

Submitted:
10 September 2024
Posted:
11 September 2024
You are already at the latest version
Abstract
The purpose of this study was to investigate the effects of cognitive dual-tasking on gait initiation and sit-to-walk. Twenty-eight healthy young adults performed gait initiation and sit-to-walk under two conditions: while engaging in serial subtraction (dual-task) and without any additional task (single-task). Motion data were collected using a 10-camera optoelectronic motion capture system, synchronized with force plates and surface electromyography. We analyzed spatiotemporal parameters, center of mass displacement, center of pressure trajectory, and lower limb muscle activation patterns. We found that dual-task conditions significantly affected both gait initiation and sit-to-walk patterns, increasing the duration of transitions and mediolateral center of mass displacements, while reducing vertical center of mass displacements and forward propulsion. We also observed a more constrained and less efficient center of pressure path, with reduced posterior displacement during the weight shift phase. Muscle activation, particularly in the tibialis anterior and biceps femoris, decreased during dual-task conditions, indicating altered neuromuscular strategies. These findings suggest a shift in postural control demands and motor performance during dual-task transitions.
Keywords:
Dual-Task
; Gait Initiation
; Sit-to-Walk
; Hesitation
; Anticipatory Postural Adjustment
1. Introduction
Transition to walking from a static position, such as standing posture, commonly known as gait initiation (GI), or sitting posture, also known as sit-to-walk (STW), are complex essential tasks in daily living. While the exact number has not been reported, studies estimate that young adults make 150-400 transitions to walking from any posture daily [1] and older adults may make up to 70 STW transitions per day [2]. Compared to steady-state walking, where individuals’ walking speed and limb movements remain consistent and rhythmic, GI and STW are thought to require a higher level of postural control for shifting the center-of-mass (CoM), redistributing body weight, and successfully achieving a smooth transition to walking [3,4]. For example, in young adults, mediolateral CoM displacement, a key indicator of the degree of postural control during a movement, is approximately 5 cm during GI [3] and about 6 cm during STW [5], which is more than 1.5 times greater than during steady-state walking (approximately 3 cm) [1].
The greater degree of mediolateral CoM displacement during GI and STW suggests that specific biomechanical and neuromuscular characteristics of these activities may be associated with mobility impairments and an increased risk of falls. For instance, Callisaya et al. (2016) reported that an increased duration of GI is an independent risk factor for multiple falls in older adults [6]. Additionally, Azizah et al. (2003) found that older adults with a history of falls had shorter step lengths and greater step length variability during GI compared to their counterparts without a fall history [7]. More recently, Kang et al. (2020) reported that older adults with mobility impairments, particularly those with diabetes-related plantar sensory loss, exhibit more unstable GI compared to healthy older adults, with the differences being more pronounced during GI than steady-state walking [8].
Far fewer studies have focused on STW, but some relevant literature exists. For example, Åberg et al. (2010) found that older adults with fear of falling had shorter step lengths and wider step widths during STW compared to those without fear of falling [9]. Furthermore, Chen and Chou (2013) discovered that older adults with a history of falls had less forward momentum during STW compared to those without a history of falls [10]. Although these and other GI and STW studies have successfully identified characteristic biomechanical patterns associated with mobility impairments and the risk of falls, many have focused on the tasks themselves under single-task conditions. In more real-life situations, GI and STW tasks are often performed concurrently with another task, known as the ‘dual-task condition’ [11].
The dual-task paradigm involves performing two tasks simultaneously, typically comprising a primary task and a secondary task [12]. In human movement research, the primary task often involves a movement of interest, such as walking, while the secondary task may involve unrelated cognitive processing, such as solving mathematical problems, hence the term “cognitive dual-tasking”. Researchers frequently test performance under two conditions: the primary task alone (single-task condition) and the primary task combined with the secondary task (dual-task condition). Since even single-task conditions in human movement involve some level of cognitive processing, like attention, working memory, and inhibitory control for safe ambulation [13], adding an additional cognitive task is thought to challenge the primary movement task and may better reflect real-life ambulation situations, even in experimental settings. As such, the dual-task paradigm in human movement research has been of great interest for understanding the fundamental motor-cognition interplay, and extensive research has been conducted on age-related mobility declines, early signs of mild cognitive impairment, and the underlying mechanisms of falls in older adults.
Nevertheless, considerable gaps remain in our understanding of the effects of cognitive dual-tasking on human movement. Firstly, most existing dual-task studies have primarily focused on biomechanical and neuromuscular patterns during steady-state walking. While these findings have important implications, there is a notable lack of research examining the effects of dual-tasking on transitional movements such as GI and STW. Because these transitions may require a higher level of postural control than steady-state walking, as evidenced by mediolateral CoM displacement, understanding how a concurrent cognitive task affects transitioning from standing or sitting to walking would provide critical insights into the motor-cognition interplay. Secondly, while a limited number of studies have explored the effects of cognitive dual-tasking on GI in individuals with neurological disorders and older adults [14], there is a notable dearth of research focusing on STW. Given the daily frequency of STW [2] and the potentially different biomechanical and neuromuscular mechanisms involved in transitioning from a sitting posture compared to a standing posture, identifying how cognitive dual-tasking alters STW may provide crucial insights and substantially expand our current knowledge of motor-cognition interplay. Furthermore, although data from individuals with mobility impairments is critically important in human movement research, data from young adults is also vital because young adults can serve as crucial benchmarks, providing reference values to understand the typical functioning of the cognitive-motor system [15].
Accordingly, the purpose of this study was to investigate the effects of cognitive dual-tasking on GI and STW in young adults. In this study, we examined how biomechanics and neuromuscular control are altered during GI and STW under dual-task conditions compared to single-task conditions. We analyzed changes in spatiotemporal parameters, kinematics, kinetics, and muscle activation patterns. Our hypothesis posits that cognitive dual-tasking will significantly change both GI and STW, leading to measurable differences in these parameters compared to single-task conditions.
2. Methods
2.1. Participants
We recruited 28 young adults from the University of Texas at Dallas (UTD) campus. All participants were overall healthy with no history of neurological or musculoskeletal disorders. All participants signed a written informed consent that was approved by the UTD Institutional Review Board. All experimental procedures were conducted in the Neuromuscular and Musculoskeletal Biomechanics Laboratory at the UTD campus.
2.2. Instrumentation
We used a ten-camera optoelectronic 3D motion capture system (Vicon, Oxford, UK), synchronized with two force plates (Kistler, Winterthur, Switzerland). The cameras circled around a 10-m walkway and collected position data from reflective markers at a sampling rate of 100 Hz. The two force plates were positioned at the start of the walkway and collected the ground reaction force and COFP displacement data at a sampling rate of 1000 Hz. We also used wireless surface electromyography (EMG) sensors (Delsys, Natick, Massachusetts, USA) to collect data for lower limb muscle activity that collected at a sampling rate of 2000 Hz.
2.3. Experimental Procedures
After signing the informed consent, we collected the participant’s demographic information including age, sex, race, and ethnicity. We also administered the Montreal Cognitive Assessment (MoCA) and the 7-item International Physical Activity Questionnaire (IPAQ) to assess the cognitive performance and physical activity level, respectively [16,17]. The MoCA is an interactive assessment tool for cognitive functioning, including attention, executive functioning, working memory, language, and visuospatial skills. The MoCA has a maximum score of 30, with a score of 25 or below indicating mild cognitive impairment [18]. The IPAQ is a popularly used self-assessment tool for physical activity levels. IPAQ consists of seven items that assess the frequency and duration of vigorous activities, moderate activities, and walking. The IPAQ also evaluates the duration of sitting.
After completing the MoCA and IPAQ, participants changed into tight-fitting clothing. Then we performed anthropometric measurements such as leg length, ankle width, knee width, elbow width, wrist width, and hand thickness. We then attached 8 EMG sensors (4 in each lower limb) for the vastus lateralis, bicep femoris, gastrocnemius, and tibialis anterior. Prior to attachment, the surface of the skin was cleaned following the Surface Electromyography for Non-Invasive Assessment of Muscles (SENIAM) guidelines [19]. After attaching the EMG sensors, we collected EMG data from maximum voluntary contraction (MVC) trials to normalize muscle activity. MVC trials followed a previously published paper [20], where participants were instructed to follow a specific sequence during the trial. Briefly, we first instructed the participant to rest for 3 seconds. Next, they were asked to conduct an isometric contraction of the muscle over 2 seconds. After this, they were instructed to exert maximum strength for 4 seconds, and finally, to relax for 2 seconds. We collected two MVC trials to target each muscle group. For the vastus lateralis, participants were sitting down with their legs angled at 90 degrees and their ankles were restricted as they performed a unilateral leg extension forward. Conversely, with the biceps femoris, the participant’s legs began slightly suspended in the air as they were asked to curl their leg posteriorly. For the tibialis anterior, we asked participants to perform a toe raise. Finally, for the gastrocnemius participants did a standing calf extension.
Once we concluded MVC trials, we attached 74 reflective markers on participants’ anatomical landmarks following previous studies [21,22]. Marker positions are shown in Figure 1: bilateral markers of the forehead, bilateral markers of the posterior head, and unilateral markers of xiphoid process, suprasternal notch, C7, T10, right scapula, acromion, humerus lesser tubercle, humerus greater tubercle, upper arm, medial epicondyle of humerus, lateral epicondyle of humerus, forearm, ulnar styloid process, radial styloid process, the second metacarpal head, anterior superior iliac, posterior superior iliac, sacrum, greater trochanter, medial epicondyle of the femur, lateral epicondyle of the femur, shank, medial malleolus, lateral malleolus, calcaneus, fifth metatarsal shaft, second metatarsal head, and first metatarsal shaft.
Participants first conducted a reference static trial. Following the reference static trial, the medial markers of the medial epicondyle of the humerus, medial epicondyle of the femur, and medial malleolus on both legs were removed. Consequently, 68 reflective markers were used for movement trials. Then, we collected the participant’s body weight using one force plate. For the body weight trial, we asked participants to stand naturally on the force plate and stand as quietly as possible.
Afterwards, movement trials began on the 10-meter walkway. Participants performed two movements, gait and STW, under two conditions (single-task and dual-task). For gait trials, participants were instructed to stand quietly at the start of the walkway on two force plates, with each foot on a separate force plate. They then performed single-task (no concurrent task) and dual-task (with a concurrent cognitive task) gait trials at their self-selected speed. Dual-task trials consisted of a serial subtraction by a randomized number that is commonly used to cognitively engage the participant during gait [23,24]. For example, participants were asked to subtract 3 from a random number (e.g., 105) aloud during quiet standing. After completing two or three subtractions, they were instructed to begin moving. In STW trials, participants began seated on an armless and backless chair (height: 45 cm) with each foot on a separate force plate. Then we asked participants to walk out straight from the chair at self-selected speed. Upon rising from the seat during STW trials, participants were asked to keep their hands by their sides and to walk forward naturally until reaching the end of the walkway [5,21]. The hand positions were determined to avoid marker occlusion [25,26]. STW trials were performed in the same single-task and dual-task conditions. Trials were repeated to collect three total trials for each condition.
2.4. Data Analysis
We used Visual3D (C-Motion, Germantown, Maryland, USA) to create a 15-segment full body biomechanical model (Figure 2A). We calculated spatiotemporal, kinematic, and kinetic variables for GI and STW using the biomechanical model. A custom MATLAB (MathWorks, Natick, Massachusetts, USA) script was utilized to analyze the EMG data.
2.4.1. GI
We followed a previous study to determine GI phases using vertical ground reaction forces, as shown in Figure 2B [23]. The weight shift phase, during which individuals shift their weight slightly towards their stepping limb before initiating push-off, was calculated from the start of GI to the weight shift peak. The start of GI was defined as the moment when the vertical ground reaction force of the stance limb changed by more than three times the standard deviation from the mean vertical ground reaction force during quiet standing. The weight shift peak was defined as the moment of the peak exchange of weight (FzStepMax, FzStanceMin). The pre-swing of the stepping limb phase, during which individuals prepare to push off with the stepping limb, was calculated as the period from the weight shift peak to the toe off of the stepping limb (FzStepZero). The final GI phase is the pre-swing of the stance limb phase, during which individuals support their full body weight on a single limb, i.e., the stance limb, most of the time and prepare to swing the stance limb. This phase was calculated from the stepping limb toe off (FzStepZero) to the stance limb toe off (FzStanceZero). The total GI duration was from the start of GI to the stance limb toe off. We calculated the peak CoM displacement in the vertical and mediolateral directions during GI.
We evaluated normalized ground reaction force to body weight (BW) in the vertical, anterior-posterior, and mediolateral planes for each GI phase. For the vertical plane we calculated the peak exchanges of normalized ground reaction forces of the stepping limb (Weight shift stepping max) and stance limb (Weight shift stance min). To obtain these measurements we first calculated the baseline ground reaction forces as seen in Figure 2B and found the magnitudes comparing the baseline to the stepping max and the stance min (Weight shift stepping max = FzStepMax – FzBaseline; Weight shift stance min = FzStanceMin – FzBaseline). The stance limb loading magnitude was measured, analyzing for the loading of the stance limb up to the toe off of the stepping limb (Stance loading = FzStance – FzStanceMin). The mediolateral plane calculated the magnitude forces similarly as seen in Figure 2C. The baseline mediolateral ground reaction force (FxBaseline) was calculated at the start of gait initiation, this value was utilized to find the magnitudes for the lateral shift of the stepping limb (ML GRF stepping lateral = FxSteppingMax - Fxbaseline) and the medial shift of the stance limb (FxStanceMin - FxBaseline). The stance lateral shift was measured taking the mediolateral ground force of the stance limb at stepping limb’s toe off and finding the magnitude difference with the medial valley of the stepping limb (FxStanceLat – FxStanceMin). In the anterior posterior plane, we measured the propulsion magnitudes by finding the differences between the global maximum and global minimum from the total gait initiation period (AP GRF = FyStanceMax - FyStanceMin) as seen in Figure 2D.
A graphic of how COFP is visualized throughout the different GI phases is shown in Figure 3. We calculated COFP displacement of the stance limb and the stepping limb in the anterior-posterior direction. For the stance limb we calculated the COFP Posterior by taking the difference as seen in Figure 3, taking the starting distance and the peak posterior position, then taking the magnitude of these two values. This results in an overall posterior displacement in centimeters (COFP Stance Posterior). While the anterior direction was calculated the same looking at the peak posterior distance and the peak anterior distance, then finding the overall anterior displacement in centimeters (COFP Stance Anterior). The stepping limb was also analyzed the same manner looking for both anterior (COFP Stepping Anterior) and posterior (COFP Stepping Posterior) displacements.
Muscle activation data was derived by taking filtered EMG data using established methods from literature (Acuña et al. 2019, Balasukumaran et al. 2020) and normalizing the filtered signal with the participant’s maximum voluntary contraction (Luca et al. 2010). First, we filtered the EMG signal by applying a detrend function to eliminate any potential direct current offset. This was followed by a bandpass Butterworth filter (nth order = 4) with a cutoff frequency range of 30-300 Hz. The filtered signal was then rectified and smoothed using a lowpass critical damping filter (nth order = 2) with a cutoff frequency of 15 Hz, resulting in a linear envelope of muscle activation. This filtering process was applied to both maximum voluntary contraction (MVC) trials and dynamic trials. To determine the maximum MVC, we computed a moving mean average over 20 frames and identified the peak value as the maximum MVC. The highest value from two MVC trials were used for normalization. We normalized the data by taking the filtered dynamic EMG data and dividing it by the maximum MVC, expressing the result as a percentage of muscle activation (%MVC). For analysis, we calculated mean EMG for every muscle in each limb across the different GI phases, as well as throughout the entire GI. Additionally, graphical visuals of each muscle activation were provided that highlight the differences between single-task and dual-task across GI.
2.4.3. STW
The phases of STW were derived using both marker and force plates data. As described by previous papers [27,28,29], STW was divided into four phases as shown in Figure 4: (1) the flexion momentum phase, where the CoM began moving forward; (2) the extension phase, where the trunk and lower extremity joints extended as the participant stood up; (3) the unloading phase, where the initial change in vertical ground reaction force of the stepping limb occurred; and (4) the stance phase, where the participant took the first step. Phase 1 began at trunk initiation, where the vertical ground reaction force of the stance limb changed by more than three times the standard deviation of the mean vertical ground reaction force during quiet sitting. Phase 2 occurs at seat off which is when the vertical CoM velocity begins to accelerate positively and ends at the peak vertical CoM velocity. Phase 3 starts at gait initiation onset, which is the peak vertical ground reaction force of the stepping limb and ends at stepping toe off. Phase 4 begins at the end of phase 3 and finishes at stance toe off, which is the point where the vertical ground reaction force of the stance leg equals zero.
We calculated the total STW duration, and absolute and normalized phase durations. For STW, due to the overlap between phases 2 and 3, the normalized phase durations did not equal 100%. We also calculated the peak CoM velocity and CoM displacement in the mediolateral, anterior-posterior, and vertical directions [5]. The peak CoM velocities in all 3 directions was calculated as the maximum CoM velocity minus the mean position during quiet sitting (VxPeak; VyPeak; VzPeak = VzMax – VzBaseline) and is represented by Figure 5. The CoM displacement in the anterior-posterior direction refers to the difference between the maximum CoM position and the baseline position (AP CoM displacement = DyMax - DyBaseline). The CoM displacement for the vertical direction was calculated similarly. For the mediolateral position, the absolute maximum or minimum position was considered (ML CoM displacement = DxAbsMax – DxBaseline).
We also calculated CoM velocity drop in the forward direction, which was determined as the difference between the initial forward peak velocity and the subsequent minimum velocity valley (Absolute velocity drop = VyMax – VyMin). We calculate the ratio of this drop to the initial forward peak velocity, termed “hesitation”, as well as the absolute velocity drop (Hesitation = Absolute velocity drop/VyMax * 100) [28]. Additionally, we calculated initial step length that was calculated as the difference between the foot’s position at swing toe off and the foot’s position at the first heel strike.
Like the methods for GI, we calculated mean EMG for each muscle for each limb in each STW phase and across the entire STW.
2.5. Statistical Analysis
Data was analyzed comparing single-task and dual-task conditions using SPSS version 29 (IBM, Armonk, New York, USA). Before comparison, data was tested for normality via Shapiro-Wilks test. Data that was not normalized was transformed via logarithmic transformation. However, if transformation was non-normalized, a Kruskal-Wallis test was used due to its condition of not assuming normality. A two tailed paired t-test was performed on the normalized data. For all statistical comparisons, we considered p-value < 0.05 as statistical significance. Additionally, we evaluated the effect size as Cohen’s D (d). We considered d < 0.2 as a small effect, 0.2 ≤ d < 0.5 as a medium effect and 0.5 ≤ d < 0.8 as a large effect.
3. Results
Mean and standard deviation of age, height, weight, body mass index (BMI), and MoCA score are reported in Table 1. The characteristic of the race and ethnicity included respectively: a Hispanic count of 3, non-Hispanic count of 25; while the ethnicity included a count of 6 Whites, 18 Asians, 1 Black, 1 mixed race, and 2 who classify as none of the ethnicities. The IPAQ results are as followed with a mean and standard deviation of the days in a week and minutes per day: vigorous physical activities (2.54 ± 2.22 days, 51.89 ± 53.38 min), moderate physical activities (1.75 ± 2.36 days, 43.61 ± 102.84 min), walking activities (6.26 ± 1.13 days, 75.36 ± 55.65 min), and sedentary (i.e., sitting) activities (322.22 ± 162.61 minutes per day).
3.1. GI
Of the outcomes, we excluded 9 participants due to protocol violation (e.g., fidgeting their legs or arms). In Figure 2, the ground reaction force versus time graph highlights how we divided up phases to calculate each phase duration.
Table 2 presents the GI spatiotemporal variables that compare single-task versus dual-task conditions, including the P-values for significance and Cohen’s D to indicate effect size. We found a significant difference following dual task effects in gait initiation in all the phase durations. The phases of total GI duration, pre-swing of stepping limb, and pre-swing of stance limb all showed a significant increase when performing dual-task gait compared to single-task (p = 0.005, p = 0.017, p = 0.001, respectively). In contrast, the weight shift phase exhibited a significant decrease (p < 0.001). The effect sizes and the percentage change from single-task to dual-task were as follows: the total GI duration had a medium effect size (d = 0.44) with an 8.0% increase; the weight shift phase had a large effect size (d = 0.86) with an 8.6% decrease; the pre-swing of the stepping limb had a medium effect size (d = 0.37) with a 13.0% increase; and the pre-swing of the stance limb had a large effect size (d = 0.81) with a 14.0% increase. For the center of mass (CoM) outcomes, we observed a significant increase in mediolateral CoM displacements (p = 0.001), with a large effect size (d = 0.48) reflecting a 16.2% increase. In contrast, vertical CoM displacements showed a significant decrease (p = 0.001), with a large effect size (d = 0.65) indicating a 29.16% decrease.
Table 3 presents the ground reaction force outcomes comparing single-task versus dual-task conditions, including P-values for significance and Cohen’s D to indicate effect size. In the vertical plane, significant differences were observed in the weight shift stepping maximum and weight shift stance minimum forces (p = 0.004, p = 0.007, respectively), with the stance loading force showing no significant change (p = 0.352). Specifically, the weight shift stepping maximum force increased by 20.1% with a medium effect size (d = 0.31), while the weight shift stance minimum force decreased by 17.4% with a medium effect size (d = 0.28). In the anterior-posterior plane, significant differences were found only in the propulsion forces of the stance limb (p = 0.001), which exhibited a large effect size (d = 0.92) and a 23.03% decrease, whereas the stepping propulsion force did not show a significant difference (p = 0.117). In the mediolateral plane, a significant difference was noted in the stance medial forces (p = 0.03) with a small effect size (d = 0.15) and a 10.0% decrease, while no significant differences were found in the lateral forces (stepping: p = 0.102, stance: p = 0.232).
We illustrated the displacement of the center of pressure (COFP) of the stance and stepping limbs in the anterior-posterior and mediolateral directions in Figure 3. Overall, in the stepping and stance limb, the COFP moved slightly posteriorly (backwards) and medially (internally) first and then shifted anteriorly (forward) and laterally (outwards) before the limbs stepped off. In Table 4, we reported the COFP displacement outcomes for the stepping and stance limb in the anterior posterior plane comparing single-task versus dual-task conditions, including P-values for significance and Cohen’s D to indicate effect size. Among the COFP displacements, we found significant differences in the COFP displacement in the posterior direction during the weight shift phase between single-task and dual-task (p = 0.01), while the other outcomes including stance anterior, stepping anterior, and stepping posterior did not show significance (p = 0.392, p = 0.448, p = 0.171, respectively). The stance posterior showed a medium effect (d = 0.36) with a 17.95% decrease.
3.1.1. GI EMG Outcomes
The pattern of muscle activation in the vastus lateralis, biceps femoris, gastrocnemius, and tibialis anterior in the stepping and stance limbs during the entire GI is shown in Figure 6 with left column representing the stepping limb and the right column representing the stance limb. The red line represented the single task data, while the green line represented the dual task data.
Results for muscle activation are shown in Table 5 comparing single-task versus dual-task conditions, including P-values for significance and Cohen’s D to indicate effect size. During the weight shift phase, none of the muscles were significantly different showing p values greater than 0.05. During the pre-swing phase of the stepping limb, the stepping gastrocnemius and stepping tibialis anterior muscles displayed significant differences (p = 0.05, p = 0.044, respectively). For the gastrocnemius muscle, this muscle was significantly different; however, displayed a small effect (d = 0.07) decreasing by 6.84%, while the tibialis anterior exhibited a medium effect (d = 0.29) decreasing by 36.4%. During the pre-swing phase of the stance limb, the stance bicep femoris and the stepping tibialis anterior muscles were significantly different (p = 0.023, p = 0.037, respectively). The stance bicep femoris displayed a large effect (d = 0.58) where the muscle activation decreased by 38.7%, while the stepping tibialis anterior possessed a medium effect (d = 0.25) and decreased by 12.6%. During the total GI phase, the stance bicep femoris, and stepping tibialis anterior muscles were significantly different (p = 0.011, p = 0.036 respectively). For the stance bicep femoris, the muscle exhibited a large effect (d = 0.56) and decreased by 35.65%, while the stepping tibialis anterior showed a medium effect (d = 0.27) decreasing by 19.79%.
3.2. STW
For STW results, data of 7 participants were excluded due to protocol violations that were not caught during data collection (e.g., shaking legs slightly or using hands to get up). These participants were a different set of 7 participants than those excluded from GI analysis.
Table 6 displays the sit-to-walk spatiotemporal outcomes comparing single-task versus dual-task conditions, including P-values for significance and Cohen’s D for effect size. Among the STW phase durations, phase 3 unloading, phase 4 stance, and total phase duration were statistically significant (p = 0.004, p = 0.001, p = 0.001, respectively). Phase 3 increased by 24.39% with a medium (d = 0.43), phase 4 increased by 14.04% with a large effect size (d = 0.67), and total phase duration increased by 9.78% with a medium effect size (d = 0.47) during dual-task compared to single-task. Similarly, CoM displacements across all directions were not statistically significant. Hesitation increased significantly (p = 0.041) by 26.47% with a medium size (d = 0.29). The initial step length was found to be significant (p = 0.004) and decreased by 0.07 m during DT with a medium effect size (d = 0.45).
Figure 7 displays the different muscle activations across the STW duration. The EMG data was averaged across all participants. The left column represents the stepping limb, and the right column represents the stance limb. The blue line represents the single task data, while the orange line represents the dual task data.
Table 7 shows the EMG outcomes for sit-to-walk comparing single-task versus dual-task conditions, including the P values for significance and Cohen’s D to indicate effect size. During phase 1 flexion momentum, all the muscles had decreased activation except for the tibialis anterior stepping limb, however, only the biceps femoris stance limb significantly decreased by 22.28% (p = 0.007) with a medium effect size (d = 0.23). During phase 2 extension, all the muscles possessed decreased activation except the stepping bicep femoris and vastus lateralis. However, only the stepping bicep femoris exhibited a significant change (p = 0.039), where it increased by 23.02% with a medium effect size (d = 0.24). While during phase 4 stance, all the muscles displayed a decrease in muscle activations except for stepping bicep femoris. However, only the stepping gastrocnemius, stepping vastus lateralis, and stance tibialis anterior muscles displayed a significant change (p = 0.004, p = 0.038, p = 0.003 respectively). The stepping gastrocnemius displayed a large effect (d = 0.52) where the muscle activation decreased by 34.52%, the stepping vastus lateralis decreased by 35.69% possessing a medium effect (d = 0.38), while lastly the stance tibialis anterior muscle decreased by 17.84% exhibiting a medium effect (d = 0.32). During the total STW overall, all the muscles displayed a decrease from dual task influence except for stepping bicep femoris. Only the stepping gastrocnemius displayed a significant difference (p = 0.032), where it decreased by 21.11% with a medium effect (d = 0.37).
4. Discussion
In this study, we explored the impact of single-task versus dual-task, employing serial subtraction as the cognitive load, on gait initiation and sit-to-walk in a cohort of young healthy adults. We found that GI and STW kinematics, kinetics, and muscle patterns changed in response to dual-task influence.
4.1. Dual Task Depends on Task Priority
Significant effects were observed in the spatiotemporal domain of GI and STW, all phases of GI including weight shift, pre-swing of the stepping limb, pre-swing of the stance limb, and total duration were found to be significantly affected. While the unloading, stance, and total STW phase was found to be significantly affected. Among these phases weight shift phase exhibited a decrease, while all the other temporal durations displayed increased durations in response to dual task. These findings align with literature that also investigated dual-task effects on anticipatory postural adjustment (APA) where they found increased durations in healthy subjects [10,30,31] and in studies investigating aging populations and frailty [32]. However, there is also literature that poses different results highlighting participants show reduced durations during their APA [33]. Results from previous literature and our study indicate that dual-task conditions influence gait initiation in various ways.
Additionally, the role of compensatory behaviors helps explain the differences in responses observed between our study and others, suggesting that these behaviors play a key role in how individuals manage the challenges posed by dual-task situations. This concept is briefly discussed in previous literature. For example, it has been discussed that GI performance not solely being influenced by the task instruction itself and environmental factors [34], but also the task priority [35,36]. As in literature, Tsang et al. (2016) found that younger populations tend to handle more complex cognitive-motor tasks better when compared to older adults [37]. This evidence may suggest the need to understand the population and the complexity of the concurrent tasks before making conclusive remarks. As some individuals may follow the posture-second strategy, where individuals adopt the manner of prioritizing cognitive tasks rather than the motor tasks causing biomechanical deficiencies or vice-versa [33]. From this evidence, the elderly, individuals with Parkinson’s disease, and other affected populations may result in different responses when their task prioritization varies compared to healthy young adults. However, the increased durations observed during GI and increased STW in our study, as well as in other studies involving healthy young adults, may suggest that this longer duration is a compensation strategy for managing complex tasks.
One consideration when analyzing temporal parameters is to correlate them with the ground kinetic responses during gait initiation. In Jonsson et al. (2007), they investigated the thrust phase of APA, identical to our weight shift phase, and found that ground reaction forces decreased for young versus elderly adults, and additionally their thrust phase duration showed an increased percentage [38]. Compared to our study, where we observed decreases in the weight shift phase despite their study exhibiting an increase in percentage, this discrepancy may be explained by differences in task prioritization between older populations and young adults. Based on these observations and our findings, increased durations or force magnitudes in APA responses among young healthy adults may suggest that the movement or task is inherently unstable. However, this also indicates that the individual is successfully employing a compensatory strategy to manage the instability and successfully executing the primary task. Young adults might generally adopt a posture-secondary strategy, given that their risk of falling or failing the movement is less severe for them; they often have the ability to recover from a potential fall. In contrast, older adults facing the same complex task may exhibit different GI responses, prioritizing stabilization over the cognitive aspects of the task.
4.2. Dual Task Increases Postural Stability Responses
Findings in literature indicate that changes in the mediolateral axis reflect postural stability, while changes in the anterior-posterior axis are associated with motor performance [34,39]. This concept helps explain the results of dual task influence on our GI and STW outcomes. Specifically, during GI, we observed significant increases in mediolateral CoM displacement and mediolateral ground reaction forces, particularly in the stance medial forces. Other mediolateral forces during GI also increased, though these changes were not statistically significant except for stance medial. Similarly, while mediolateral spatiotemporal outcomes during STW increased, they were not significant. Conversely, we found decreases in anterior-posterior responses.
During GI, there was a reduction in vertical CoM and a decrease in the anterior-posterior ground reaction force related to stance propulsion. Additionally, during STW, increased hesitation accounted for the reduced forward momentum and lower fluidity in the transition from sitting to walking, as reflected by the decrease in initial step length. Overall, these findings align with previous literature and reinforce the idea that dual-task conditions require enhanced postural stability. Our findings of COFP displacement also align with our findings of reduced anterior posterior movement. To illustrate, consider the analogy of throwing a ball: the posterior displacement correlates with the preparation and potential energy before the throw, while the anterior displacement corresponds to the release phase. According to Kong et al. (2024), COFP path length increases with worsening pathology, such as obesity, suggesting that greater path lengths may reflect compensatory behavior to manage larger weight shifts [40]. However, our results present a different picture. Although both stepping and stance limb weight shifts increased, the COFP path lengths revealed a decrease in posterior displacement and shorter durations. These findings may indicate a negative impact, possibly due to the dual task demands. These findings suggest that while individuals may exhibit increased weight shift in both stepping and stance limbs, the reduced posterior displacement and shorter path lengths could reflect a more constrained or inefficient response, potentially exacerbated by dual-task conditions. This indicates that the dual-task environment may negatively impact the ability to manage and coordinate weight shifts effectively.
4.3. Neuromuscular Trace during GI and STW
We analyzed lower-extremity EMG patterns in young, healthy adults performing both single-task and dual-task transitional movements. Our results indicate that during dual-task scenarios, individuals tend to adopt compensatory strategies that either impede forward anterior-posterior movement or enhance balance control through increased activation of muscles associated with stability. In literature, Waldon et al. (2023) emphasizes the role of the tibialis anterior (TA) muscle in clearing the foot off the ground during the initial swing phase [41]. Fundamentally, the forward momentum of the stepping limb cannot begin until the limb is cleared from the ground. Our results align with these findings, revealing reduced TA activation during the pre-swing phase of the stepping limb during GI. This decreased activation suggests that dual task conditions do impair the forward momentum of the stepping limb, supporting the notion that dual task conditions can inhibit motor performance in some manner.
However, when examining STW results, we do not see differences between dual-task conditions. In contrast, research on healthy older adults has shown that the TA muscles are involved in STW movements and activate first during rising movements [42]. Comparatively, when analyzing stroke patients in a similar movement of sit-to-stand, Cheng et al. (2004) states that 70% of their patients experienced low or no TA activation [43]. These findings may suggest that the TA muscle group is essential for balance control; however, our findings may also display the effects of task priority challenges. Our data shows a general decrease in TA activation during STW movements, though this change is not statistically significant. In contrast, during the GI process, young adults appear to adopt a “posture second” strategy, which affects their gait. STW movements, being more complex, may compel individuals to use a “posture first” strategy to manage the increased demands. This suggests that the complexity of STW movements leads young adults to prioritize them more deliberately. These findings highlight the importance of understanding how different dual-task movements vary based on task priority and how concurrent cognitive tasks impact performance. Further research is needed to explore these effects across different populations and movement scenarios.
It is also crucial to consider the role of the TA muscle in balance control. Literature highlights that the TA muscle group is essential for maintaining balance during gait, particularly for impact absorption and stabilizing the foot during the stance phase [44]. Our results show reduced TA activation during the pre-swing phase of the stance limb under dual-task conditions, which may reflect a “posture second” strategy. This finding contrasts with existing literature, which presents conflicting results. For example, Schmitz et al. (2009) found that older adults exhibited greater TA activation during the loading response and mid-stance phases compared to younger adults [45]. In contrast, Keloth et al. (2021) reported reduced TA modulation during walking in patients with Parkinson’s disease [46]. Additionally, our STW results indicate that TA activation in the stepping limb was not significantly affected by dual-task conditions. Our results suggest that dual-task conditions negatively impact TA activation during the GI phase, leading to reduced engagement of the TA muscle before foot strike. However, during STW, the complexity of the movement may cause individuals to concentrate more on their gait, which could explain why dual-task conditions did not significantly affect TA activation during this phase. These observations highlight the nuanced effects of dual-task conditions on muscle activation. The reduced TA engagement during GI suggests that cognitive demands may compromise the muscle’s role in preparing for foot strike, potentially impacting gait stability. Conversely, the stable TA activation during STW indicates that the complexity of the task may lead individuals to prioritize gait stability over cognitive processing.
5. Conclusions
The purpose of this research was to investigate the effects of dual-task conditions on transitional movements during GI and STW. We found that dual-task conditions affect these movements by increasing the need for postural stability, as evidenced by greater mediolateral engagement, and impaired motor performance, as indicated by reduced anterior-posterior outcomes. These changes likely stem from the need to manage body weight transfer smoothly during these transitions. GI involves building potential energy in the stepping limb, which is then transferred back to the stance limb to facilitate propulsion. In contrast, STW requires a more complex transfer of energy, involving significant muscle activation changes as one transitions from a seated position to propulsion. Our results suggest that dual-task conditions affect these movements both similarly and differently, as evidenced by increased duration outcomes and varying TA activation patterns. These responses to dual-task conditions may vary depending on the complexity of the movement and the task priority. One concept to consider for future investigations is that individuals may adopt a “posture-second” strategy for movements perceived as easier. Future research should consider incorporating additional movements with varying levels of complexity, such as stair biomechanics to further add complexity of the movements to support these findings. Furthermore, recording the success of the cognitive tasks could offer valuable feedback on how effectively the dual task conditions challenge the individual’s cognitive abilities. Additionally, exploring a broader range of dual-task scenarios could provide insights into how realistic, complex tasks impact balance and gait in more naturalistic settings. For some other outcomes to explore, joint range of motion should be considered when exploring these transitional movements. Potentially a connection between ankle range of motion would connect to the usage of the TA muscle. Overall, these findings enhance our understanding of transitional movements and could inform the development of interventions to prevent falls, especially for elderly individuals and patients with Parkinson’s disease who experience freezing of gait during initiation.
Author Statement
Angeloh Stout: Data collection and analysis, Writing – Original draft preparation. Kaye Mabbun: Data collection and analysis, Writing – Original draft preparation. Ke’Vaughn Waldon: Data collection and analysis. Marvin Alvarez: Data collection and analysis. Stacy Nguyen: Data collection and analysis. Miguel Barcellano: Data collection and analysis. Sandra Cuenca: Data collection and analysis. Aanand Naik: Writing – Reviewing and editing. Gu Eon Kang: Conceptualization, Methodology, Supervision, Writing – Reviewing and editing.
Acknowledgements
This study received partial funding support from the Shirley Ryan AbilityLab C-STAR Collaborative Mentorship Funding; grant number P2C HD101899. However, the funding source had no role in study design, data collection and analysis, and the interpretation of the results.
References
- Orendurff, M.S.; Schoen, J.A.; Bernatz, G.C.; Segal, A.D.; Klute, G.K. How humans walk: bout duration, steps per bout, and rest duration. Journal of Rehabilitation Research & Development 2008, 45. [Google Scholar]
- Grant, P.M.; Dall, P.M.; Kerr, A. Daily and hourly frequency of the sit to stand movement in older adults: a comparison of day hospital, rehabilitation ward and community living groups. Aging clinical and experimental research 2011, 23, 437–444. [Google Scholar] [CrossRef] [PubMed]
- Caderby, T.; Yiou, E.; Peyrot, N.; Begon, M.; Dalleau, G. Influence of gait speed on the control of mediolateral dynamic stability during gait initiation. Journal of biomechanics 2014, 47, 417–423. [Google Scholar] [CrossRef] [PubMed]
- Magnan, A.; McFadyen, B.J.; St-Vincent, G. Modification of the sit-to-stand task with the addition of gait initiation. Gait & Posture 1996, 4, 232–241. [Google Scholar]
- Kang, G.E.; Gross, M.M. Emotional influences on sit-to-walk in healthy young adults. Human movement science 2015, 40, 341–351. [Google Scholar] [CrossRef]
- Callisaya, M.L.; Blizzard, L.; Martin, K.; Srikanth, V.K. Gait initiation time is associated with the risk of multiple falls—A population-based study. Gait & posture 2016, 49, 19–24. [Google Scholar]
- Azizah, M.G.; Lajoie, Y.; Teasdale, N. Step length variability at gait initiation in elderly fallers and non-fallers, and young adults. Gerontology 2003, 49, 21–26. [Google Scholar] [CrossRef]
- Kang, G.E.; Zhou, H.; Varghese, V.; Najafi, B. Characteristics of the gait initiation phase in older adults with diabetic peripheral neuropathy compared to control older adults. Clinical Biomechanics 2020, 72, 155–160. [Google Scholar] [CrossRef]
- Åberg, A.C.; Frykberg, G.E.; Halvorsen, K. Medio-lateral stability of sit-to-walk performance in older individuals with and without fear of falling. Gait & posture 2010, 31, 438–443. [Google Scholar]
- Chen, T.; Chou, L.-S. Altered center of mass control during sit-to-walk in elderly adults with and without history of falling. Gait & Posture 2013, 38, 696–701. [Google Scholar]
- Hillel, I.; Gazit, E.; Nieuwboer, A.; Avanzino, L.; Rochester, L.; Cereatti, A.; Croce, U.D.; Rikkert, M.O.; Bloem, B.R.; Pelosin, E. Is every-day walking in older adults more analogous to dual-task walking or to usual walking? Elucidating the gaps between gait performance in the lab and during 24/7 monitoring. European review of aging and physical activity 2019, 16, 1–12. [Google Scholar] [CrossRef] [PubMed]
- Bayot, M.; Dujardin, K.; Tard, C.; Defebvre, L.; Bonnet, C.T.; Allart, E.; Delval, A. The interaction between cognition and motor control: A theoretical framework for dual-task interference effects on posture, gait initiation, gait and turning. Neurophysiologie Clinique 2018, 48, 361–375. [Google Scholar] [CrossRef]
- Herman, T.; Mirelman, A.; Giladi, N.; Schweiger, A.; Hausdorff, J.M. Executive control deficits as a prodrome to falls in healthy older adults: a prospective study linking thinking, walking, and falling. Journals of Gerontology Series A: Biomedical Sciences and Medical Sciences 2010, 65, 1086–1092. [Google Scholar] [CrossRef]
- Nocera, J.R.; Roemmich, R.; Elrod, J.; P Altmann, L.J.; Hass, C.J. Effects of cognitive task on gait initiation in Parkinson disease: evidence of motor prioritization? Journal of Rehabilitation Research & Development 2013, 50. [Google Scholar]
- Woollacott, M.; Shumway-Cook, A. Attention and the control of posture and gait: a review of an emerging area of research. Gait & posture 2002, 16, 1–14. [Google Scholar]
- Nasreddine, Z.S.; Phillips, N.A.; Bédirian, V.; Charbonneau, S.; Whitehead, V.; Collin, I.; Cummings, J.L.; Chertkow, H. The Montreal Cognitive Assessment, MoCA: a brief screening tool for mild cognitive impairment. Journal of the American Geriatrics Society 2005, 53, 695–699. [Google Scholar] [CrossRef] [PubMed]
- Craig, C.L.; Marshall, A.L.; Sjöström, M.; Bauman, A.E.; Booth, M.L.; Ainsworth, B.E.; Pratt, M.; Ekelund, U.; Yngve, A.; Sallis, J.F. International physical activity questionnaire: 12-country reliability and validity. Medicine & science in sports & exercise 2003, 35, 1381–1395. [Google Scholar]
- Carson, N.; Leach, L.; Murphy, K.J. A re-examination of Montreal Cognitive Assessment (MoCA) cutoff scores. International journal of geriatric psychiatry 2018, 33, 379–388. [Google Scholar] [CrossRef]
- Stegeman, D.; Hermens, H. Standards for surface electromyography: The European project Surface EMG for non-invasive assessment of muscles (SENIAM). Enschede: Roessingh Research and Development 2007, 10, 8–12. [Google Scholar]
- Heintz, S.; Gutierrez-Farewik, E.M. Static optimization of muscle forces during gait in comparison to EMG-to-force processing approach. Gait & posture 2007, 26, 279–288. [Google Scholar]
- Kang, G.E.; Mickey, B.J.; McInnis, M.G.; Krembs, B.S.; Gross, M.M. Motor behavior characteristics in various phases of bipolar disorder revealed through biomechanical analysis: Quantitative measures of activity and energy variables during gait and sit-to-walk. Psychiatry research 2018, 269, 93–101. [Google Scholar] [CrossRef] [PubMed]
- Kang, G.E.; Mickey, B.J.; Krembs, B.S.; McInnis, M.G.; Gross, M.M. The effect of mood phases on balance control in bipolar disorder. Journal of Biomechanics 2019, 82, 266–270. [Google Scholar] [CrossRef] [PubMed]
- Lin, C.-C.; Creath, R.A.; Rogers, M.W. Variability of anticipatory postural adjustments during gait initiation in individuals with Parkinson’s disease. Journal of neurologic physical therapy: JNPT 2016, 40, 40. [Google Scholar] [CrossRef] [PubMed]
- Goh, H.-T.; Pearce, M.; Vas, A. Task matters: an investigation on the effect of different secondary tasks on dual-task gait in older adults. BMC geriatrics 2021, 21, 1–12. [Google Scholar] [CrossRef]
- van der Kruk, E.; Strutton, P.; Koizia, L.J.; Fertleman, M.; Reilly, P.; Bull, A.M. Why do older adults stand-up differently to young adults?: investigation of compensatory movement strategies in sit-to-walk. npj Aging 2022, 8, 13. [Google Scholar] [CrossRef]
- Komaris, D.-S.; Govind, C.; Murphy, A.; Ewen, A.; Riches, P. Identification of movement strategies during the sit-to-walk movement in patients with knee osteoarthritis. Journal of Applied Biomechanics 2018, 34, 96–103. [Google Scholar] [CrossRef]
- Kerr, A.; Durward, B.; Kerr, K. Defining phases for the sit-to-walk movement. Clinical biomechanics 2004, 19, 385–390. [Google Scholar] [CrossRef]
- Kerr, A.; Pomeroy, V.; Rowe, P.; Dall, P.; Rafferty, D. Measuring movement fluency during the sit-to-walk task. Gait & posture 2013, 37, 598–602. [Google Scholar]
- Jones, G.D.; James, D.C.; Thacker, M.; Perry, R.; Green, D.A. Gait-initiation onset estimation during sit-to-walk: recommended methods suitable for healthy individuals and ambulatory community-dwelling stroke survivors. Plos one 2019, 14, e0217563. [Google Scholar] [CrossRef]
- Song, Y.H.; Cho, S.N.; Nam, S.M. Asymmetric influence of dual-task interference on anticipatory postural adjustments in one-leg stance. International Journal of Environmental Research and Public Health 2022, 19, 11289. [Google Scholar] [CrossRef]
- Chen, T.; Chang, C.-C.; Chou, L.-S. Sagittal plane center of mass movement strategy and joint kinetics during sit-to-walk in elderly fallers. Clinical Biomechanics 2013, 28, 807–812. [Google Scholar] [CrossRef] [PubMed]
- Hommen, J.M.; Batista, J.P.; Bollheimer, L.C.; Hildebrand, F.; Laurentius, T.; Siebers, H.L. Movement patterns during gait initiation in older adults with various stages of frailty: a biomechanical analysis. European Review of Aging and Physical Activity 2024, 21, 1. [Google Scholar] [CrossRef] [PubMed]
- de Souza Fortaleza, A.C.; Mancini, M.; Carlson-Kuhta, P.; King, L.A.; Nutt, J.G.; Chagas, E.F.; Junior, I.F.F.; Horak, F.B. Dual task interference on postural sway, postural transitions and gait in people with Parkinson’s disease and freezing of gait. Gait & posture 2017, 56, 76–81. [Google Scholar]
- Chen, Y.; Tang, H.; Wang, Y.; Jin, C.; Wang, L.; Miao, W.; Wang, X. The effect of complex cognitive context on the dynamic stability during gait initiation in older women. Frontiers in Aging Neuroscience 2024, 15, 1342570. [Google Scholar] [CrossRef]
- Kelly, V.E.; Janke, A.A.; Shumway-Cook, A. Effects of instructed focus and task difficulty on concurrent walking and cognitive task performance in healthy young adults. Experimental brain research 2010, 207, 65–73. [Google Scholar] [CrossRef]
- Yogev-Seligmann, G.; Hausdorff, J.M.; Giladi, N. Do we always prioritize balance when walking? Towards an integrated model of task prioritization. Movement Disorders 2012, 27, 765–770. [Google Scholar] [CrossRef]
- Tsang, W.W.-N.; Chan, V.W.-L.; Wong, H.H.; Yip, T.W.-C.; Lu, X. The effect of performing a dual-task on postural control and selective attention of older adults when stepping backward. Journal of physical therapy science 2016, 28, 2806–2811. [Google Scholar] [CrossRef]
- Jonsson, E.; Henriksson, M.; Hirschfeld, H. Age-related differences in postural adjustments in connection with different tasks involving weight transfer while standing. Gait & posture 2007, 26, 508–515. [Google Scholar]
- Kimijanová, J.; Bzdúšková, D.; Hirjaková, Z.; Hlavačka, F. Age-related changes of the anticipatory postural adjustments during gait initiation preceded by vibration of lower leg muscles. Frontiers in Human Neuroscience 2021, 15, 771446. [Google Scholar] [CrossRef]
- Kong, L.; Zhang, Z.; Bao, J.; Zhu, X.; Tan, Y.; Xia, X.; Zhang, Q.; Hao, Y. Influences of cognitive load on center of pressure trajectory of young male adults with excess weight during gait initiation. Frontiers in Bioengineering and Biotechnology 2024, 11, 1297068. [Google Scholar] [CrossRef]
- Waldon, K.V.T.; Stout, A.; Manning, K.; Gray, L.; Wilson, D.G.; Kang, G.E. Dual-Task Interference Effects on Lower-Extremity Muscle Activities during Gait Initiation and Steady-State Gait among Healthy Young Individuals, Measured Using Wireless Electromyography Sensors. Sensors 2023, 23, 8842. [Google Scholar] [CrossRef] [PubMed]
- Dehail, P.; Bestaven, E.; Muller, F.; Mallet, A.; Robert, B.; Bourdel-Marchasson, I.; Petit, J. Kinematic and electromyographic analysis of rising from a chair during a “Sit-to-Walk” task in elderly subjects: role of strength. Clinical Biomechanics 2007, 22, 1096–1103. [Google Scholar] [CrossRef] [PubMed]
- Cheng, P.-T.; Chen, C.-L.; Wang, C.-M.; Hong, W.-H. Leg muscle activation patterns of sit-to-stand movement in stroke patients. American journal of physical medicine & rehabilitation 2004, 83, 10–16. [Google Scholar]
- Maharaj, J.N.; Cresswell, A.G.; Lichtwark, G.A. Tibialis anterior tendinous tissue plays a key role in energy absorption during human walking. Journal of Experimental Biology 2019, 222, jeb191247. [Google Scholar] [CrossRef]
- Kim, J.; Lee, J.; Lee, G.; Chang, W.H.; Ko, M.-H.; Yoo, W.-K.; Ryu, G.-H.; Kim, Y.-H. Relationship between lower limb muscle activity and cortical activation among elderly people during walking: Effects of fast speed and cognitive dual task. Frontiers in Aging Neuroscience 2023, 14, 1059563. [Google Scholar] [CrossRef]
- Keloth, S.M.; Arjunan, S.P.; Raghav, S.; Kumar, D.K. Muscle activation strategies of people with early-stage Parkinson’s during walking. Journal of NeuroEngineering and Rehabilitation 2021, 18, 1–15. [Google Scholar] [CrossRef]
Figure 1.
Full body marker set.
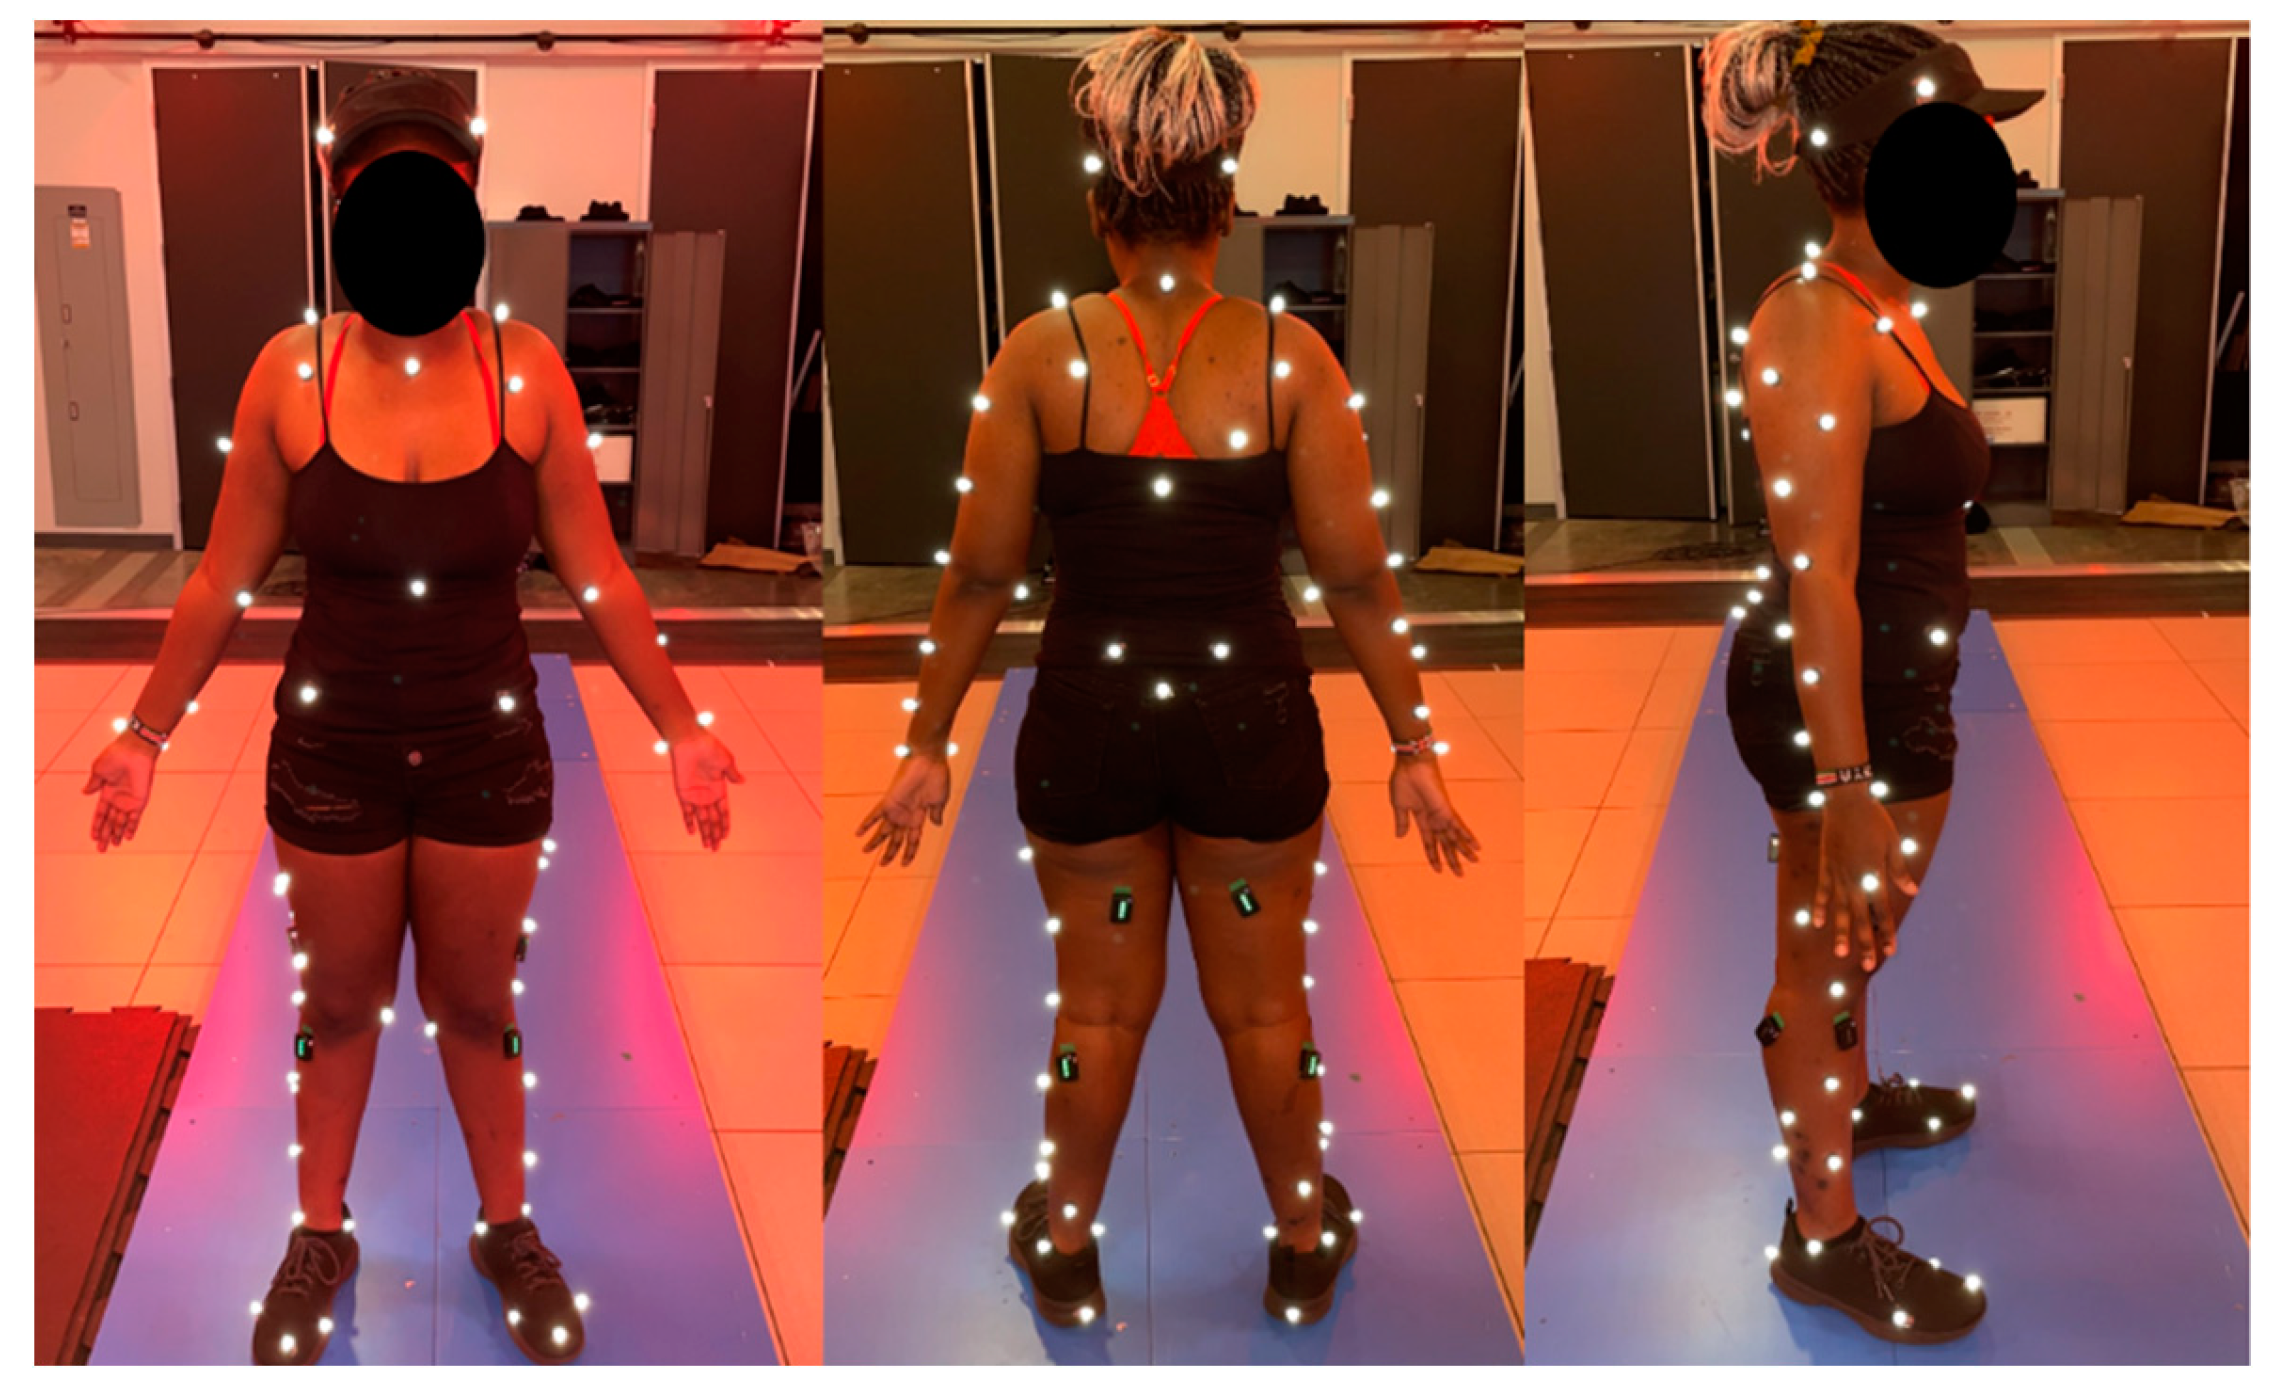
Figure 2.
(A) Postural characteristics of each GI phase identified visualized via Visual3D: Phase 1 (weight shift phase), Phase 2 (pre-swing of the stepping limb phase), and Phase 3 (pre-swing of the stance limb phase). (B) Characteristics of normalized vertical ground reaction force to body weight (y-axis) over time (seconds; x-axis) of the stepping limb (dotted line) and stance limb (solid line). Vertical ground reaction forces were used to identify each GI phase. (C) Characteristics of normalized mediolateral ground reaction force to body weight (y-axis) over time (seconds; x-axis) of the stepping limb (dotted line) and stance limb (solid line). (D) Characteristics of normalized anterior-posterior ground reaction force to body weight (y-axis) over time (seconds; x-axis) of the stepping limb (dotted line) and stance limb (solid line).
Figure 2.
(A) Postural characteristics of each GI phase identified visualized via Visual3D: Phase 1 (weight shift phase), Phase 2 (pre-swing of the stepping limb phase), and Phase 3 (pre-swing of the stance limb phase). (B) Characteristics of normalized vertical ground reaction force to body weight (y-axis) over time (seconds; x-axis) of the stepping limb (dotted line) and stance limb (solid line). Vertical ground reaction forces were used to identify each GI phase. (C) Characteristics of normalized mediolateral ground reaction force to body weight (y-axis) over time (seconds; x-axis) of the stepping limb (dotted line) and stance limb (solid line). (D) Characteristics of normalized anterior-posterior ground reaction force to body weight (y-axis) over time (seconds; x-axis) of the stepping limb (dotted line) and stance limb (solid line).
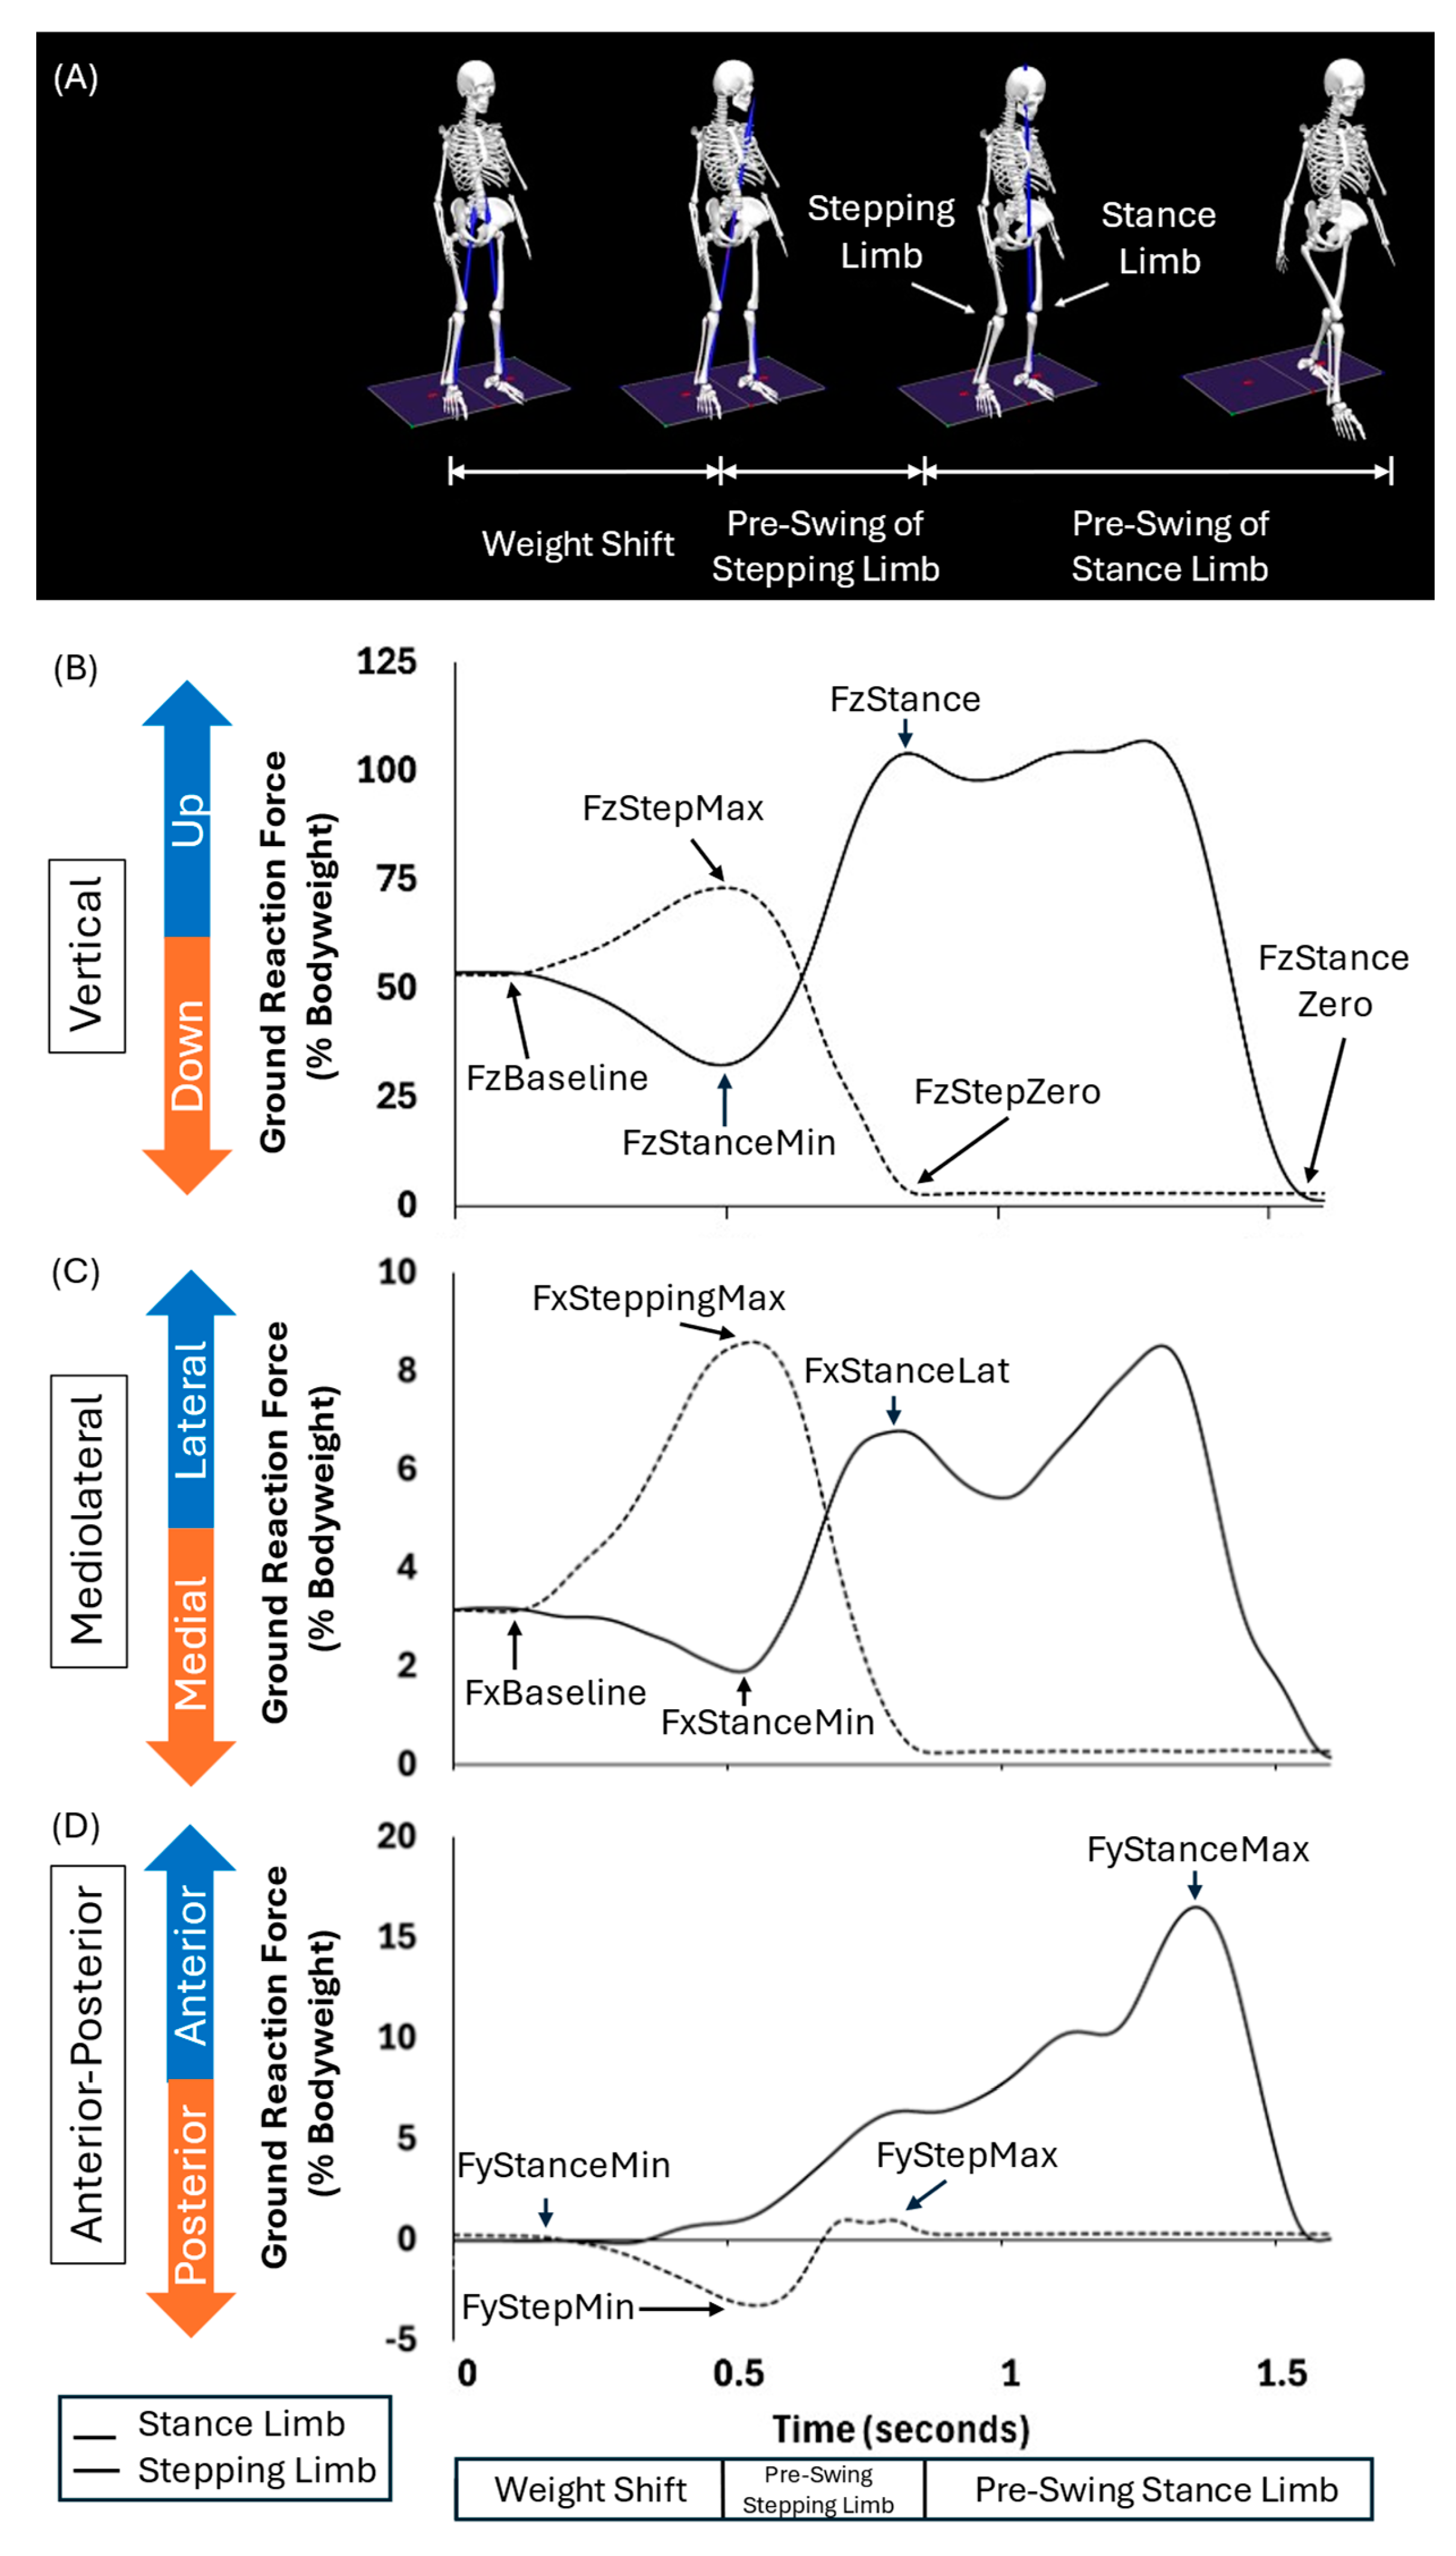
Figure 3.
COFP displacement graph of the stance (left) and stepping (right) limb across the different phases of GI for one participant’s trial.
Figure 3.
COFP displacement graph of the stance (left) and stepping (right) limb across the different phases of GI for one participant’s trial.
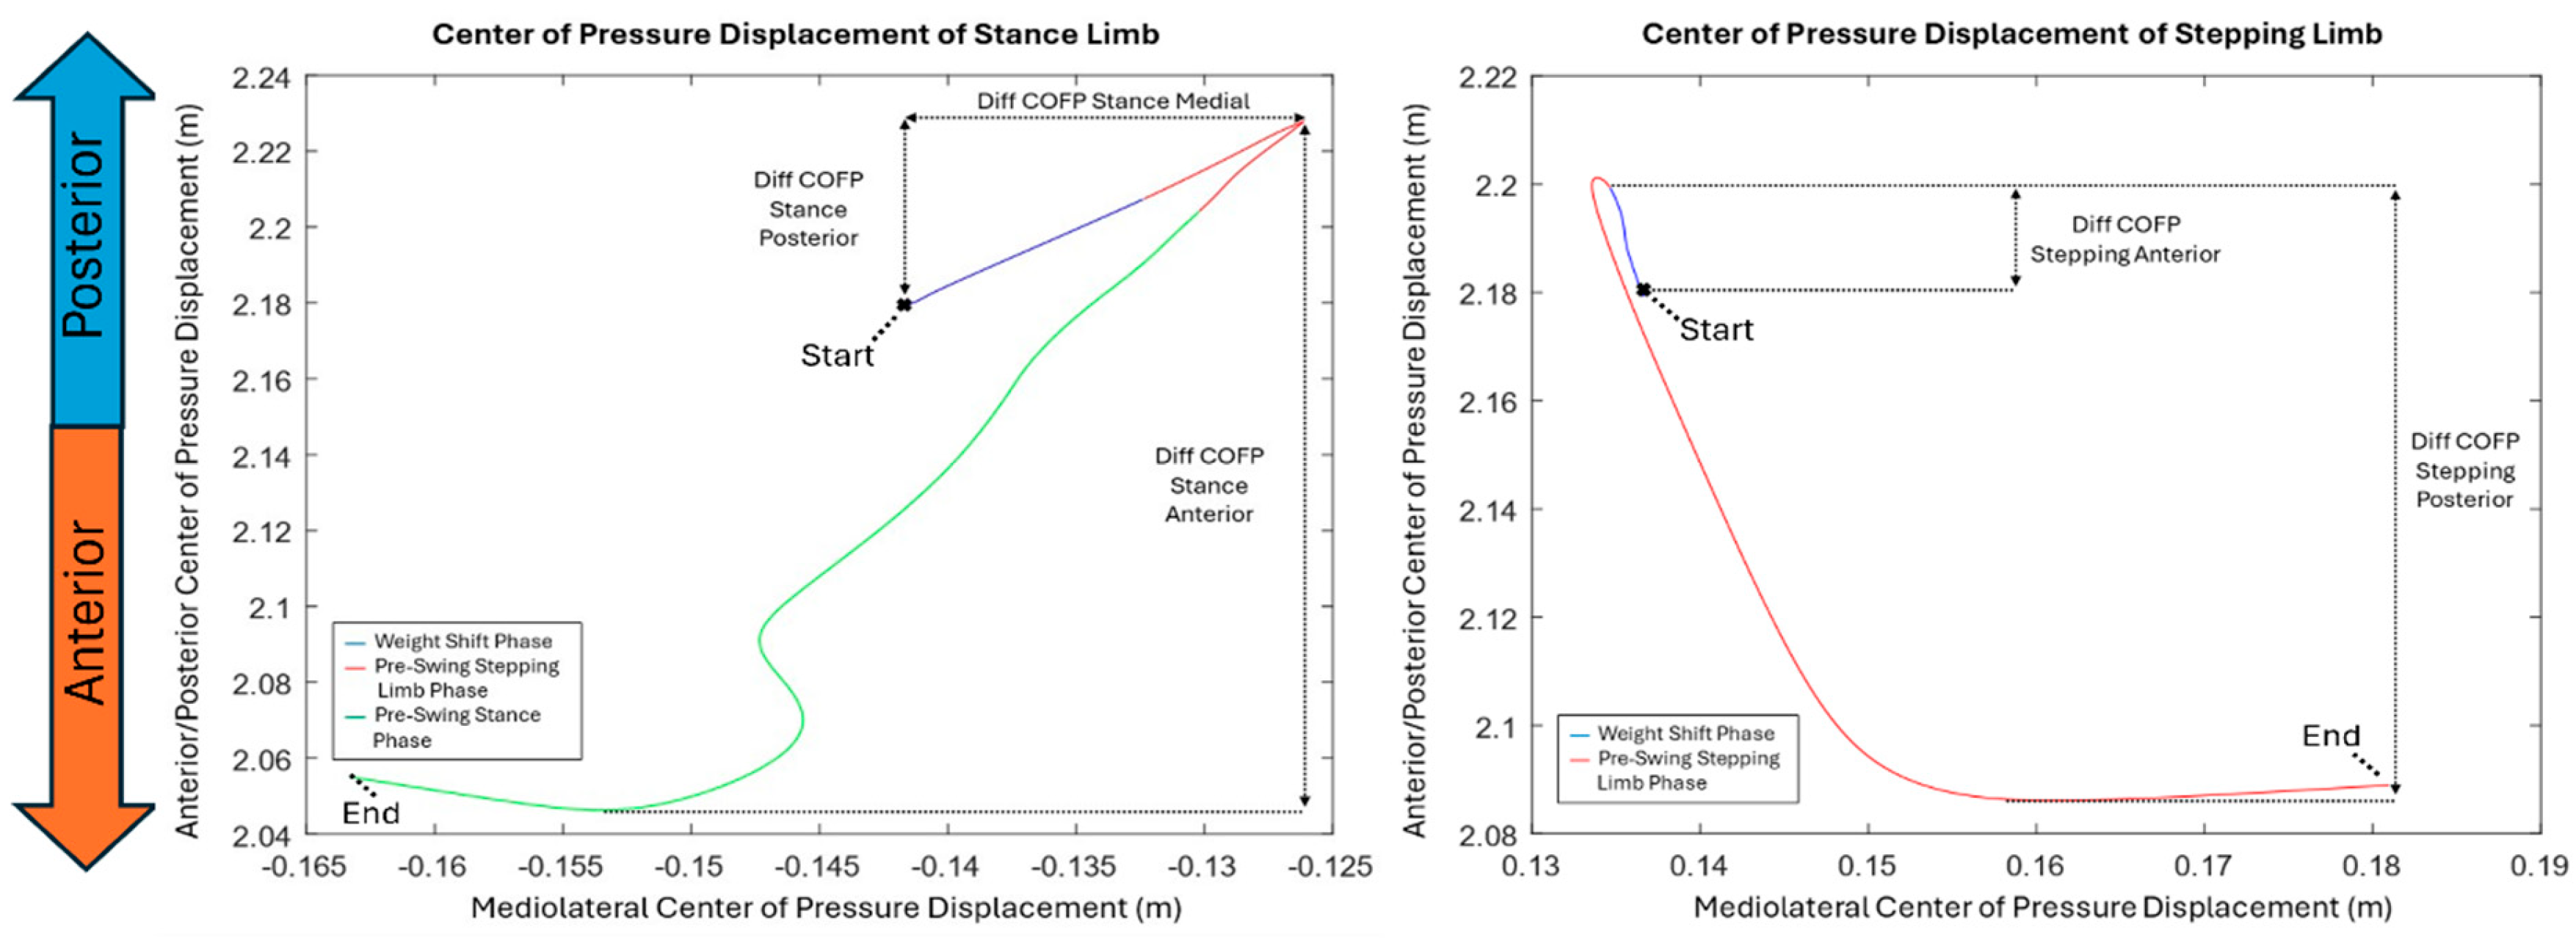
Figure 4.
STW events identified through marker and ground reaction force data via Visual3D: Phase 1 (flexion momentum; from trunk initiation to seat off), Phase 2 (Extension; from seat off to peak CoM vertical velocity), Phase 3 (Unloading; from gait onset initiation to stepping toe off), and Phase 4 (Stance; from stepping toe off to stance toe off).
Figure 4.
STW events identified through marker and ground reaction force data via Visual3D: Phase 1 (flexion momentum; from trunk initiation to seat off), Phase 2 (Extension; from seat off to peak CoM vertical velocity), Phase 3 (Unloading; from gait onset initiation to stepping toe off), and Phase 4 (Stance; from stepping toe off to stance toe off).
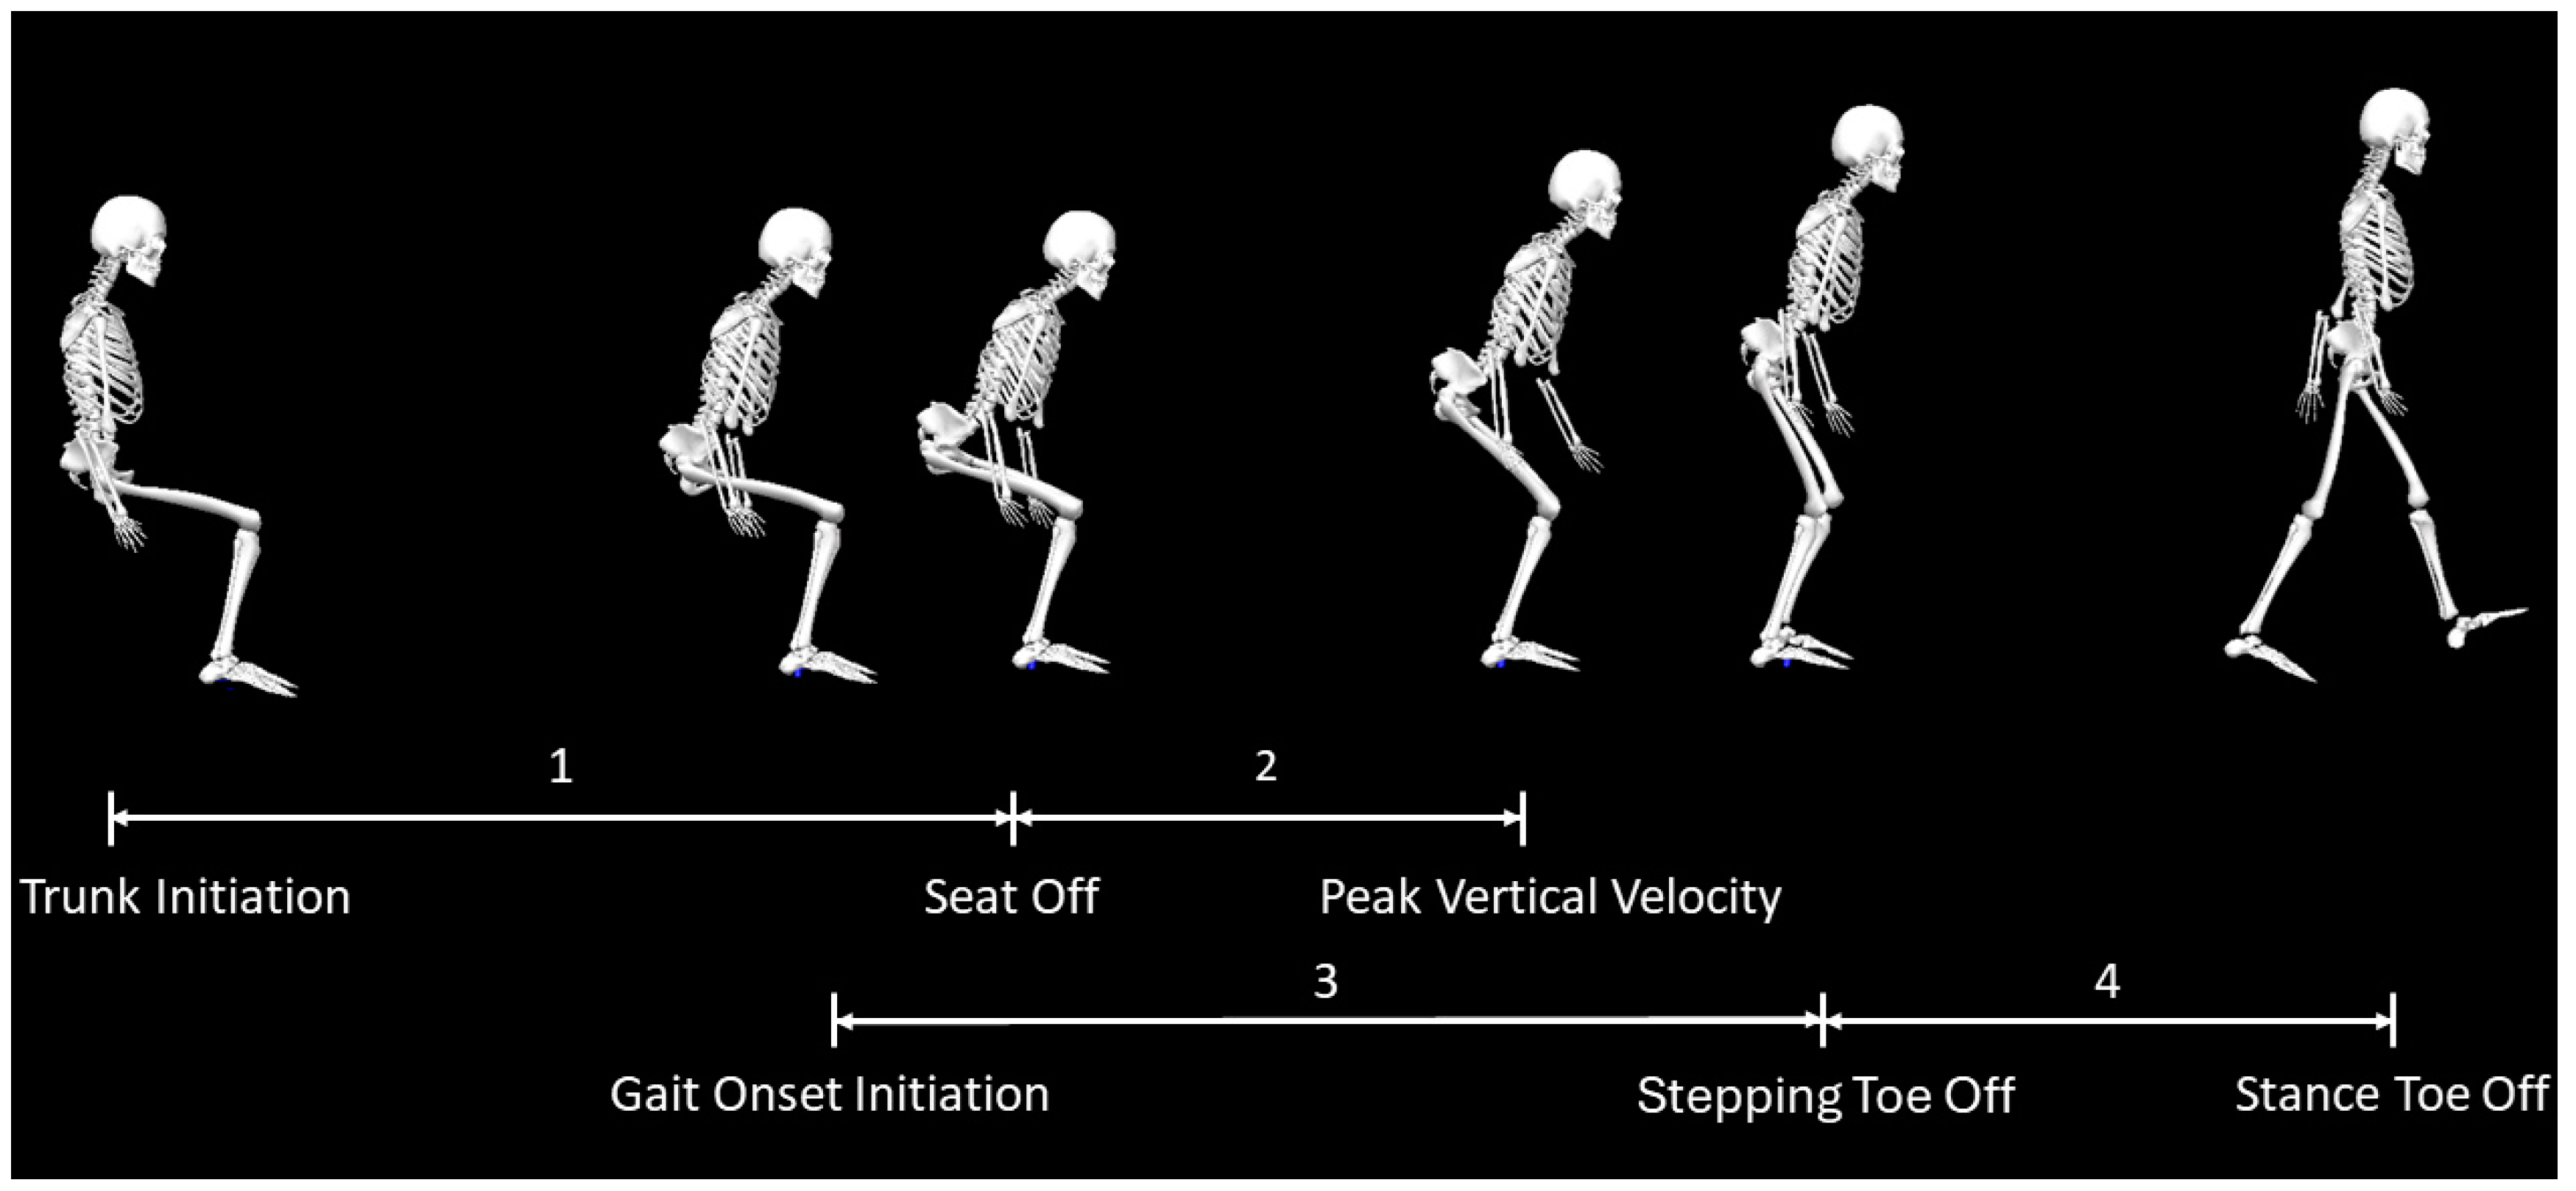
Figure 5.
CoM position (first row) and velocity (second row) in the mediolateral, anterior-posterior, and vertical directions during the total STW duration averaged across all participants.
Figure 5.
CoM position (first row) and velocity (second row) in the mediolateral, anterior-posterior, and vertical directions during the total STW duration averaged across all participants.
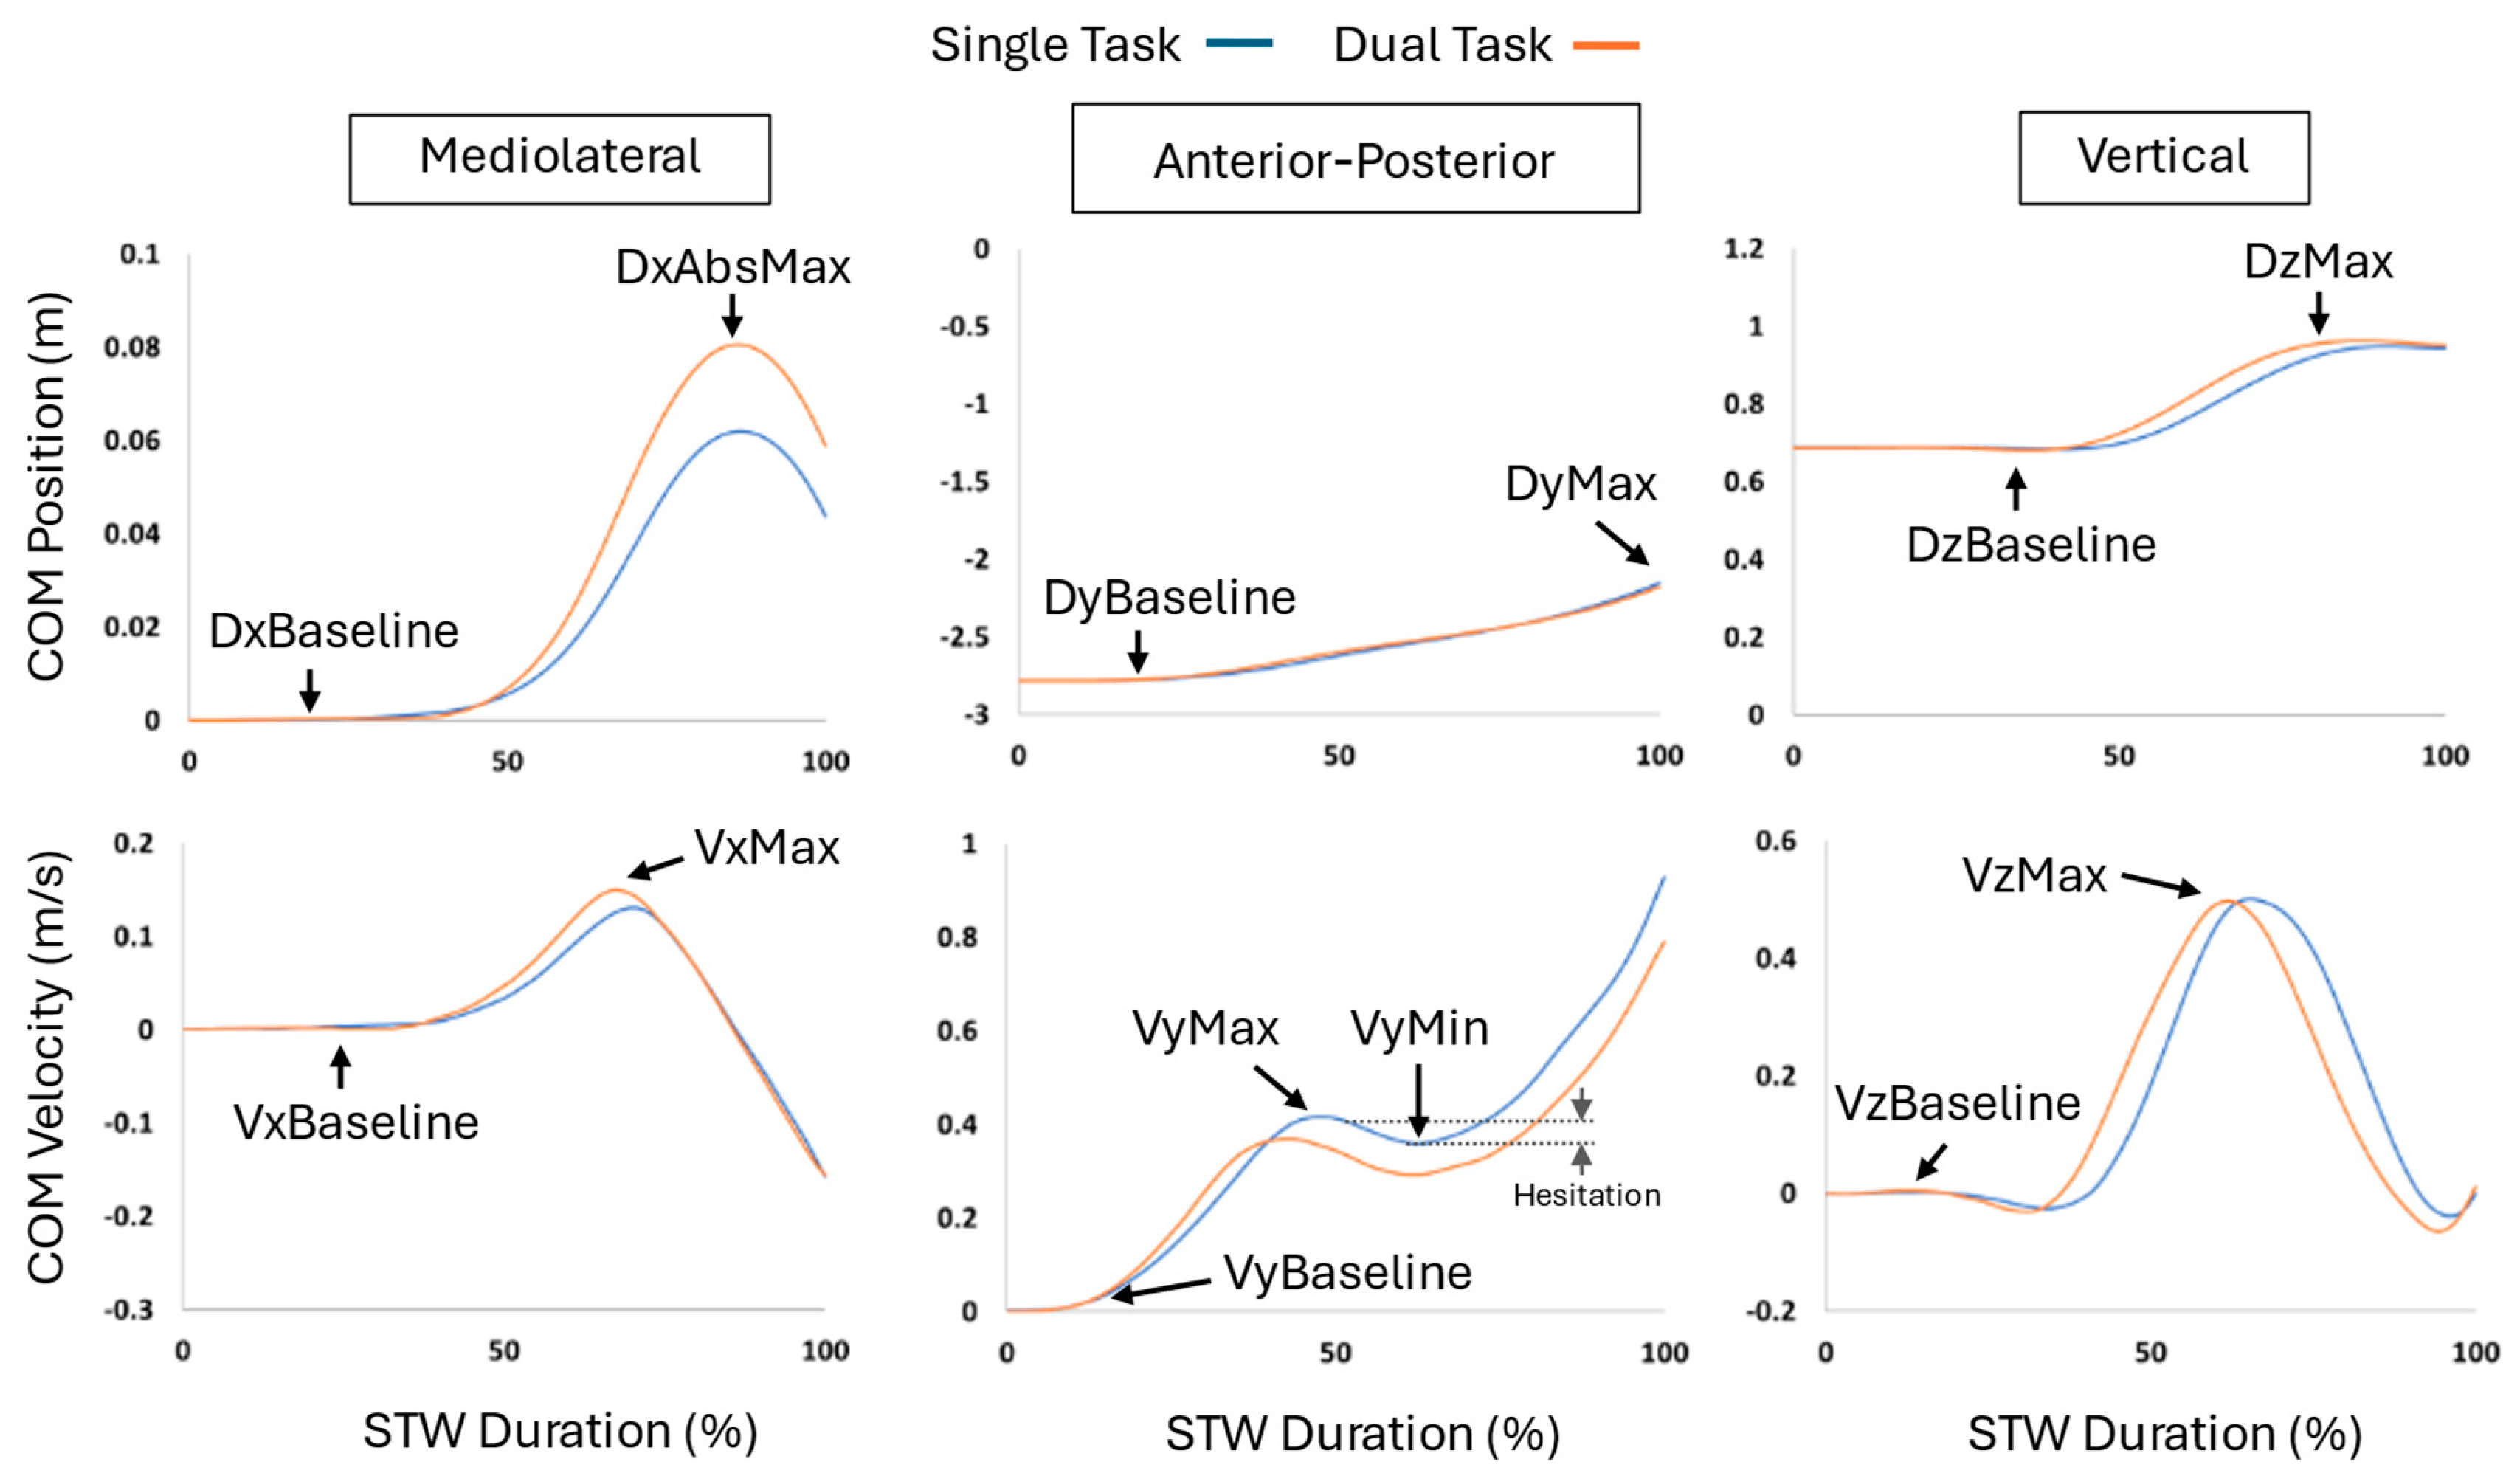
Figure 6.
EMG activation of the stepping and stance limb vastus lateralis, biceps femoris, gastrocnemius, and tibialis anterior muscles during the total GI duration. The left column represents stepping limb and the right column represents the stance limb. Blue line = single task. Orange line = dual task.
Figure 6.
EMG activation of the stepping and stance limb vastus lateralis, biceps femoris, gastrocnemius, and tibialis anterior muscles during the total GI duration. The left column represents stepping limb and the right column represents the stance limb. Blue line = single task. Orange line = dual task.
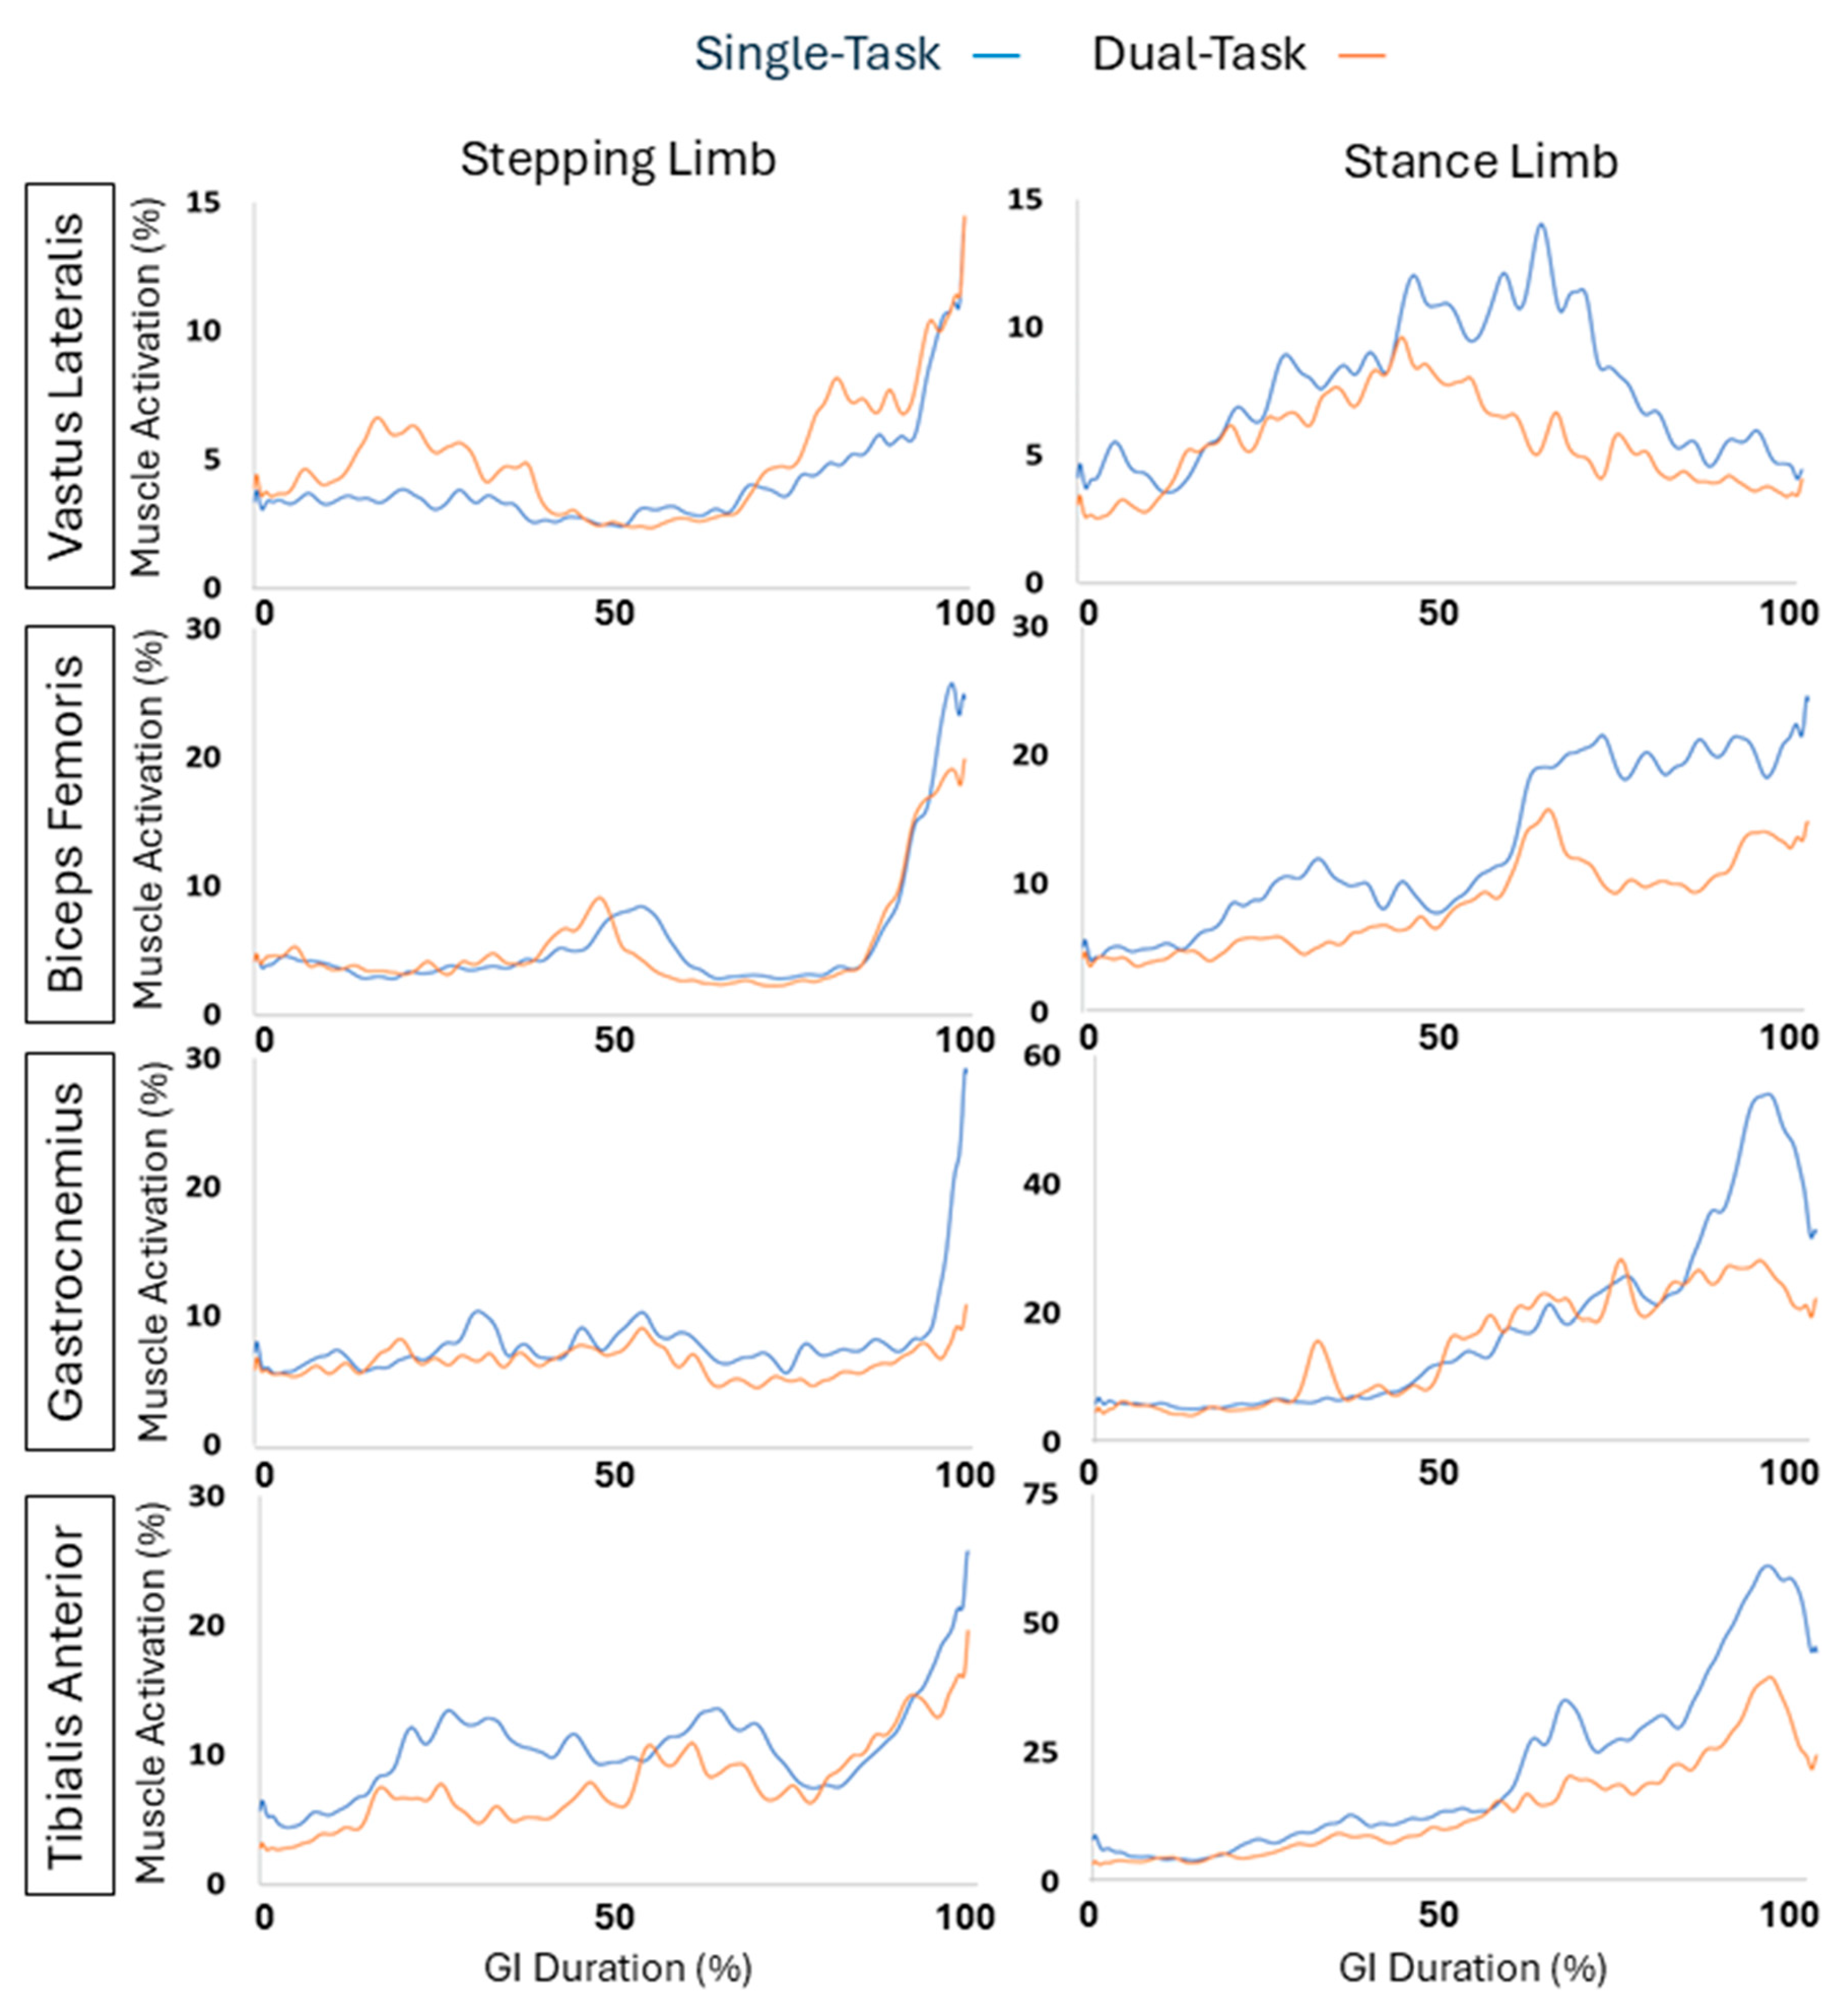
Figure 7.
EMG activation of the stepping and stance limb vastus lateralis, biceps femoris, gastrocnemius, and tibialis anterior muscles during the total STW duration.
Figure 7.
EMG activation of the stepping and stance limb vastus lateralis, biceps femoris, gastrocnemius, and tibialis anterior muscles during the total STW duration.
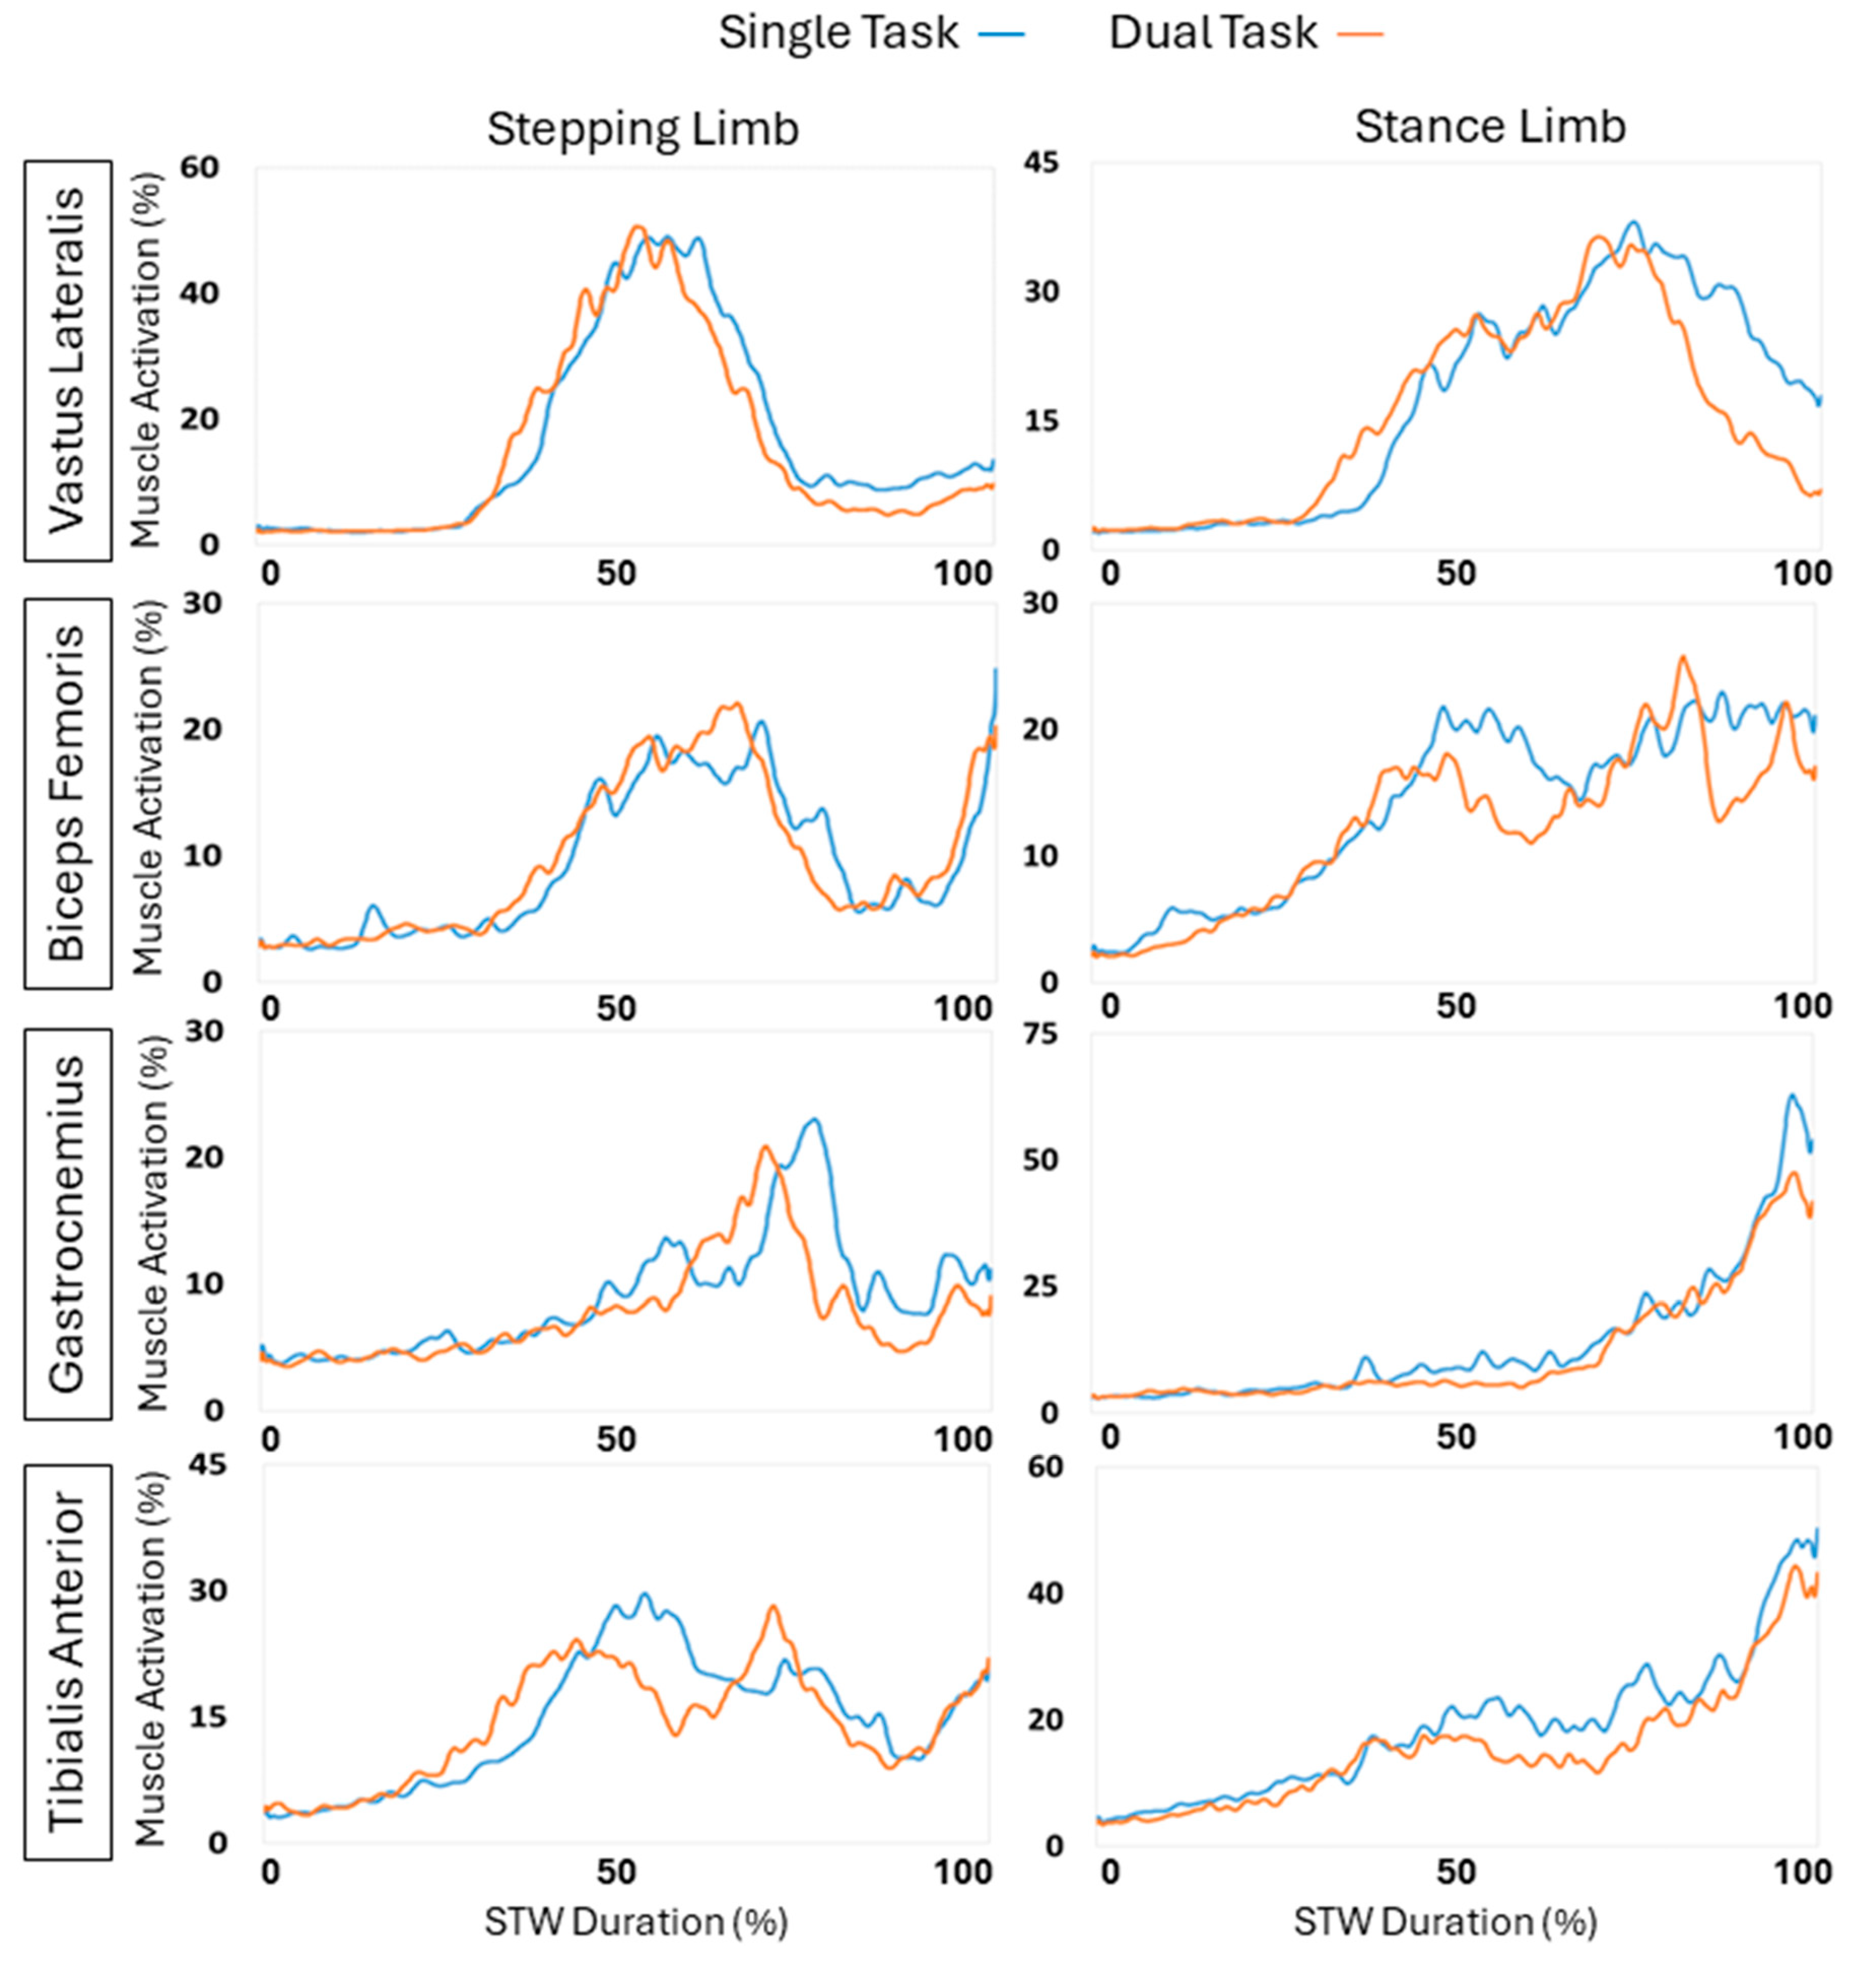

Table 1.
Participant (n = 28) demographic information.
| Number of females | 11 |
| Age (years) | 22.4 ± 5.2 |
| Height (m) | 1.69 ± 0.07 |
| Weight (kg) | 69.0 ± 10. 2 |
| BMI (kg/m2) | 23.9 ± 2.7 |
| MoCA (out of 30) | 27.8 ± 2.0 |
Table 2.
GI spatiotemporal variables of single-task versus dual-task.
| Variables | Single-Task | Dual-Task | P-Value | Effect Size |
|---|---|---|---|---|
| Phase durations (Seconds) | ||||
| Total GI duration | 1.37 ± 0.19 | 1.48 ± 0.23 | 0.005* | 0.44 |
| Phase 1: Weight shift | 0.35 ± 0.15 | 0.32 ± 0.09 | < 0.001* | 0.86 |
| Phase 2: Pre-swing of stepping limb | 0.38 ± 0.12 | 0.43 ± 0.14 | 0.017* | 0.37 |
| Phase 3: Pre-swing of stance limb | 0.64 ± 0.07 | 0.73 ± .11 | 0.001* | 0.81 |
| Phase durations (Normalized; %) | ||||
| Weight shift | 24.8 ± 10.7 | 22.8 ± 7.0 | 0.017* | 0.17 |
| Pre-swing of stepping limb | 26.9 ± 8.6 | 30.6 ± 10.1 | 0.001* | 0.37 |
| Pre-swing of stance limb | 45.2 ± 5.2 | 51.9 ± 8.1 | 0.001* | 4.47 |
| CoM Displacement (cm) | ||||
| Mediolateral | 6.2 ± 2.0 | 7.2 ± 2.2 | 0.001* | 0.48 |
| Vertical | 2.4 ± 0. 9 | 1.7 ± 0. 8 | 0.001* | 0.65 |
Note: Asterisks indicate p < 0.05. Effect sizes were calculated as Cohen’s d with the following classifications: d < 0.2 as a small effect, 0.2 ≤ d < 0.5 as a medium effect and 0.5 ≤ d < 0.8 as a large effect.
Table 3.
Results for ground reaction forces during GI.
| Kinetic Variables | Single-Task | Dual-Task | P-Value | Effect Size |
|---|---|---|---|---|
| Vertical Ground Reaction Force (%BW) | ||||
| Weight shift stepping max | 14.4 ± 7.9 | 17.3 ± 6.0 | 0.004* | 0.31 |
| Weight shift stance min | -15.5 ± 8.4 | -18.2 ± 6.4 | 0.007* | 0.28 |
| Stance loading | 66.6 ± 12.6 | 68.2 ± 9.0 | 0.352 | 0.12 |
| Anterior-Posterior Ground Reaction Force (%BW) | ||||
| Stance Propulsion | 17.8 ± 4.9 | 13.7 ± 5.1 | 0.001* | 0.92 |
| Stepping Propulsion | 3.1 ± 1.9 | 2.4 ± 1.5 | 0.117 | 0.28 |
| Mediolateral Ground Reaction Force (%BW) | ||||
| Stepping Lateral | 3.7 ± 1.9 | 4.1 ± 1.6 | 0.102 | 0.16 |
| Stance Medial | -2.0 ± 1.3 | -2.2 ± 1.3 | 0.03* | 0.15 |
| Stance Lateral | 6.8 ± 2.1 | 6.4 ± 1.6 | 0.232 | 0.19 |
Note: Asterisks indicate p < 0.05. Effect sizes were calculated as Cohen’s d with the following classifications: d < 0.2 as a small effect, 0.2 ≤ d < 0.5 as a medium effect and 0.5 ≤ d < 0.8 as a large effect.
Table 4.
Results for the COFP displacement in centimeters during the weight shift phase.
| COFP Displacements (cm) | Single-Task | Dual-Task | P-Value | Effect Size |
|---|---|---|---|---|
| Stance Anterior | 18.4 ± 3.1 | 19.4 ± 8.7 | 0.392 | 0.13 |
| Stance Posterior | 3.9 ± 1.7 | 3.2 ± 2.0 | 0.01* | 0.36 |
| Stepping Anterior | 13.2 ± 7.4 | 13.5 ± 7.3 | 0.448 | 0.04 |
| Stepping Posterior | 2.6 ± 1.4 | 2.3 ± 1.2 | 0.171 | 0.18 |
Note: Asterisks indicate p < 0.05. Effect sizes were calculated as Cohen’s d with the following classifications: d < 0.2 as a small effect, 0.2 ≤ d < 0.5 as a medium effect and 0.5 ≤ d < 0.8 as a large effect.
Table 5.
Magnitudes of the maximum muscle activation in each muscle in each GI phase and entire GI.
| Muscle Group in Phase | Single-Task | Dual-Task | P-Value | Effect Size |
|---|---|---|---|---|
| Weight Shift Phase | ||||
| Biceps Femoris (stepping limb) | 3.6 ± 2.0 | 3.8 ± 2.6 | 0.843 | 0.07 |
| Biceps Femoris (stance limb) | 5.4 ± 4.9 | 3.9 ± 3.9 | 0.055 | 0.27 |
| Gastrocnemius (stepping limb) | 4.9 ± 3.6 | 6.2 ± 3.5 | 0.294 | 0.26 |
| Gastrocnemius (stance limb) | 5.8 ± 4.6 | 5.6 ± 6.6 | 0.10 | 0.02 |
| Tibialis Anterior (stepping limb) | 5.4 ± 6.5 | 4.3 ± 3.7 | 0.144 | 0.14 |
| Tibialis Anterior (stance limb) | 5.0 ± 4.9 | 4.2 ± 2.9 | 0.244 | 0.17 |
| Vastus Lateralis (stepping limb) | 3.4 ± 3.3 | 3.7 ± 2.5 | 0.636 | 0.08 |
| Vastus Lateralis (stance limb) | 5.0 ± 4.8 | 3.8 ± 3.0 | 0.191 | 0.21 |
| Pre-Swing of Stepping Limb Phase | ||||
| Biceps Femoris (stepping limb) | 5.3 ± 4.9 | 5.0 ± 4.4 | 0.884 | 0.04 |
| Biceps Femoris (stance limb) | 10.0 ± 12.0 | 6.4 ± 4.9 | 0.132 | 0.28 |
| Gastrocnemius (stepping limb) | 7.3 ± 3.7 | 6.8 ± 7.1 | 0.050 | 0.07 |
| Gastrocnemius (stance limb) | 8.2 ± 8.5 | 9.4 ± 12.2 | 0.831 | 0.07 |
| Tibialis Anterior (stepping limb) | 9.6 ± 11.3 | 6.1 ± 4.9 | 0.044* | 0.29 |
| Tibialis Anterior (stance limb) | 11.9 ± 13.8 | 9.0 ± 7.3 | 0.186 | 0.19 |
| Vastus Lateralis (stepping limb) | 3.2 ± 2.8 | 3.5 ± 2.5 | 0.577 | 0.09 |
| Vastus Lateralis (stance limb) | 9.1 ± 9.8 | 7.3 ± 6.2 | 0.281 | 0.17 |
| Pre-Swing of Stance Limb Phase | ||||
| Biceps Femoris (stepping limb) | 7.3 ± 5.0 | 6.1 ± 4.7 | 0.129 | 0.19 |
| Biceps Femoris (stance limb) | 18.6 ± 15.4 | 11.4 ± 8.1 | 0.023* | 0.58 |
| Gastrocnemius (stepping limb) | 7.5 ± 10.1 | 6.1 ± 2.9 | 0.419 | 0.14 |
| Gastrocnemius (stance limb) | 28.4 ± 19.0 | 22.7 ± 17.9 | 0.160 | 0.22 |
| Tibialis Anterior (stepping limb) | 11.9 ± 5.5 | 10.4 ± 4.0 | 0.037* | 0.25 |
| Tibialis Anterior (stance limb) | 23.1 ± 17.7 | 22.5 ± 19.3 | 0.845 | 0.03 |
| Vastus Lateralis (stepping limb) | 4.6 ± 3.4 | 5.0 ± 2.7 | 0.618 | 0.08 |
| Vastus Lateralis (stance limb) | 7.8 ± 6.5 | 5.1 ± 3.8 | 0.10 | 0.41 |
| Total GI | ||||
| Biceps Femoris (stepping limb) | 5.8 ± 3.5 | 5.4 ± 3.6 | 0.354 | 0.10 |
| Biceps Femoris (stance limb) | 12.9 ± 9.4 | 8.3 ± 5.5 | 0.011* | 0.56 |
| Gastrocnemius (stepping limb) | 6.6 ± 6.6 | 6.4 ± 2.9 | 0.890 | 0.02 |
| Gastrocnemius (stance limb) | 16.9 ± 10.2 | 14.9 ± 12.1 | 0.427 | 0.13 |
| Tibialis Anterior (stepping limb) | 9.6 ± 6.0 | 7.7 ± 3.6 | 0.036* | 0.27 |
| Tibialis Anterior (stance limb) | 18.9 ± 22.0 | 14.0 ± 10.8 | 0.098 | 0.21 |
| Vastus Lateralis (stepping limb) | 4.0 ± 2.4 | 4.1 ± 2.6 | 0.851 | 0.03 |
| Vastus Lateralis (stance limb) | 7.5 ± 6.3 | 5.5 ± 4.0 | 0.276 | 0.30 |
Note: Asterisks indicate p < 0.05. Effect sizes were calculated as Cohen’s d with the following classifications: d < 0.2 as a small effect, 0.2 ≤ d < 0.5 as a medium effect and 0.5 ≤ d < 0.8 as a large effect..
Table 6.
Comparison of STW spatiotemporal variables between single-task and dual-task.
| Outcome | Single-Task | Dual-Task | P-Value | Effect Size |
|---|---|---|---|---|
| Phase Duration (s) | ||||
| Total Phase | 1.8 ± 0.3 | 2.0 ± 0.4 | 0.001* | 0.47 |
| Phase 1: Flexion Momentum | 0.9 ± 0.2 | 0.9 ± 0.2 | 0.809 | 0.06 |
| Phase 2: Extension | 0.4 ± 0.1 | 0.4 ± 0.1 | 0.210 | 0.17 |
| Phase 3: Unloading | 0.4 ± 0.1 | 0.5 ± 0.2 | 0.004* | 0.43 |
| Phase 4: Stance | 0.6 ± 0.1 | 0.7 ± 0.1 | 0.001* | 0.67 |
| Peak COM Velocity (m/s) | ||||
| Mediolateral | 0.2 ± 0.1 | 0.2 ± 0.1 | 0.478 | 0.06 |
| Anterior-Posterior | 0.5 ± 0.1 | 0.5 ± 0.1 | 0.369 | 0.28 |
| Velocity Vertical | 0.7 ± 0.1 | 0.7 ± 0.1 | 0.447 | 0.23 |
| Peak COM Displacement (m) | ||||
| Mediolateral | 0.07 ± 0.04 | 0.08 ± 0.05 | 0.397 | 0.15 |
| Anterior-Posterior | 0.6 ± 0.1 | 0.6 ± 0.1 | 0.45 | 0.10 |
| Vertical | 0.25 ± 0.03 | 0.26 ± 0.02 | 0.052 | 0.45 |
| Hesitation (%) | 0.3 ± 0.2 | 0.4 ± 0.2 | 0.041* | 0.29 |
| Absolute Velocity Drop (m/s) | 0.18 ± 0.10 | 0.22 ± 0.10 | 0.061 | 0.26 |
| Initial Step Length (m) | 0.64 ± 0.10 | 0.58 ± 0.12 | 0.004* | 0.45 |
Note: Asterisks indicate p < 0.05. Effect sizes were calculated as Cohen’s d with the following classifications: d < 0.2 as a small effect, 0.2 ≤ d < 0.5 as a medium effect and 0.5 ≤ d < 0.8 as a large effect.
Table 7.
Comparison of STW EMG variables between single-task and dual-task.
| Muscle (% MVC) | Single-Task | Dual-Task | P-Value | Effect Size |
|---|---|---|---|---|
| Phase 1: Flexion Momentum Phase | ||||
| Biceps Femoris (stepping limb) | 4.7 ± 5.4 | 4.1 ± 3.6 | 0.973 | 0.14 |
| Biceps Femoris (stance limb) | 7.5 ± 4.9 | 5.8 ± 6.2 | 0.007* | 0.23 |
| Gastrocnemius (stepping limb) | 5.2 ± 3.0 | 4.3 ± 2.4 | 0.433 | 0.28 |
| Gastrocnemius (stance limb) | 4.4 ± 2.4 | 4.3 ± 2.2 | 0.913 | 0.05 |
| Tibialis Anterior (stepping limb) | 9.2 ± 5.9 | 9.3 ± 6.8 | 0.926 | 0.01 |
| Tibialis Anterior (stance limb) | 9.5 ± 9.6 | 8.3 ± 6.5 | 0.853 | 0.10 |
| Vastus Lateralis (stepping limb) | 6.2 ± 4.5 | 5.6 ± 3.2 | 0.636 | 0.11 |
| Vastus Lateralis (stance limb) | 4.7 ± 3.4 | 4.5 ± 3.1 | 0.726 | 0.05 |
| Phase 2: Extension Phase | ||||
| Biceps Femoris (stepping limb) | 17.5 ± 14.7 | 18.8 ± 13.2 | 0.17 | 0.09 |
| Biceps Femoris (stance limb) | 21.2 ± 12.9 | 17.8 ± 12.4 | 0.174 | 0.21 |
| Gastrocnemius (stepping limb) | 12.2 ± 7.9 | 9.1 ± 7.5 | 0.036* | 0.32 |
| Gastrocnemius (stance limb) | 11.2 ± 10.0 | 6.9 ± 3.5 | 0.048* | 0.42 |
| Tibialis Anterior (stepping limb) | 26.0 ± 15.8 | 24.0 ± 15.0 | 0.432 | 0.10 |
| Tibialis Anterior (stance limb) | 22.6 ± 19.4 | 18.6 ± 15.2 | 0.424 | 0.15 |
| Vastus Lateralis (stepping limb) | 47.1 ± 18.2 | 48.5 ± 16.5 | 0.673 | 0.07 |
| Vastus Lateralis (stance limb) | 28.6 ± 22.0 | 28.3 ± 16.9 | 0.759 | 0.01 |
| Phase 3: Unloading Phase | ||||
| Biceps Femoris (stepping limb) | 15.4 ± 12.0 | 18.9 ± 12.8 | 0.039* | 0.24 |
| Biceps Femoris (stance limb) | 19.6 ± 12.8 | 15.1 ± 10.8 | 0.086 | 0.34 |
| Gastrocnemius (stepping limb) | 11.0 ± 6.9 | 10.7 ± 10.4 | 0.103 | 0.02 |
| Gastrocnemius (stance limb) | 10.4 ± 11.1 | 6.6 ± 3.5 | 0.06 | 0.35 |
| Tibialis Anterior (stepping limb) | 23.1 ± 13.4 | 19.3 ± 11.0 | 0.198 | 0.23 |
| Tibialis Anterior (stance limb) | 20.6 ± 19.1 | 16.6 ± 13.9 | 0.663 | 0.17 |
| Vastus Lateralis (stepping limb) | 42.2 ± 20.0 | 42.0 ± 18.5 | 0.947 | 0.01 |
| Vastus Lateralis (stance limb) | 25.8 ± 21.3 | 25.8 ± 17.2 | 0.628 | 0 |
| Phase 4: Stance Phase | ||||
| Biceps Femoris (stepping limb) | 10.2 ± 6.9 | 11.3 ± 13.9 | 0.99 | 0.09 |
| Biceps Femoris (stance limb) | 19.1 ± 13.6 | 15.1 ± 11.1 | 0.054 | 0.26 |
| Gastrocnemius (stepping limb) | 13.2 ± 10.4 | 8.6 ± 7.9 | 0.004* | 0.52 |
| Gastrocnemius (stance limb) | 29.2 ± 17.3 | 25.6 ± 10.2 | 0.554 | 0.20 |
| Tibialis Anterior (stepping limb) | 16.8 ± 12.5 | 16.6 ± 8.5 | 0.885 | 0.01 |
| Tibialis Anterior (stance limb) | 30.4 ± 13.4 | 25.0 ± 10.6 | 0.038* | 0.32 |
| Vastus Lateralis (stepping limb) | 11.3 ± 10.3 | 7.3 ± 7.3 | 0.003* | 0.38 |
| Vastus Lateralis (stance limb) | 28.5 ± 19.7 | 19.9 ± 13.2 | 0.073 | 0.38 |
| Total STW | ||||
| Biceps Femoris (stepping limb) | 9.5 ± 7.6 | 9.9 ± 6.1 | 0.279 | 0.05 |
| Biceps Femoris (stance limb) | 14.2 ± 7.2 | 12.3 ± 9.9 | 0.264 | 0.16 |
| Gastrocnemius (stepping limb) | 9.0 ± 5.0 | 7.1 ± 4.8 | 0.032* | 0.37 |
| Gastrocnemius (stance limb) | 14.0 ± 7.8 | 12.0 ± 4.4 | 0.557 | 0.28 |
| Tibialis Anterior (stepping limb) | 14.5 ± 7.6 | 14.2 ± 6.8 | 0.89 | 0.03 |
| Tibialis Anterior (stance limb) | 18.7 ± 10.8 | 15.7 ± 6.6 | 0.404 | 0.24 |
| Vastus Lateralis (stepping limb) | 16.6 ± 6.3 | 15.2 ± 5.0 | 0.218 | 0.19 |
| Vastus Lateralis (stance limb) | 17.0 ± 10.3 | 15.1 ± 8.1 | 0.309 | 0.15 |
Note: Asterisks indicate p < 0.05. Effect sizes were calculated as Cohen’s d with the following classifications: d < 0.2 as a small effect, 0.2 ≤ d < 0.5 as a medium effect and 0.5 ≤ d < 0.8 as a large effect.
Disclaimer/Publisher’s Note: The statements, opinions and data contained in all publications are solely those of the individual author(s) and contributor(s) and not of MDPI and/or the editor(s). MDPI and/or the editor(s) disclaim responsibility for any injury to people or property resulting from any ideas, methods, instructions or products referred to in the content. |
© 2024 by the authors. Licensee MDPI, Basel, Switzerland. This article is an open access article distributed under the terms and conditions of the Creative Commons Attribution (CC BY) license (http://creativecommons.org/licenses/by/4.0/).
Copyright: This open access article is published under a Creative Commons CC BY 4.0 license, which permit the free download, distribution, and reuse, provided that the author and preprint are cited in any reuse.


