Submitted:
10 September 2024
Posted:
11 September 2024
You are already at the latest version
Abstract
GR4J (Genie Rural a 4 parame`tres Journalier) is a rainfall-runoff model widely used to modelling rainfall into discharge. In this model, the input data used are daily rainfall and evapotranspiration data, calibrated using daily observed discharge data. This model seeks the optimum parameter value that produces the minimum deviation or error. The Nash-Sutcliffe Coefficient and Relative Volume Error (RVE) are used to estimate the errors that occur. One of the modelling parameters, namely X4 (peak time), has a value that does not match the observed hydrograph peak time (Tp). For this reason, it is necessary to adjust the modelling equation so that the unit hydrograph of the model appropriately in terms of value and shape with observed unit hydrograph. This study examines ten watersheds in Java Island so that it is expected to represent catchment conditions in tropical areas and developing countries. A relationship was obtained between the difference peak time from modelling (X4) and observed Tp. Adjustments Formula can be made to the general GR4J modelling equation for unit hydrograph in Java Island watersheds.

Keywords:
GR4J rainfall-runoff model
; observed unit hydrograph
; synthetic unit hydrograph
; Nash-Sutcliffe coefficient
; Java Island watershed
1. Background
Discharge data is needed to design flood control infrastructure. This discharge data is often very limited in the field, so rainfall data is usually used to calculate flood discharge. Changing rainfall data into discharge can be done by using the general flood equation, where rainfall intensity is multiplied by the basin area and land cover constant. If rainfall data is unavailable, synthetic hydrograph analysis can be used. Synthetic hydrograph analysis is a method that calculate flood from watershed parameter, such as area, length of the river, and so on. Synthetic hydrograph analysis commonly used in Indonesia is Snyder-Alexejev, SCS, Nakayasu, and HSS ITB (Dantje, 2010).
This research examines the analysis of unit hydrographs from GR4J rainfall-runoff model. GR4J, developed by Perrin (2001) has proven to have good results and is efficient in modelling. The GR4J modelling is a development of the GR3J model, where GR3J is a modelling developed by Edijatno and Mitchel (1989).
The study location used is ten watersheds located on Java Island. This model uses input data from daily rainfall and potential evapotranspiration data, calibrated using daily observation discharge data. This study aims to optimise the GR4J modelling parameters with the smallest deviation.
Modelling is done with two stages of activities, namely calibration and model validation. The first five years of data are used for model calibration to obtain the most optimum parameters. In comparison, the second five years of data are used for model validation using previously obtained parameters. The Nash-Sutcliffe Coefficient equation is used to measure the similarity of modelling results with actual hydrographs. This study began by building the GR4J modelling program using Matlab 7.0 software. The input rainfall data is regional rainfall calculated using Thiessen polygons, and potential evapotranspiration data is obtained using the Modified Pennman method. The modelling optimises four free parameters, namely Maximum Production Store Capacity (X1), Ground Water Change Coefficient (X2), Maximum Routing Store Capacity (X3), and The peak time of the unit hydrograph (X4). X4 is an important parameter that will be compared with the peak time of observed unit hydrograph.
2. Research Objectives
This study aims to improve the unit hydrograph based on the results of the GR4j rainfall-runoff modelling in the river basin area in Java Island so that it can be similar to the actual unit hydrograph, both in terms of the peak time of the hydrograph and the shape of the hydrograph.
3. Study Location
Java Island, stands out with its unique geography. Stretching from west to east, it spans about 1,000 km and reaches a maximum width of approximately 210 km. The island is filled with active volcanoes.
The total area of Java Island is 128,297 km², the most populous island in Indonesia. Around 56% of Indonesia's total population is recorded as living on the island of Java (156,927,800 people). This population is concentrated in major cities such as Jakarta (the capital of Indonesia), Surabaya, Bandung, and Yogyakarta, making Java Island a center of economic activity.
The topography of Java Island is varied with a combination of lowlands, highlands, and mountains. There are extensive highlands that often have an excellent and fertile climate suitable for agriculture.
4. Model Description
GR4J is rainfall-runoff modelling that optimizes four free parameters, namely maximum production storage capacity (X1), groundwater change coefficient (X2), maximum route storage capacity (X3), and peak discharge time of UH1 hydrograph unit (X4). This modelling was developed by Perrin in 2001 based on the GR3J method pioneered by Edijatno and Mitchel in 1989.
Previous research by Perrin et al. has shown the performance of the GR4J model to be better than other rainfall-runoff models such as TOPMODEL, Tank model, IHACRES, HBV, SMAR, and others (Hydrology Journal 279 pages 275-289, 2003). Perrin's research was conducted in 429 watersheds with diverse climate conditions, including tropical climates. This makes GR4J relevant for use in areas such as Indonesia, which has the same tropical climate.
The physical description of the GR4J modelling from the process of rainfall to the discharge collected in the river can be described as follows:
- Production Store (X1) is a reservoir on the surface that can hold water from rainfall. This reservoir sustains evapotranspiration and percolation processes. The soil type influences the size of the production storage in a watershed. The smaller the soil porosity, the larger the existing production store.
- Groundwater change coefficient (X2) is a function of groundwater changes that affect the size of the routing store. When it has a negative value, the water enters the aquifer, and when it has a positive value, the water from the aquifer comes out and goes into production storage.
- Routing storage (X3) is the water capacity stored in the ground.
- Peak time (X4) is the time required to reach the peak of the unit hydrograph ordinate. This unit hydrograph is generated from the direct runoff, where 10% of the flow becomes a fast flow going to the river, and 90% becomes a slow flow that holds up or enters the ground.
Figure 1 shows all the water quantity calculations in mm. The first step is to enter the daily rainfall (P) and potential evapotranspiration (E) data. P is defined as net rainfall Pn and E as net evapotranspiration En. Below are the equations for obtaining Pn and En.
If P ≥ E, then Pn = P – E, and En = 0.
If P ≤ E, then En = E – P, and Pn = 0.
The next step is to find the Pn value, formulated as follows:
Another case of P < E is formulated as follows:
En reduces production store, and production store S never exceeds X1. So, the production store is formulated as follows:
Si = Si-1 – Es + Ps
In the production store, Percolation is formulated as follows:
Perc is always considered to be lower than S. So the storage value can be formulated as follows:
Si = Si-1 − Perc
Part of Pn − Ps from Pn and part of the percolation from the production store combine and reach the routing store Pr.
Pr = Perc + (Pn − Ps)
The amount of water reaching the routing store is divided into fast and slow flow. Fast flows are routed with the UH1 hydrograph unit and slow flows with UH2. The UH1 hydrograph unit routes 90% of Pr, and UH2 routes the remainder.
UH1 is defined based on time, t as follows:
For t ≤ 0, SH1(t) = 0
For t ≥ X4, SH1(t) = 1
Like SH1, SH2 is searched as follows:
For t ≤ 0, SH2(t) = 0
For t ≥ X4, SH2(t) = 1
UH1 and UH2 are formulated as follows:
UH1 = SH1J − SH1J–1
UH2 = SH2J − SH2J–1
Groundwater change, F, is formulated as follows:
Where R is the height of the routing store, provided that R never exceeds X3, the height of the routing store changes as Q9 increases from UH1 and F, so it can be formulated as follows:
R = max (0; R + Q9 + F)
The discharge Qr from the storage can be calculated with the equation:
Where it is always lower than R, the height of the reservoir can then be calculated using the equation:
R = R − Qr
Water originating from routing/tracing is called Qd and is calculated using the equation:
R = max (0; R + Q1 + F)
The total discharge, Q, can be calculated with the equation:
Q = Qr + Qd
5. Model Calibration
Daily discharge data at the outlet is needed to calibrate the model so that the optimum value of four parameters is obtained. This modelling process uses the MATLAB 7.0 program.
The Nash-Sutcliffe Coefficient and Relative Volume Error (RVE) methods are used to calculate the deviation between the observed discharge and the modelled discharge. The general Nash-Sutcliffe Coefficient equation is as follows:
with:
Xi = observation data (actual data)
Yi = estimation data (estimation result data)
= average observation data
N = estimation data (estimation result data)
The Nash-Sutcliffe Coefficient method can show the similarity of observed discharge compared to modelled discharge and the best result for NS value is one.

Table 1.
Criteria of Nash-Sutcliffe Efficiency (NSE) value.
| NSE Value | Interpretation |
|---|---|
|
NSE > 0.75 0.36 < NSE < 0.75 NSE < 0.36 |
Good Qualified Not Qualified |
Source: Motovilov. et al. 1999.
General Equation for Relative Volume Error,
The median and approximate 80% confidence intervals of the GR4J parameters are expressed in Table 2 below:
6. Analysis and Discussion
Daily discharge from 1825 observations data (5 years, 2008–2012) was used as calibration data to obtain the optimum GR4J parameter. The NS coefficient measures how well the model predicts the observed data.
To get the most optimum results we do iteration, each parameter must be evaluated by selecting the parameter that produces the minimum error. If a new parameter is obtained with minimum error, the previous parameter is replaced with a new one. So, if there is no better parameter value, the value will not change. The calculations obtained the deviation values, as seen in Table 3.
From the results above, it can be seen that the deviation using the Nash-Sutcliffe coefficient method gives a value of 0.82 for calibration data and 0.65 for validating data, which means the model has good results. Figure 2 shows the observed discharge compared to the modelling discharge calculated using the parameter values that produce the smallest deviation.
Figure 2.
Graph of observed discharge vs modeled discharge (2008–2012).
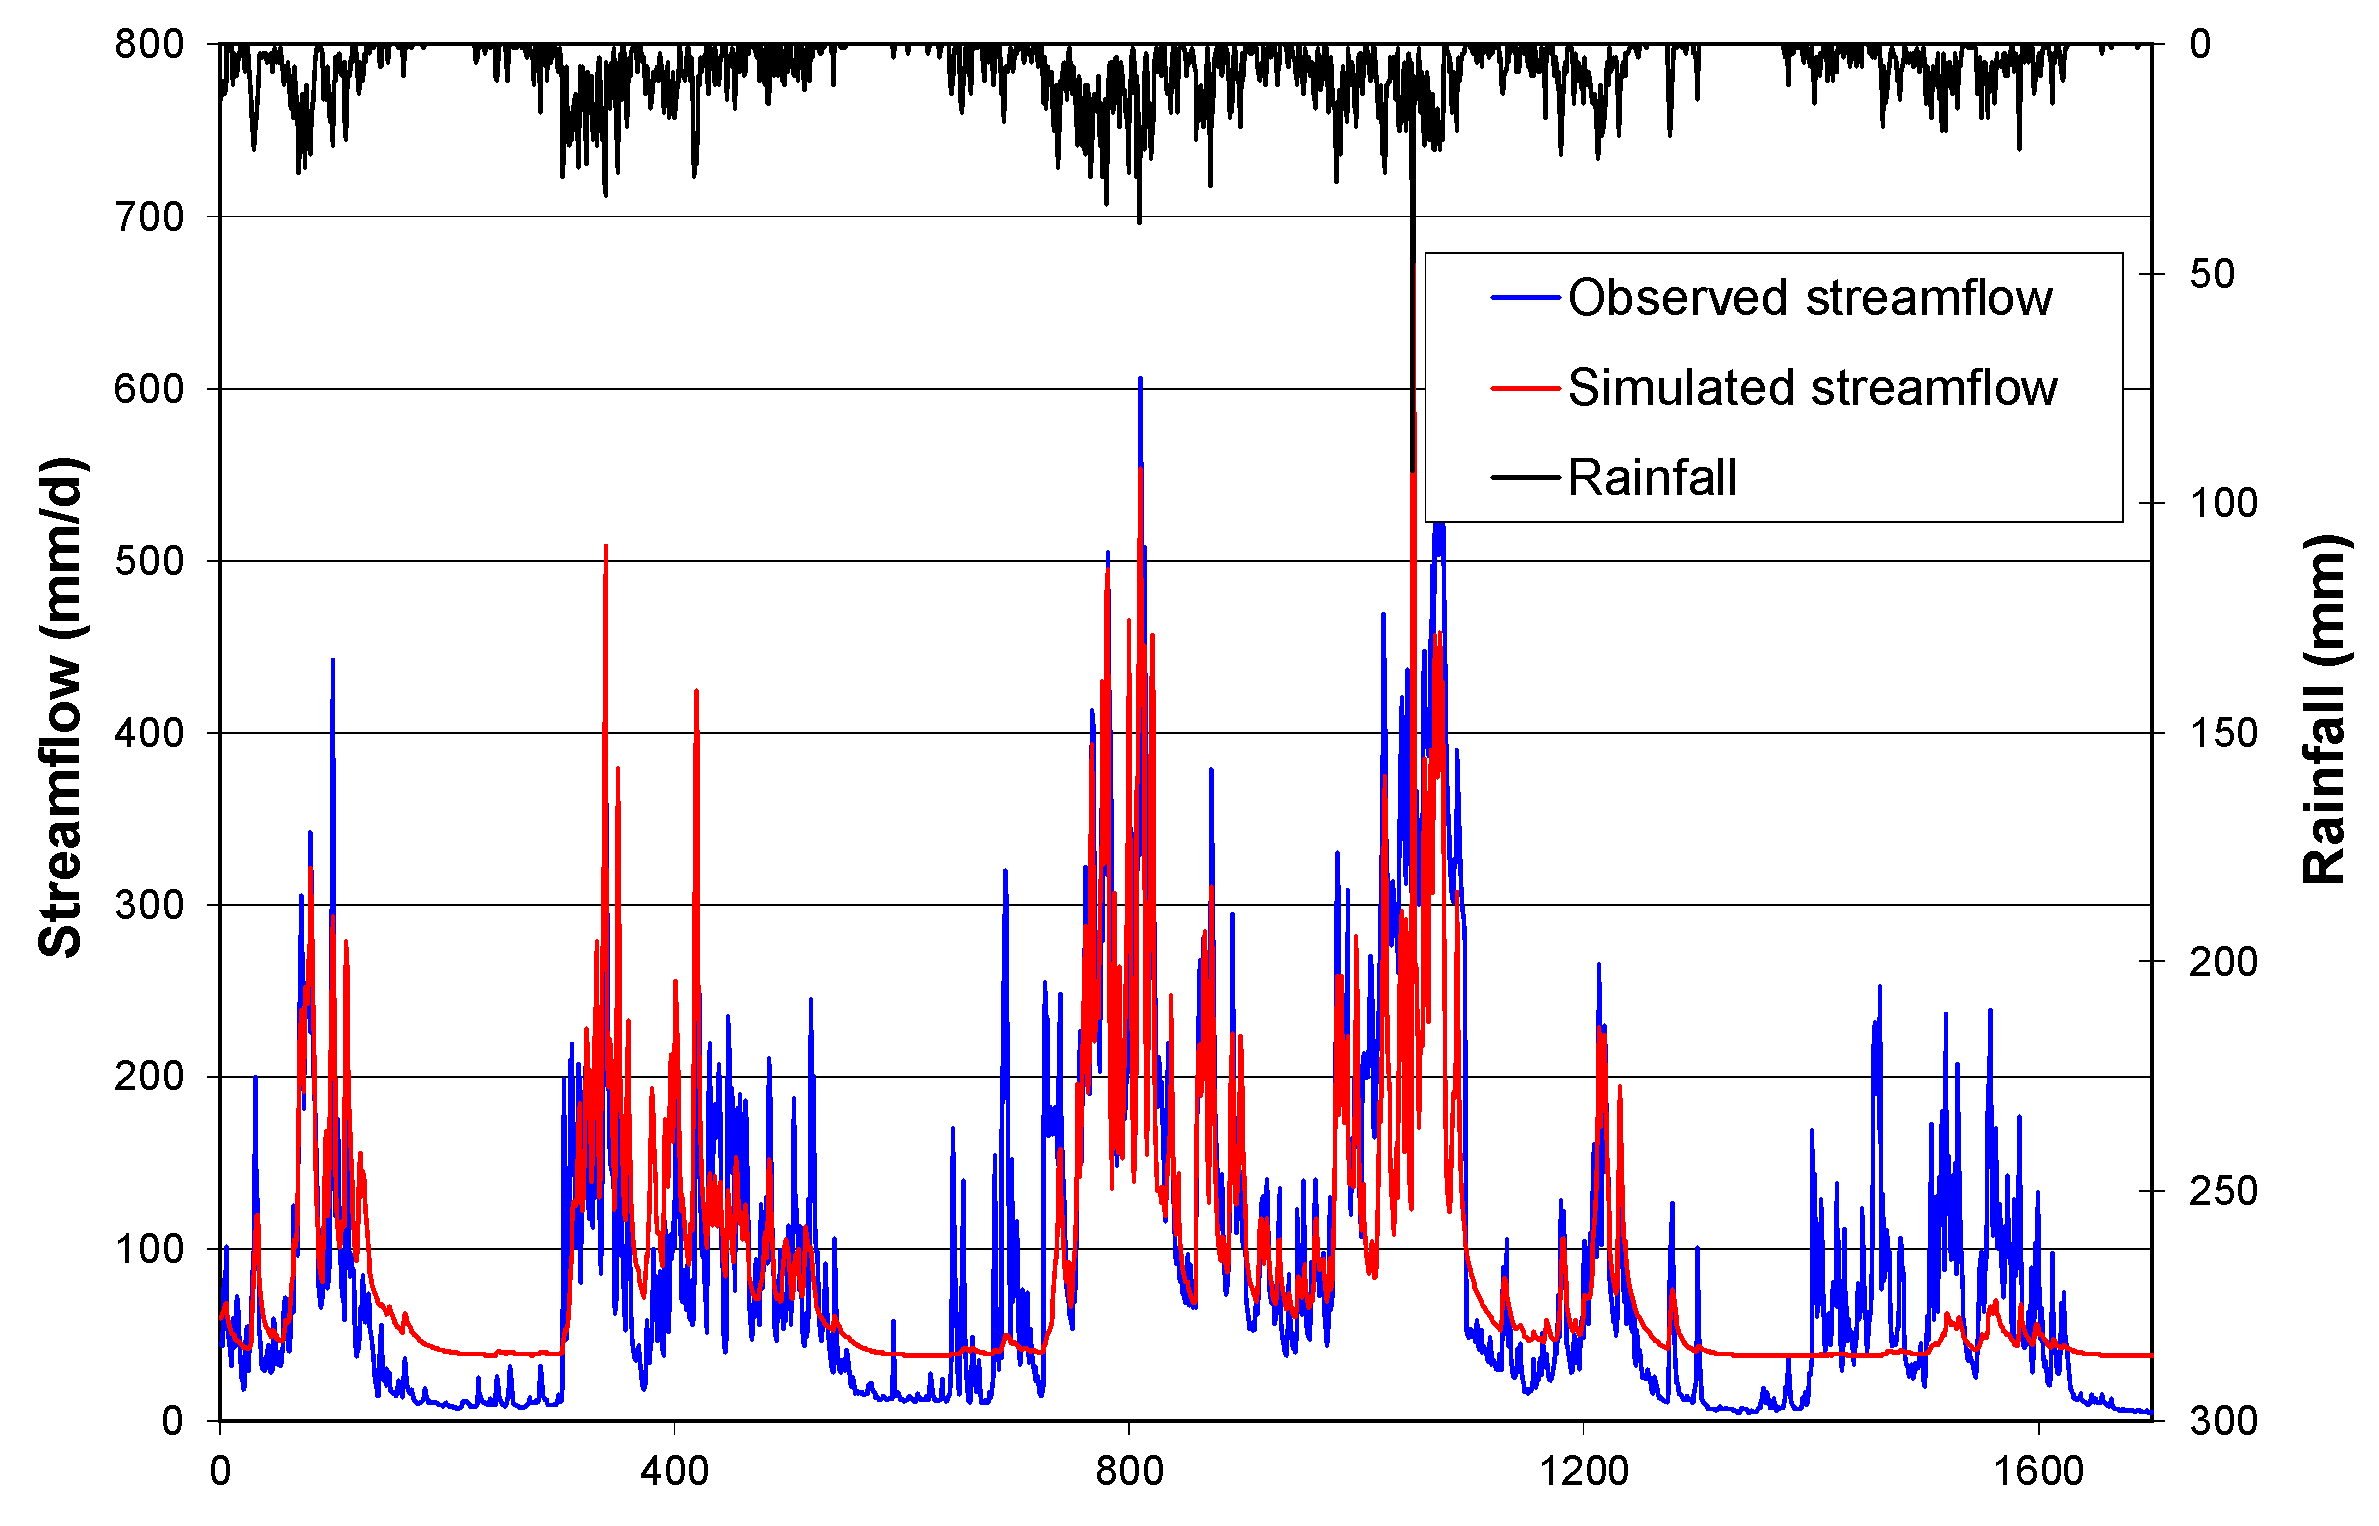
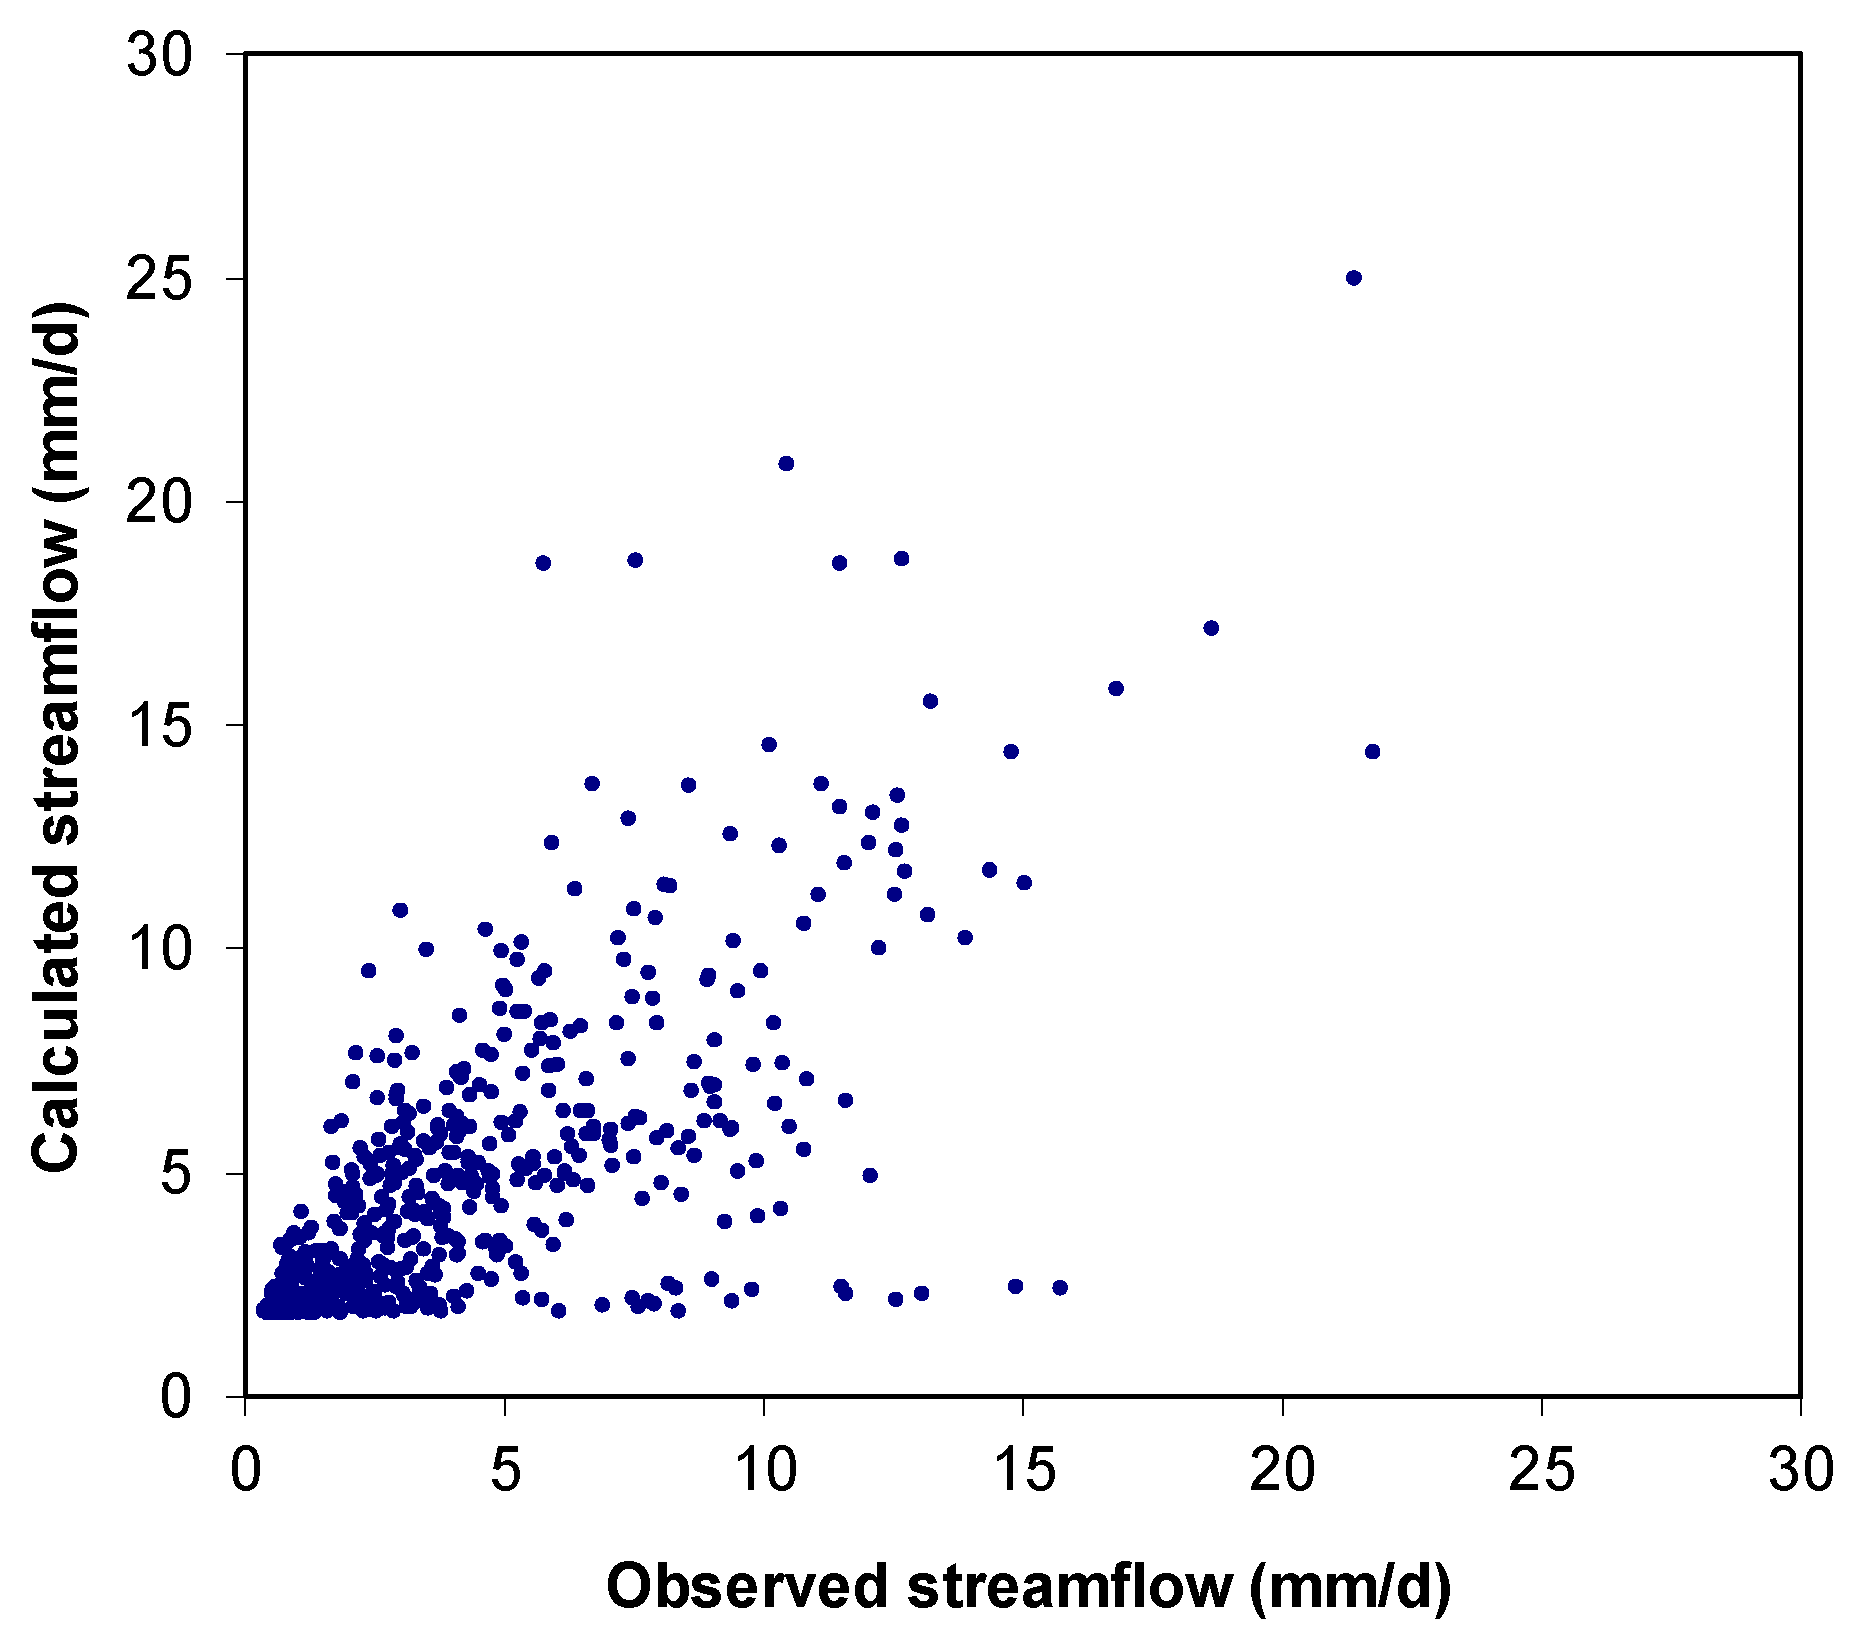
Figure 3.
Flow XY plot compares observed and modelled discharge (2008–2012).
Validate Model
To validate the model, optimum parameters obtained from the previous modelling are used to model the next five years of data, namely 2013–2017. Figure 4 compares observed discharge and modelling discharge obtained using data for 2013–2017.
Figure 4.
Graph of Observed Discharge vs Modeled Discharge (2013–2017).
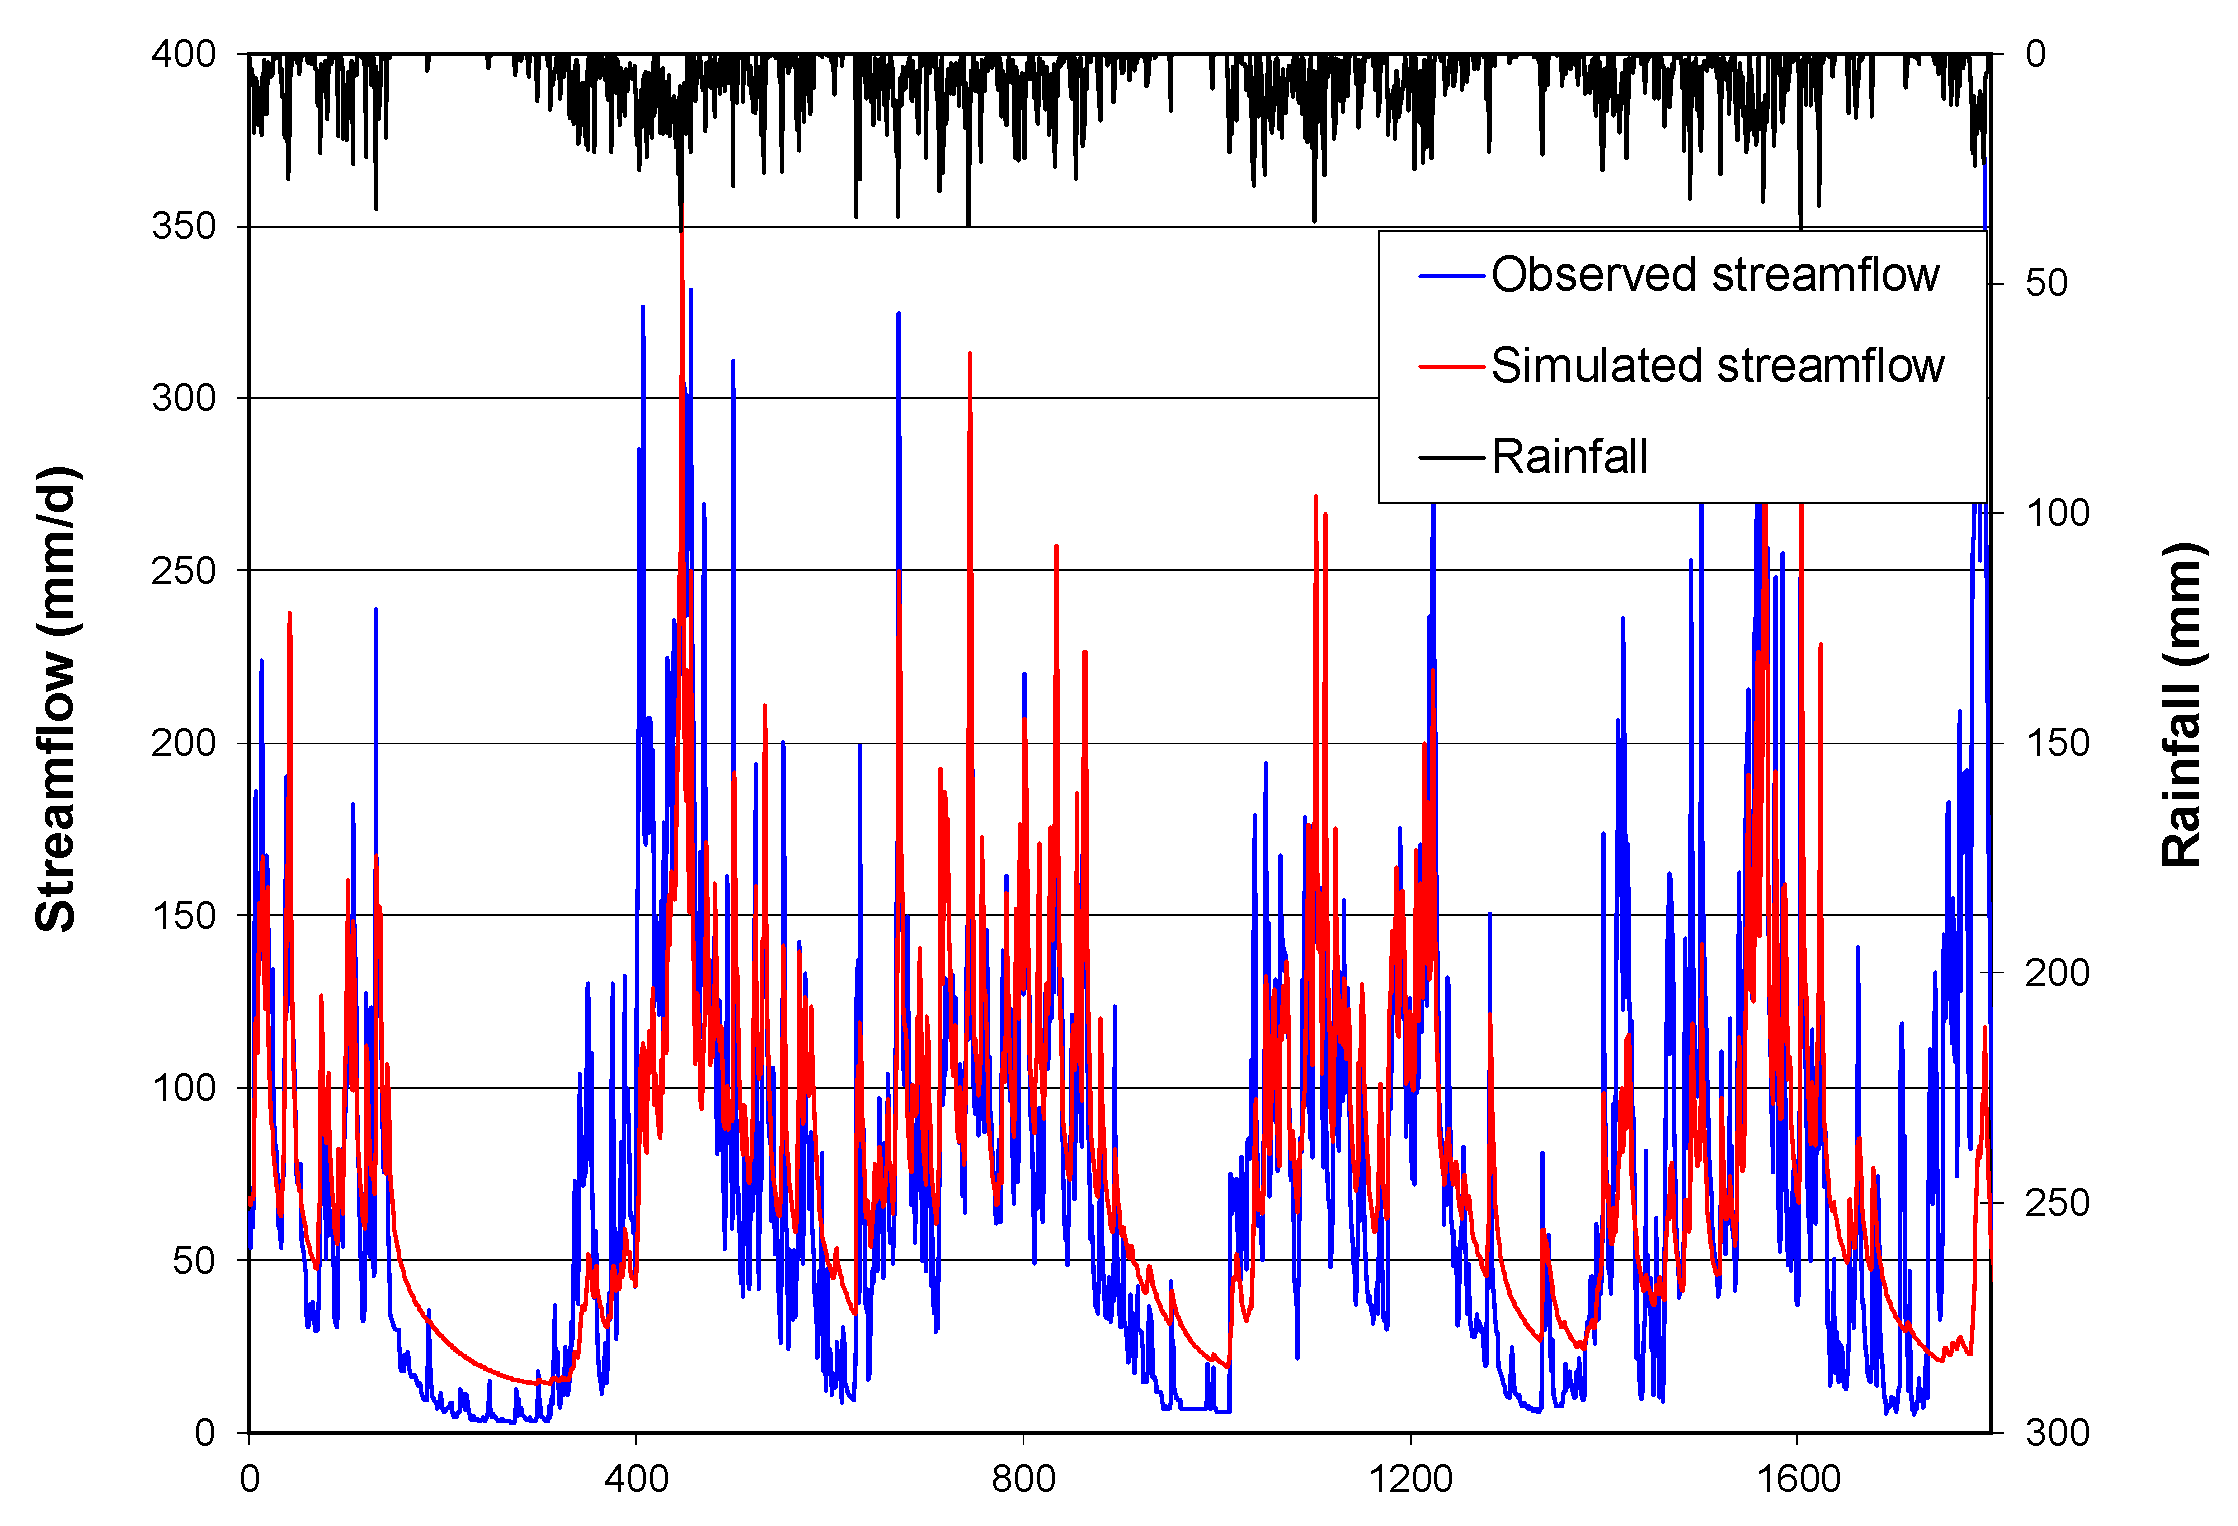
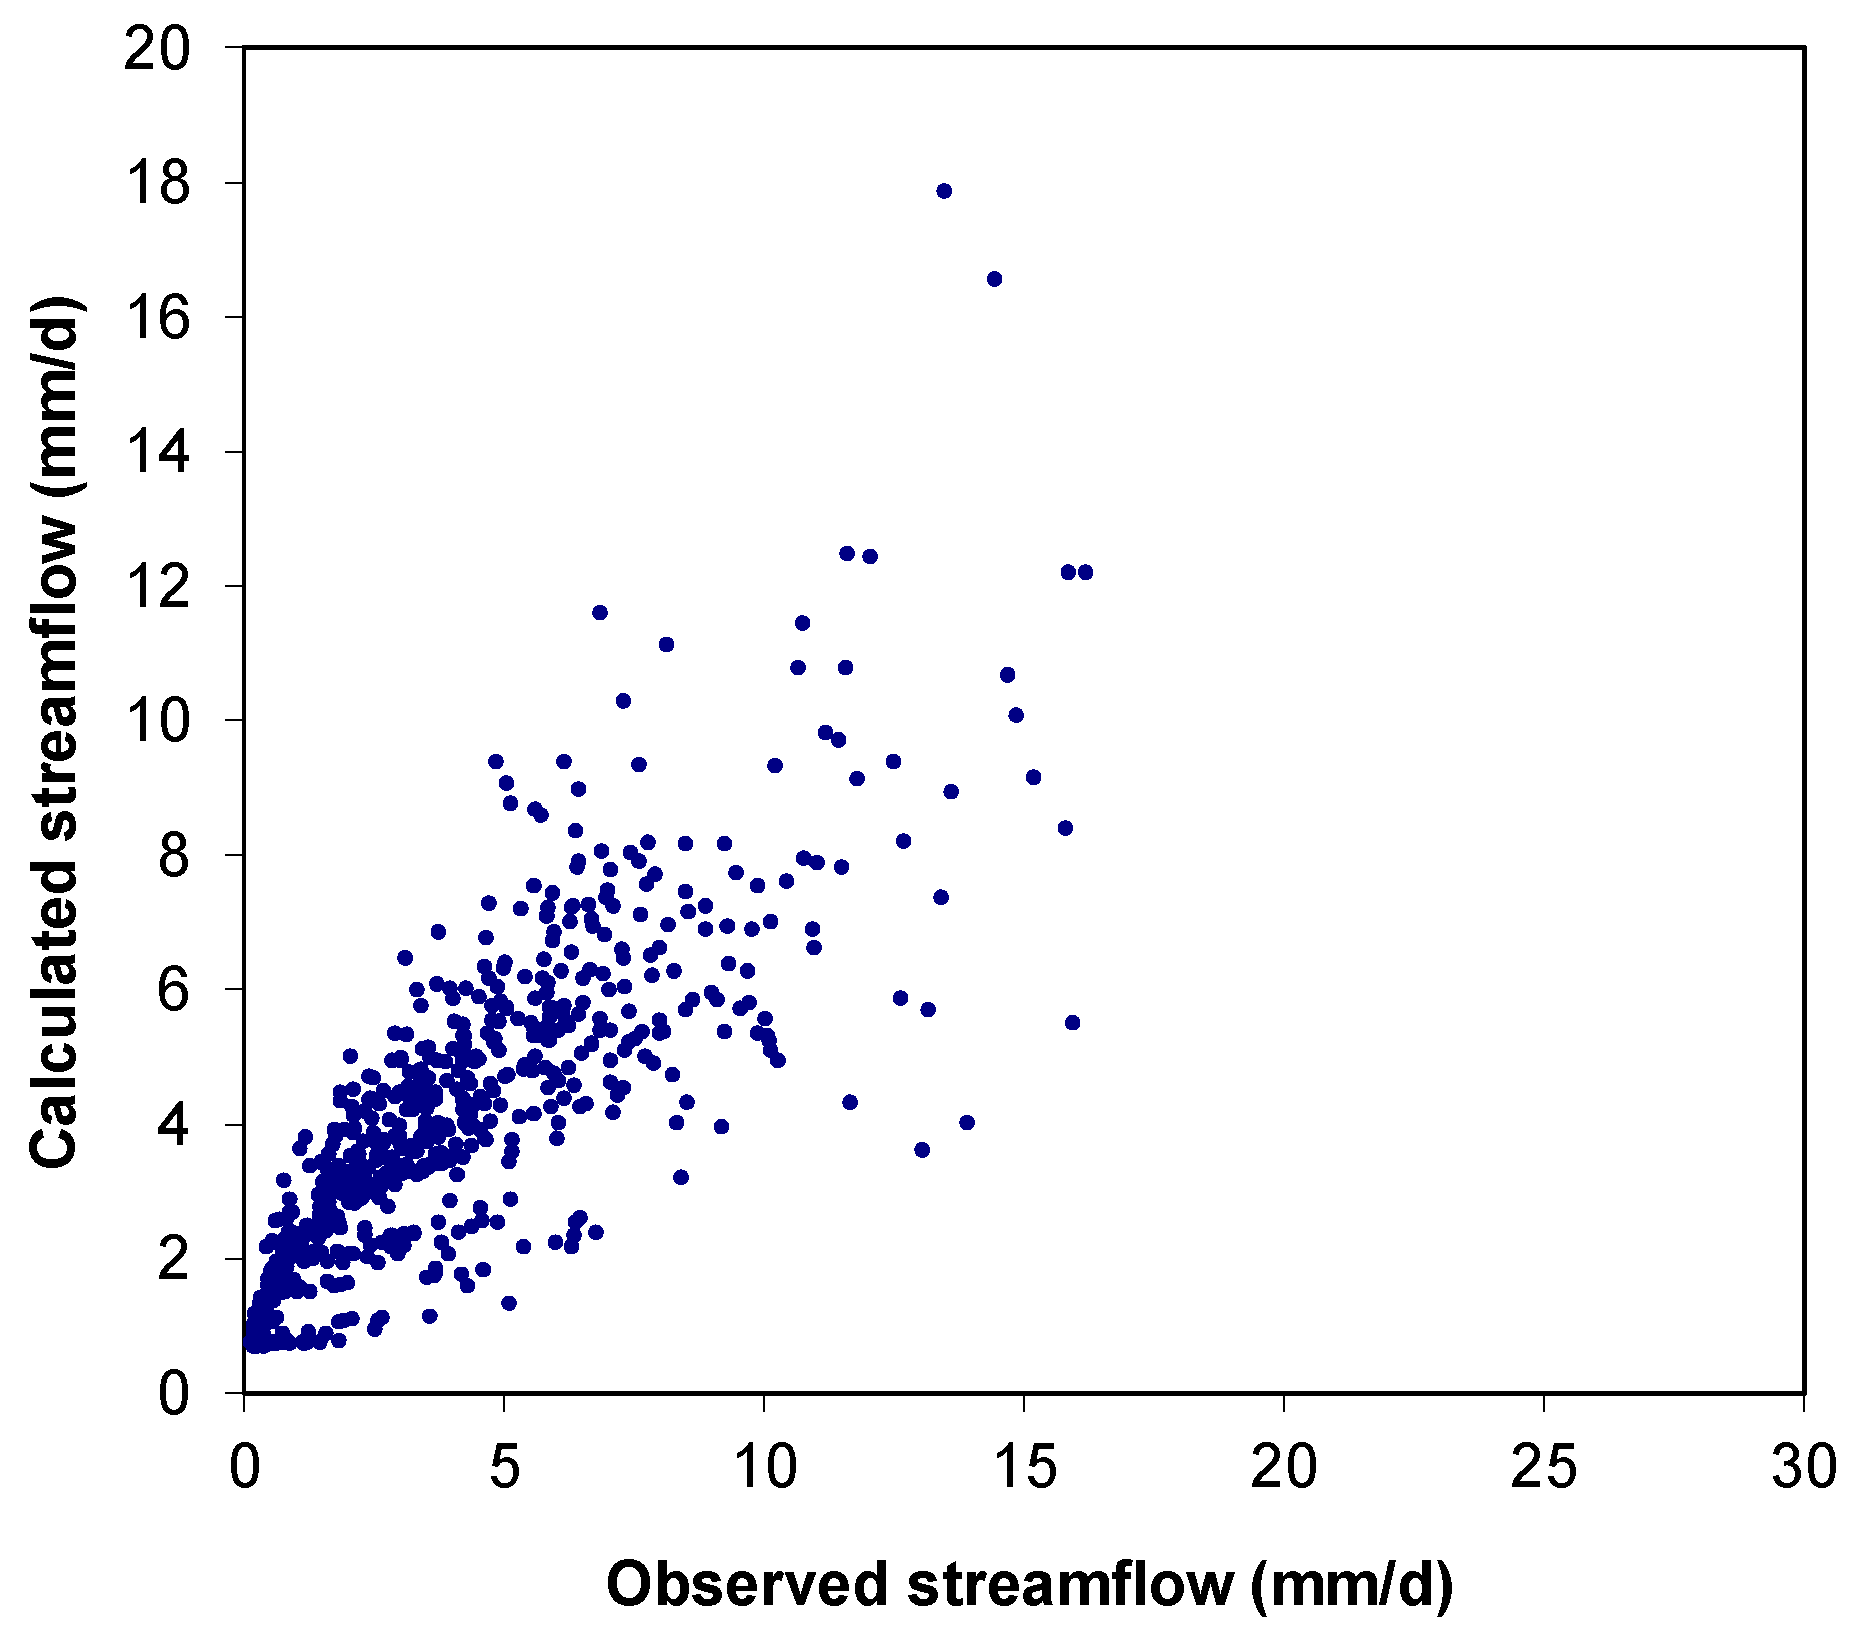
Figure 5.
Flow XY plot compares observed and calculated flows (2013–2017).
To find out that our GR4J model gets results in accordance with field conditions, the X4 parameter is compared with the average actual hydrograph value in each AWLR. In this study, no less than 100 real hydrographs were taken and analysed that met the requirements of one hydrograph cycle in terms of time and hydrograph form. Figure 6 is an example of the hydrograph in the Upper Citarum basin.
The figure below shows the Tp value from 100 hydrograph taken that can represent the actual Tp in AWLR Nanjung for the Upper Citarum Basin.
Figure 7.
Actual Tp in Upper Citarum basin (AWLR Nanjung).

From the image above, it can be seen the average value of Tp from 100 Hydrographs reviewed is 6.85. The normal distribution method is used to find out what percentage of Tp is outside the range of 5.85–7.85. The following is the normal distribution calculation to calculate the probability of the Tp value.
Average Tp (µ) = 6.85.
Deviation (σ) = 1.
The probability of Tp value below 5.85 is:
so P[x < 1] = P[Z < -1] from the normal distribution table we get z = 0.1587.
P[x < 5,85] = P[Z < Zi]
The probability of Tp below 5.85 is 15.87%.
The probability of Tp value above 7.85 is:
so P[x < 1] = P[Z < -1] from the normal distribution table we get z = 0.8413.
P[x > 7.85] = P[Z > Zi]
The probability of Tp above 7.85 is 100 – 84.13 = 15.87%. Figure 8 shows the normal distribution of a population of 100 Tp as below:
Following the normal distribution pattern, this result shows that the Tp value for the Upper Citarum watershed is between 5.85 and 7.85 hours with the probability is 68.26%. The Tp value representing the Upper Citarum basin is average value, which is 6.85. Table 4 last column shows the Tp values for other watershed in Java Island obtained by the same method.
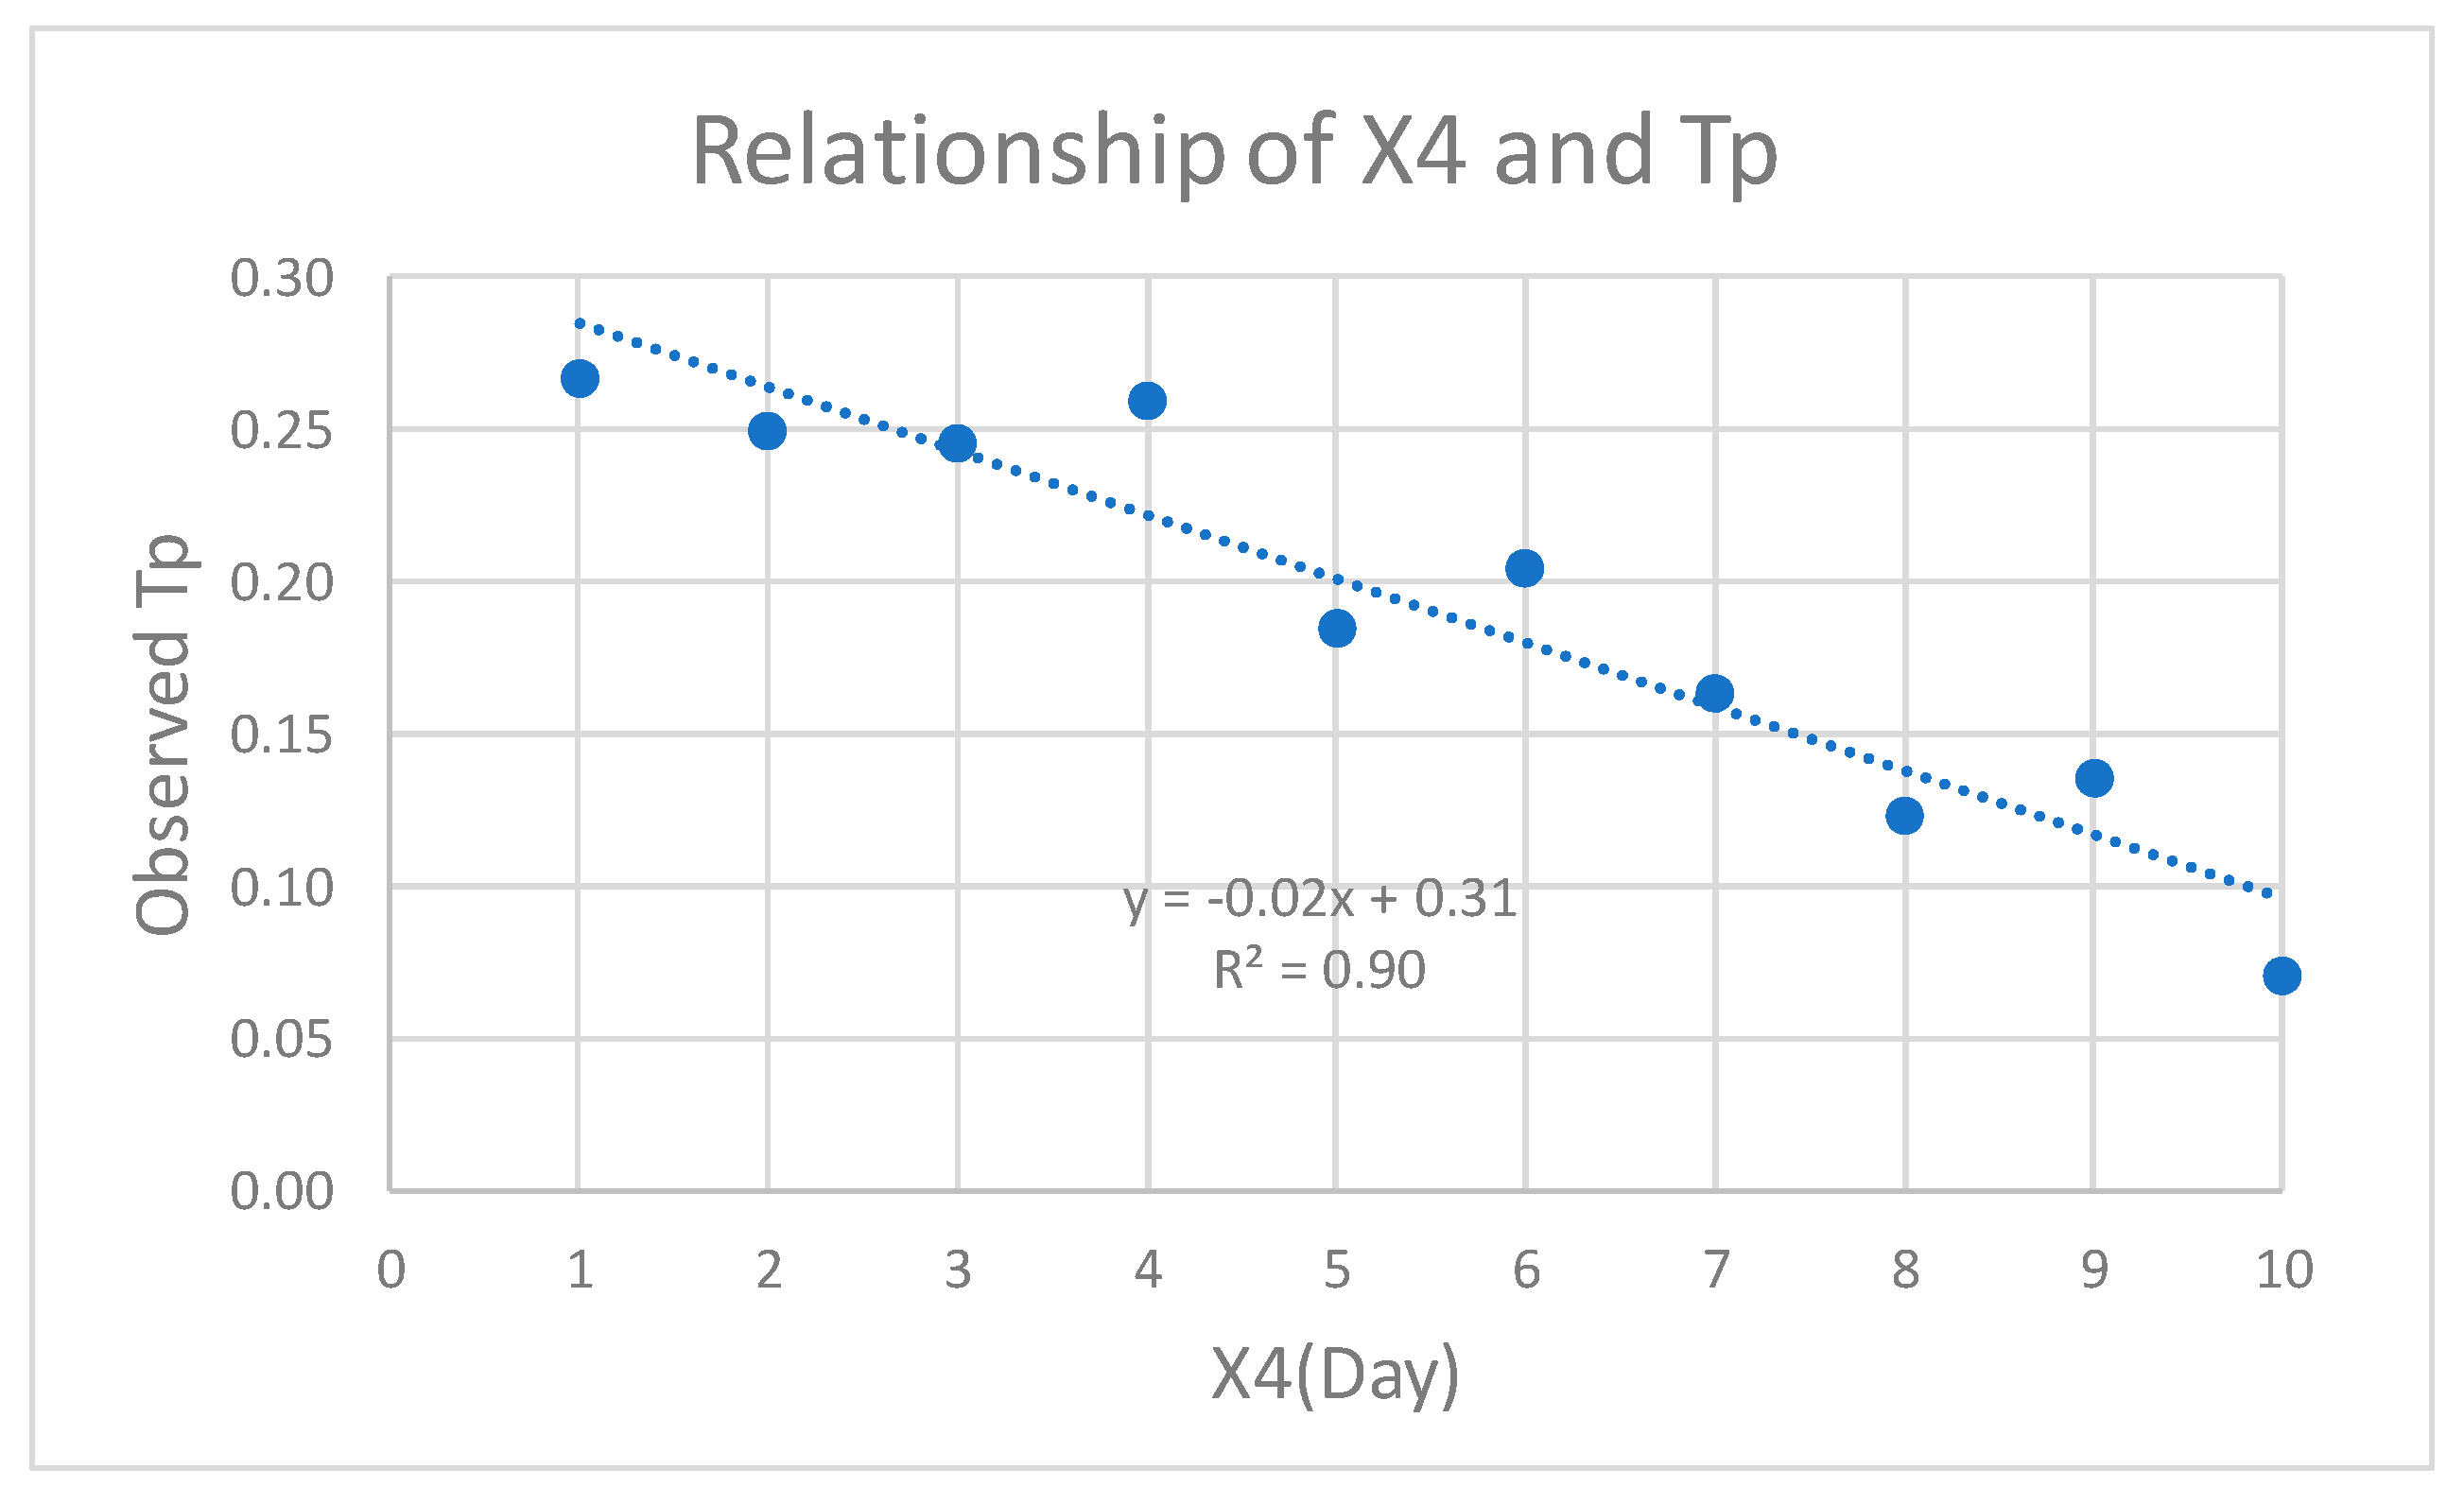
From the modelling results above, Tp modelling results is different from actual Tp that obtained from observed hydrographs. Figure 9 shows the relationship between X4 and the Tp observed.
An interesting relationship exists between the difference Tp from modelling results and Tp observed, namely y = –0.02x + 0.31. From this relationship, adjustments can be made to the general GR4J modelling equation for unit hydrograph.
Hydrograph unit adjustment procedure from GR4J modelling:
- X4 is obtained from the results of GR4J modelling.
- The relationship between X4 and the peak observation time is y = –0.02x + 0.31.
- To get UH from GR4J modelling (Perrin et al, 2023),
-
To get a suitable new UH (Munajat, 2024),To get the discharge at flood,To develop new UH,
Below is an example of adjusting the unit hydrograph from the GR4J modeling results into one that approaches the actual hydrograph form obtained from observed hydrographs.
Figure 10.
Modeled GR4J UH vs modified UH in Upper Citarum basin.
7. Conclusions and Suggestions
The conclusions that can be drawn from the research carried out are as follows:
- GR4J is a rainfall-runoff modelling that has been proven to have good results with four independent parameters. One of the resulting parameters is X4, namely the peak time flood.
- For the modelling case on the island of Java, the unit hydrograph result from the modelling does not match the Tp observed. The improvement is needed to make Tp modeled similar with Tp observed.
- There is a special relationship between the peak time from the Tp modelled and the Tp observed, namely y = –0.02x + 0.31, where the unit of Tp is days.
- Suggestions from this research:
- For more general results, research needs to be carried out more watersheds, and their locations can be outside Java Island to get different watershed characteristics. Due to the limited data obtained, this research only uses data from 10 watersheds on the island of Java.
- Research should be carried out in natural river watersheds so that the observation data matches the characteristics of actual river watersheds without taking or adding enormous amounts of water discharge.
Author Contributions
Conceptualization, Cecep M. Munajat, and Dhemi Harlan; methodology, Cecep M. Munajat; software, Cecep M. Munajat; validation, Cecep M. Munajat and Dhemi Harlan; formal analysis, Cecep M. Munajat; investigation, Cecep M. Munajat; resources, Cecep M. Munajat; data Cecep M. Munajat; writing—original draft preparation, Cecep M. Munajat; writing—review and editing, Cecep M. Munajat, Sri Legowo W. Darsono and Dhemi Harlan; visualization, Cecep M. Munajat; supervision, Sri Legowo W. Darsono; project administration, Cecep M. Munajat; funding acquisition, Cecep M. Munajat. All authors have read and agreed to the published version of the manuscript.
Funding
This research received no external funding.
Data Availability Statement
Further inquiries for data used in writing this paper can be directed to the corresponding author.
Acknowledgments
The authors would like to thank the support received from the Citarum River Basin Center and Pemali Juana River Basin Center for completing this study.
Conflicts of Interest
The authors declare no conflict of interest in writing this paper.
References
- Bedient, P. B. dan Huber, W. C. Hydrology and Floodplain Analysis; Oregon State University, USA, 1992.
- Booij, M.J. Impact of climate change on river flooding assessed with different spatial model resolutions. Journal of Hydrology 2005, Volume 303, Issues 1–4. [CrossRef]
- Chaudhry, M.H. Open-Channel Flow; Prentice-Hall, Englewood Cliffs, New Jersey, 1993.
- Chow, V. T., Maidment, D. R., Mays. Applied Hydrology; Mc Graw-Hill Book Company, International Edition, 1998.
- Das, Ghanshyam. Hydrology and Soil Conservations Engineering; Prentice Hall of India, 2002.
- Edijatno. GR3J: A daily watershed model with three free parameters. Journal of Hydrology 1999. [CrossRef]
- Indra, Miranda. Kajian Unit Hidrograf dan Unit Hidrograf Sintetik pada Daerah Aliran Sungai Citarum. Departemen Teknik Sipil, ITB, Bandung 2007.
- Munajat, C. M. The Improvement of Gr4j Modeling Parameter to Estimate Unit Hydrograph. https://hathi-pusat.org/ejournalv2/index.php/SI6/article/view/370 2020.
- Ossenbruggen, P. J. System Analysis for Civil Engineers; Jhon Willey & Sons, New York, 1984.
- Perrin, M., and Andre´assian. Improvement of a parsimonious model for streamflow simulation. Journal of Hydrology 2003. [CrossRef]
- Salas, J. D., Delleur, J. W., Yevjevich, V. and Lane, W. L. Applied Modelling of Hydrologic Time Series; Book Crafters Inc., Michigan, USA, 1980.
Figure 1.
This is a figure. Schemes follow the same formatting.
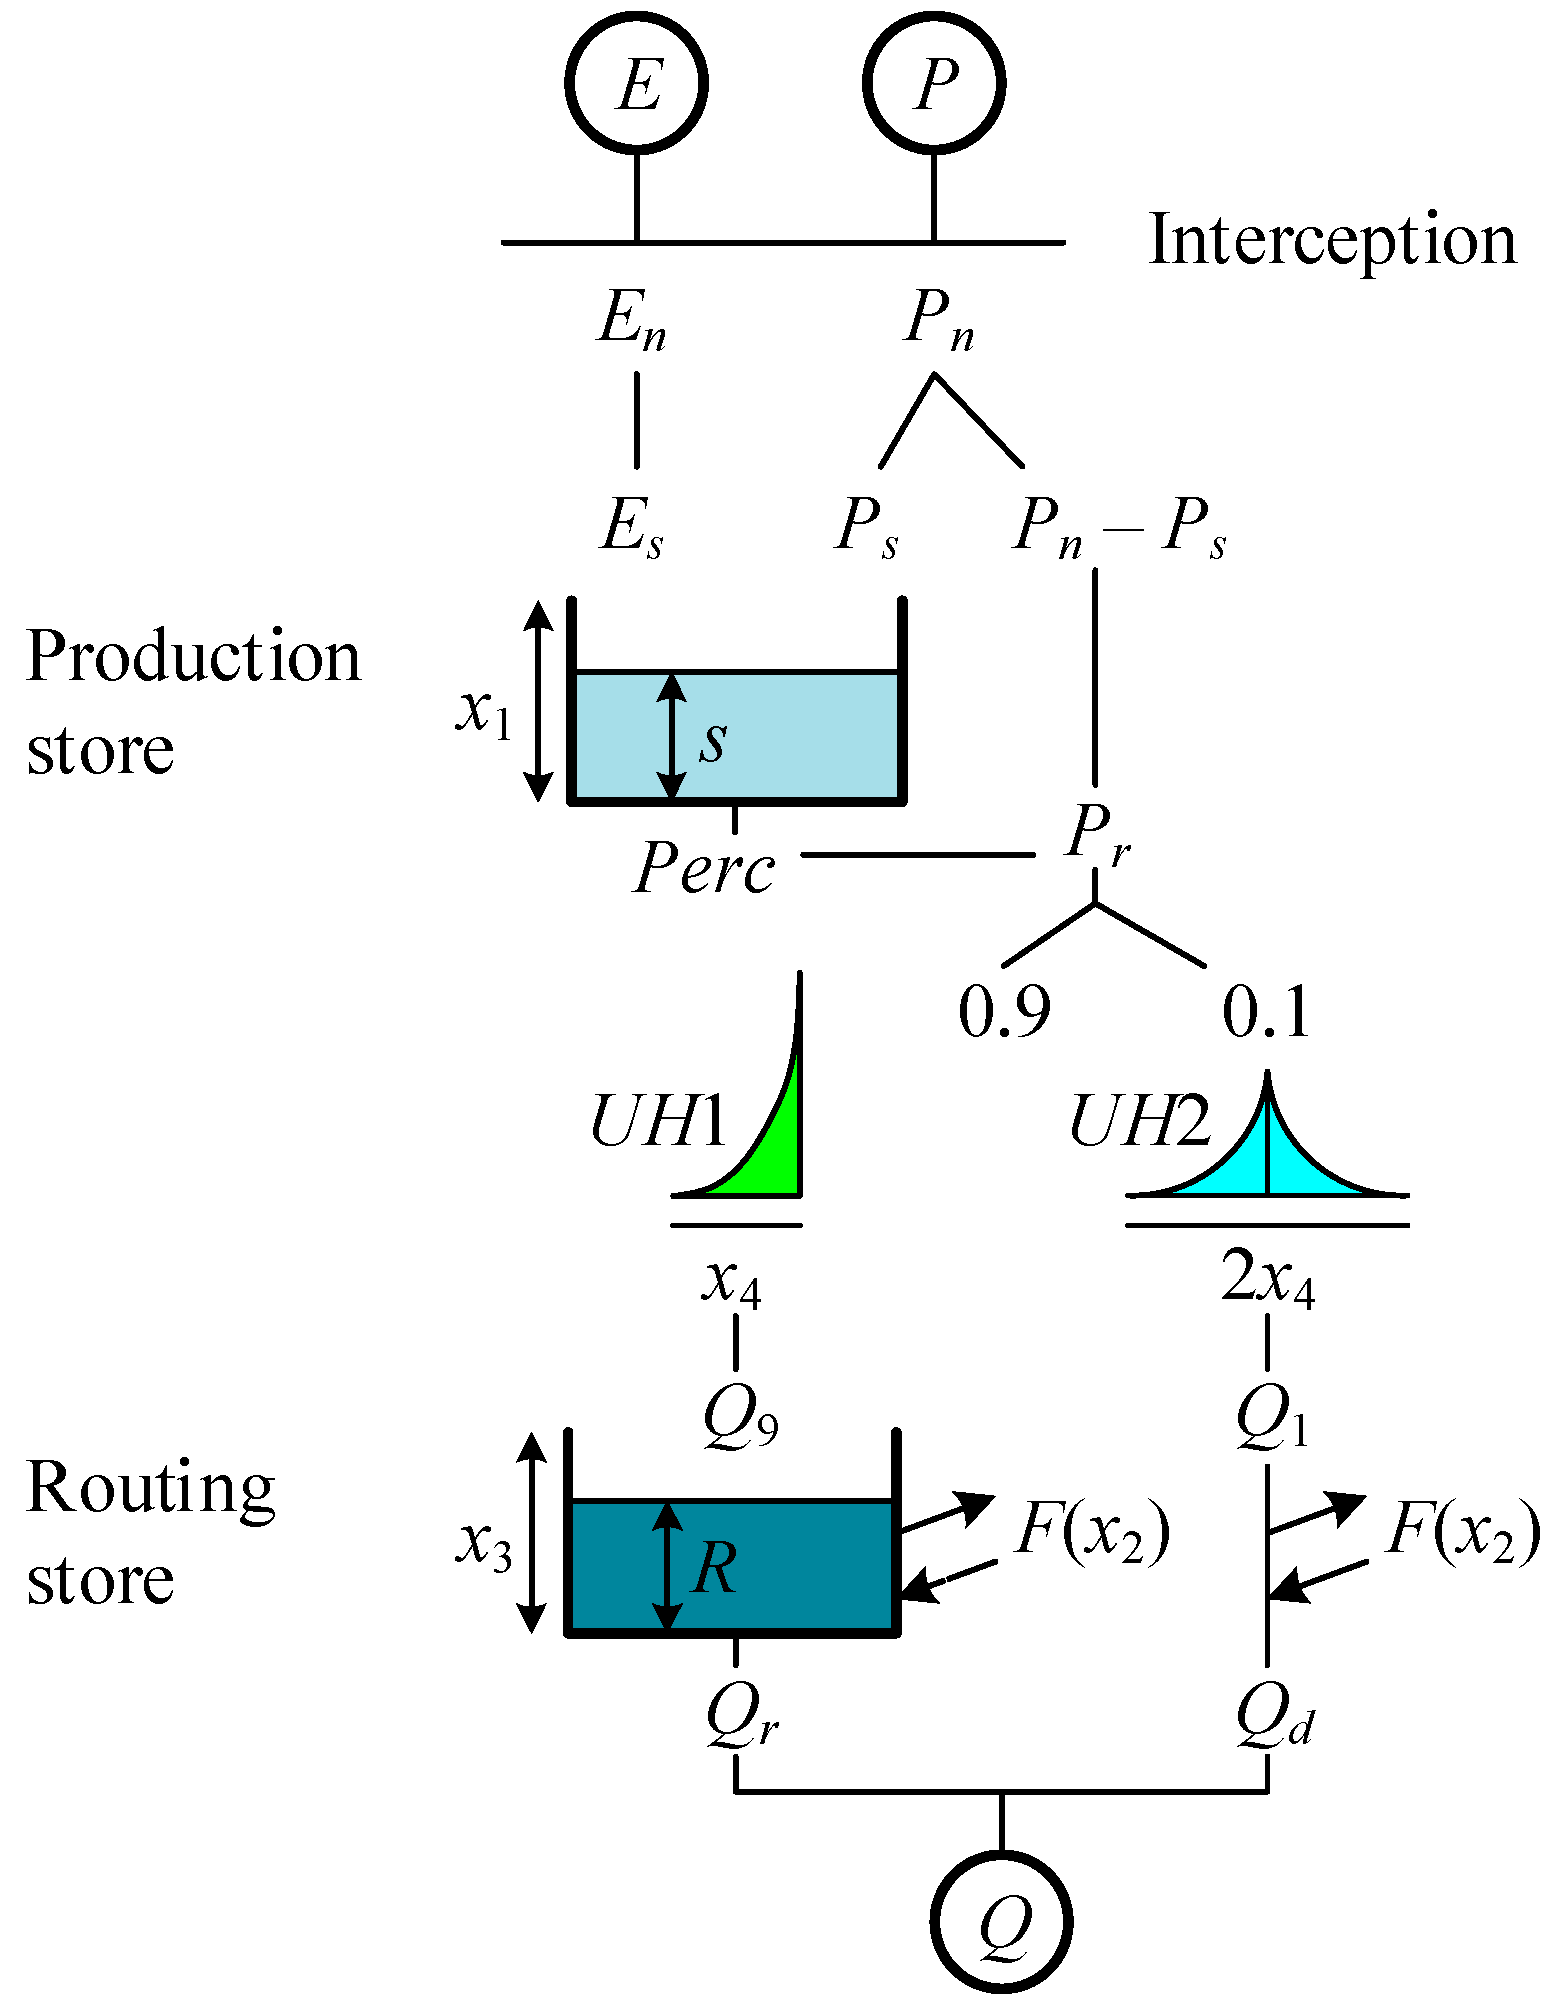
Figure 6.
Example of a hydrograph at AWLR Nanjung (April, 2017).
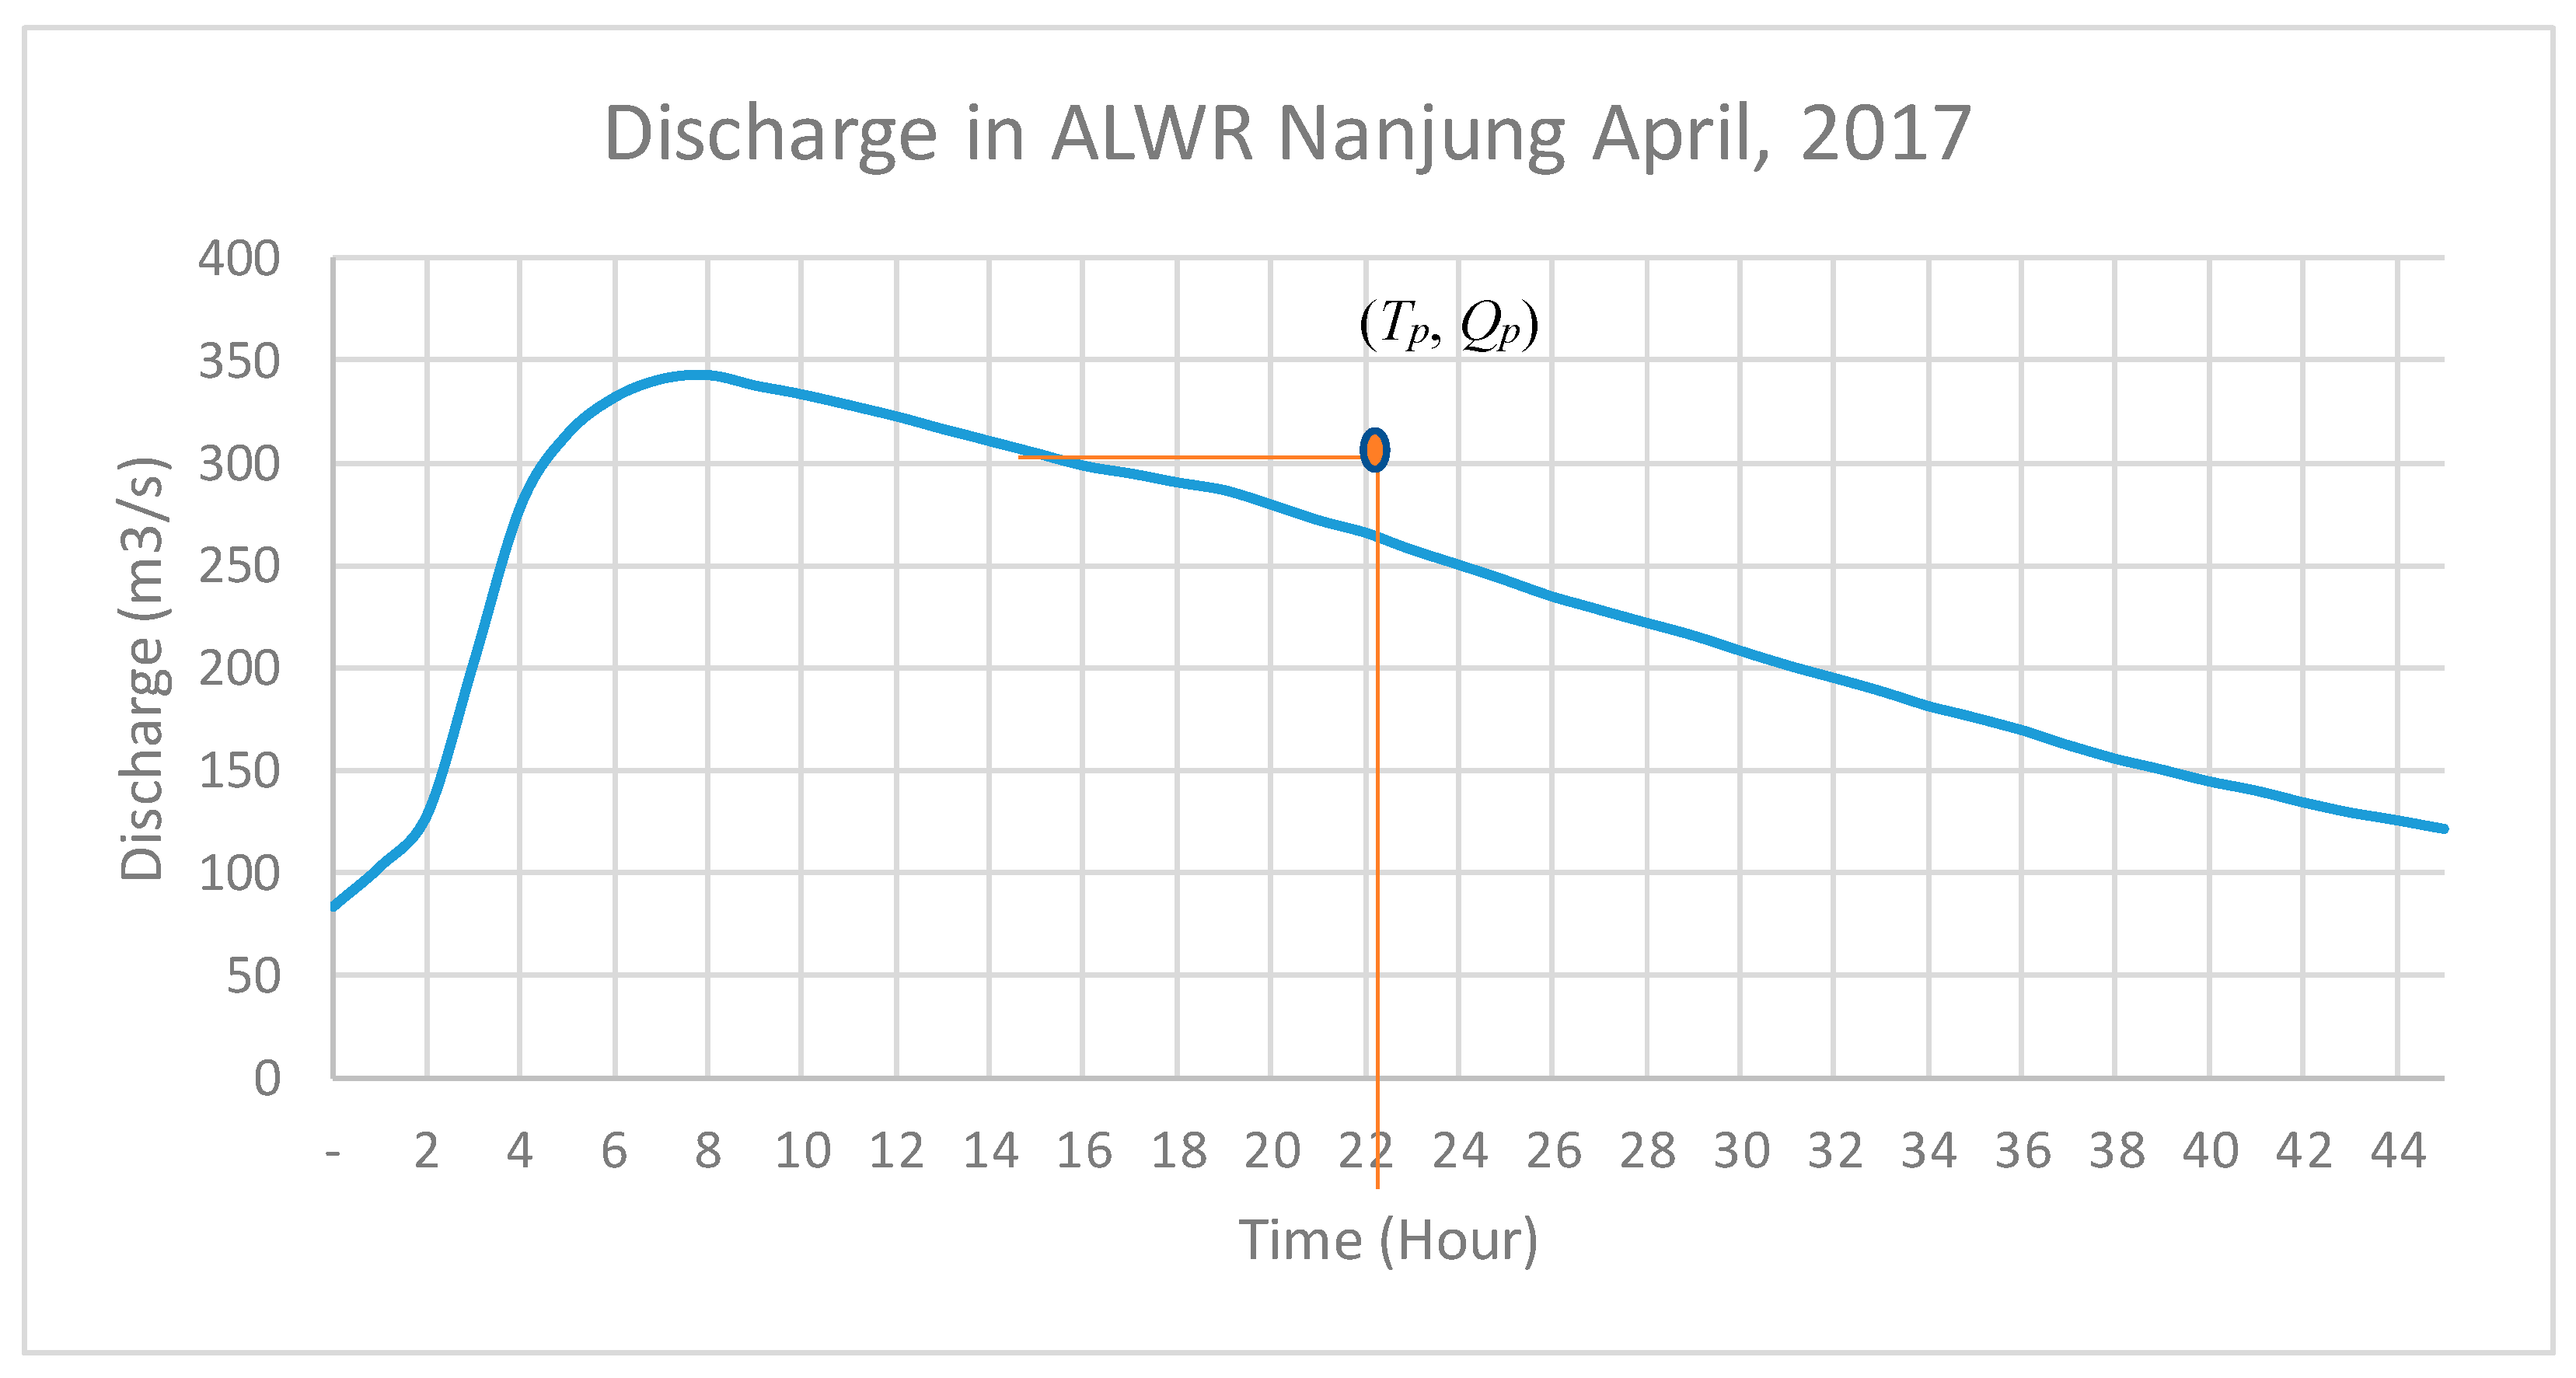
Figure 8.
Normal distribution for Tp in AWLR Nanjung, Upper Citarum watershed.
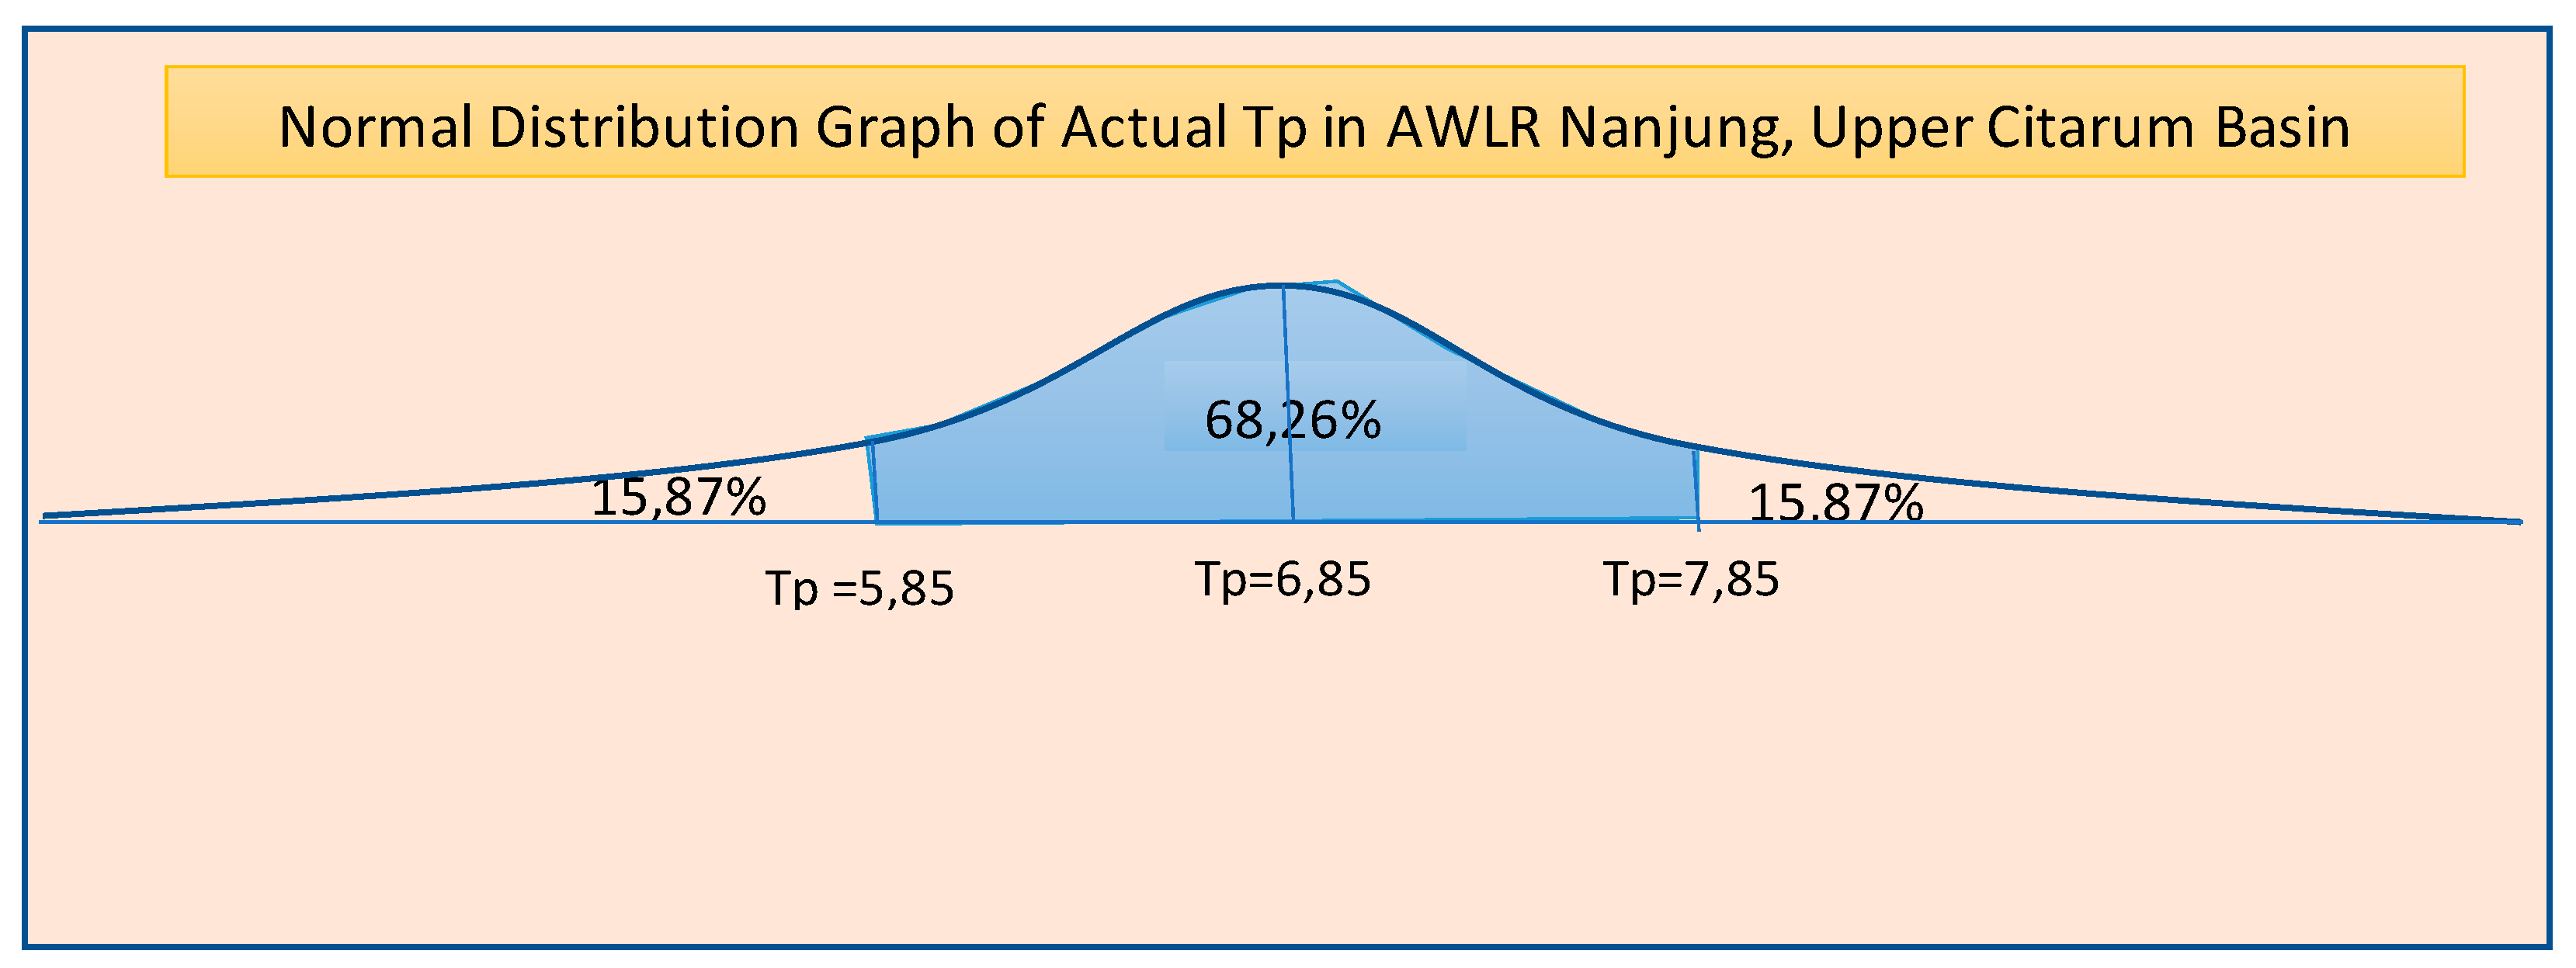
Figure 9.
Relationship between X4 and the average actual peak time.
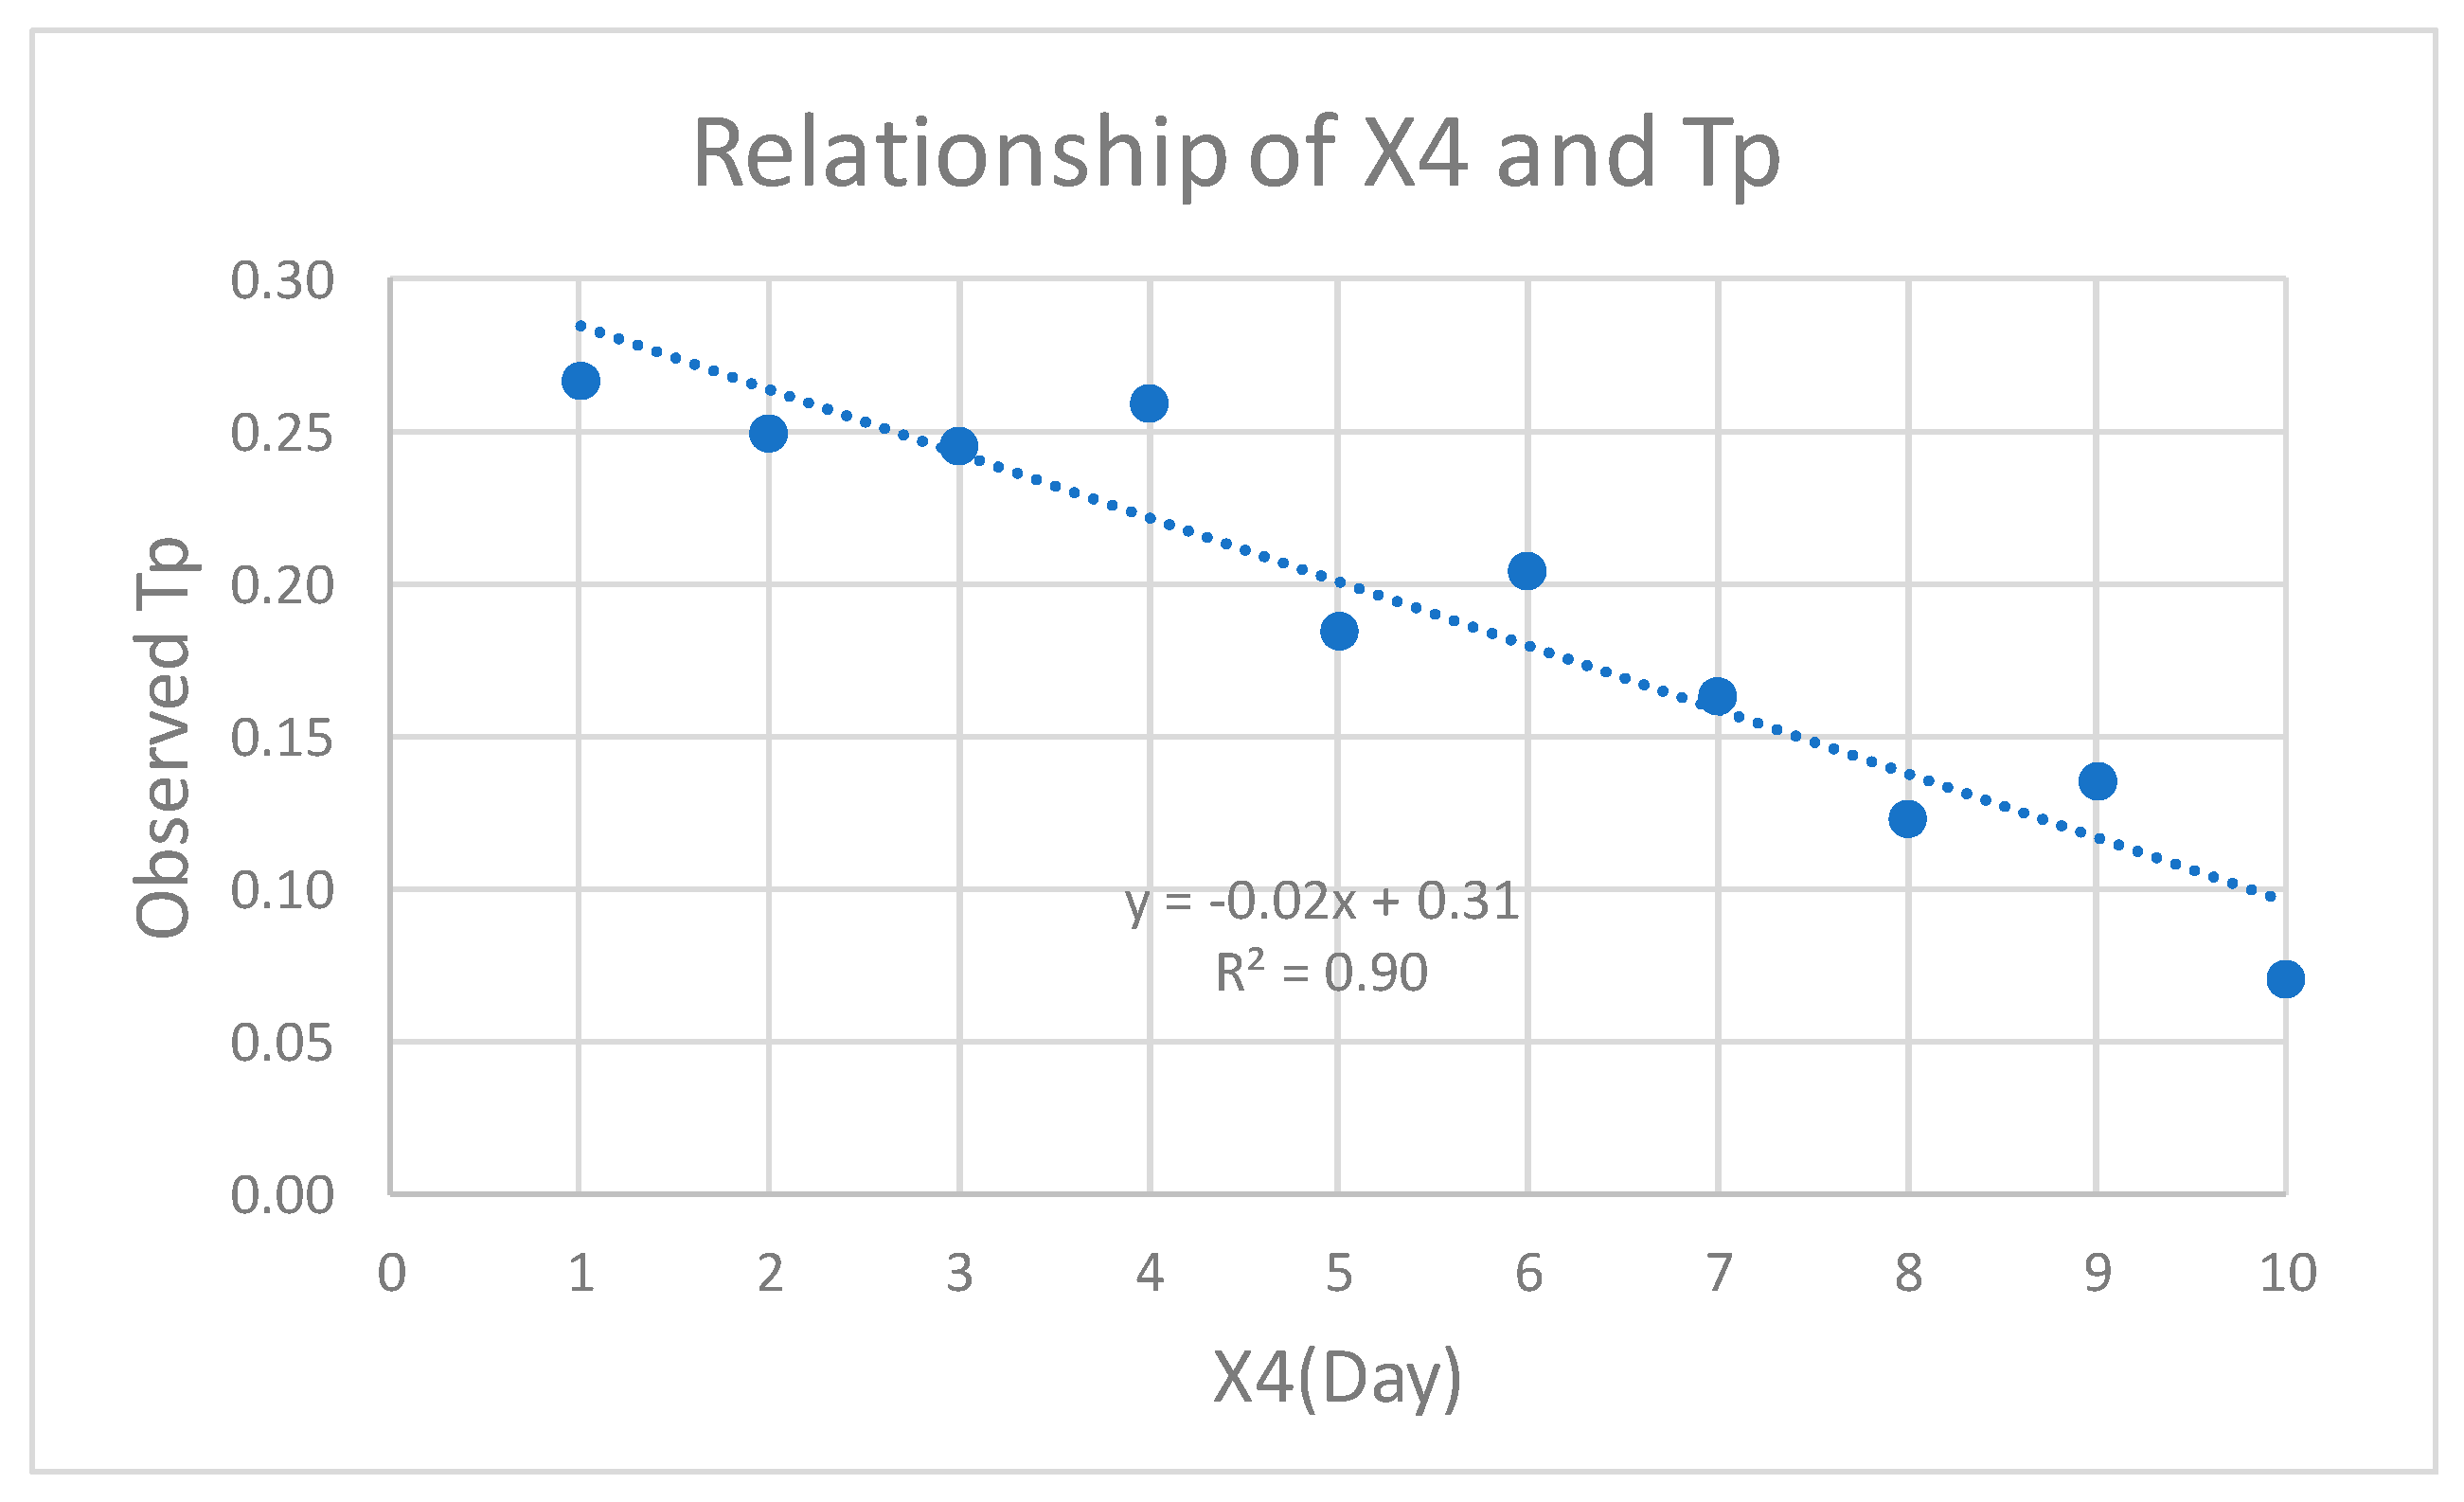
Table 2.
Value of median model parameters and approximate 80% confidence intervals.
| Median value | 80% Confidence interval | |
|---|---|---|
| x1 (mm) | 350 | 100 – 200 |
| x2 (mm) | 0 | -5 – 3 |
| x3 (mm) | 90 | 20 – 300 |
| x4 (day) | 1.7 | 1.1 – 2.9 |
Source: C. Perrin et.al. (2003).
Table 3.
Optimum values of GR4J parameters and their deviations.
| Coefficient | (2008 – 2012) | (2013 – 2017) | |||
|---|---|---|---|---|---|
| NS | RVE (%) | NS | RVE (%) | ||
| x1 | 462.76 | 0.82 | 0.07 | 0.65 | 32.38 |
| x2 | 3.34 | ||||
| x3 | 19.55 | ||||
| x4 | 1.23 | ||||
Table 4.
Modelling results for the watershed studied.
| No. | River Basin | Area (km²) |
NS | RVE | X1 (mm) | X2 (mm) | X3 (mm) | X4 (days) | Tp (hour) |
|---|---|---|---|---|---|---|---|---|---|
| 1 | Cibeka | 434.06 | 0.63 | 2.88E-06 | 2797.63 | 1.90 | 76.87 | 1.01 | 6.47 |
| 2 | Cukangleuleus | 552.85 | 0.64 | -4.60E-08 | 515.55 | 13.99 | 71.91 | 1.12 | 7.05 |
| 3 | Cimuntur | 621.00 | 0.71 | -9.14E-08 | 913.98 | 2.89 | 20.37 | 1.14 | 6.72 |
| 4 | Guwo | 241.96 | 0.47 | -1.44E-06 | 1652.43 | 2.04 | 10.35 | 1.09 | 3.54 |
| 5 | Girimargo | 104.61 | 0.39 | 1.19E-07 | 466.38 | 3.19 | 38.81 | 1.93 | 3.28 |
| 6 | Jengglong | 70.45 | 0.36 | -4.06E-08 | 1409.51 | 1.75 | 6.81 | 0.50 | 3.12 |
| 7 | Majalaya | 204.62 | 0.53 | -3.85E-07 | 1352.89 | 4.12 | 33.30 | 1.07 | 4.74 |
| 8 | Komplek Radio | 111.19 | 0.50 | 2.30E-08 | 35.63 | 33.69 | 86.14 | 0.99 | 4.86 |
| 9 | Dayeuh Kolot | 1350.14 | 0.73 | 5.99E-08 | 1339.43 | 3.78 | 14.46 | 1.27 | 4.98 |
| 10 | Nanjung | 1756.42 | 0.82 | -6.99E-02 | 462.76 | 3.34 | 19.55 | 1.23 | 6.73 |
Disclaimer/Publisher’s Note: The statements, opinions and data contained in all publications are solely those of the individual author(s) and contributor(s) and not of MDPI and/or the editor(s). MDPI and/or the editor(s) disclaim responsibility for any injury to people or property resulting from any ideas, methods, instructions or products referred to in the content. |
© 2024 by the authors. Licensee MDPI, Basel, Switzerland. This article is an open access article distributed under the terms and conditions of the Creative Commons Attribution (CC BY) license (http://creativecommons.org/licenses/by/4.0/).
Copyright: This open access article is published under a Creative Commons CC BY 4.0 license, which permit the free download, distribution, and reuse, provided that the author and preprint are cited in any reuse.


