
Submitted:
09 September 2024
Posted:
10 September 2024
You are already at the latest version
Abstract
This study employed the Allium cepa bioassay to evaluate the toxic effects of contaminants in the Yucatan aquifer. Seven monitoring wells were studied during September and October 2021. Nutrient concentrations showed significant variation between sites, with samples closer to the coast (P3 and P7) presenting higher ammonia and phosphate concentrations. The pesticides found at the highest concentration were δ-HCH and chlorpyrifos, with 141.44 and 175.92 ng/L, respectively. Heptachlor and aldrin were present in sites P4oct and P2sept. Interestingly, DDT values were highly correlated with caffeine concentrations. Acenaphthylene, acenaphthene, fluorene, phenanthrene, and the sum of B(k)fluoranthene and B(b)fluoranthene presented the highest prevalence. B(k)fluoranthene and B(b)fluoranthene were the PAHs found at the highest concentration. The results of the A. cepa bioassay indicated no nuclear abnormalities. The study also found no statistical differences in the mitotic index, root length, biomarkers of oxidative stress, and inhibition of B-esterases between sites and controls. In summary, the wells sampled in the present study had low concentrations of contaminants that can be used as a proxy of anthropogenic discharges; the lack of effect in the biomarkers used at organism, cellular, and biochemical levels indicated no toxic effect on A. cepa roots.
Keywords:
Allium cepa
; biomonitoring
; pesticides
; PAHs
; nutrients
; Mexico
; Yucatan
; groundwater
; water quality
1. Introduction
Yucatan lacks surface freshwater, so groundwater is the only source for human consumption. Karstification makes the aquifer highly permeable, making it especially vulnerable to contamination [1,2]. Groundwater must meet quality standards to be used as a source of human supply. In Mexico, drinking water regulations are stated in the NOM-127-SSA1-2021 [3], which contemplates the permitted water quality limits for human use and consumption. This NOM includes many physical, chemical, and bacteriological parameters but does not evaluate toxicity.
Studies in Yucatan report potentially toxic contaminants in groundwater, such as organochlorine pesticides and polycyclic aromatic hydrocarbons [4,5]. Specifically, studies on humans have correlated the presence of organochlorine pesticides with cancer [6].
The use of Allium cepa, the common onion, for environmental monitoring is currently used in various parts of the world, proving to be a good alternative for the early detection of pollutants with genotoxic and cytotoxic effects. Among the advantages over other genotoxicity tests, such as the Ames test, are its low cost, speed, and the fact that it does not require a complex infrastructure [7,8].
2. Materials and Methods
Seven deep wells were selected in Yucatan, Mexico (Figure 1). All the wells used in this study are part of the Coastal Aquifer Monitoring Network in the Northwest of the State of Yucatán (RNWY) established by UNAM Coastal Engineering and Processes Laboratory (LIPC) in conjunction with the National Coastal Resilience Laboratory (LANRESC). Sites are located in two transects to the coast; one transect runs from Sierra Papacal in Merida to Chuburná in Progreso municipality (sites P1-P3), and the other transect runs from Nohuaúun in Tetiz to Sisal in Hunucmá municipality (sites P4-P7). General information on the monitored wells is presented in Supplementary Table S1.
Water samples were collected in September and October 2021. Physicochemical parameters were analyzed in situ using a YSI Exo 1 multiparameter probe (temperature, dissolved oxygen, pH, total dissolved solids TDS, oxidation-reduction potential ORP, and conductivity) previously calibrated according to the manufacturer’s guidelines. Samples were collected 5 m below the water level. All samples were transported on ice to the Laboratory of Environmental Coastal Sciences at the Unit of Chemistry in Sisal, School of Chemistry, of the National Autonomous University of Mexico. They were refrigerated at 8°C until their analysis.
For the determination of organochlorine pesticides (OCP), polycyclic aromatic hydrocarbons (PAHs), and caffeine, one liter of water was collected in glass amber bottles (washed with phosphate-free laboratory detergent and rinsed with deionized water and acetone before use). Before the analysis, 0.5 g of ethylenediaminetetraacetic acid (EDTA) was added to each water sample. Then, a solid phase extraction (SPE) was performed using 500 mg/6 mL Strata-X 33 μm polymeric reversed phase cartridges (Phenomenex, 8B-S100-HCH), conditioned with solvents of increasing polarity: 10 mL of ethyl acetate, 10 mL of methanol, and 10 mL of distilled water. For extraction, 1 L of the sample was passed through the cartridge with a flow of 10-15 mL/min. After passing the sample, the cartridge was washed with 10 mL of distilled water and vacuum-dried for approximately 120 min. After the extraction, analytes were recovered by eluting with 15 mL of ethyl acetate, and extracts were evaporated under a gentle nitrogen stream. Samples were placed in 2 mL vials with a PTFE/silicone septum cap. Pollutants were identified and quantified by gas chromatography/mass spectrometry (GC-MS), using a gas chromatograph coupled to a mass selective detector operated in electron impact (EI) ionization mode and equipped with an automatic liquid sampler (Agilent Technologies 7890B Series GC; 5977B MSD and 7693A Autoinjector, respectively). Samples were injected in splitless mode and the injector was at 280°C. The GC was equipped with a J&W HP-5MS capillary column (30 m X 0.25 mm and 0.25 μm of film thickness) and the carrier gas was He (ultra-pure grade) with a flow rate of 0.8 mL/min. For pesticide and caffeine analysis, oven temperature was initially set at 50°C and increased 10°C/min until 180°C, then 1.5°C/min until 200°C (hold time 2 min) and finally 6°C/min until 290°C (hold time 1 min); for PAH determination, oven temperature was set at 60°C, then increased 6°C/min to 290°C (hold time 11.67 min). Transfer line temperature was 280°C. Mass spectra (m/z 50-550) were recorded at a rate of five scans per second at 70 eV. Mass spectrometric analysis was performed in the selected ion monitoring (SIM) mode of two characteristic fragment ions for each compound; Supplementary Tables S2 and S3 list retention times and the ions used for identification and quantification.
Nutrients (nitrate, nitrite, ammonium, silicates, and phosphate) were analyzed by spectrophotometry in microplates with methods previously described [9]; samples were collected in 35 mL amber glass bottles rinsed with deionized water and nitric acid. Simple Nutrients in Seawater-whole volume from Sigma-Aldrich (QC3179-500ML, Lot LRAA9336) was used as certified reference material to validate nutrient data.
For A. cepa bioassay, 1 liter of water was collected in amber glass bottles rinsed with deionized water and acetone. Root growth was initiated on 60 onions of similar sizes and no leaf growth. To do this, the lower brown part of the bulb was removed to expose the root primordium, and it was put in contact with distilled water for 48 hours until a root length of approximately 1 cm was observed. The best onions (5 per treatment) with similar growth were selected, and roots were measured before exposure to evaluate growth. Roots were exposed to the water samples for 72 h. After 24 hours, five root tips (approximately 5 mm long) were collected for microscopic study and preserved in 70% ethanol until analysis. After 72 hours of exposure, roots were measured to estimate growth and were cut and frozen at -80° until analysis of biomarkers of oxidative stress and B-esterase activities. Distilled water was used as a control [10,11].
For the analysis of biomarkers of oxidative stress and B-esterases (acetylcholinesterase and carboxylesterase), samples were homogenized with 0.05 M tris Buffer pH 7.4 at 100 mg wet weight/ml, using a Potter Elvehjem homogenizer with a PTFE pistil immersed in ice. Protein carbonylation (PO), lipid peroxidation (LPO), and total glutathione (GSH) are reported per mg of wet tissue and aliquoted after homogenization. The rest of the homogenate was centrifuged at 10,000 rpm for 5 minutes at 4° C (Eppendorf Centrifuge 5424 R, United States), and the supernatant was separated for analysis.
AChE activity was determined using a method adapted to a microplate [12,13]. The reaction started by adding acetylcholine iodide (1 mM) and was measured at an absorbance of 405 nm for 120 s for 2 min. CbE activity was determined by adding Tris Buffer 7.4/ƿNPA solution, which was measured at an absorbance of 405 nm every 15 s for 5 min [14]. CAT activity was determined using the molybdate method [15,16] by measuring the reduction rate of hydrogen peroxide at 405nm every 15 s for 10 min upon reaction with ammonium molybdate. GST levels were obtained based on the Sigma Aldrich Assay Kit CS04 using CDNB 100 mM as the substrate for spectrophotometric measurement at 340 nm every 15 s for 5 min [17]. SOD activity was determined by Sigma Aldrich Assay Kit 19160. Sigma Aldrich Glutathione Assay Kit CS0260 determined total GSH concentration. PO quantification was based on a previously described method [18]. LPO quantification was done using the FOX method with the Sigma Aldrich Peroxi Detect Kit. Proteins were analyzed in the supernatant following Bradford method [19] using bovine serum albumin (BSA) as a standard to standardize all enzyme activities in activity nmol/min/mg protein.
The data were analyzed using a multivariate approach. Permutational MANOVA (PERMANOVA) and Principal Coordinate Analysis (PCO) were performed using Primer v 7.0 + PERMANOVA add-on. Data were transformed using the function log10(x+1) and normalized. The resemblance was calculated using the Euclidean distance of samples [20]. PERMANOVA was done using the permutation of the raw data with 9999 permutations to generate pseudo-F [21].
3. Results and Discussion
Physicochemical parameters were measured in situ and are presented in Table 1. Unfortunately, the small diameter of the well on site P7 made it impossible to measure these parameters. Principal coordinate analysis of physicochemical variables was able to explain 84.19 % of the variability in the first two axes (Figure 2). Dissolved oxygen (DO), pH, and conductivity correlated with PCO1, and temperature and ORP correlated with PCO2. PERMANOVA indicated significant differences between sites (P=0.0005, Pseudo-F=8.90) but not between transects (P=0.17, Pseudo-F=1.804). Cluster analysis with the SIMPROF test indicated two groups, site P2 and the rest (Figure 3). NOM-127-SSA1-2021 includes the permitted values of pollutants in water for human use or consumption; the permissible value for pH ranges between 6.5 and 8.5; all the samples were between this limit. For total dissolved solids (TDS), the limit is 1000 mg/L. All the sites, except P2, were above this limit.
The summary of the nutrient analysis is presented in Table 2. PCO analysis explained 83.76% of the total variability in the first two axes (Figure 4). PCO1 correlated with the concentration of nitrate, ammonia, phosphate, and silicate, and PCO2 correlated with the concentration of nitrites. PERMANOVA indicated significant differences between sites (P=0.0007, Pseudo-F=14.57) but not between transects (P=0.2716, Pseudo-F=1.298). Cluster analysis formed three groups: P3, P7, and a third group with the rest of the sites. P3 and P7 are the closest to the coast, with the highest values of phosphates and ammonia (Figure 5). Nitrogen compounds are regulated by NOM-127-SSA1-2021, which includes the permitted values of pollutants in water for human use or consumption. The ammonium limit is 0.5 mg N-NH4/L; site P7 is above this limit. For nitrates and nitrites, the permitted limits are 11 mg N-NO2/L and 0.9 N-NO3 /L, respectively; all the samples were below these limits.
Measured concentrations of organochlorine pesticides, chlorpyrifos, and caffeine are presented in Table 3. PCO analysis explained 69.4% of the variation in the first two axes (Figure 6). PERMANOVA indicated no significant differences between sites (P=0.7902, PseudoF= 0.74519) or transects (P=0.1074, Pseudo-F= 1.94). α-HCH, γ-HCH, and DDT were the pesticides with the highest prevalence, with 85.71%, 64.29%, and 57.14%, respectively. The pesticides found at the highest concentration were δ-HCH and chlorpyrifos, with 141.44 and 175.92 ng/L, respectively. γ-HCH, heptachlor, aldrin, and DDT and its metabolites are regulated in NOM-127-SSA-2021, which includes the permitted values of pollutants in water for human use or consumption. In the present study, none of the sites had values above this threshold. Heptachlor and Aldrin were only present in sites P4oct and P2sept. Interestingly, DDT values are highly correlated with caffeine concentrations. This result may indicate that DDT is linked to domestic discharges.
α-HCH is one of the eight stereoisomers of hexachlorocyclohexane (HCH) and the one found in the highest proportion (53-70%) in what is known as technical HCH (mixture of isomers), in addition to β-HCH (3-14%), γ-HCH (11-18%) and δ-HCH (6-10%). δ-HCH is the only isomer with strong insecticidal properties, refined from technical HCH and known as Lindane. Lindane is an insecticide for fruits, vegetables, and forest crops. In the environment, it can be converted into α-HCH through photochemical processes. α-HCH and γ-HCH can be biologically transformed into β-HCH, which is the most persistent isomer and resistant to biodegradation compared to the others. This could explain why it was the third most abundant isomer [22]. The alpha/gamma HCH ratio can be used to identify the source of HCH in water. A ratio of 0.2-1 suggests an origin from lindane, and a range between 4-15 indicates the use of technical HCH [23]. The alpha/gamma ratio obtained for the analyzed wells was between 0.42-1.29, so its origin could be attributed to using Lindane.
Previous works measured DDT and lindane in water from 29 wells between Merida and Progreso in Yucatan (24). They reported values well above what was found in the present study; for example, α-HCH was found in a range of 20-830 ng/L, and β-HCH was found in a range of 30-13200 ng/L, both pesticides were present in higher concentrations in the “Nortes” season (from November to February) where some wells exceeded the established limits in NOM-127-SSA1-2021. DDT was found in 57.14% of the samples, and its metabolite p-p’DDD was only found in one sample. The highest concentration was found in site P3oct (86.57 ng/L). This result contrasts with what was reported [24], where 65% of the wells analyzed in the “Nortes” season were above the limit permitted by NOM-127-SSA1-2021, 1000 ng/L.
Chlorpyrifos was found in four samples, three of them in October, and was the pesticide found at the highest concentration (175.92 ng/L in site P3 in September). Chlorpyrifos is an organophosphate pesticide that controls mosquitoes, flies, and domestic pests (25). Chlorpyrifos was added to the NOM-124-SSA1-2021 with a permitted value of 30,000 ng/L. This threshold contrasts with the value allowed in the European Union of 100 ng/L.
The results of PAHs quantification are presented in Table 5. PCO analysis explained 53.9% of the variation in the first two axes (Figure 7). PCO1 is highly correlated with anthracene, fluoranthene, and benzo(a) pyrene, and PCO2 is highly correlated with naphthalene, acenaphthene, and benzo(a)anthracene. B(k)fluoranthene and B(b)fluoranthene could not be identified individually, so they were considered the sum for analysis. Acenaphthylene, acenaphthene, fluorene, phenanthrene, and the sum of B(k)fluoranthene and B(b)fluoranthene presented the highest prevalence. B(k)fluoranthene and B(b)fluoranthene were the PAHs found at the highest concentration. Benzo(b)fluoranthene is primarily found in gasoline exhaust, tobacco and cigarette smoke, coal tar, soot, amino acids, and fatty acid pyrolysis products. Benzo(k)fluoranthene is primarily found in gasoline exhaust, cigarette smoke, coal tar, coal and oil combustion emissions, lubricating oils, used motor oils, and crude oils. Both compounds are considered potential human carcinogens [26]. Previous works reported report benzo(k)fluoranthene as the PAH with the highest concentration in groundwater collected in shallow wells in the city of Mérida between October 2007 and March 2008, with an average concentration of 747.0 ng/L and a maximum of 5100.0 ng/L [27], values higher than those found in this research. The Mexican Official Norm NOM-127-SSA-2021 only includes benzo(a)pyrene, with a maximum permissible level of 700 ng/L value, a threshold well above the concentrations measured in this study. PERMANOVA indicated no significant differences between sites (P=0.1483, pseudo-F=1.2261), but results were significant between transects (P=0.0195, pseudo-F=1.89).
Nuclear abnormalities were not found in exposed onion roots at any sites or controls. The results of biomarkers are presented in Supplementary Table 4. PCO analysis of the tested biomarkers was able to explain 57.99% of the total variation in the first two axes (Figure 8). CbE, GST, and SOD correlated highly with PCO1. CAT and SOD are highly correlated with PCO2. PERMANOVA indicated no significant differences between sites and controls (P=0.7857, Pseudo-F=0.8373) or between transects (P=0.0831, Pseudo-F=1.76). Allium cepa test only incorporates the mitotic index, the nuclear abnormalities index, and the growth as toxicity biomarkers. Nevertheless, evaluating other biomarkers, traditionally measured in animal models, is possible since a perfect amount of root biomass is available at the end of the bioassay. Changes in the biomarkers of oxidative stress and inhibition of B-esterases are used to assess exposure and the effects of contaminants in water. The samples presented low concentrations of nutrients, organochlorine pesticides, and PAHs in the present study. Some of these contaminants are reported as cytotoxic and genotoxic.

Table 3.
PAHs in wells of Yucatan, México in September and October 2021. Values expressed in ng/L. ND: Not detected.
Table 3.
PAHs in wells of Yucatan, México in September and October 2021. Values expressed in ng/L. ND: Not detected.
| PAH | Month | Site | ||||||
| P1 | P2 | P3 | P4 | P5 | P6 | P7 | ||
| Naphtalene | Sep | ND | ND | ND | ND | 2.63 | ND | ND |
| Oct | ND | ND | ND | ND | ND | ND | 1.59 | |
| Acenaphtylene | Sep | ND | ND | ND | ND | ND | ND | ND |
| Oct | ND | ND | ND | 2.28 | 3.51 | 2.86 | 7.46 | |
| Acenaphtene | Sep | ND | ND | ND | ND | ND | ND | ND |
| Oct | ND | ND | ND | ND | ND | ND | ND | |
| Fluorene | Sep | ND | ND | ND | ND | ND | ND | ND |
| Oct | ND | ND | ND | ND | ND | ND | ND | |
| Phenanthrene | Sep | ND | ND | ND | ND | ND | ND | ND |
| Oct | ND | ND | ND | ND | ND | ND | ND | |
| Anthracene | Sep | ND | ND | ND | ND | ND | ND | ND |
| Oct | ND | ND | ND | ND | ND | ND | ND | |
| Fluoranthene | Sep | ND | ND | ND | ND | ND | ND | ND |
| Oct | ND | ND | ND | ND | ND | ND | ND | |
| Pyrene | Sep | ND | ND | ND | ND | ND | ND | ND |
| Oct | ND | ND | ND | ND | ND | ND | ND | |
| Benzo(a)anthracene | Sep | ND | ND | ND | ND | ND | ND | ND |
| Oct | ND | ND | ND | ND | ND | ND | ND | |
| Benzo(b)Fluoranthene + Benzo(k)Fluoranthene | Sep | 10.93 | 10.63 | 12.07 | ND | 10.48 | 9.40 | 11.56 |
| Oct | 14.26 | 9.08 | 12.51 | 9.60 | 9.60 | 7.63 | 8.39 | |
| Benzo(a)pyrene | Sep | ND | 2.88 | ND | ND | ND | ND | ND |
| Oct | ND | ND | ND | ND | ND | ND | ND | |
The studies in which A. cepa has been used to evaluate water quality are primarily from sites with high pollution, such as industrial effluents, water from household waste, and agriculture. Generally, water comes from surface sources such as rivers or lakes [7,8,28]. Thus, the contaminants are not attenuated by groundwater filtration, so the contaminants are likely in sufficient concentration to cause damage to cells. Other studies use A. cepa to evaluate the genotoxic and cytotoxic effects of specific contaminants at known concentrations rather than evaluating a sample of ambient water. Most of these studies assess concentrations, in general, much higher than those environmentally found in the present study. For example, previous works evaluated the effect of the pesticide etoxazole. They found a dose-dependent decrease in growth and an increase in mitotic index, nuclear aberration index, CAT, SOD, and MDA (malondialdehyde, a subproduct of lipid peroxidation) [29]. A meta-analytical review of the Allium cepa test and pesticides showed that the number of micronuclei is higher in organisms exposed to pesticides than in controls and that pesticides reduce the mitotic index [30]. Other authors evaluated benzo(a) anthracene and benzo(a)pyrene at 1.5 µg/L, finding significant inhibition in root development [31].
The results of the A. cepa bioassay in the present study indicated no nuclear abnormalities. Mitotic index, root length, biomarkers of oxidative stress, and inhibition of B-esterases indicated no statistical differences between sites and controls.
In summary, the wells sampled in the present study had low concentrations of contaminants that can be used as a proxy of anthropogenic discharges; the lack of effect in the biomarkers used at organism, cellular, and biochemical levels indicated no toxic effect on A. cepa roots.
Supplementary Materials
The following supporting information can be downloaded at: www.mdpi.com/xxx/s1, Table S1 General information of the monitored wells, Table S2 SIM ions (m/z) of target compounds for OCP analysis. Table S3 SIM ions (m/z) of target compounds for PAH analysis. Analysis Table S4 Mean of biomarkers in Allium cepa roots exposed to water from ells of Yucatan, Mexico in September and October 2021. .
Author Contributions
Conceptualization, Elsa Noreña-Barroso and Gabriela Rodríguez-Fuentes; Data curation, Gabriela Rodríguez-Fuentes; Formal analysis, Loremy Cauich-Suárez, Victor Sánchez-Sánchez, Gissela Moreno-Ortiz, Elsa Noreña-Barroso and Gabriela Rodríguez-Fuentes; Methodology, Loremy Cauich-Suárez, Gissela Moreno-Ortiz, Elsa Noreña-Barroso and Gabriela Rodríguez-Fuentes; Validation, Loremy Cauich-Suárez, Victor Sánchez-Sánchez and Elsa Noreña-Barroso; Writing – original draft, Loremy Cauich-Suárez, Elsa Noreña-Barroso and Gabriela Rodríguez-Fuentes; Writing – review & editing, Loremy Cauich-Suárez, Gissela Moreno-Ortiz, Elsa Noreña-Barroso and Gabriela Rodríguez-Fuentes.
Funding
This study was partially financed by Posgrado en Ciencias del Mar y Limnología at Universidad Nacional Autónoma de México (UNAM) and Consejo Nacional de Humanidades Ciencia y Tecnología (CONAHCyT) with the scholarships granted to LCS and GMO. This project was financed by grants UNAM-DGAPA-PAPIIT IN203321 and UNAM-FQ-PAIP given to GRF and ENB.
Acknowledgments
We thank Erick Antonio Osorio Mendoza for his help with the site map.
Conflicts of Interest
The authors declare that the research was conducted without any commercial or financial relationships that could be construed as potential conflicts of interest.
References
- Durán, R.; Méndez, M. Biodiversidad y desarrollo humano en Yucatán. México: CICY, PDD-FMAN, CONABIO, SEDUMA; 2010. p. 12-13.
- Salik, M. Aquifers: matrix and fluids. IntechOpen; 2018. p. 11-14.
- Secretaría de Salud, 2021. Norma Ofical Mexicana NOM-127-SSA1-2021 Agua para uso y consumo humano. Límites permisibles de la calidad del agua https://sidof.segob.gob.mx/notas/docFuente/5650705.
- Polanco Rodríguez, A. G., Alberto, J. A. N., Sánchez, J. S., Rejón, G. J. M., Gómez, J. M., & Del Valls Casillas, T. A. (2015). Contamination by organochlorine pesticides in the aquifer of the Ring of Cenotes in Yucatán, México. Water and Environment Journal, 29(1), 140–150. [CrossRef]
- López-Macias, R., Cobos-Gasca, V., Cabañas-Vargas, D., Rendón von Osten, J. (2019). Presence and Spatial Distribution of Polynuclear Aromatic Hydrocarbons (PAHs) in Groundwater of Merida City, Yucatan, Mexico. Bulletin of Environmental Contamination and Toxicology 102: 538-543. [CrossRef]
- Polanco Rodríguez, Á. G., Riba López, M. I., DelValls Casillas, T. Á., Araujo León, J. A., Mahjoub, O., & Prusty, A. K. (2017). Monitoring of organochlorine pesticides in blood of women with uterine cervix cancer. Environmental Pollution, 220, 853–862. [CrossRef]
- Ramos, L. P. N., Leite, D. M., Macedo, W. D. A., Farias, C. B. M., Oliveira, A. S. de, Dahmer, N., & Karsburg, I. V. (2020). Evaluation of the cytotoxic and genotoxic effect of Allium cepa L. (Amaryllidaceae) root cells after exposure in water samples of five lakes of Alta Floresta, State of Mato Grosso. Ambiente e Agua - An Interdisciplinary Journal of Applied Science, 15(1), 1. [CrossRef]
- Dimuthu Nilmini Wijeyaratne, W. M., & Wadasinghe, L. G. Y. J. G. (2019). Allium cepa Bio Assay to Assess the Water and Sediment Cytogenotoxicity in a Tropical Stream Subjected to Multiple Point and Nonpoint Source Pollutants. Journal of Toxicology, 2019. [CrossRef]
- Ringuet, S., Sassano, L., & Johnson, Z. I. (2011). A suite of microplate reader-based colorimetric methods to quantify ammonium, nitrate, orthophosphate and silicate concentrations for aquatic nutrient monitoring. Journal of Environmental Monitoring, 13(2), 370–376. [CrossRef]
- Fiskesjo, G. (1985). The Allium test as a standard in environmental monitoring. Hereditas, 102(1), 99–112. [CrossRef]
- Radić, S., Stipaničev, D., Vujčić, V., Rajčić, M. M., Širac, S., & Pevalek-Kozlina, B. (2010). The evaluation of surface and wastewater genotoxicity using the Allium cepa test. Science of the Total Environment, 408(5), 1228–1233. [CrossRef]
- Ellman, G. L., Courtney, K. D., Andres, V., & Featherstone, R. M. (1961). A new and rapid colorimetric determination of acetylcholinesterase activity. Biochemical Pharmacology, 7(2). [CrossRef]
- Rodríguez-Fuentes, G., Armstrong, J., & Schlenk, D. (2008). Characterization of muscle cholinesterases from two demersal flatfish collected near a municipal wastewater outfall in Southern California. Ecotoxicology and Environmental Safety, 69(3), 466–471. [CrossRef]
- Hosokawa, M., & Satoh, T. (2001). Measurement of Carboxylesterase ( CES ) Activities. Current Protocols in Toxicology, 10(1). [CrossRef]
- Góth, L. (1991). A simple method for determination of serum catalase activity and revision of reference range. Clinica Chimica Acta, 196(2–3), 143–151. [CrossRef]
- Hadwan, M. H., & Abed, H. N. (2016). Data supporting the spectrophotometric method for the estimation of catalase activity. Data in Brief, 6, 194–199. [CrossRef]
- Habig, W. H., & Jakoby, W. B. (1981). [27] Glutathione S-transferases (rat and human) (pp. 218–231). [CrossRef]
- Mesquita, C. S., Oliveira, R., Bento, F., Geraldo, D., Rodrigues, J. V., & Marcos, J. C. (2014a). Simplified 2,4-dinitrophenylhydrazine spectrophotometric assay for quantification of carbonyls in oxidized proteins. Analytical Biochemistry, 458, 69–71. [CrossRef]
- Bradford, M. (1976). A Rapid and Sensitive Method for the Quantitation of Microgram Quantities of Protein Utilizing the Principle of Protein-Dye Binding. Analytical Biochemistry, 72(1–2). [CrossRef]
- Legendre, P. (2019). Numerical Ecology. In Encyclopedia of Ecology (pp. 487–493). Elsevier. [CrossRef]
- Anderson, M. J. (2008). A new method for non-parametric multivariate analysis of variance. Austral Ecology, 26(1). [CrossRef]
- Zhang, Z. L., Hong, H. S., Zhou, J. L., Huang, J., & Yu, G. (2003). Fate and assessment of persistent organic pollutants in water and sediment from Minjiang River Estuary, Southeast China. Chemosphere, 52(9), 1423–1430. [CrossRef]
- Maldonado, C., & Bayona, J. M. (2002). Organochlorine compounds in the north-western Black Sea water: Distribution and water column process. Estuarine, Coastal and Shelf Science, 54(3), 527–540. [CrossRef]
- Giácoman-Vallejos, G., Lizarraga-Castro, I., Ponce-Caballero, C., González-Sánchez, A., & Hernández-Núñez, E. (2018). Presence of DDT and Lindane in a Karstic Groundwater Aquifer in Yucatan, Mexico. Groundwater Monitoring and Remediation, 38(2), 68–78. [CrossRef]
- WHO, Guidelies for drinking-water quality: fouth edition incorporating the first addendum. 2017. p. 310, 313, 339, 398.
- PubChem 2023 update. Nucleic Acids Res., 51(D1) , D1373-D1380. [CrossRef]
- López-Macias, R., Cobos-Gasca, V., Cabañas-Vargas, D., Rendón von Osten, J. (2019). Presence and Spacial Distribution of Polynueclear Aromatic Hydrocarbons (PAHs) in Groundwater of Merida City, Yucatan, Mexico. Bulletin of Environmental Contamination and Toxicology 102: 538-543. [CrossRef]
- Nam, T. H., Jeon, H. J., Mo, H. ho, Cho, K., Ok, Y. S., & Lee, S. E. (2015). Determination of biomarkers for polycyclic aromatic hydrocarbons (PAHs) toxicity to earthworm (Eisenia fetida). Environmental Geochemistry and Health, 37(6). [CrossRef]
- Macar, O., Kalefetoğlu Macar, T., Yalçın, E., & Çavuşoğlu, K. (2022). Acute multiple toxic effects of Trifloxystrobin fungicide on Allium cepa L. Scientific Reports, 12(1). [CrossRef]
- Fernandes, T., Mota, M., Sampaio, A. R., Vasconcelos, M. W., De, N., & Ghisi, C. (2022). Allium cepa test vs. insecticides: A scientometric and meta-analytical review. [CrossRef]
- Geremias, R., de Fávere, V. T., Pedrosa, R. C., & Fattorini, D. (2011). Bioaccumulation and adverse effects of trace metals and polycyclic aromatic hydrocarbons in the common onion Allium cepa as a model in ecotoxicological bioassays. Chemistry and Ecology, 27(6), 515–522. [CrossRef]
Figure 1.
Study area. Wells located in two transects from inland to the coast were used. One transect runs from Sierra Papacal in Mérida municipality to Chuburná in Progreso, and the other transect is from Nohuayún in Tetiz municipality to Sisal in Hunucmá. .
Figure 1.
Study area. Wells located in two transects from inland to the coast were used. One transect runs from Sierra Papacal in Mérida municipality to Chuburná in Progreso, and the other transect is from Nohuayún in Tetiz municipality to Sisal in Hunucmá. .
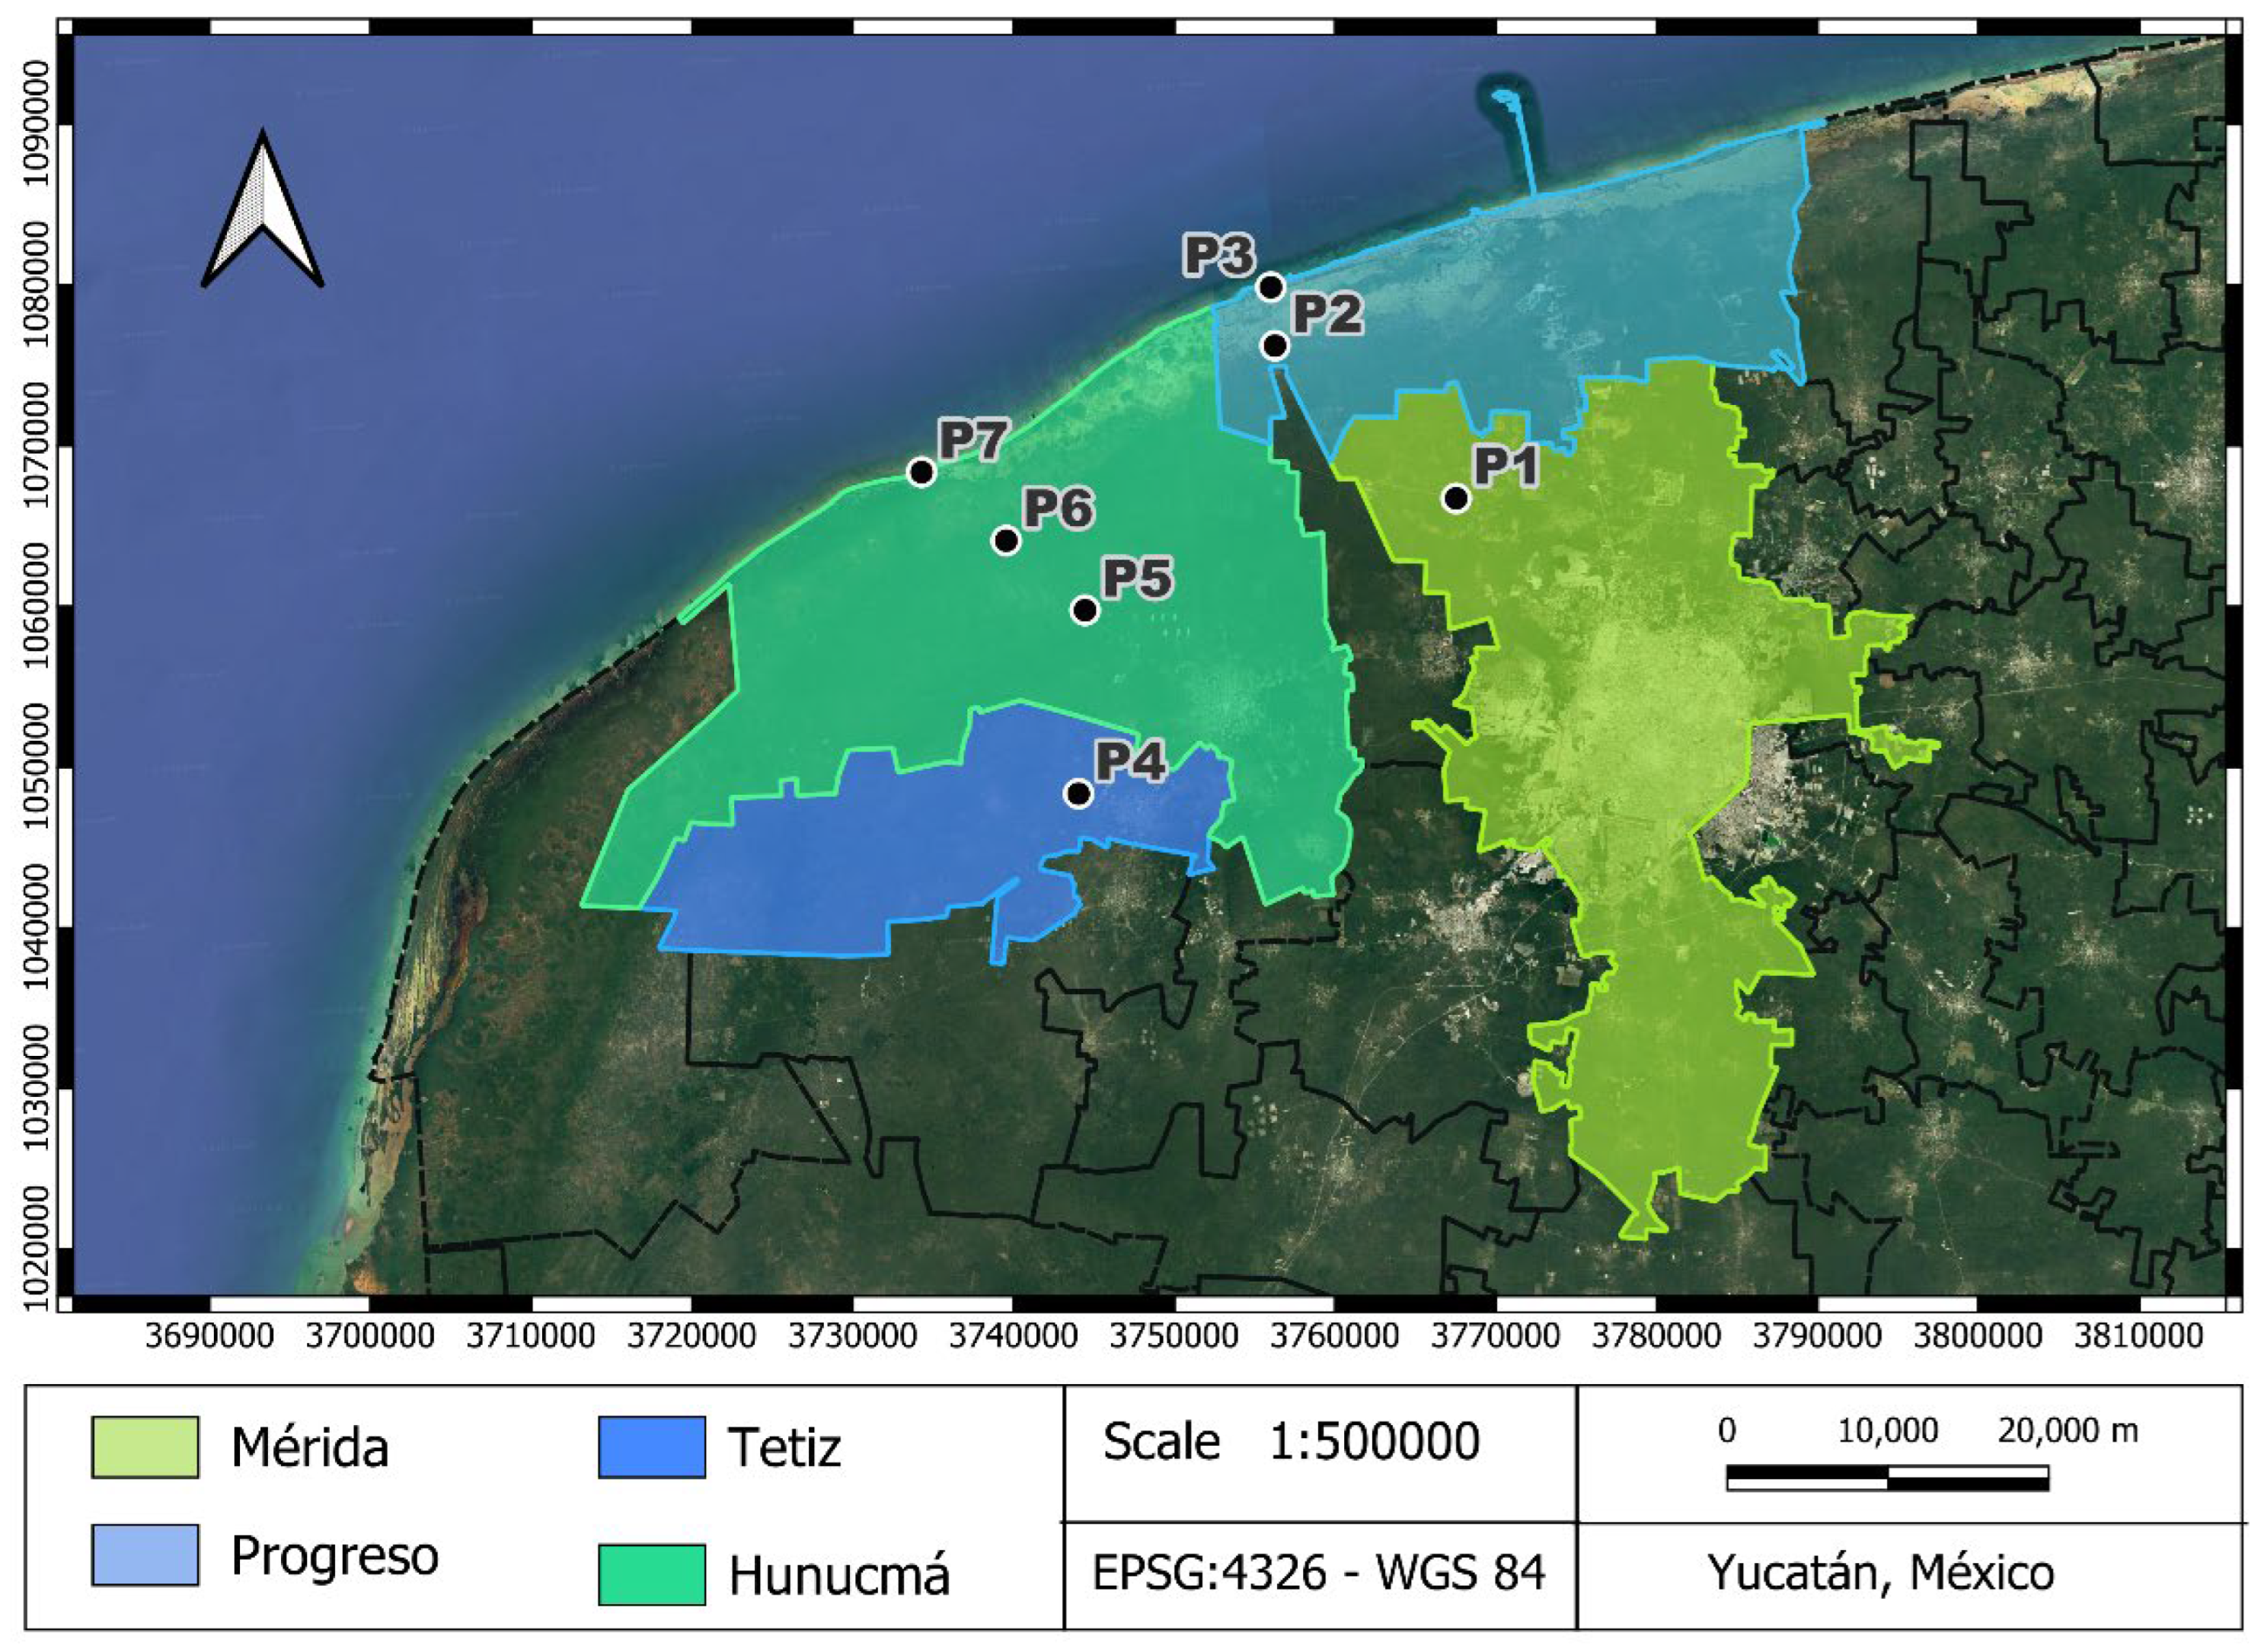
Figure 2.
Principal Coordinate Analysis (PCO) of physicochemical variables measured in September and October 2021 in wells of Yucatan, Mexico. Inverted triangles are used in samples measured in transect 1 (Sierra Papacal to Chuburná), and circles are used in transect 2 (Nohuayún to Sisal). Colors indicate its nearness to the coast; inland samples are presented from red to green, and the sites nearest to the coast are blue.
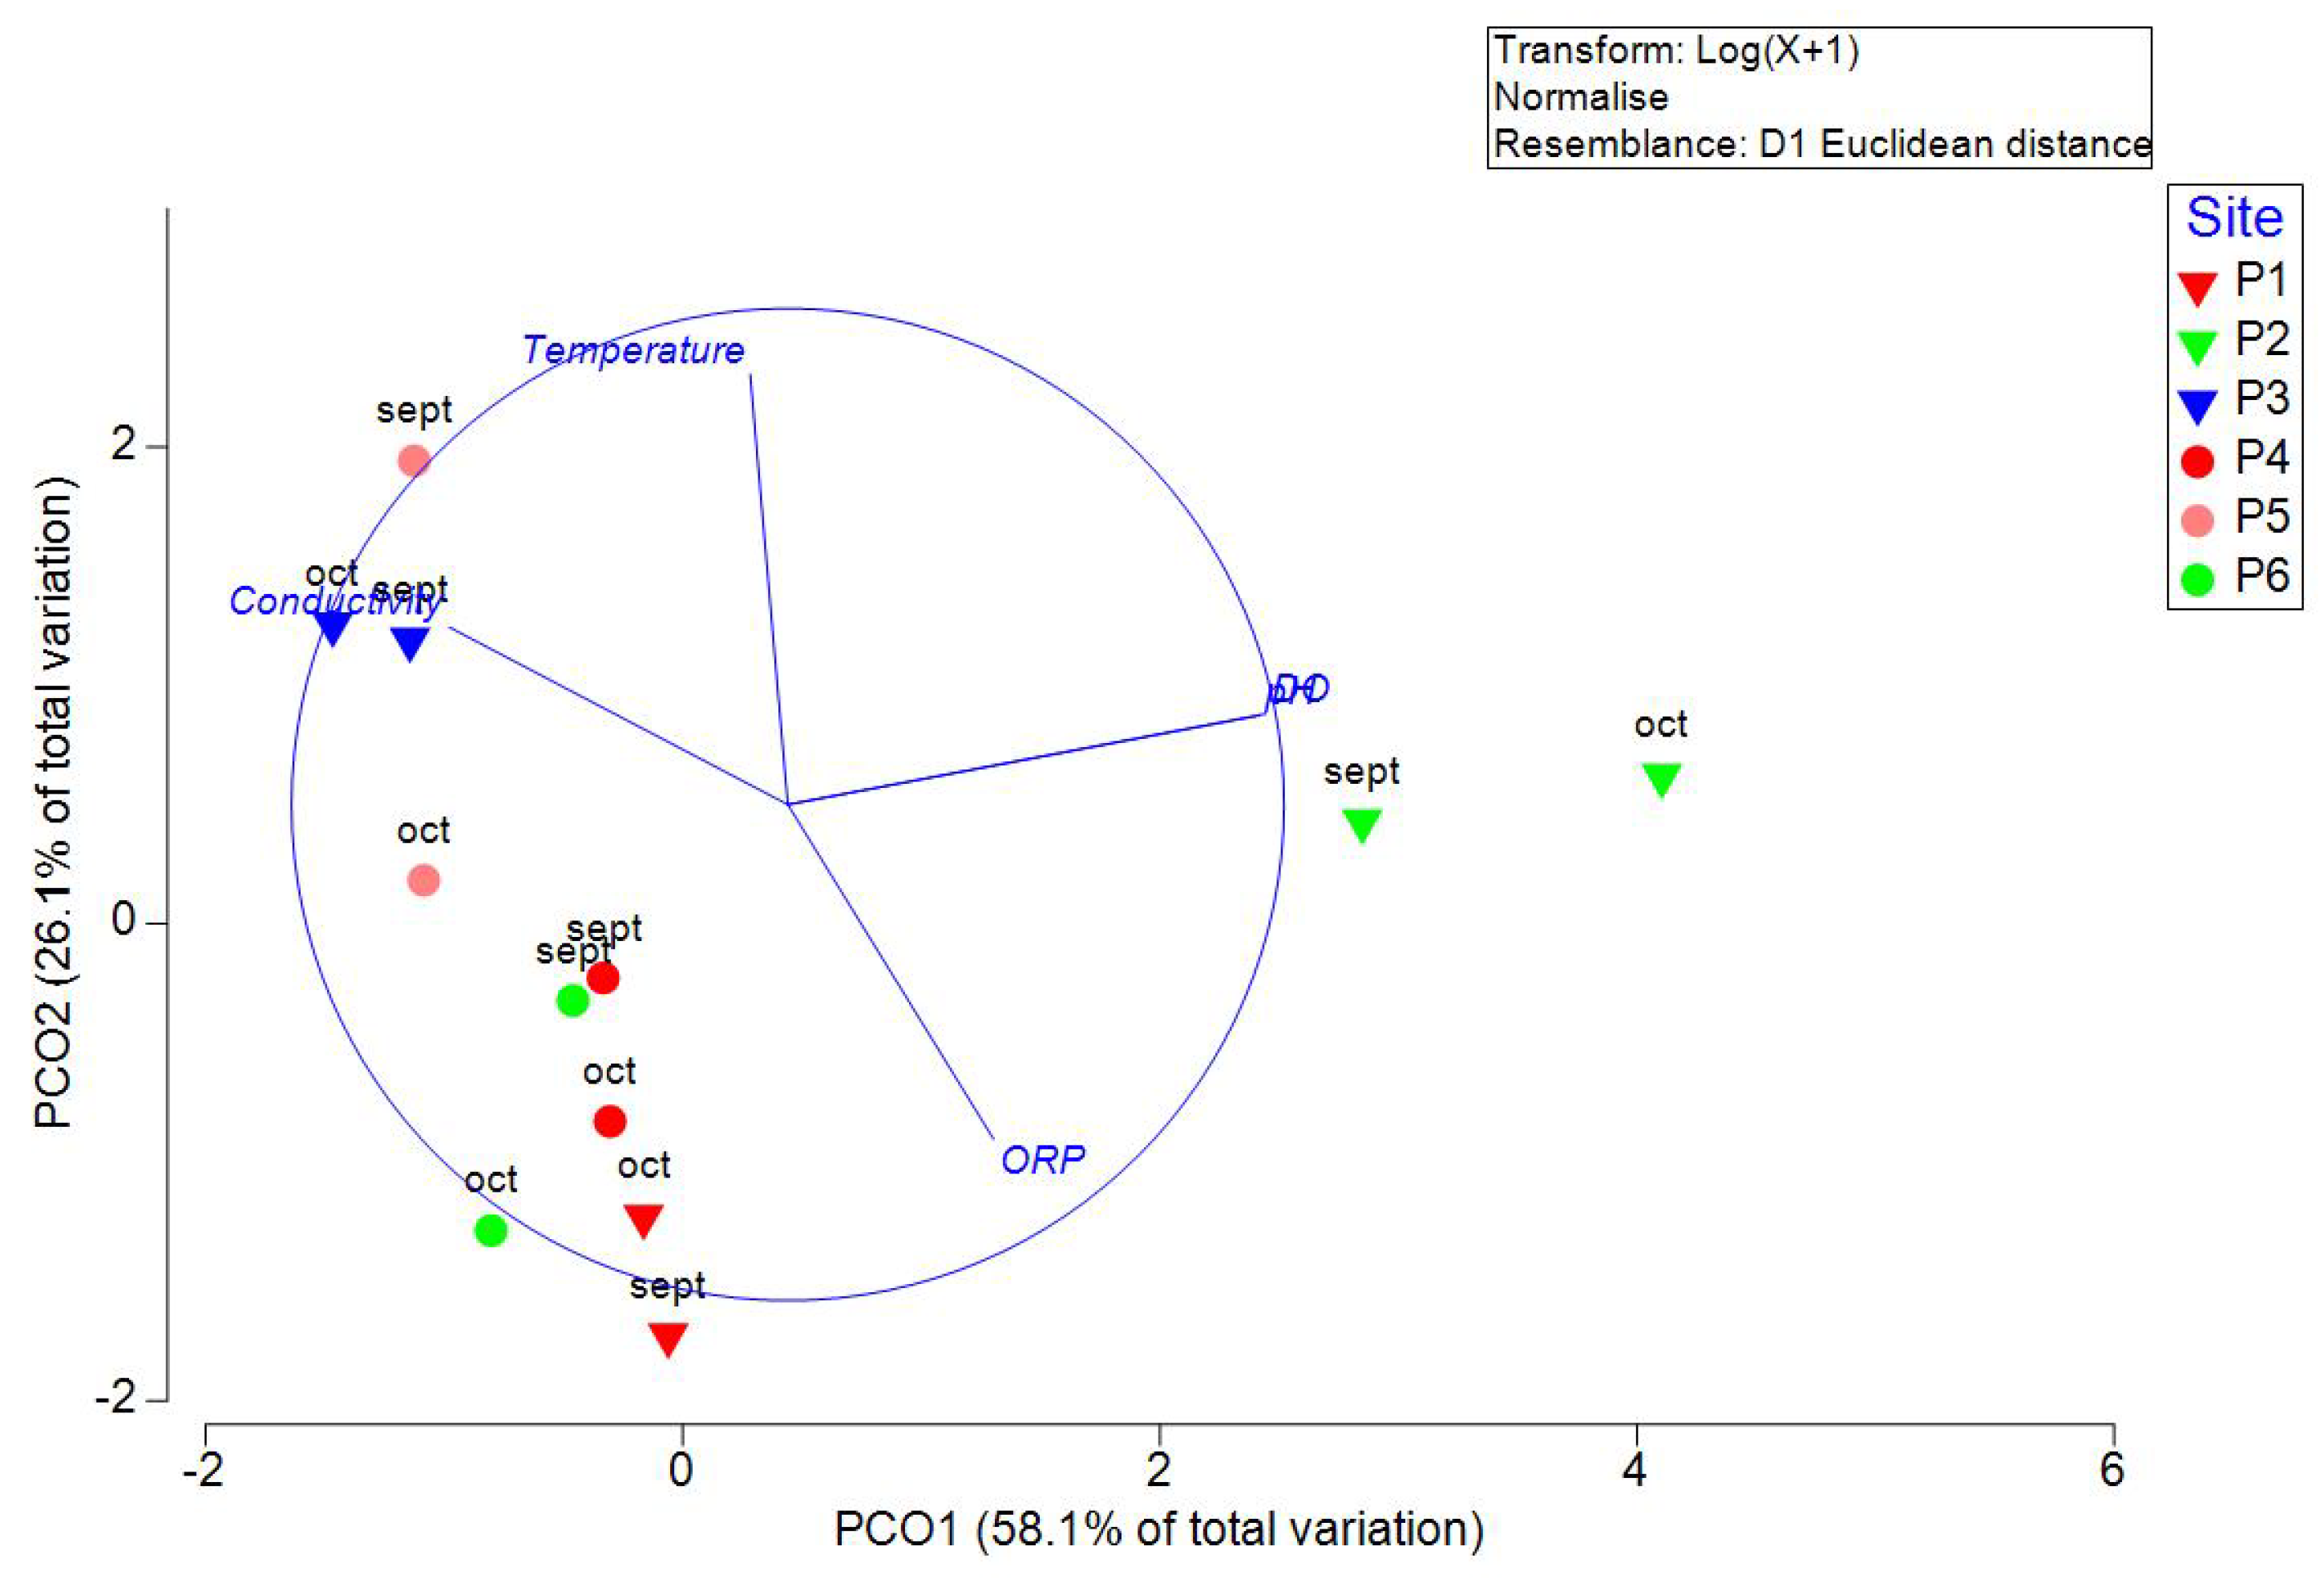
Figure 3.
Cluster Analysis with SIMPROF test of physicochemical variables measured in September and October 2021 in wells of Yucatan, Mexico. Inverted triangles are used in samples measured in transect 1 (Sierra Papacal to Chuburná), and circles are used in transect 2 (Nohuayún to Sisal). Colors indicate its nearness to the coast; inland samples are presented from red to green, and the sites nearest to the coast are blue. Dashed red lines are used to mark pseudo-groups indicated by the SIMPROF test.
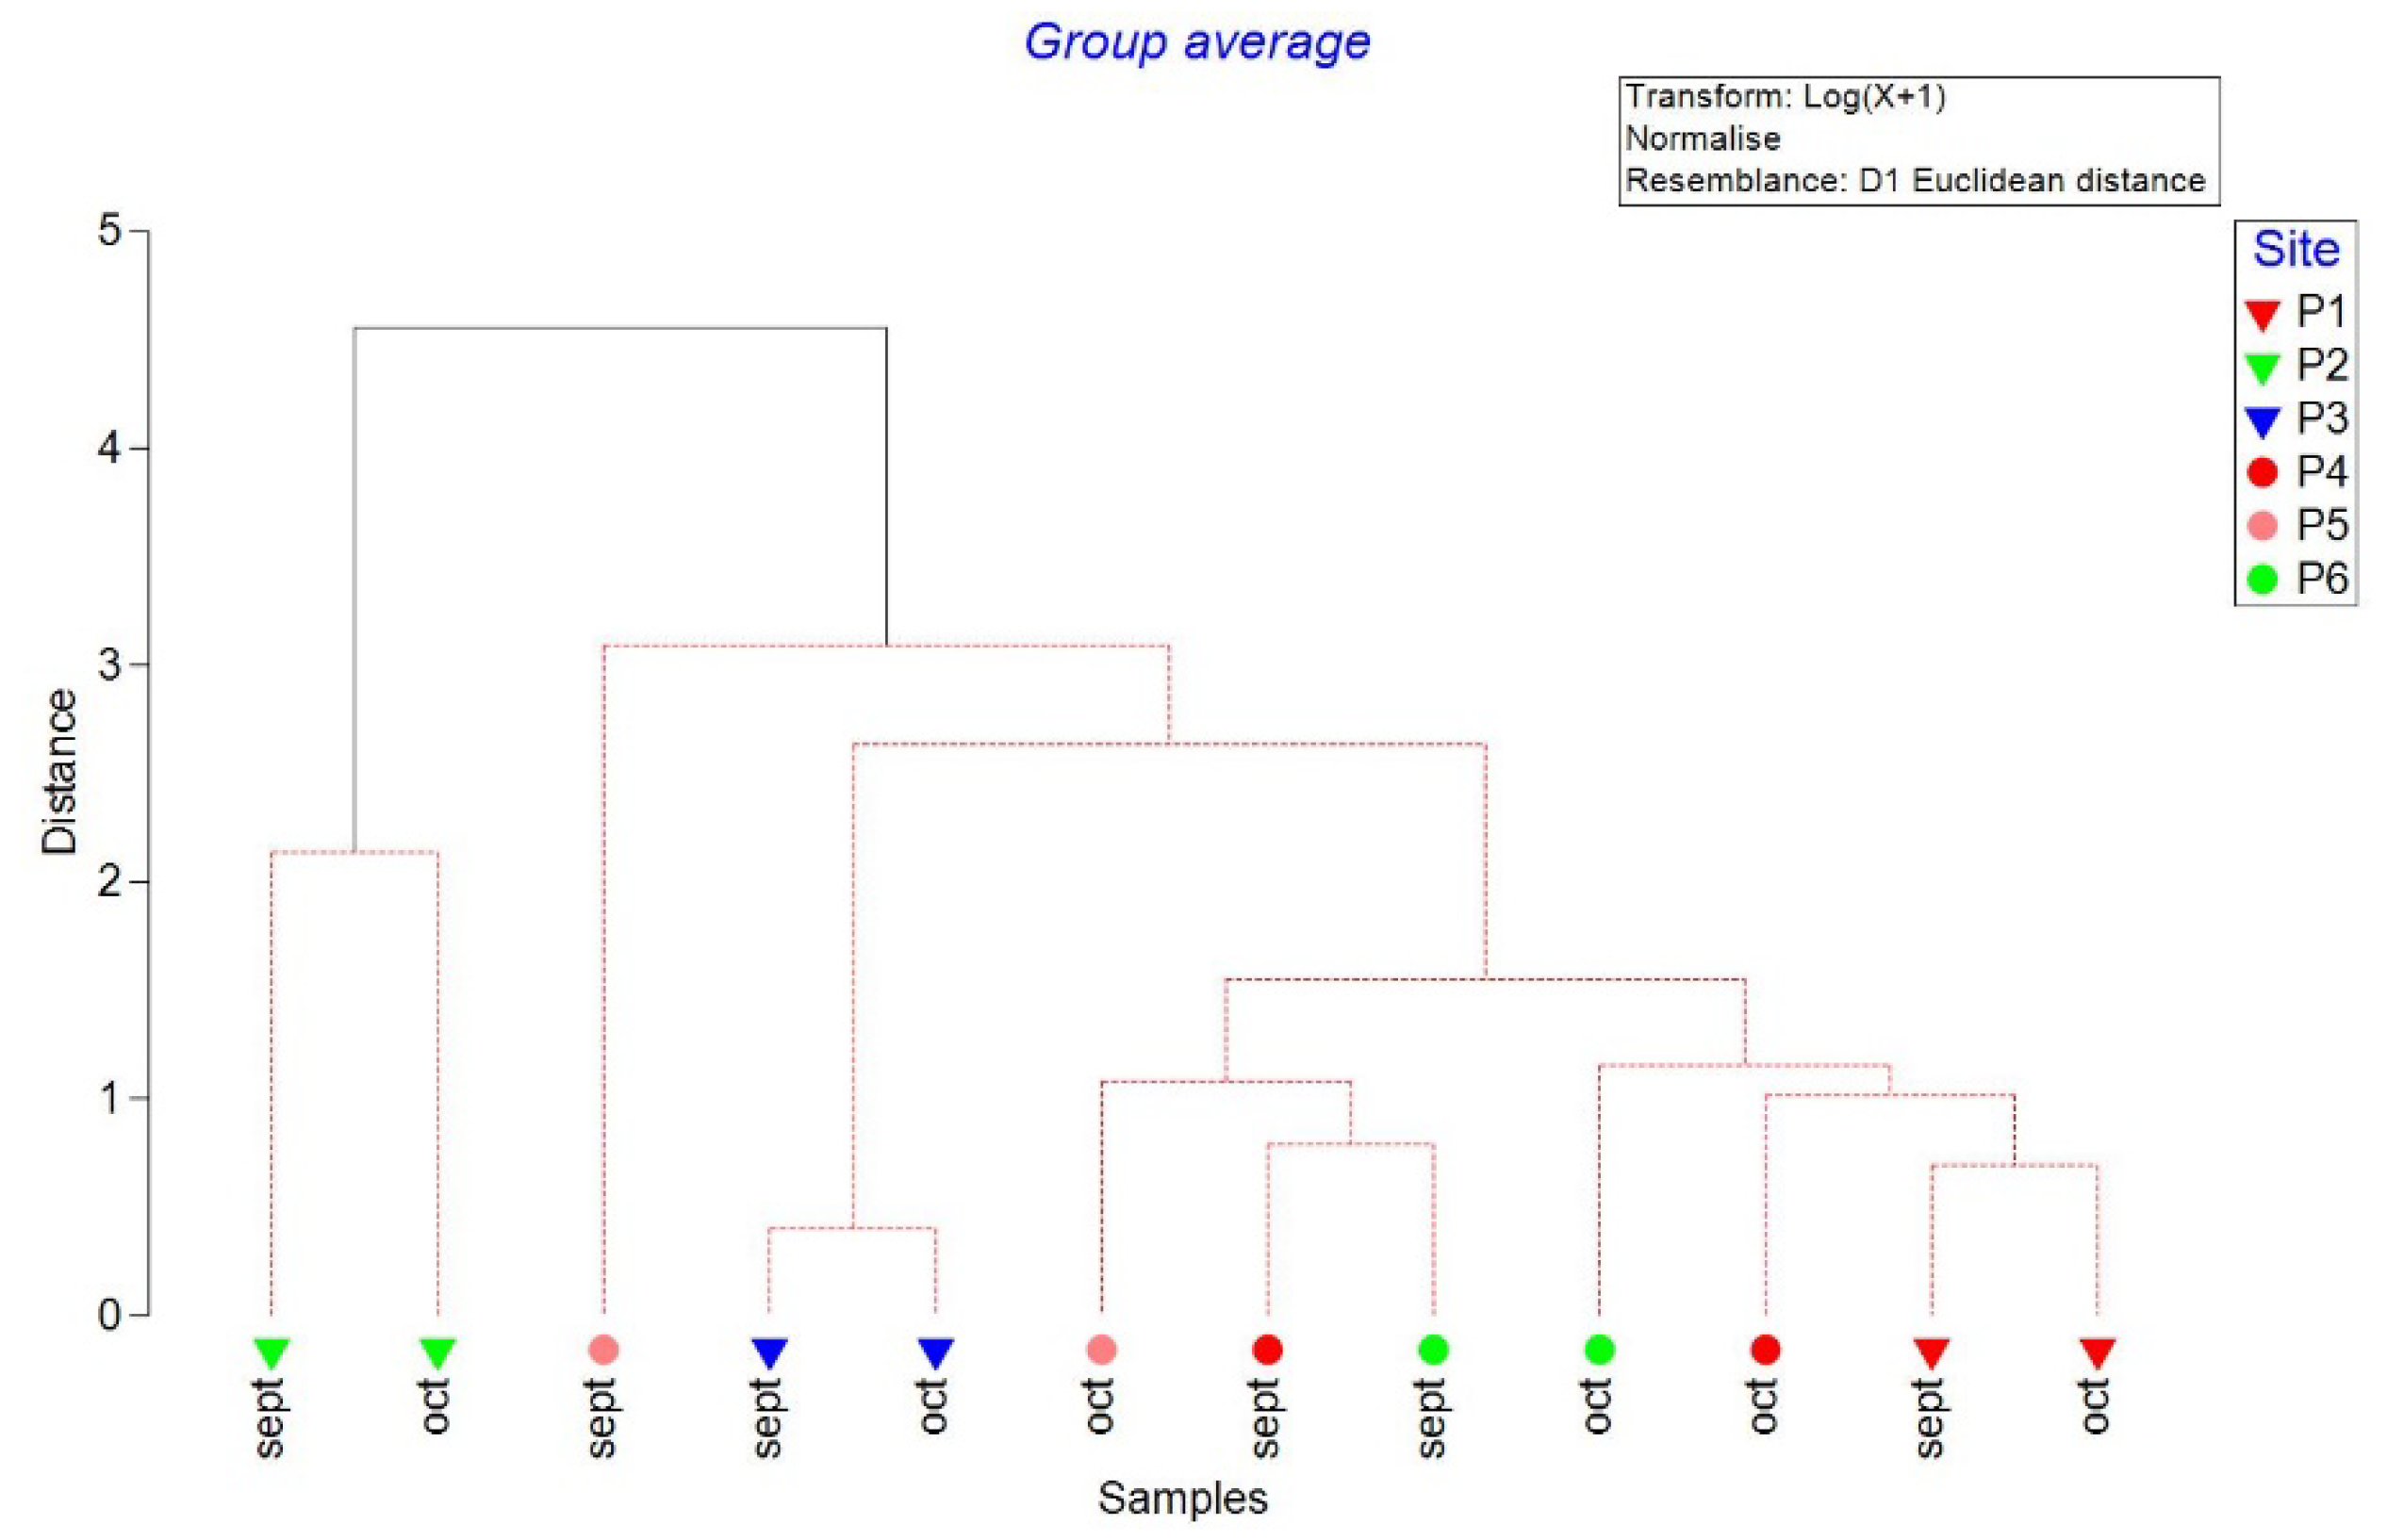
Figure 4.
Principal Coordinate Analysis (PCO) of nutrients measured in September and October 2021 in wells of Yucatan, Mexico. Inverted triangles are used in samples measured in transect 1 (Sierra Papacal to Chuburná), and circles are used in transect 2 (Nohuayán to Sisal). Colors indicate its nearness to the coast; inland samples are presented from red to green, and the sites nearest to the coast are blue.
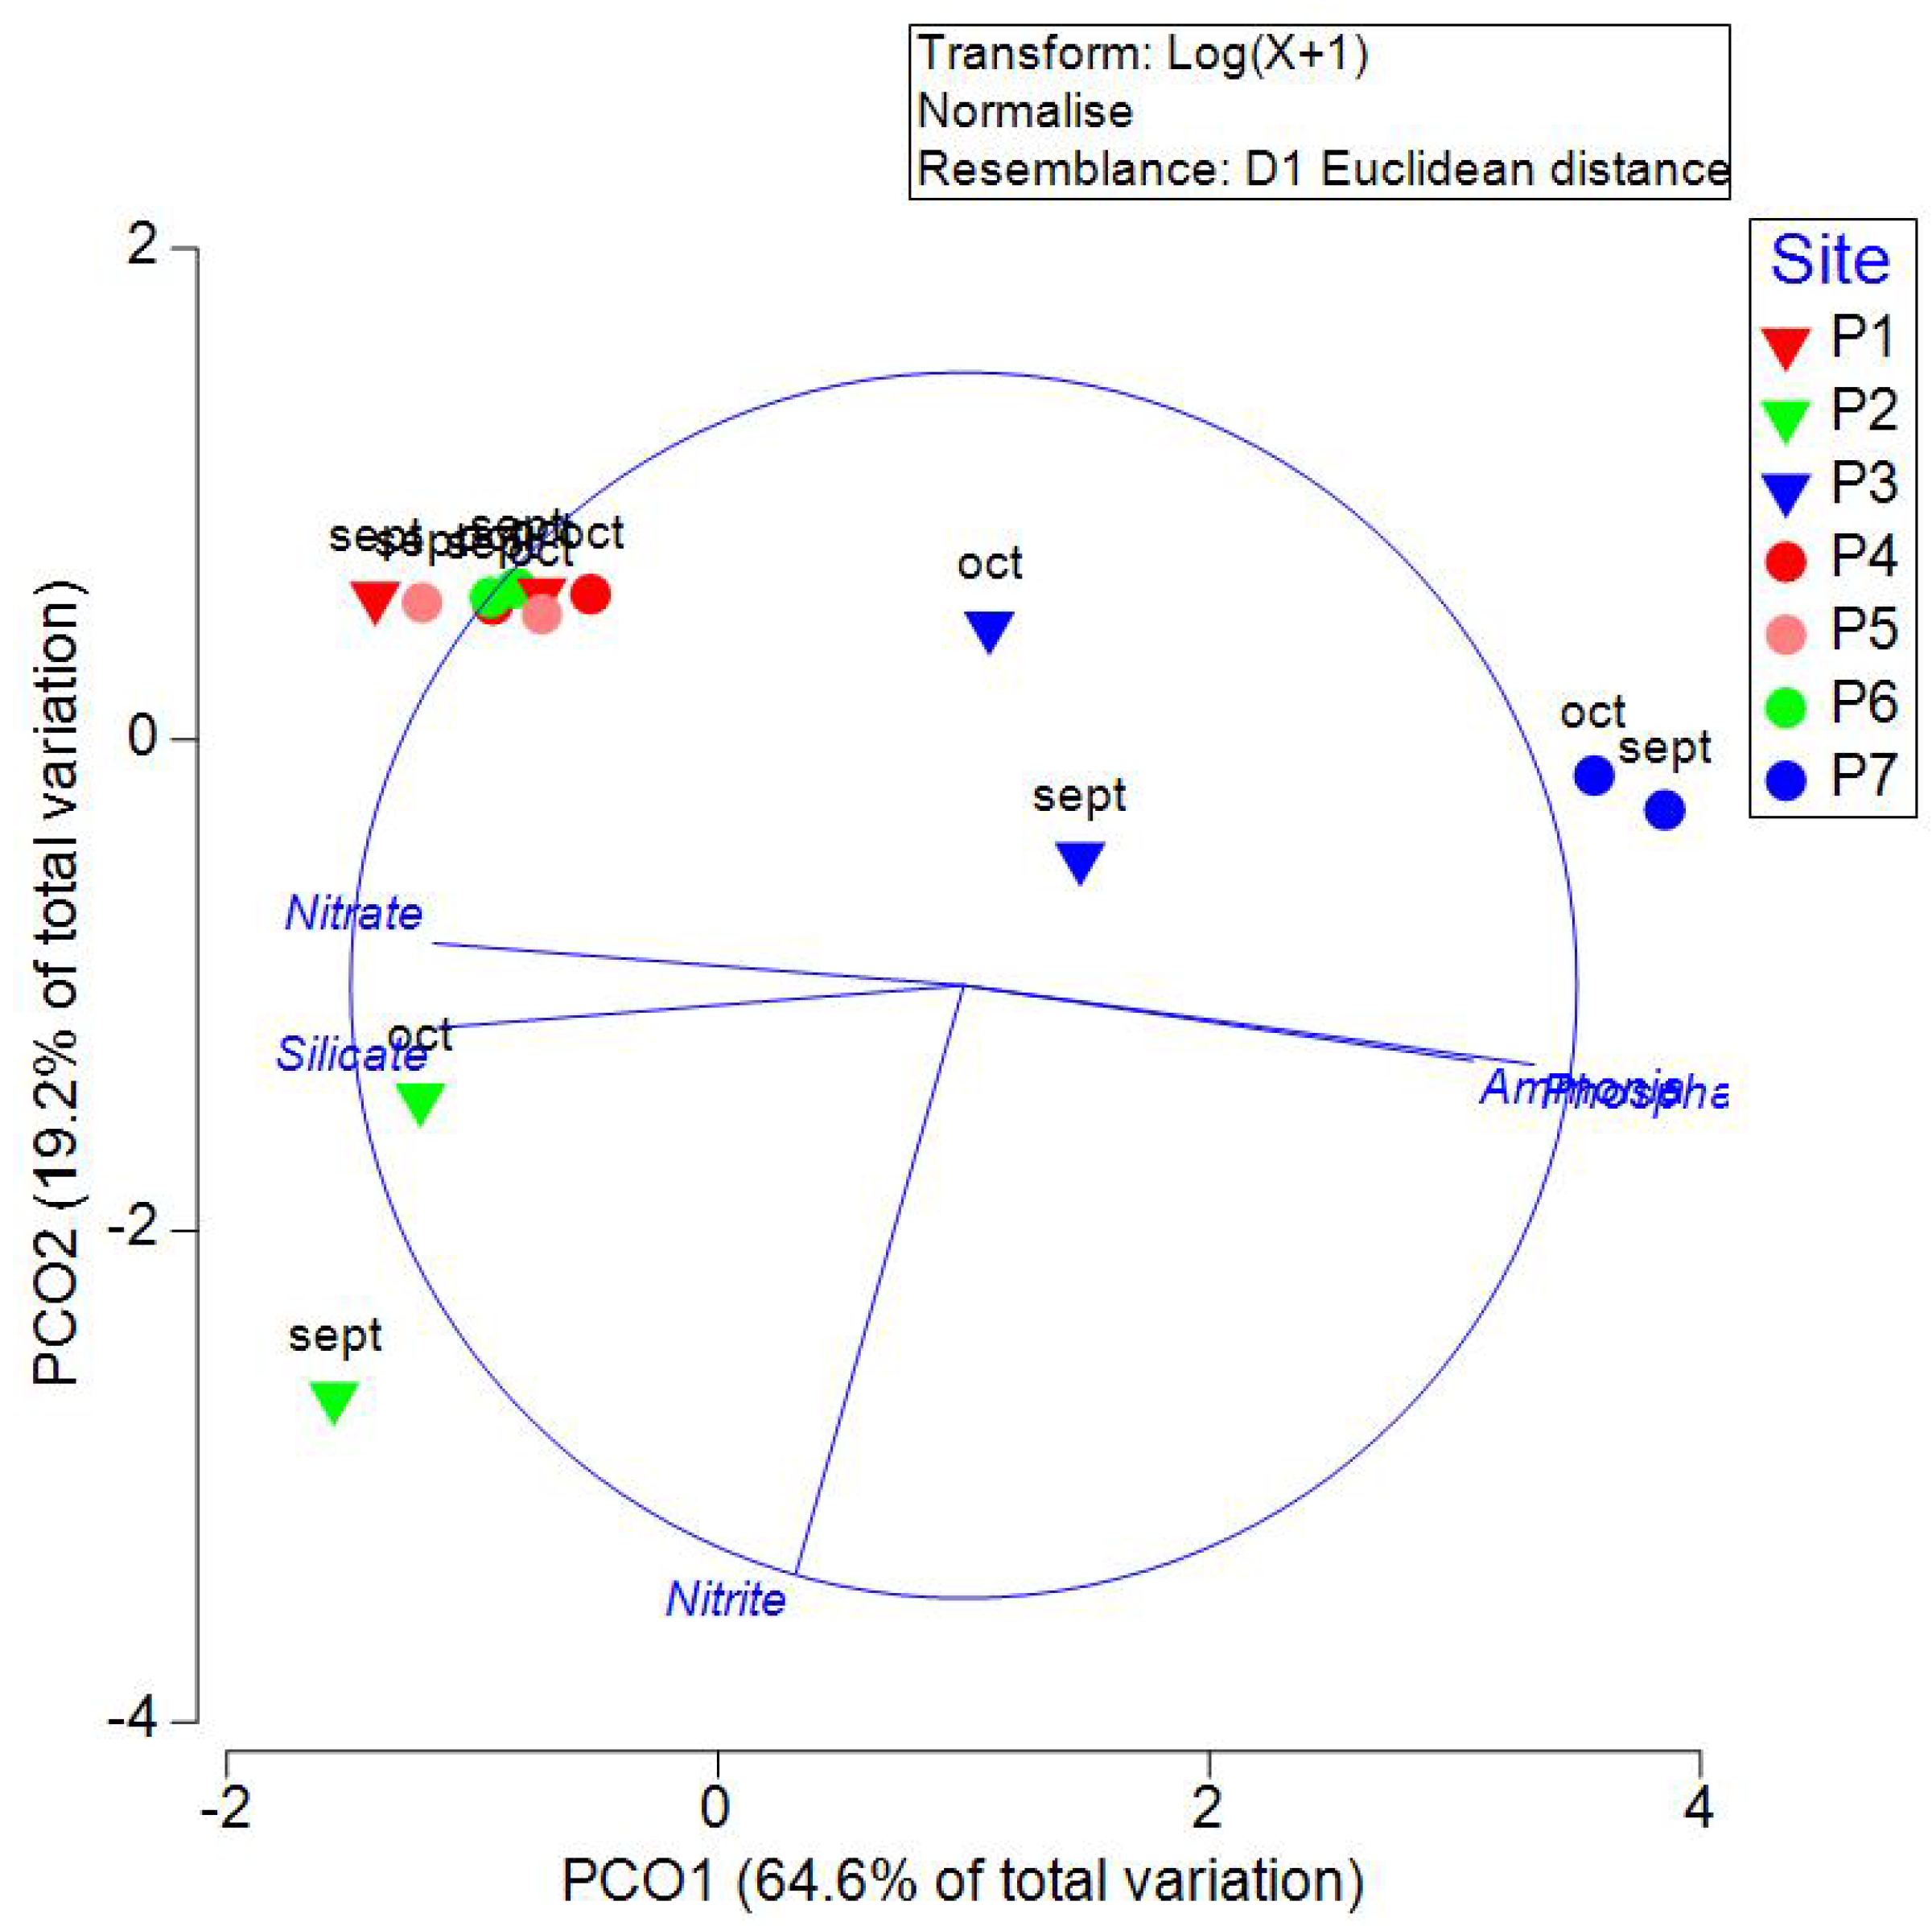
Figure 5.
Cluster Analysis with SIMPROF test of nutrients measured in September and October 2021 in wells of Yucatan, Mexico. Inverted triangles are used in samples measured in transect 1 (Sierra Papacal to Chuburná), and circles are used in transect 2 (Nohuayún to Sisal). Colors indicate its nearness to the coast; inland samples are presented from red to green, and the sites nearest to the coast are blue. Dashed red lines are used to mark pseudo-groups indicated by the SIMPROF test.
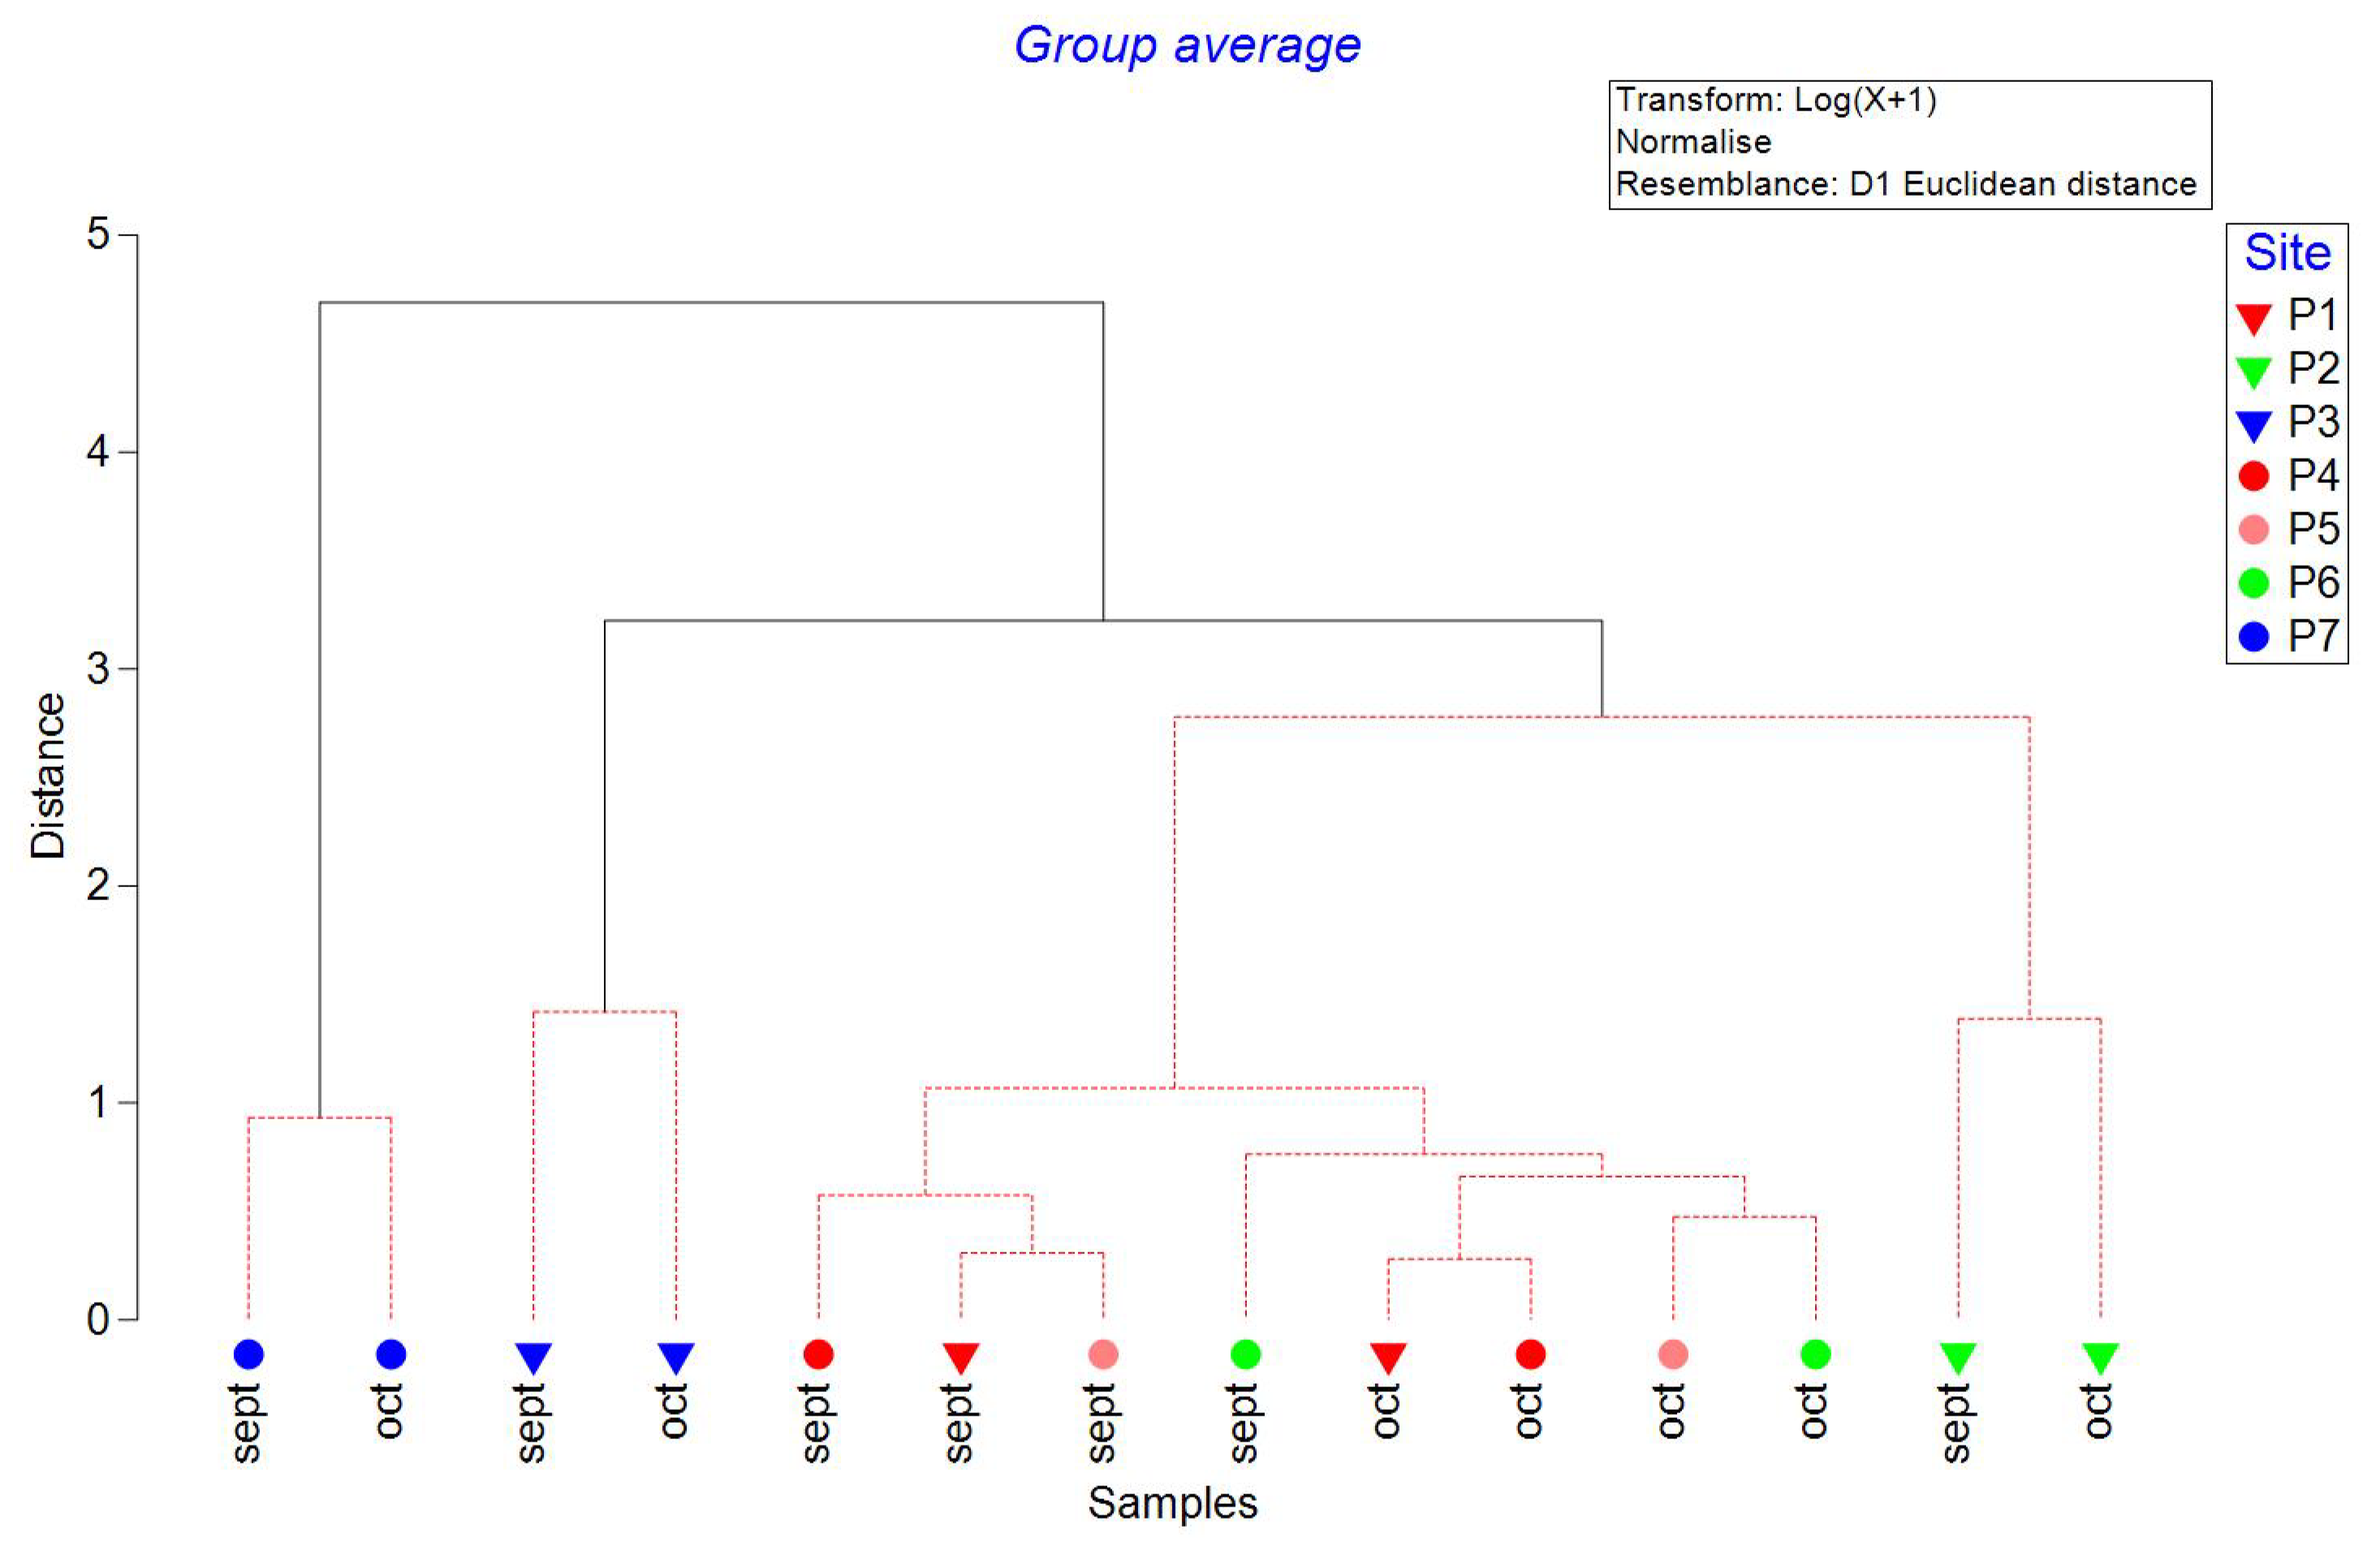
Figure 6.
Principal Coordinate Analysis (PCO) of pesticides and caffeine measured in September and October 2021 in wells of Yucatan, Mexico. Inverted triangles are used in samples measured in transect 1 (Sierra Papacal to Chuburná), and circles are used in transect 2 (Nohuayún to Sisal). Colors indicate its nearness to the coast; inland samples are presented from red to green, and the sites nearest to the coast are blue.
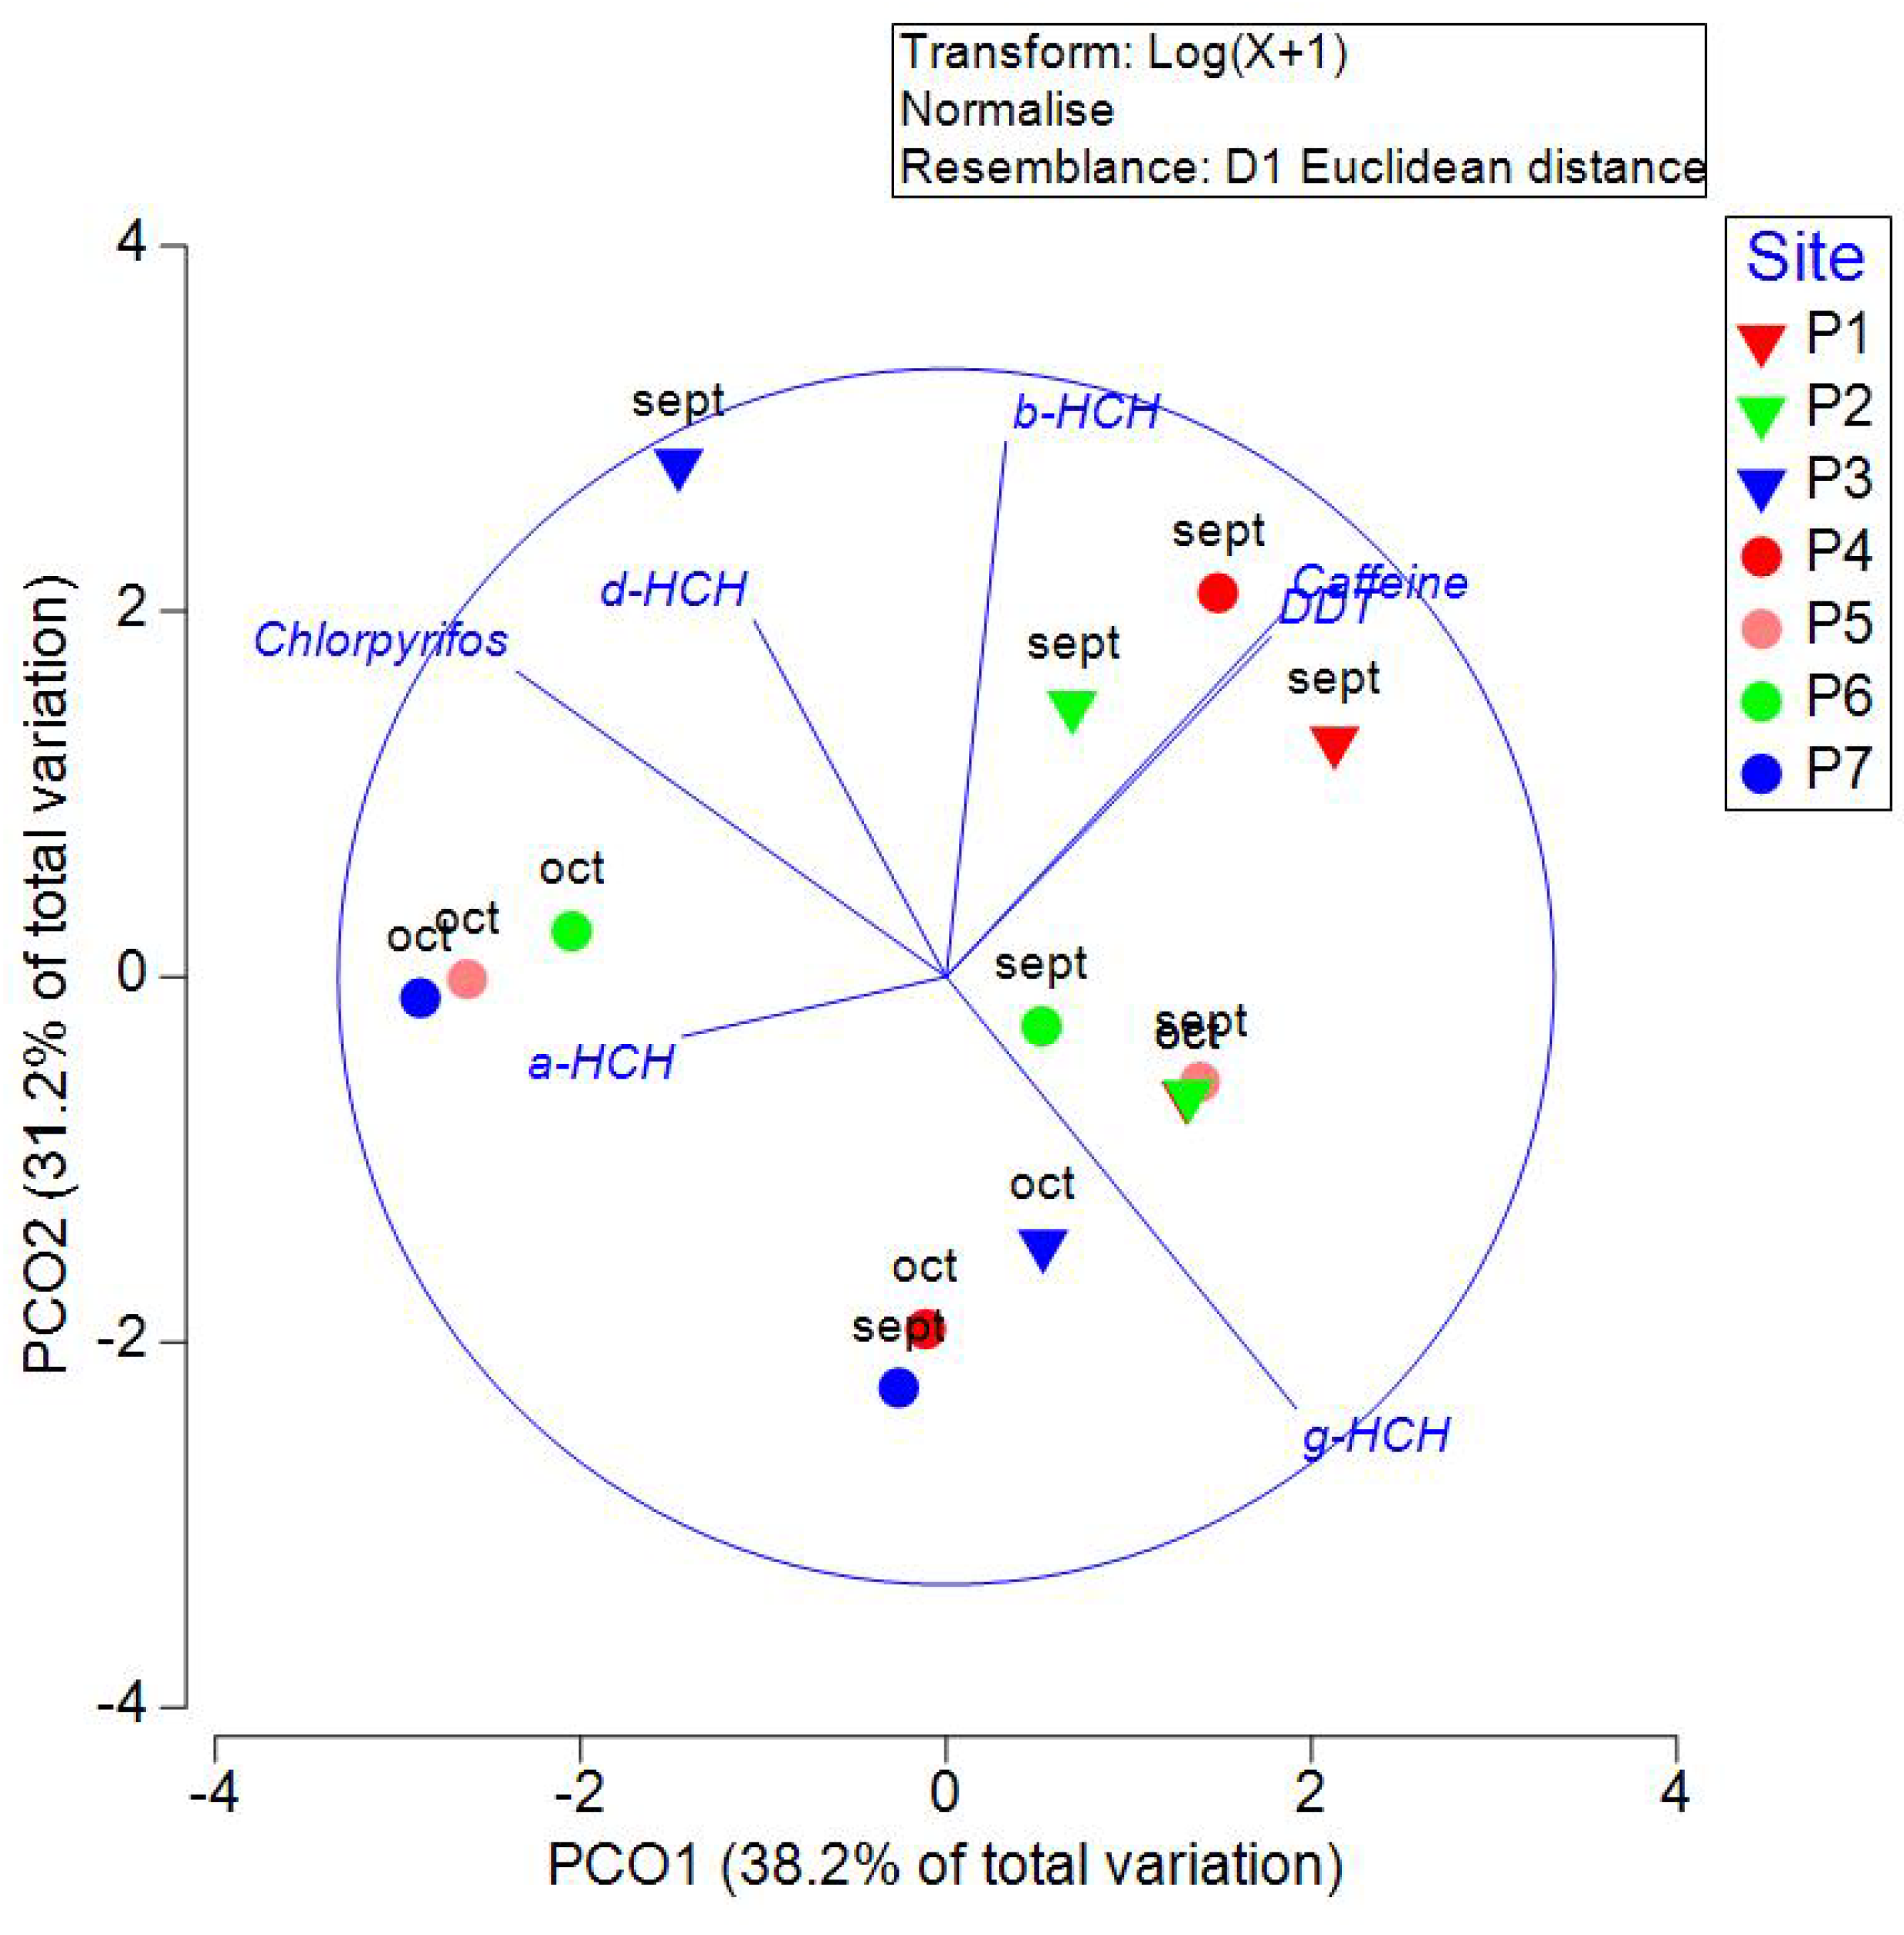
Figure 7.
Principal Coordinate Analysis (PCO) of PAHs and caffeine measured in September and October 2021 in wells of Yucatan, Mexico. Inverted triangles are used in samples measured in transect 1 (Sierra Papacal to Chuburná), and circles are used in transect 2 (Nohuayún to Sisal). Colors indicate its nearness to the coast; inland samples are presented from red to green, and the sites nearest to the coast are blue.
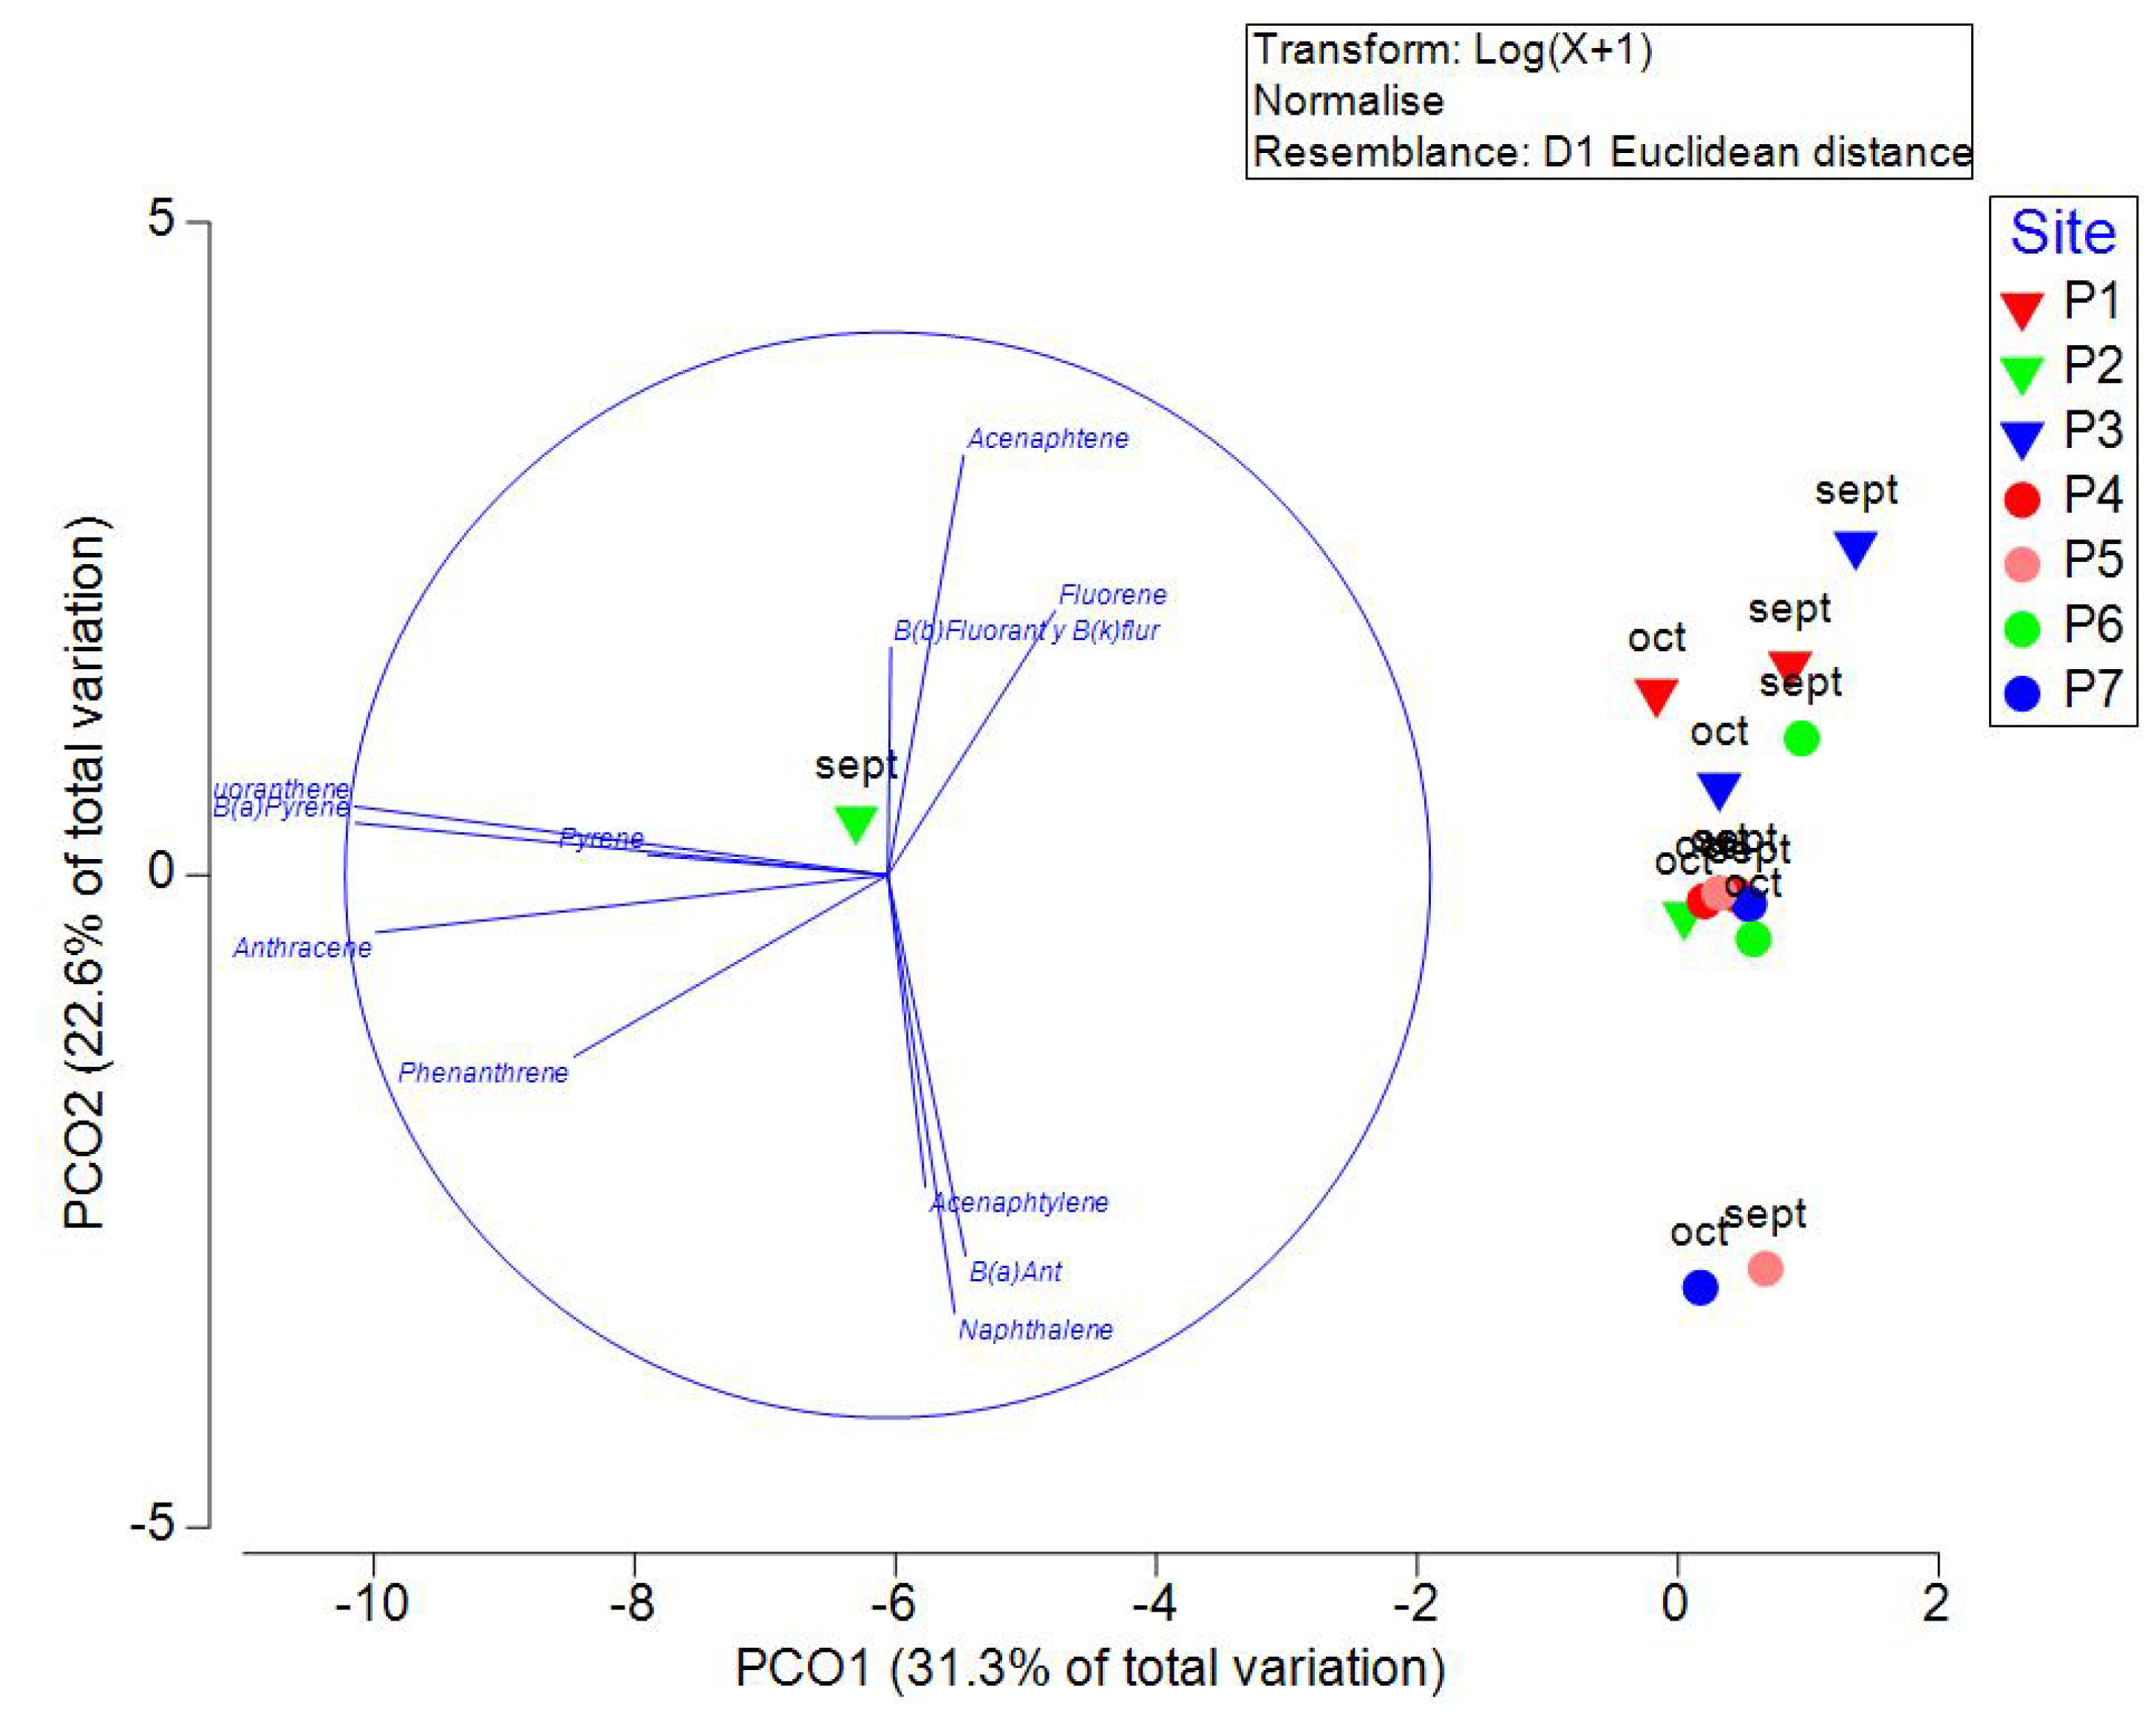
Figure 8.
Principal Coordinate Analysis (PCO) of biomarkers in Allium cepa roots exposed to well samples in September and October 2021 in wells of Yucatan, Mexico. Triangles are used in samples measured in transect 1 (Sierra Papacal to Chuburná), and circles are used in transect 2 (Nohuayún to Sisal). Colors indicate the site's proximity to the coast; inland samples are presented from red to green, and the sites nearest to the coast are blue.
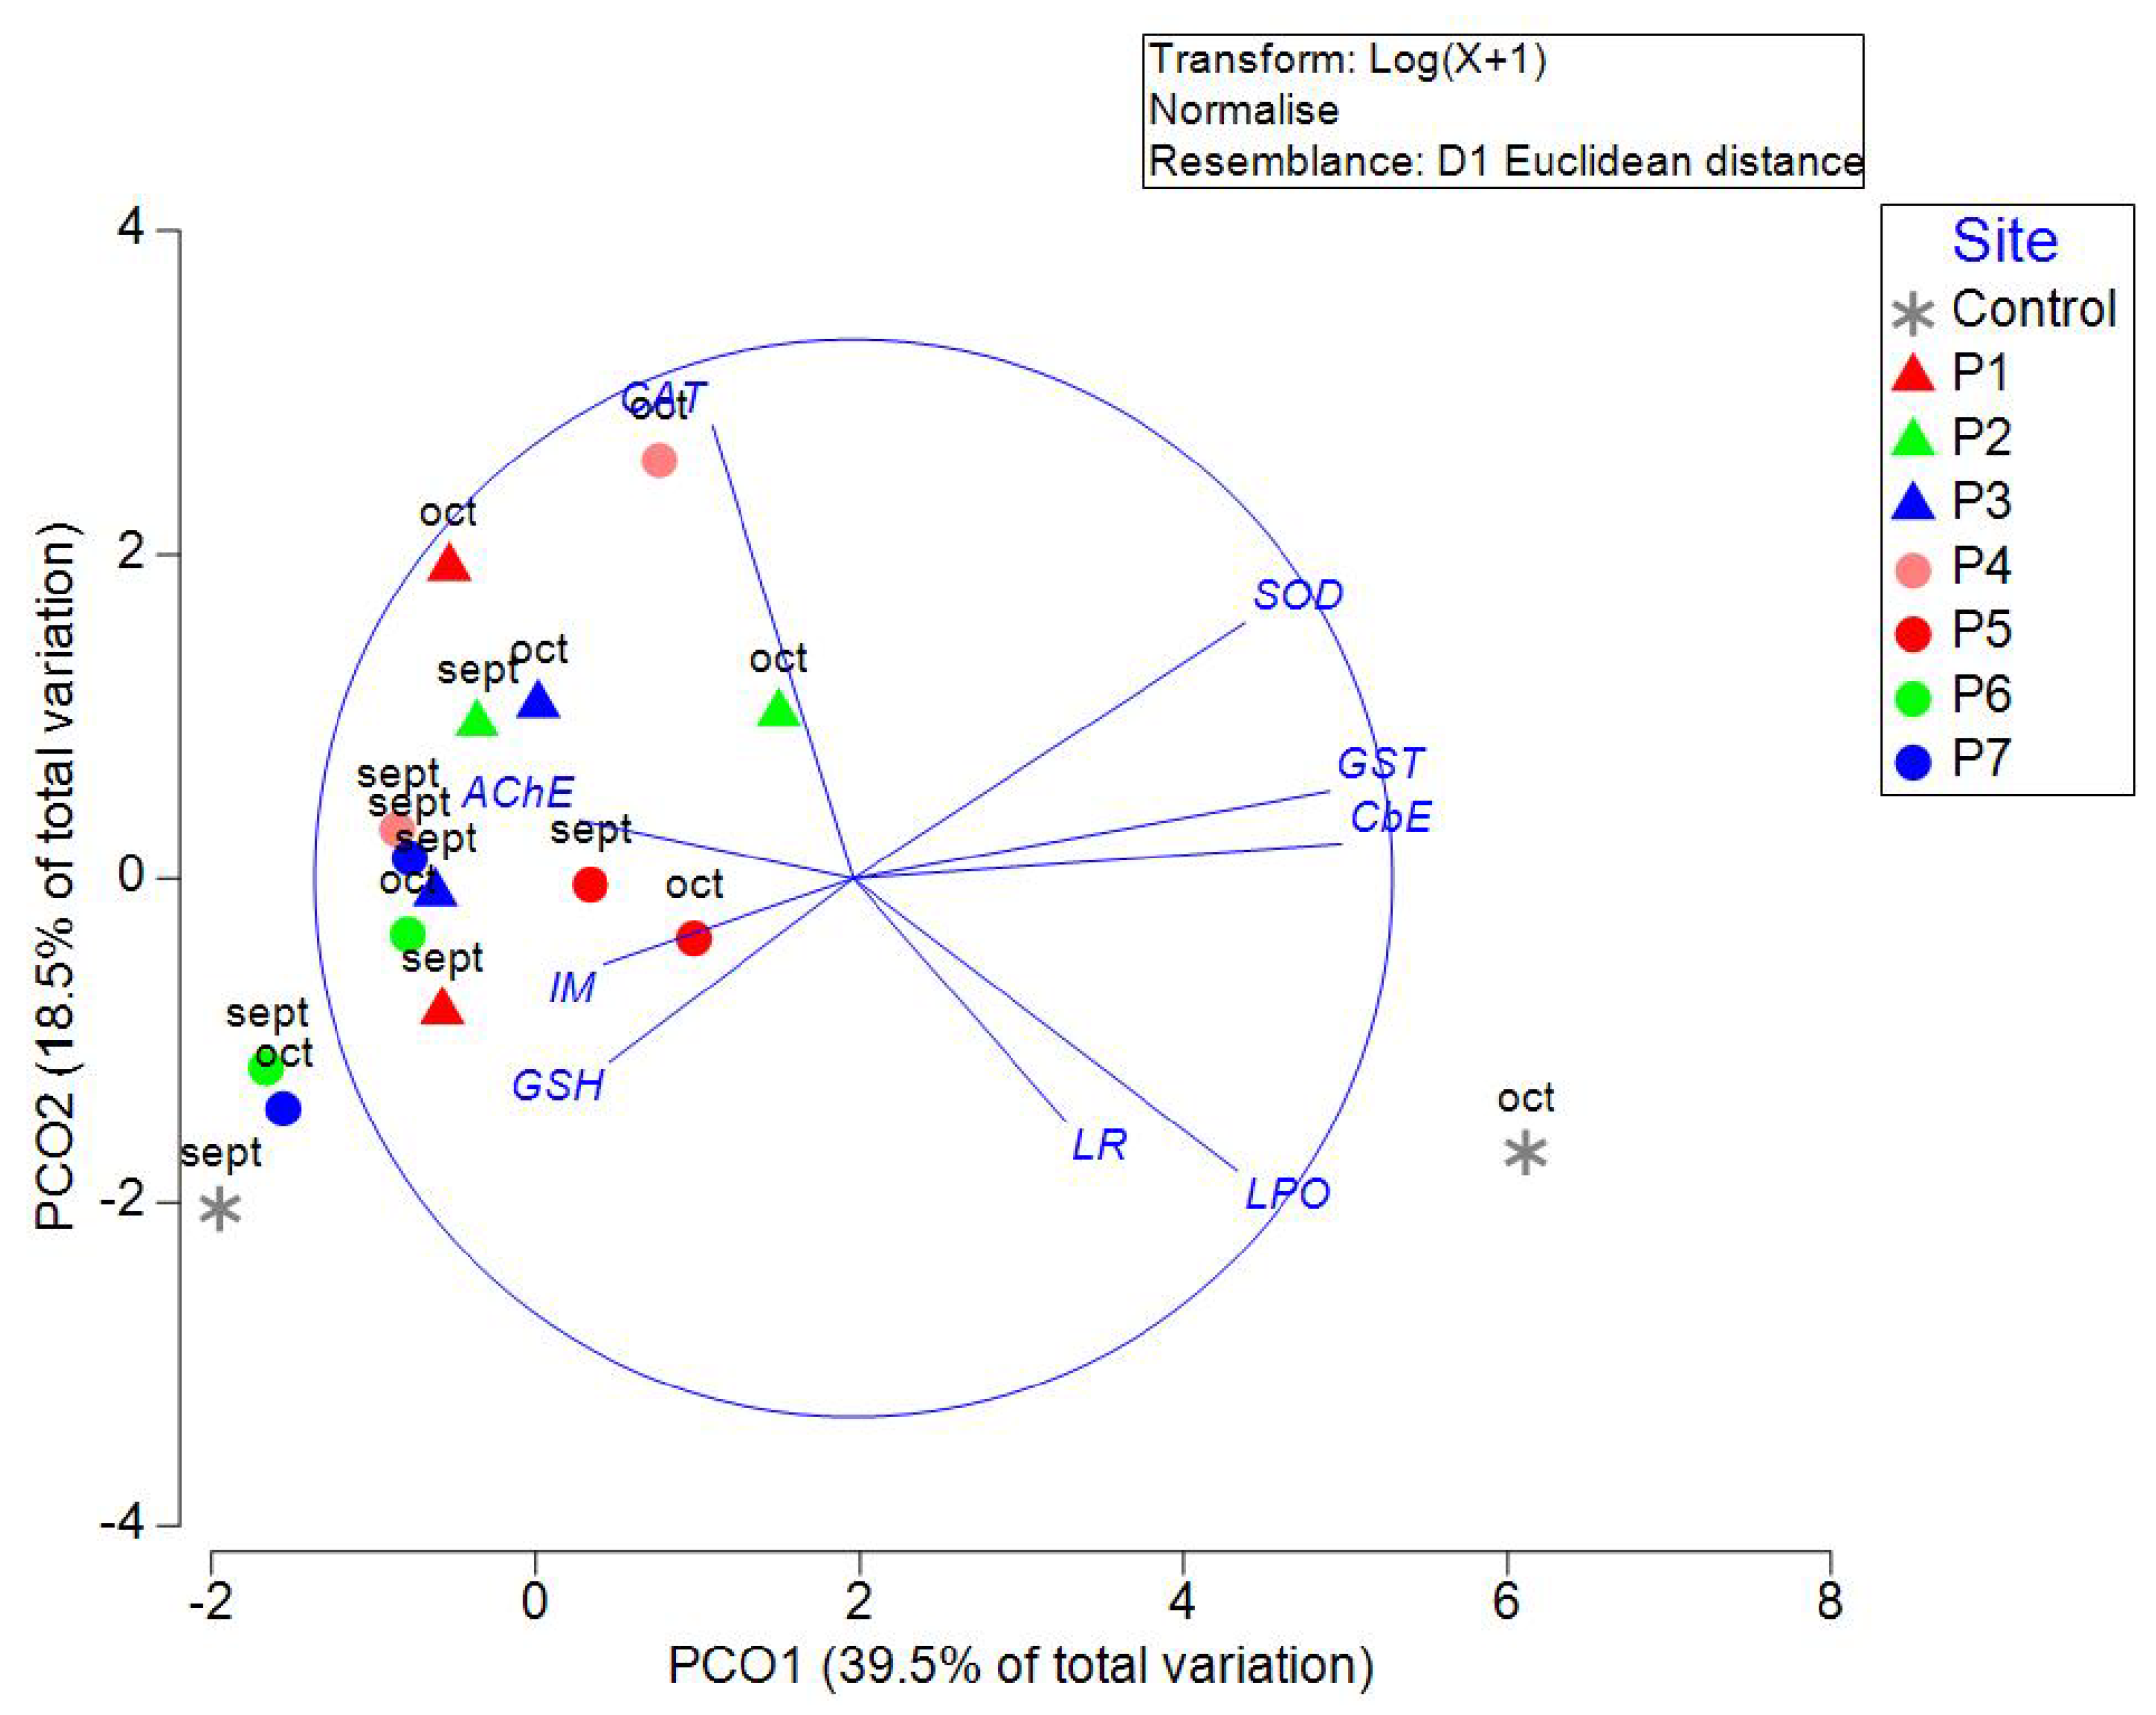
Table 1.
Physicochemical parameters measured in situ in September and October 2021 in wells located in Yucatan, Mexico.
Table 1.
Physicochemical parameters measured in situ in September and October 2021 in wells located in Yucatan, Mexico.
| Parameter | Temperature (°C) | pH | Conductivity µS/cm | TDS mg/L | DO mg/L | ORP mV | ||||||
| Month | Sept. | Oct. | Sept. | Oct. | Sept. | Oct. | Sept. | Oct. | Sept. | Oct. | Sept. | Oct. |
| Site | ||||||||||||
| P1 | 27.28 | 27.70 | 6.73 | 6.71 | 1942.25 | 2154.3 | 1199 | 1332 | 0.95 | 0.92 | 188.15 | 192.3 |
| P2 | 28.21 | 28.4 | 7.47 | 7.51 | 277.7 | 4.9 | 170 | 3 | 7.8 | 7.66 | 87.6 | 131.2 |
| P3 | 29.19 | 29.24 | 6.61 | 6.5 | 5658.9 | 6051.95 | 3406 | 3639 | 0.68 | 0.54 | 33.1 | 27.35 |
| P4 | 27.91 | 27.93 | 6.72 | 6.54 | 1628.9 | 1786.6 | 1003 | 1100 | 1.02 | 1.35 | 33.85 | 133.3 |
| P5 | 28.48 | 28.20 | 6.78 | 6.56 | 2047.45 | 2464.1 | 1248 | 1509 | 0.67 | 0.52 | -8.9 | 20.6 |
| P6 | 27.60 | 27.41 | 6.8 | 6.6 | 1585.8 | 1822.9 | 982 | 1133 | 0.66 | 0.3 | 16.6 | 69.1 |
Table 2.
Nutrient quantification in wells of Yucatan, México in September and October 2021. ND=Not detected.
Table 2.
Nutrient quantification in wells of Yucatan, México in September and October 2021. ND=Not detected.
| Nutrient | Phosphates mg/L | Silicates mg/L | Ammonium mg N-NH4/L | Nitrites mg N-NO2/L | Nitrates Mg N-NO3 /L | |||||
| Month | Sept. | Oct. | Sept. | Oct. | Sept. | Oct. | Sept. | Oct. | Sept. | Oct. |
| Site | ||||||||||
| P1 | ND | ND | 5.21 | 3.01 | ND | 0.13 | ND | ND | 1.21 | 1.64 |
| P2 | ND | ND | 4.69 | 3.71 | 0.13 | 0.16 | 0.13 | 0.08 | 1.29 | 1.63 |
| P3 | 0.61 | 0.12 | 1.57 | 1.78 | ND | 0.07 | 0.03 | ND | 0.05 | 0.01 |
| P4 | ND | ND | 4.12 | 2.67 | 0.10 | 0.15 | ND | ND | 1.21 | 1.57 |
| P5 | ND | ND | 3.34 | 3.64 | 0.01 | 0.12 | ND | ND | 1.22 | 1.60 |
| P6 | ND | ND | 4.83 | 3.69 | 0.06 | 0.26 | ND | ND | 1.24 | 1.56 |
| P7 | 1.86 | 1.14 | 1.62 | 1.36 | 1.11 | 1.03 | ND | ND | 0.07 | ND |
Table 3.
Organochlorine pesticides, chlorpyrifos, and caffeine in wells of Yucatan, México in September and October 2021. Values expressed in ng/L. ND: Not detected.
Table 3.
Organochlorine pesticides, chlorpyrifos, and caffeine in wells of Yucatan, México in September and October 2021. Values expressed in ng/L. ND: Not detected.
| Compound | Month | Site | ||||||
| P1 | P2 | P3 | P4 | P5 | P6 | P7 | ||
| α-HCH | Sep | ND | 13.07 | 81.61 | ND | 38.78 | 31.75 | 85.71 |
| Oct | 43.77 | 48.03 | 79.26 | 27.7 | 25.57 | 38.19 | 64.23 | |
| β-HCH | Sep | 60.30 | 54.14 | 64.61 | 53.50 | ND | 41.86 | ND |
| Oct | ND | ND | ND | ND | ND | 37.01 | ND | |
| γ-HCH | Sep | 30.05 | 30.82 | ND | ND | 45.28 | 35.21 | 66.37 |
| Oct | 44.93 | 45.23 | 70.08 | 45.22 | ND | ND | ND | |
| δ-HCH | Sep | ND | 141.44 | 80.70 | ND | ND | ND | ND |
| Oct | ND | ND | ND | ND | 33.81 | ND | 54.69 | |
| Heptachlor | Sep | ND | ND | ND | ND | ND | ND | ND |
| Oct | ND | ND | ND | 17.03 | ND | ND | ND | |
| Aldrin | Sep | 15.34 | ND | ND | ND | ND | ND | ND |
| Oct | ND | ND | ND | ND | ND | ND | ND | |
| Chlorpyrifos | Sep | ND | ND | 175.92 | ND | ND | ND | ND |
| Oct | ND | ND | ND | ND | 90.83 | 129.80 | 98.26 | |
| p,p’-DDD | Sep | ND | ND | ND | ND | ND | ND | ND |
| Oct | ND | ND | ND | ND | ND | 41.75 | ||
| p,p’-DDT | Sep | 65.12 | 52.21 | 65.06 | 59.54 | 56.95 | ND | ND |
| Oct | 57.20 | 57.80 | 86.57 | ND | ND | ND | ND | |
| Total pesticides | Sep | 170.82 | 291.68 | 467.90 | 113.04 | 141.00 | 108.82 | 152.08 |
| Oct | 145.91 | 151.07 | 235.90 | 89.96 | 150.20 | 205.00 | 258.93 | |
| Caffeine | Sep | 6.16 | 5.92 | 8.12 | 10.21 | 10.10 | 5.41 | ND |
| Oct | 8.38 | 9.13 | ND | ND | ND | ND | ND | |
Disclaimer/Publisher’s Note: The statements, opinions and data contained in all publications are solely those of the individual author(s) and contributor(s) and not of MDPI and/or the editor(s). MDPI and/or the editor(s) disclaim responsibility for any injury to people or property resulting from any ideas, methods, instructions or products referred to in the content. |
© 2024 by the authors. Licensee MDPI, Basel, Switzerland. This article is an open access article distributed under the terms and conditions of the Creative Commons Attribution (CC BY) license (http://creativecommons.org/licenses/by/4.0/).
Copyright: This open access article is published under a Creative Commons CC BY 4.0 license, which permit the free download, distribution, and reuse, provided that the author and preprint are cited in any reuse.


