Submitted:
07 September 2024
Posted:
09 September 2024
You are already at the latest version
Abstract
Zinc Oxide nanoparticles functionalized with APTES were obtained to evaluate their CH4 and CO2 adsorption and separation behavior. First, ZnO nanoparticles were obtained by a precipitation method and subsequently coated with (3-aminopropyl)-triethoxysilane (APTES). The nanoparticles sample was characterized by UV-Vis, FT-IR spectroscopy, TGA, XRD, TEM/EDX, XPS and N2 adsorption at 77 K. CH4 and CO2 adsorption experiments were carried out at 298 K in a range between 0-10 bar. It was observed that the amount of gas adsorbed on the surface of the nanostructure is very small in comparison with other materials traditionally used for this purpose but slightly higher than those obtained in naked nanoparticles evaluated in previous studies.
Keywords:
ZnONPs@APTES nanoparticles
; functionalization
; adsorption
; separation
; CH4
; CO2
1. Introduction
Zinc oxide (ZnO) is one of the most widely used semiconductors in everyday life; it can be called a multifunctional material due to its unique physical and chemical properties. The hexagonal wurtzite-type crystalline structure takes place in nature, although it may also occur with cubic blende-type structure.
The nanostructured ZnO presents a gap of 3.37 eV at room temperature, with an exciton energy of 60 meV. The strong exciton binding energy (25 meV) and thermal energy at room temperature (26 meV) can ensure efficient exciton emission at the above conditions. As a consequence, this material may be used in photoelectronics [1] and electronic equipment [2], in sensors [3,4,5,6,7,8], in UV laser [9], as well as in solar cells [10]. Also, it is known that ZnO photoluminescence properties depend on the its crystal size , defects in its crystalline structure and temperature [11].
Other applications in which ZnO has played a fundamental role have been in catalytic processes [12]. On the other hand, the antibacterial, disinfectant and drying properties of zinc oxide allows its use in the production of various types of pharmaceutical products [13,14].
The separation of CH4 and CO2 from natural gas has generated great interest in recent years. There are different materials capable of achieving this objective with higher or lower effectiveness, such as zeolites, activated carbons, MOFs, among others [15,16,17]. Moreover, metal oxides have been studied for this purpose [18].
In this study, a preliminary evaluation of CO2 adsorption by ZnO nanoparticles functionalized with (3-aminopropyl)−triethoxysilane (APTES) will be carried out. The obtained results will be compared with a previous study where the adsorption and separation of CH4 and CO2 by naked ZnO naanoparticles were discussed [19].
Results
2.1. Synthesis and Characterization of ZnO and ZnO@APTES Nanoparticles
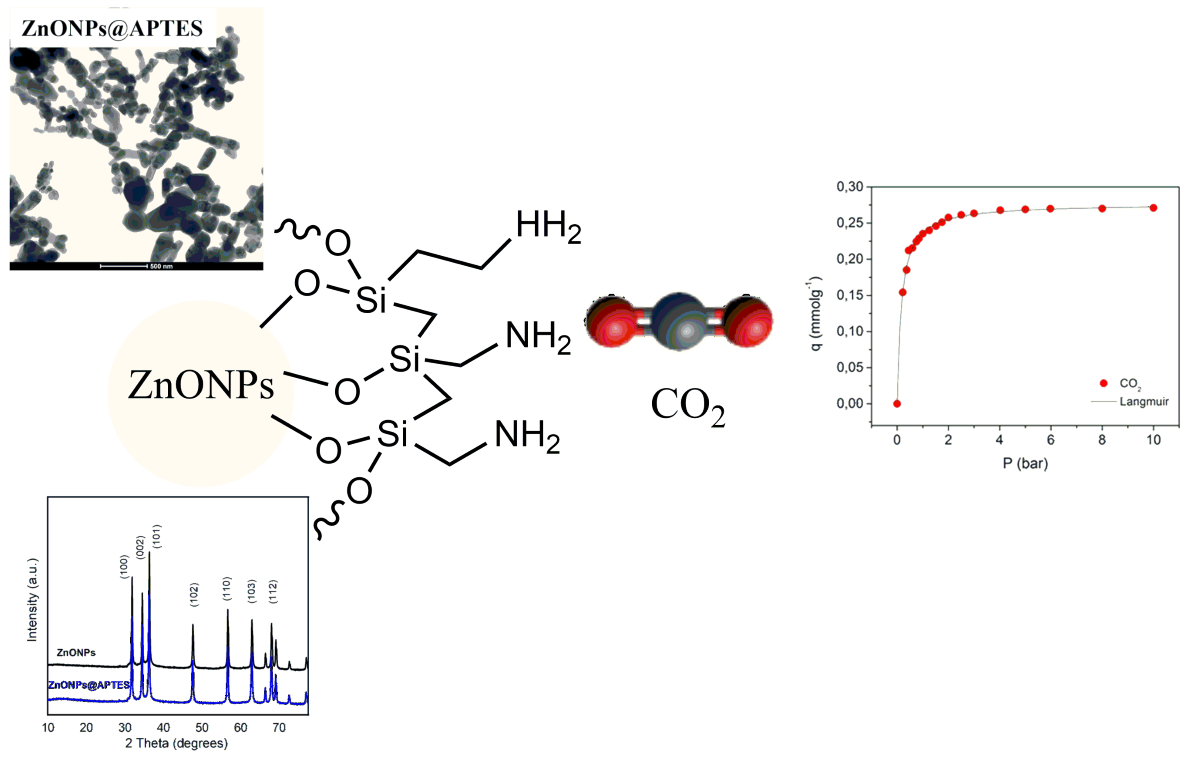
ZnO nanoparticles (ZnONPs) were obtained by a method similar to the one previously reported by Hariharan [20]. The ZnONPs were functionalized with APTES by a post-synthesis procedure (ZnONPs@APTES). The naked and functionalized nanostructures were then characterized using different techniques to provide information on their structural, morphological and surface characteristics.
The UV-Vis spectra of both synthesized samples are shown in Figure 1a, suggesting the formation of ZnO. The presence of characteristic bands of APTES on the surface of ZnO may be observed in the FT-IR spectra (Figure 1b).
A thermogravimetric measurement was performed on the naked and functionalized ZnONPs to determine the amount of organic matter in the APTES-coated ZnO (Figure 2).
The structural characterization of the synthesized nanostructures was performed by XRD. The obtained XRD patterns of naked and functionalized ZnONPs with APTES are shown in Figure 3.
The HRTEM and elemental mapping images for both nanostructures are shown in Figure 4 and Figure 5, respectively.
The weight and atomic percentage of Zn, O, Si and N are summarized in Table 1, with oxygen as the major element, as expected.
The surface and the chemical state of the constituent element for samples ZnONPs and ZnONPs@APTES were studied by XPS. The high resolution C 1s, O 1s and Zn 2p3/2 core level spectra for both samples, as well as the N 1s core level spectrum for the ZnONPs@APTES sample, are displayed in Figure 6. The binding energy values of the constituent elements and the surface chemical composition are shown in Table 2.
2.2. Gas Adsorption Experiments for ZnONPs@APTES
The adsorption isotherm of N2 at 77 K in the ZnONPs@APTES sample is shown in Figure 7a. From the N2 adsorption measurements, the surface area and pore volume were calculated (see Table 3). Also, the CO2 experimental adsorption isotherm at 298 K up to 10 bar is shown in Figure 7b. The CH4 adsorption isotherm at similar conditions was also measured, but no significant adsorption was observed.
3. Discussion
The naked and APTES coated ZnO nanoparticles have a characteristic band in the UV-Vis spectrum, which allows their identification. An absorption band is observed around 375 nm, which could be assigned to the transition from the valence band to the conduction band (O2p → Zn3d) (Figure 1a) [21]. This band is exhibited at a shorter wavelength than that of the bulk ZnO, which is reported to arise at 385 nm [22]. It has been previously studied that the absorption maximum can shift to shorter wavelengths by decreasing the particle size [23,24].
The FT-IR spectrum of the ZnONPs@APTES sample is shown in Figure 1b. The presence of APTES was verified by comparing the FT-IR spectra of both samples. The band corresponding to the Zn-O valence vibration (around 450 cm-1) can be observed in the spectrum of ZnONPs@APTES which indicates the presence of ZnO. The broad band towards 3395 cm-1 refers to the NH valence vibration (νN-H), while the band located at 1635 cm-1 is assigned to the dubbing vibration HNH (δH-N-H) of the free amino groups [25]. The signal that appears at 1110 cm-1 corresponds to the Si-O valence vibration (νSi-O) of the silanol groups present as a result of the functionalization. The bands (νN-H, δH-N-H and νSi-O) confirm the presence of APTES at the ZnONPs surface.
The thermogram obtained for the ZnONPs and ZnONPs@APTES samples is shown in Figure 2. The thermogravimetric curve of ZnONPs@APTES exhibits two stages of weight loss. A first stage occurs around 115 °C, corresponding to the loss of 6.5 % of water adsorbed on the surface of ZnO nanoparticles. The second weight loss (13.2 %) takes place at 388 °C, which could be ascribed to the decomposition and degradation of organic matter (APTES). These results may be related with the analysis of the FTIR spectrum that exhibits characteristic bands corresponding to the presence of APTES at the ZnONPs surface.
The structural characterization of the synthesized nanoparticles was performed by XRD. The obtained XRD patterns of naked and functionalized ZnONPs with APTES are shown in Figure 3. The diffraction peaks are assigned to the (1 0 0), (0 0 2), (1 0 1), (1 0 2), (1 1 0), (1 0 3), (1 1 2) planes, characteristic of the structure of the hexagonal wurtzite ZnO (P63mc space group) (JCPDS No. 79-2205) [26]. Narrow diffraction peaks are observed in both samples, which suggest good crystallinity [27].
High-resolution TEM images of both samples are shown in Figure 4, where particles with quasi-spherical or hexagonal shape may be observed (particle sizes between 35–170 nm of diameter in both cases). The elemental mapping of the ZnONPs@APTES sample (Figure 5) shows the distribution of Zn, O, Si and N, which are well dispersed in all areas of the particles, indicating that APTES is incorporated uniformly on the entire surface of the ZnO particles. The weight and atomic percentage of Zn, O, Si and N are summarized in Table 1, with oxygen as the major element, as expected.
The presence and surface concentrations of N, O, Si and Zn was studied by XPS analysis. The C 1s spectrum of ZnONPs sample can be decomposed in three contributions at 284.8, 285.9 and 288.8 eV. The more intense contribution at 284.8 eV is assigned to adventitious carbon, and the other weak contributions at 285.9 and 288.8 eV to C-OH and carbonate groups respectively. The C 1s spectrum of the sample functionalized with APTES also shows three contributions. However the contribution at 285.9 eV exhibits a relative intensity much more intense than the naked ZnONPs which could be ascribed to the presence of C-N bonds of the amino group [28]. The high-resolution O 1s core level spectrum of ZnONPS can be decomposed in three contributions at 530.1, 531.2 and 532.2 eV assigned to lattice oxygen of ZnO, Zn-OH group and carbonate, respectively [29]. Upon functionalization with APTES, a contribution at 531.6 eV with a high relative intensity is observed due to the presence Zn-O-Si bonds (Figure 6b), confirming the grafting of APTES on the ZnO nanoparticles. Figure 6c also includes the Zn 2p3/2 spectra for both solids. The observed binding energy values are similar and typical of ZnO [29], but the intensity of this signal in the case of ZnONPs@APTES is much less intense due to that APTES is covering the ZnO nanoparticles. In fact, the atomic concentration % of Zn decreases from 37.25 % for the naked ZnONPs to 11.38% for the functionalized ZnONPs@APTES. Finally, the high-resolution N 1s spectrum for ZnONPs@APTES shows a single peak at 399.7 eV. This value is similar to those found in the case of materials coated with APTES [30,31].
The chemical surface composition (Table 2) shows a clear increase of the carbon content upon functionalization from 20.02 to 39.31 %. The presence of N and Si was detected and N/Si atomic ratio of 7.16/8.84 = 0.81 is relatively close to the theoretical values of 1.00. In summary, the formation of a covalent bonding between ZnO nanoparticles and APTES is verified by XPS.
The adsorption isotherm of N2 at 77 K in the ZnONPs@APTES sample is shown in Figure 7a. The isotherms were of type II with hysteresis loop H3 according to the IUPAC classification [33]. This type of isotherm is characteristic of non-porous or macroporous adsorbents and represents adsorption in monolayer-multilayer without restrictions. The specific surface area obtained value using the BET method [34] was similar to the naked NPs (Table 3). The pore volume value decreased slightly after functionalization which could be ascribed to the partial block of the porosity by APTES molecules (Table 3). C constant was higher in the functionalized material which indicates a stronger interaction with the adsorbate due to the silanol groups of APTES contribution.
The CO2 experimental adsorption isotherm at 298 K up to 10 bar in the ZnONPs@APTES sample is exposed in Figure 7b, showing a Langmuit type I behavior. The maximum adsorbed amount was 0.277 mmol g-1, slightly higher than the previously reported value for naked ZnONPs (0.240 mmol g-1) [19]. A Langmuir fit is also shown in Figure 7 with maximum adsorbed quantity (qmax) values and the bi parameter, related to the adsorbent-adsorbate interaction, estimated at 0.277 ± 0.001 mmol g-1 and 5.847 ± 0.218 bar-1 respectively. In both cases, regression coefficients (r2) were higher than 0.978, indicating that the Langmuir equation represents the experimental values with good precision. Therefore, only one molecule is adsorbed at each site; sites are energetically homogeneous and there is no interaction between adsorbate molecules (lateral interactions) [32]. CO2 adsorption takes place especially on APTES molecules dispersed on the surface and also explains why CH4 is not adsorbed. The amines groups located on the external surface of the nanoparticles are the energetic active sites where CO2 is adsorbed due to the high affinity of CO2 molecules by these groups. On the other hand, the studied material did not absorb any significant CH4 quantity (it falls within the error of the balance) which could be probably ascribed to the weak interaction of CH4 molecule with amines groups of APTES present at the ZnO nanoparticles after functionalization.
As can be seen, the amount of gas adsorbed on the surface of the nanoparticles is very small compared to the materials traditionally used for this purpose (zeolites, clays and active charcoals) [34,35,36,37,38]. This behavior may be due to the low values of surface area and pore volume obtained by adsorption of N2 at 77 K. To improve these results, the functionalization with ligands capable of increasing the surface areas of the evaluated nanostructures is convenient. In that sense, it would be possible to improve the adsorbate-adsorbent affinity with the incorporation of energy-stronger sites and consequently upgrade the amount adsorbed.
Another explanation related to the adsorption of CO2 and the null adsorption of CH4 by the nanoparticles functionalized with APTES could be the fact that the APTES amino groups (which are responsible for the capture) are selective to CO2. Since the acidic CO2 molecules interact with the basic surface groups, the formation of ammonium carbamate species occurring under anhydrous conditions and ammonium bicarbonate species in the presence of water [39,40]. Therefore, given the activation conditions previously explained, with the subsequent absence of water, the formation of ammonium carbamate would be favored. The advantage of using coatings that have amino groups in their structure is that they could provide selectivity in process of CO2/CH4 separation.
Adsorption of CO2, as well as none CH4 adsorption by the nanostructures functionalized with APTES is related to the fact that the amino groups present in APTES (which are responsible for the capture) are selective for CO2, since the acidic CO2 molecules interact with the basic surface groups. Thus the formation of ammonium carbamate species in anhydrous conditions and ammonium bicarbonate species take place (Figure 8) [39,40]. The advantage of using coatings with amino groups in their structure is providing selectivity to the separation process of these types of gases.
Amino groups have been of great interest in organic functionalization due to their high reactivity and selectivity towards CO2 and other acid gases. The mechanism of this reaction was proposed by M. Caplow 1968 [39] and reintroduced by Danckwertz in 1979 [40], who described the reaction between CO2 and amino groups (primary and secondary) through the formation of an unstable amphoteric salt (zwitterion) followed by deprotonation of the base. The reaction mechanism is defined in two stages:
- Nucleophilic attack of the amino group on the carbon of CO2 and formation of the intermediate zwitterion (R1R2NH+COO-)R1R2NH + CO2 ®R1R2NH+COO- eq.III
- Acceptance of the proton by a base. Under anhydrous conditions, this function is performed by an adjacent amino group (primary or secondary) leading to the formation of the carbamate. (R1R2NCOO-)R1R2NH+COO- + Base (B)®BH+ +R1R2NCOO- eq.IV
The deprotonation of the zwitterion can be favored by the presence of any molecule of a basic nature. Therefore, the maximum CO2/N ratio theoretically achievable is 0.5 in anhydrous conditions (one molecule of CO2 for every two amino groups, active site).
4. Materials and Methods
4.1. Materials
Zinc acetate and oxalic acid were supplied by Merck (Darmstadt, Germany). Ethanol, acetone and nitric acid were purchased from Panreac. APTES was supplied by Fluka AG, Chem. All reagents were used without pretreatment or further purification and were purchased under the categories “pure for synthesis” or “pure for analysis”.
4.2. Synthesis of ZnO Nanoparticles (ZnONPs)
ZnO nanoparticles were prepared by sligthly modifying the method used by Hariharan [20]. 1.09 g of zinc acetate were dissolved in 30 mL of ethanol at 60 °C. The salt was dissolved completely in 10 min. Simultaneously, 1.2600 g of oxalic acid were dissolved in 20 mL of ethanol at 50 °C. The oxalic acid solution was slowly added to the hot ethanolic solution of zinc acetate, maintaining the stirring of the reaction mixture. A white gel was formed, which was dried at 80 °C for 20 h. The xerogel was calcined at 800 °C for 2 h to obtain the ZnO nanostructures [19].
4.3. Synthesis of ZnO Nanoparticles Functionalized with APTES (ZnONPs@APTES)
1.500 g of the previously synthesized ZnONPs were dispersed in 50 mL of distilled water. HNO3 (2 mol L-1) was added dropwise, under magnetic stirring and subsequently NaOH (1 mol L-1) was added until reaching a pH = 6.5. The dispersion was kept under constant stirring for one hour. Subsequently, 1 mL of APTES was added. The pH after the addition was maintained in the range between 8.9 and 9.2. The reaction mixture was left under stirring for 24 h. The particles were filtered and washed with ethanol and acetone. The powder was dried at 60 °C under vacuum.
4.4. Spectroscopic, Morphological and Thermogravimetric Characterization of ZnONPs and ZnONPs@APTES
UV-Vis measurements were performed using an Amershan-Biosciences Ultrospec 2100 pro Spectrophotometer with a Wavescan auxiliary software. For the recording of the spectra, quartz cuvettes with an optical step of 1 cm were used. The sample was dispersed in dimethylsulfoxide (DMSO) with ultrasound during 10 min, prior to the registration of the spectrum.
FT-IR spectra were recorded in a FT-IR WQF-510 spectrophotometer, using pellets in KBr. The FT-IR spectra were registered between 400 and 4000 cm-1.
Thermogravimetric analysis (TGA): The rate of change of the material weight as a function of temperature was continuously recorded when heating the sample in the range between 30 and 800 ºC at a constant sweep speed (5.0 ºC/min). The thermogram was obtained on a NETZSCH STA 409 PC/PG. Aluminum oxide was used as a reference.
X-ray powder diffraction pattern of the sample was taken on a Rigaku diffractometer, Miniflex model, with a Bragg-Brentano geometry using a monochromatic CuKα radiation (λ=1.5408 Å). The monochromator was operated at 35 Kv and 25 mA. The samples were scanned in the range 2θ = 2 - 80°. ZnONPs@APTES XRD data was refined by Rietveld method [41].
An equipment TALOS F200x was employed to analyze the morphology by High-Resolution Transmission Electron Microscopy (HRTEM), also operating in STEM mode (Scanning Transmission Electron Microscopy), and the microanalysis was carried out with an EDX Super-X system provided with 4 X-ray detectors and an X-FEG beam.
XPS studies were carried on a Physical Electronics spectrometer (PHI Versa Probe II Scanning XPS Microprobe, Physical Electronics, Chanhassen, MN, USA) with monochromatic X-ray Al Kα radiation (200 μm, 100 W, 20 kV, 1,486.6 eV) and a dual beam charge neutralizer. XPS spectra were analyzed using PHI SmartSoft software and processed using MultiPak 9.3 package. The binding energy values were referenced to adventitious carbon C 1s signal (284.8 eV).
4.5. N2, CO2 and CH4 Adsorption Experiments
N2 adsorption isotherms were collected at 77 K and P/P0 = 0.01-0.99 using Accelerated Surface Area and Porosimetry system (ASAP 2050 model from Micromeritics). Samples activation was carried out at 250 °C under vacuum for 12 h. Specific surface area of all materials was evaluated using Brunauer-Emmett-Teller (BET) model [33].
The CH4 and CO2 adsorption measurements were carried out on a magnetic suspension balance Rubotherm (Bochum, Germany). The monocomponent isotherms of CH4 and CO2 were carried out at 298 K in the pressure range of 0 - 10 bar. Samples were degassed prior to obtaining the adsorption isotherms at 300 °C for 12 hours using a heating ramp of 2 °C min-1 until the final temperature.
The equilibrium data determination consists of exposing the sample to successive increases in pressure after the degassing stage, in which the mass variations are quantified in relation to the pressure, until the equilibrium is reached. The equilibrium condition established was for a mass variation lower than 0.1 mg for 30 min. From the recorded mass variation, the amount of gas adsorbed can be calculated using the eq. I.
Where ∆m is the mass variation, mex is the amount of gas adsorbed in excess and [(VB + VS) . ρg] is the buoyancy effect, where VB is the volume of balance components, VS is the volume of the sample solid and ρg is the adsorbate density [42].
The adjustment of the CO2 isotherms was made using the non-linear Langmuir model according to the eq. II.
Where qmax is the amount adsorbed at infinite pressure or the amount adsorbed at saturation (mmol g-1) and bi is related to the adsorbent-adsorbate affinity (bar-1).
5. Conclusions
The ZnONPs@APTES material was obtained in two steps: ZnONPs were synthesized from precipitation by hydrolysis of zinc acetate, which were functionalized with APTES in a second step. The obtained ZnONPs@APTES nanostructures were characterized by UV-Vis, FT-IR spectroscopy, TGA, XRD, TEM/EDX, XPS and N2 adsorption at 77 K. The grafting of APTES on ZnO nanoparticles is clearly evidenced by XPS. The adsorption isotherm of CO2 at 298 K was obtained up to 10 bar, showing a maximum adsorbed amount of 0.28 mmol g-1. No significant quantity of methane adsorption was obtained, probably due to the fact that the APTES amino groups are more selective to CO2 molecule.
Author Contributions
Conceptualization, Alicia Díaz-García and Giselle I. Autié-Castro; methodology, Alicia Díaz-García, Giselle I. Autié-Castro, Enrique Vilarrasa-García and Daniel Ballesteros-Plata; software, Luis A. Montejo-Mesa, Enrique Vilarrasa-García, Enrique Rodríguez-Castellón and Daniel Ballesteros-Plata; validation, Alicia Díaz-García, Giselle I. Autié-Castro, Celio L. Cavalcante Jr. and Enrique Rodríguez-Castellón; supervision, Alicia Díaz-García, Giselle I. Autié-Castro and Enrique Rodríguez-Castellón; formal analysis, Luis A. Montejo-Mesa, Enrique Vilarrasa-García and Daniel Ballesteros-Plata; investigation, Luis A. Montejo-Mesa, Alicia Díaz-García and Giselle I. Autié-Castro; resources, Enrique Rodríguez-Castellón and Celio L. Cavalcante Jr.; data curation, Luis A. Montejo-Mesa, Enrique Vilarrasa-García, Daniel Ballesteros-Plata and Enrique Rodríguez-Castellón; writing—original draft preparation, Luis A. Montejo-Mesa, Alicia Díaz-García and Giselle I. Autié-Castro; writing—review and editing Alicia Díaz-García, Giselle I. Autié-Castro, Enrique Rodríguez-Castellón and Daniel Ballesteros-Plata; visualization, Enrique Rodríguez-Castellón; supervision, Alicia Díaz-García and Giselle I. Autié-Castro; project administration, Enrique Rodríguez-Castellón and Celio L. Cavalcante Jr.; funding acquisition, Enrique Rodríguez-Castellón and Celio L. Cavalcante Jr.
Funding
Spanish Ministry of Science and Innovation, project PID2021-126235OB-C32 funded by MCIN/AEIMCIN/ AEI/10.13039/501100011033/ and FEDER funds, and project TED2021-130756B-C31 funded by MCIN/AEI/10.13039/501100011033 and by “ERDF A way of making Europe”. Project PN223LH010-062 from “Ministerio de Ciencia Tecnología y Medio Ambiente (Cuba), Programa de Ciencias Básicas y Naturales”. Project PN223LH010-062 from University Foundation of the University of Havana.
Institutional Review Board Statement
Not applicable.
Informed Consent Statement
Not applicable.
Data Availability Statement
Not applicable.
Acknowledgments
G.E.A., E.R.C. and D.B.P thank to Spanish Ministry of Science and Innovation, project PID2021-126235OB-C32 funded by MCIN/AEIMCIN/ AEI/10.13039/501100011033/ and FEDER funds, and project TED2021-130756B-C31 funded by MCIN/AEI/10.13039/501100011033 and by “ERDF A way of making Europe”. This work was also supported by the project PN223LH010-062 from “Ministerio de Ciencia Tecnología y Medio Ambiente (Cuba), Programa de Ciencias Básicas y Naturales”. We thank to the University Foundation of the University of Havana for helping to manage the project PN223LH010-062. Thanks to UNESCO/Keizo Obuchi Research Fellowships Programme (UNESCO/Japan Young Researcher’s Fellowship Programe), Cycle 2012. Dr. Giselle Autié Castro thanks to CNPq-TWAS Postdoctoral Fellowship 2014. The authors also acknowledge Dr. Edilso Reguera from the Center for Applied Science and Advanced Technology of IPN, Legaria Unit, Mexico for the access to their experimental facilities.
Conflicts of Interest
The authors declare that they have no known competing financial interests or personal relationships that could have appeared to influence the work reported in this paper.
References
- Ding, M.; Guo, Z.; Zhou, L.; Fang, X.; Zhang, L.; Zeng, L.; Xie, L.; Zhao, H. One-Dimensional Zinc Oxide Nanomaterials for Application in High-Performance Advanced Optoelectronic Devices. Crystals, 8: 223 (2018). [CrossRef]
- Saleem S., Jameel M. H. , Rehman A. , Tahir M. B., Irshad M. I., Jiang Z.-Y., Malik R.Q., Hussain A. A. , Rehman A., Jabbar A. H., Alzahrani A. Y., Salem M. A., Hessien M.M., Evaluation of structural, morphological, optical, and electrical properties of zinc oxide semiconductor nanoparticles with microwave plasma treatment for electronic device applications, Journal of Materials Research and Technology, 19: 2126-2134 (2022). [CrossRef]
- Jian J.-C., Chang Y.-C., Chang S.-P., Chang S.-J., Biotemplate-Assisted Growth of ZnO in Gas Sensors for ppb-Level NO2 Detection, ACS Omega 9 (1): 1077-1083 (2024). [CrossRef]
- Jian J.-C., Chang Y.-C., Chang S.-P., Chang S.-J., Biotemplate-Assisted Growth of ZnO in Gas Sensors for ppb-Level NO2 Detection, ACS Omega 9 (1): 1077-1083 (2024). [CrossRef]
- Xia, Y., Pan, A., Su, Y. Q., Zhao, S., Li, Z., Davey, A. K., Zhao, L., Maboudian, R., & Carraro, C.. In-situ synthesized N-doped ZnO for enhanced CO 2 sensing: Experiments and DFT calculations. Sensors and Actuators, B: Chemical, 357: 131359 (2022). [CrossRef]
- Deng, Y. Semiconducting Metal Oxides: Microstructure and Sensing Performance. In: Semiconducting Metal Oxides for Gas Sensing. Springer, Singapore. 271–297 (2023). [CrossRef]
- Zhang S., Li H., Zhang N., Zhao X., Zhang Z., Wang Yan, Self-sacrificial templated formation of ZnO with decoration of catalysts for regulating CO and CH4 sensitive detection, Sensors and Actuators B: Chemical, 330: 129286 (2021). [CrossRef]
- Sangchap M., Hashtroudi H., Thathsara T., HarrisonC. J., Kingshott P., Kandjani A. E., Trinchi A., Shafiei M., Exploring the promise of one-dimensional nanostructures: A review of hydrogen gas sensors, International Journal of Hydrogen Energy, 50 (A): 1443-1457 (2024). [CrossRef]
- Chen X., Bagnall D., Nasiri N., Capillary-Driven Self-Assembled Microclusters for Highly Performing UV Photodetectors. Adv. Funct. Mater. 33: 2302808. (2023). [CrossRef]
- Alba-Cabañas J. , Rodríguez-Martínez Y. , Vaillant-Roca L. , Effects on the ZnO nanorods array of a seeding process made under a static electric field, Materials Today Communications 39: 108917 (2024). [CrossRef]
- Crapanzano, R.; Villa, I.; Mostoni, S.; D’Arienzo, M.; Di Credico, B.; Fasoli, M.; Scotti, R.; Vedda, A. Morphology Related Defectiveness in ZnO Luminescence: From Bulk to Nano-Size. Nanomaterials 10: 1983 (2020). [CrossRef]
- Güell F., Galdámez-Martínez A., Martínez-Alanis P., Catto A. C., da Silva L. F., Mastelaro V. R., Santana G., Dutt A. ZnO-based nanomaterials approach for photocatalytic and sensing applications: recent progress and trends Mater. Adv., 4: 3685-3707 (2023). [CrossRef]
- Motelica, L.; Vasile, B.-S.; Ficai, A.; Surdu, A.-V.; Ficai, D.; Oprea, O.-C.; Andronescu, E.; Mustățea, G.; Ungureanu, E.L.; Dobre, A.A. Antibacterial Activity of Zinc Oxide Nanoparticles Loaded with Essential Oils. Pharmaceutics , 15: 2470 (2023). [CrossRef]
- Kim I., Viswanathan K., Kasi G., Sadeghi K., Thanakkasaranee S., Seo J., Preparation and characterization of positively surface charged zinc oxide nanoparticles against bacterial pathogens, Microbial Pathogenesis, 149: 104290 (2020). [CrossRef]
- Najafi A. M., Soltanali S., Khorashe F., Ghassabzadeh H., Effect of binder on CO2, CH4, and N2 adsorption behavior, structural properties, and diffusion coefficients on extruded zeolite 13X, Chemosphere, 324: 138275 (2023). [CrossRef]
- Chang Y., Yao Ya., Wang L., Zhang Kun, High-Pressure adsorption of supercritical methane and carbon dioxide on Coal: Analysis of adsorbed phase density, Chemical Engineering Journal, 487: 150483 (2024). [CrossRef]
- Jiang C., Wang X., Lu K., Jiang W., Xu Huakai., Wei X., Wang Z., Ouyang Y., Dai F., From layered structure to 8-fold interpenetrated MOF with enhanced selective adsorption of C2H2/CH4 and CO2/CH4, Journal of Solid State Chemistry, 307:122881 (2022). [CrossRef]
- Gordijo J. S. , Rodrigues N. M., Martins J. B. L. , CO2 and CO Capture on the ZnO Surface: A GCMC and Electronic Structure Study, ACS Omega 8 (49): 46830–46840 (2023). [CrossRef]
- Montejo-Mesa, L. A., Autié-Castro, G. I. & Cavalcante, C. C. L. Evaluation of Zinc Oxide nanoparticles for separation of CH4-CO2. Rev. Cub. Quím. 30, 119–130 (2018). ISSN 2224-5421 http://scielo.sld.cu/scielo.php?pid=S2224-54212018000100010&script=sci_abstract&tlng=en.
- Hariharan, C. Photocatalytic degradation of organic contaminants in water by ZnO nanoparticles : Revisited. Applied Catalysis A: General 304, 55–61 (2006). [CrossRef]
- Erhart, P., Albe, K. & Klein, A. First-principles study of intrinsic point defects in ZnO : Role of band structure , volume relaxation , and finite-size effects. Physical Review B 73: 1–9 (2006). [CrossRef]
- Segets, D., Gradl, J., Taylor, R. K., Vassilev, V. & Peukert, W. Analysis of Optical Absorbance Spectra for the Determination of ZnO. ACS Nano 3: 1703–1710 (2009). [CrossRef]
- Viswanatha, R. et al. Understanding the quantum size effects in ZnO nanocrystals. J Matter Chem 14: 661–668 (2004). [CrossRef]
- Arya S., Mahajan P., Mahajan S., Khosla A., Datt R., Gupta V., Young S.-J., Oruganti S. K. Review—Influence of Processing Parameters to Control Morphology and Optical Properties of Sol-Gel Synthesized ZnO NanoparticlesECS J. Solid State Sci. Technol. 10: 023002 (2021). [CrossRef]
- Roslan A. A., Zaine S. N. A., Zaid H. M., Umar M., Beh H. G., Nanofluids stability on amino-silane and polymers coating titanium dioxide and zinc oxide nanoparticles, Engineering Science and Technology, an International Journal, 37: 101318 (2023). [CrossRef]
- PDF-2 File. JCPDS International Center for Diffraction Data, 1601 Park Lane, Swarthmore, PA.
- Raha S., Ahmaruzzaman Md., ZnO nanostructured materials and their potential applications: progress, challenges and perspectives, Nanoscale Adv., 4: 1868-1925 (2022). [CrossRef]
- Mahdavi Reza, Talesh S. S. A., Effects of amine (APTES) and thiol (MPTMS) silanes-functionalized ZnO NPs on the structural, morphological and, selective sonophotocatalysis of mixed pollutants: Box–Behnken design (BBD), J. Alloys Compd., 896: 163121 (2022). [CrossRef]
- Rao, X., Abou, A., Cédric, H., Mengxue, G. & Stephanie, Z. Plasma Polymer Layers with Primary Amino Groups for Immobilization of Nano - and Microparticles. Plasma Chem. Plasma Process. 40: 589–606 (2020). [CrossRef]
- Min, H., Gross, T., Lippitz, A., Dietrich, P. & Unger, W. E. S. Ambient-ageing processes in amine self-assembled monolayers on microarray slides as studied by ToF-SIMS with principal component analysis , XPS , and NEXAFS spectroscopy. Anal Bioanal Chem 403, 613–623 (2012). [CrossRef]
- Casula, G., Fantauzzi, M., Elsener, B. & Rossi, A. XPS and ARXPS for Characterizing Multilayers of Silanes on Gold Surfaces. Coatings 14, 327–345 (2024). [CrossRef]
- Thommes, M. et al. Physisorption of gases , with special reference to the evaluation of surface area and pore size distribution ( IUPAC Technical Report ). Pure Appl Chem 87, 1051–1069 (2015). [CrossRef]
- Brunauer, S., Emmett, P. H. & Teller, E. Adsorption of Gases in Multimolecular Layers. Journal of the American Chemical Society 60, 309–319 (1938). [CrossRef]
- Siriwardane, R. V et al. Adsorption of CO2 on Zeolites at Moderate Temperatures. Energy & Fuels 19, 1153–1159 (2005). [CrossRef]
- Arencibia, A., Pizarro, P., Sanz, R. & Serrano, D. P. CO2 adsorption on amine-functionalized clays. Microporous and Mesoporous Materials 282, 38–47 (2019). [CrossRef]
- Ozdemir, E. & Schroeder, K. Effect of Moisture on Adsorption Isotherms and Adsorption Capacities of CO2 on Coals. Energy & Fuels 23, 2821–2831 (2009). [CrossRef]
- Vilarrasa-García E., Cecilia J.A., Santos S.M.L., Cavalcante C.L., Jiménez-Jiménez J., Azevedo D.C.S., Rodríguez-Castellón E. CO2 adsorption on APTES functionalized mesocellular foams obtained from mesoporous silicas. Microporous and Mesoporous Materials 187, 125–134 (2014). [CrossRef]
- E. Vilarrasa-García, J. A. Cecilia, M. Bastos-Neto, C. L. Cavalcante Jr., D. C. S. Azevedo, E. R.-C. CO2/CH4 adsorption separation process using pore expanded mesoporous silicas functionalizated by APTES grafting. Adsorption 565–575 (2015). [CrossRef]
- Caplow, M. Kinetics of Carbamate Formation and Breakdown. J. Am. Chem. Socm Chem. Soc, 89, 6795–6803 (1968). [CrossRef]
- Danckwerts P.V. The reaction of CO2 with ethanolamines. Chem. Eng. Sci., 34: 443–446 (1979). [CrossRef]
- Rietveld, H. M. A profile refinement method for nuclear and magnetic structures. J Appl Cryst 2, 65–71 (1969). [CrossRef]
- Dreisbach, F., Staudt, R. & Keller, J. U. High Pressure Adsorption Data of Methane , Nitrogen , Carbon Dioxide and their Binary and Ternary Mixtures on Activated Carbon. 227, 215–227 (1999). [CrossRef]
Figure 1.
UV-Vis absorption spectrum (a) and FTIR (b) of ZnO and ZnO@APTES nanostructures.
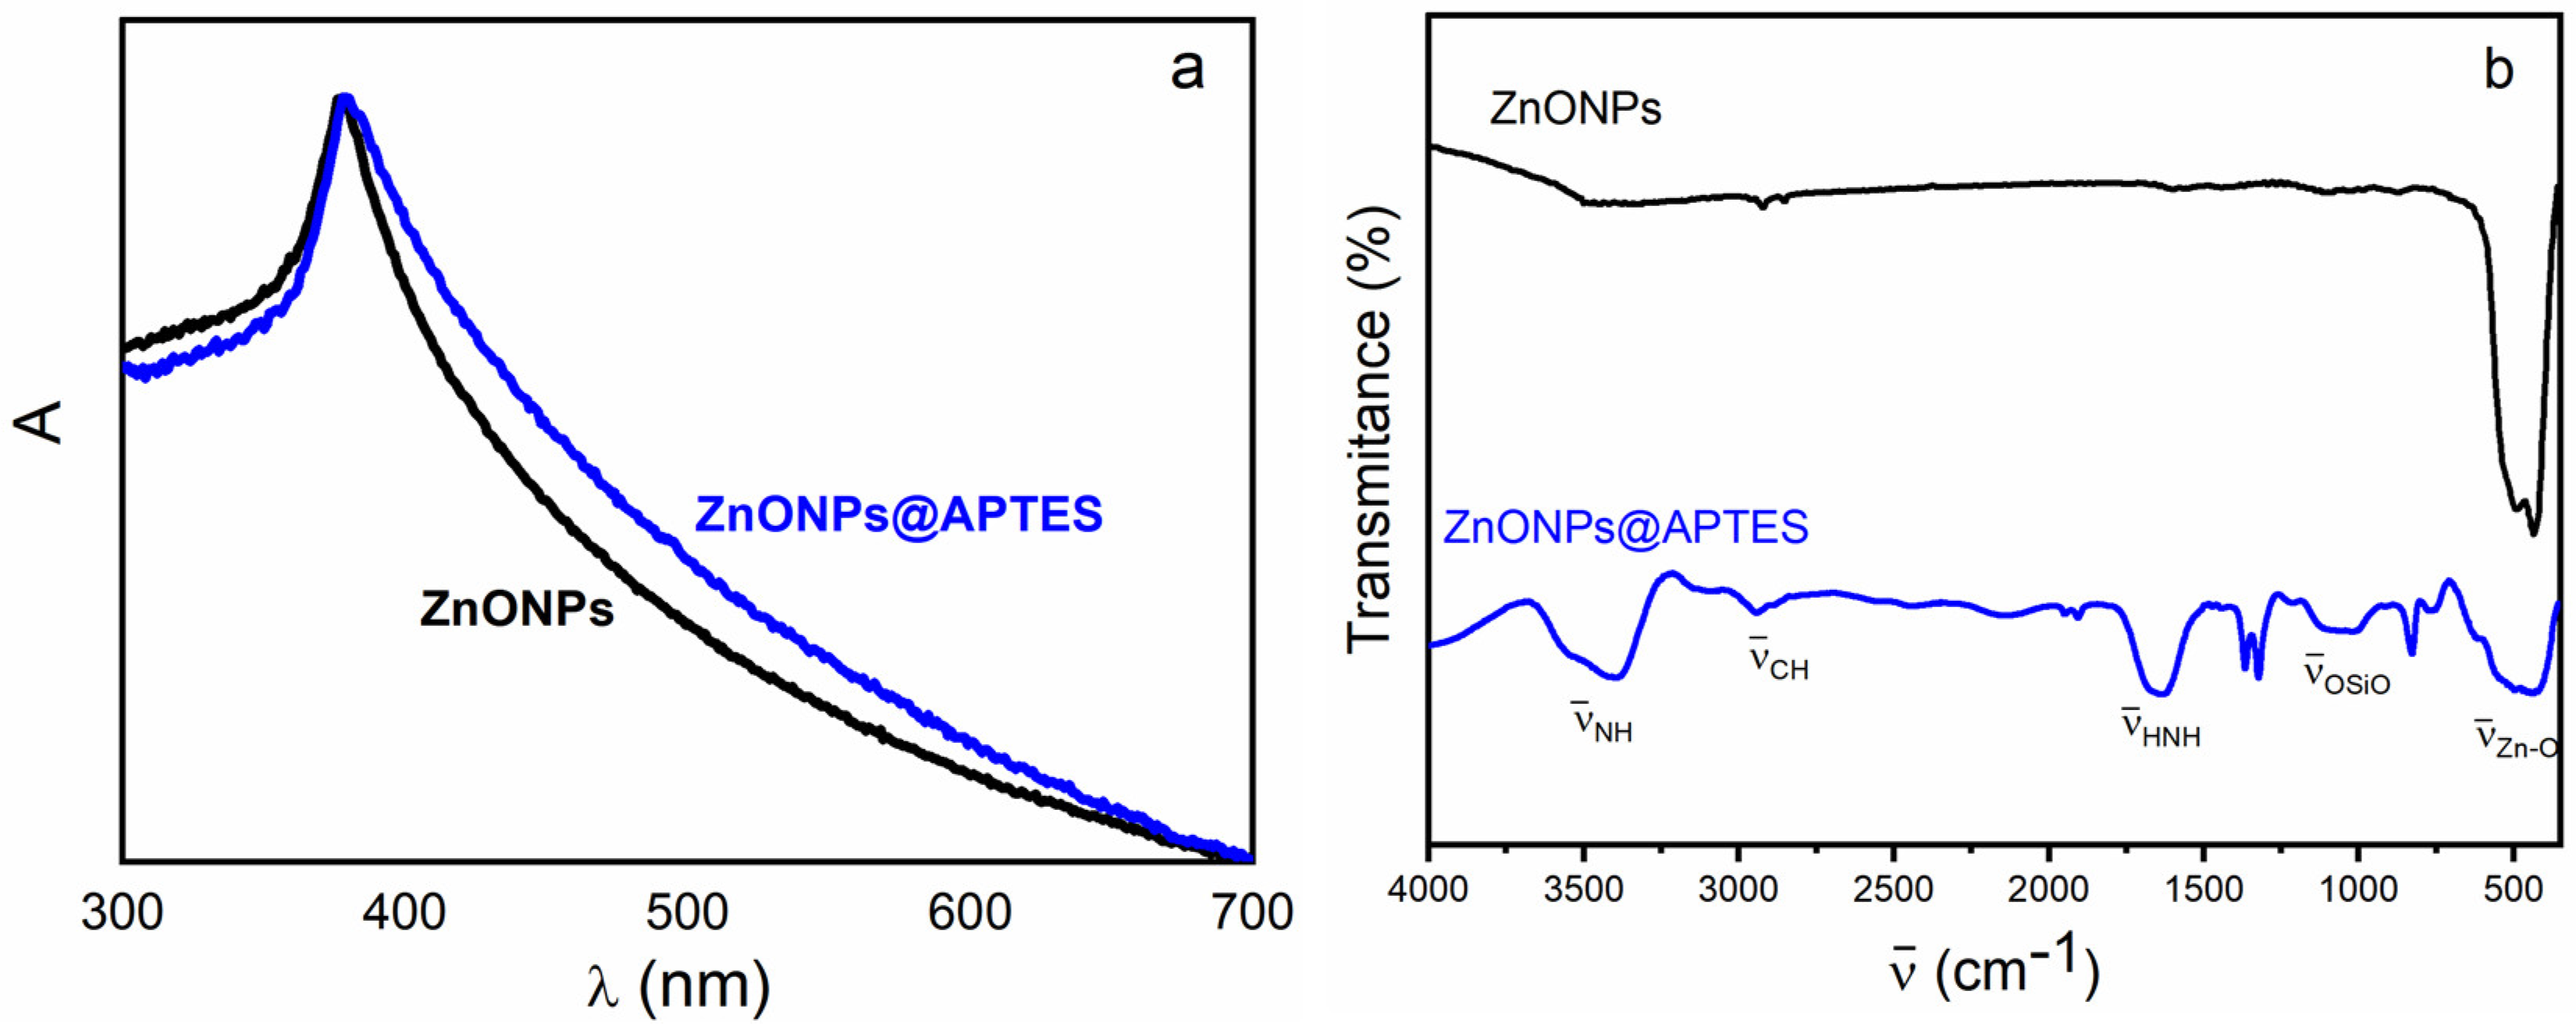
Figure 2.
Thermogravimetric curves of ZnONPs and ZnONP@APTES nanostructures.
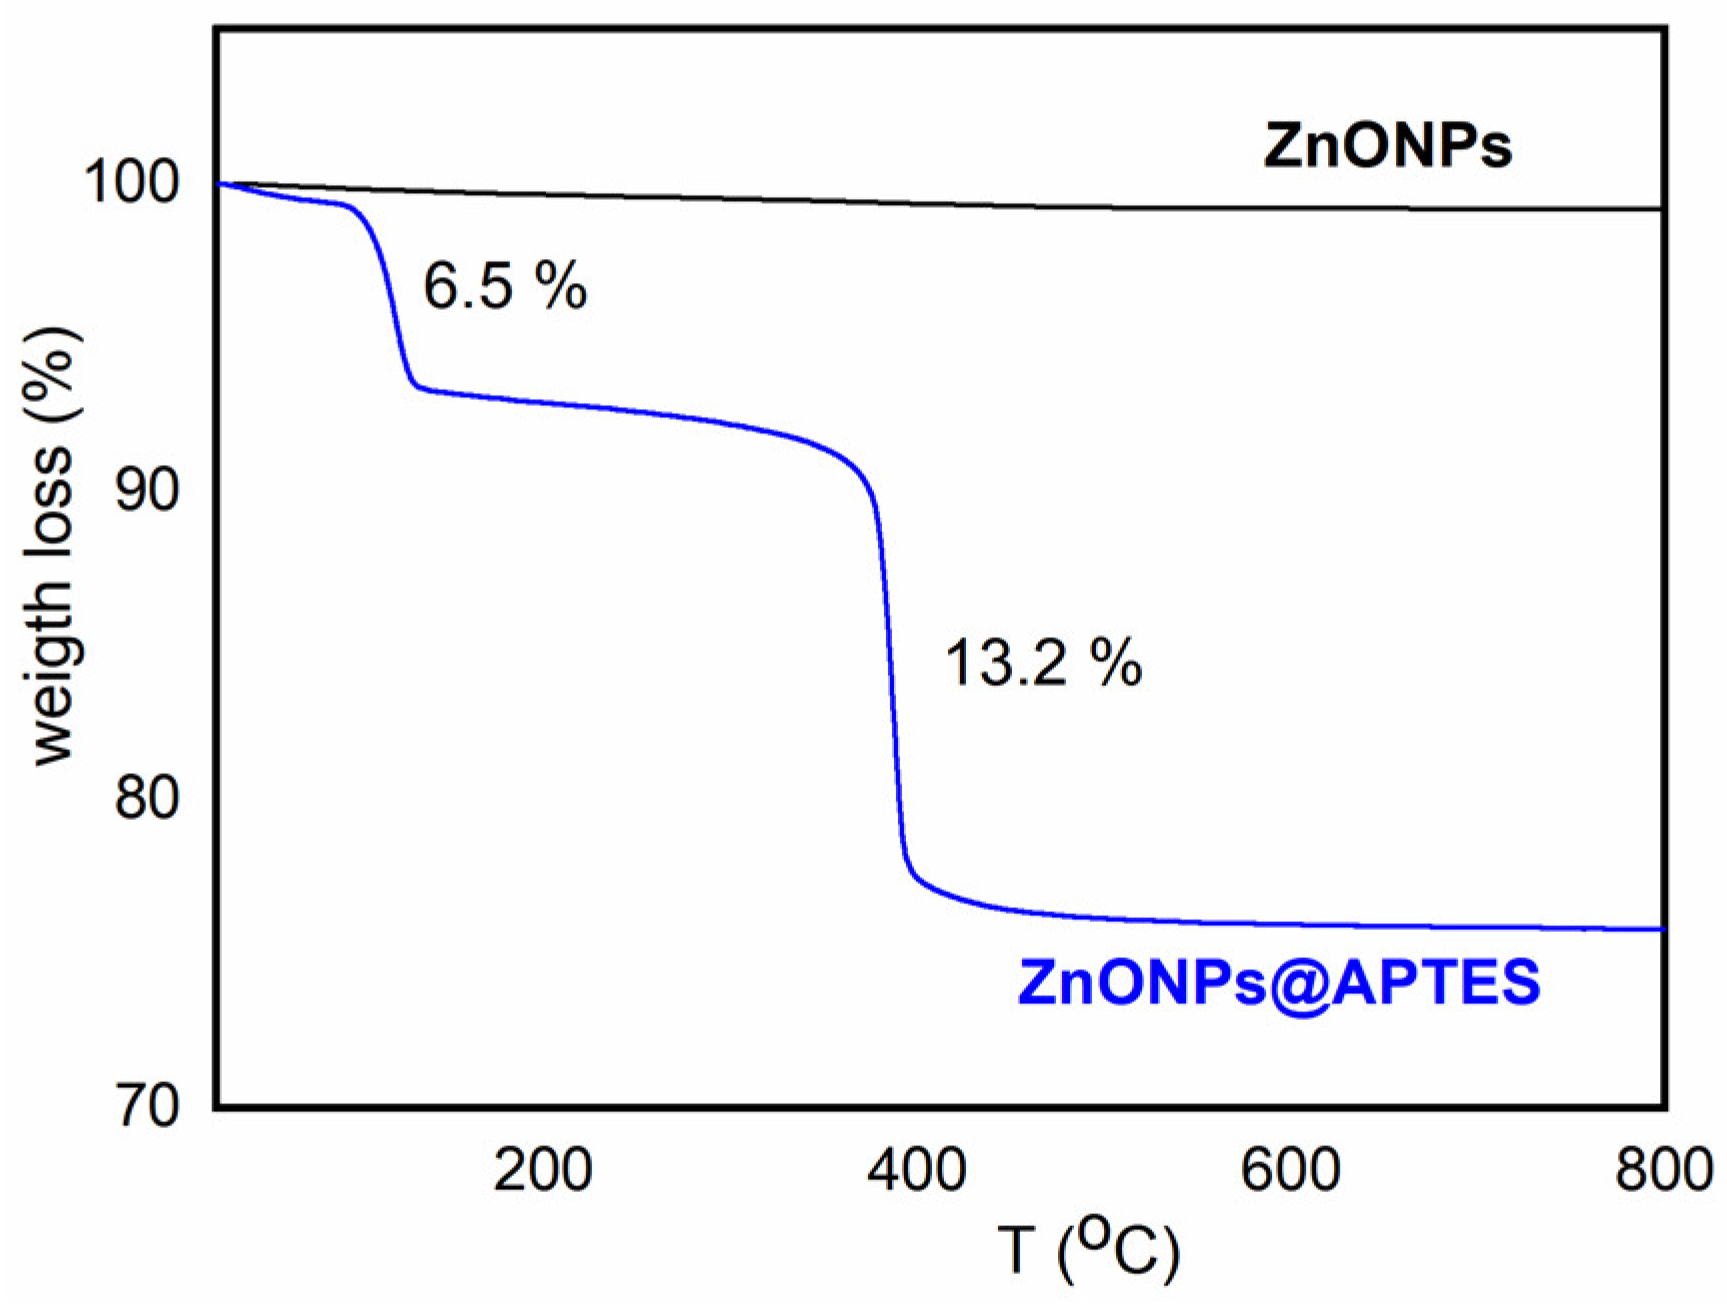
Figure 3.
Diffraction patterns of ZnONPs and ZnONPs@APTES nanostructures.
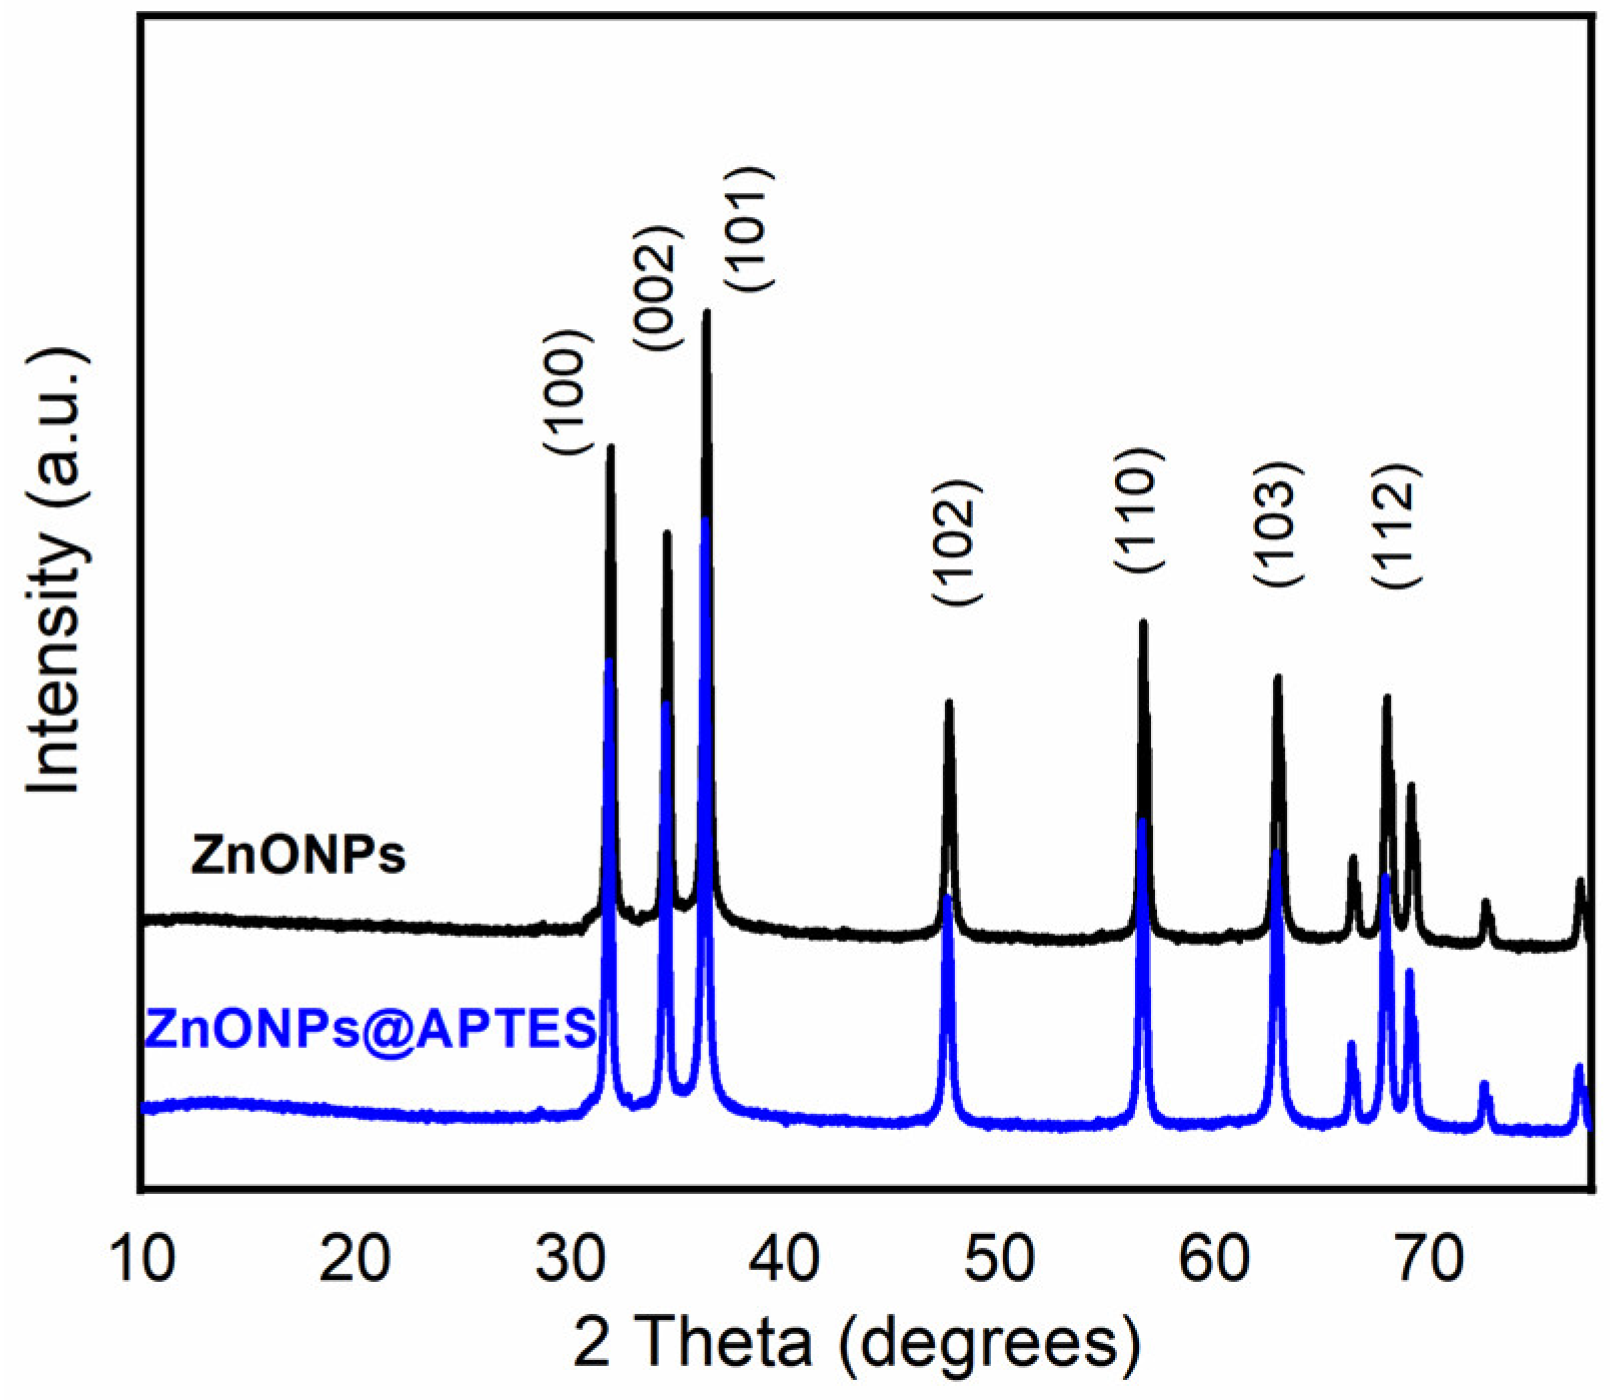
Figure 4.
HRTEM images of ZnONPs and ZnONPs@APTES.
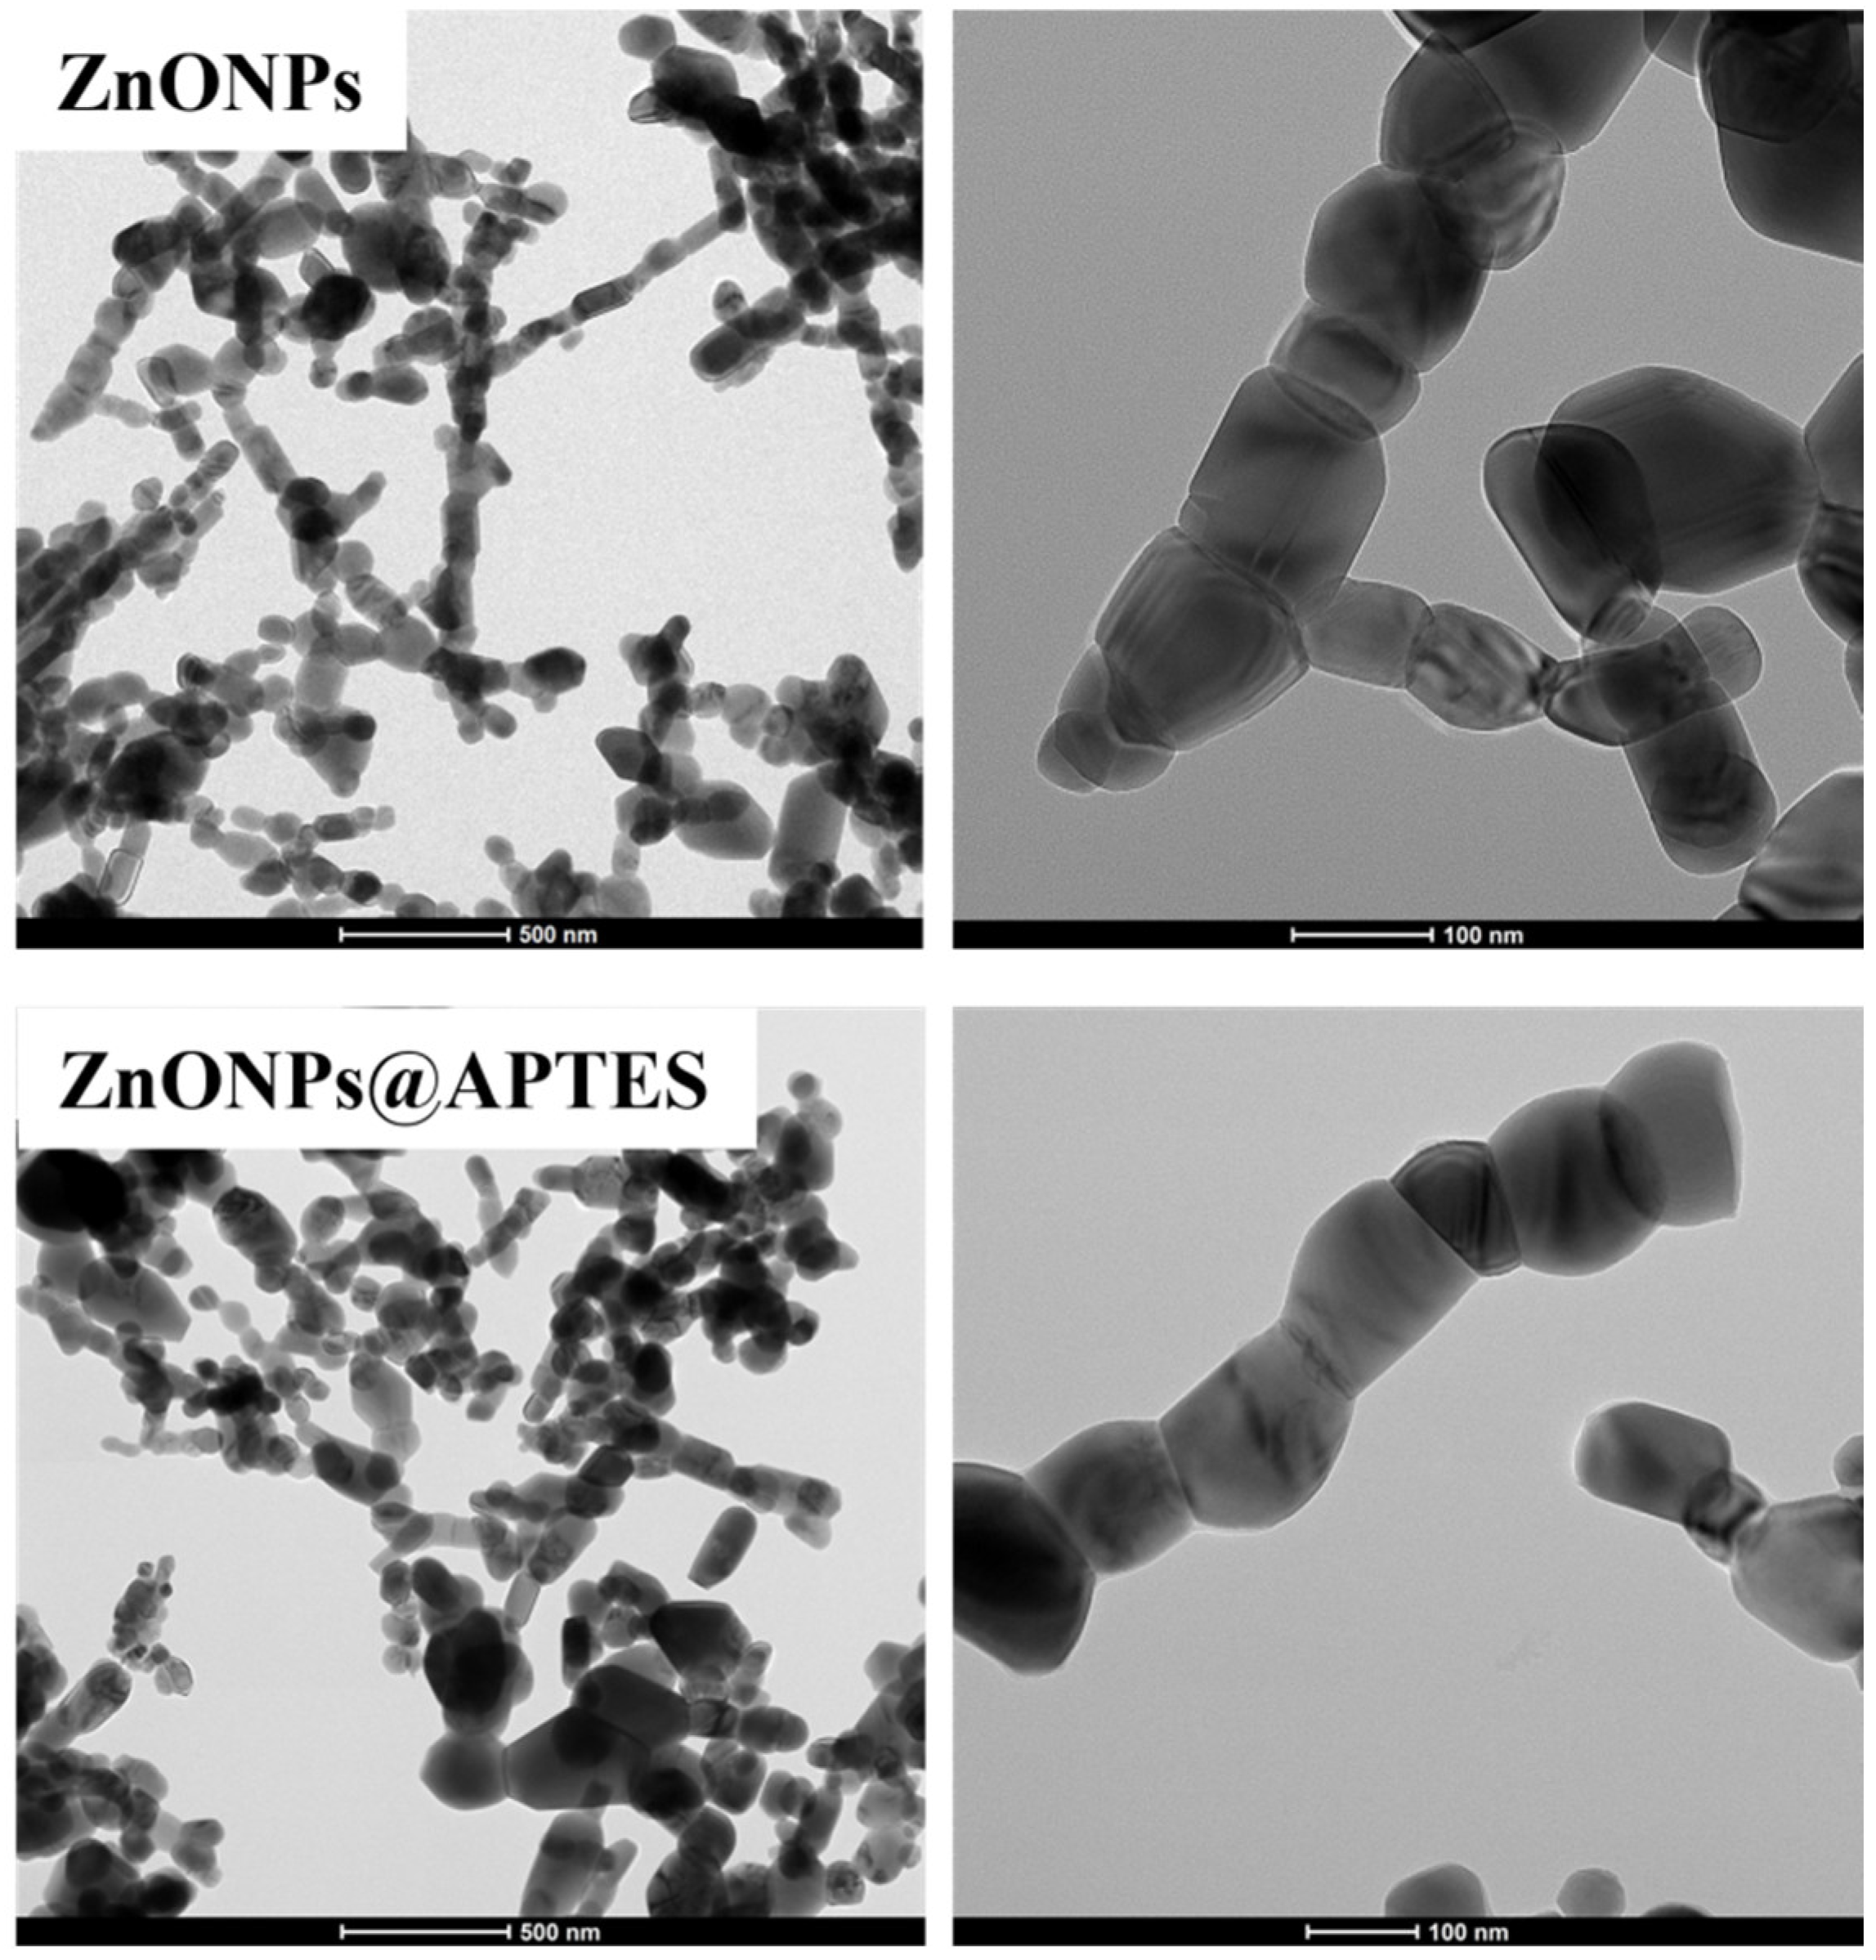
Figure 5.
Elemental mapping of ZnONPs and ZnONPs@APTES.
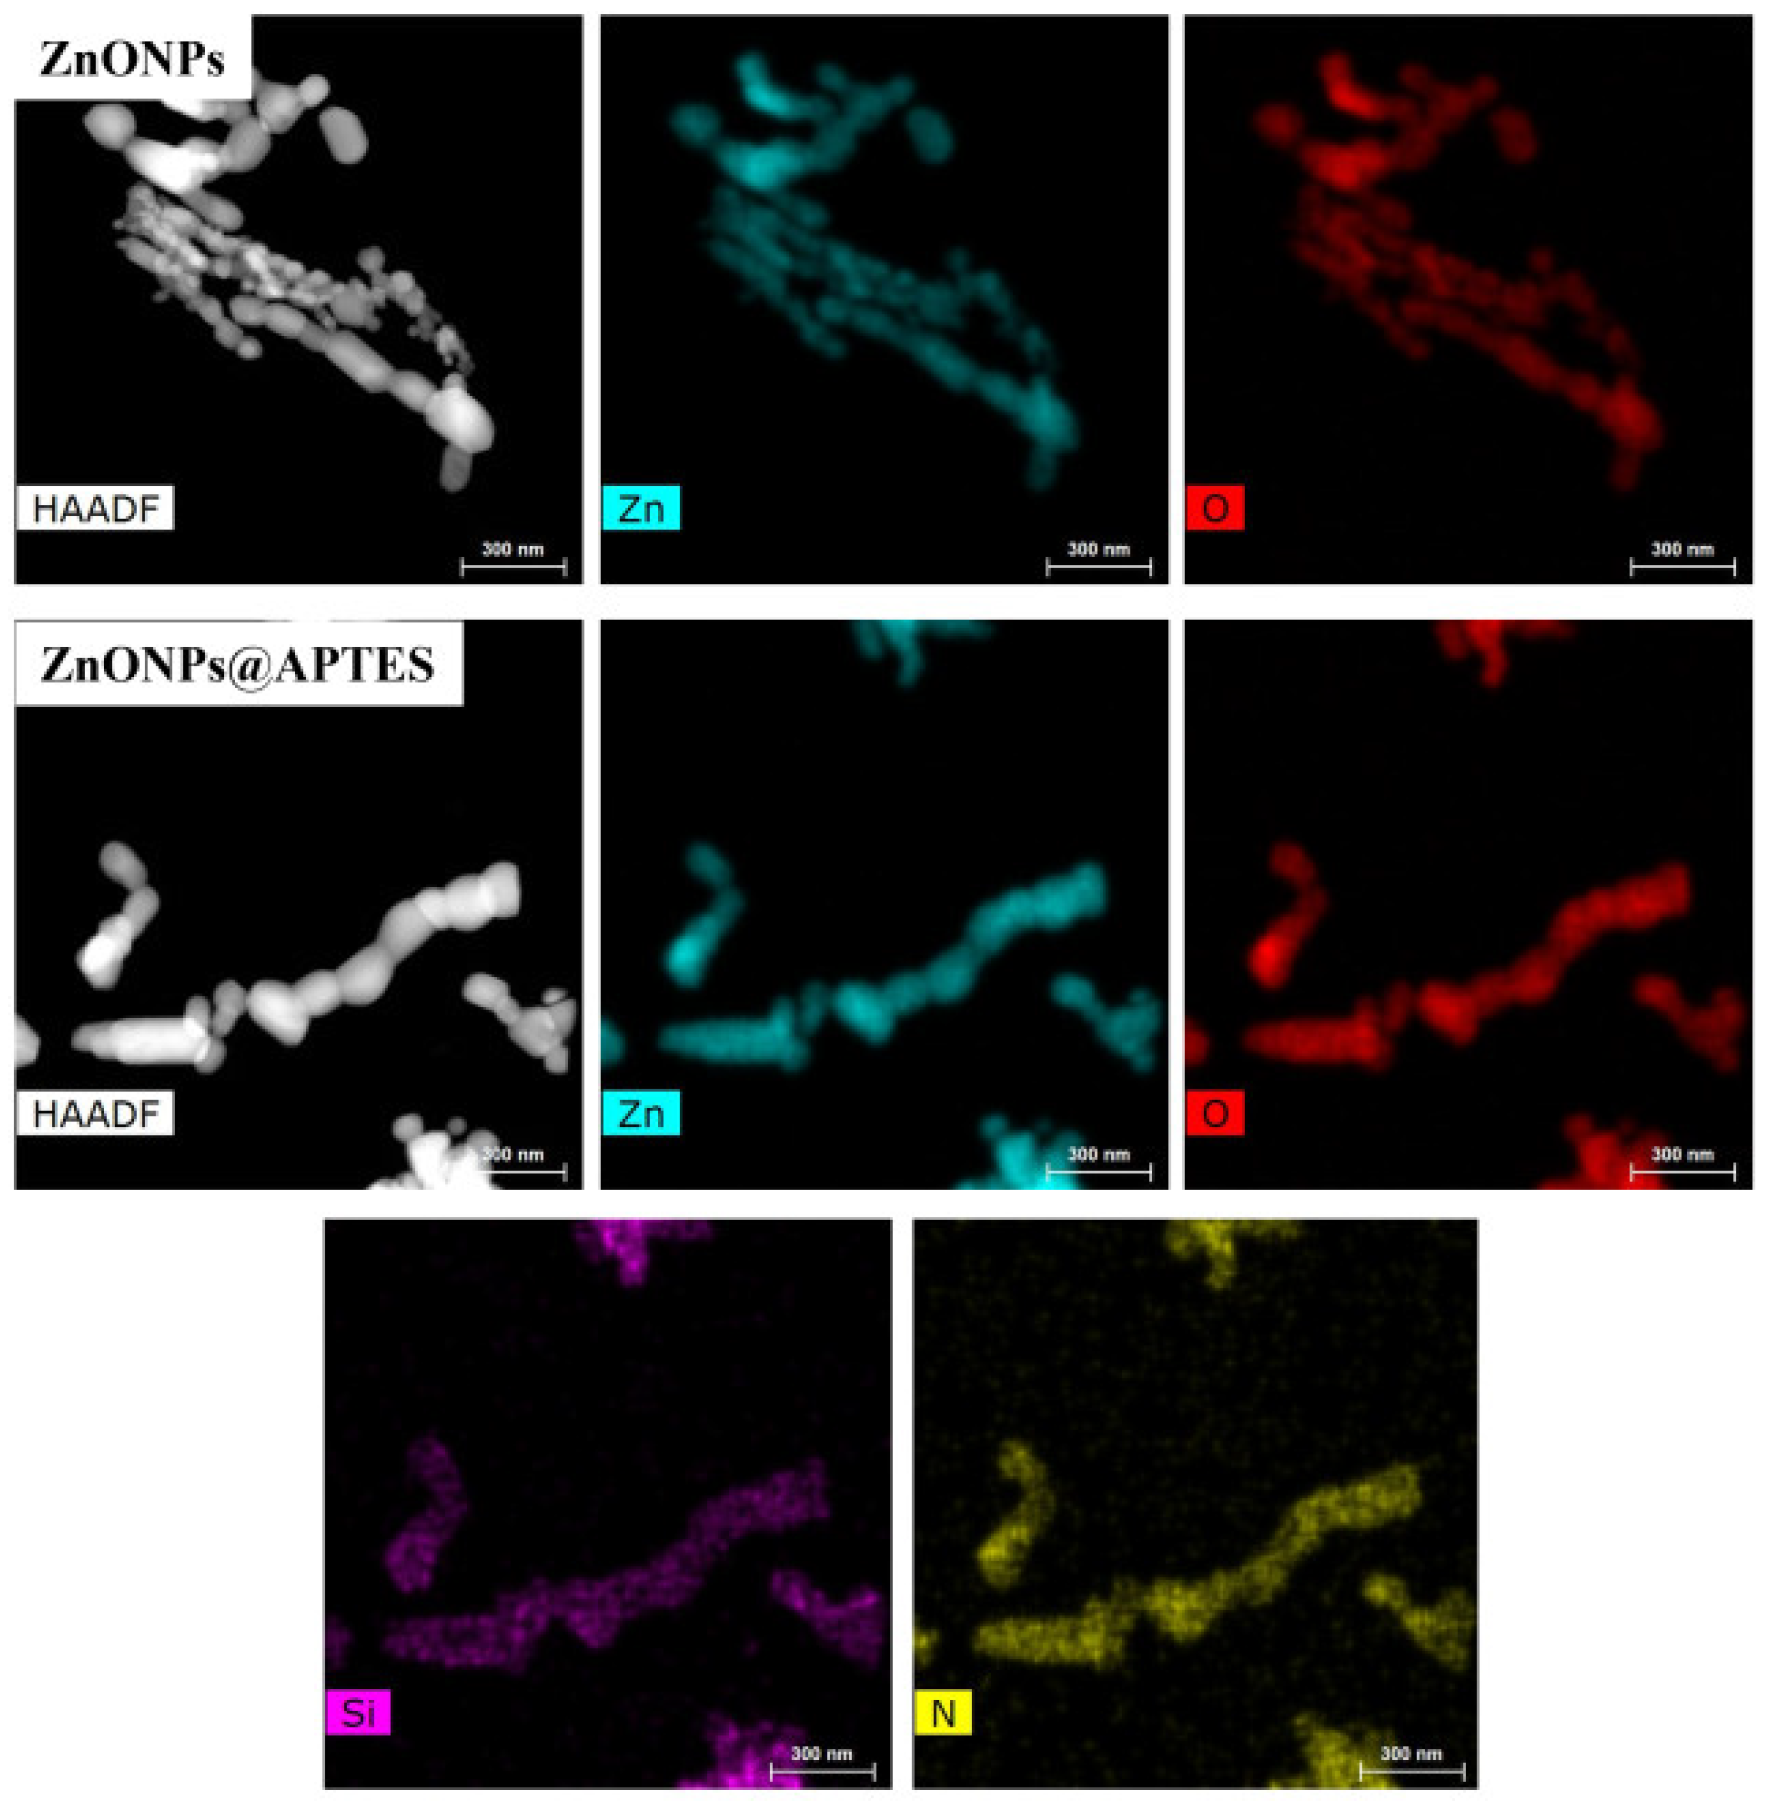
Figure 6.
C 1s (a), O 1s (b), Zn 2p3/2 (c) and N 1s (d) core level spectra of the studied samples.
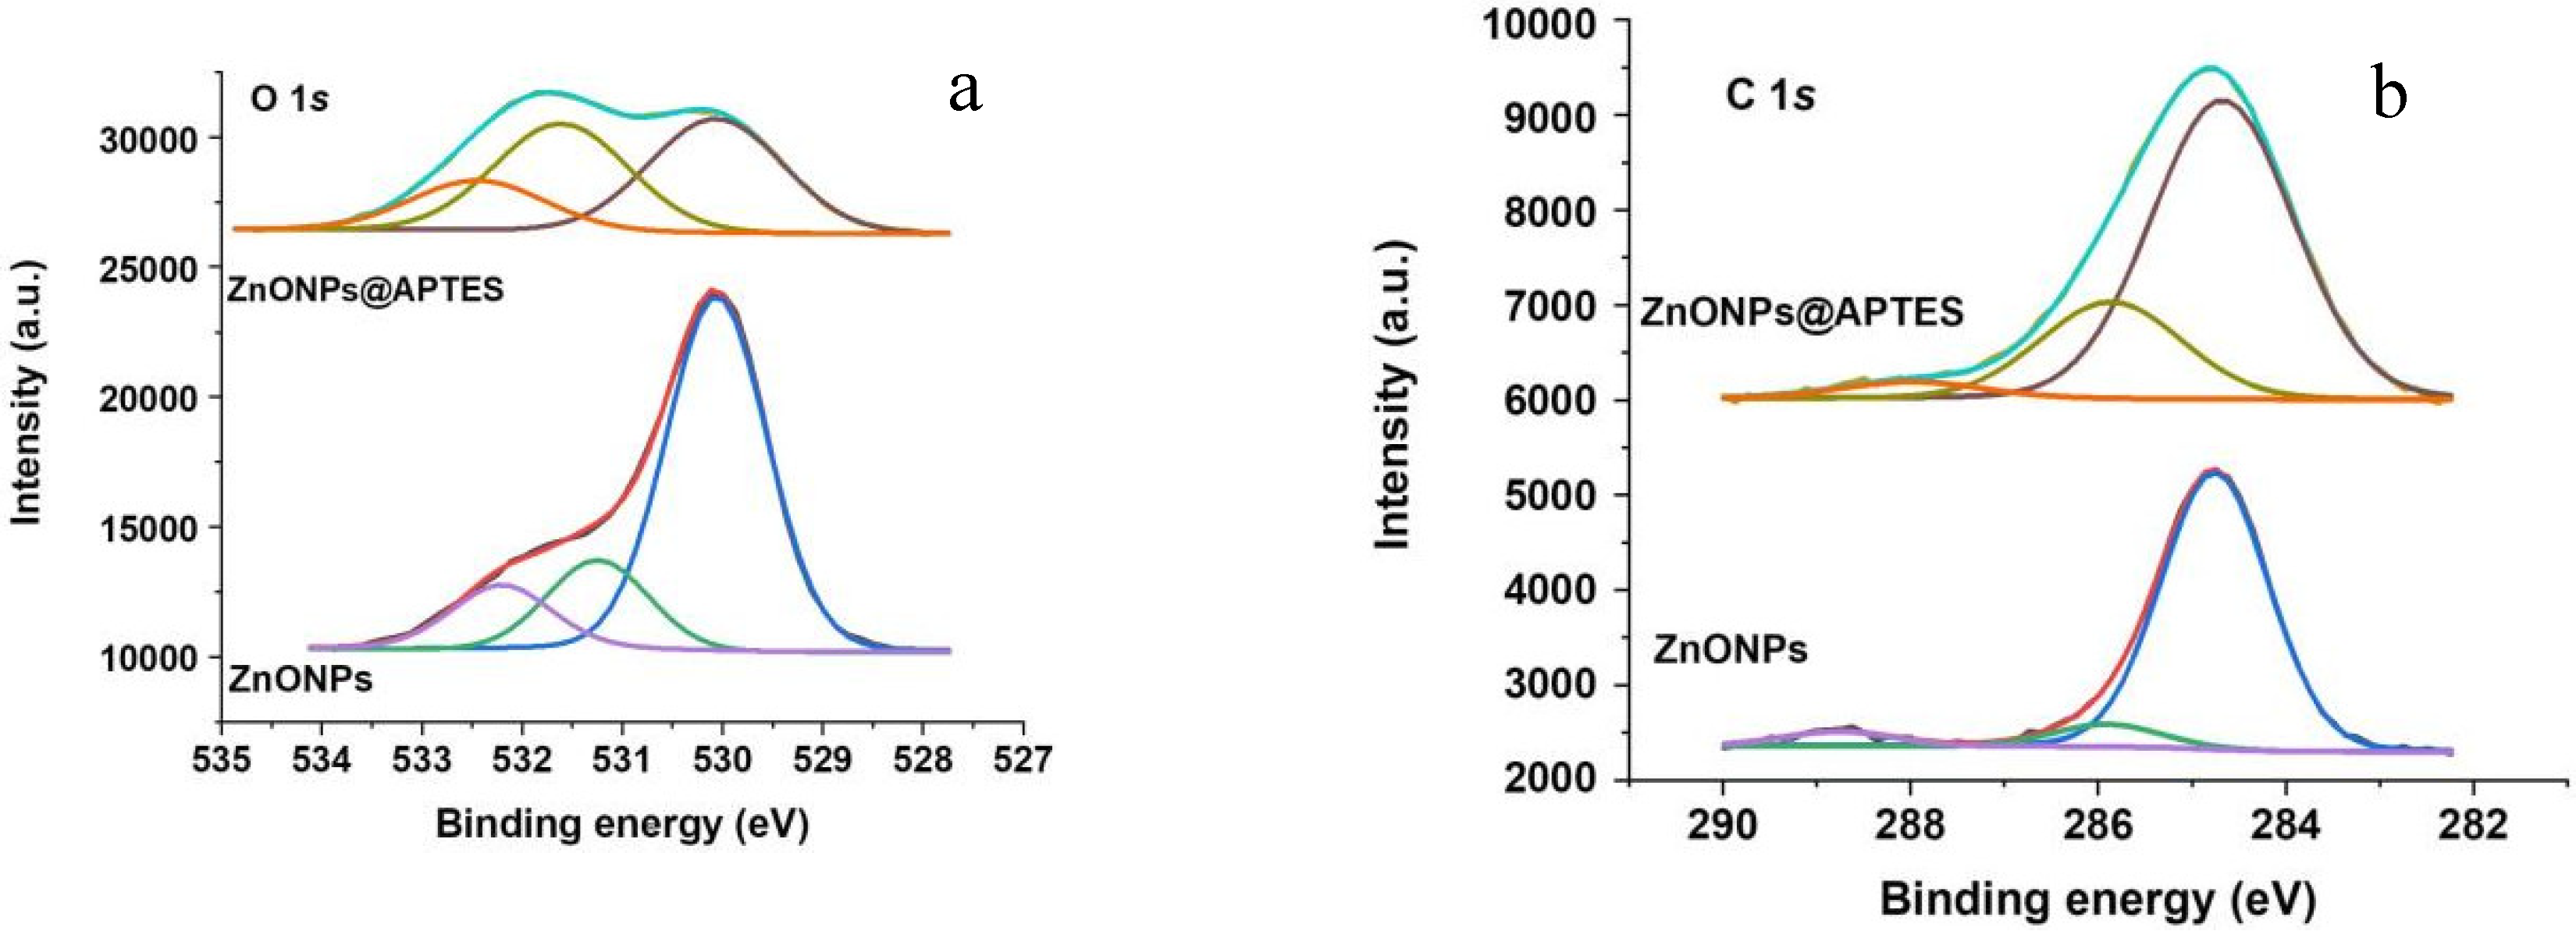
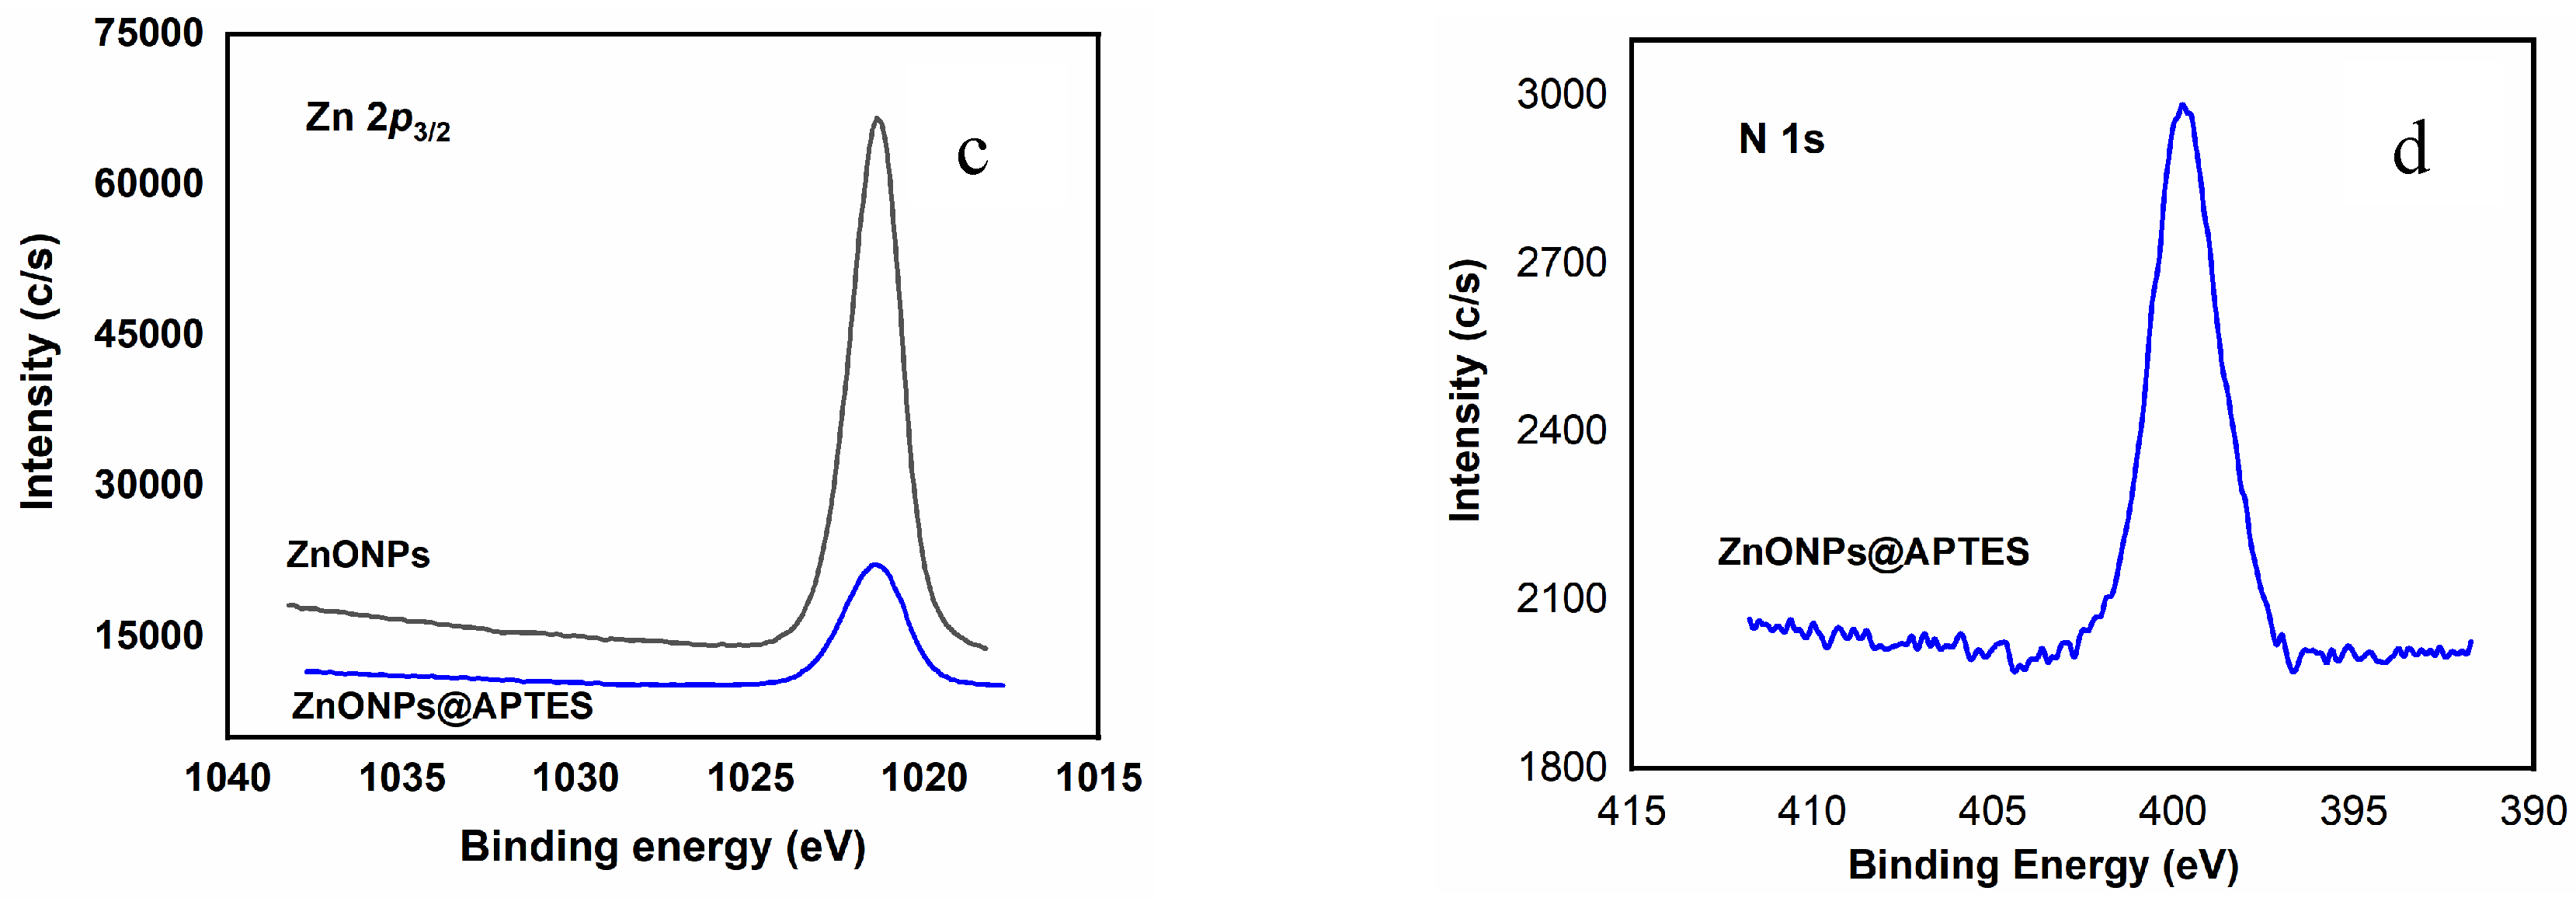
Figure 7.
Adsorption isotherms of N2 at 77 K (a) and adsorption isotherm of CO2 at 298 K up to 10 bar (b) in the ZnONPs@APTES sample.
Figure 7.
Adsorption isotherms of N2 at 77 K (a) and adsorption isotherm of CO2 at 298 K up to 10 bar (b) in the ZnONPs@APTES sample.
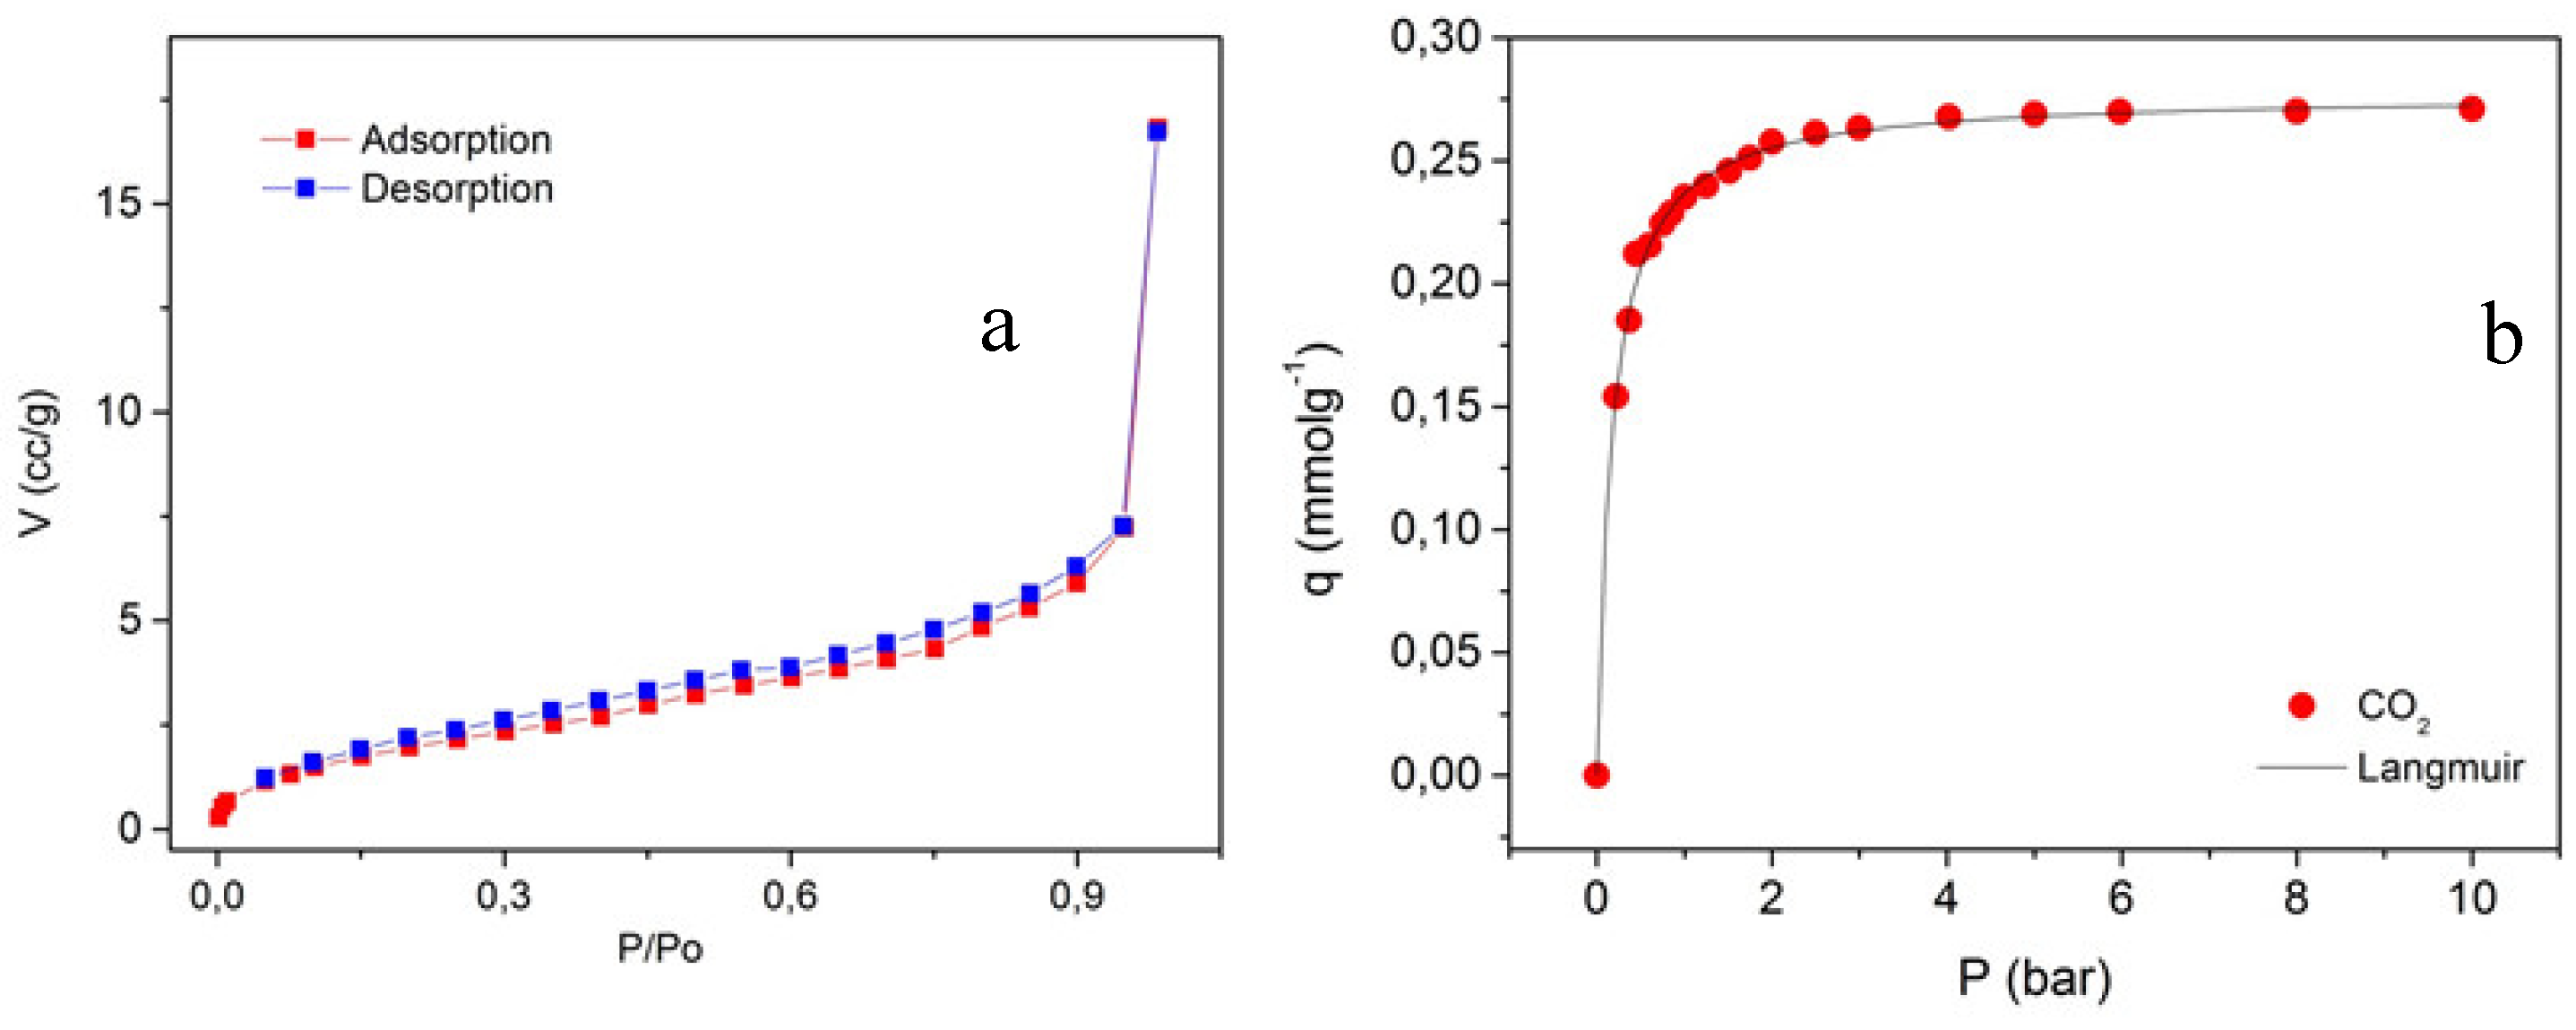
Figure 8.
Representation of interaction mechanism between CO2 molecule and amino groups present at ZnONPs@APTES surface.
Figure 8.
Representation of interaction mechanism between CO2 molecule and amino groups present at ZnONPs@APTES surface.
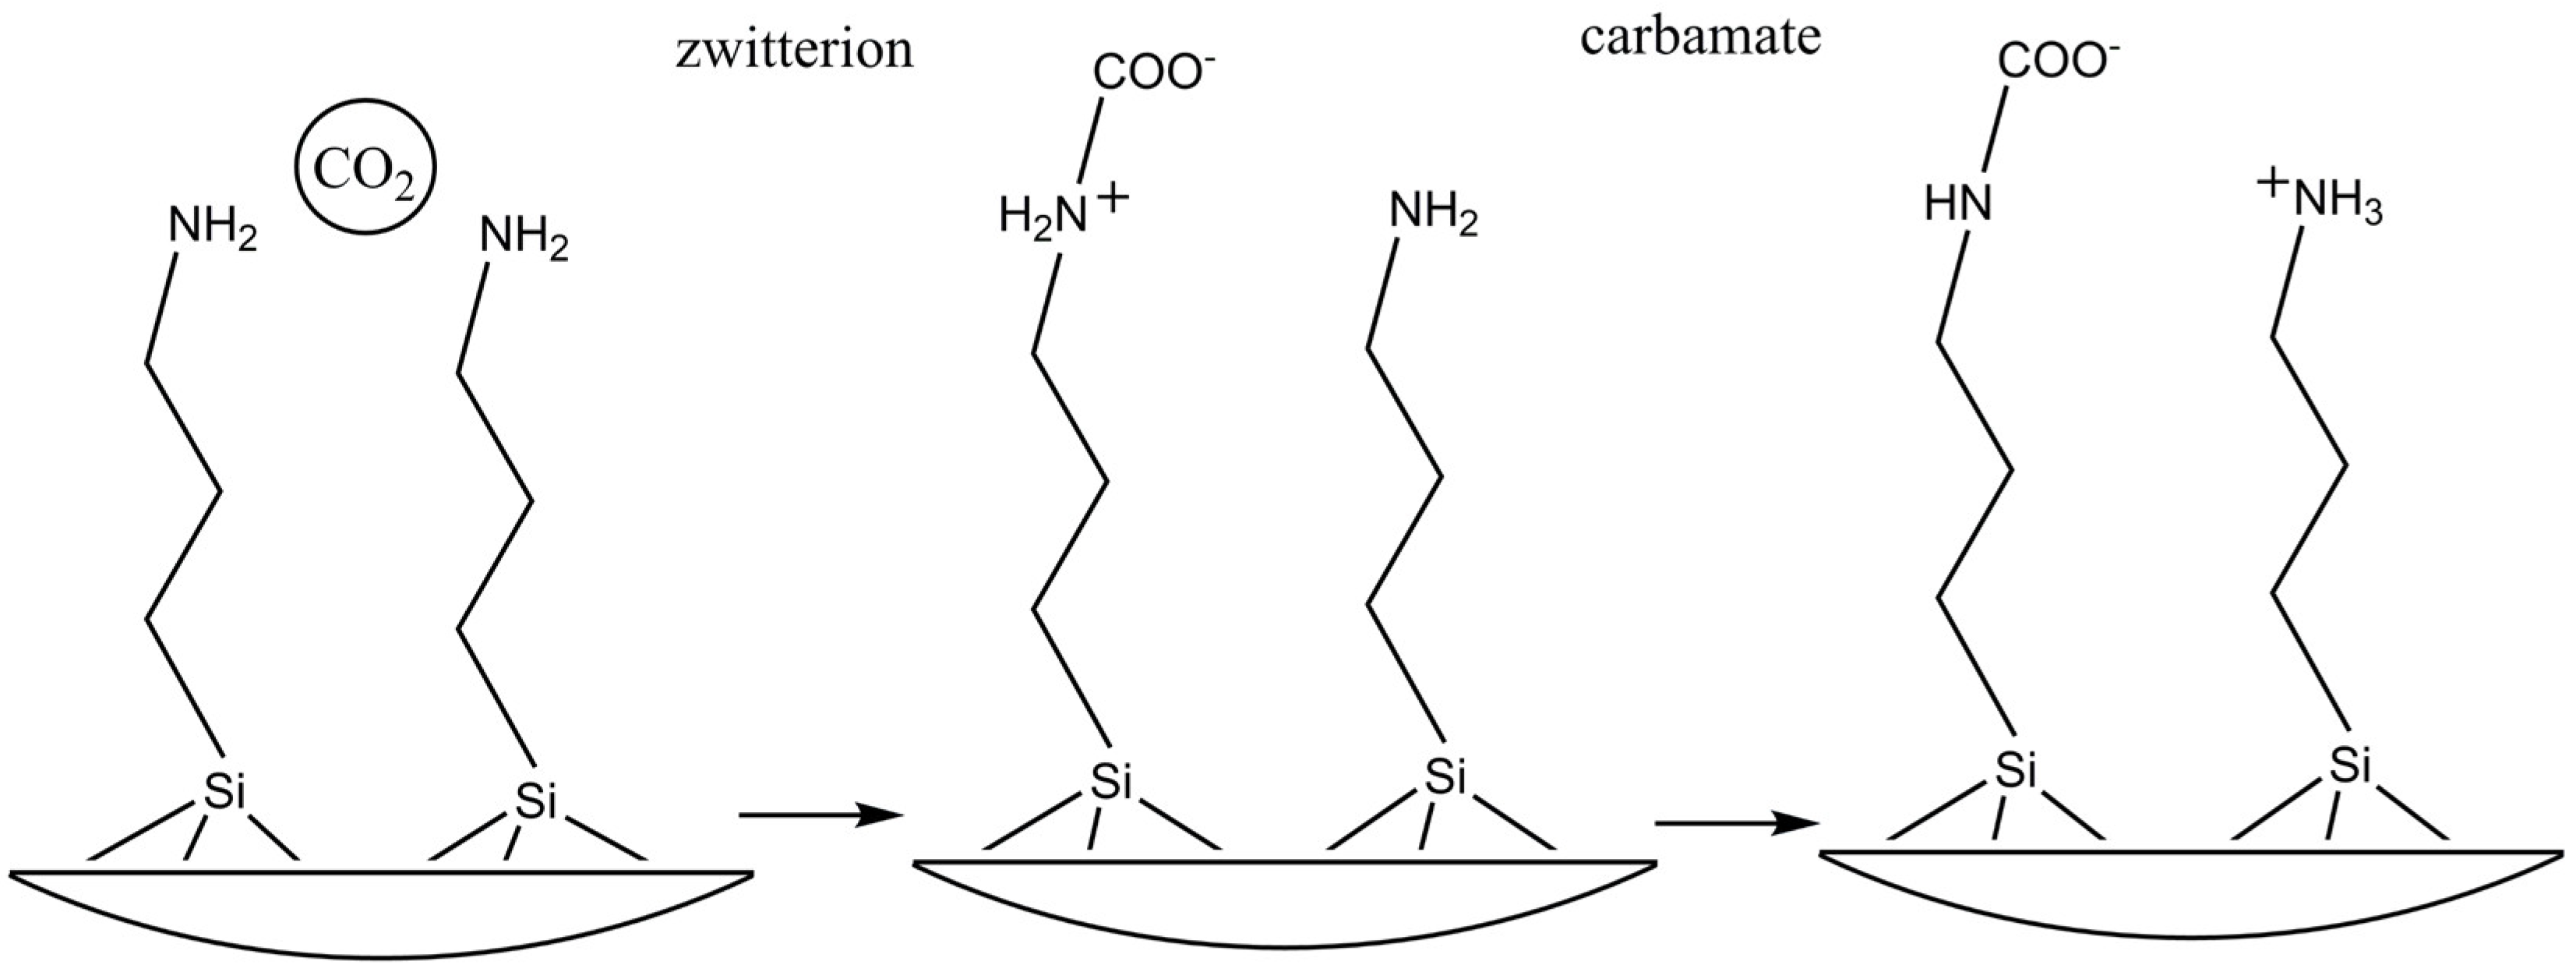

Table 1.
Total weight and atomic percentage of each element present in the samples, obtained from EDX analysis.
Table 1.
Total weight and atomic percentage of each element present in the samples, obtained from EDX analysis.
| Elements/Series | Weigth (%) | Atomic (%) | ||
|---|---|---|---|---|
| ZnO | ZnONPs@APTES | ZnO | ZnONPs@APTES | |
| Zn/K-series | 70.89 | 59.12 | 37.34 | 23.51 |
| O/K-serie | 29.11 | 20.50 | 62.66 | 33.31 |
| N/K-serie | - | 0.34 | - | 0.62 |
| Si/K-serie | - | 0.66 | - | 0.62 |
| C/K-serie | - | 19.38 | - | 41.94 |
Table 2.
Binding energy values in eV of the constituent elements of the studied samples, where the values in parentheses are the % of each contribution, and surface chemical composition (in atomic concentration %).
Table 2.
Binding energy values in eV of the constituent elements of the studied samples, where the values in parentheses are the % of each contribution, and surface chemical composition (in atomic concentration %).
| Sample | C 1s | N 1s | O 1s | Si 2s | Zn 2p3/2 |
|---|---|---|---|---|---|
| ZnONPs | 284.8 (88) | 530.1 (69) | - | ||
| 285.9 (7) | - | 531.2 (17) | 1021.3 | ||
| 288.8 (5) | 532.2 (14) | ||||
| ZnONPs@APTES | 284.8 (73) 285.9 (23) 288.0 (4) |
399.7 | 530.1 (42) 531.6 (40) 532.4 (18) |
153.1 |
1021.4 |
| ZnONPs | 20.02 | - | 42.73 | - | 37.25 |
| ZnONPs@APTES | 39.31 | 7.16 | 32.32 | 8.84 | 11.38 |
Table 3.
Specific surface area and pore volume in samples of ZnONPs and ZnONPs@APTES obtained from BET equation.
Table 3.
Specific surface area and pore volume in samples of ZnONPs and ZnONPs@APTES obtained from BET equation.
| Sample | Surface area (m2g-1) | Pore volume(cm3g-1) | C |
|---|---|---|---|
| ZnONPs [19] | 7 | 0.018 | 2.11 |
| ZnONPs@APTES | 8 | 0.011 | 27.4 |
Disclaimer/Publisher’s Note: The statements, opinions and data contained in all publications are solely those of the individual author(s) and contributor(s) and not of MDPI and/or the editor(s). MDPI and/or the editor(s) disclaim responsibility for any injury to people or property resulting from any ideas, methods, instructions or products referred to in the content. |
© 2024 by the authors. Licensee MDPI, Basel, Switzerland. This article is an open access article distributed under the terms and conditions of the Creative Commons Attribution (CC BY) license (http://creativecommons.org/licenses/by/4.0/).
Copyright: This open access article is published under a Creative Commons CC BY 4.0 license, which permit the free download, distribution, and reuse, provided that the author and preprint are cited in any reuse.


