
Submitted:
05 September 2024
Posted:
09 September 2024
You are already at the latest version
Abstract
The global incidence of cutaneous squamous cell carcinoma (cSCC), a prevalent and aggressive skin cancer, has risen significantly, posing a substantial public health challenge. This study investigates the tumor microenvironment (TME) of cSCC by focusing on the spatial distribution patterns of immune and vascular markers (CD31, CD20, CD4, and CD8) using fractal dimension (FD) analysis. Our analysis encompassed 141 cases, including 100 invasive cSCC and 41 specimens with pre-invasive lesions exclusively, and the rest being peripheral pre-invasive lesions from the invasive cSCC class. The FD values for each marker were computed and compared between pre-invasive and invasive lesion classes. The results revealed significant differences in FD values between the two classes for CD20 and CD31 markers, suggesting distinct alterations in B cell distribution and angiogenic activity during cSCC progression. However, CD4 and CD8 markers did not exhibit significant changes individually. Still, the CD4/CD8 ratio showed a significant difference, indicating a potential shift in the immune landscape as lesions progress from pre-invasive to invasive stages. These findings underscore the complexity and heterogeneity of the TME in cSCC and highlight the potential of FD analysis as a quantitative tool for characterizing tumor progression. Further research is needed to elucidate the implications of these differences in the clinical management of cSCC.
Keywords:
fractal dimension
; cutaneous squamous cell carcinoma
; digital image analysis
; tumor microenvironment
; angiogenesis
; immune cells
1. Introduction
The incidence rate of cutaneous squamous cell carcinoma (cSCC), a malignant epithelial tumor originating from keratinocytes [1], has increased globally by approximately 36% between 1990 and 2019 [2]. This alarming rise in cSCC, the second most common type of skin cancer, represents a significant public health concern, with over 2.4 million new cases and more than 356,000 deaths attributed to it worldwide annually [2,3].
cSCC progresses through distinct stages, beginning with abnormal cell growth (dysplasia), as observed in actinic keratosis. It then develops into a pre-cancerous stage confined to the epidermis (carcinoma in situ or Bowen’s disease), before ultimately transforming into invasive cancer that penetrates through the basement membrane into the dermis or deeper tissues [1].
The most common sites of cSCC development are sun-exposed areas, predominantly the head and neck, with the ears, lips, scalp, and face being the most frequently affected sites [1,4]. However, cSCC can also develop on the trunk and lower extremities, with the legs being a frequent site in women [4,5]. Risk factors associated with cSCC development, in addition to chronic sun exposure, include advanced age, with an increased incidence observed in individuals over 50 years, peaking over 70 [2]. Furthermore, immunosuppression, fair-skin, chronic irritation, trauma (e.g., burn scars, chronic ulcers), and radiation exposure also contribute to an elevated risk of cSCC [1].
Histologically, cSCC is characterized by pleomorphic polygonal cells, exhibiting a degree of differentiation dependent on tumor grade [1]. These cells adhere together, forming nests or islands surrounded by tumor stroma, and may demonstrate variable keratin production [1]. The tumor stroma is a complex environment surrounding and interacting with the tumor cells [6]. It contains various cellular components, including immune cells [7,8] and cancer-associated fibroblasts [9], and extracellular matrix components such as collagen [10] and blood vessels [11]. This composition of the tumor stroma can influence tumor progression, invasion and metastasis [12].
Immune cells play a critical role in the tumor microenvironment (TME) [13]. CD8+ cytotoxic T cells can directly kill tumor cells, and their presence is associated with a better prognosis [14,15]. Tregs (CD4+ regulatory T cells), on the other hand, suppress the immune response [16] and their abundance is linked to poorer outcomes. The ratio of these two cell types within the TME can vary depending on factors like tumor stage and genetics [7]. Blood vessels are another vital component of the TME, supplying nutrients and oxygen to the tumor. Compared to basal cell carcinoma (BCC), in which the blood vessels are arranged at the periphery, cSCC lesions show a bigger vessel density with two vascular pedicles [17] indicating a possible involvement in the more aggressive tumor behavior.
Many natural objects have complex structures that stay complex across magnifications, and patterns repeat at different scales. This makes traditional measurements tricky, so fractal geometry can be used instead [18]. Fractal dimension measures how much space an object fills and can be estimated using image analysis [18]. It has been a helpful tool in biology for analyzing DNA, tumors, and understanding growth processes [18].
Benoît Mandelbrot, the visionary behind fractals, introduced fractal dimension, a tool to quantify the intricate patterns found in nature’s seemingly irregular forms. From aiding in the diagnosis of tumors [19] and the analysis of brain scans [20] to providing insights into the intricacies of the circulatory system, the application of fractal dimension has emerged as a potent instrument in the ongoing exploration and comprehension of the human body’s complexities [21].
In the realm of dermatology, fractal analysis has proven to be a valuable tool for characterizing various aspects of skin lesions. Notably, it has been employed to evaluate the extent of field cancerization activity [22], a critical factor in understanding the progression of skin cancers. Additionally, fractal analysis has aided in the investigation of melanoma and other pigmented lesions [23,24]. This has involved the analysis of both histopathological slides and dermatoscopic images [25], providing insights into the structural complexities of these lesions. Furthermore, researchers have utilized fractal dimensions to examine the vascularity of melanomas and their micrometastases [26], potentially contributing to the development of improved diagnostic and prognostic tools.
Our investigation centers on the TME of cutaneous squamous cell carcinoma (cSCC), with particular attention directed towards the spatial arrangement of CD20, CD31, CD4, and CD8 markers. By employing fractal dimension analysis, we seek to provide a quantitative characterization of the distributional patterns of these markers, stratified into two distinct categories (classes): pre-invasive and invasive lesions.
2. Materials and Methods
2.1. Material
The present research encompassed a total sample of 141 cases, comprising 100 consecutive cases of invasive cutaneous squamous cell carcinoma and an additional 41 cases characterized exclusively by the presence of pre-invasive lesions. In order to achieve a total number of 100 pre-invasive lesions analyzed, the sample was supplemented with pre-invasive lesions identified at the periphery within the class of 100 cSCC cases. Ethical approval for this research was obtained from the Research Ethics Committee of the Emergency Clinical County Hospital, Cluj-Napoca, Romania (Approval No. 38789/13.09.2021) and the University of Medicine and Pharmacy “Iuliu Hatieganu” Cluj-Napoca (AVZ2/8.11.2021). In this study, lesions confined to the epidermis were classified as pre- invasive, while those infiltrating underlying structures were considered invasive.
Following standard histological processing and Hematoxylin-eosin (H&E) staining, additional sections were prepared from paraffin-embedded tissue blocks for immunohistochemical (IHC) analysis. IHC staining was performed using the BOND-MAX Fully Automated IHC and ISH Staining System (LEICA). The following antibodies and epitope retrieval solutions were utilized:
- CD4: Clone 4B12, mouse, ready-to-use (RTU), Leica. Antigen retrieval was achieved using Bond ER2 solution at an alkaline pH for 20 minutes.
- CD8: Clone 4B11, mouse, RTU, Leica. Antigen retrieval was conducted using Bond ER2 solution at an alkaline pH for 30 minutes.
- CD20: Clone L26, mouse, RTU, Leica. Antigen retrieval was performed using Bond ER1 solution at an alkaline pH for 20 minutes.
- CD31: Clone 1A10, mouse, RTU, Leica. Antigen retrieval was accomplished using Bond ER2 solution at an alkaline pH for 10 minutes.
The BOND-PRIME Polymer DAB Detection System kit was employed for signal detection, incorporating peroxide block, post-primary, polymer reagent, DAB chromogen, and hematoxylin counterstain. The staining protocol included a 5-minute peroxide block, followed by three washes, 15 minutes of primary antibody incubation, three washes, 8 minutes of post-primary incubation, three washes, 8 minutes of polymer incubation, two washes, and a distilled water wash. Subsequently, slides were immersed in DAB Refine for 5 minutes (repeated twice), washed three times with distilled water, and counterstained with hematoxylin for 5 minutes. Finally, all slides (H&E and IHC) were digitally scanned using a Pannoramic SCAN II slide scanner (3DHISTECH, Budapest, Hungary) equipped with a 40x objective. Figure 1 shows the control stains for each antibody used on a sample of lingual tonsil tissue.
2.2. Image Selection
Trained dermatopathologists selected and cropped five images for each case. Hematoxylin and eosin (H&E) staining was used as the reference standard to identify and outline squamous cell carcinoma (SCC) and pre-invasive lesions. The other immunohistochemical stainings (CD31, CD20, CD4, and CD8) were manually aligned to match the corresponding H&E images. Figure 2 shows a sample of images from both pre-invasive and invasive classes. The images were cropped to a resolution of 1024x1024 pixels, captured at a magnification equivalent to a 20x objective, with a spatial resolution of 5 microns per pixel.
2.3. Algorithm
The images underwent preprocessing to correct variations in staining, as the staining process could not be performed simultaneously due to the large number of slides. To standardize the stainings, a color transfer method was applied. For each staining type, an image with a well-balanced color distribution was empirically selected as the reference (target). All other images of the same staining type were adjusted to match the color profile of this target image. This normalization was performed in the LAB color space using an algorithm proposed by Reinhard et al. [27], which adjusts the mean and standard deviation of each color channel to align with those of the target image. While a hardware-based marker could have provided more consistent results [28], this was not feasible at the current stage.
Next, each immunohistochemical stained image was segmented into three distinct masks using a channel-splitting algorithm suggested by Reyes-Aldasoro C.C. [29,30]. The first masks represent stained structures (cytoplasm and membrane) with the specific antibody, the second represents unstained basophilic structures, and the third captures the background. Figure 3 shows examples of these segmented masks for both pre-invasive and invasive lesions.
Following segmentation, a box-counting algorithm was employed to estimate the fractal dimension of each mask, quantifying its complexity by analyzing how detail in the pattern changes with scale. The algorithm involves covering the object with grids of boxes (squares) of varying sizes, in powers of 2, and counting how many of these boxes contain part of the object. The fractal dimension is estimated by plotting the logarithm of the number of occupied boxes against the logarithm of the inverse box size and calculating the slope of the resulting line. The exact implementation of this algorithm is described in a previous paper [31]. For other applications, we proposed a faster box-counting method based on integral images [32], but this was not necessary here due to the relatively small number of images.
For each of the four immunohistochemical stained images, of each case, we computed three fractal dimension component values: one for the marked structures, one for the unmarked structures, and one for the remaining background.
We compared the mean FD values of each component between the classes. More than that, we compared different component ratios between the classes, like CD4/CD8 and (CD4+CD8)/CD20.
2.4. Statistical Assessment
All fractal dimension (FD) values were logged, and for each staining and component, values between the first and third quartiles were retained, resulting in a sample of 50 for each component, staining, and class. Data normality within each class was evaluated using the Shapiro-Wilk, and Kolmogorov-Smirnov tests. Since all variables followed a normal distribution, comparisons between different values were made using the parametric Student’s t-test. A p-value <0.05 was considered significant.
3. Results
The results, presented as the mean ± standard deviation (SD) of the computed FD for the marked structures for each of the four stainings and each class, are shown in Table 1. Similarly, the results for the unmarked structures are shown in Table 2, while the background results are presented in Table 3. Visual representations of these values are presented as box-plots in Figure 4, Figure 5 and Figure 6.
The individual levels of CD4 and CD8 did not differ significantly between the two classes. However, CD20 levels did show a significant difference. When we calculated the CD4/CD8 ratio, we observed a statistically significant difference between the classes, as shown in Table 4. A similar significant difference was also found when analyzing the ratio of CD4+CD8 to CD20.
4. Discussion
The present study employed an innovative approach to investigate the TME in cSCC by utilizing FD analysis on several IHC stains (specifically CD31, CD20, CD4, and CD8). The findings revealed intriguing insights into the complexity and heterogeneity of the TME, particularly highlighting differences between two important classes of tumors: pre-invasive and invasive cSCC lesions.
Our previous research has concentrated on characterizing the TME across various tumor types. Specifically, in the context of prostate adenocarcinoma, we investigated correlations between the intratumoral interstitial fibrillary network and tumor architecture [33], as well as between the intratumoral vascular network and tumor architecture [34]. We also explored the relationships between the intratumoral interstitial fibrillary and vascular network [35]. This line of inquiry was further advanced by employing FD analysis to study the components of tumor architecture in prostate adenocarcinoma [31]. In colorectal cancer research, we identified predictive markers for primary tumors [36] and evaluated potential markers of colorectal cancer stem cells [37]. Moving closer to cutaneous pathology, we demonstrated that nodular and micronodular subtypes of basal cell carcinoma are distinct entities, based not only on their morphological architecture but also on their TME [38]. Additionally, in the study of palate squamous cell carcinomas, we described the distribution and expression of certain tumor invasiveness markers [39], providing a foundation for our current work on squamous cell carcinoma at a different site. This body of previous research, including direct studies on squamous cell carcinoma at varying sites, has laid the groundwork for the findings presented in our current study.
CD31, also known as Platelet Endothelial Cell Adhesion Molecule-1 (PECAM-1) [40], is a protein primarily expressed on the surface of endothelial cells [40], which line blood vessels, as well as on platelets, certain leukocytes, and a subset of macrophages [41]. CD31 plays a critical role in several physiological processes of the vascular and immune systems. Particularly, CD31 has numerous functions in the formation and maintenance of the endothelial barrier [42], angiogenesis [43], transmigration of leukocytes across the endothelial layer [44], and platelet activation and aggregation [45]. Having all these functions one could suspect that, as part of the TME, the CD31 pattern evolves with the tumors. This is also reinforced by our previous studies on other tumor types. The current study shows that CD31 marking has significantly different FD values between pre-invasive and invasive classes, with a lower value in the former, as seen in Table 1 and Figure 4. This indicates a possible differentiation between the two classes and could lead to further investigations as the vessels are subjected to being analyzed with non-invasive imaging techniques, and in turn this could bring useful information in the clinical decision.
CD20 is a protein found on the surface of B cells, which are a type of white blood cell involved in the immune system. The CD20 molecule plays a key role in B cell development, differentiation, and activation [46]. It is not present on early B cells or plasma cells, but it is expressed on mature B cells. B cells exhibiting CD20, are present in different diseases like leukemia, lymphoma [47], and autoimmune diseases [48] and are used for targeted therapy, showing their role in the immune intervention. The current study shows that CD20 marking has significantly different FD values between pre-invasive invasive classes, with a lower value in the latest, as seen in Table 1 and Figure 4. This indicates a possible differention between the two classes and could lead to further investigations.
CD4 is a glycoprotein expressed on the surface of certain immune cells, including T helper cells [49], monocytes, macrophages [50], and dendritic cells [51]. CD4 is a co-receptor that plays a crucial role in the immune system by aiding in the activation and coordination of the immune response [49]. Particularly, CD4 has numerous functions like orchestrating the immune response by helping to activate other immune cells, including B cells (which produce antibodies) [49], cytotoxic T cells (which kill infected cells) [52], and macrophages [50] (which engulf and destroy pathogens). It also has a role in immune regulation, where CD4+ T cells are involved in regulating the immune response, ensuring that it is appropriately robust to fight infections but also controlled to prevent excessive inflammation or autoimmune reactions [49]. CD4+ T cells can play a role in both pro-inflammatory and anti-inflammatory responses. The type of response depends on the specific subtype of CD4+ T cell involved and the signals it receives [53]. When these CD4+ T cells recognize a foreign antigen presented by other immune cells, they can initiate a variety of immune responses, including pro-inflammatory ones [54]. The current study shows that CD4 marking has no significantly different FD values between pre-invasive and invasive classes, as seen in Table 1 and Figure 4. This could indicate that CD4 expressing cells are highly involved in both pre-invasive and invasive lesions.
CD8 is a glycoprotein found on the surface of certain immune cells, primarily cytotoxic T cells (also known as CD8+ T cells) [55]. It serves as a co-receptor that is crucial in the immune system, particularly in the identification and elimination of infected or cancerous cells [56]. CD8+ T cells have the ability to directly kill cells that are infected with viruses or other intracellular pathogens, as well as cells that are cancerous or otherwise abnormal [57]. They accomplish this by releasing cytotoxic molecules like perforin and granzymes, which induce apoptosis (programmed cell death) in the target cell [57]. CD8+ T cells interact with MHC class I molecules, which are present on almost all nucleated cells [57]. This interaction allows them to survey cells for signs of infection or transformation. The current study shows that CD8 expression (as measured by FD values) does not differ significantly between pre-invasive and invasive classes, as seen in Table 1 and Figure 4. Similar with the CD4 expression, this could indicate that CD8 expressing cells are highly involved in both pre-invasive and invasive lesions.
Following to Table 1 and Figure 4, we found that CD4 and CD8 do not exhibit significant changes of the FD within the pre-invasive and invasive classes. However, when we compute the CD4 to CD8 ratio of the obtained FD-ratio shows a significant difference, as seen in Table 4. The invasive class has a lower overall FD ratio. Since the individual values of CD4 and CD8 showed no statistical difference, we are forced to take in consideration both the influence of denominator and numerator without being able to point out the one that changes.
Following a similar approach when aiming to see the T to B FD-ratio, we computed (CD4+C8)/CD20, and found out that the FD-ratio is statistically different between the two classes, as pointed out in Table 4. With CD20 itself showing statistically different values between classes, and with the CD4+CD8 showing no statistical difference, it is unclear if the CD4+CD8 has a contribution in this matter.
The analysis of FD values in unmarked structures—areas not stained for specific markers but showing high basophilic staining—revealed significant differences between pre-invasive and invasive cSCC in the CD31, CD4, and CD8 images. Invasive cSCC showed higher FD values in unmarked structures across all three markers, as illustrated in Table 2 and Figure 5. However, FD values for unmarked structures in CD20 images did not differ between the two classes. The underlying causes for these insignificant FD difference in the T line cells, as well as the significant differences in unmarked structures, remain unclear. The phenomena are opposite in the B cell line. This is particularly intriguing because it suggests a mirroring effect: when marked structures show significant differences, the unmarked structures do not, and vice versa.
The background mask was created by excluding both marked and unmarked structures, theoretically representing the stroma and non-cellular spaces. For the average FD, all components showed statistically significant differences between the classes, as detailed in Table 3 and Figure 6. Higher FD values were observed in the non-invasive class for CD31 and CD4, while CD8 and CD20 showed higher values in the invasive class. Given that at least one statistically significant difference was found in the combination of marked and unmarked structures for all four stainings—CD31 showing differences in both—it is challenging to interpret these findings at this stage. However, this observation may be useful for future studies aimed at identifying correlations.
The presence of CD4+ and CD8+ T cells is generally associated with anti-tumor immune responses [58], and their increased complexity in invasive cSCC could reflect an ongoing immune response against the tumor or a more complex interplay between different T cell subsets. It should be noted that in other studies, a decrease in T reg CD4+, also evaluated by digital image analysis, was observed in invasive cSCC lesions compared to premalignant lesions [7]. On the other hand, the same study [7] states that there is a progressive increase in CD8 T cells in cSCC carcinogenesis.
Furthermore, the analysis of FD values on background regions, representing areas not occupied by cells, also showed significant differences between pre-invasive and invasive cSCC for all four IHC markers. The decrease in FD values for CD31 observed in invasive cSCC suggests a reduction in background complexity, potentially indicating alterations in the extracellular matrix or stromal components surrounding the tumor cells (such as blood vessels). These changes in the background could impact cell-cell interactions, signaling pathways, and overall TME dynamics, potentially contributing to tumor progression and invasion [59].
While individual levels of CD4 and CD8 T-cells did not show significant differences between pre-invasive and invasive classes, the ratio of CD4 to CD8 was significantly lower in the invasive class. This suggests a potential shift in the balance of T-cell subsets during progression to invasive disease. Additionally, CD20 levels were significantly different between classes, and the ratio of combined CD4 and CD8 T-cells to CD20 was also significantly lower in the invasive classes. This may indicate alterations in the interplay between T-cells and B-cells (CD20+) in the TME as the disease advances. These findings highlight the potential importance of T-cell and B-cell ratios as biomarkers or therapeutic targets in cSCC.
So far, the literature about the use of fractal dimension in cutaneous squamous cell carcinoma is limited. The only study that we found was using nuclear FD to describe and compare morphometric aspects and expression of factors related to apoptosis and cell proliferation in actinic keratosis (AK), in both photoexposed and photoprotected epidermis [22].
However, FD has been used in the study of the tumor stroma of oral squamous cell carcinoma by assessing the nuclear FD of lymphocytes present in the stroma, showing that high nuclear FDs are associated with an increased number of lymphocytes in the tumor stroma [60]. In our study, unlike Bose et al.‘s approach [60], which employed H&E staining, we opted for the enhanced specificity of IHC markers to more precisely identify and quantify the lymphocytes within the tumor microenvironment. Specifically, we utilized CD20 to identify B lymphocytes, CD4 for helper T lymphocytes (TCD4+), and CD8 for cytotoxic T lymphocytes (TCD8+).In a separate investigation pertaining to oral carcinomas, Goutzanis et al. [61] proposed that FD can serve as a dependable indicator for assessing angiogenic activity within oral squamous cell carcinoma. In a distinct study from Margaritescu et. al [62] shows that fractal analysis demonstrated a rise in lymphatic network complexity as oral mucosal lesions progressed from normal to premalignant, offering supplementary prognostic insights into oral malignancies.
In the context of non-melanoma skin cancer (NMSC), the fractal dimension (FD) has also been utilized by Capasso et al. [63] to analyze the stroma of basal cell carcinoma (BCC) in patients with kidney transplants. They employed WSIs with H&E and Trichrome staining. Their findings indicated that the microenvironment of BCC in kidney transplant patients exhibited a higher density of inflammatory cells in comparison to the control group [63]. Similar, in our research, using immunohistochemical markers for B cells and T cells, we observed a tendency towards decreased structural complexity and irregularities in invasive lesions when compared to pre-invasive ones.
It would be valuable to further investigate how these immune cell aggregates differ in complexity between invasive cutaneous squamous cell carcinoma and premalignant lesions in comparison to BCC. Additionally, examining the complexity of blood vessels in cSCC and BCC is warranted, as previous research has shown that, unlike BCC, where blood vessels are located at the periphery, cSCC lesions display a higher vessel density with two vascular pedicles [17], potentially contributing to their more aggressive tumor behavior. Our current findings, which demonstrate significantly different CD31 marking FD values between pre-invasive and invasive classes—with lower values observed in the former—further emphasize the need for future investigations. These studies should aim to establish a direct link between our observations regarding CD31 expression, a marker of angiogenesis, and the more aggressive clinical behavior of cSCC in comparison to BCC. Such a connection could offer a deeper understanding of the role of angiogenesis in cSCC progression and potentially pave the way for the development of novel therapeutic strategies targeting tumor vascularization. As we show in previous studies researching the vascular network architecture with the help of FD have observed that the complexity of the vascular architecture tends to get lower in poorly differentiated patterns of prostatic adenocarcinoma, having a more linear type arrangement [31].
The current investigation possesses certain limitations that merit acknowledgment. Firstly, the sample size is restricted and originates from a single center, necessitating expansion in subsequent studies to augment statistical power and the generalizability of the results. Secondly, the manual alignment of IHC images to the corresponding H&E images, although performed meticulously, might introduce minor registration errors that could affect FD calculations. Last, but maybe the most important, is that the invasive class lacks subclass stratification, as one would expect that there are differences between poorly, moderated and high-grade subclasses. However, due to the sample size this could not be resolved within this iteration.
5. Conclusions
This study introduced a novel approach by applying FD analysis to IHC images to investigate the tumor TME in cSCC. The results demonstrated significant differences in structural complexity and heterogeneity between the two classes taken in consideration: pre-invasive and invasive lesions, with notable changes observed in blood vessel distribution, immune cell infiltration, and overall background complexity.
Specifically, the FD values of CD20 and CD31-marked structures differed significantly between pre- invasive and invasive classes. Similarly, unmarked structures associated with CD31, CD4, and CD8 showed statistically significant differences in FD values. Additionally, the background, which was defined by excluding both marked and unmarked structures, revealed statistically significant differences of the computed FD across all four IHC stainings.
These findings enhance our understanding of the dynamic nature of the TME in cSCC and could potentially inform the development of new diagnostic and therapeutic strategies targeting the TME to improve patient outcomes. Further research with larger sample sizes and more advanced image analysis techniques is needed to explore the complex relationship between the TME and cSCC progression.
Author Contributions
Conceptualization, A.B. and M.-S.Ș.; methodology, A.B. and M.-S.Ș.; software, M.-S.Ș.; validation, C.G., D.C. and M.C.; formal analysis, M.-S.Ș.; investigation, A.B.; resources, A.B., D.C., B.-A.G, I.-A.G.-R, B.P.; data curation, A.B. and M.-S.Ș.; writing—original draft preparation, A.B.; writing—review and editing, A.B., R.M.H and M.-S.Ș.; visualization, A.B. and M.-S.Ș.; supervision, M.C.; project administration, M.C. All authors have read and agreed to the published version of the manuscript.
Funding
This research received no external funding.
Institutional Review Board Statement
The study was conducted in accordance with the Declaration of Helsinki and approved by the Institutional Research Ethics Committee of the Emergency Clinical County Hospital, Cluj-Napoca, Romania (Approval No. 38789/ 13.09.2021), and of the University of Medicine and Pharmacy “Iuliu Hatieganu” Cluj-Napoca (AVZ2/8.11.2021).
Informed Consent Statement
Written informed consent has been obtained, according to hospital protocol, from the patients to publish this paper.
Data Availability Statement
Data used in the present study can be shared upon reasonable request.
Conflicts of Interest
The authors declare no conflicts of interest.
References
- BlueBooksOnline Available online:. Available online: https://tumourclassification.iarc.who.int/chaptercontent/64/35 (accessed on 20 May 2024).
- Guo, A.; Liu, X.; Li, H.; Cheng, W.; Song, Y. The Global, Regional, National Burden of Cutaneous Squamous Cell Carcinoma (1990–2019) and Predictions to 2035. European Journal of Cancer Care 2023, 2023, e5484597. [Google Scholar] [CrossRef]
- Caudill, J.; Thomas, J.E.; Burkhart, C.G. The Risk of Metastases from Squamous Cell Carcinoma of the Skin. Int J Dermatol 2023, 62, 483–486. [Google Scholar] [CrossRef] [PubMed]
- Fijałkowska, M.; Koziej, M.; Antoszewski, B. Detailed Head Localization and Incidence of Skin Cancers. Sci Rep 2021, 11, 12391. [Google Scholar] [CrossRef] [PubMed]
- Tokez, S.; Wakkee, M.; Louwman, M.; Noels, E.; Nijsten, T.; Hollestein, L. Assessment of Cutaneous Squamous Cell Carcinoma (cSCC) In Situ Incidence and the Risk of Developing Invasive cSCC in Patients With Prior cSCC In Situ vs the General Population in the Netherlands, 1989-2017. JAMA Dermatology 2020, 156, 973–981. [Google Scholar] [CrossRef] [PubMed]
- Guo, S.; Deng, C.-X. Effect of Stromal Cells in Tumor Microenvironment on Metastasis Initiation. Int J Biol Sci 2018, 14, 2083–2093. [Google Scholar] [CrossRef]
- A, S.; V, T.; H, P.; A, M.; S, G.; M, M.; Ep, K. Evaluation of T-Lymphocyte Subpopulations in Actinic Keratosis, in Situ and Invasive Squamous Cell Carcinoma of the Skin. Journal of cutaneous pathology 2018, 45. [Google Scholar] [CrossRef]
- Nishida, H.; Kondo, Y.; Kusaba, T.; Kawamura, K.; Oyama, Y.; Daa, T. CD8/PD-L1 Immunohistochemical Reactivity and Gene Alterations in Cutaneous Squamous Cell Carcinoma. PLoS One 2023, 18, e0281647. [Google Scholar] [CrossRef]
- Schütz, S.; Solé-Boldo, L.; Lucena-Porcel, C.; Hoffmann, J.; Brobeil, A.; Lonsdorf, A.S.; Rodríguez-Paredes, M.; Lyko, F. Functionally Distinct Cancer-Associated Fibroblast Subpopulations Establish a Tumor Promoting Environment in Squamous Cell Carcinoma. Nat Commun 2023, 14, 5413. [Google Scholar] [CrossRef]
- van Kempen, L.C.L.T.; Rijntjes, J.; Claes, A.; Blokx, W.A.M.; Gerritsen, M.-J.P.; Ruiter, D.J.; van Muijen, G.N.P. Type I Collagen Synthesis Parallels the Conversion of Keratinocytic Intraepidermal Neoplasia to Cutaneous Squamous Cell Carcinoma. J Pathol 2004, 204, 333–339. [Google Scholar] [CrossRef]
- Tzoutzos, K.; Batistatou, A.; Kitsos, G.; Liasko, R.; Stefanou, D. Study of Microvascular Density and Expression of Vascular Endothelial Growth Factor and Its Receptors in Cancerous and Precancerous Lesions of the Eyelids. Anticancer Res 2014, 34, 4977–4983. [Google Scholar]
- Bussard, K.M.; Mutkus, L.; Stumpf, K.; Gomez-Manzano, C.; Marini, F.C. Tumor-Associated Stromal Cells as Key Contributors to the Tumor Microenvironment. Breast Cancer Res 2016, 18, 84. [Google Scholar] [CrossRef] [PubMed]
- Saeidi, V.; Doudican, N.; Carucci, J.A. Understanding the Squamous Cell Carcinoma Immune Microenvironment. Front Immunol 2023, 14, 1084873. [Google Scholar] [CrossRef] [PubMed]
- Xie, Q.; Ding, J.; Chen, Y. Role of CD8+ T Lymphocyte Cells: Interplay with Stromal Cells in Tumor Microenvironment. Acta Pharm Sin B 2021, 11, 1365–1378. [Google Scholar] [CrossRef] [PubMed]
- Rosa, M.L.; Reinert, T.; Pauletto, M.M.; Sartori, G.; Graudenz, M.; Barrios, C.H. Implications of Tumor-Infiltrating Lymphocytes in Early-Stage Triple-Negative Breast Cancer: Clinical Oncologist Perspectives. Translational Breast Cancer Research 2024, 5. [Google Scholar] [CrossRef]
- Dwivedi, M.; Tiwari, S.; Kemp, E.H.; Begum, R. Implications of Regulatory T Cells in Anti-Cancer Immunity: From Pathogenesis to Therapeutics. Heliyon 2022, 8, e10450. [Google Scholar] [CrossRef]
- Department of Pathology, Iuliu Haţieganu University of Medicine and Pharmacy, Cluj-Napoca, Romania; Bungărdean, R. -M.; Stoia, M.-A.; Department of Internal Medicine, Iuliu Haţieganu University of Medicine and Pharmacy, Cluj-Napoca, Romania; Pop, B.; Department of Pathology, Iuliu Haţieganu University of Medicine and Pharmacy, Cluj-Napoca, Romania; Department of Pathology, Prof. Dr. Ion Chiricuţă Oncology Institute, Cluj-Napoca, Romania; Crişan, M.; Department of Histology, Iuliu Haţieganu University of Medicine and Pharmacy, Cluj-Napoca, Romania Morphological Aspects of Basal Cell Carcinoma Vascularization. Rom J Morphol Embryol 2023, 64, 15–23. [Google Scholar] [CrossRef]
- Cross, S.S. Fractals in Pathology. The Journal of Pathology 1997, 182, 1–8. [Google Scholar] [CrossRef]
- da Silva, L.G.; da Silva Monteiro, W.R.S.; de Aguiar Moreira, T.M.; Rabelo, M.A.E.; de Assis, E.A.C.P.; de Souza, G.T. Fractal Dimension Analysis as an Easy Computational Approach to Improve Breast Cancer Histopathological Diagnosis. Appl Microsc 2021, 51, 6. [Google Scholar] [CrossRef]
- Di Ieva, A. Fractal Analysis in Clinical Neurosciences: An Overview. Adv Neurobiol 2024, 36, 261–271. [Google Scholar] [CrossRef]
- Di Ieva, A.; Al-Kadi, O.S. Computational Fractal-Based Analysis of Brain Tumor Microvascular Networks. Adv Neurobiol 2024, 36, 525–544. [Google Scholar] [CrossRef]
- Miola, A.C.; Castilho, M.A.; Schmitt, J.V.; Marques, M.E.A.; Miot, H.A. Contribution to Characterization of Skin Field Cancerization Activity: Morphometric, Chromatin Texture, Proliferation, and Apoptosis Aspects. An Bras Dermatol 2019, 94, 698–703. [Google Scholar] [CrossRef] [PubMed]
- Bedin, V.; Adam, R.L.; de Sá, B.C.; Landman, G.; Metze, K. Fractal Dimension of Chromatin Is an Independent Prognostic Factor for Survival in Melanoma. BMC Cancer 2010, 10, 260. [Google Scholar] [CrossRef] [PubMed]
- Piantanelli, A.; Maponi, P.; Scalise, L.; Serresi, S.; Cialabrini, A.; Basso, A. Fractal Characterisation of Boundary Irregularity in Skin Pigmented Lesions. Med Biol Eng Comput 2005, 43, 436–442. [Google Scholar] [CrossRef]
- Popecki, P.; Kozakiewicz, M.; Ziętek, M.; Jurczyszyn, K. Fractal Dimension Analysis of Melanocytic Nevi and Melanomas in Normal and Polarized Light-A Preliminary Report. Life (Basel) 2022, 12, 1008. [Google Scholar] [CrossRef]
- Quatresooz, P.; Pierard-Franchimont, C.; Paquet, P.; Pierard, G.E. Angiogenic Fast-Growing Melanomas and Their Micrometastases. Eur J Dermatol 2010, 20, 302–307. [Google Scholar] [CrossRef] [PubMed]
- Reinhard, E.; Adhikhmin, M.; Gooch, B.; Shirley, P. Color Transfer between Images. IEEE Computer Graphics and Applications 2001, 21, 34–41. [Google Scholar] [CrossRef]
- Şerbănescu, M.S.; Pleşea, I.E. A Hardware Approach for Histological and Histopathological Digital Image Stain Normalization. Rom J Morphol Embryol 2015, 56, 735–741. [Google Scholar]
- Reyes-Aldasoro, C. c.; Williams, L. j.; Akerman, S.; Kanthou, C.; Tozer, G. m. An Automatic Algorithm for the Segmentation and Morphological Analysis of Microvessels in Immunostained Histological Tumour Sections. Journal of Microscopy 2011, 242, 262–278. [Google Scholar] [CrossRef]
- Reyes-Aldasoro, C.C.; Griffiths, M.K.; Savas, D.; Tozer, G.M. CAIMAN: An Online Algorithm Repository for Cancer Image Analysis. Computer Methods and Programs in Biomedicine 2011, 103, 97–103. [Google Scholar] [CrossRef]
- Pleşea, R.M.; Şerbănescu, M.S.; Ciovică, D.V.; Roşu, G.C.; Moldovan, V.T.; Bungărdean, R.M.; Popescu, N.A.; Pleşea, I.E. The Study of Tumor Architecture Components in Prostate Adenocarcinoma Using Fractal Dimension Analysis. Rom J Morphol Embryol 2019, 60, 501–519. [Google Scholar]
- Șerbănescu, M.-S. Fractal Dimension Box-Counting Algorithm Optimization Through Integral Images. In Proceedings of the 7th International Conference on Advancements of Medicine and Health Care through Technology; Vlad, S., Roman, N.M., Eds.; Springer International Publishing: Cham, 2022; pp. 95–101. [Google Scholar]
- Stoiculescu, A.; Pleşea, I.E.; Pop, O.T.; Alexandru, D.O.; Man, M.; Serbănescu, M.; Pleşea, R.M. Correlations between Intratumoral Interstitial Fibrillary Network and Tumoral Architecture in Prostatic Adenocarcinoma. Rom J Morphol Embryol 2012, 53, 941–950. [Google Scholar] [PubMed]
- Pleşea, I.E.; Stoiculescu, A.; Serbănescu, M.; Alexandru, D.O.; Man, M.; Pop, O.T.; Pleşea, R.M. Correlations between Intratumoral Vascular Network and Tumoral Architecture in Prostatic Adenocarcinoma. Rom J Morphol Embryol 2013, 54, 299–308. [Google Scholar] [PubMed]
- Mitroi, G.; Pleşea, R.M.; Pop, O.T.; Ciovică, D.V.; Şerbănescu, M.S.; Alexandru, D.O.; Stoiculescu, A.; Pleşea, I.E. Correlations between Intratumoral Interstitial Fibrillary Network and Vascular Network in Srigley Patterns of Prostate Adenocarcinoma. Rom J Morphol Embryol 2015, 56, 1319–1328. [Google Scholar] [PubMed]
- Bărbălan, A.; Nicolaescu, A.C.; Măgăran, A.V.; Mercuţ, R.; Bălăşoiu, M.; Băncescu, G.; Şerbănescu, M.S.; Lazăr, O.F.; Săftoiu, A. Immunohistochemistry Predictive Markers for Primary Colorectal Cancer Tumors: Where Are We and Where Are We Going? Rom J Morphol Embryol 2018, 59, 29–42. [Google Scholar]
- Harbiyeli, I.F.C.; Burtea, D.E.; Ivan, E.T.; Streață, I.; Nicoli, E.R.; Uscatu, D.; Șerbănescu, M.-S.; Ioana, M.; Vilmann, P.; Săftoiu, A. Assessing Putative Markers of Colorectal Cancer Stem Cells: From Colonoscopy to Gene Expression Profiling. Diagnostics (Basel) 2022, 12, 2280. [Google Scholar] [CrossRef]
- Șerbănescu, M.-S.; Bungărdean, R.M.; Georgiu, C.; Crișan, M. Nodular and Micronodular Basal Cell Carcinoma Subtypes Are Different Tumors Based on Their Morphological Architecture and Their Interaction with the Surrounding Stroma. Diagnostics (Basel) 2022, 12, 1636. [Google Scholar] [CrossRef]
- Pătru, A.; Şurlin, V.; Mărgăritescu, C.; Ciucă, E.M.; Matei, M.; Şerbănescu, M.S.; Camen, A. Analysis of the Distribution and Expression of Some Tumor Invasiveness Markers in Palate Squamous Cell Carcinomas. Rom J Morphol Embryol 2020, 61, 1259–1278. [Google Scholar] [CrossRef]
- Lertkiatmongkol, P.; Liao, D.; Mei, H.; Hu, Y.; Newman, P.J. Endothelial Functions of Platelet/Endothelial Cell Adhesion Molecule-1 (CD31). Curr Opin Hematol 2016, 23, 253–259. [Google Scholar] [CrossRef]
- Newman, P.J. The Biology of PECAM-1. J Clin Invest 1997, 99, 3–8. [Google Scholar] [CrossRef]
- Mei, H.; Campbell, J.M.; Paddock, C.M.; Lertkiatmongkol, P.; Mosesson, M.W.; Albrecht, R.; Newman, P.J. Regulation of Endothelial Cell Barrier Function by Antibody-Driven Affinity Modulation of Platelet Endothelial Cell Adhesion Molecule-1 (PECAM-1) *. Journal of Biological Chemistry 2014, 289, 20836–20844. [Google Scholar] [CrossRef]
- Cao, G.; O’Brien, C.D.; Zhou, Z.; Sanders, S.M.; Greenbaum, J.N.; Makrigiannakis, A.; DeLisser, H.M. Involvement of Human PECAM-1 in Angiogenesis and in Vitro Endothelial Cell Migration. Am J Physiol Cell Physiol 2002, 282, C1181–1190. [Google Scholar] [CrossRef] [PubMed]
- Andreata, F.; Clément, M.; Benson, R.A.; Hadchouel, J.; Procopio, E.; Even, G.; Vorbe, J.; Benadda, S.; Ollivier, V.; Ho-Tin-Noe, B.; et al. CD31 Signaling Promotes the Detachment at the Uropod of Extravasating Neutrophils Allowing Their Migration to Sites of Inflammation. Elife 2023, 12, e84752. [Google Scholar] [CrossRef] [PubMed]
- Kuriri, F.A.; O’Malley, C.J.; Jackson, D.E. Molecular Mechanisms of Immunoreceptors in Platelets. Thromb Res 2019, 176, 108–114. [Google Scholar] [CrossRef]
- Pavlasova, G.; Mraz, M. The Regulation and Function of CD20: An “Enigma” of B-Cell Biology and Targeted Therapy. Haematologica 2020, 105, 1494–1506. [Google Scholar] [CrossRef] [PubMed]
- Casan, J.M.L.; Wong, J.; Northcott, M.J.; Opat, S. Anti-CD20 Monoclonal Antibodies: Reviewing a Revolution. Hum Vaccin Immunother 2018, 14, 2820–2841. [Google Scholar] [CrossRef]
- Carlson, A.K.; Amin, M.; Cohen, J.A. Drugs Targeting CD20 in Multiple Sclerosis: Pharmacology, Efficacy, Safety, and Tolerability. Drugs 2024, 84, 285–304. [Google Scholar] [CrossRef] [PubMed]
- Sun, L.; Su, Y.; Jiao, A.; Wang, X.; Zhang, B. T Cells in Health and Disease. Signal Transduct Target Ther 2023, 8, 235. [Google Scholar] [CrossRef]
- Zhen, A.; Krutzik, S.R.; Levin, B.R.; Kasparian, S.; Zack, J.A.; Kitchen, S.G. CD4 Ligation on Human Blood Monocytes Triggers Macrophage Differentiation and Enhances HIV Infection. J Virol 2014, 88, 9934–9946. [Google Scholar] [CrossRef]
- Jardine, L.; Barge, D.; Ames-Draycott, A.; Pagan, S.; Cookson, S.; Spickett, G.; Haniffa, M.; Collin, M.; Bigley, V. Rapid Detection of Dendritic Cell and Monocyte Disorders Using CD4 as a Lineage Marker of the Human Peripheral Blood Antigen-Presenting Cell Compartment. Front. Immunol. 2013, 4. [Google Scholar] [CrossRef]
- Chen, H.; Sameshima, J.; Yokomizo, S.; Sueyoshi, T.; Nagano, H.; Miyahara, Y.; Sakamoto, T.; Fujii, S.; Kiyoshima, T.; Guy, T.; et al. Expansion of CD4+ Cytotoxic T Lymphocytes with Specific Gene Expression Patterns May Contribute to Suppression of Tumor Immunity in Oral Squamous Cell Carcinoma: Single-Cell Analysis and in Vitro Experiments. Front Immunol 2023, 14, 1305783. [Google Scholar] [CrossRef]
- Eizenberg-Magar, I.; Rimer, J.; Zaretsky, I.; Lara-Astiaso, D.; Reich-Zeliger, S.; Friedman, N. Diverse Continuum of CD4+ T-Cell States Is Determined by Hierarchical Additive Integration of Cytokine Signals. Proceedings of the National Academy of Sciences 2017, 114, E6447–E6456. [Google Scholar] [CrossRef]
- Kruse, B.; Buzzai, A.C.; Shridhar, N.; Braun, A.D.; Gellert, S.; Knauth, K.; Pozniak, J.; Peters, J.; Dittmann, P.; Mengoni, M.; et al. CD4+ T Cell-Induced Inflammatory Cell Death Controls Immune-Evasive Tumours. Nature 2023, 618, 1033–1040. [Google Scholar] [CrossRef] [PubMed]
- Charles A Janeway, J.; Travers, P.; Walport, M.; Shlomchik, M.J. T Cell-Mediated Cytotoxicity. In Immunobiology: The Immune System in Health and Disease. 5th edition; Garland Science, 2001.
- Schmidt, M.E.; Varga, S.M. The CD8 T Cell Response to Respiratory Virus Infections. Front. Immunol. 2018, 9. [Google Scholar] [CrossRef] [PubMed]
- Koh, C.-H.; Lee, S.; Kwak, M.; Kim, B.-S.; Chung, Y. CD8 T-Cell Subsets: Heterogeneity, Functions, and Therapeutic Potential. Exp Mol Med 2023, 55, 2287–2299. [Google Scholar] [CrossRef] [PubMed]
- Brummel, K.; Eerkens, A.L.; de Bruyn, M.; Nijman, H.W. Tumour-Infiltrating Lymphocytes: From Prognosis to Treatment Selection. Br J Cancer 2023, 128, 451–458. [Google Scholar] [CrossRef] [PubMed]
- Buruiană, A.; Gheban, B.-A.; Gheban-Roșca, I.-A.; Georgiu, C.; Crișan, D.; Crișan, M. The Tumor Stroma of Squamous Cell Carcinoma: A Complex Environment That Fuels Cancer Progression. Cancers 2024, 16, 1727. [Google Scholar] [CrossRef] [PubMed]
- Bose, P.; Brockton, N.T.; Guggisberg, K.; Nakoneshny, S.C.; Kornaga, E.; Klimowicz, A.C.; Tambasco, M.; Dort, J.C. Fractal Analysis of Nuclear Histology Integrates Tumor and Stromal Features into a Single Prognostic Factor of the Oral Cancer Microenvironment. BMC Cancer 2015, 15, 409. [Google Scholar] [CrossRef]
- Goutzanis, L.P.; Papadogeorgakis, N.; Pavlopoulos, P.M.; Petsinis, V.; Plochoras, I.; Eleftheriadis, E.; Pantelidaki, A.; Patsouris, E.; Alexandridis, C. Vascular Fractal Dimension and Total Vascular Area in the Study of Oral Cancer. Head Neck 2009, 31, 298–307. [Google Scholar] [CrossRef]
- Margaritescu, C.; Raica, M.; Pirici, D.; Simionescu, C.; Mogoanta, L.; Stinga, A.C.; Stinga, A.S.; Ribatti, D. Podoplanin Expression in Tumor-Free Resection Margins of Oral Squamous Cell Carcinomas: An Immunohistochemical and Fractal Analysis Study. Histol Histopathol 2010, 25, 701–711. [Google Scholar] [CrossRef]
- Capasso, A.; Viggiano, D.; Lee, M.W.; Palladino, G.; Bilancio, G.; Simeoni, M.; Capolongo, G.; Secondulfo, C.; Ronchi, A.; Caputo, A.; et al. Kidney Transplant Modifies the Architecture and Microenvironment of Basal Cell Carcinomas. Kidney and Blood Pressure Research 2020, 45, 368–377. [Google Scholar] [CrossRef]
Figure 1.
Internal stain control for CD31 (A), CD20 (B), CD 4 (C), and CD8 (D) was performed on a sample of lingual tonsil tissue.
Figure 1.
Internal stain control for CD31 (A), CD20 (B), CD 4 (C), and CD8 (D) was performed on a sample of lingual tonsil tissue.
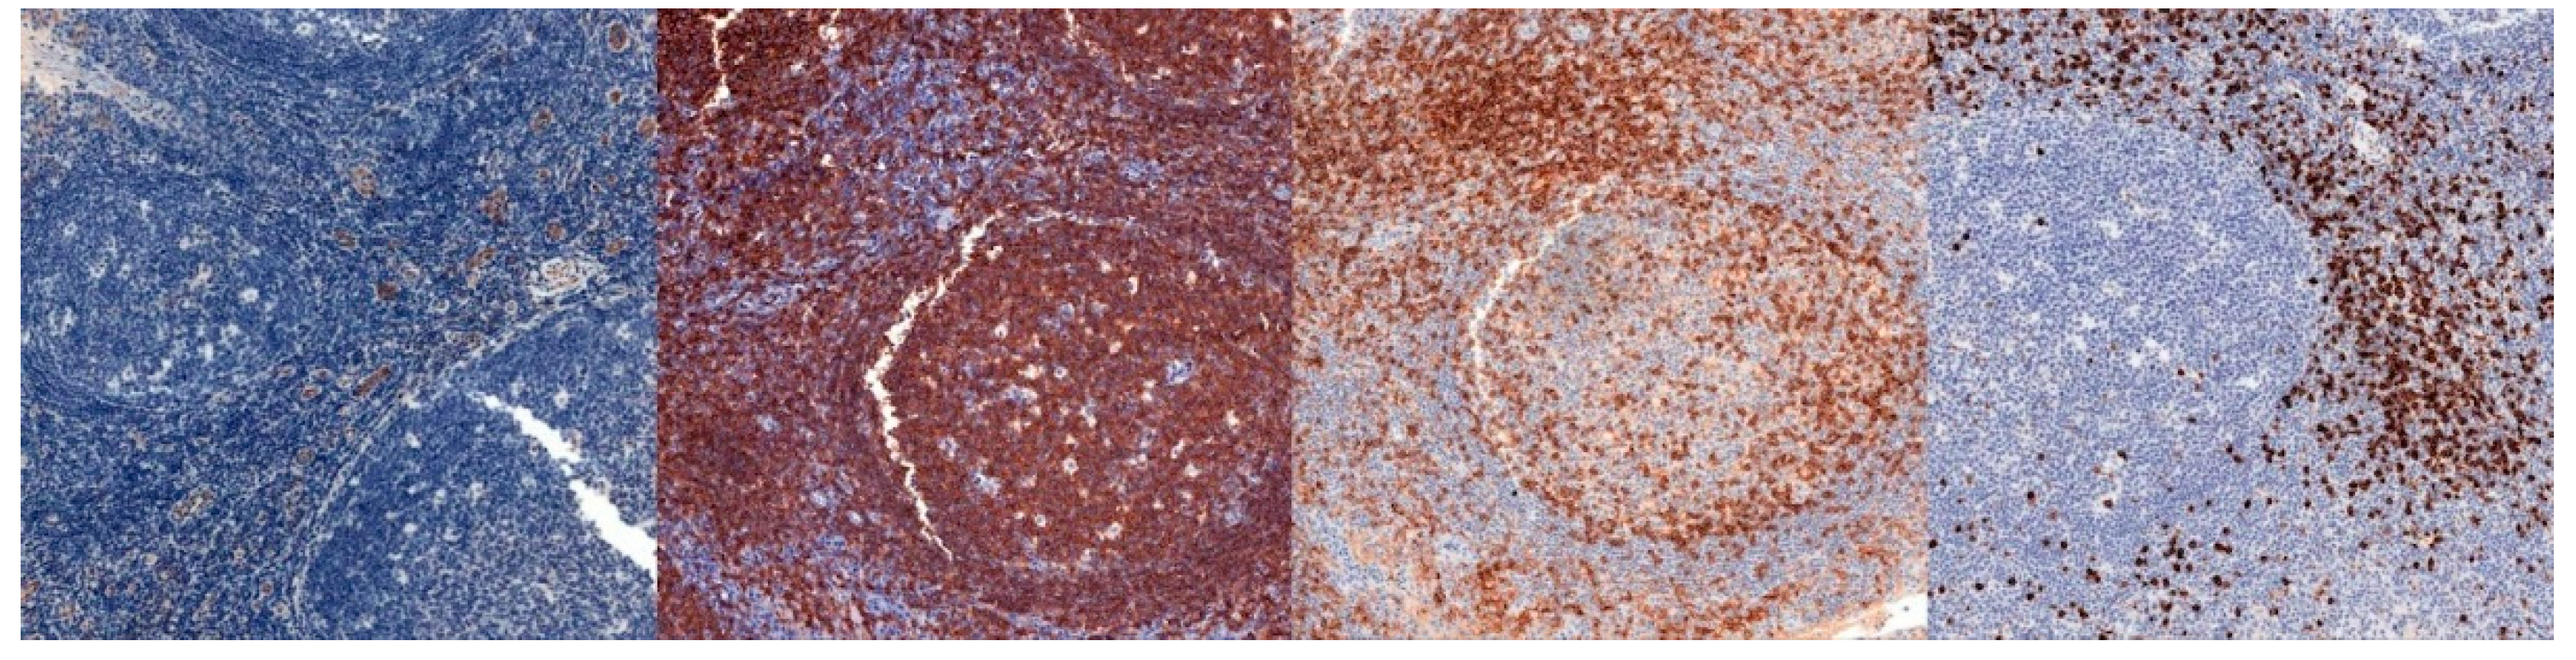
Figure 2.
Dataset sample: pre-invasive CD31 (A), CD20 (B), CD 4 (C) and CD8 (D), and invasive CD31 (E), CD20 (F), CD 4 (G) and CD8 (H).
Figure 2.
Dataset sample: pre-invasive CD31 (A), CD20 (B), CD 4 (C) and CD8 (D), and invasive CD31 (E), CD20 (F), CD 4 (G) and CD8 (H).
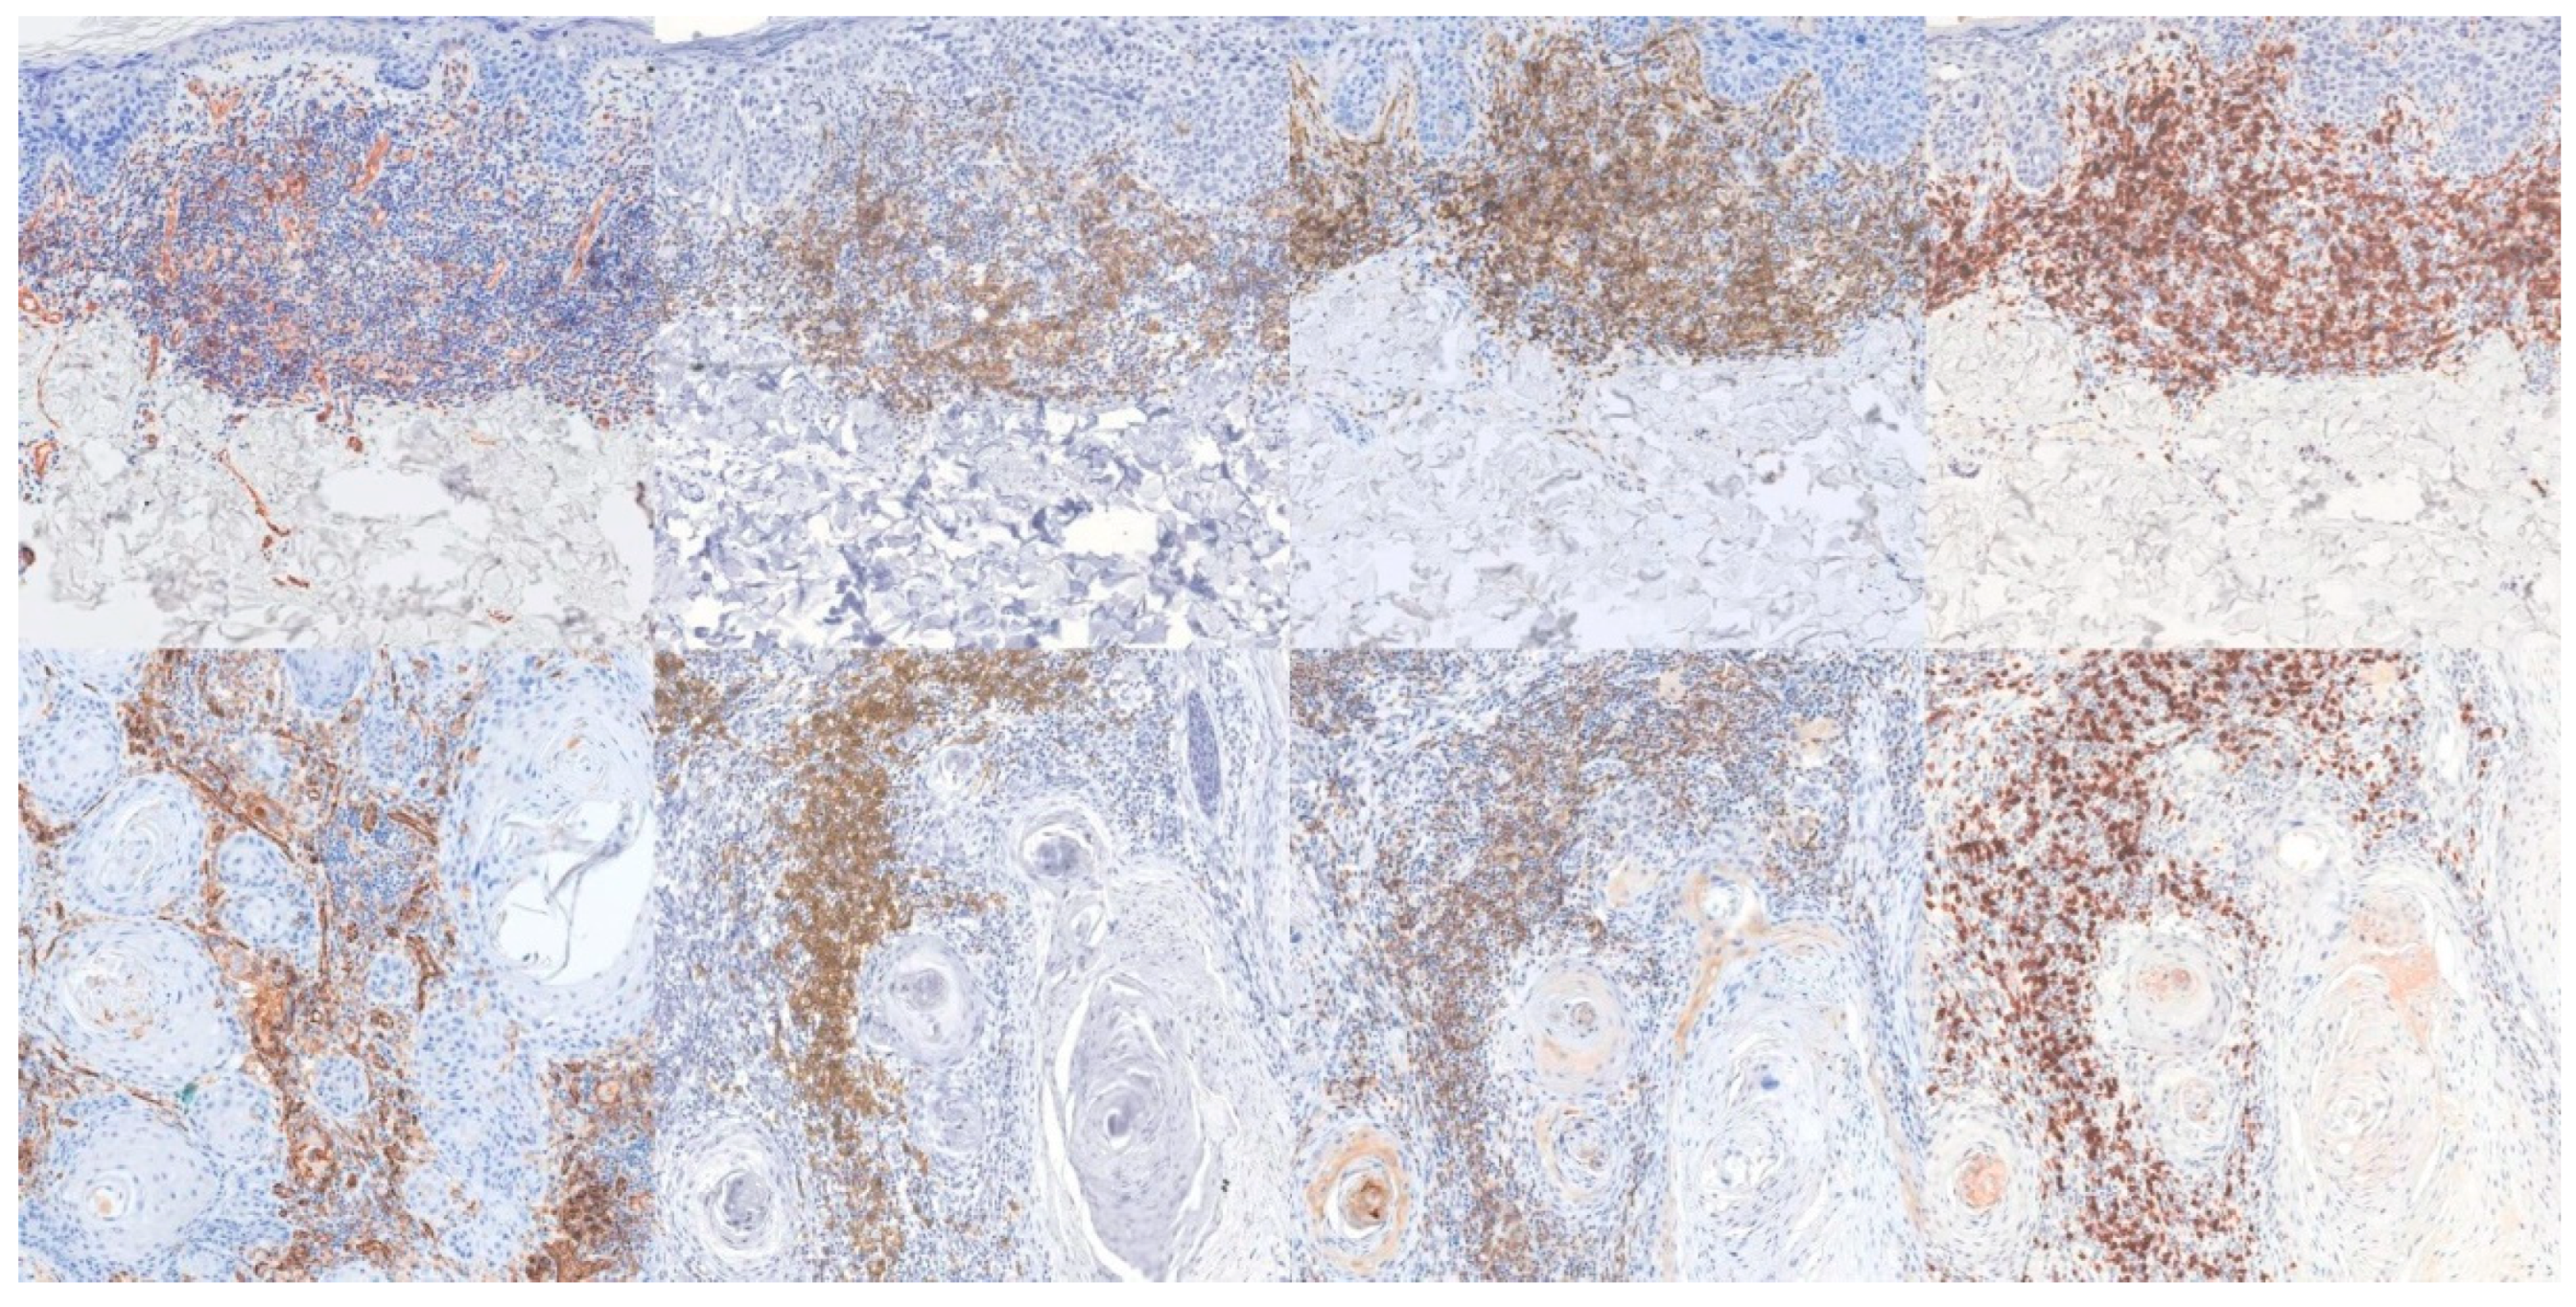
Figure 3.
IHC channel split. First column - IHC image, second column - marked structures, third column unmarked structures, fourth column - background. Rows, from top to bottom: pre-invasive CD31, CD20, CD4, CD8, and invasive CD31, CD20, CD4, CD8.
Figure 3.
IHC channel split. First column - IHC image, second column - marked structures, third column unmarked structures, fourth column - background. Rows, from top to bottom: pre-invasive CD31, CD20, CD4, CD8, and invasive CD31, CD20, CD4, CD8.
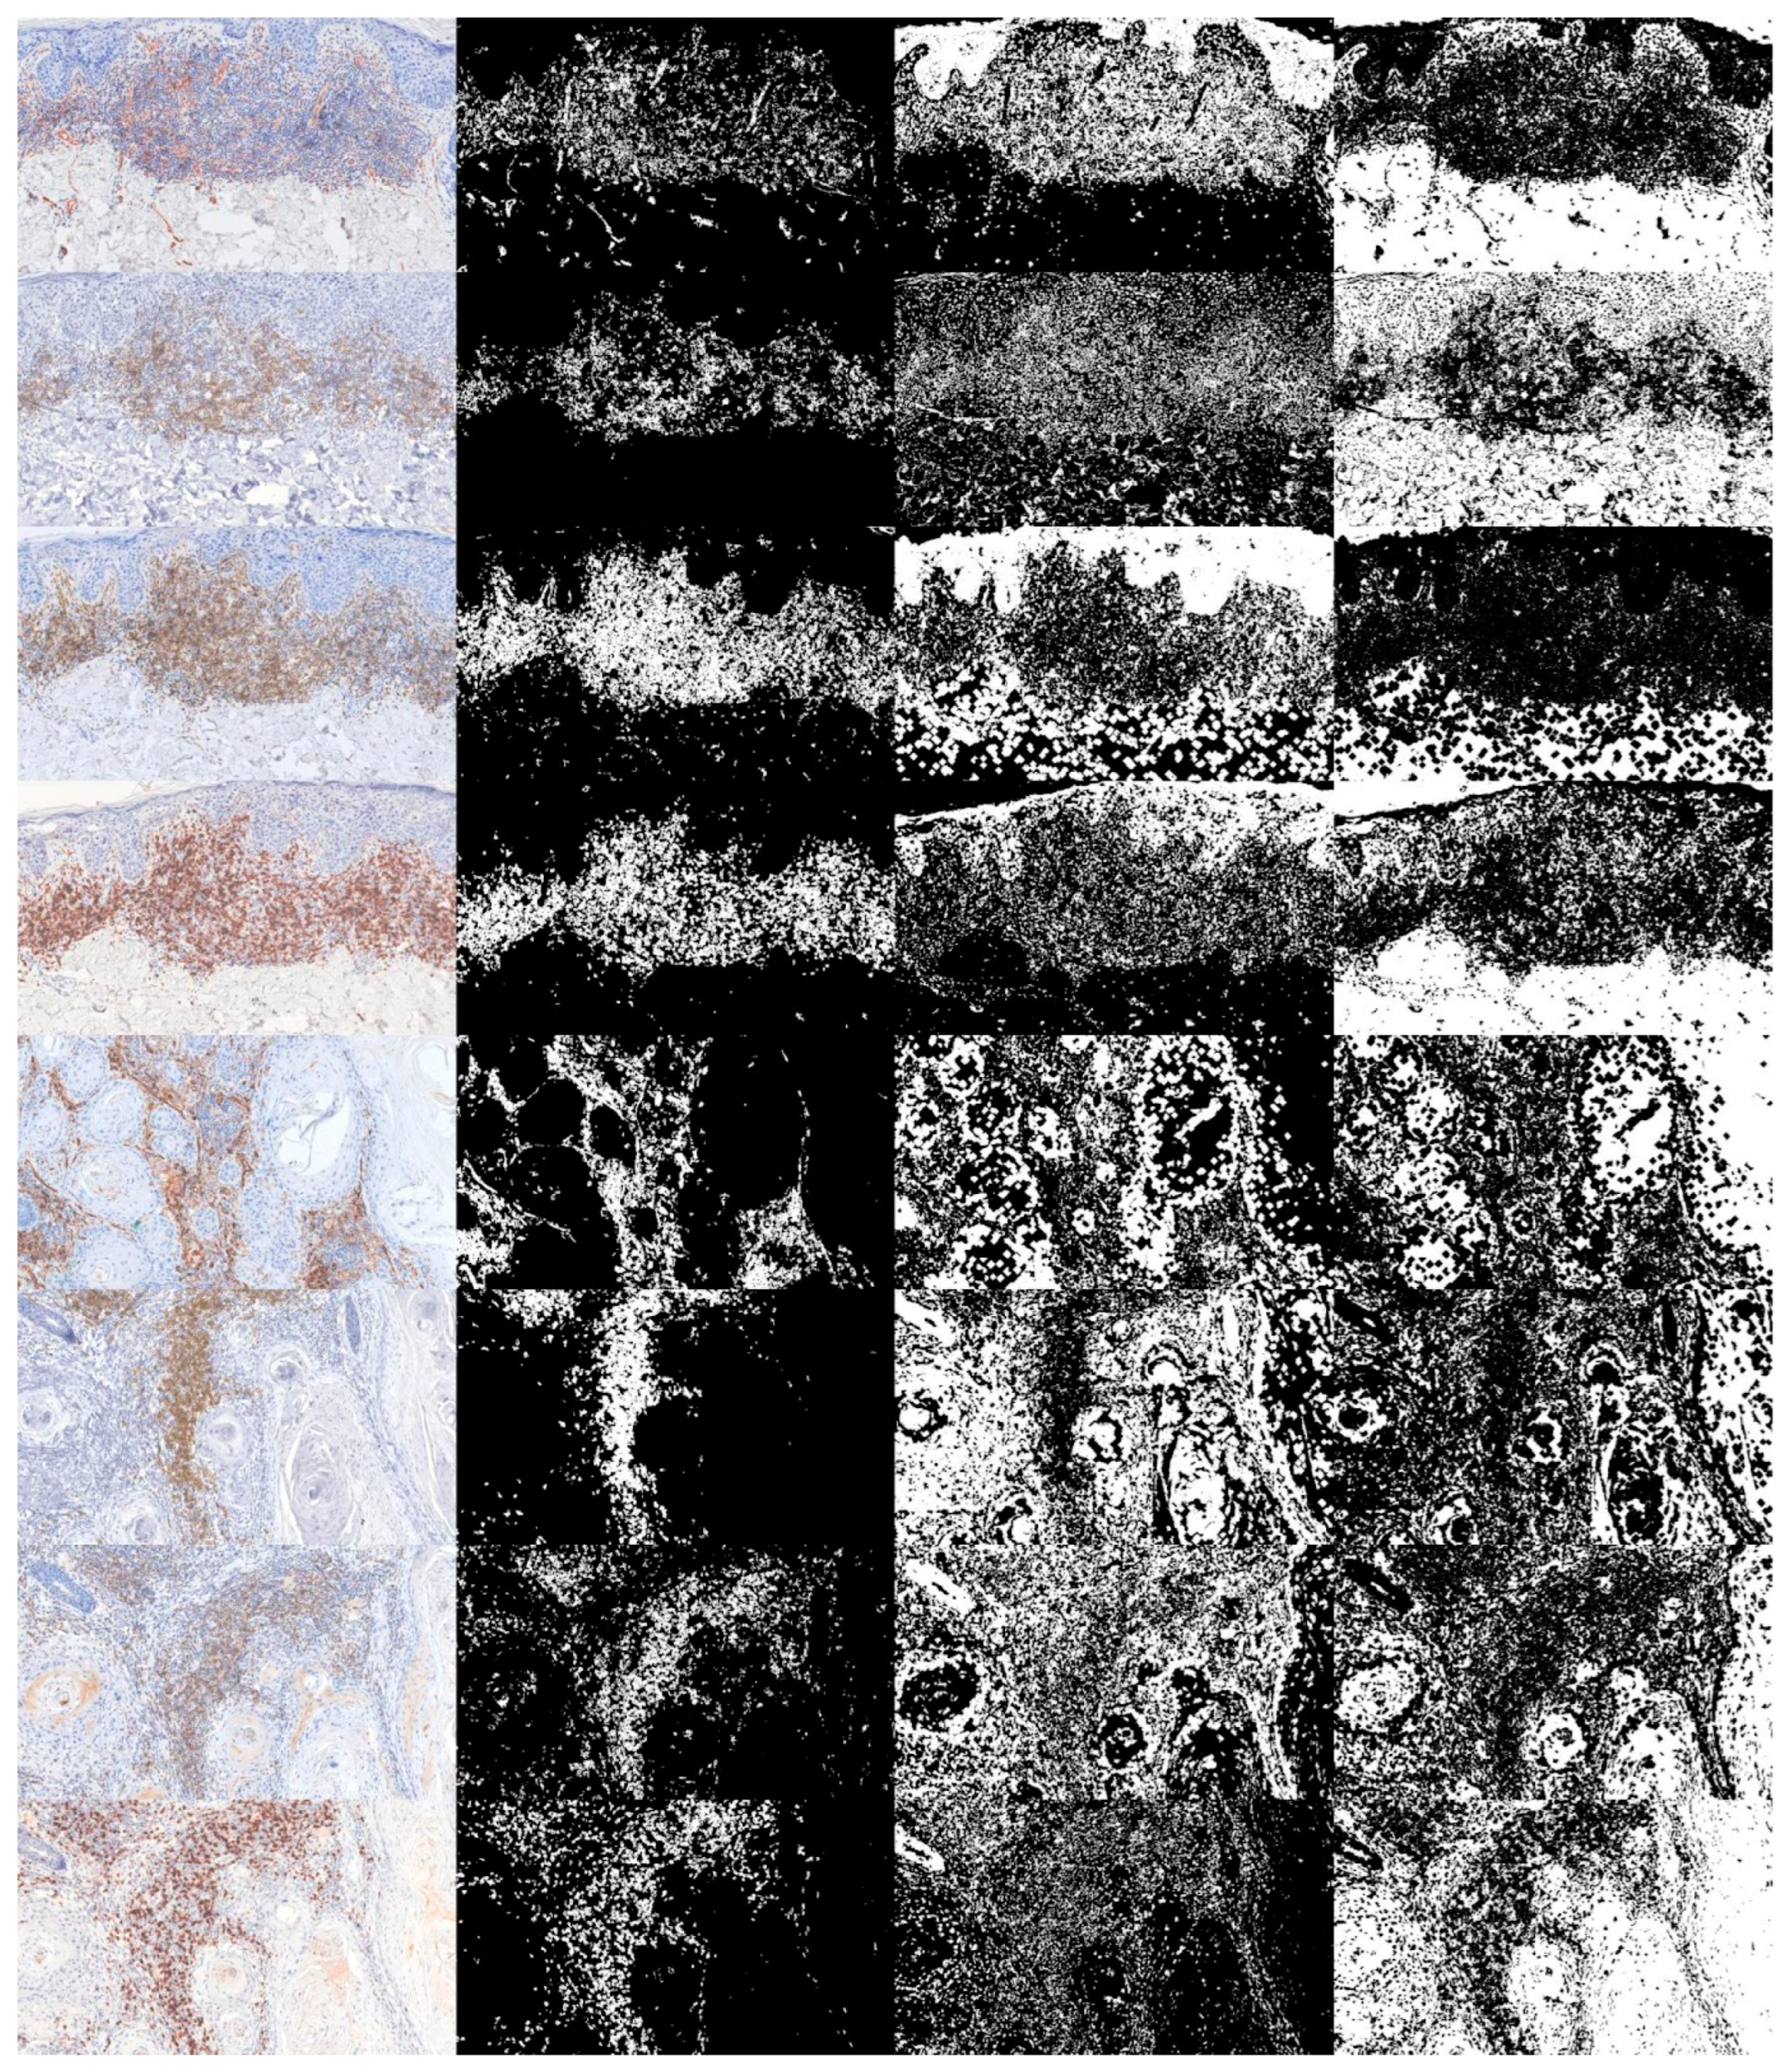
Figure 4.
FD on the marked structures. CD31 and CD20 show statistically different values, while CD4 and CD8 do not. P stands for pre-invasive, while I stands for invasive.
Figure 4.
FD on the marked structures. CD31 and CD20 show statistically different values, while CD4 and CD8 do not. P stands for pre-invasive, while I stands for invasive.
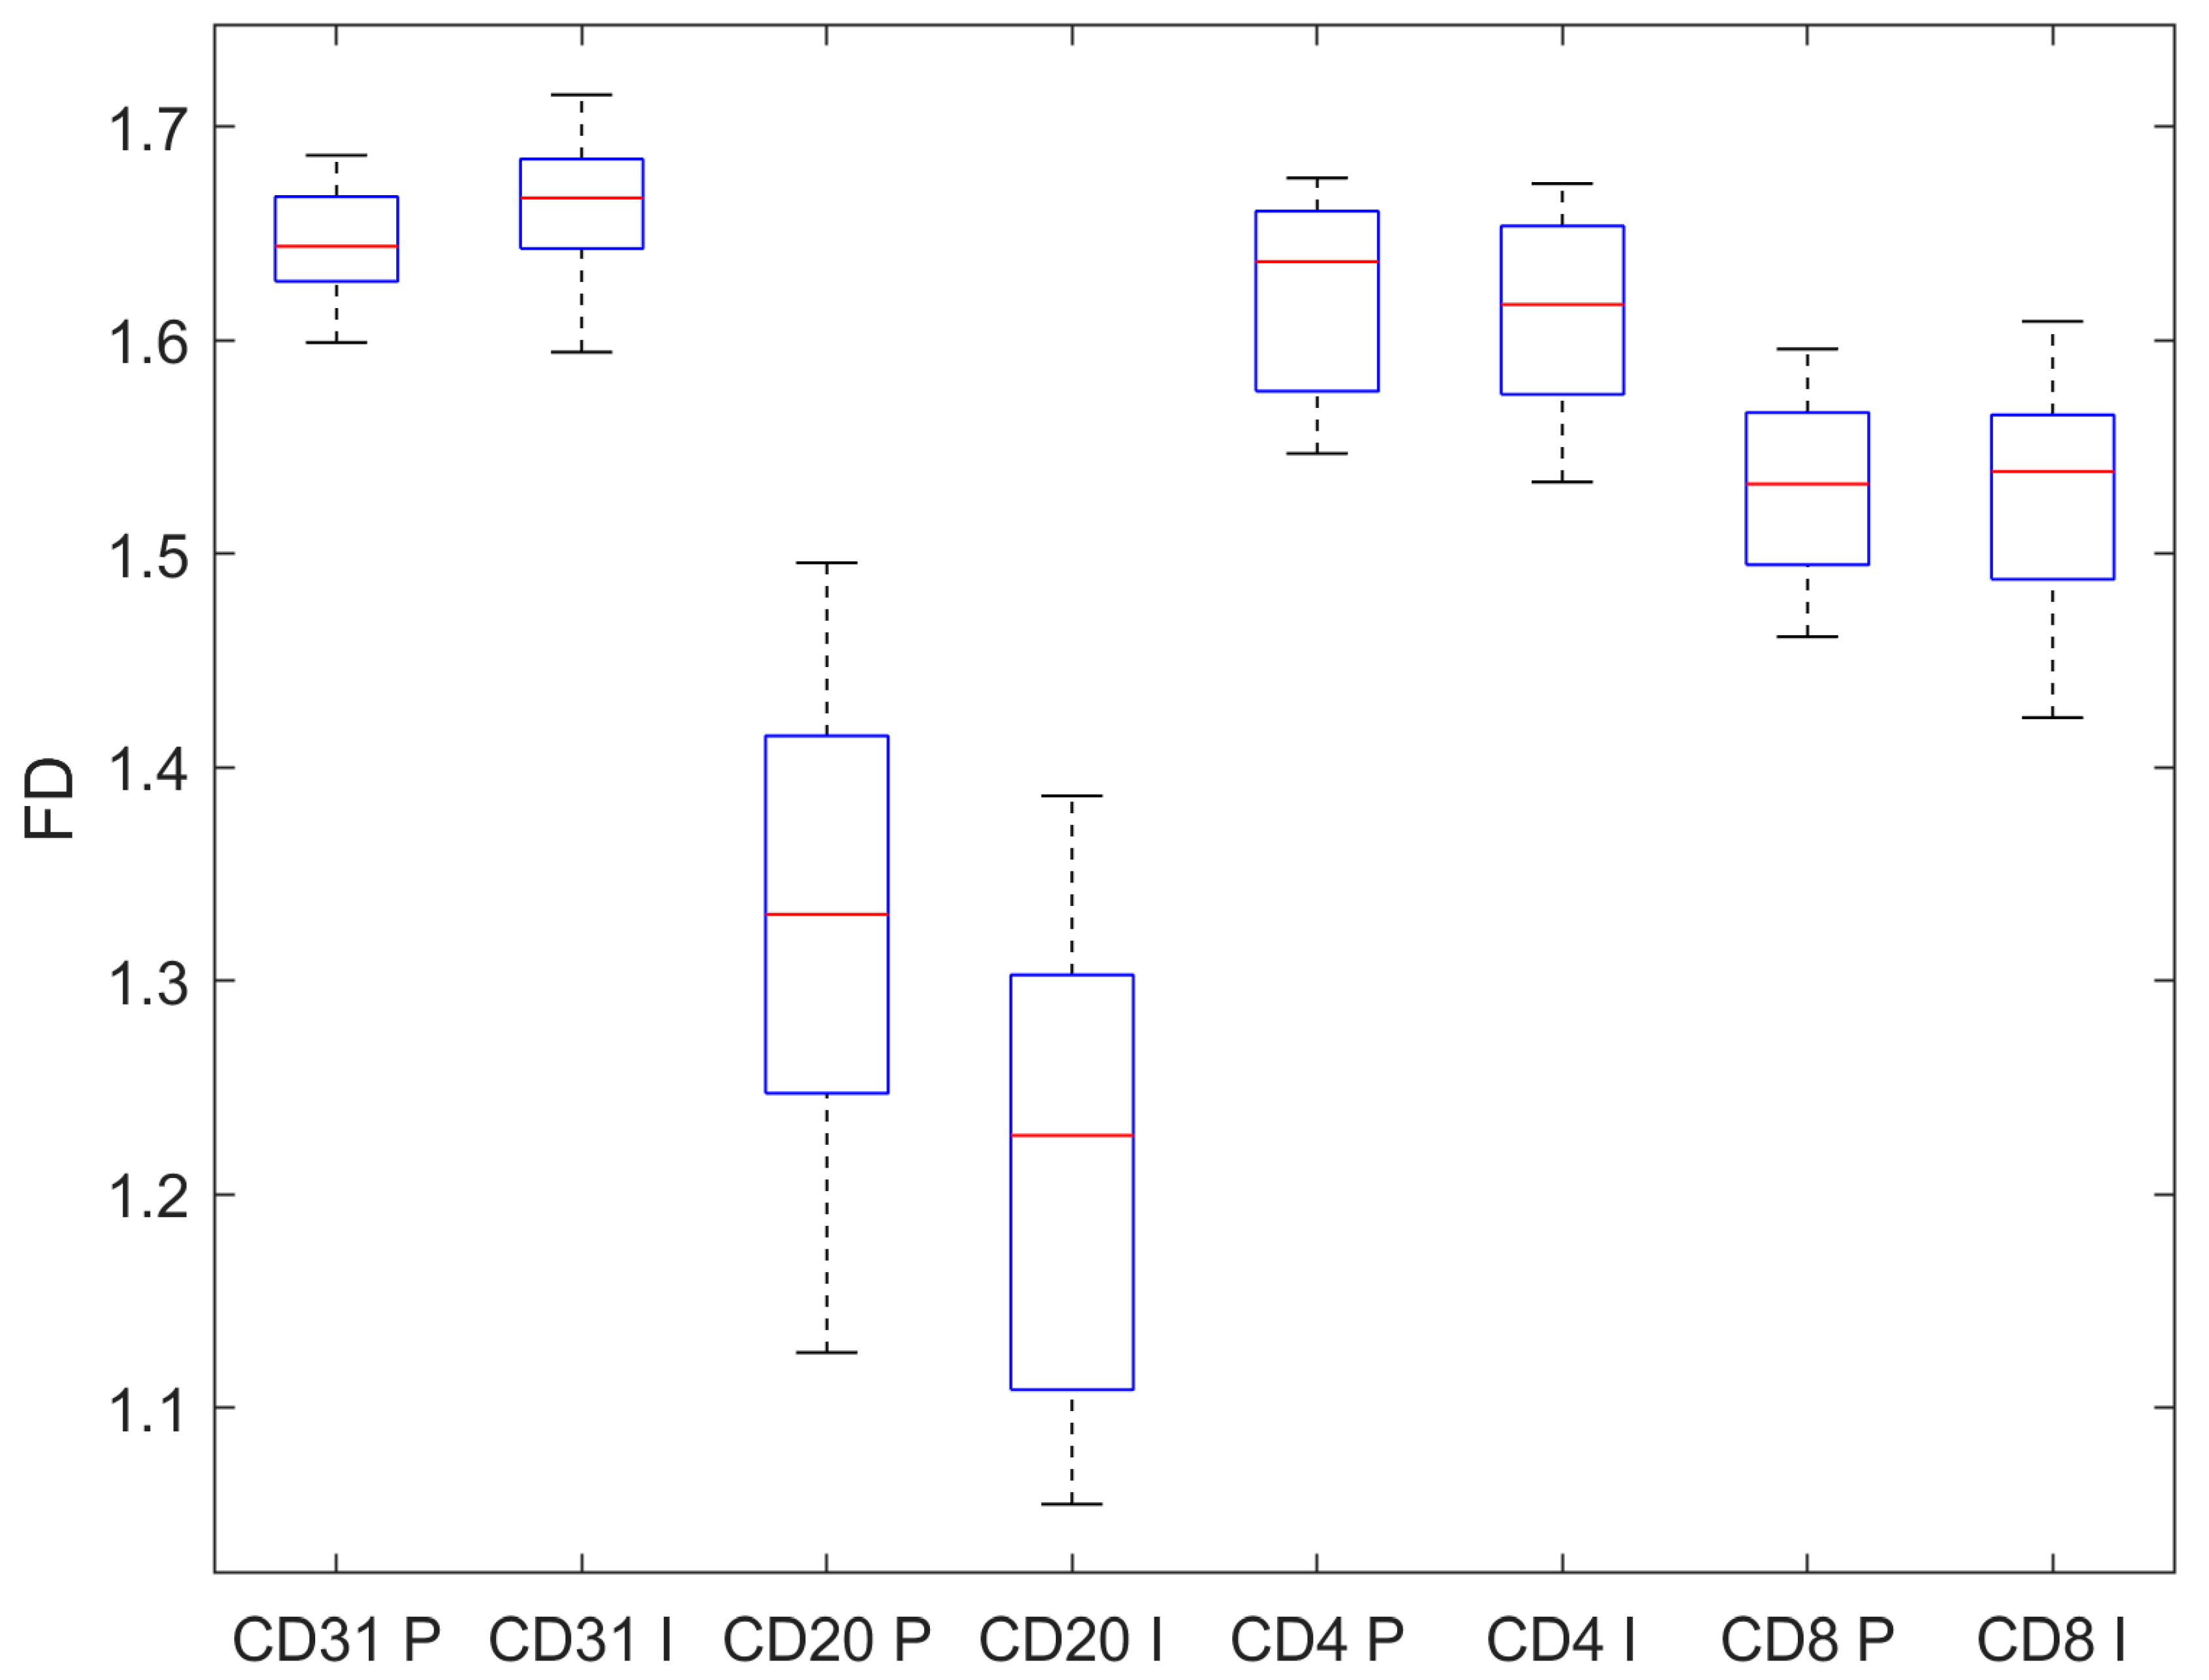
Figure 5.
FD on the unmarked structures. CD31, CD4, and CD8 show statistically different values, while CD20 does not. P stands for pre-invasive, while I stands for invasive.
Figure 5.
FD on the unmarked structures. CD31, CD4, and CD8 show statistically different values, while CD20 does not. P stands for pre-invasive, while I stands for invasive.
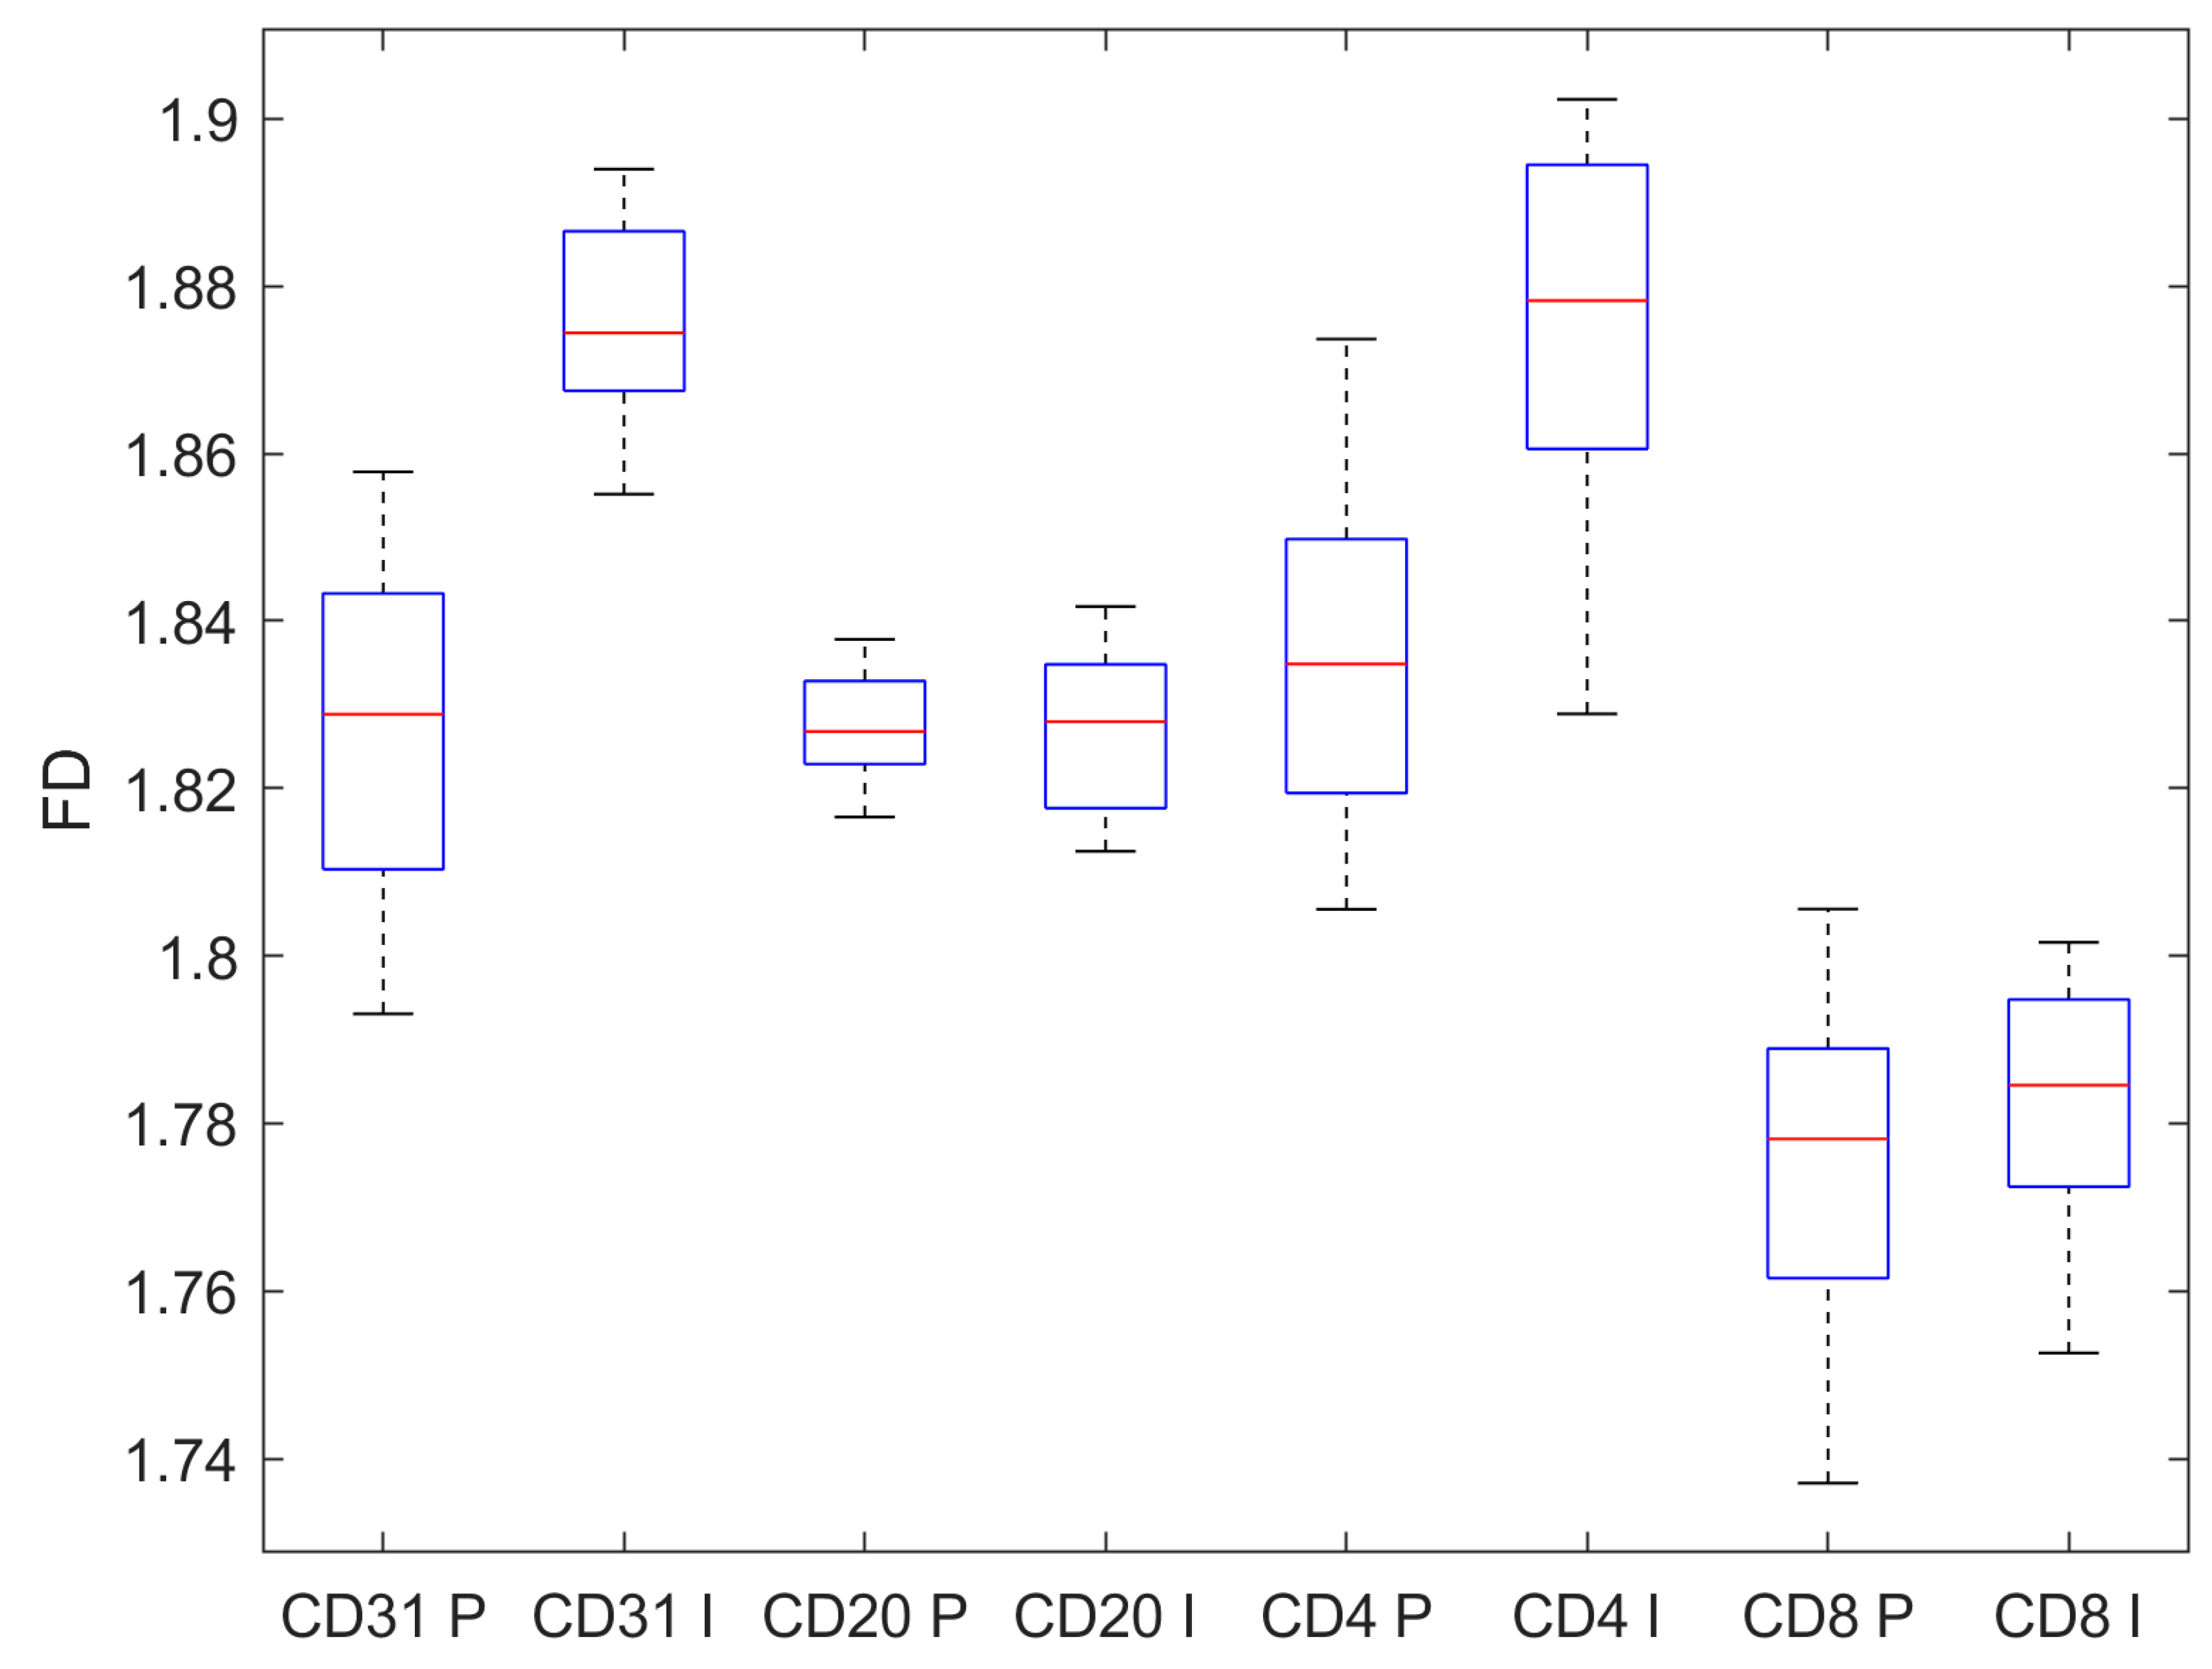
Figure 6.
FD on the background. All immunohistochemical staining exhibit statistical different FD values. P stands for pre-invasive, while I stands for invasive.
Figure 6.
FD on the background. All immunohistochemical staining exhibit statistical different FD values. P stands for pre-invasive, while I stands for invasive.
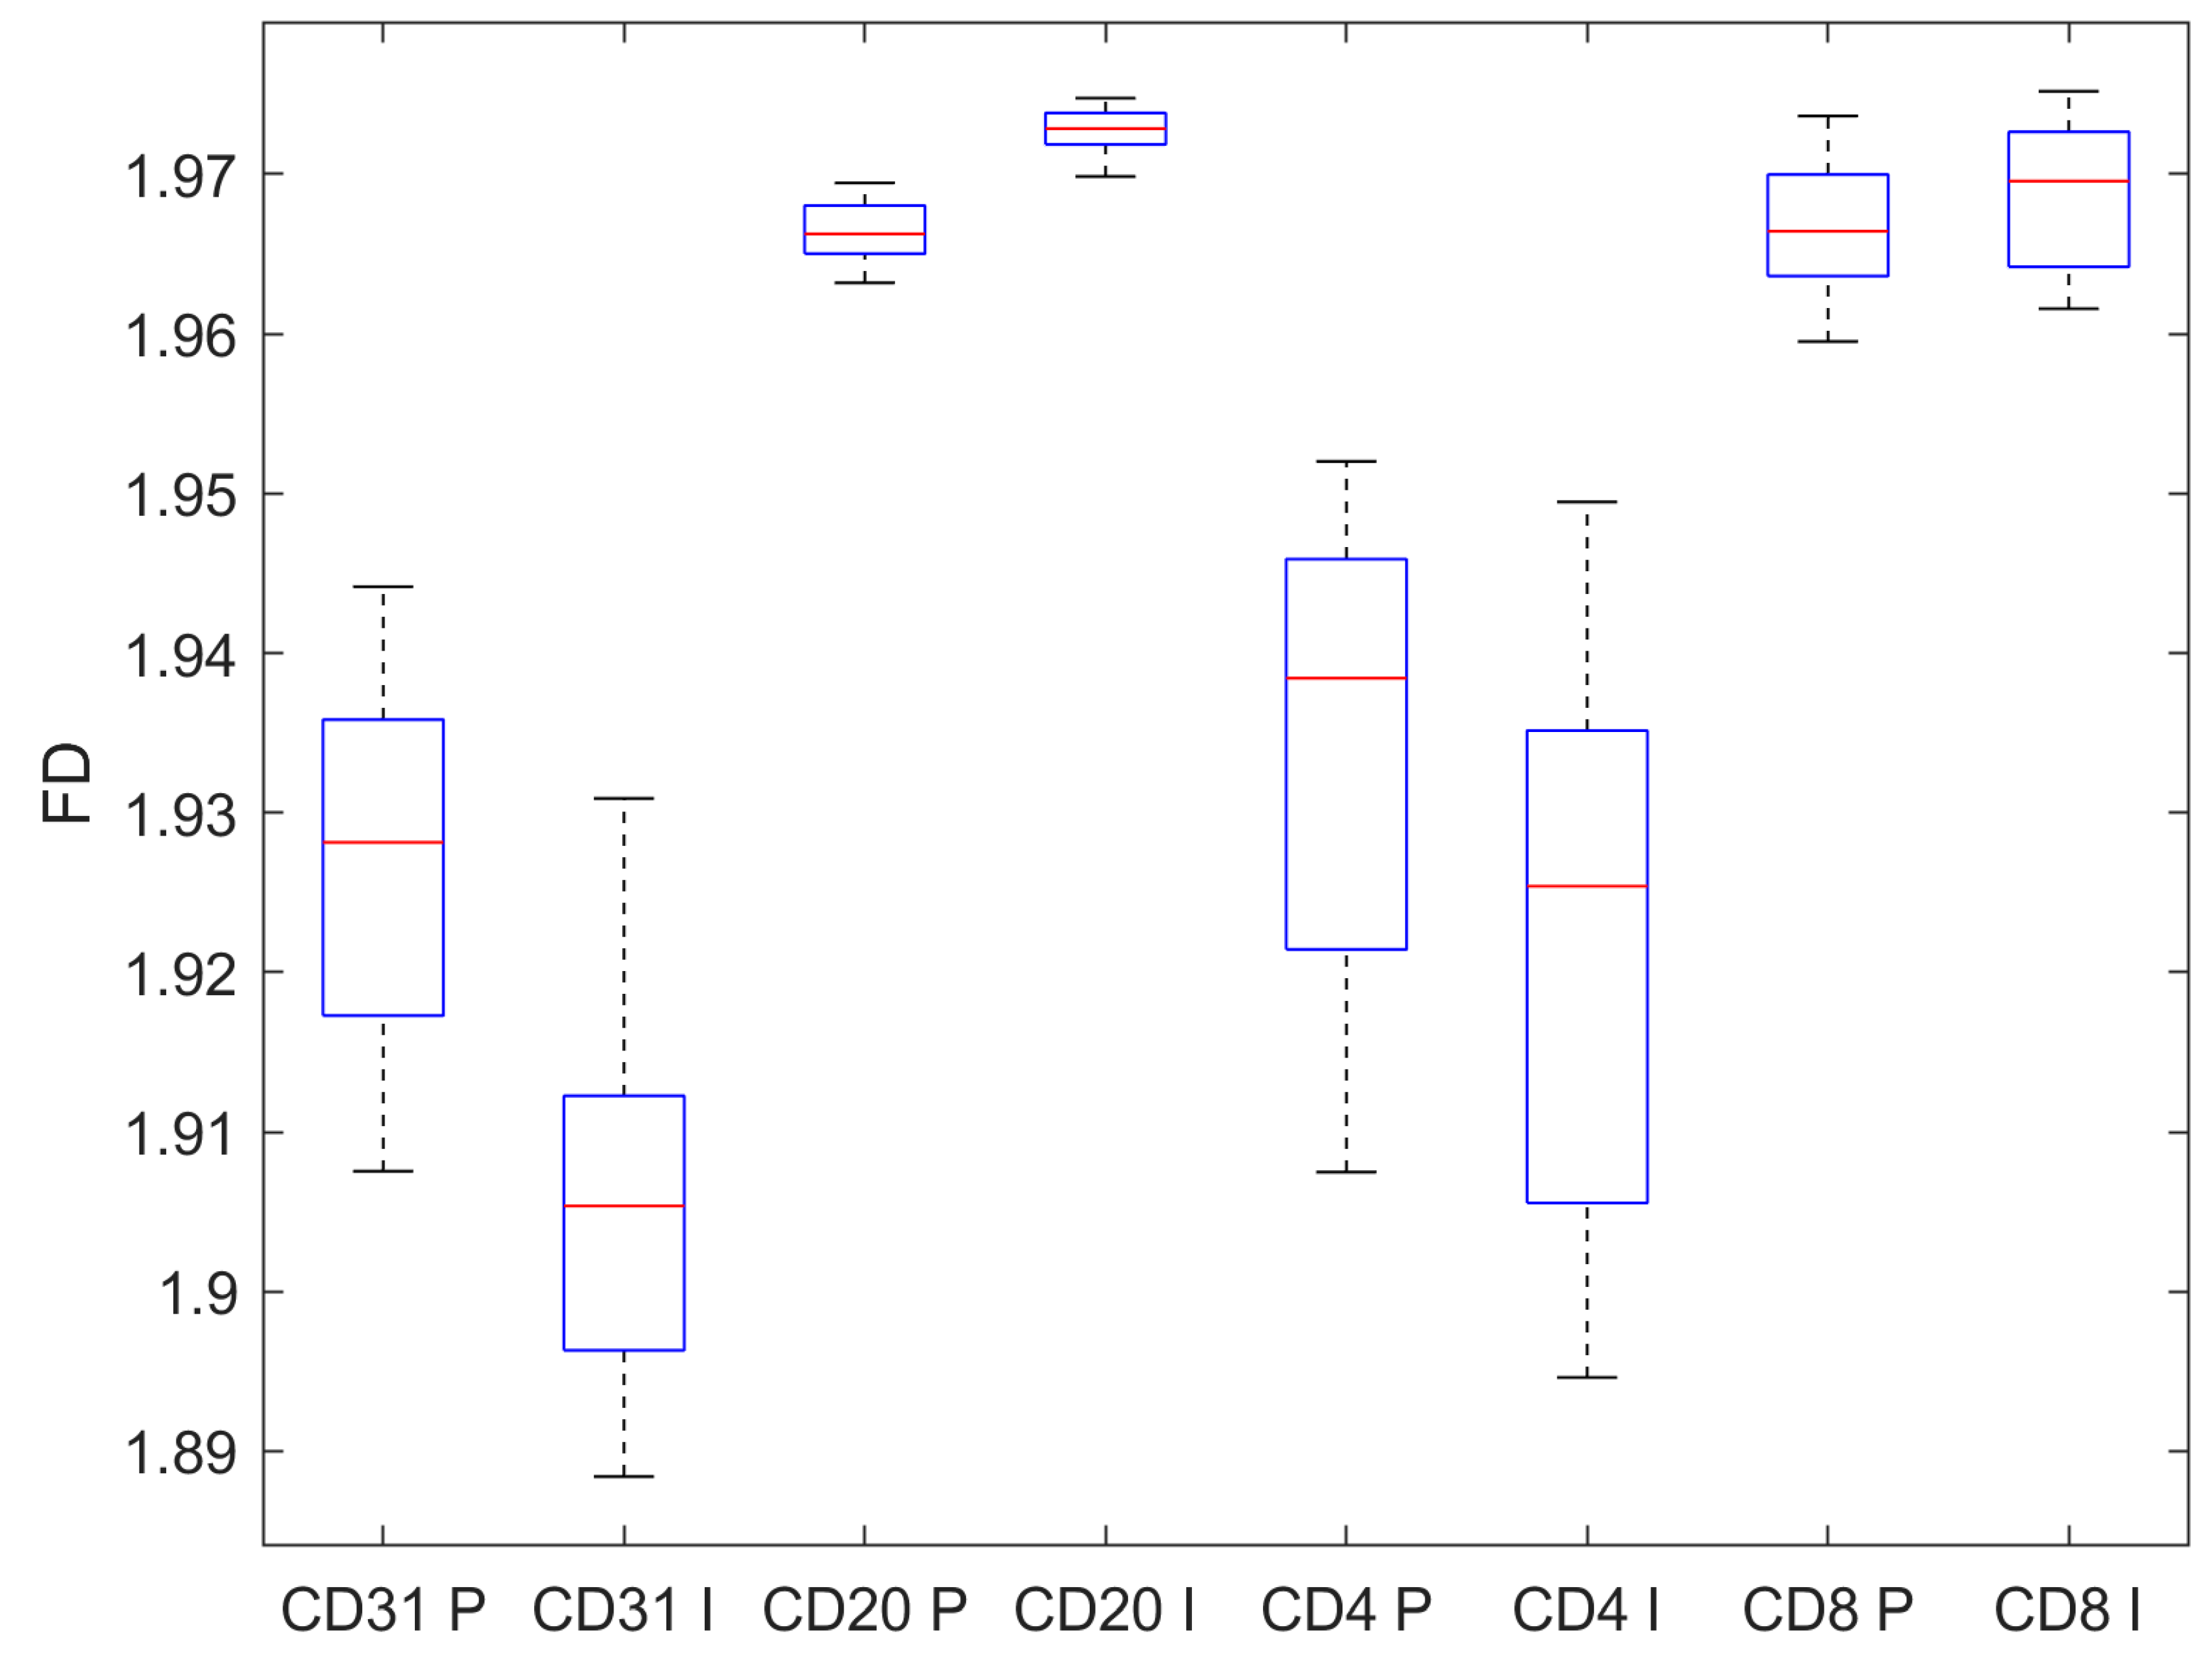

Table 1.
FD on the marked structures. Mean and SD of the computed FD.
| CD31 | CD20 | CD4 | CD8 | |
|---|---|---|---|---|
| Pre-invasive | 1.645 ± 0.024 | 1.321 ± 0.104 | 1.623 ± 0.041 | 1.530 ± 0.041 |
| Invasive | 1.661 ± 0.035 | 1.220 ± 0.102 | 1.610 ± 0.046 | 1.527 ± 0.053 |
| p, t-test | 0.010 | < 0.001 | 0.133 | 0.738 |
Table 2.
FD on the unmarked structrures. Mean and SD of the computed FD.his is a table.
| CD31 | CD20 | CD4 | CD8 | |
|---|---|---|---|---|
| Pre-invasive | 1.827 ± 0.019 | 1.827 ± 0.006 | 1.835 ± 0.020 | 1.774 ± 0.019 |
| Invasive | 1.876 ± 0.012 | 1.827 ± 0.009 | 1.875 ± 0.021 | 1.783 ± 0.014 |
| p, t-test | <0.001 | 0.619 | <0.001 | 0.007 |
Table 3.
FD on the background. Mean and SD of the computed FD.
| CD31 | CD20 | CD4 | CD8 | |
|---|---|---|---|---|
| Pre-invasive | 1.926 ± 0.011 | 1.966 ± 0.002 | 1.934 ± 0.015 | 1.967 ± 0.004 |
| Invasive | 1.906 ± 0.011 | 1.973 ± 0.001 | 1.922 ± 0.017 | 1.969 ± 0.004 |
| p, t-test | <0.001 | <0.001 | <0.001 | 0.019 |
Table 4.
FD on the marked structures. Mean and SD of the computed FD.
| CD4/CD8 | CD4+CD8 | (CD4+CD8)/CD20 | |
|---|---|---|---|
| Pre-invasive | 1.061 ± 0.006 | 3.153 ± 0.082 | 2.397 ± 0.132 |
| Invasive | 1.055 ± 0.009 | 3.136 ± 0.099 | 2.581 ± 0.136 |
| p, t-test | 0.010 | 0.368 | <0.001 |
Disclaimer/Publisher’s Note: The statements, opinions and data contained in all publications are solely those of the individual author(s) and contributor(s) and not of MDPI and/or the editor(s). MDPI and/or the editor(s) disclaim responsibility for any injury to people or property resulting from any ideas, methods, instructions or products referred to in the content. |
© 2024 by the authors. Licensee MDPI, Basel, Switzerland. This article is an open access article distributed under the terms and conditions of the Creative Commons Attribution (CC BY) license (http://creativecommons.org/licenses/by/4.0/).
Copyright: This open access article is published under a Creative Commons CC BY 4.0 license, which permit the free download, distribution, and reuse, provided that the author and preprint are cited in any reuse.


