
Submitted:
04 September 2024
Posted:
05 September 2024
You are already at the latest version
Abstract
The nEDM experiment at Oak Ridge’s Spallation Neutron Source will probe for an electric dipole moment of the neutron at an unprecedented level of sensitivity. Polarized 3He atoms dressed by a radio-frequency field are a crucial component. For field parameters comparable to the parameters being used in the nEDM experiment, numerical studies using a fourth-order Runge-Kutta solver reveal inadequacies in earlier analyses of 3He spin dynamics. It’s seen that neutron absorption is influenced by avoided level-crossings omitted previously. Also, the critical dressing condition, used to eliminate effects of the static magnetic field, requires modification. First-order perturbative corrections to eigenstates and third-order corrections to eigenenergies are needed to account for the impact of avoided level-crossings and the changes in the critical dressing condition, respectively.
Keywords:
spin dressing
; ultra cold neutrons
; magnetic resonance
; quantum mechanics
; perturbation theory
1. Spin Dressing Theory
1.1. Spin Dressing Introduction
Understanding the dynamics of spin dressing in regards to the nEDM experiment is crucial for reliable measurements at never before reached sensitives. From the Golub, Lamoreaux Physics Reports paper [1], the Hamiltonian in Equation 1 contains everything I need for a basic spin dressing framework. Given a spin 1/2 particle in a static magnetic field along +z and an oscillating magnetic field along x with frequency , the quantized Hamiltonian is
where is the gyromagnetic ratio of the particle, and is the volume of the trap. I will treat the last term in Equation 1, the static field term, as a perturbation. The Hamiltonian can be transformed [2] such that the unperturbed eigenstates can be defined as
 where is an eigenstate of with eigenvalue and for a spin 1/2 particle, . Going forward, I will express states at or . |n> is an eigenstate of with eigenvalue n. and its definition starts from the energy density of magnetic field given as such that where .
After the transformation, the energy eigenvalues, which are the degenerate in , present themselves as
With the Hamiltonian now transformed, expectation values will require calculation of the inner product of two bar states. The calculation and proof originally done in [2] is shown in Appendix A. The Physics Reports [1] has the eigenstates as
 where and is an equivalent form of the eigenvectors shown in Appendix A for spin along +z and -z (). Going forward, I will write as m and any spin states with a + or - is a state in the x basis.
1.2. Expectation Values
Given Equation 4 are eigenstates that lift the degeneracy in the Hamiltonian, I can now derive expressions for spin expectation values as done in [1]. For each component that follows, I will first show the matrix elements using Equation 4 and then incorporate the elements into a time dependent wave function.
The matrix elements for are
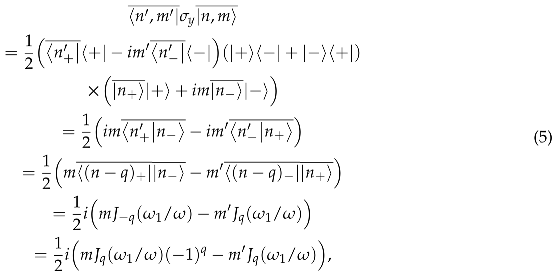 so that the expectation value is
are Glauber coefficients which describe the probability amplitudes of photons of a harmonic field. They can be expressed as
where , the average photon number. Then for large n, . Given selection rules on m and and summing over these values, the expectation value for becomes
For , the matrix elements are
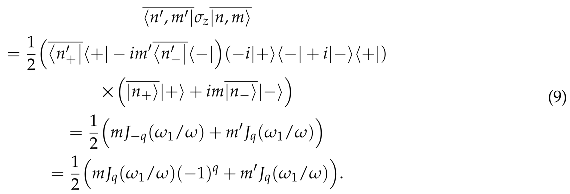 So that the expectation value is
And finally, for
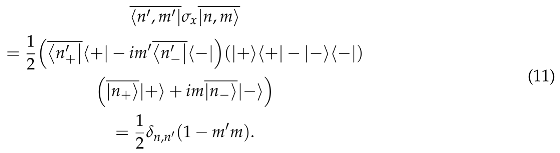 So that the expectation value is
Thus, I have expressions for how spin expectations values evolve through time.
When it comes to my simulation work, the comparison of simulation data versus these expressions is important to benchmark the simulations before extending them to higher complexities. After making a fourth order Runge-Kutta (RK4) solver in Matlab to solve the spin Bloch equations, I saw there were frequencies matching with theory as well as additional frequencies which have not been accounted for in the Physics Reports. Furthermore, I saw confluence of the RK4 results with the near-exact Hamiltonian method shown in a later section. Given how the RK4 results vary with the parameter , perturbation theory became my focus to try to account for the additional frequencies. Also, the experiment uses and so examination of whether this parameter is sufficiently small to only use the first order corrections to the eigenvalues is quite important.
2. The 4th Order Runge-Kutta Solver for the Spin Bloch Equations
The spin Bloch equations can be solved in Matlab by constructing a fourth-order Runge-Kutta solver. Given the Bloch equations
I can specify field parameters, time steps, simulation time and initial conditions as inputs into my RK4. For spin dressing, I simply have to use the appropriate fields and solve for the spin components. The fields will be
An example of a three dimensional spin dressing simulation between UCN and 3He is shown in Figure 1.
Using initial conditions on the time dependent spin components of , and , time steps of seconds for the spin components and for magnetic field time steps, the RK4 will solve for each spin time series.
For the rest of this chapter, the simulation time is (the actual computation can take anywhere from minutes to hours). For the number of particles, I will use . Finally, the first results I will show have field parameters of
The results are spins as a function of time: , and . I then take the fast Fourier transform (FFT) of these time series and to see relevant frequencies. From the theory in the previous section, I expect certain frequencies for each spin component. The plots in Figure 2 to 4 are the FFTs of the spins for the parameters in Equation 15. In light green is simulation data and in black is theory using the expectation values from last section. The time steps are very small and therefore the frequency range is large so the plots are zoomed in for better inspection of the relevant frequencies.
The theory in Figure 2-4 are the predicted results from Equations 8, 10 and 12, respectively. As seen, there are frequencies and harmonics consistent with the expectation values in that section. Furthermore, the ratio of the heights of the expected peaks are in-line with ratios of amplitudes of Bessel functions of the first kind of corresponding order. But what is quite interesting are the peaks that the theory doesn’t predict. In Figure 4 for , I see these ’unexpected’ frequencies of and are almost negligible. But in Figure 2 showing , the unexpected peaks at and are not negligible. And for in Figure 3, the unexpected frequencies of and have meaningful intensities as well. Figure 5 and 6 show what Figure 3 and 4 showed but for meaning is ten times larger.
What’s interesting is that the unexpected frequencies decreased in height substantially between and . Given y is a measure of the perturbing static field relative to the rate of oscillation of the dressing field, intensity dependence on y points to missing higher order perturbation theory terms.
The question then is: are these unexpected frequencies due to the RK4 numerical solver issues in Matlab or is it from higher order perturbation theory terms? The reduction in intensity when y is smaller would suggest the latter. Some theoretical models use y anywhere between 0.10 and 0.01 while the experiment will use . Figure 7 to 9 show how these unexpected frequency peaks change as the perturbation strength changes. I chose two frequencies from ( and ) and one each from () and (). Then stepped y by 0.0001 between 0.01 and 0.10.
The oscillatory behavior in Figure 7 to 9 most likely comes from numerical issues within the solver. From Figure 9, the unexpected frequencies I chose from and show linear in y dependence. And from Figure 7 and 8, unexpected frequencies for show and y dependence respectively. Going forward, I will call these unexpected frequencies .
Given the dependence on y, the anomalies most likely come from perturbation theory. The next section shows a different method for solving for expectation values and frequencies of spin components to provide further evidence that the anomalies are not artifacts. If it can give confluence to the RK4 method, I will use higher order perturbation theory to more accurately represent this system.
3. The Hamiltonian Method
3.1. Theory
Diagonalizing the Hamiltonian in Equation 1 is a method that for high photon number , converges towards an exact solution. However, computation time is a limiting factor. For very large, refers to an addition or subtraction away from . This also means the in can be ignored. I will write as n going forward. Given this Hamiltonian and how the creation and annihilation operators effect adjacent states, the Hamiltonian matrix in the z basis up to can be written as
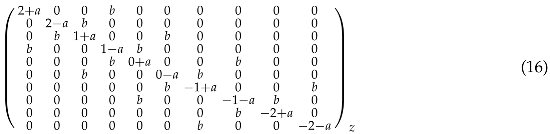 where and . Additionally, I can write the Hamiltonian matrix in the x or nbar basis but for my simulations, I used the z basis.
3.2. Solving for Eigenvalues, Eigenvectors and Time Evolution Operators
Solving for the eigenvalues and eigenvectors will be the large majority of the computation. For calculating the expectation values of time dependent spin components, initialization of the state and spin matrices are needed. Specifically, in the z basis and an initial state along +x, will take the form of an Nx1 column vector of all ones and a normalization factor. The spin component operators will be NxN matrices with 2x2 Pauli matrices along their respective diagonals.
With the eigenvalues known, I move to calculating time evolution operators
where is just an element in the array t representing time and since I will use and tsteps, t is a 1x20001 array. is the diagonal eigenvalues matrix so that U is an NxN diagonal matrix at a given time.
is constructed by transforming U into the eigenvector basis, letting it evolve, then transforming back and multiplying it onto
where K is the NxN eigenvector matrix. Finally, the expectation values over time take the usual form of
The results are spin components as time arrays just like in the RK4 and I proceed to take fast Fourier transforms of them to extract frequencies. What I saw was agreement between this method and the RK4. At first, for low N, the Hamiltonian method was all over the place. But as N got larger, the results converged towards what the RK4 showed.
3.3. Comparing the Hamiltonian Method to the RK4
The Hamiltonian method showed reasonable results for which is . However, to be more accurate, I will use in the following plots. Figure 10 to 13 show and for and and as with the RK4 plots, I have zoomed in to show relevant frequencies.
Figure 10.
frequencies for y=0.10 using the Hamiltonian method, N=802.
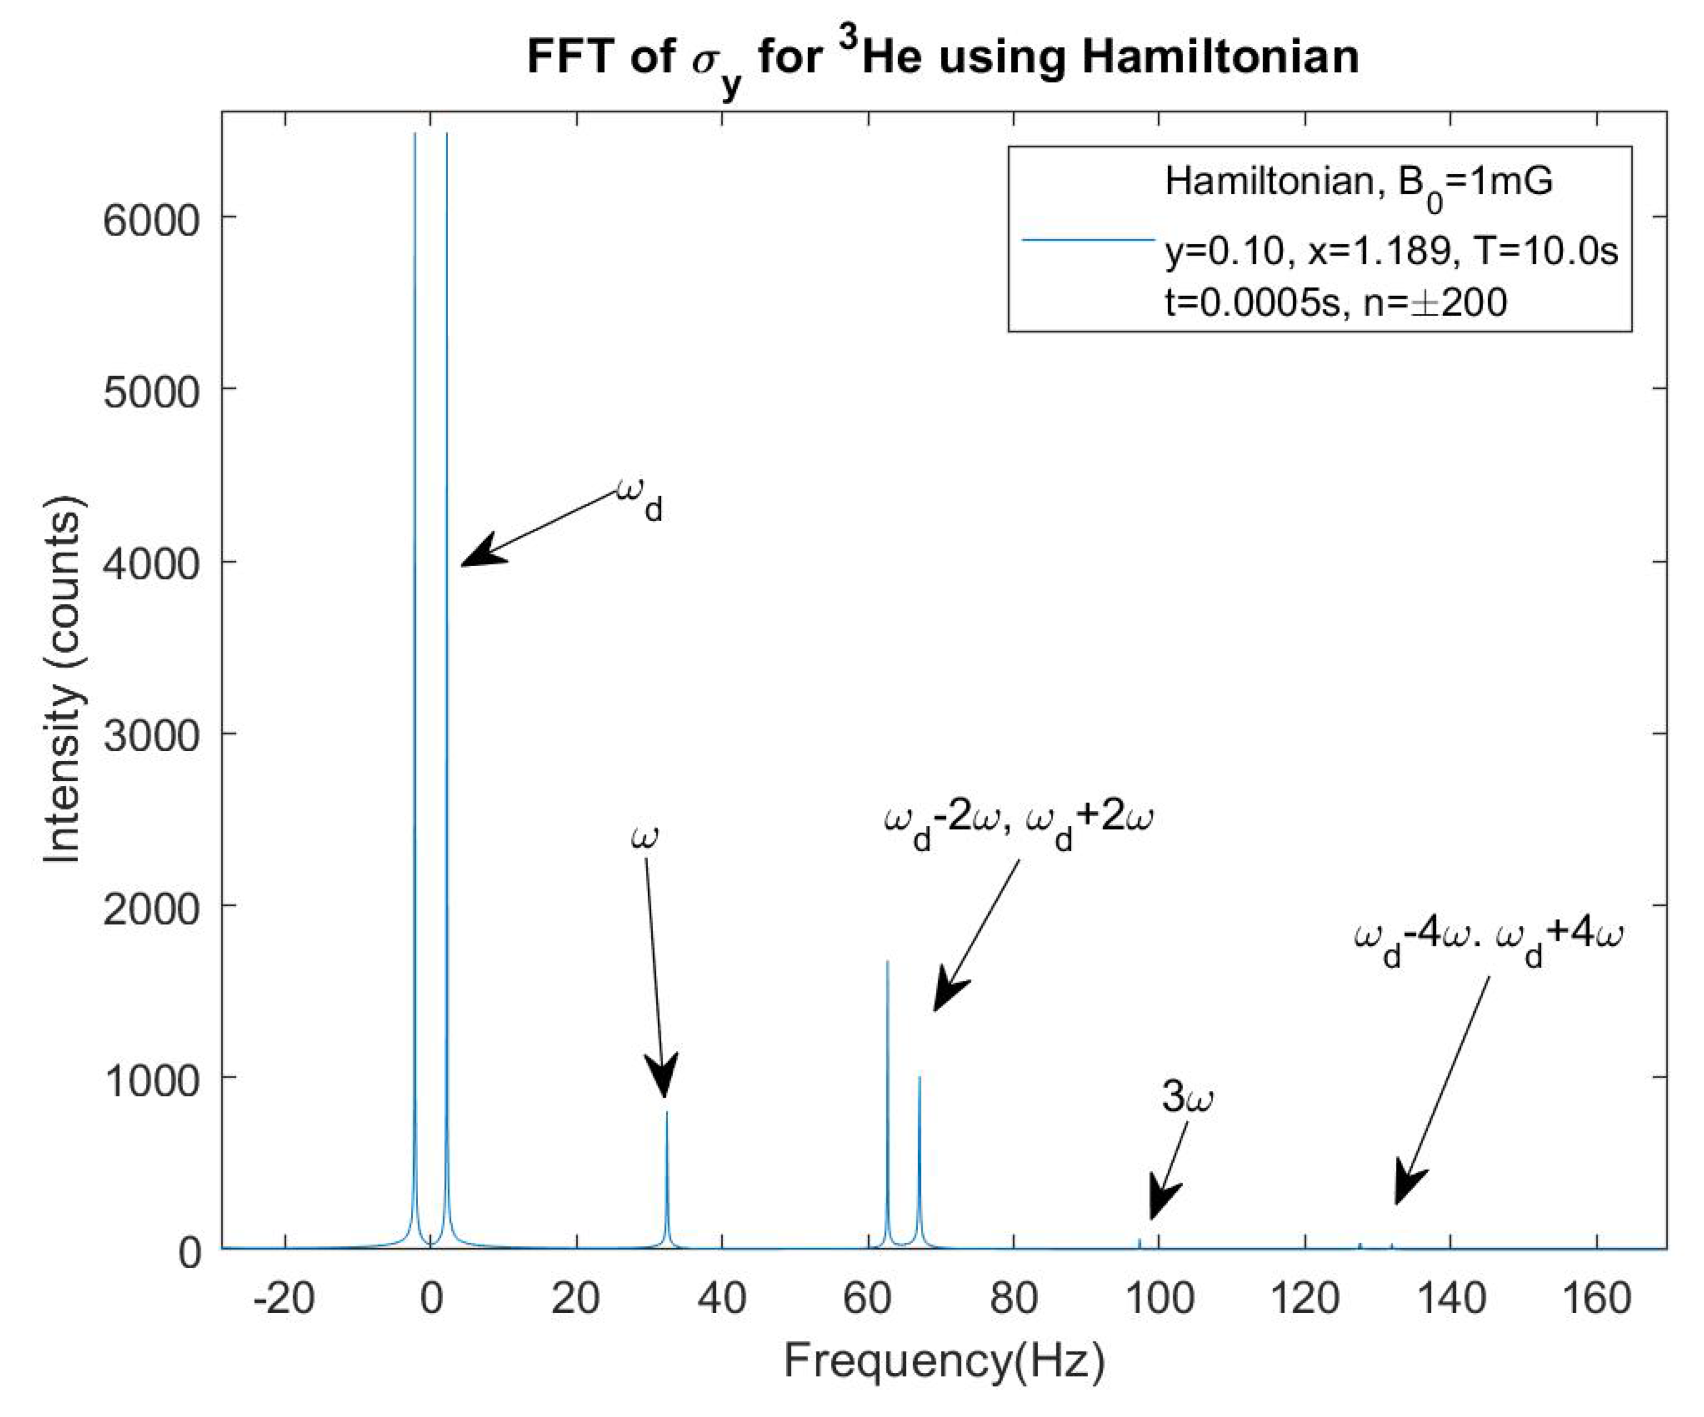
Figure 11.
frequencies for y=0.01 using the Hamiltonian method, N=802.
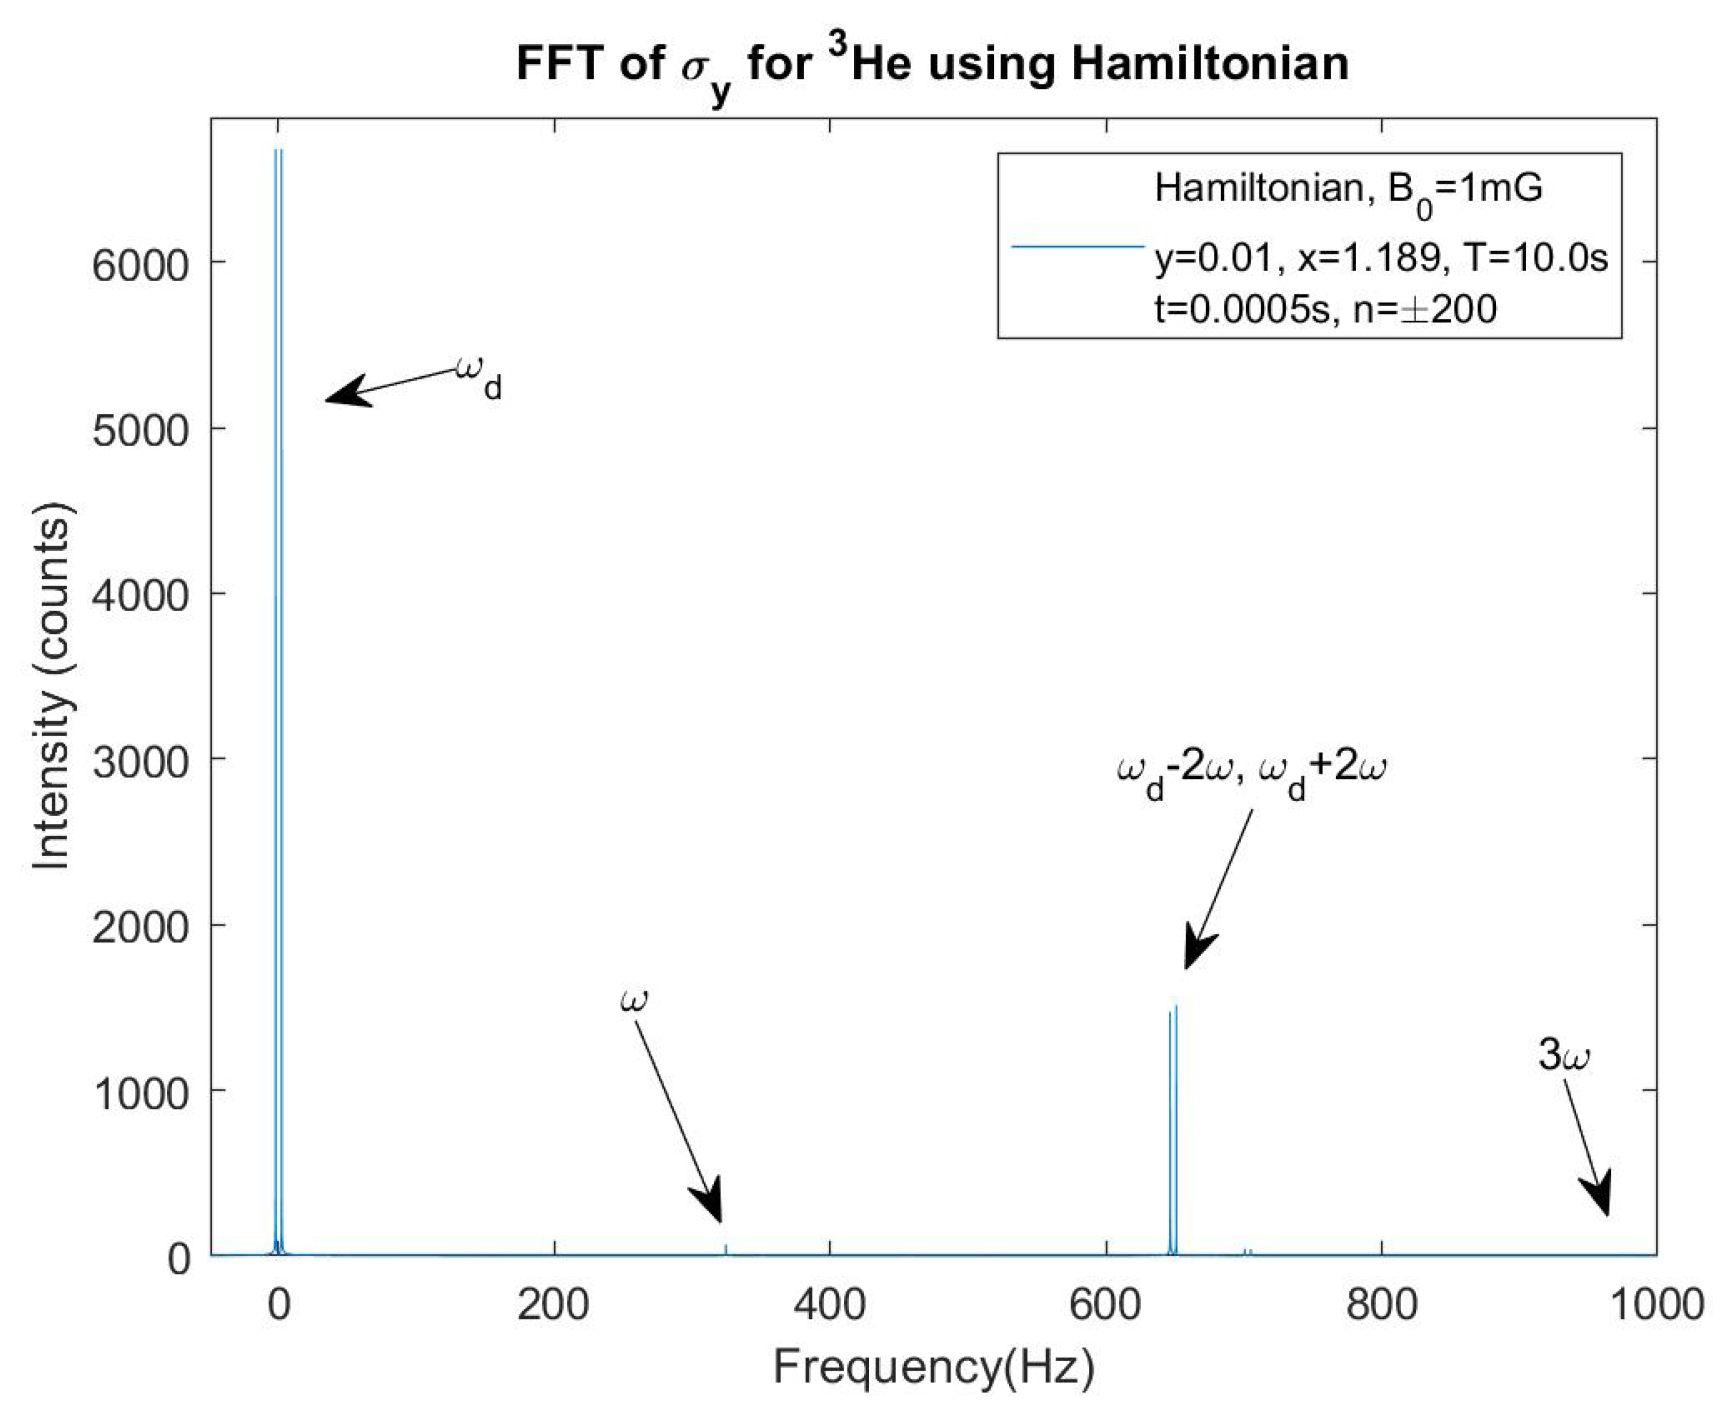
Figure 12.
frequencies for y=0.10 using the Hamiltonian method, N=802.
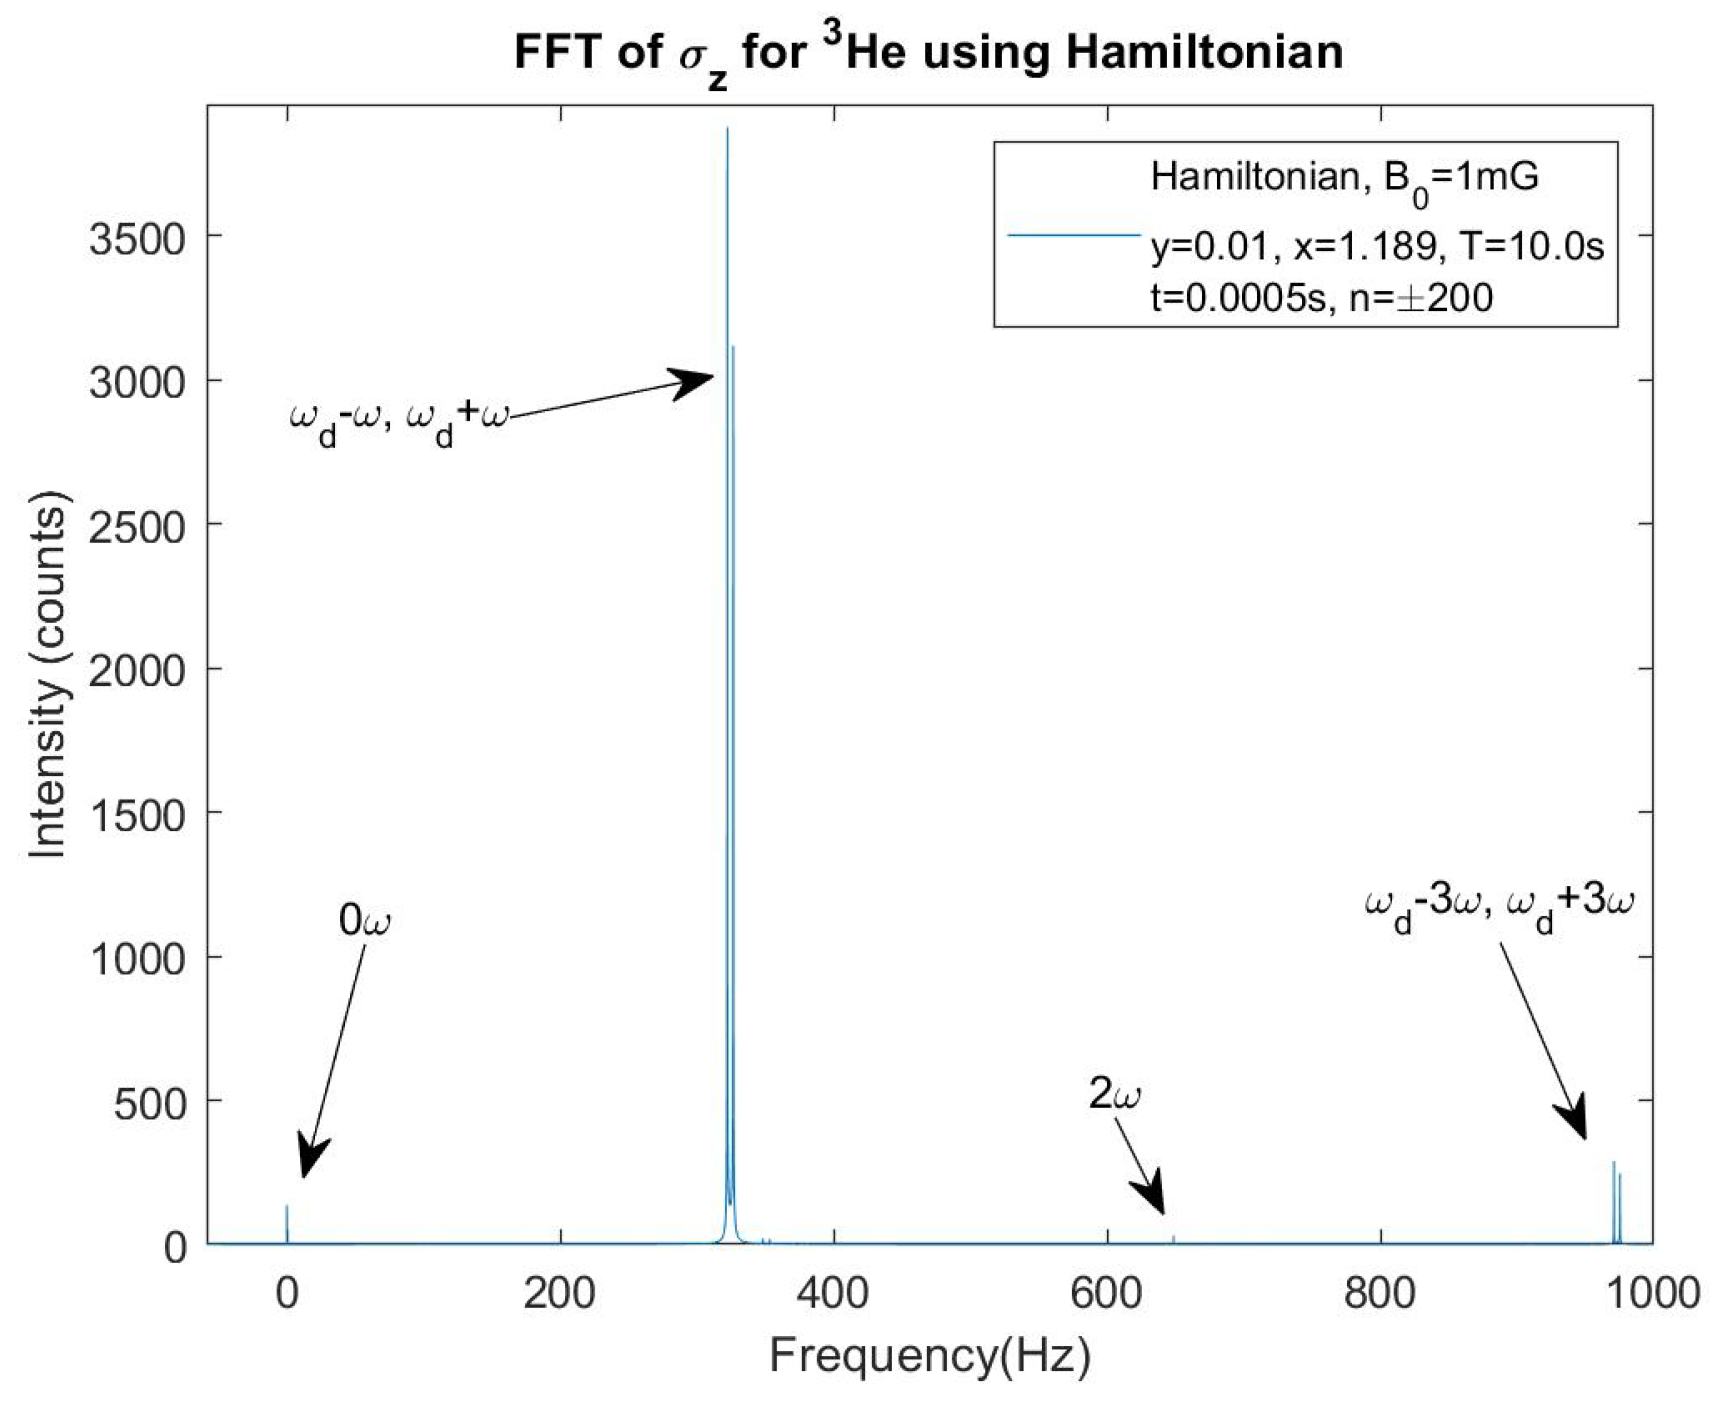
Figure 13.
frequencies for y=0.01 using the Hamiltonian method, N=802.
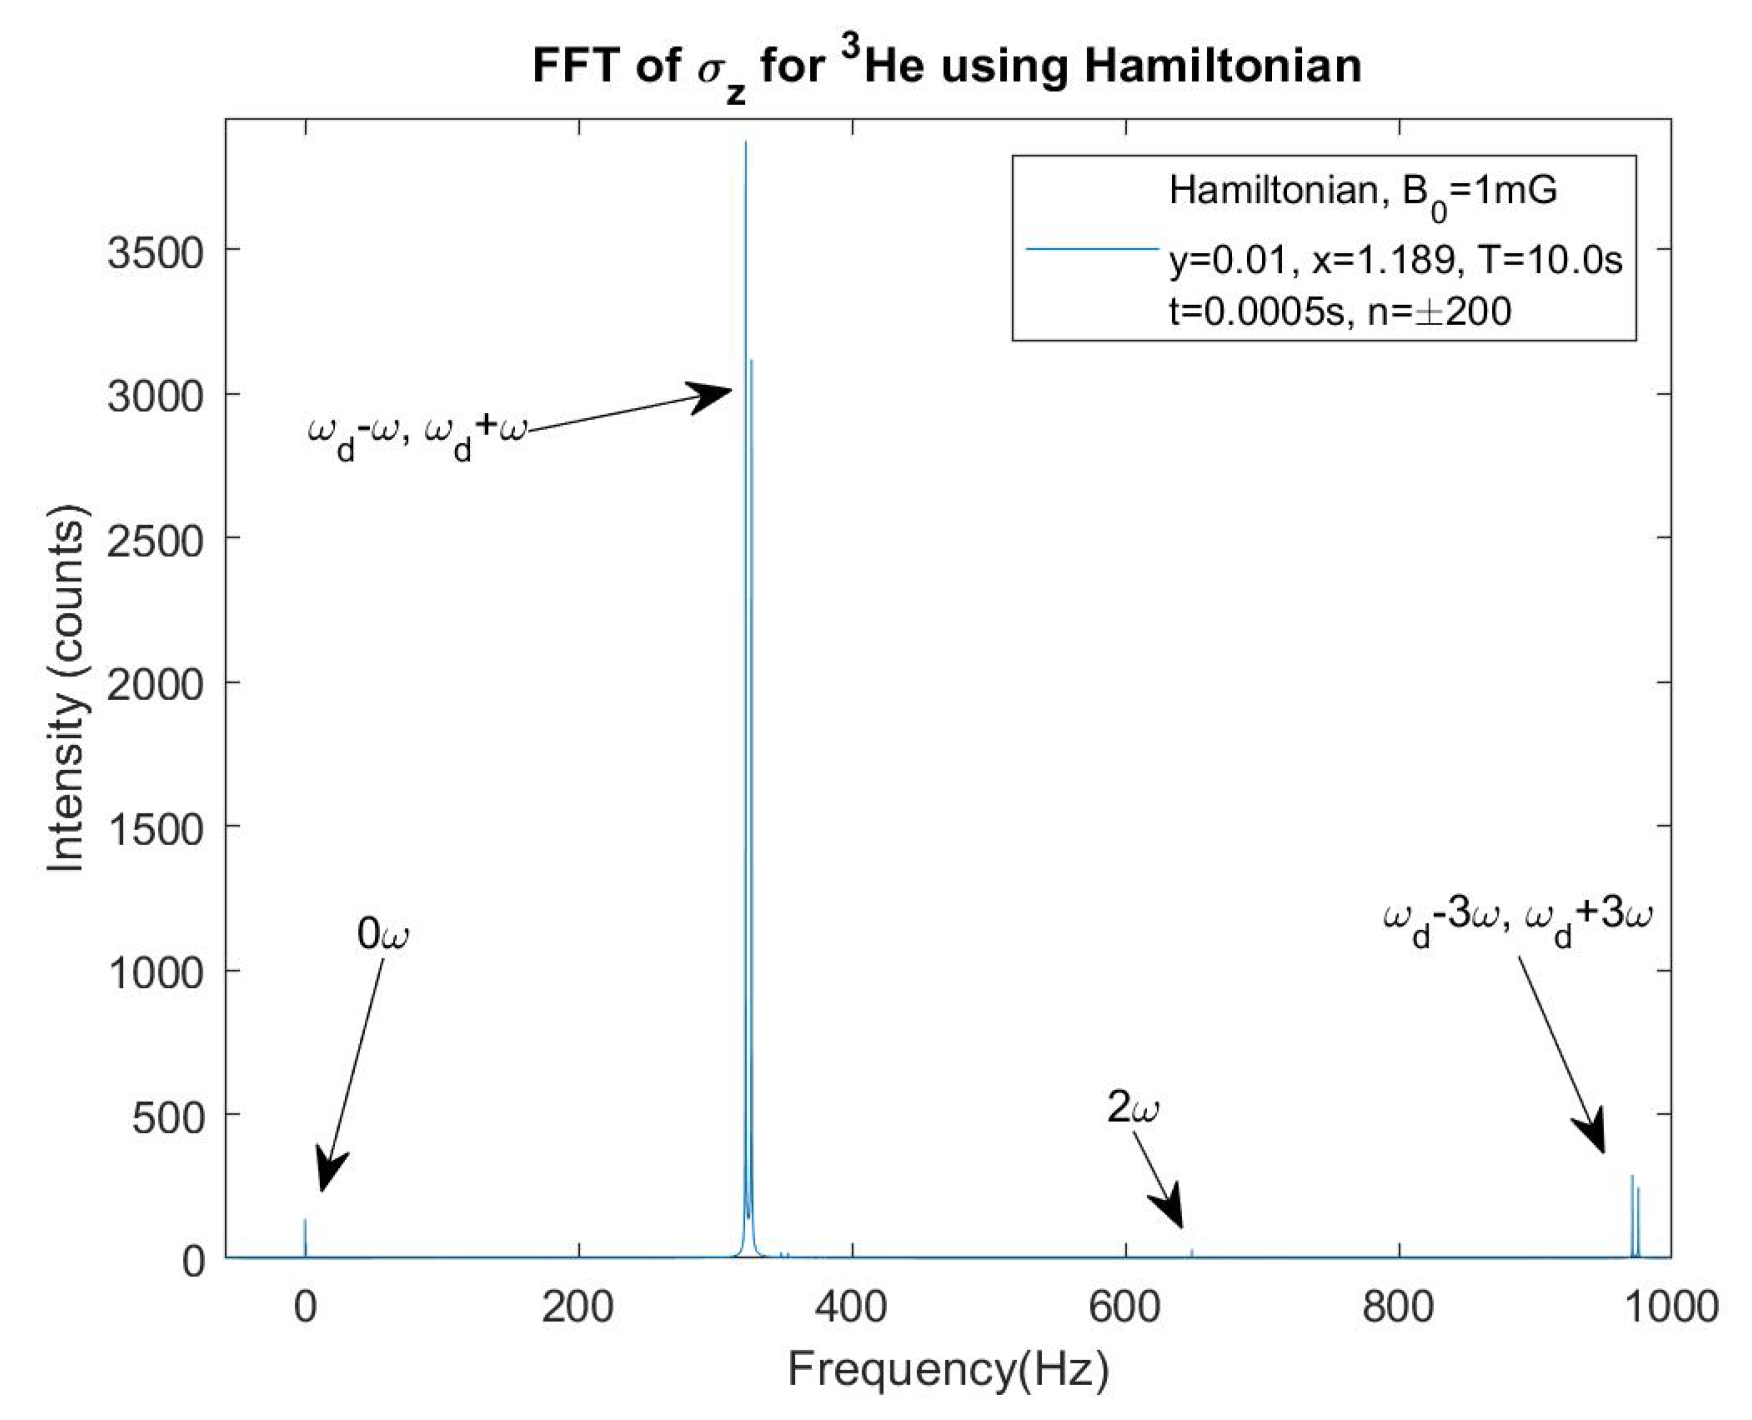
The immediate conclusion is that the Hamiltonian method is showing very similar results to the RK4 method. The difference in heights between the two methods mostly comes from the difference in time stepping and therefore total intensity. The ratio of heights between the two methods as well as the ratio of heights within a method and compared to the other would converge for n much larger. And again, I am seeing the anomalous frequency heights decreasing as y gets smaller. For comparison to Figure 9, I will loop through four values of y: 0.10, 0.05, 0.02 and 0.01 and show the results for in Figure 14. The reason I’m only using four values whereas the RK4 plots used 901 y values is because each Hamiltonian method simulation takes a long time. The plot shows a near linear relationship for these anomalies’ heights and y, as seen before.
4. First Order Perturbation Theory, Corrections to the Eigenstates
In the first section, the degeneracy was lifted by finding first order energy shifts. The eigenvectors were then used for calculating expectation values. Given the evidence laid out in the sections showing results from the RK4 and Hamiltonian methods, it’s clear extensions of perturbation theory are needed to account for the anomalous frequencies. More specifically, corrections to the eigenstates are required rather than corrections to the eigenvalues. This is because the only way for the peak heights to have a dependence on , where n is the order of perturbation theory, is from corrections to the eigenstates. Whereas corrections to the eigenvalues introduce changes to energy levels and therefore frequencies.
An expansion of an eigenstate using higher order corrections is written as
 The first term on the right hand side are the eigenstates whereas the second term is the 1st order correction.
 The first order correction is generally written as
 and so first order corrections to unprimed and primed states are
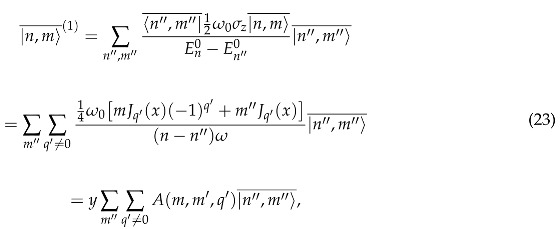 where I define A as
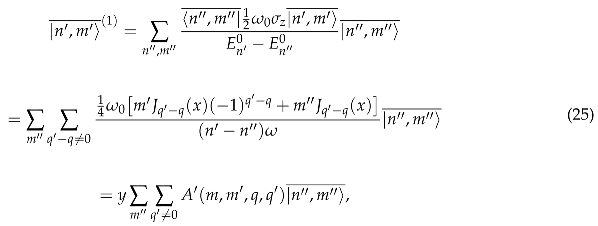 where I define as
Now a state up to first order is
 And similarly, a state up to first order is

The matrix elements for are
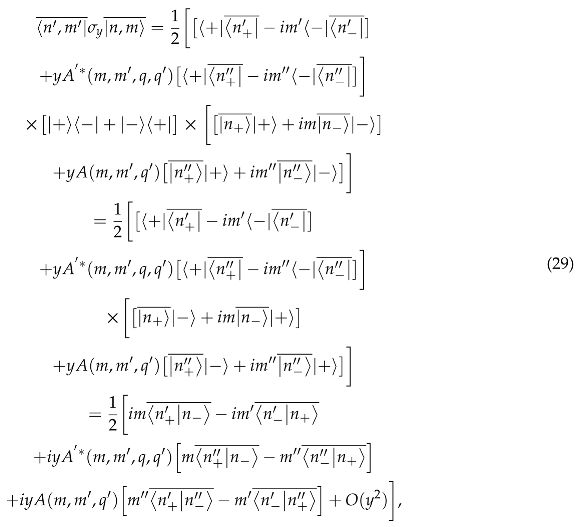 where the first two terms in the brackets are the usual zeroth order, unperturbed terms and refers to terms proportional to that I will ignore. Then, the expectation value is
Finally, the expectation value for and odd q can be written as
The first few terms are
For all the other cases ( with q odd or even and with even q) all terms vanish.
For , the matrix elements are
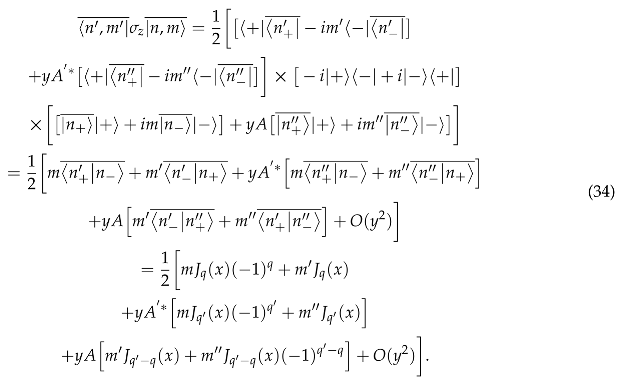 So that the expectation value up to y is
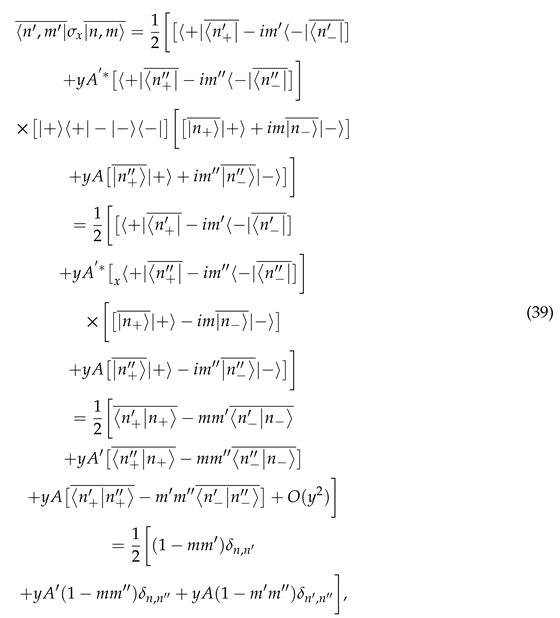 so that the expectation value is
In Figure 15, the theoretical heights in black from the first order corrections are too large. In Figure 16, the theory peak is too small while the is too large. Figure 17 has discrepancies between RK4 heights and the new terms added to the theory as well. I also simply used 0.10 as a placeholder for the oscillatory term. The differences are most likely due to either factors of 2 missing for certain frequency amplitudes, missing Bessel function terms since I stopped the sums after two terms or issues with normalization for Fourier transforms in Matlab.
What has been demonstrated is that the approximation is not valid for considering the non-negligible intensities in the and FFTs. The next section will show that again, when using , perturbation theory needs to be extended for the eigenvalues as well.
5. The Critical Dressing Condition
Critical dressing is defined by when the precession rate about the z-axis is matched between the two particle species. In regards of UCN and 3He, this means matching their effective Larmor frequencies. From earlier, the normal Larmor frequencies has been shifted by a factor of . Then the critical dressing condition is:
where is the critical dressing parameter and has been chosen to satisfy Equation 45 by adjusting the magnitude of the oscillating field . Thus, the condition is defined using the first order corrections to the eigenvalues. When I mentioned the approximation last section, this is precisely what the approximation says: the first order corrections to the eigenvalues are sufficient. However, I found in my simulations that the critical dressing parameter was varying drastically from the solution to Equation 45. Not only that but also had dependence. Furthermore, the reason I investigated further into the critical dressing condition is because I wanted to perform simulations where a 3He pseudomagnetic field would be modulated via the dressing field and its affect nullified. If the critical dressing parameter changes, the point where the modulation centers on changes. A plot of is shown in Figure 18 and the absolute value of the critical dressing condition is shown in Figure 19.
The first zero is at the critical dressing point the experiment will use because the nEDM term gets diluted by the Bessel function correction so the largest value of should be used. This solution in the approximation is . When I performed simulations where I solved for using the same field parameters as the experiment ( mG, ), critical dressing was at . This 0.55% difference between my simulation value and the analytical approximation value was the first indication that something was missing. The second indication was when I tried modulating the dressing field. When the dressing field is set for critical dressing, the neutrons and Helium precess about the z-axis at the same rate. Since dressing is controlling the relative rate, a change in x has the effect, when averaged over, of producing a about the z-axis between the UCN and 3He. The Bessel function is asymmetric about critical dressing so I will label the ’s as and
where I will write as going forward since there will be two different magnitudes of the dressing field. Intuitively, being near the magnitude of should give symmetry about critical dressing. This would make sense since the UCN and 3He need to alternate relative phase shifts in a symmetric manner while itself is asymmetric as mentioned. The data I looked at for symmetry was the scintillation signal which the experiment relies on. This signal is maximum when there’s a maximum component of anti-parallel spins between the two species (Appendix D talks about the spin dependent scattering length of of neutron-3He capture which leads to a periodic scintillation rate and a pseudomagnetic field). Therefore, observing the behavior of with modulation gives evidence as to whether the modulation is doing a good enough job to offset the pseudomagnetic field. But what I first saw was that was leading to large asymmetries in as shown in Figure 20.
Note, in most of my simulations, the initial conditions have the spin parallel to each other. However Figure 20 has the spins initially perpendicular so that the symmetry or asymmetry about 0 can be seen easier. As can be seen, the blue curve which had , was asymmetric about 0 and therefore continuously had phase shifts building. Whereas the three other curves for are mostly symmetric about 0. What this points to given the definition of is that the expressions for are wrong. This can be conceptualized by thinking about why symmetric is leading to symmetry. Looking at Figure 19, symmetric () for small should lead to . But as can be seen in the legend of Figure 20, and have large percentage differences. This led me to think back to whether the approximation is valid for and the idea of extending the eigenvalues to higher orders.
6. Corrections to the Eigenvalues
The general expression for the second order correction to the eigenvalues is
 and using the bar eigenstates of where
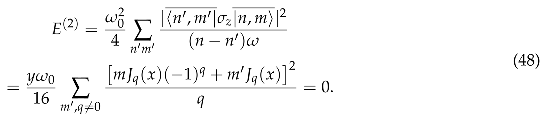 Next are the third order corrections to the eigenvalues which I suspected to be the source. The third order corrections to the eigenvalues have two summation terms and one is easier to calculate than the other. The general expression is
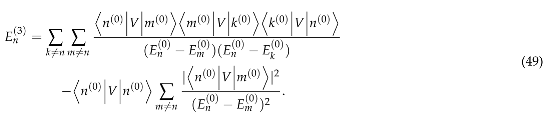 Defining , the third order correction in this context is
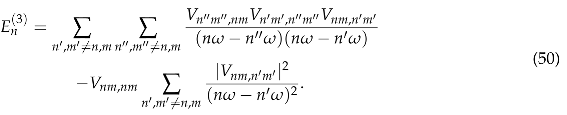 The Physics Reports [1] made the approximation that the first term, which is more complicated than the second, is equal in magnitude as the second term and therefore did not calculate it. What I found is that the first term is actually larger than the second term and when included in the critical dressing condition, produces much better convergence with simulation values. The calculation for the second term in Equation 50 is
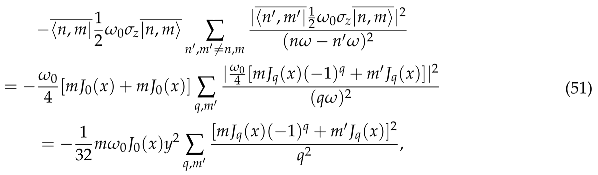 such that for different q’s, or . The terms up to are
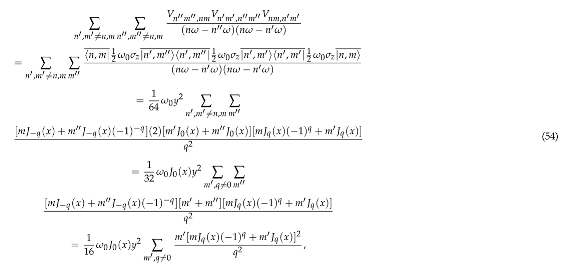 where the sum over made or else the whole term vanishes. Continuing the calculation of just the sum
Figure 21 shows the zoomed-in view of the new critical dressing condition and how varies for different values of y. This demonstrates how the nEDM experiments needs to account for this shift in not only for the sake of critical dressing and modulating the dressing field but for an accurate expression for the scintillation rate. This third order correction also dilutes the nEDM signal.
What I now see from my simulations is much better agreement between my simulation and the analytical expression for that includes the third order corrections. Figure 22 shows the analytical and simulation critical dressing parameters for different values of y. And Figure 23 shows the percentage difference of these values at each given value of y. There is still a dependence in Figure 23 because the third order correction terms I’ve ignored are of course still proportional to . Given I now have an accurate expression for the critical dressing condition, I can more accurately modulate around it.
7. Modulation and the Pseudomagnetic Field
With the third order corrections from the last section, I will briefly show what modulation looks like with a pseudomagnetic field on and off. Figure 24 shows a near symmetric scintillation signals with modulation on and an applied pseudomagnetic field off.
As seen in the legend, the corrected do have magnitudes much closer to each other than before.
For the magnitude of , I wanted to use the value from the paper by Leung et al.[3] where for and such that G. However, this magnitude is very small compared to the fields already present and the sensitivity of the simulation so instead I looked at . The relevant plots are shown in Figure 25 to 27. For a benchmark, I first show the difference in for the pseudomagnetic field off and on without modulation. Followed by plots where modulation will cancel out the effects from . Note that in Figure 25, I chose to use the color blue for the pseudomagnetic field on and orange for it off which differs from other plots. This was solely to give a better contrast to the naked eye.
Figure 25 showed that was inducing a non-negligible phase shift between the 3He and UCN that grows linear in time (with no modulation). Then Figure 26 and 27 show the modulation doing a good job at canceling the phase difference that was built in the plots without modulation.
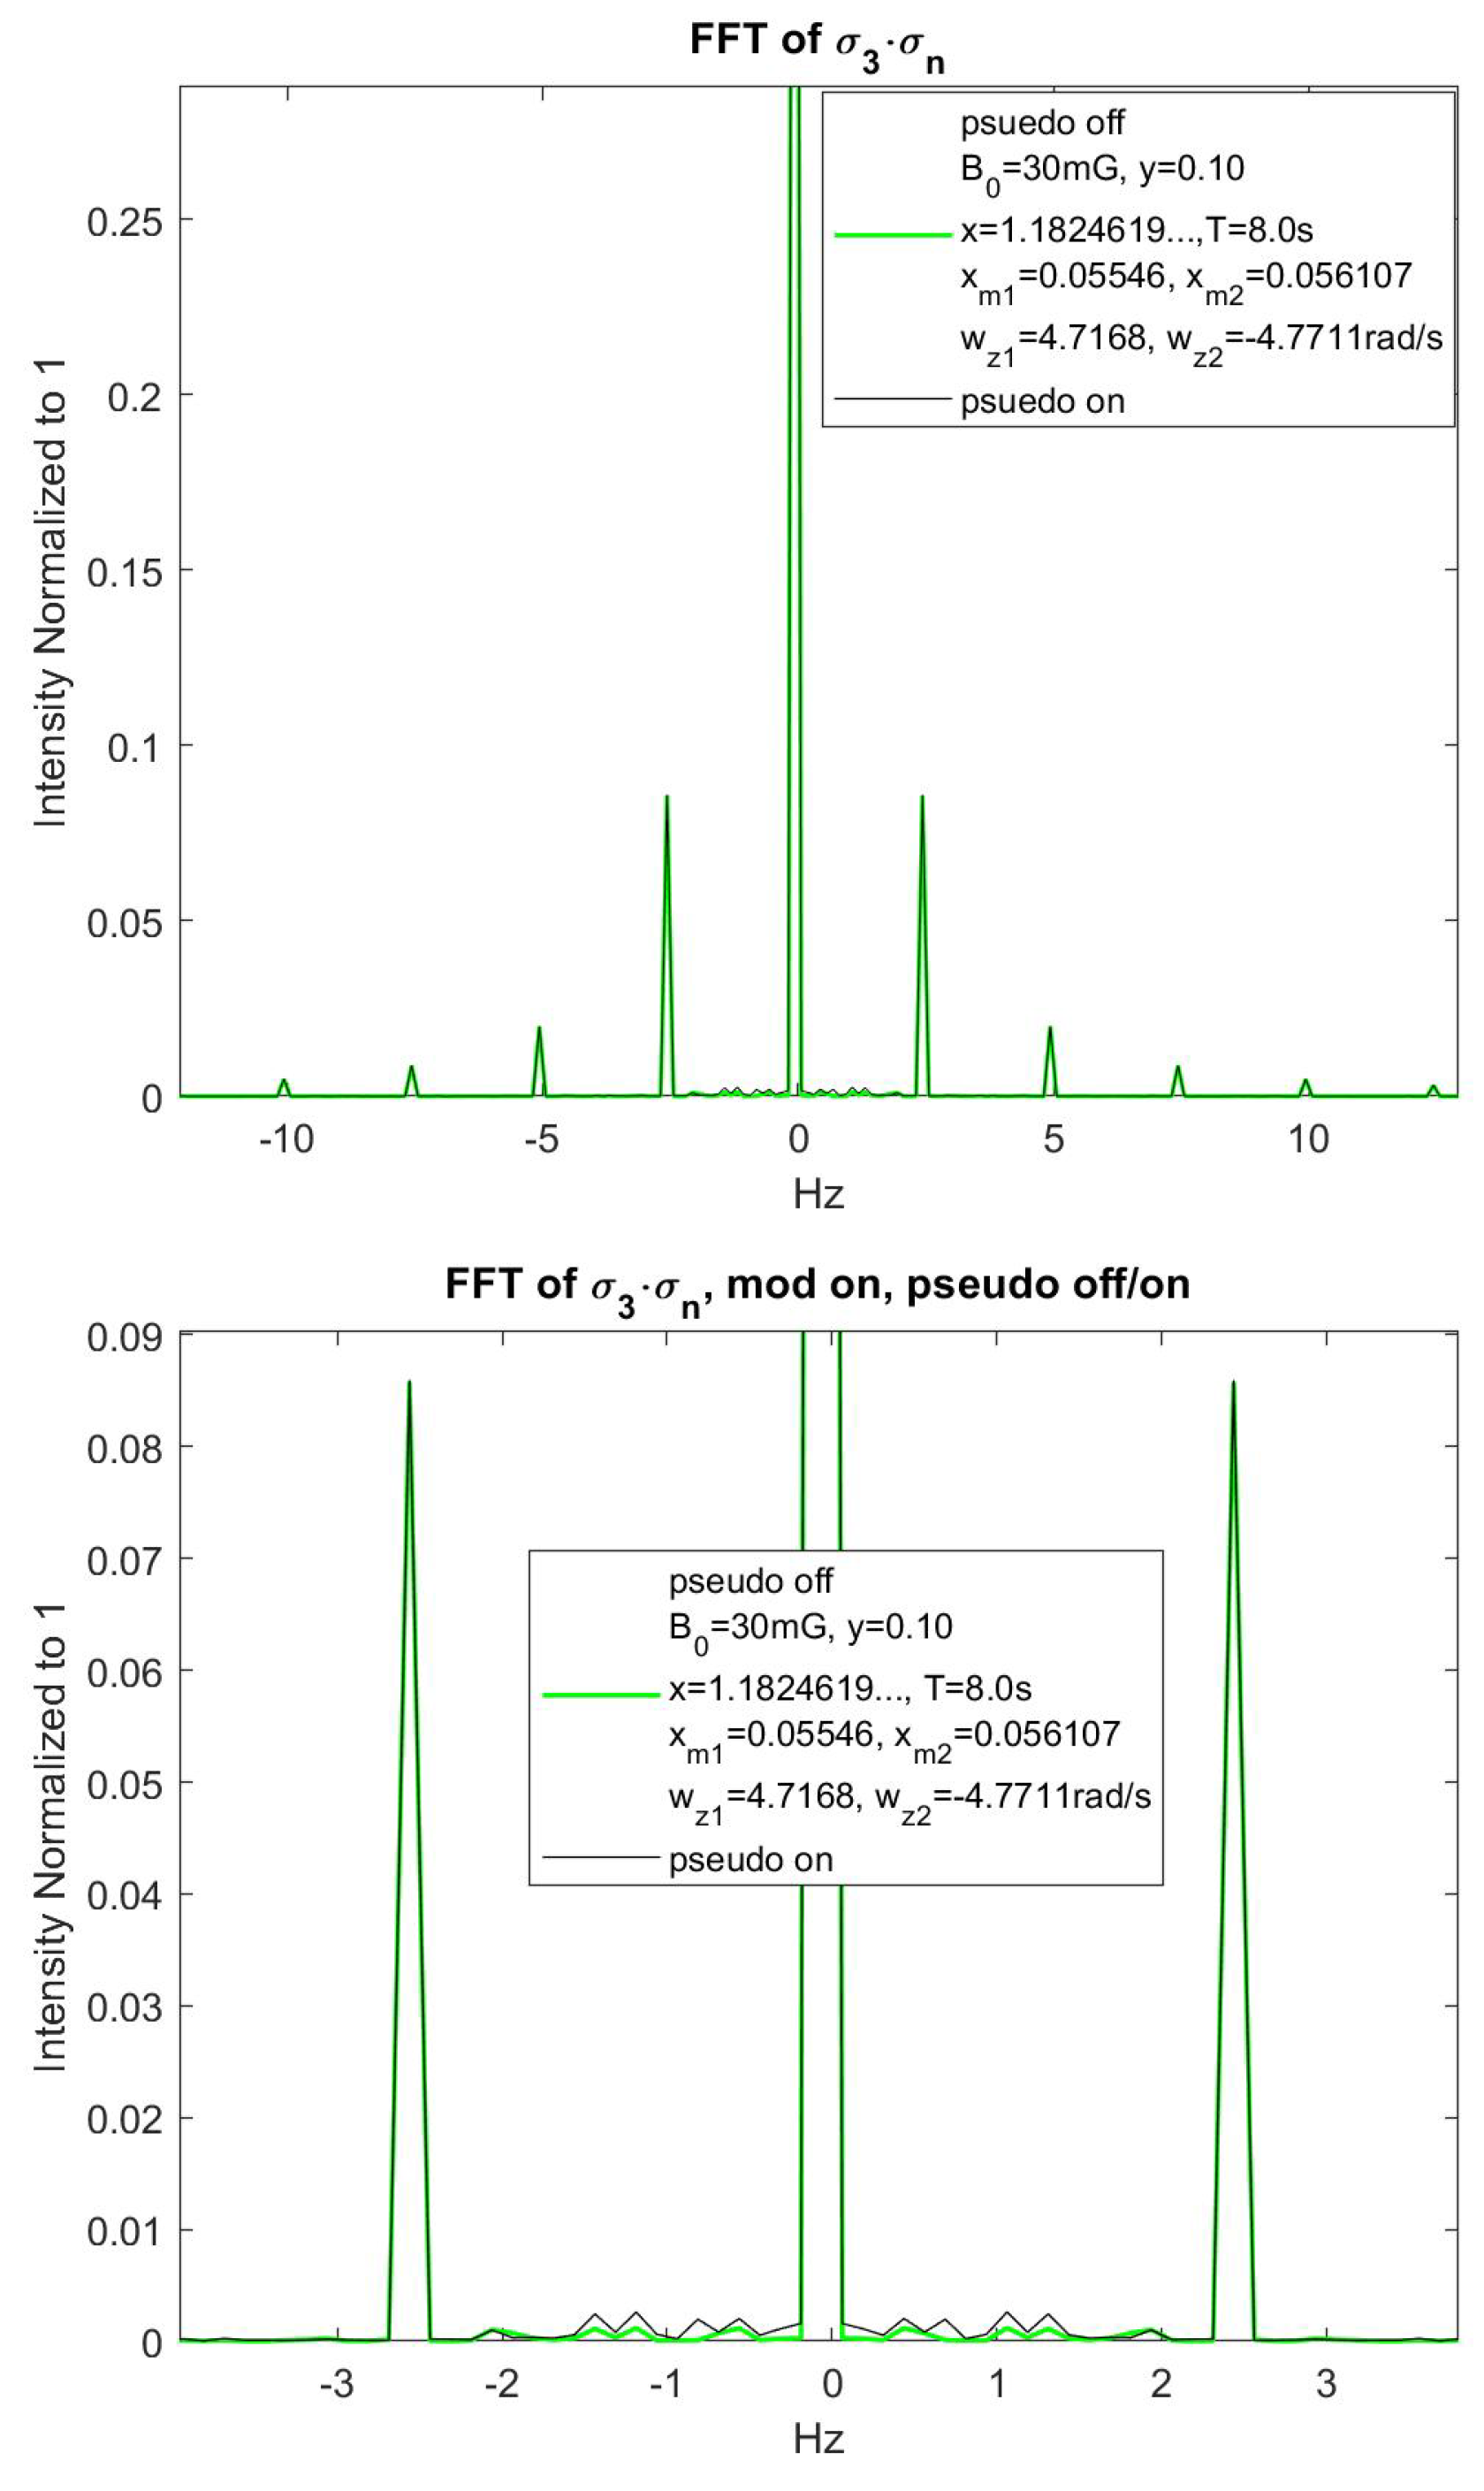
Finally, one way which Robert Golub proposed to quantitatively check how the modulations were performing was to check the relationship between the first and second harmonic signals in Fourier space. The idea is that the first harmonic at 1.25 Hz should be near zero if the modulations are symmetric about . Whereas the second harmonic will have a much larger height and increase in height as the first harmonic signal decreases. So checking the ratio of the second to the first harmonic with modulation on pseudomagnetic field off and modulation on pseudomagnetic field on, will be a better test of whether the modulations are doing their job. I optimized symmetry by looping through values that produced the lowest first harmonic signal. The results were and , close to the values I’ve been using and I used a simulation time of 8 seconds. Figure 28 shows the FFT of with modulations, no pseudomagnetic field and zoomed on the modulation harmonics.
The FFTs are shows in Figure 29 where I zoomed-in on the harmonics but further zoomed-in on the first (1.25 Hz) and second (2.5 Hz) harmonics. The colors have been changed to better see where the curves differ and overlap.
The black curve for when the pseudomagnetic field is on has a larger value at the first harmonic which is expected. Due to the binning of the frequency axis which comes from the time steps and length of the simulation, there was no value exactly on 1.25 Hz or 2.5 Hz. For the 1.25 Hz, I took the average of the values at 1.1875 Hz and 1.3125 Hz. For the 2.5 Hz, I used the value at 2.4375 Hz. The results were that the ratio of the second harmonic signal to the first with the pseudomagnetic field off was 30.055. The ratio with the pseudomagnetic field on was 13.346. Thus, the pseudomagnetic field being flipped to on changed the relative ratios by about a factor of 2.25. This change is a good benchmark as to how well the modulations are doing going forward and with a field that is not 100x the experiment’s strength.
Acknowledgments
Thank you to my advisor Robert Golub for his expertise in this field and his direction in where to take my thesis work.
Appendix A. Lifting the Degeneracy
The inner product of two bar states, , originally done in [2] can be expressed as
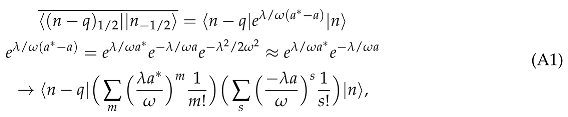 where . From applying the creation and annihilation operators, you can see the only non-zero result is when so that . Assume and , then
For a fixed n, the unperturbed states are degenerate in so I want to calculate the matrix elements from the perturbation to lift the degeneracy. I diagonalize this matrix in the x basis to find the eigenvalues and eigenvectors. The sub-matrix elements for a constant n are

Given , I want to solve for all combinations of and . Writing
, gives
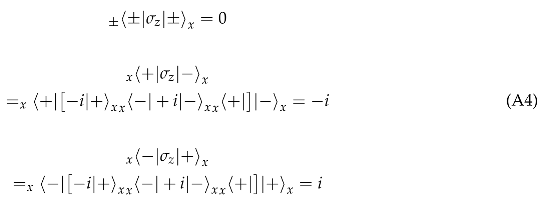
so that the matrix I must diagonalize is
The eigenvalues come from the determinant after inserting ’s such that the eigenvalue equation and its solution is
Equation A6 shows by how much the energy levels are shifted. Solving for the eigenvectors and
so that both eigenvectors in the bar basis are
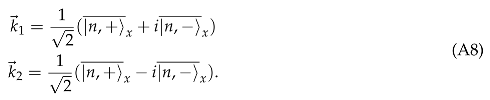
Appendix B. σ y Expectation Value Selection Rules
The expectation value of with first order corrections to the eigenstates for gives the following terms for the expressions in the large bracket of Equation 38
Adding the terms together between the choices for all m’s we have:
Appendix C. Example of Choosing q for σ y
For the terms in the large braces of Equation 39, I start with and choose the closest values that satisfy the even/odd rules.
where the expression after the arrow can use whichever value of . For the next closest choices
Appendix D. Scattering Length
The nEDM experiment relies on UCN-3He absorption which means their mutual interaction is of utmost importance. There will be a 3He pseudomagnetic field present that only the neutrons will feel. Modulation of the dressing field will be used to offset this field. The scattering length for the neutron-3He interaction is complex and can be decomposed into coherent and incoherent components. The scattering length is spin dependent and this is exploited in the nEDM experiment. The imaginary terms control the absorption rate and lead to the near zero cross section when the spins are parallel and large cross section when the spins are antiparallel. Whereas, the real terms give the Abragam pseudomagnetic field - the Fermi potential is spin dependent and mimics a magnetic field potential. As measured by Koester et al. [4], the coherent and incoherent scattering lengths are
giving
where + and − refer to spins parallel and antiparallel respectively and I is nuclear spin. For neutrons and 3He in the x-y plane, neutrons will precess about the helium spins and on average, the pseudomagnetic field will remain in the x-y plane. This means the pseudomagnetic field is perpendicular to the electric field and reduces nEDM sensitivity.
Given the pseudomagnetic field is only seen by the neutrons, a deviation away from critical dressing is created as an extra field term will push the neutron effective Larmor frequency away from 3He Larmor frequency. And although the pseudomagnetic field is quite small, about T for the experiment’s 3He concentrations of and near perfect polarization, it must be accounted for because of the high precision of the nEDM experiment. The pseudomagnetic field will be parallel to the 3He spins and will have some average field value. In the lab frame on critical dressing, there were UCN and 3He precessing about the z-axis while undergoing an oscillating precession about the x-axis. UCN will have a small additional precession about the 3He and pick up a relative phase shift. Qualitatively, there would be separation that grows in time between the blue and red curves in Figure 4.4. The goal then is to offset this phase shift with dressing field modulations. The modulations will put the UCN and 3He in front or behind one another and create a symmetry about critical dressing that offsets the asymmetric phase shift from the pseudomagnetic field. The following section will derive the theory for modulations and underscore the lack of dependence has on the pseudomagnetic field strength.
Appendix E. Third Order Correction to Eigenvalues Vanishing or Negelcted Terms
, the next terms would have and some example values could be and . This means so that the smallest q and q’ available is for or . Generally
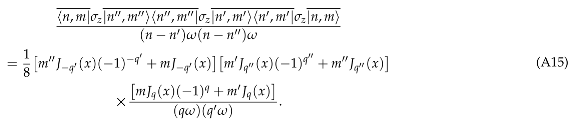 The two cases above will yield the following terms
References
- Golub, R.; Lamoreaux, S.K. Neutron Electric-Dipole Moment, Ultracold Neutrons and Polarized 3He. Physics Reports 1994, 237, 1–62. [Google Scholar] [CrossRef]
- Polonsky, N.; Cohen-Tannoudji, C. Interpretation Quantique de la Modulation de Frequence. Le Journal de Physique 1965, 26, 409–413. [Google Scholar] [CrossRef]
- Leung, K. The neutron electric dipole moment experiment at the Spallation Neutron Source. EPJ Web of Conferences 2019, 219. [Google Scholar] [CrossRef]
- Koester, L., H.R.; Seymann, H. Nuclear Data Tables, pp. 49–65.
Figure 1.
3He in red and UCN in blue, the two critically dressed for 0.20s of simulation time.
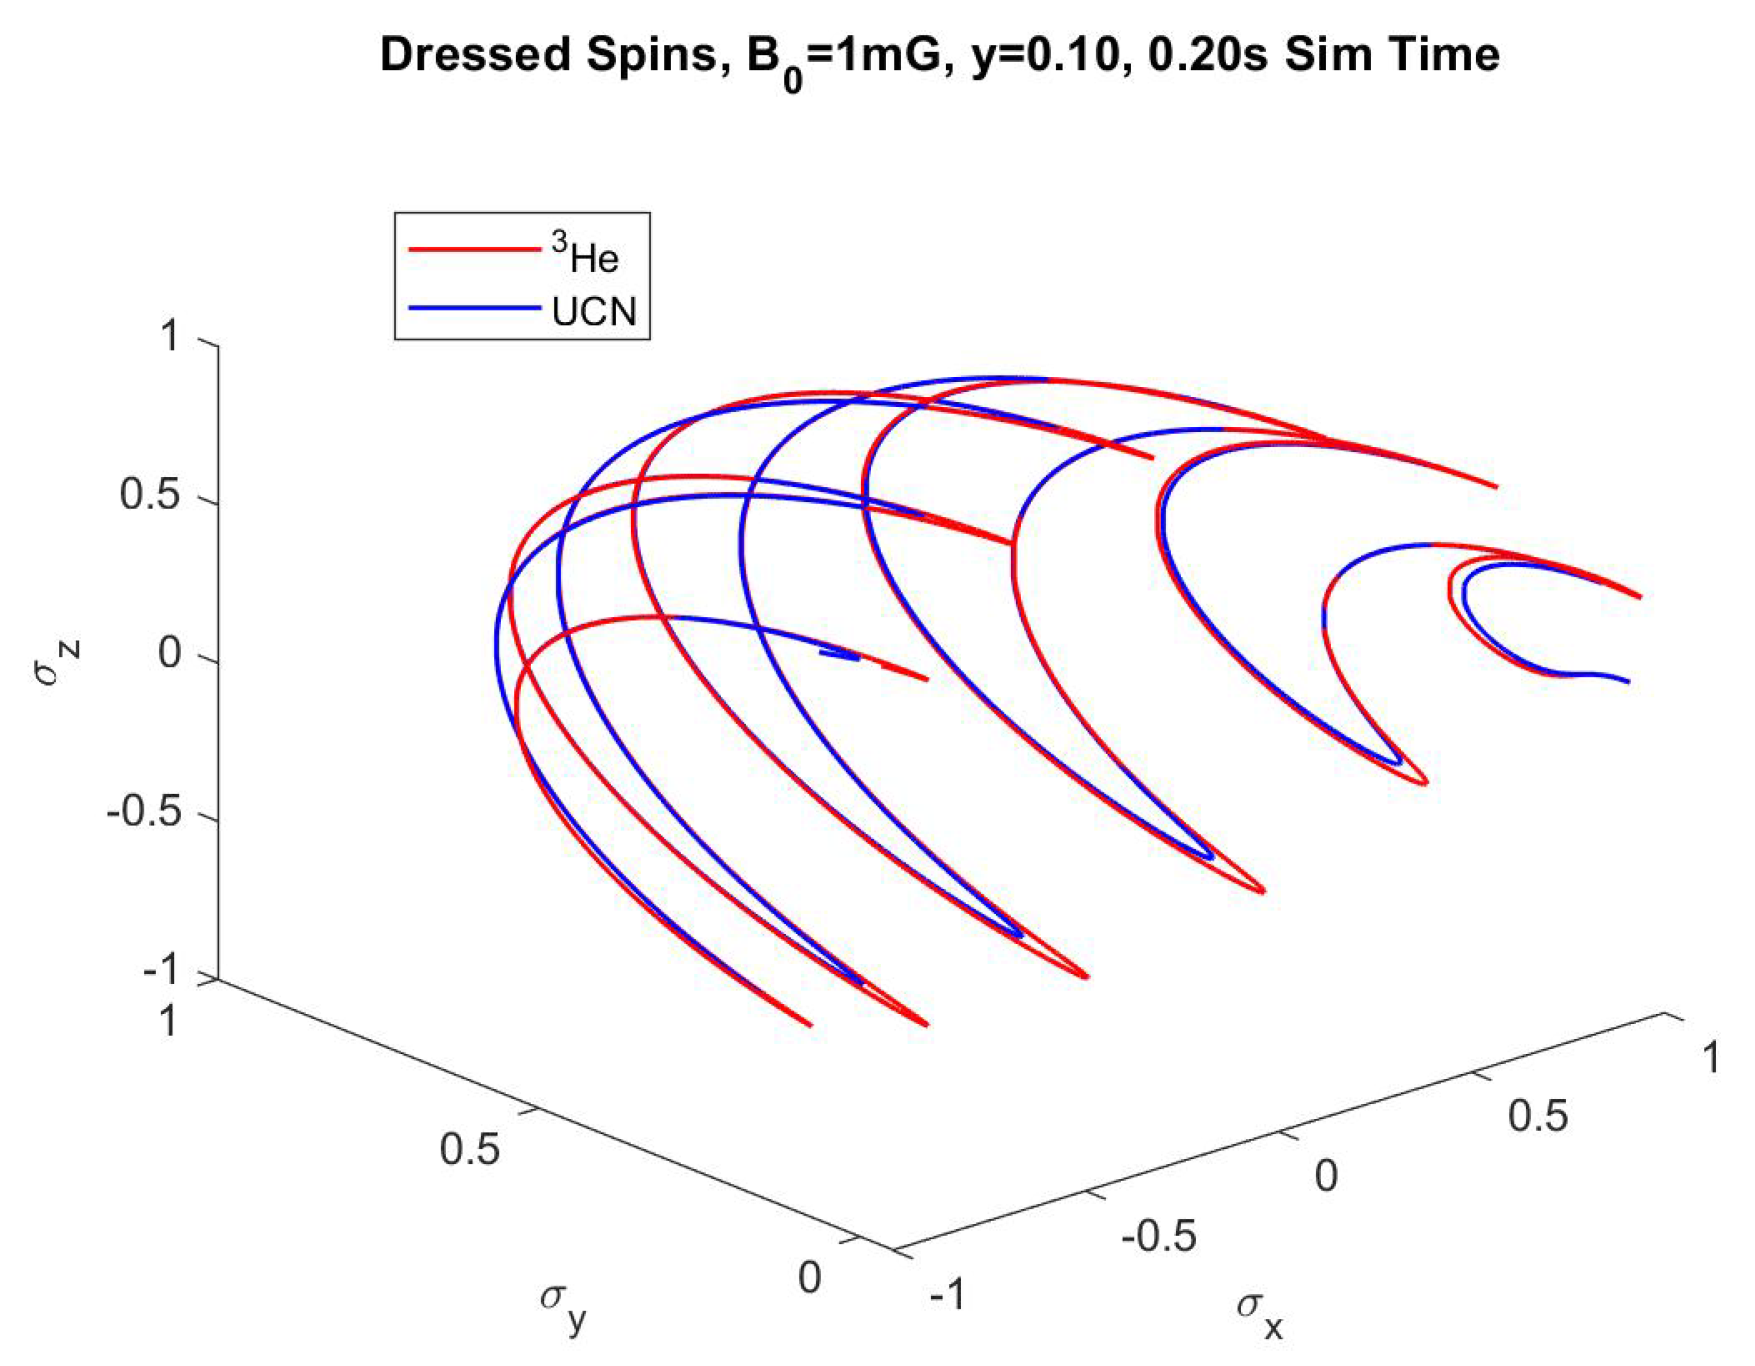
Figure 2.
for , frequencies solved for using the RK4 method. and are frequencies not currently included in theory.
Figure 2.
for , frequencies solved for using the RK4 method. and are frequencies not currently included in theory.
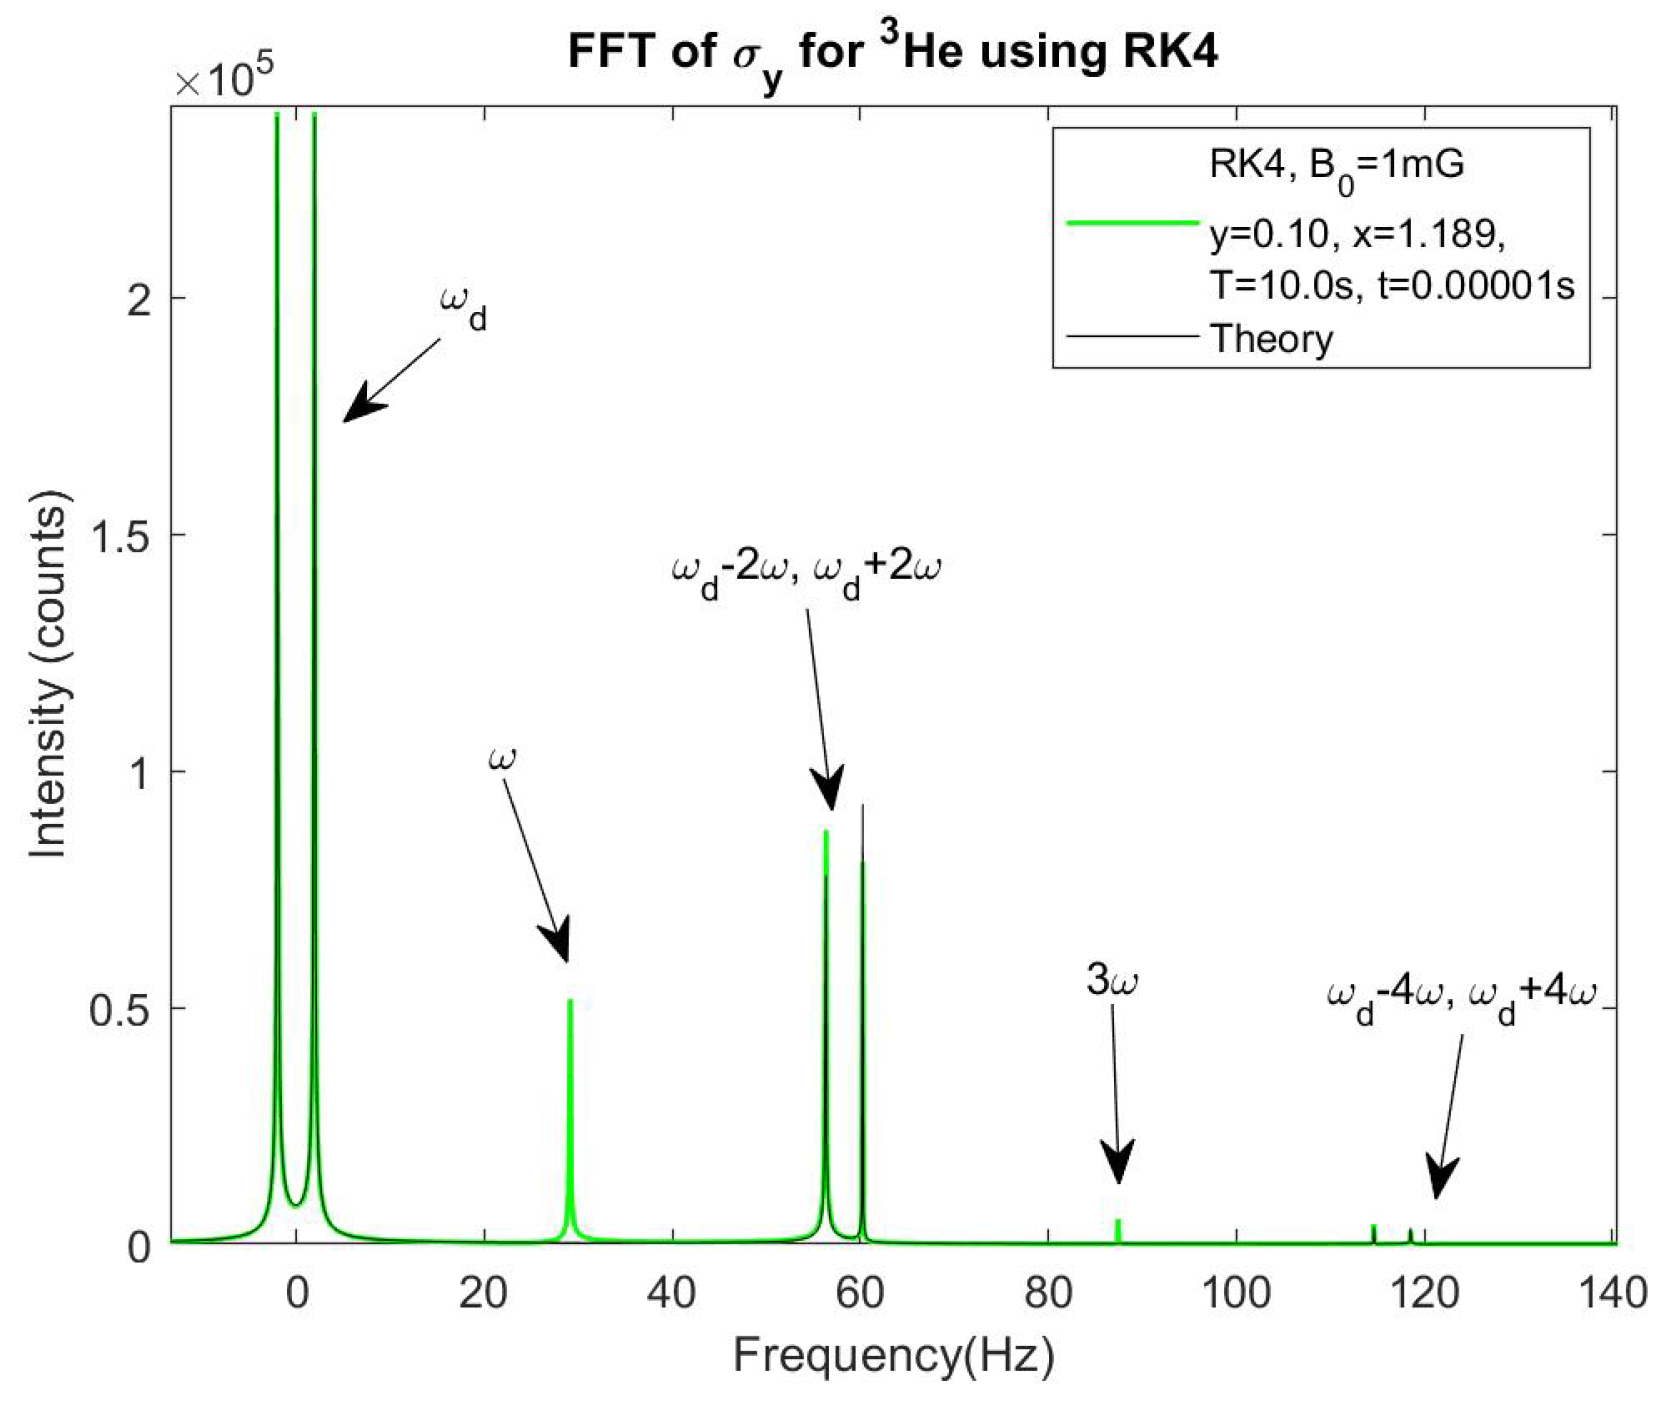
Figure 3.
for , frequencies solved for using the RK4 method. and are frequencies not currently included in theory.
Figure 3.
for , frequencies solved for using the RK4 method. and are frequencies not currently included in theory.
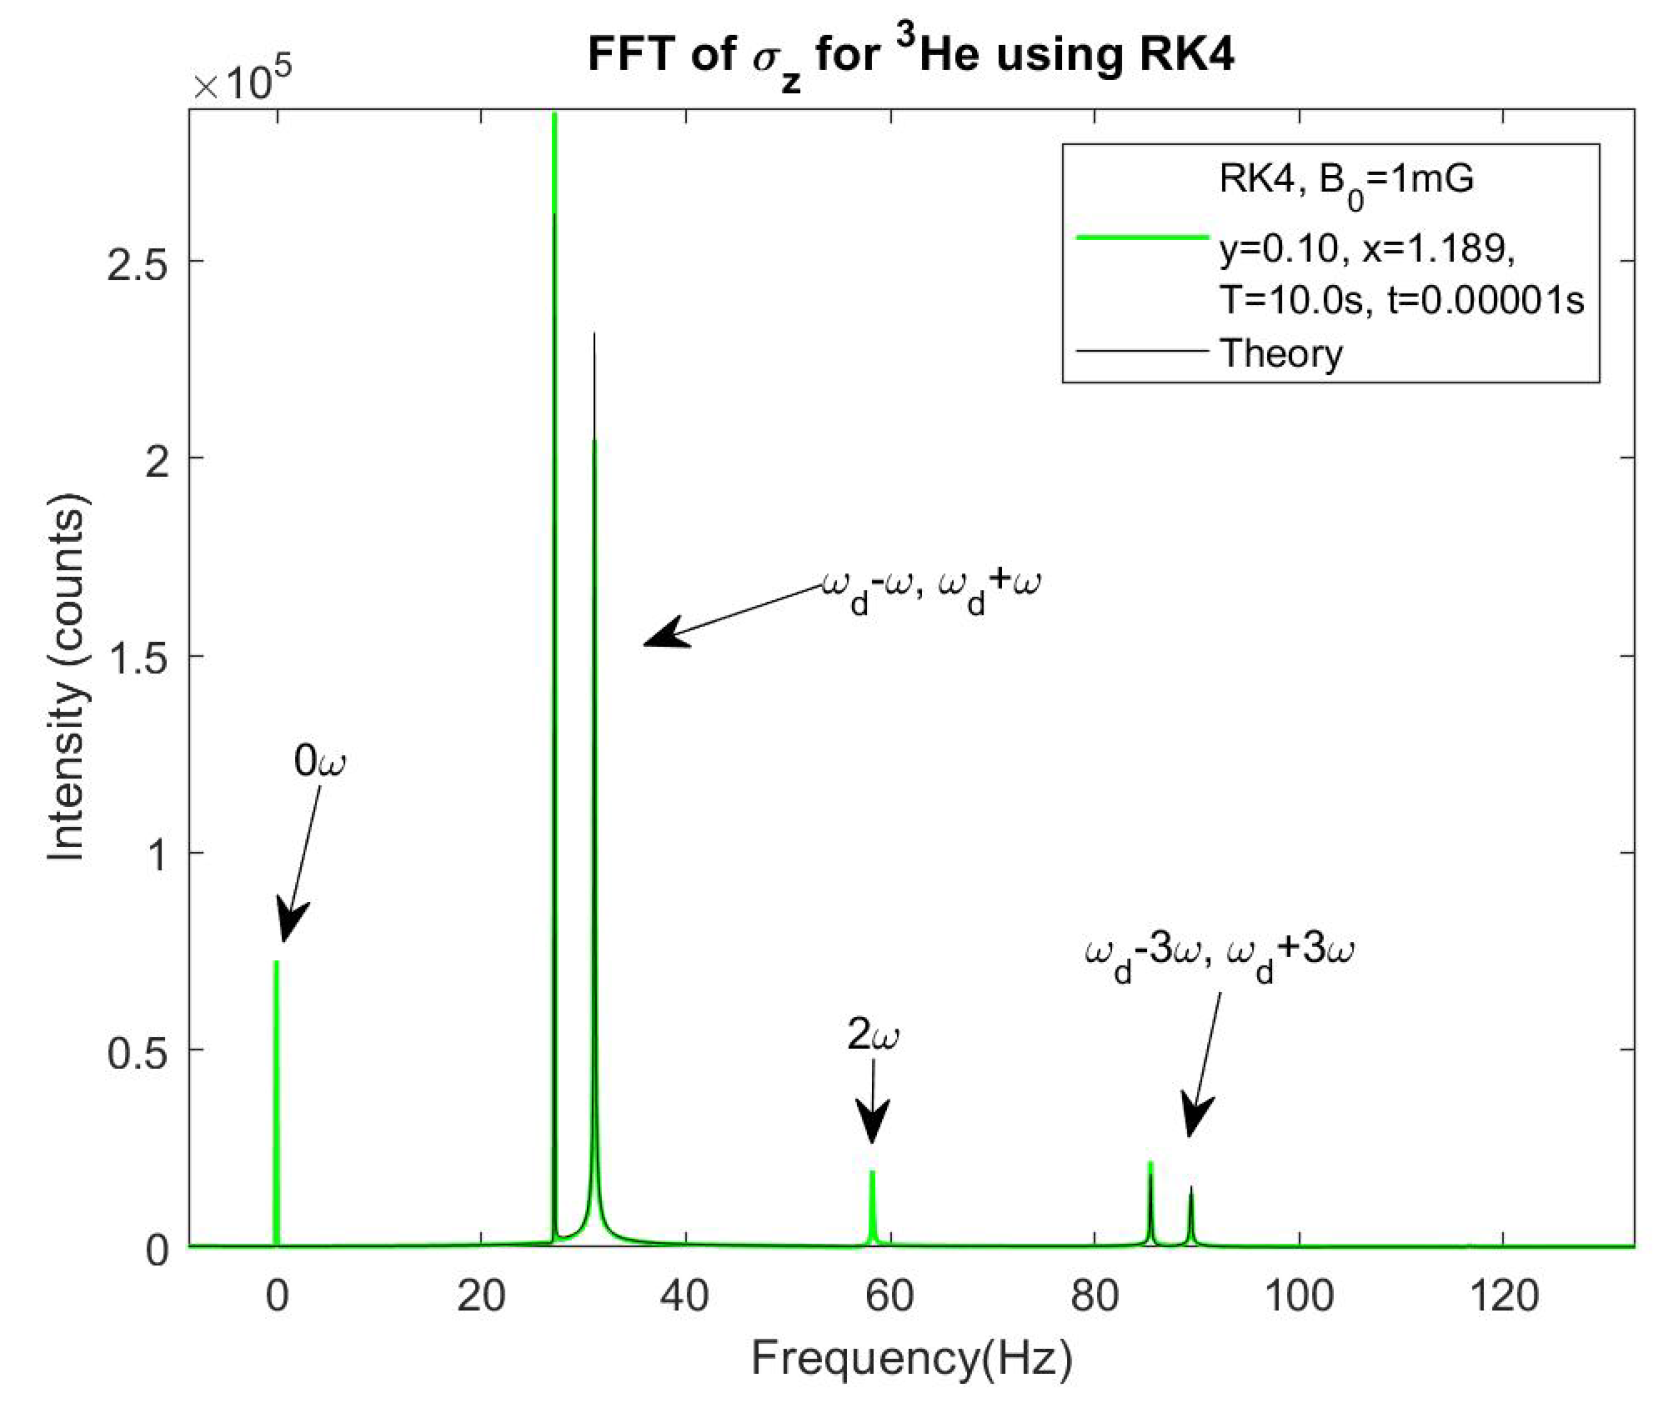
Figure 4.
for , frequencies solved for using the RK4 method. and are frequencies not currently included in theory.
Figure 4.
for , frequencies solved for using the RK4 method. and are frequencies not currently included in theory.
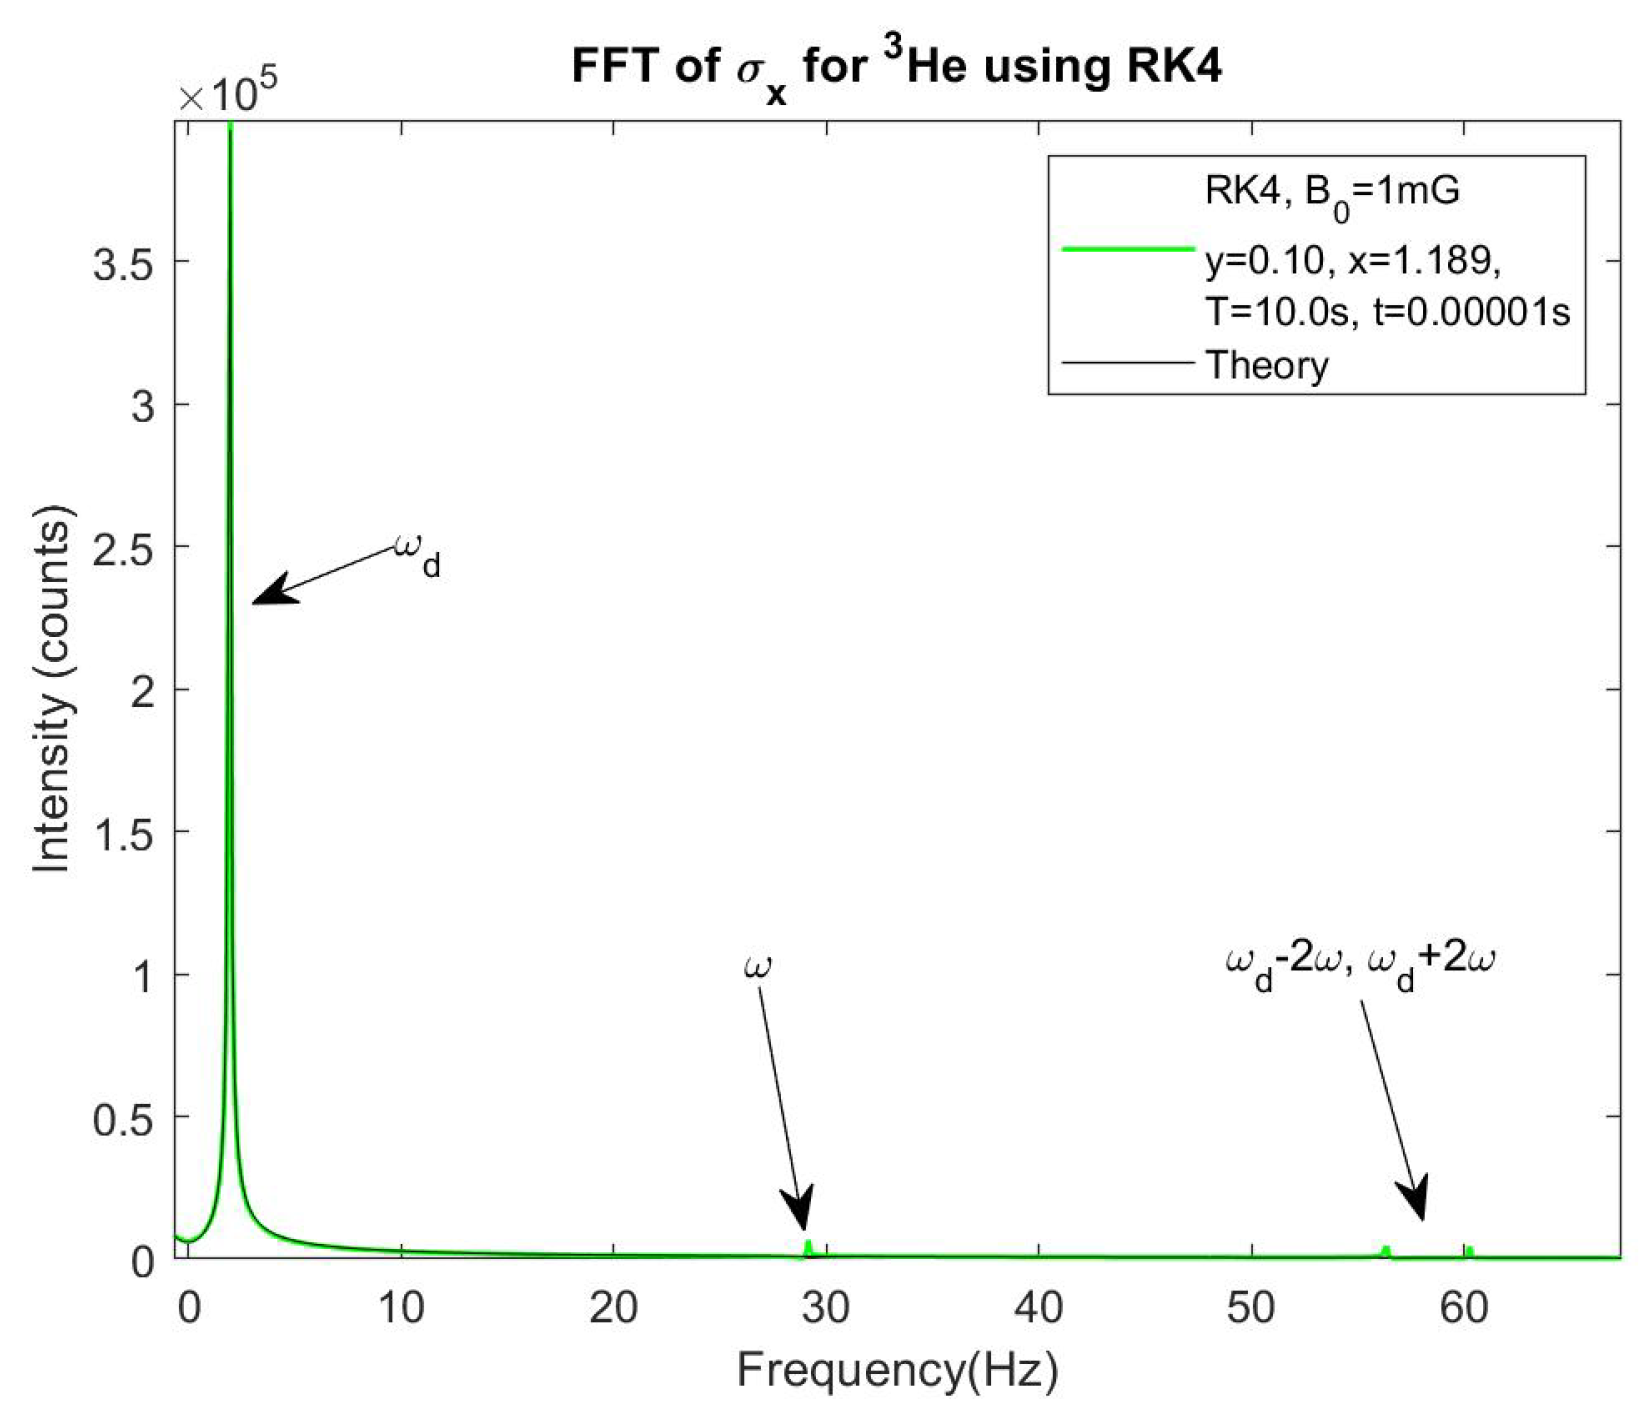
Figure 5.
for , frequencies solved for using the RK4 method. and are frequencies not currently included in theory.
Figure 5.
for , frequencies solved for using the RK4 method. and are frequencies not currently included in theory.
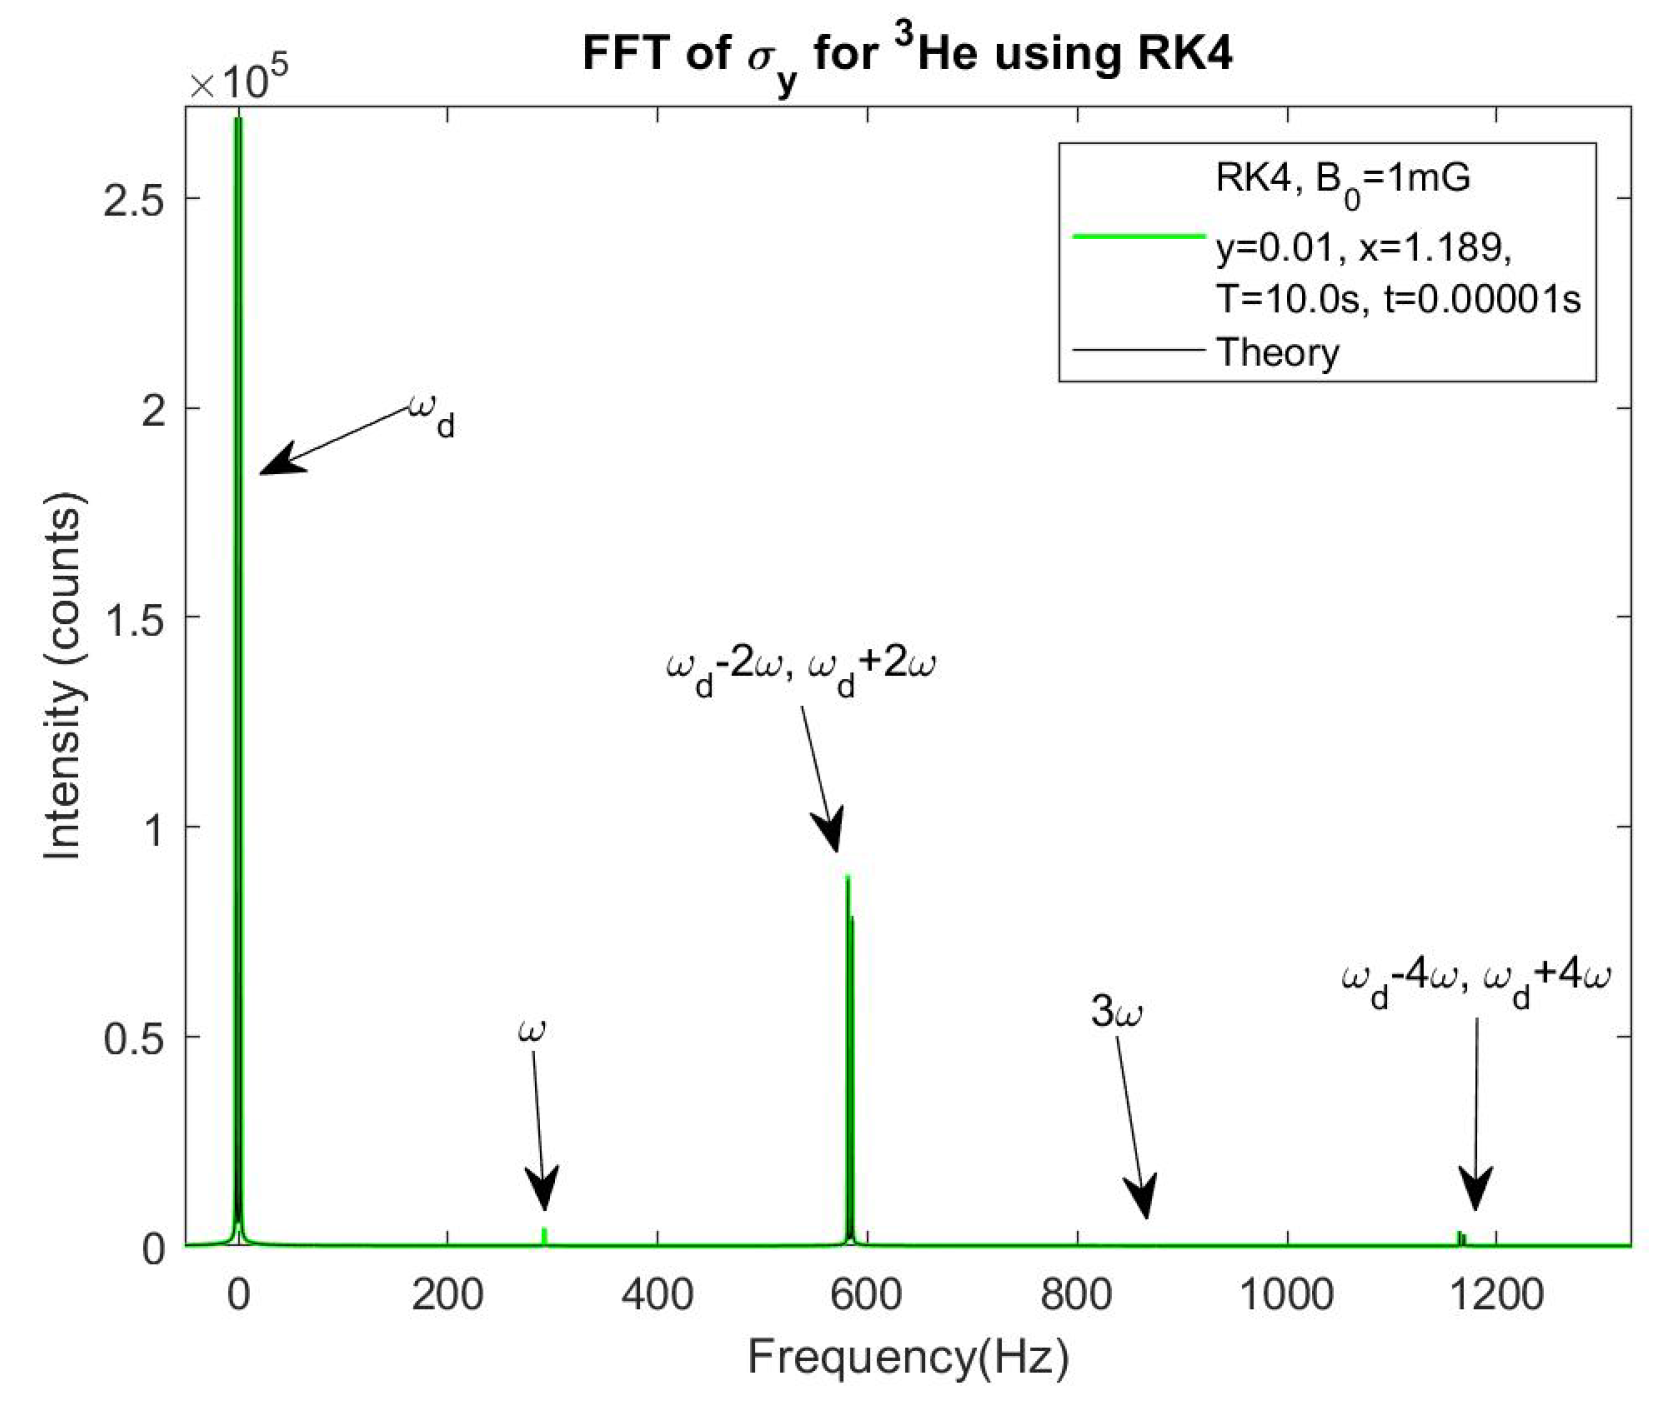
Figure 6.
for , frequencies solved for using the RK4 method. and are frequencies not currently included in theory.
Figure 6.
for , frequencies solved for using the RK4 method. and are frequencies not currently included in theory.
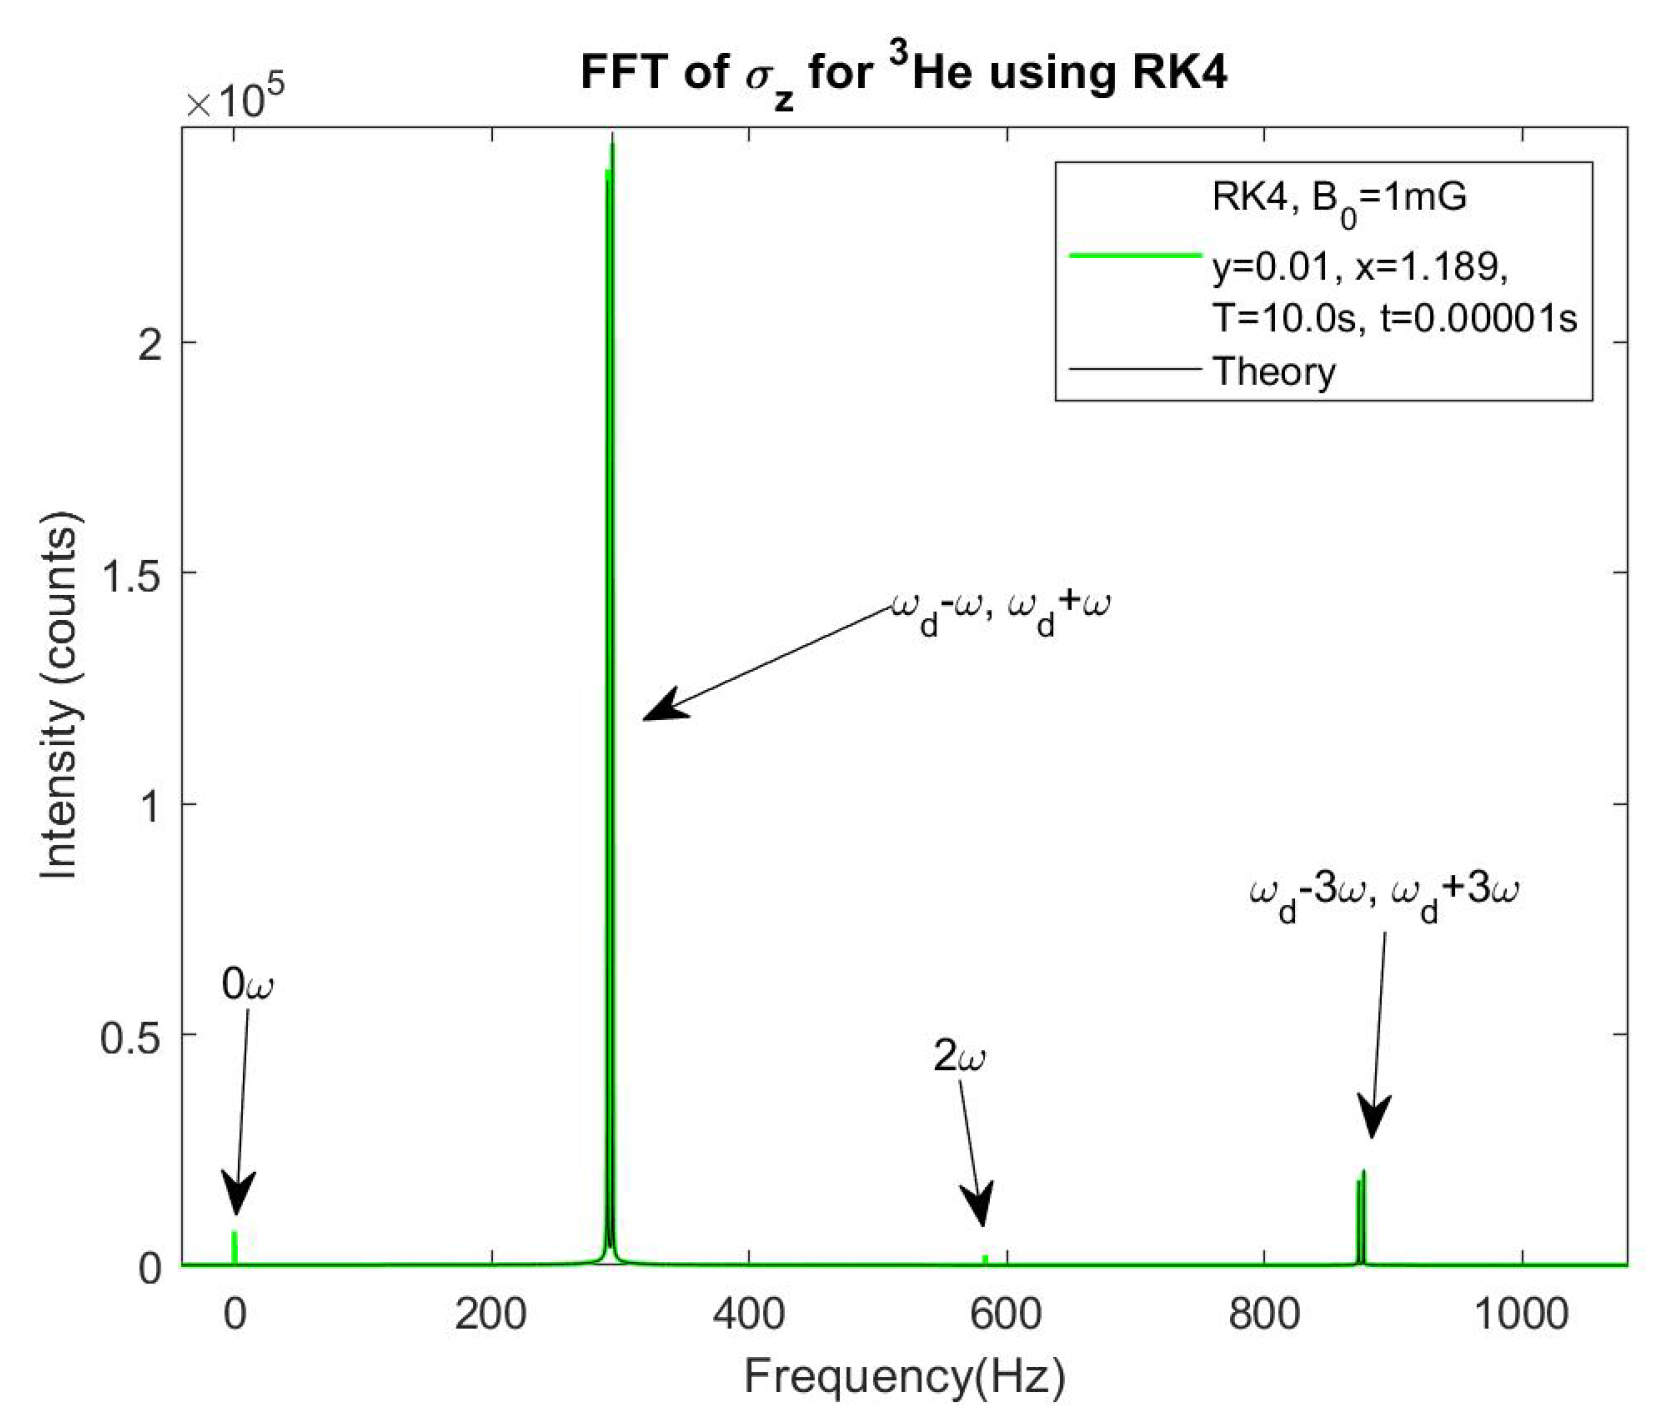
Figure 7.
heights vs y using the RK4. Intensity ranges from 36 to 4031
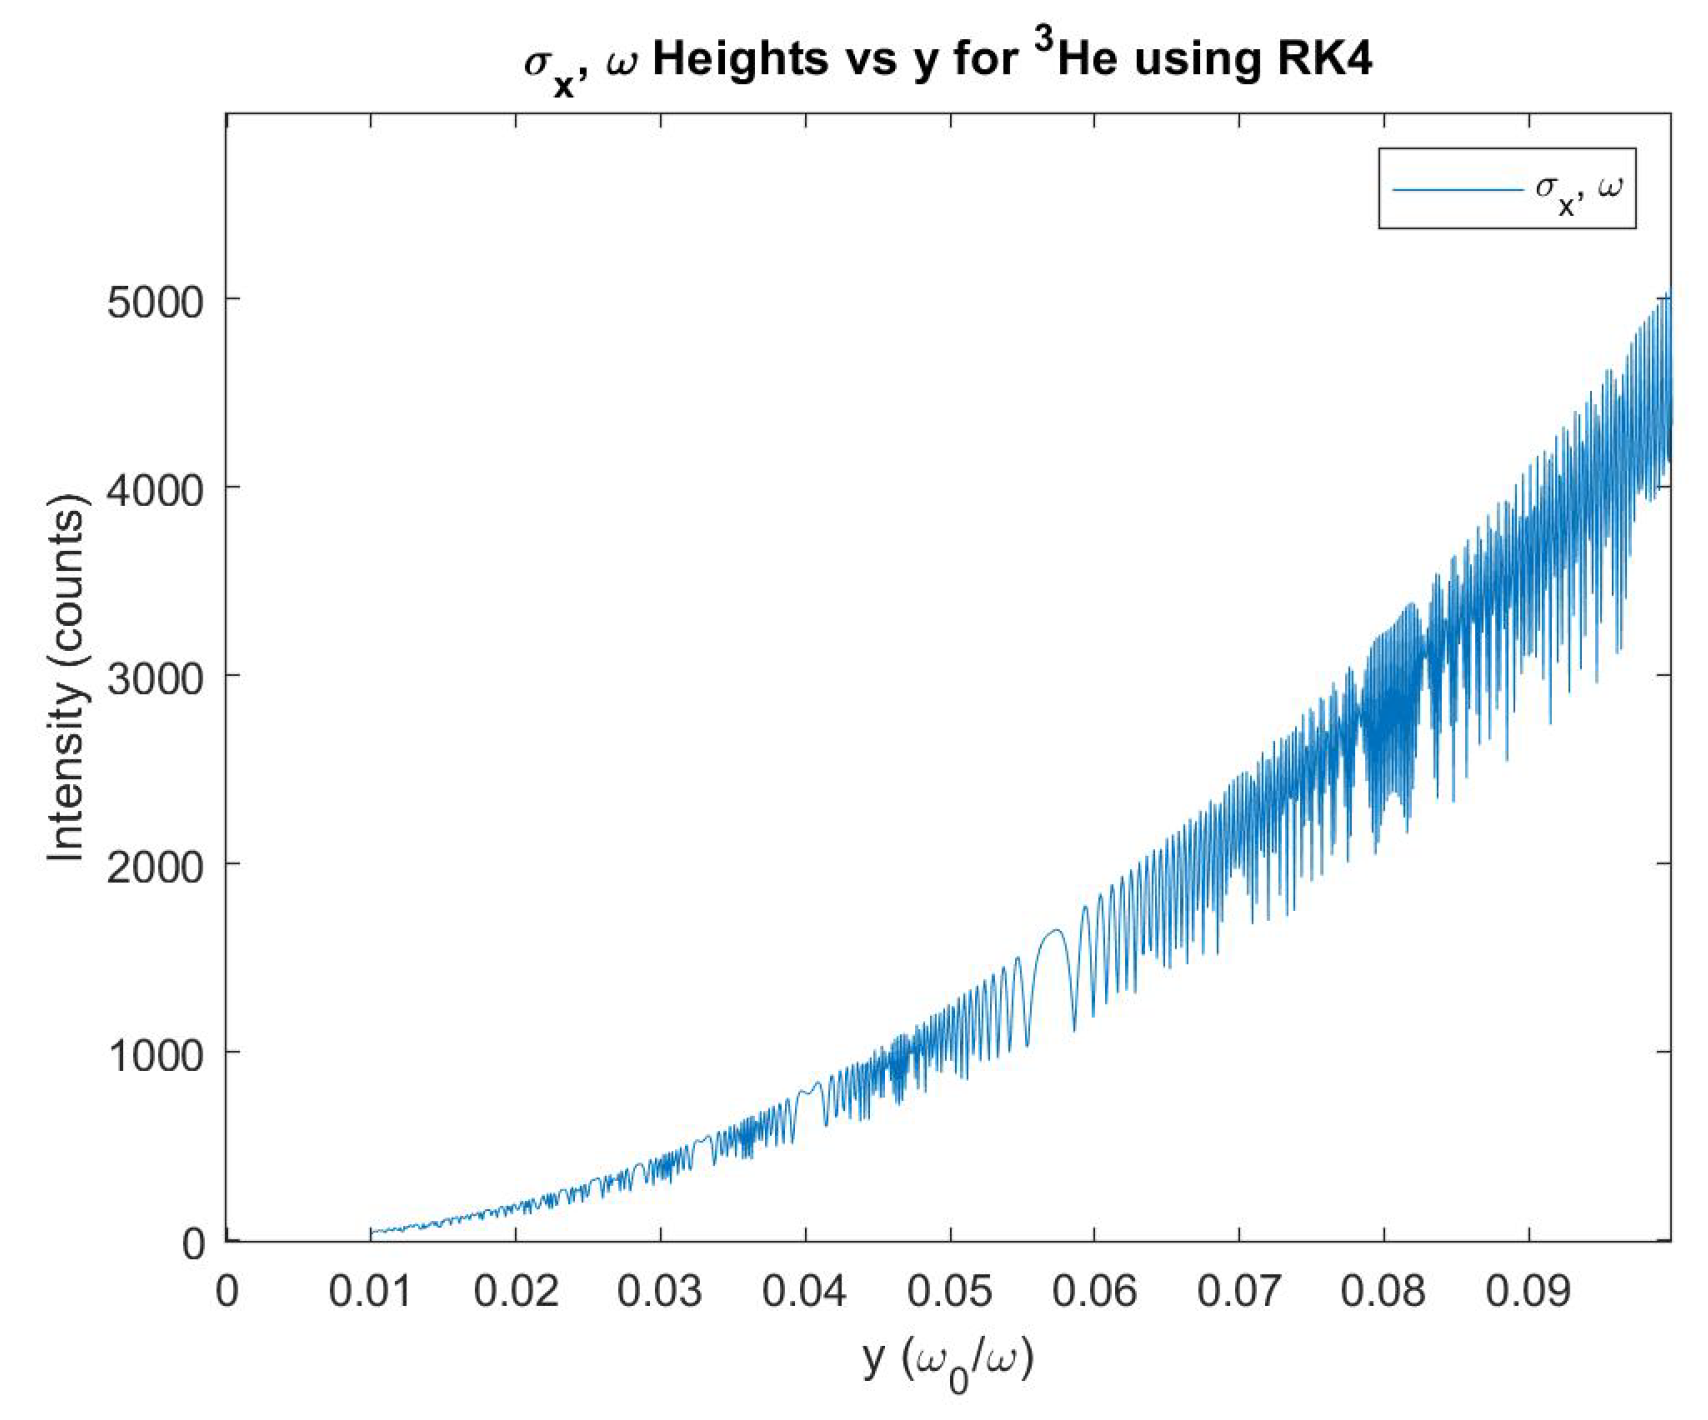
Figure 8.
heights vs y using the RK4. Intensity ranges from 370 to 4304.
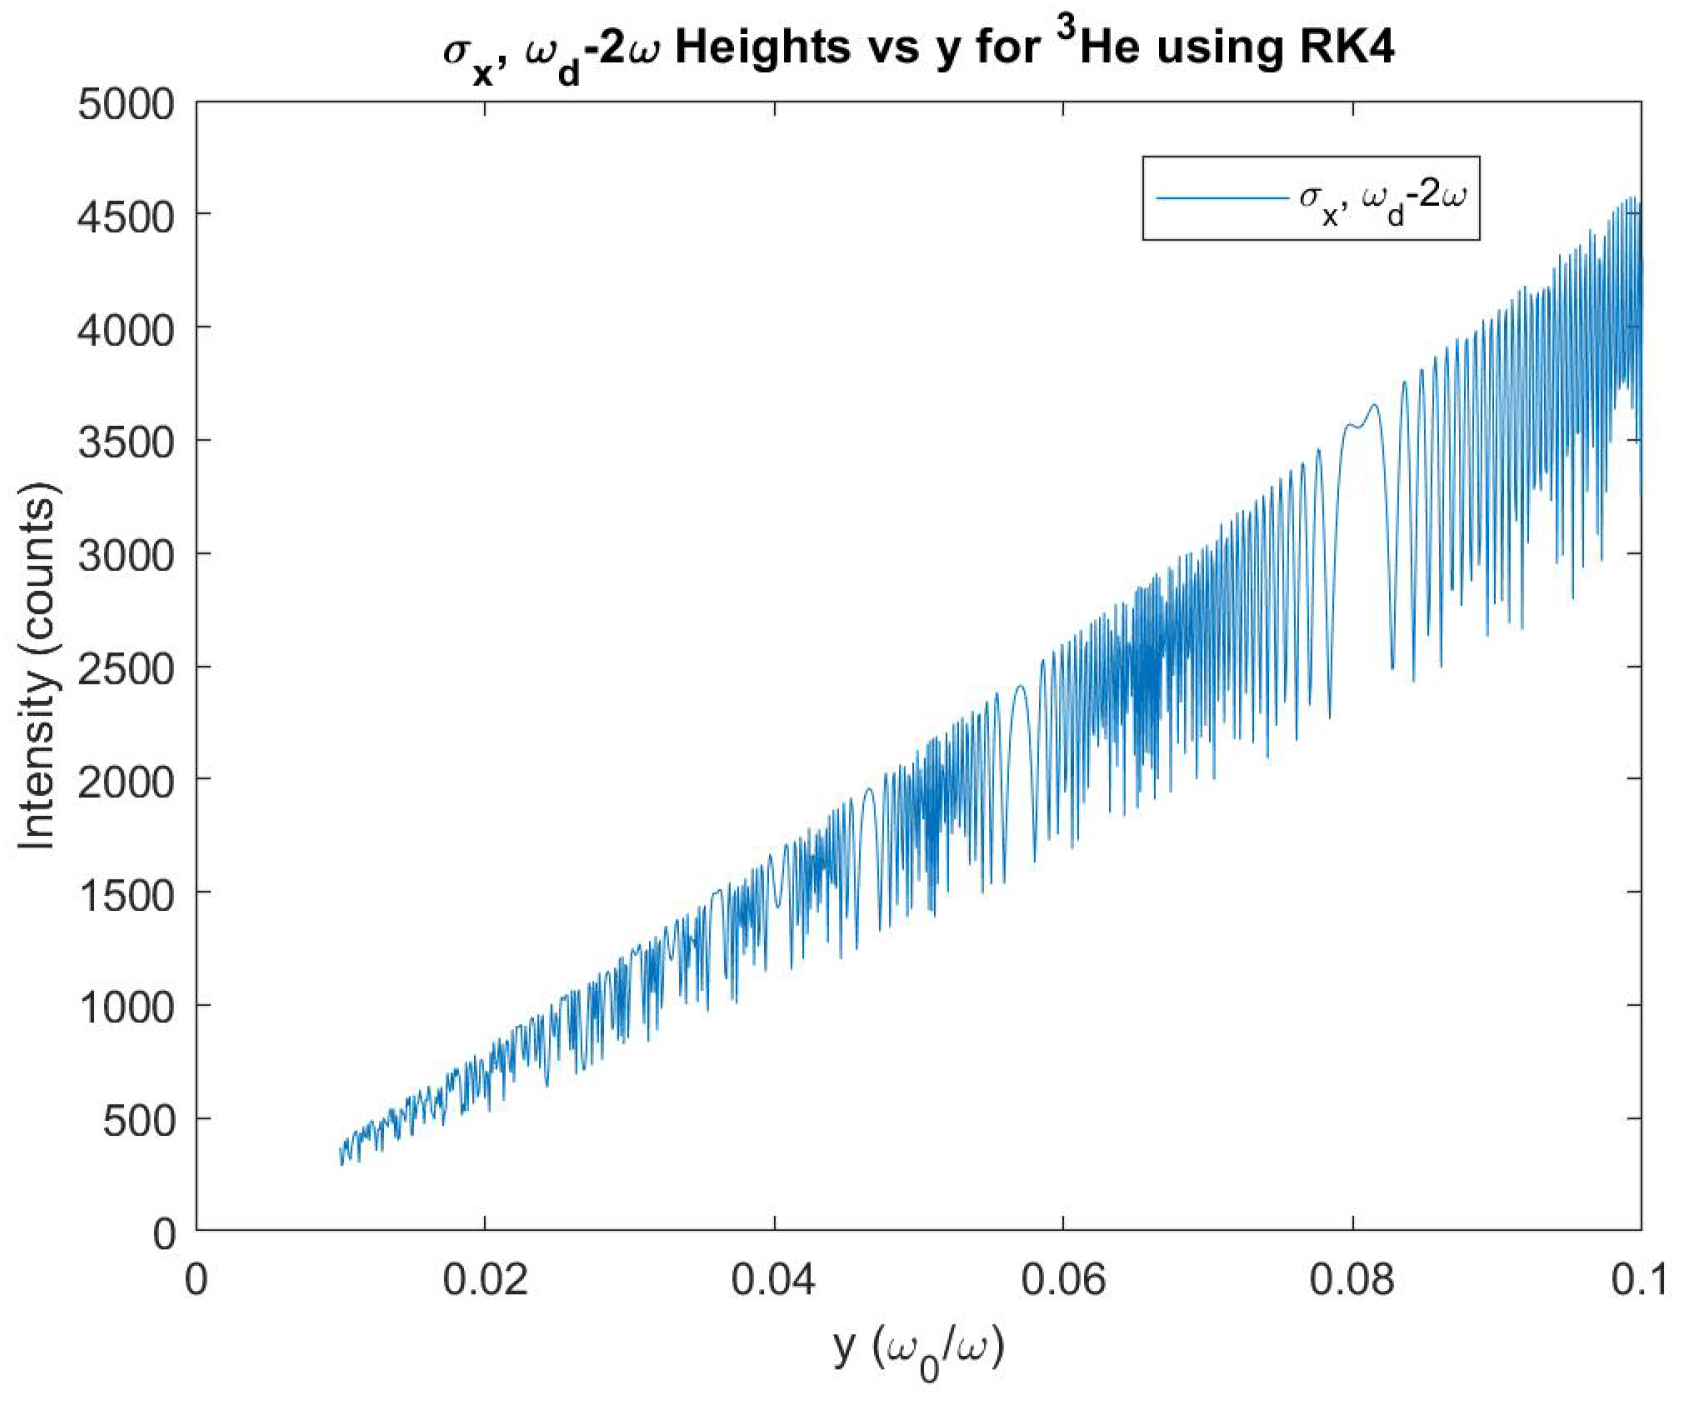
Figure 9.
and heights vs y using the RK4. Intensity ranges from 4050 to 41863 and 6861 to 68212 respectively.
Figure 9.
and heights vs y using the RK4. Intensity ranges from 4050 to 41863 and 6861 to 68212 respectively.
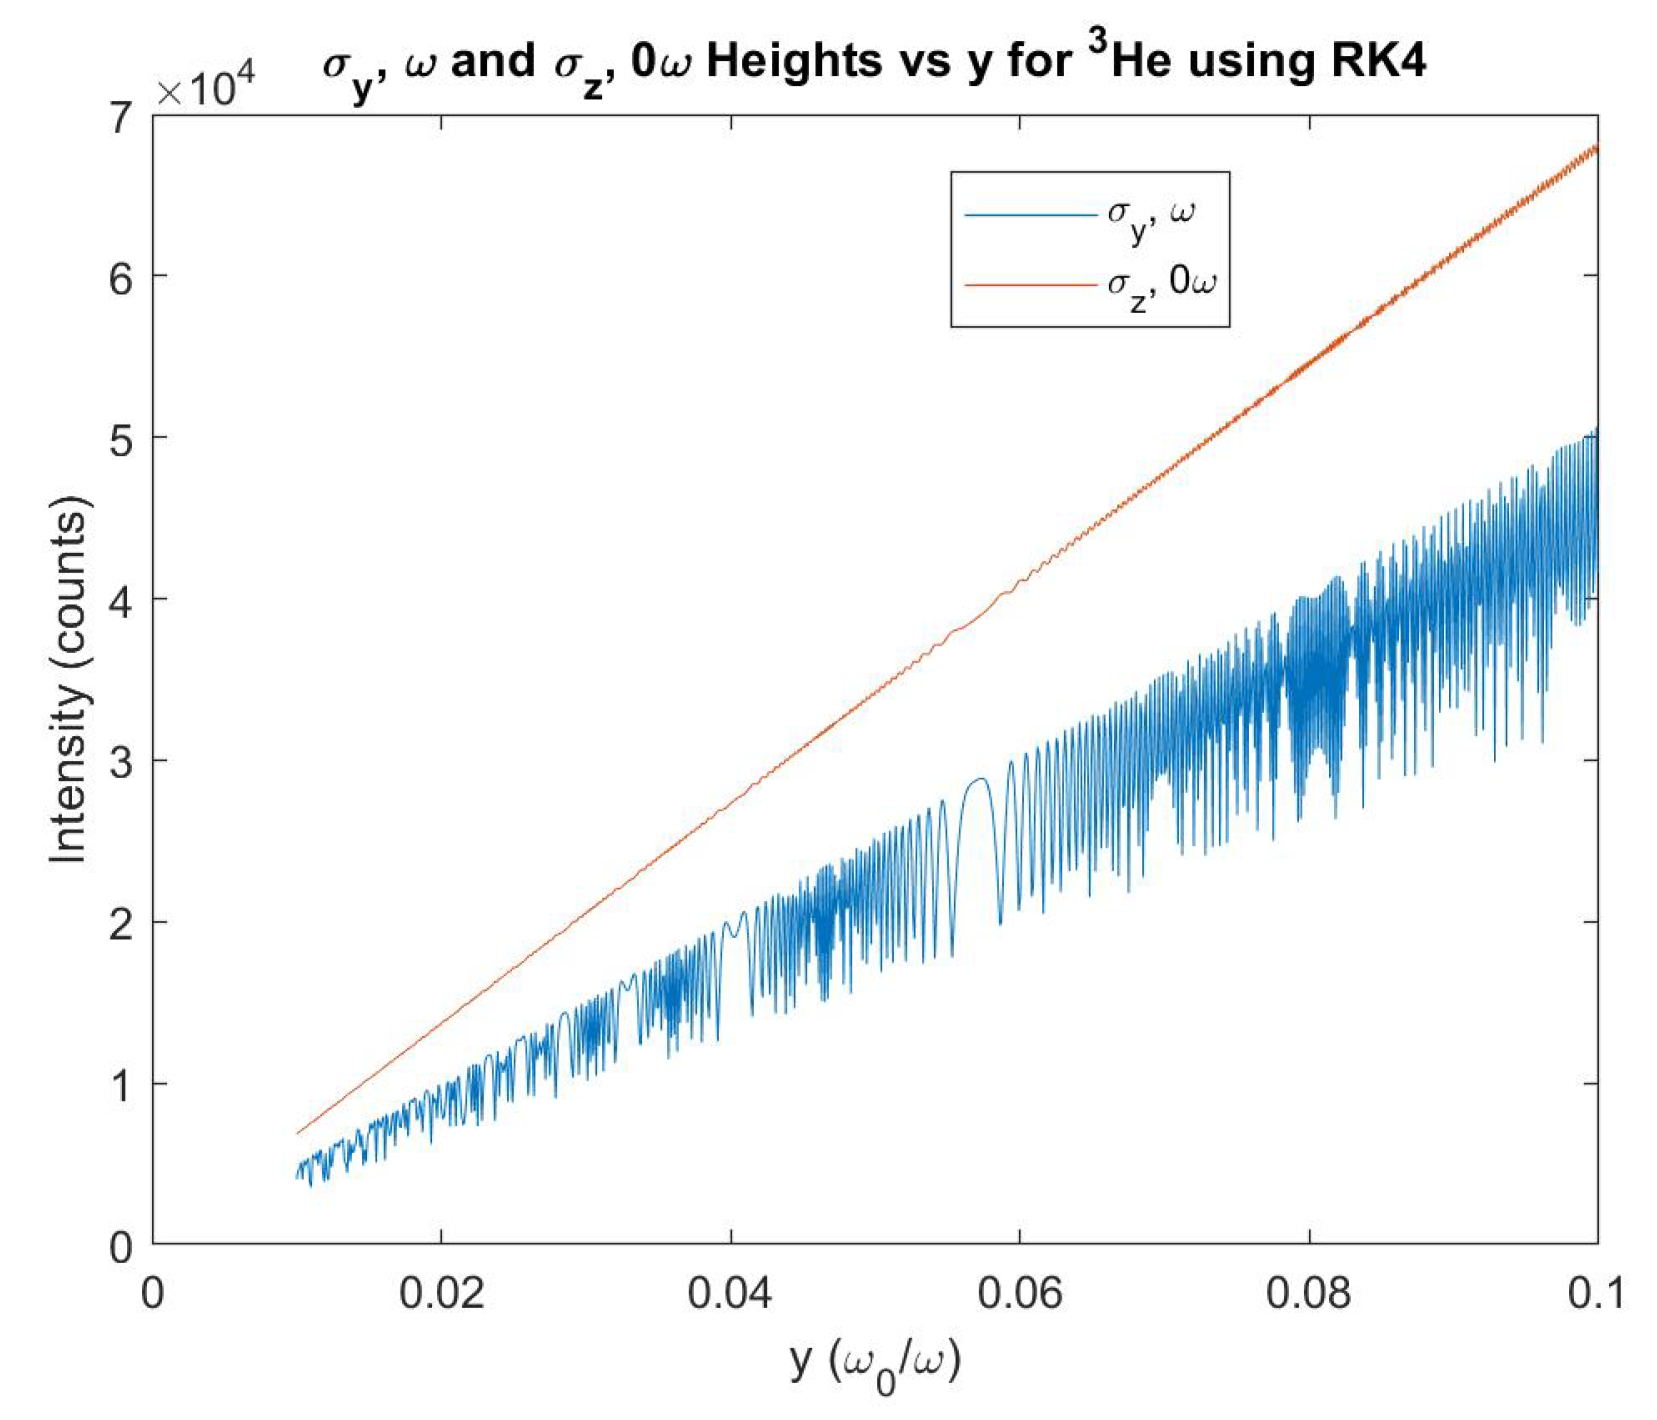
Figure 14.
and y vs. frequency peaks, solved using the Hamiltonian method for .
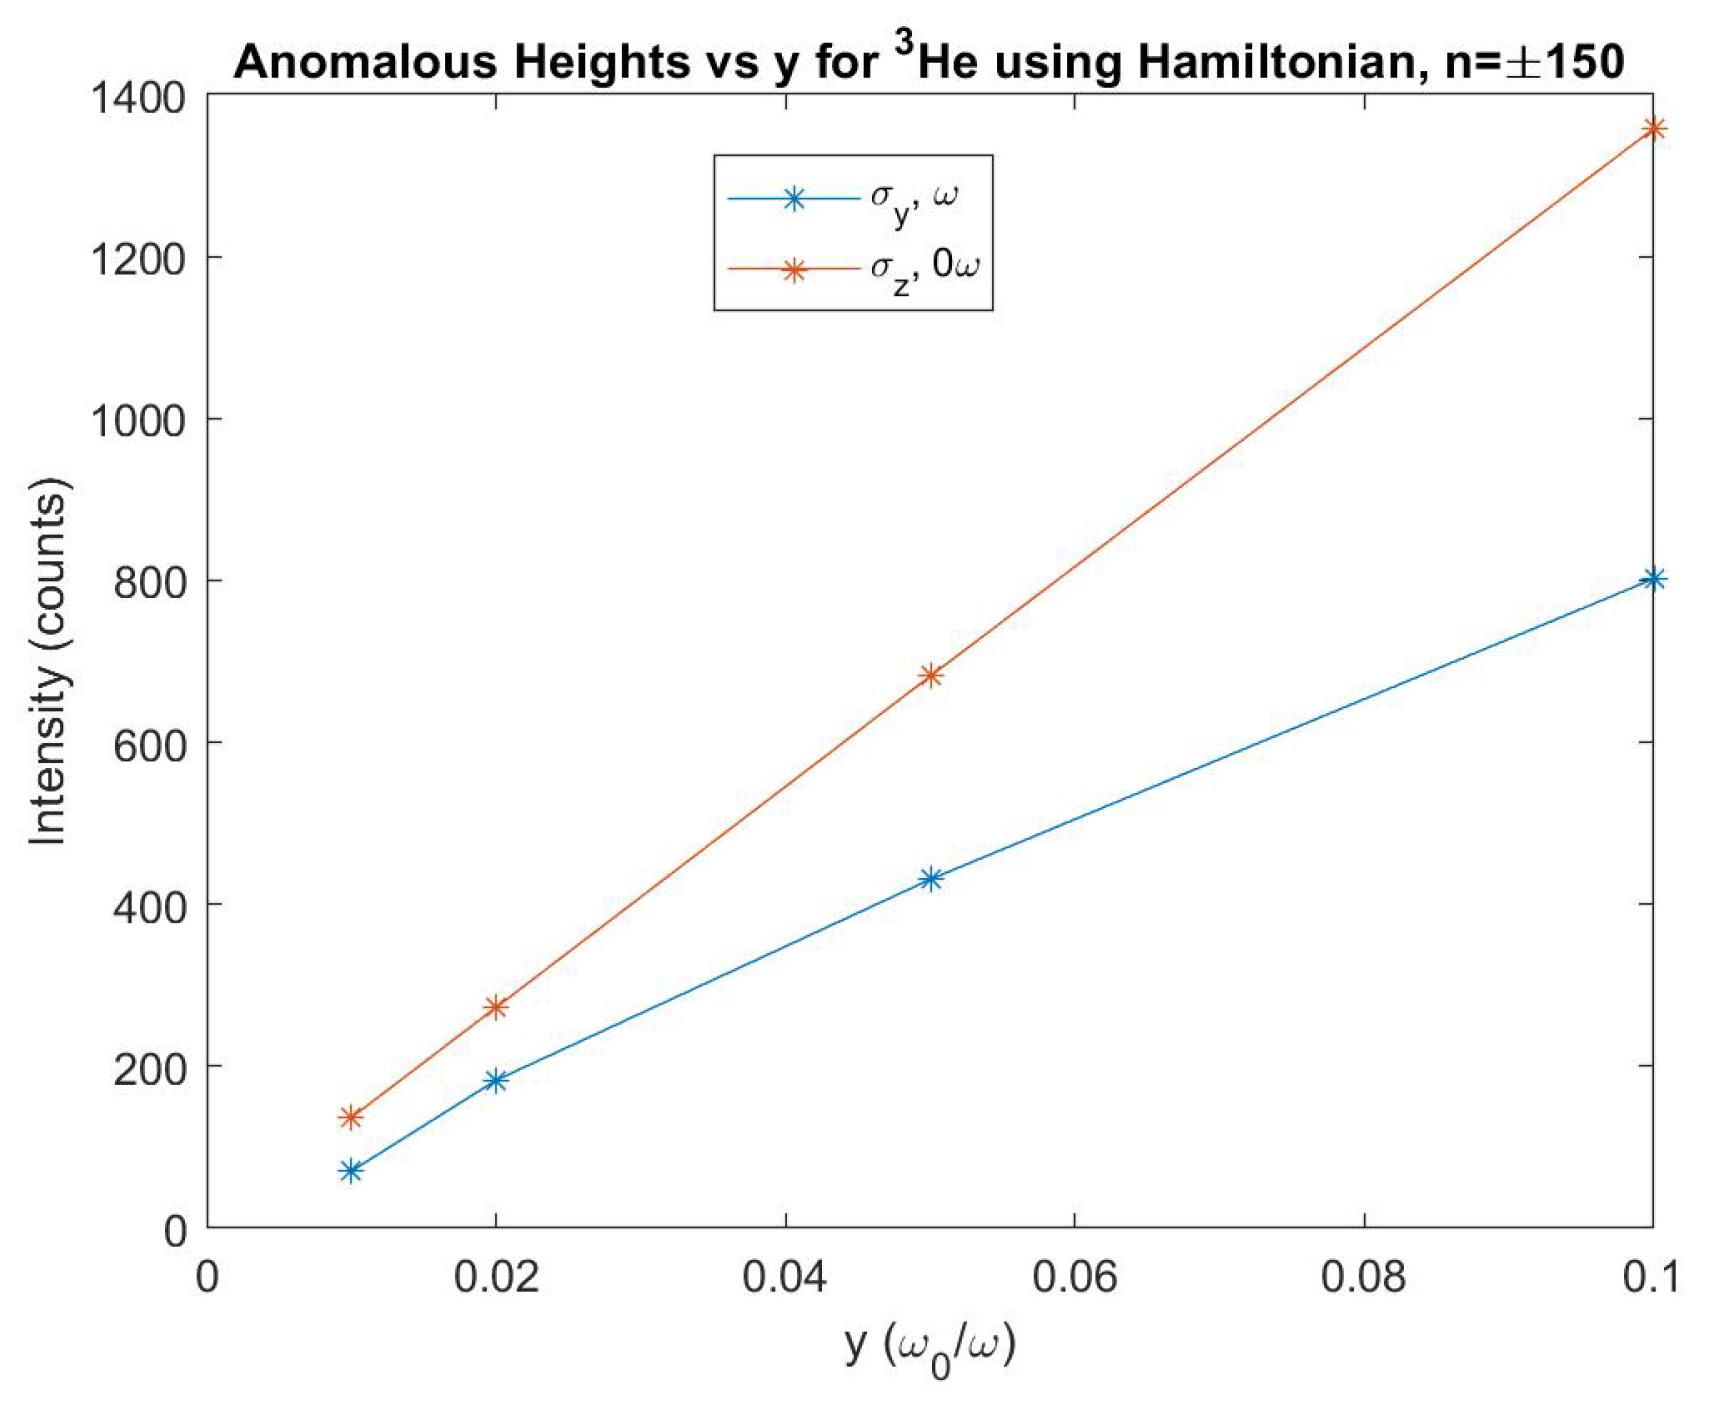
Figure 15.
for , frequencies solved for using the RK4 method. The frequencies are now accounted for with the first order corrections to the eigenstates. The bottom plot shows the anomalies with a zoomed-in view.
Figure 15.
for , frequencies solved for using the RK4 method. The frequencies are now accounted for with the first order corrections to the eigenstates. The bottom plot shows the anomalies with a zoomed-in view.
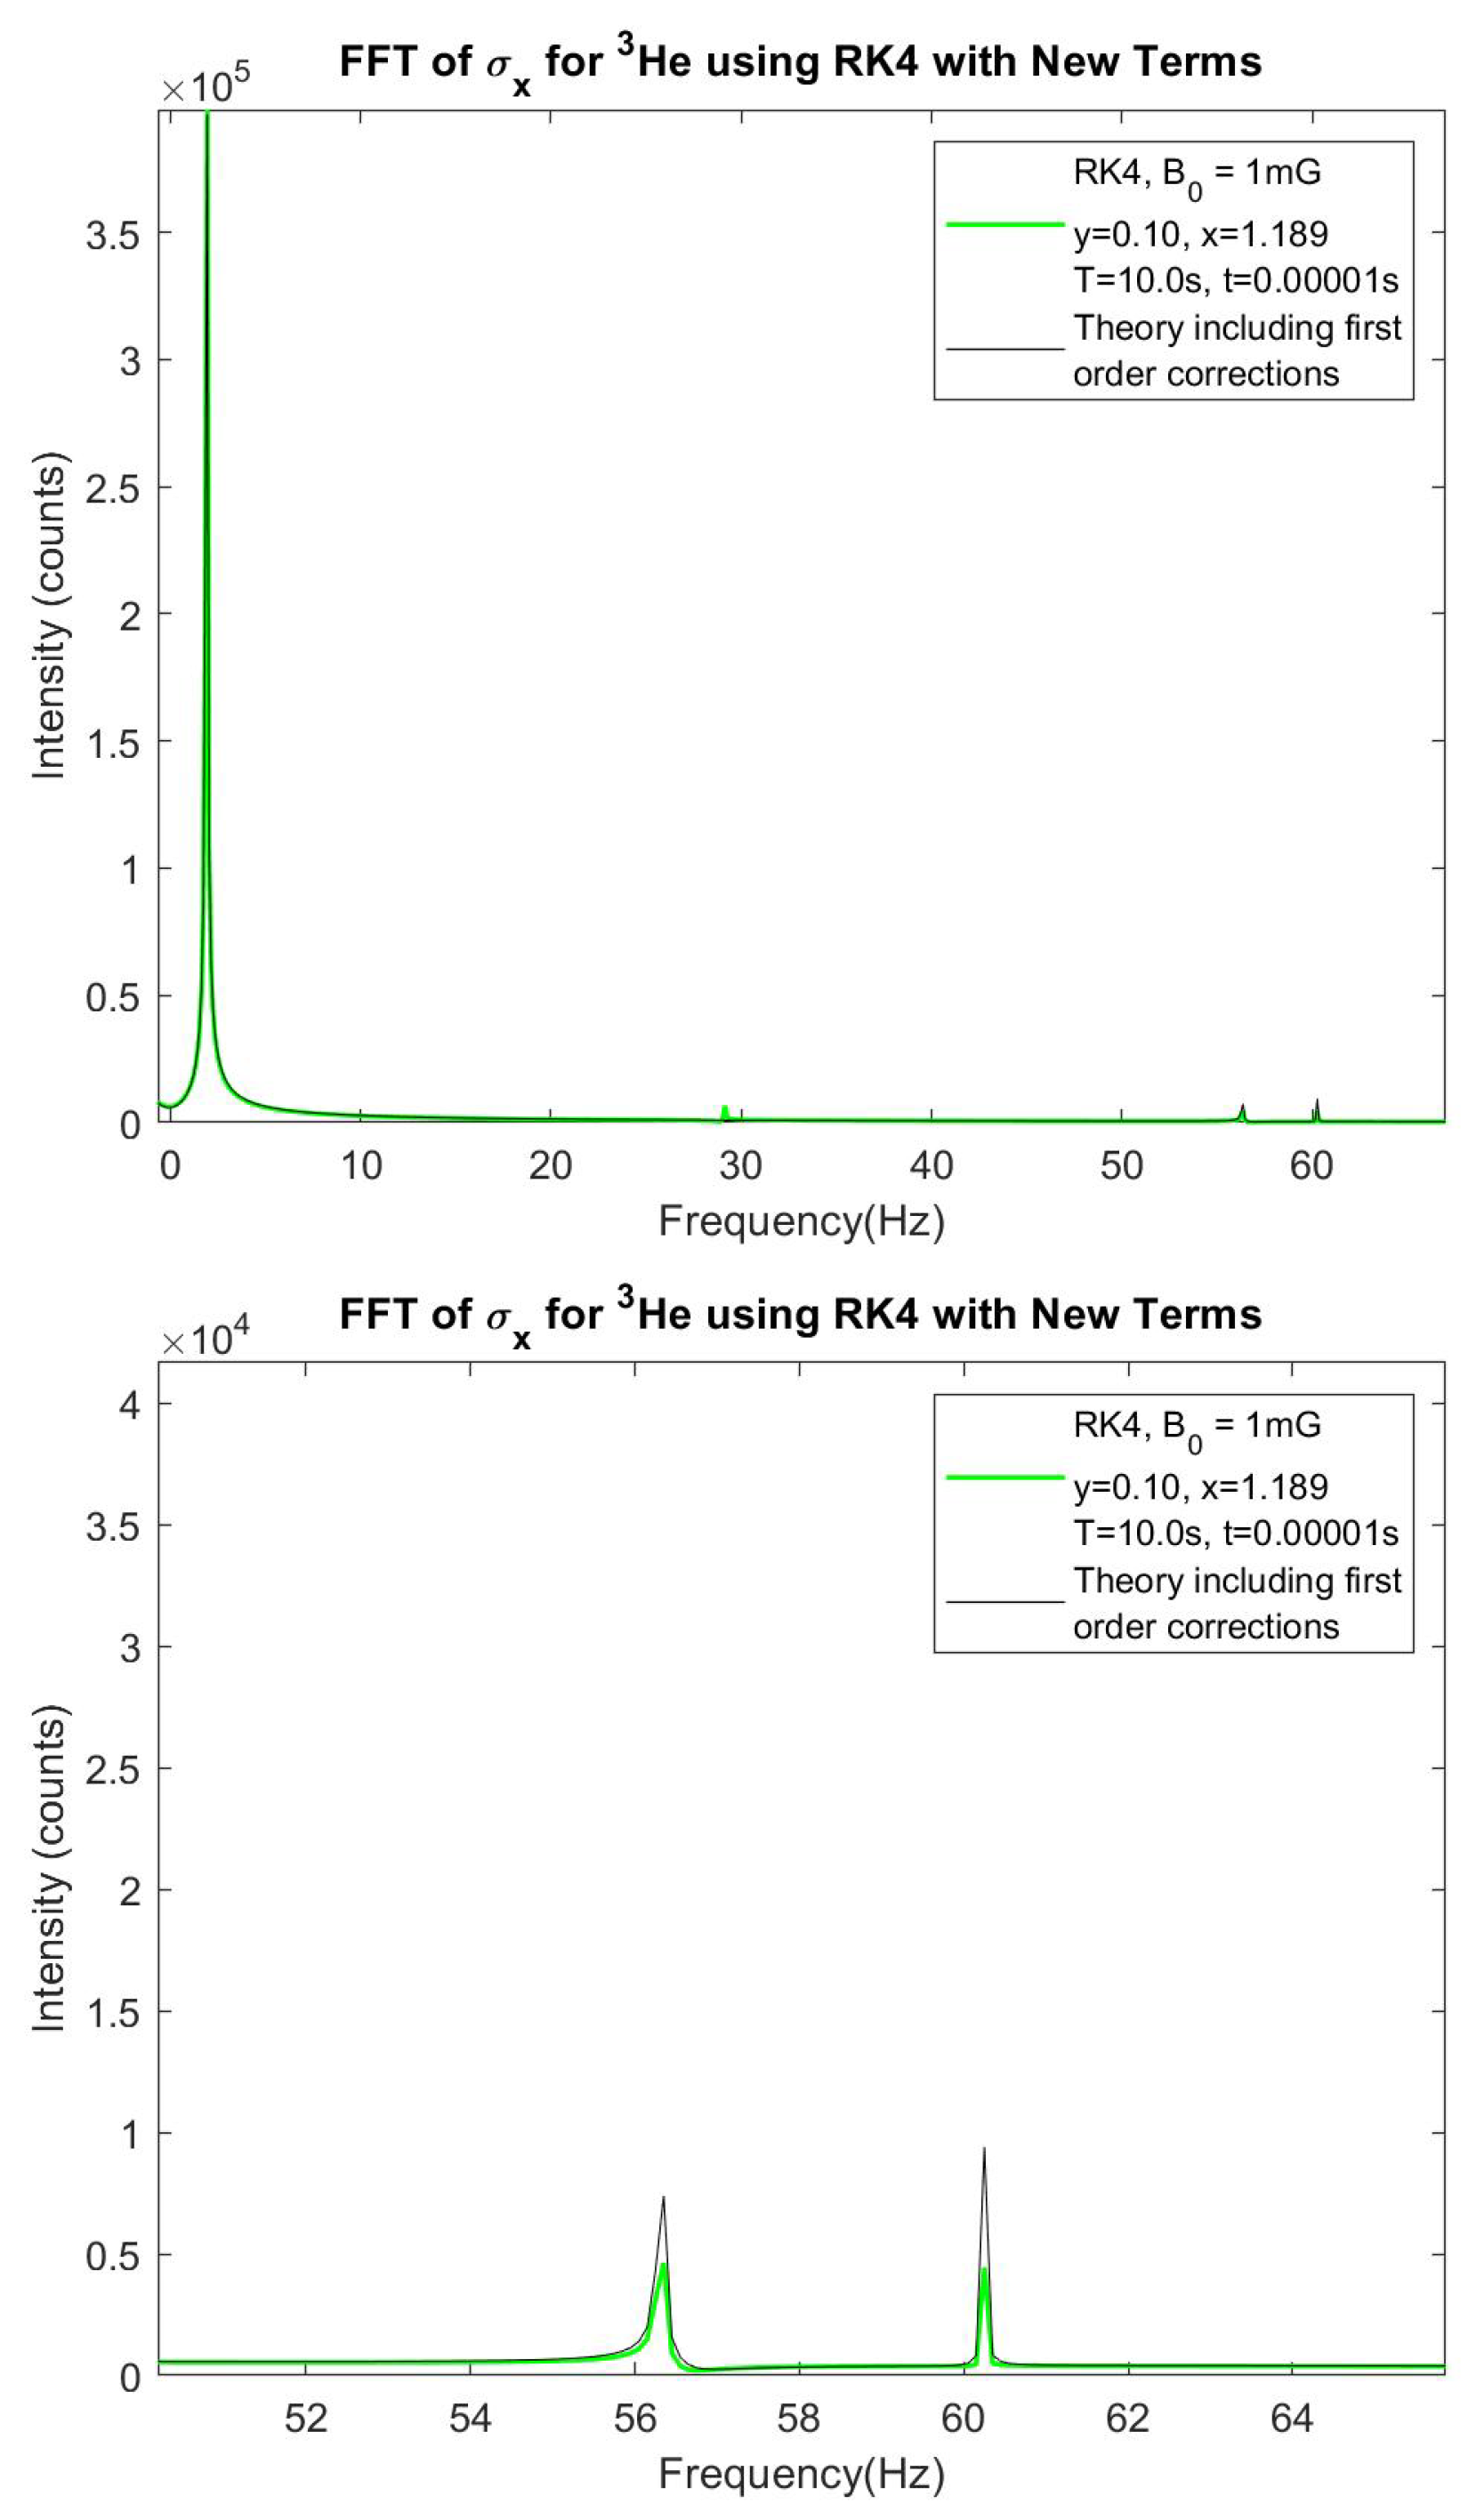
Figure 16.
for , frequencies solved for using the RK4 method. The and frequencies are now accounted for with the first order corrections to the eigenstates. The bottom plot shows the anomalies with a zoomed-in view.
Figure 16.
for , frequencies solved for using the RK4 method. The and frequencies are now accounted for with the first order corrections to the eigenstates. The bottom plot shows the anomalies with a zoomed-in view.
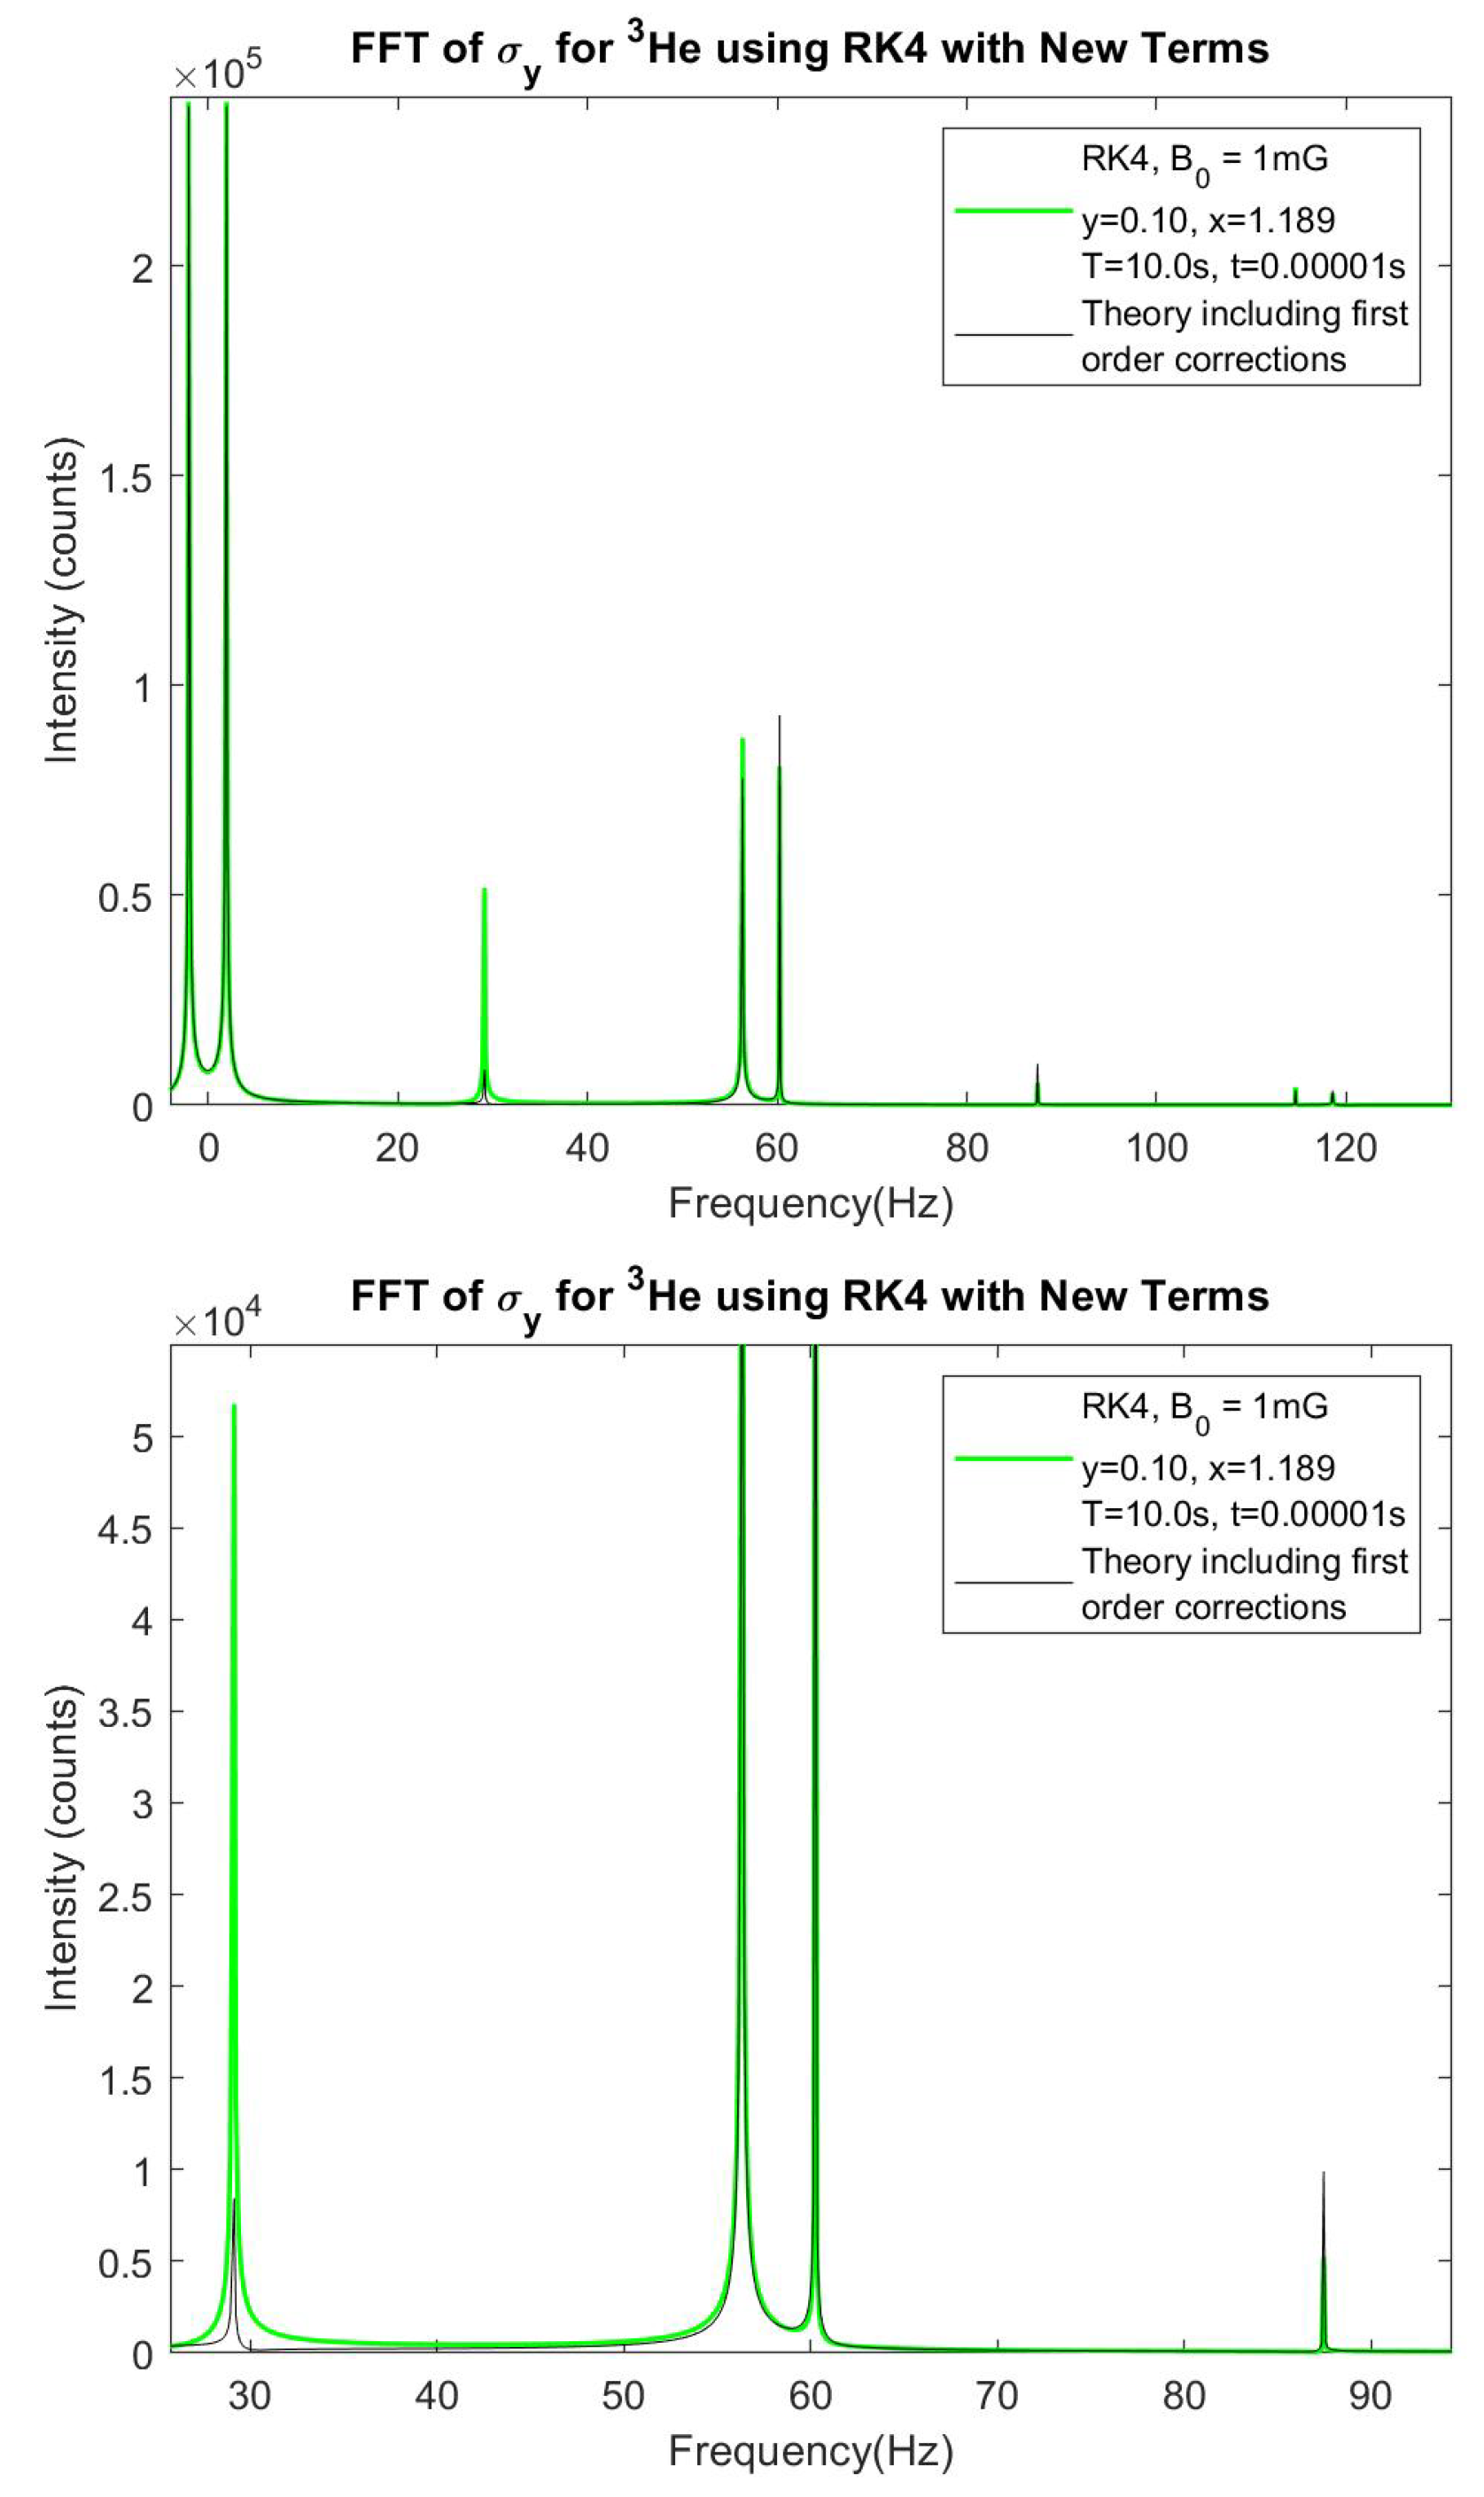
Figure 17.
for , frequencies solved for using the RK4 method. The and frequencies are now accounted for with the first order corrections to the eigenstates. The bottom plot shows the anomalies with a zoomed-in view.
Figure 17.
for , frequencies solved for using the RK4 method. The and frequencies are now accounted for with the first order corrections to the eigenstates. The bottom plot shows the anomalies with a zoomed-in view.
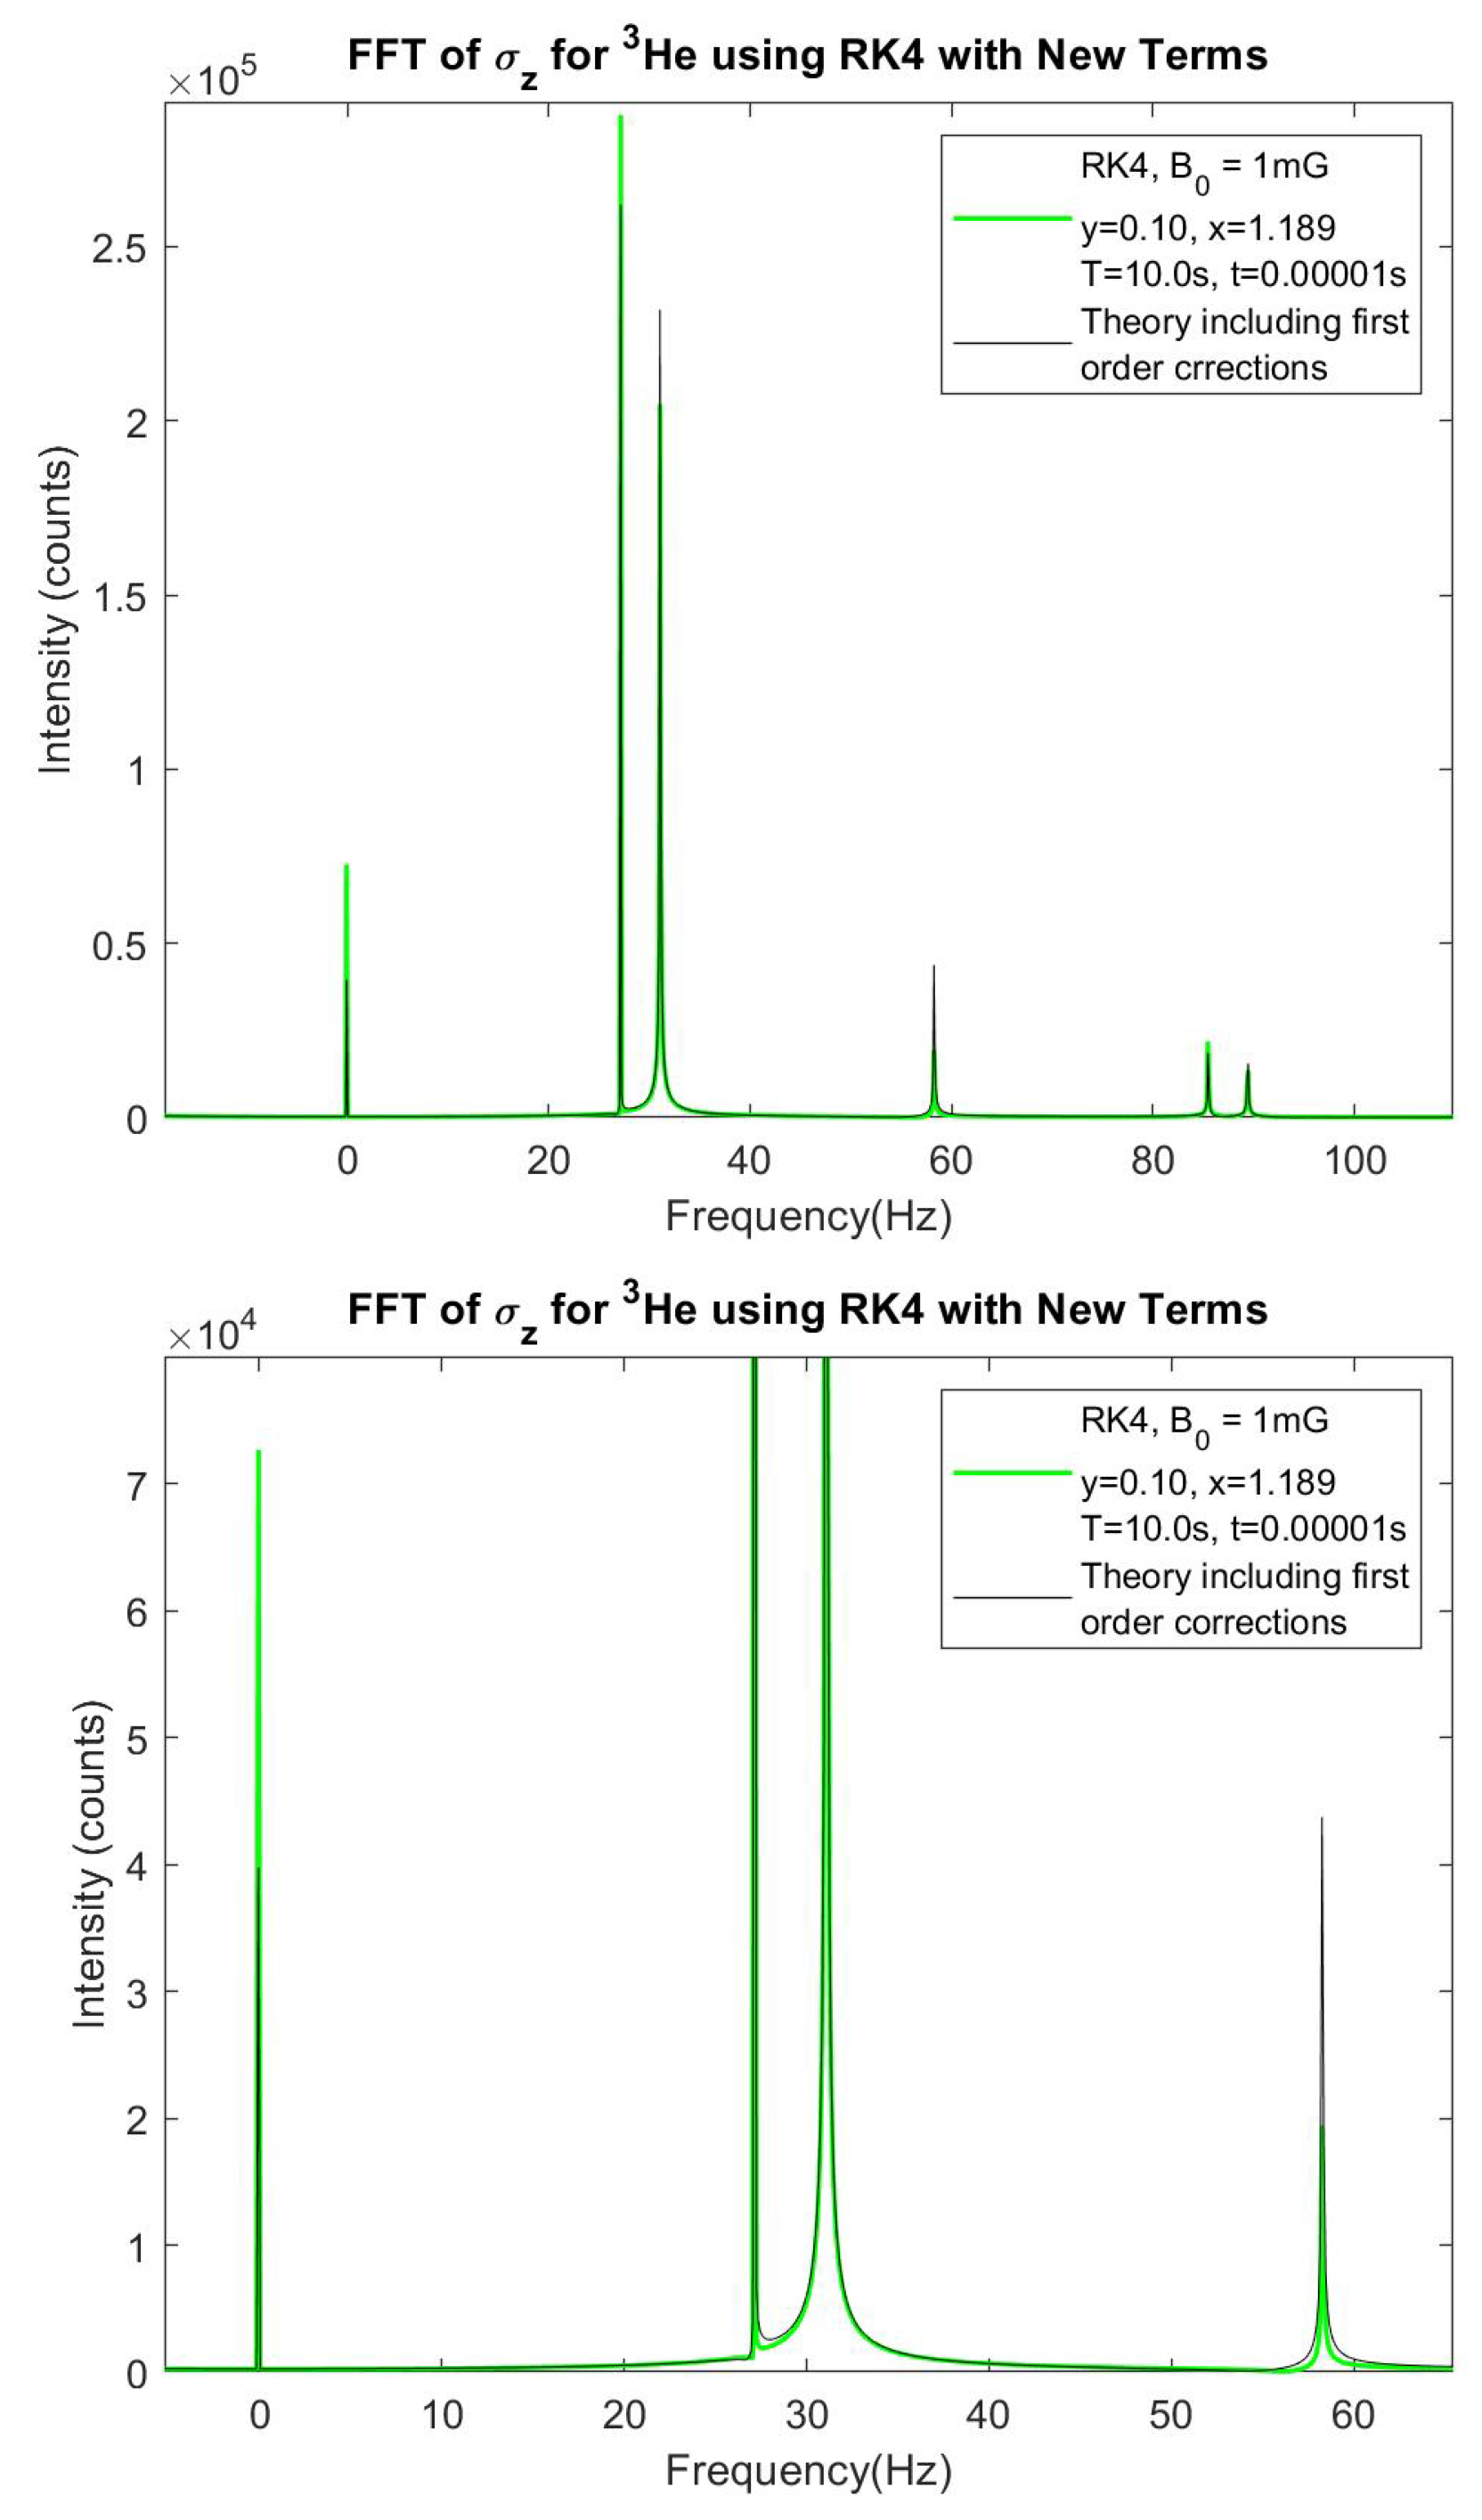
Figure 18.
The zeroth order Bessel function of the first kind.
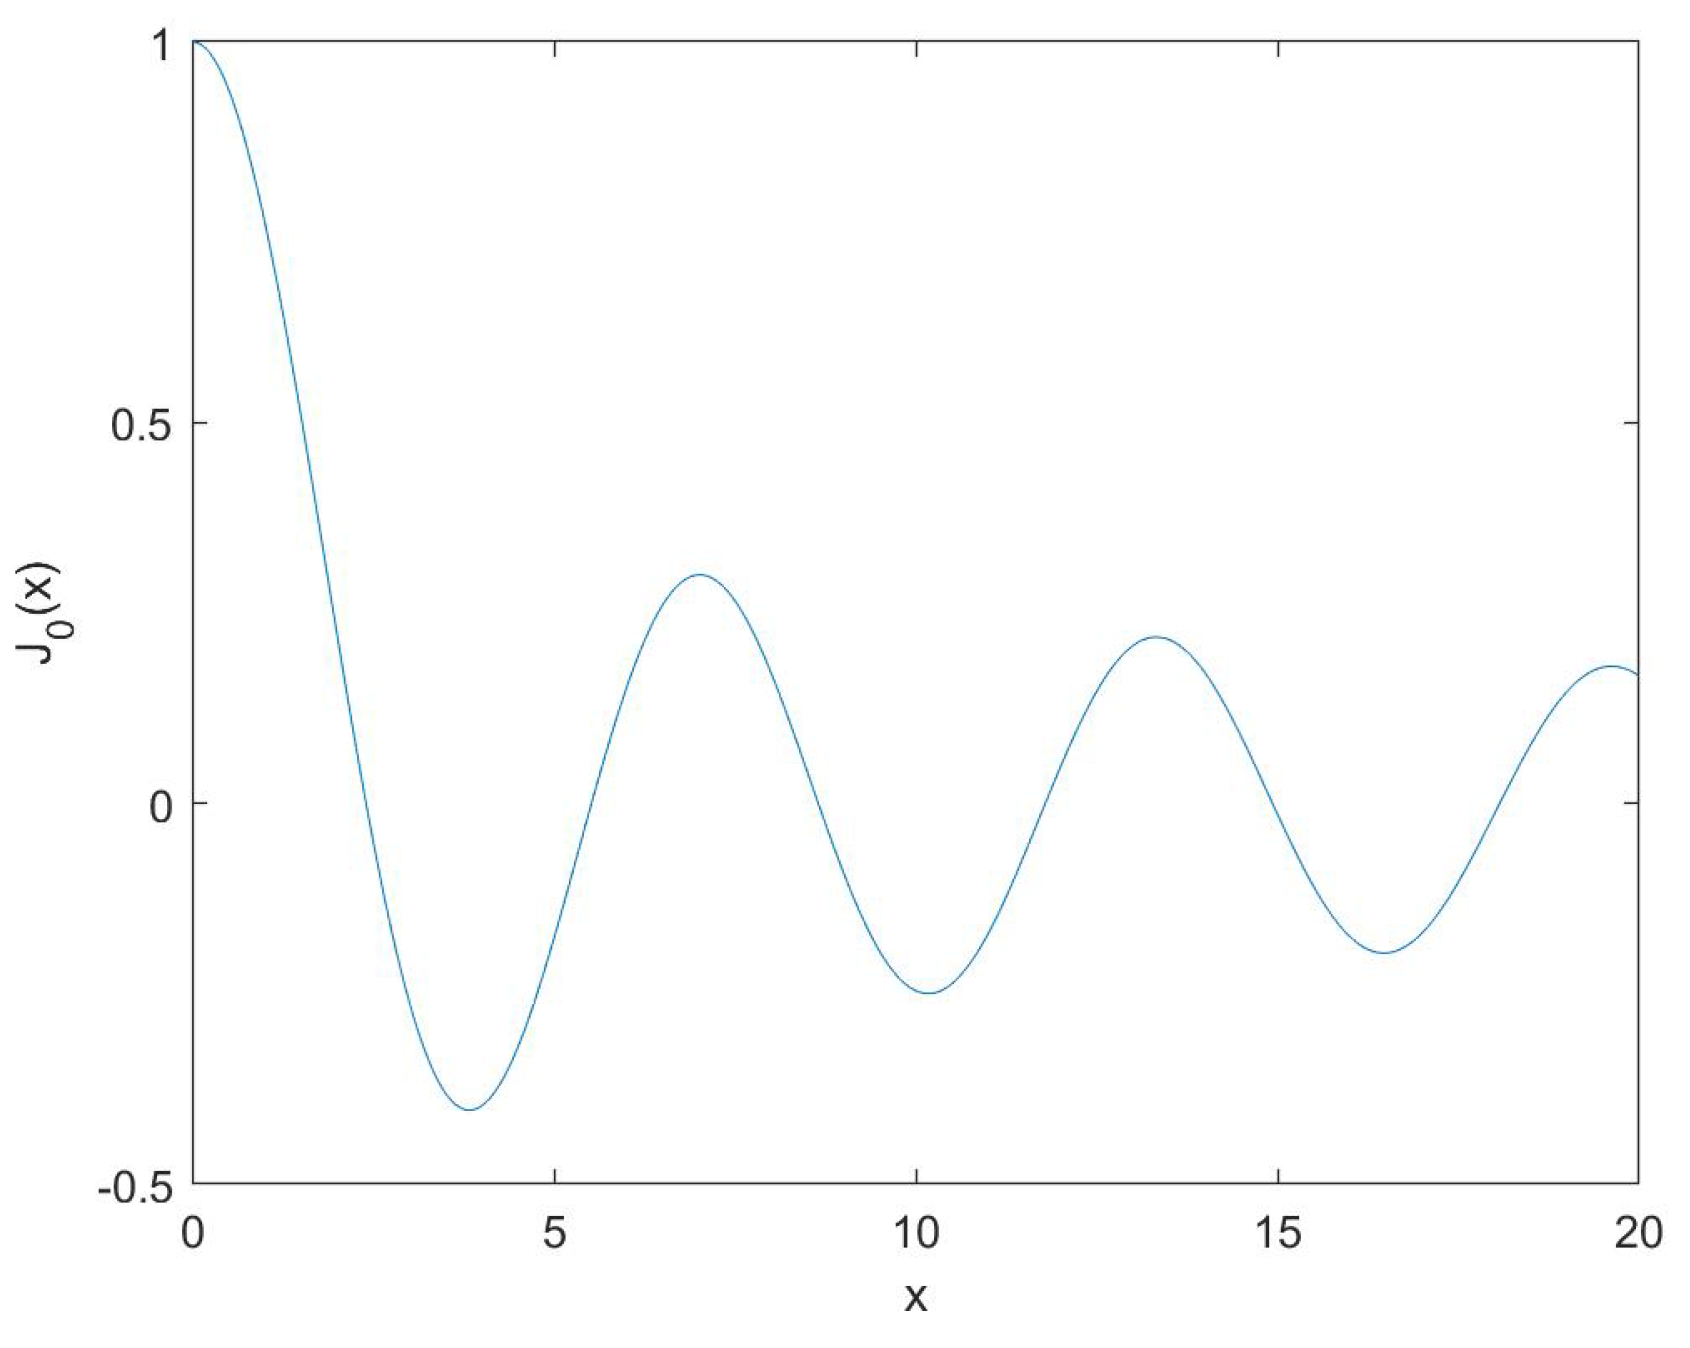
Figure 19.
The absolute value of the critical dressing condition where the y-axis is the relative frequency between UCN and 3He, , divided by .
Figure 19.
The absolute value of the critical dressing condition where the y-axis is the relative frequency between UCN and 3He, , divided by .
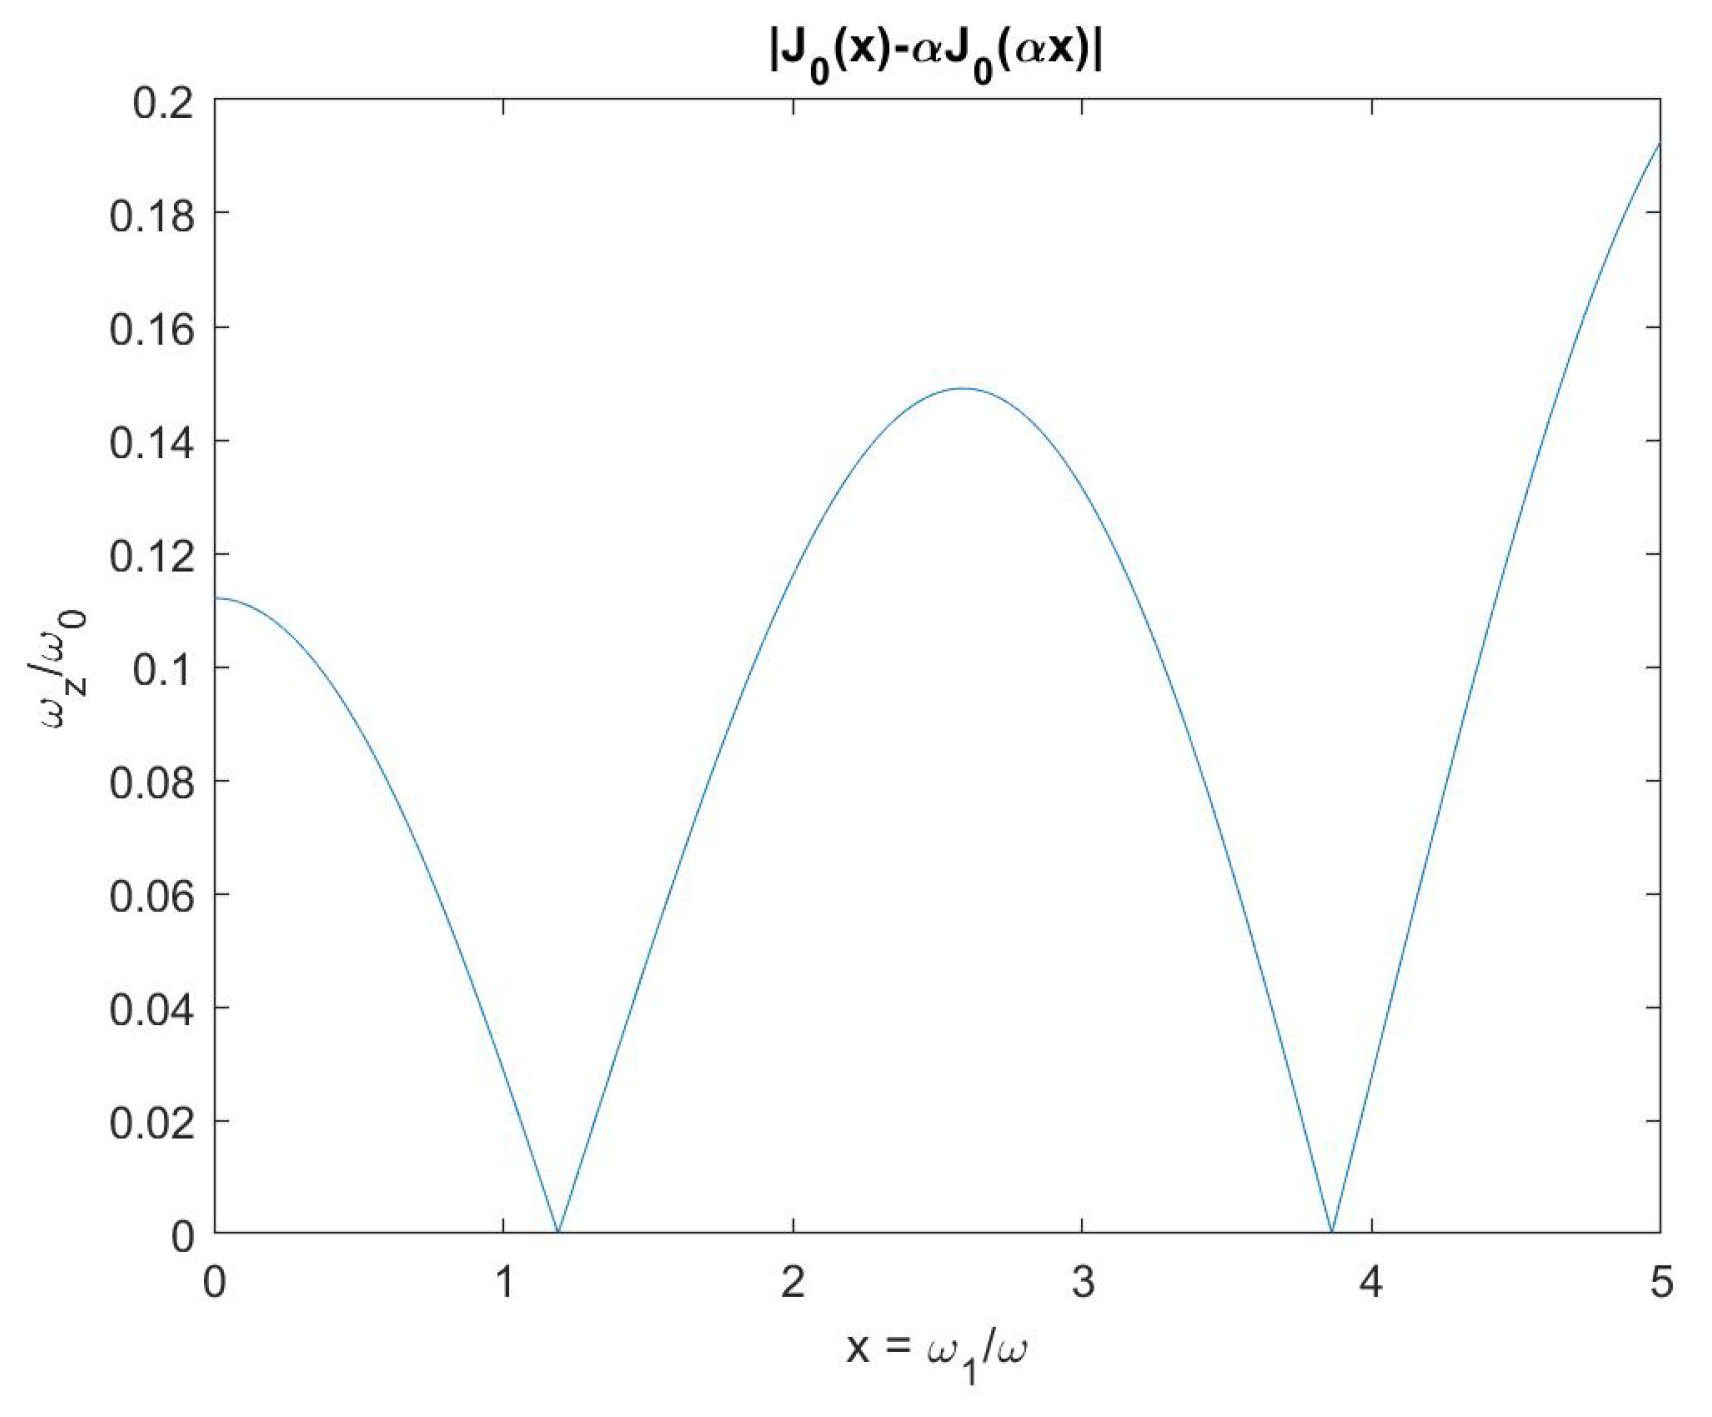
Figure 20.
vs time with in blue and in orange, yellow and purple. The two cases are mutually exclusive.
Figure 20.
vs time with in blue and in orange, yellow and purple. The two cases are mutually exclusive.
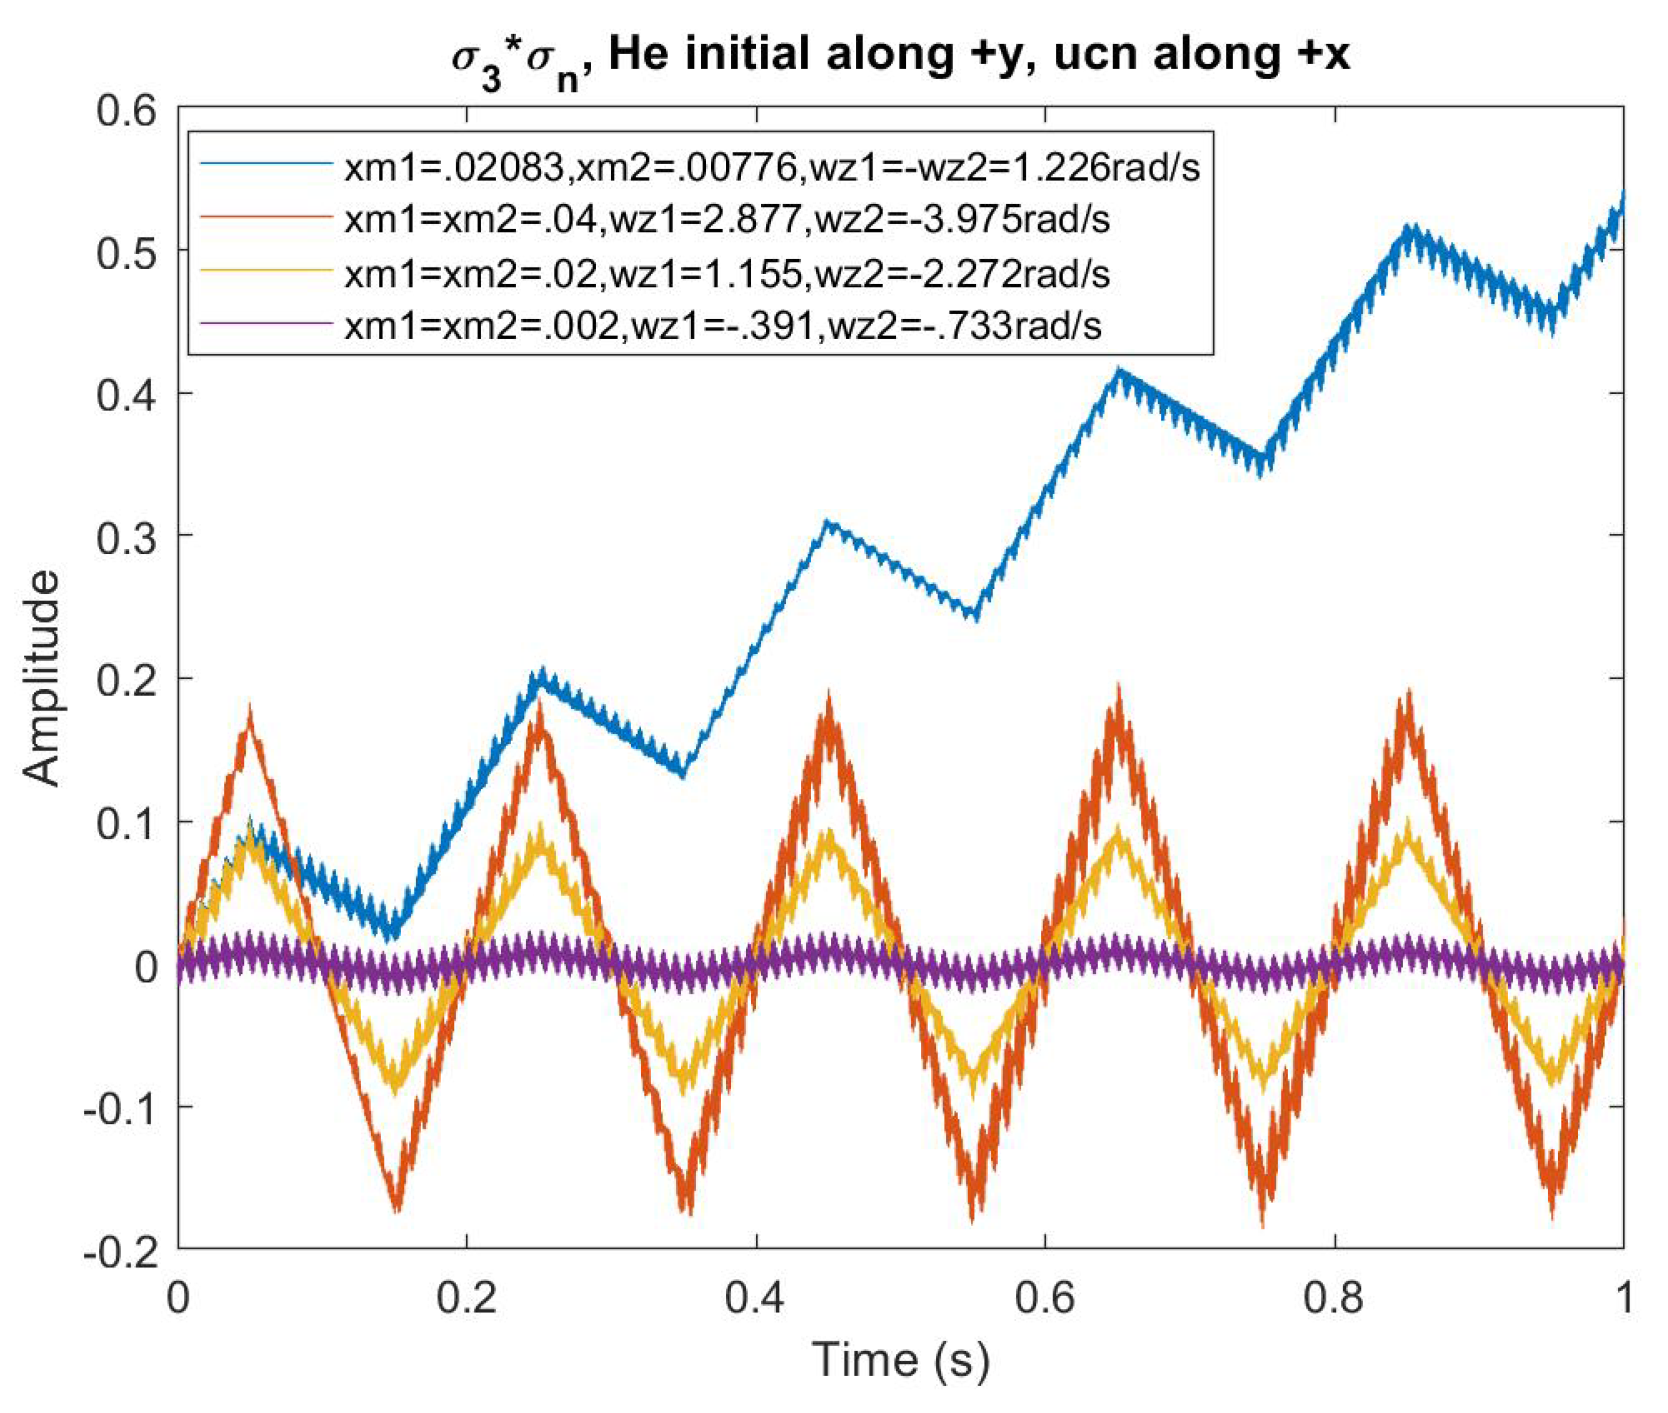
Figure 21.
Solutions for critical dressing parameters for different with the third order corrections as part of the condition. The first line in the legend is just a vertical line for , the solution for critical dressing in the approximation.
Figure 21.
Solutions for critical dressing parameters for different with the third order corrections as part of the condition. The first line in the legend is just a vertical line for , the solution for critical dressing in the approximation.
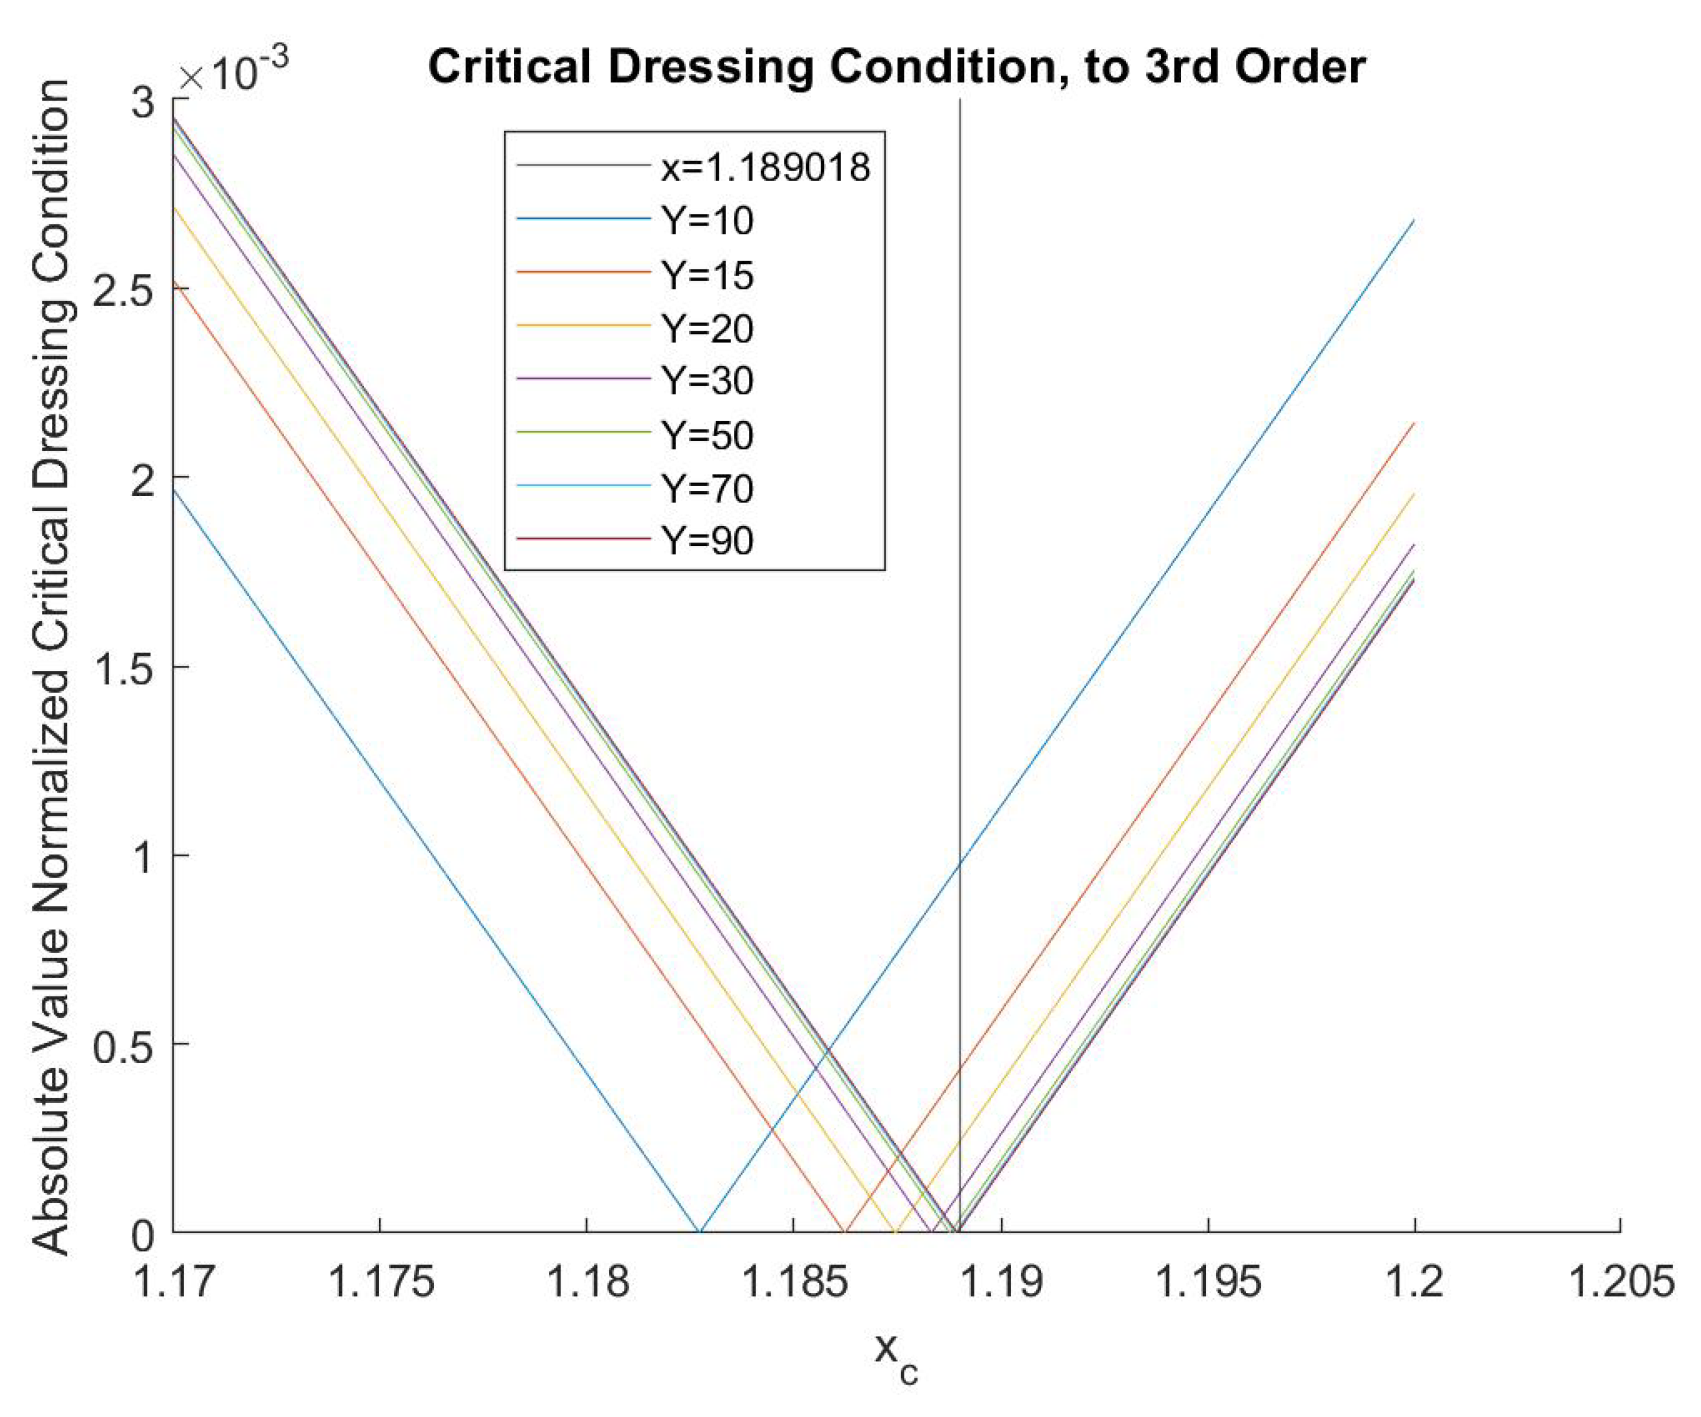
Figure 22.
Comparing the analytical critical dressing parameters from Figure 5.12 to those found using the RK4 simulations.
Figure 22.
Comparing the analytical critical dressing parameters from Figure 5.12 to those found using the RK4 simulations.
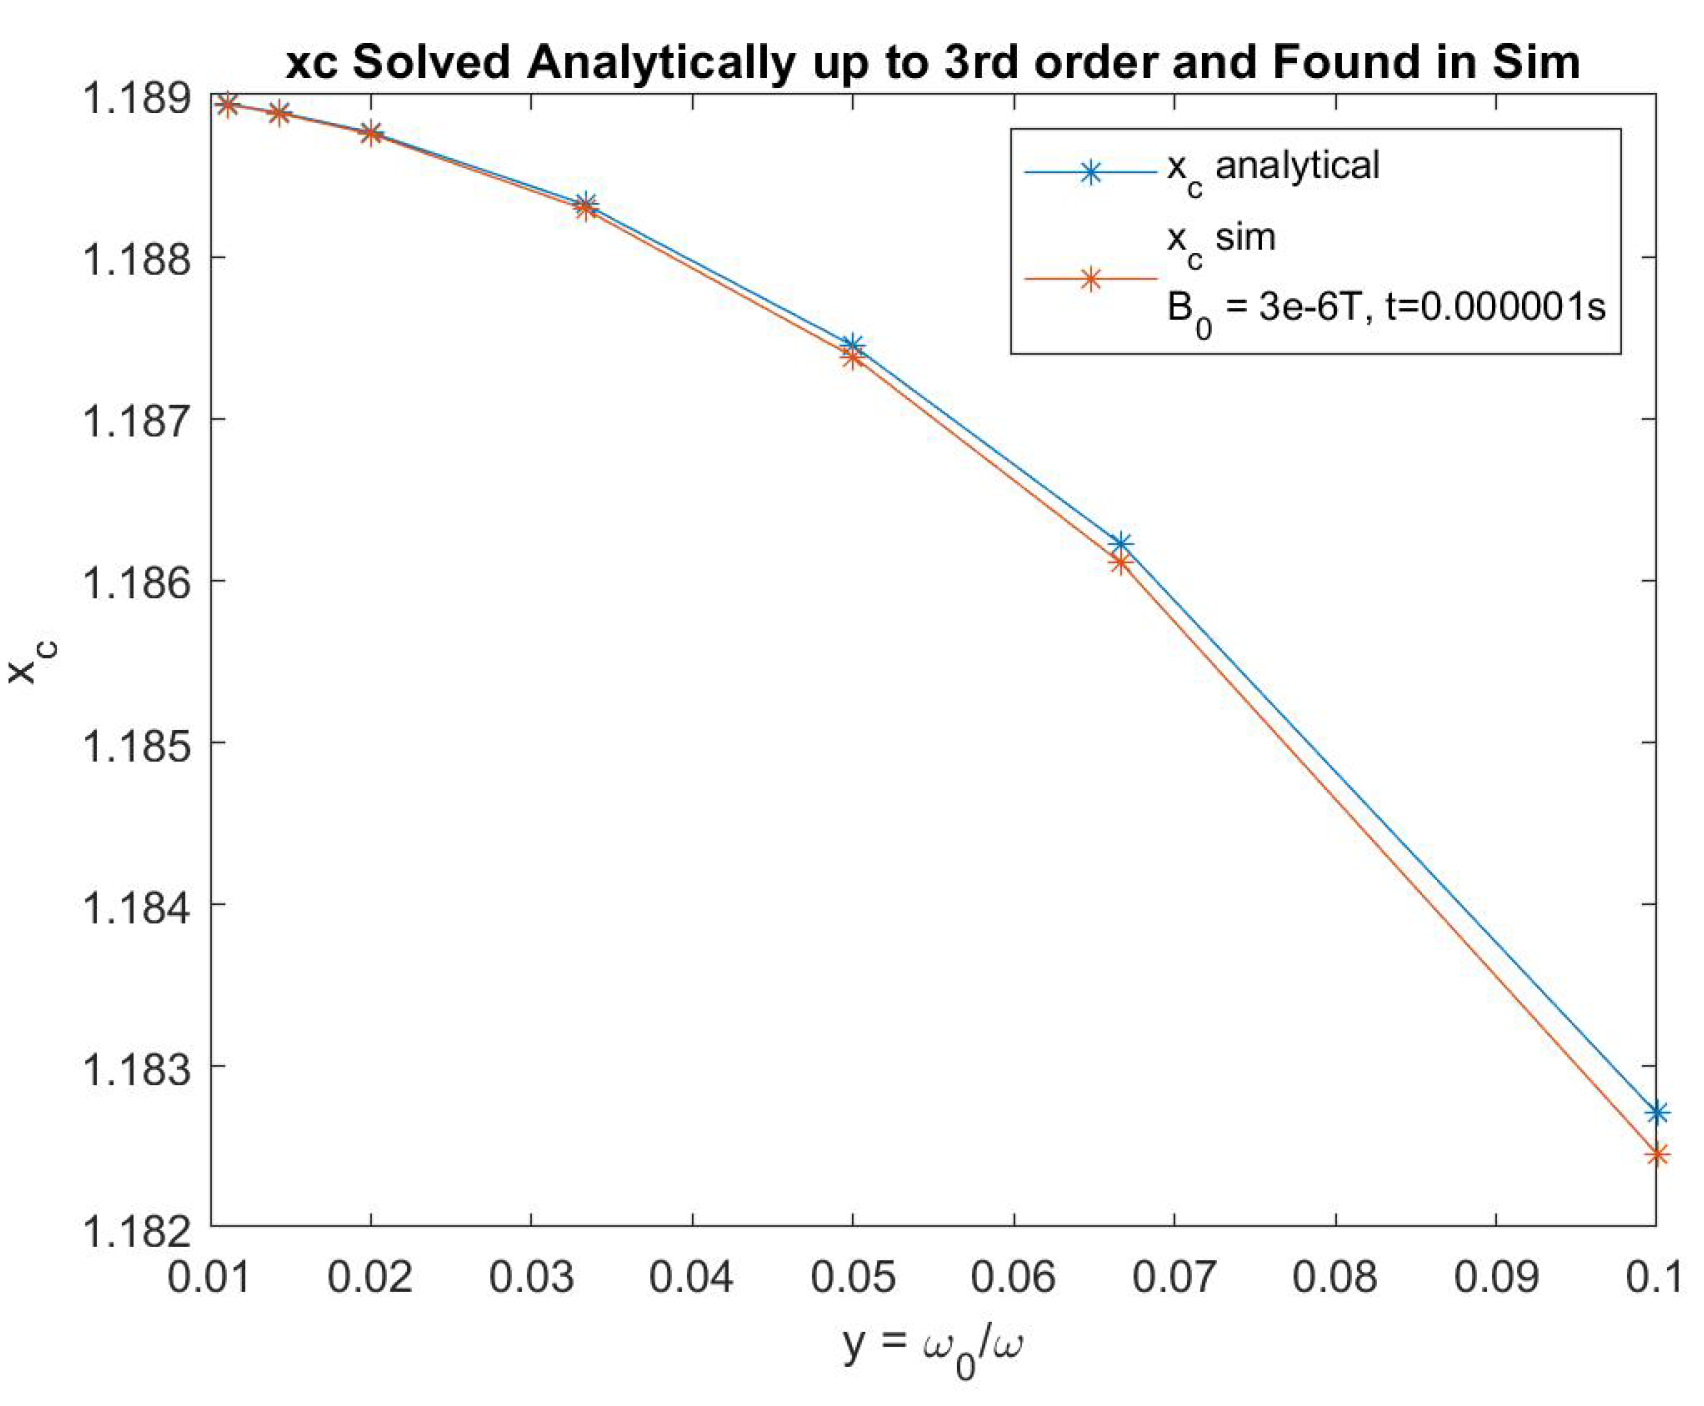
Figure 23.
The percentage difference between points in Figure 5.13 for a given Y.
Figure 23.
The percentage difference between points in Figure 5.13 for a given Y.
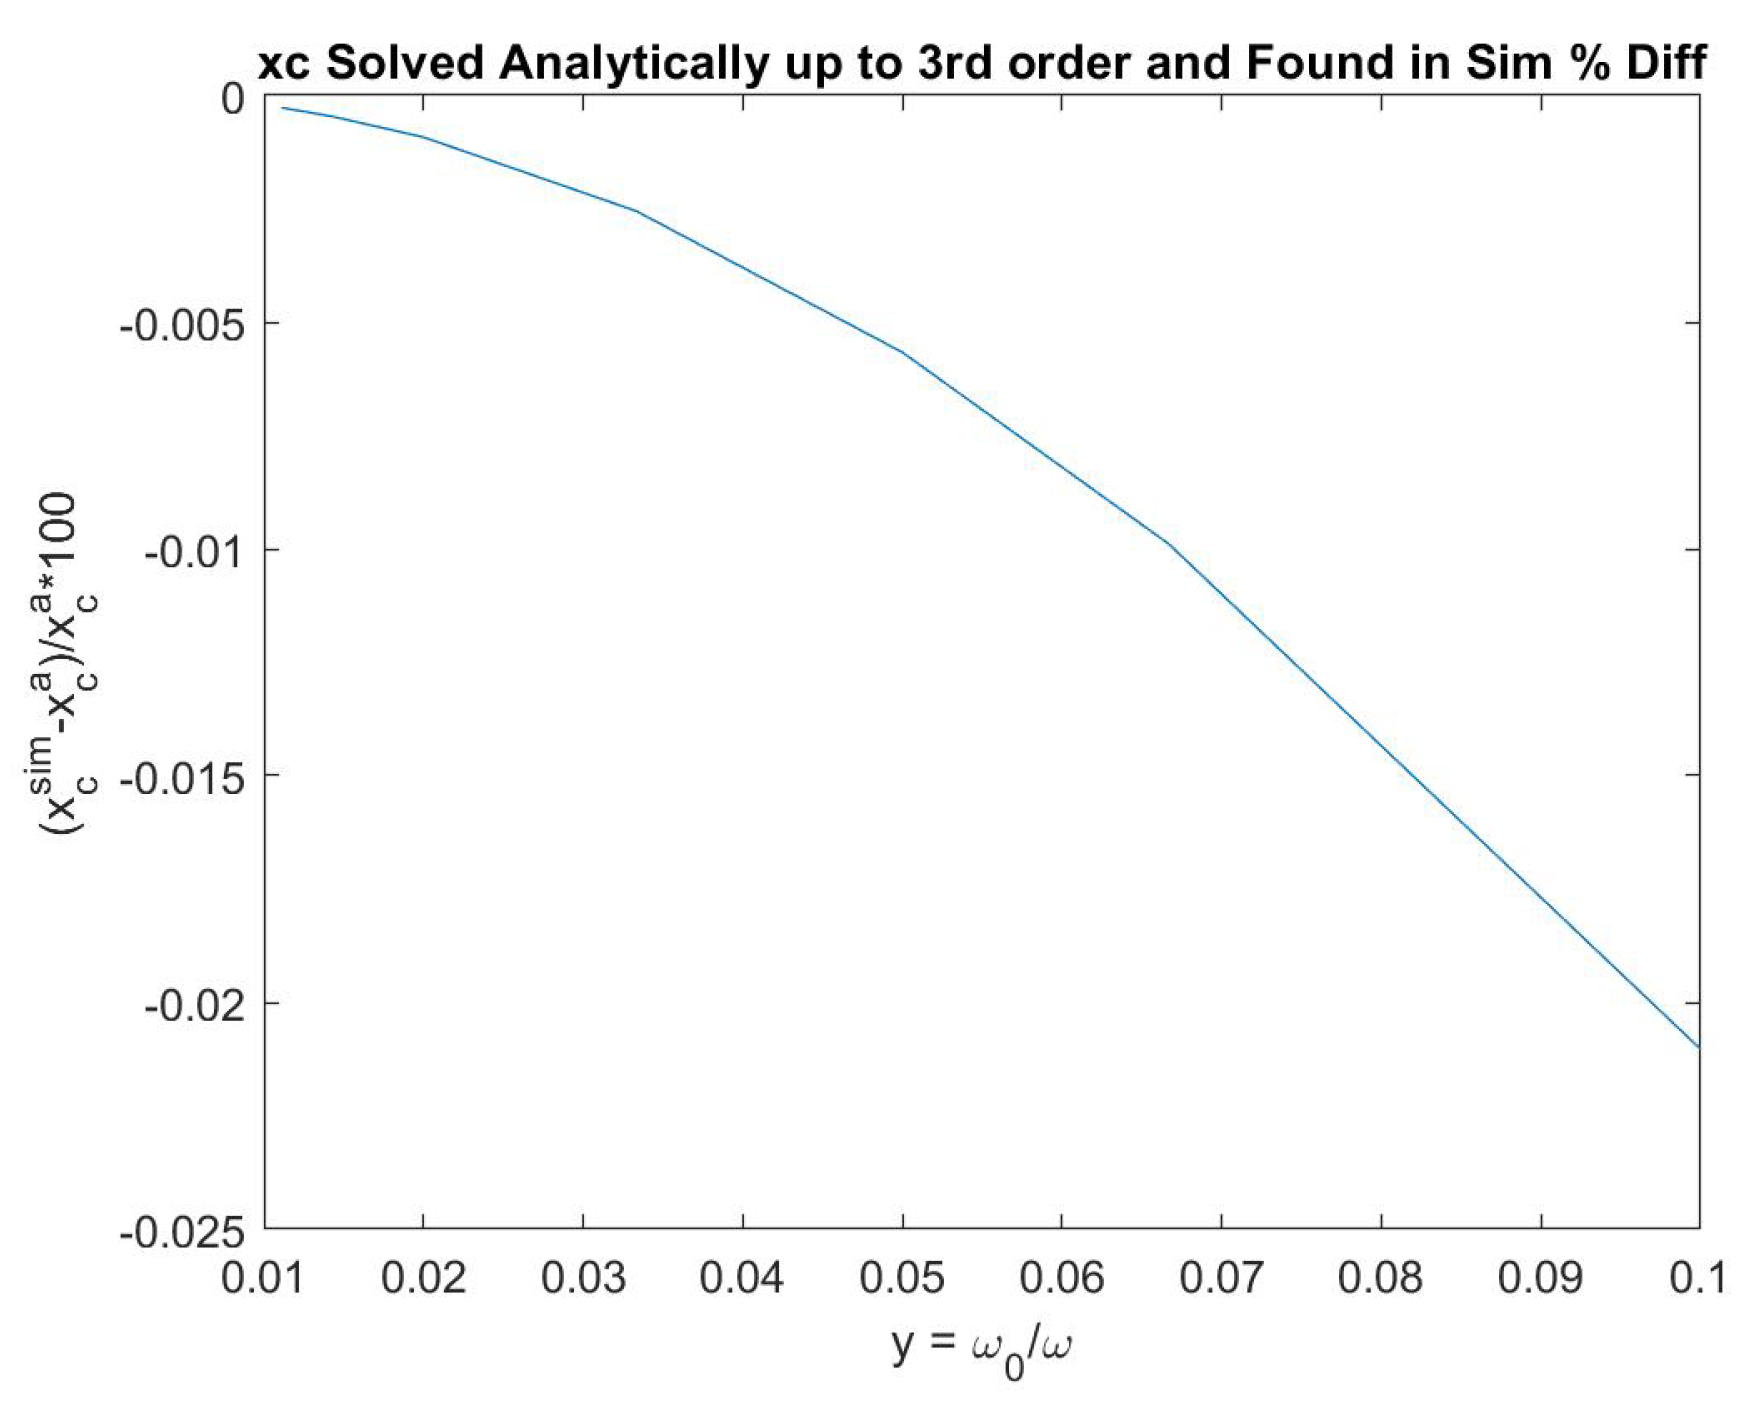
Figure 24.
vs time for modulation parameters and . The scintillation signals are more symmetric than any other modulated plot I have shown.
Figure 24.
vs time for modulation parameters and . The scintillation signals are more symmetric than any other modulated plot I have shown.
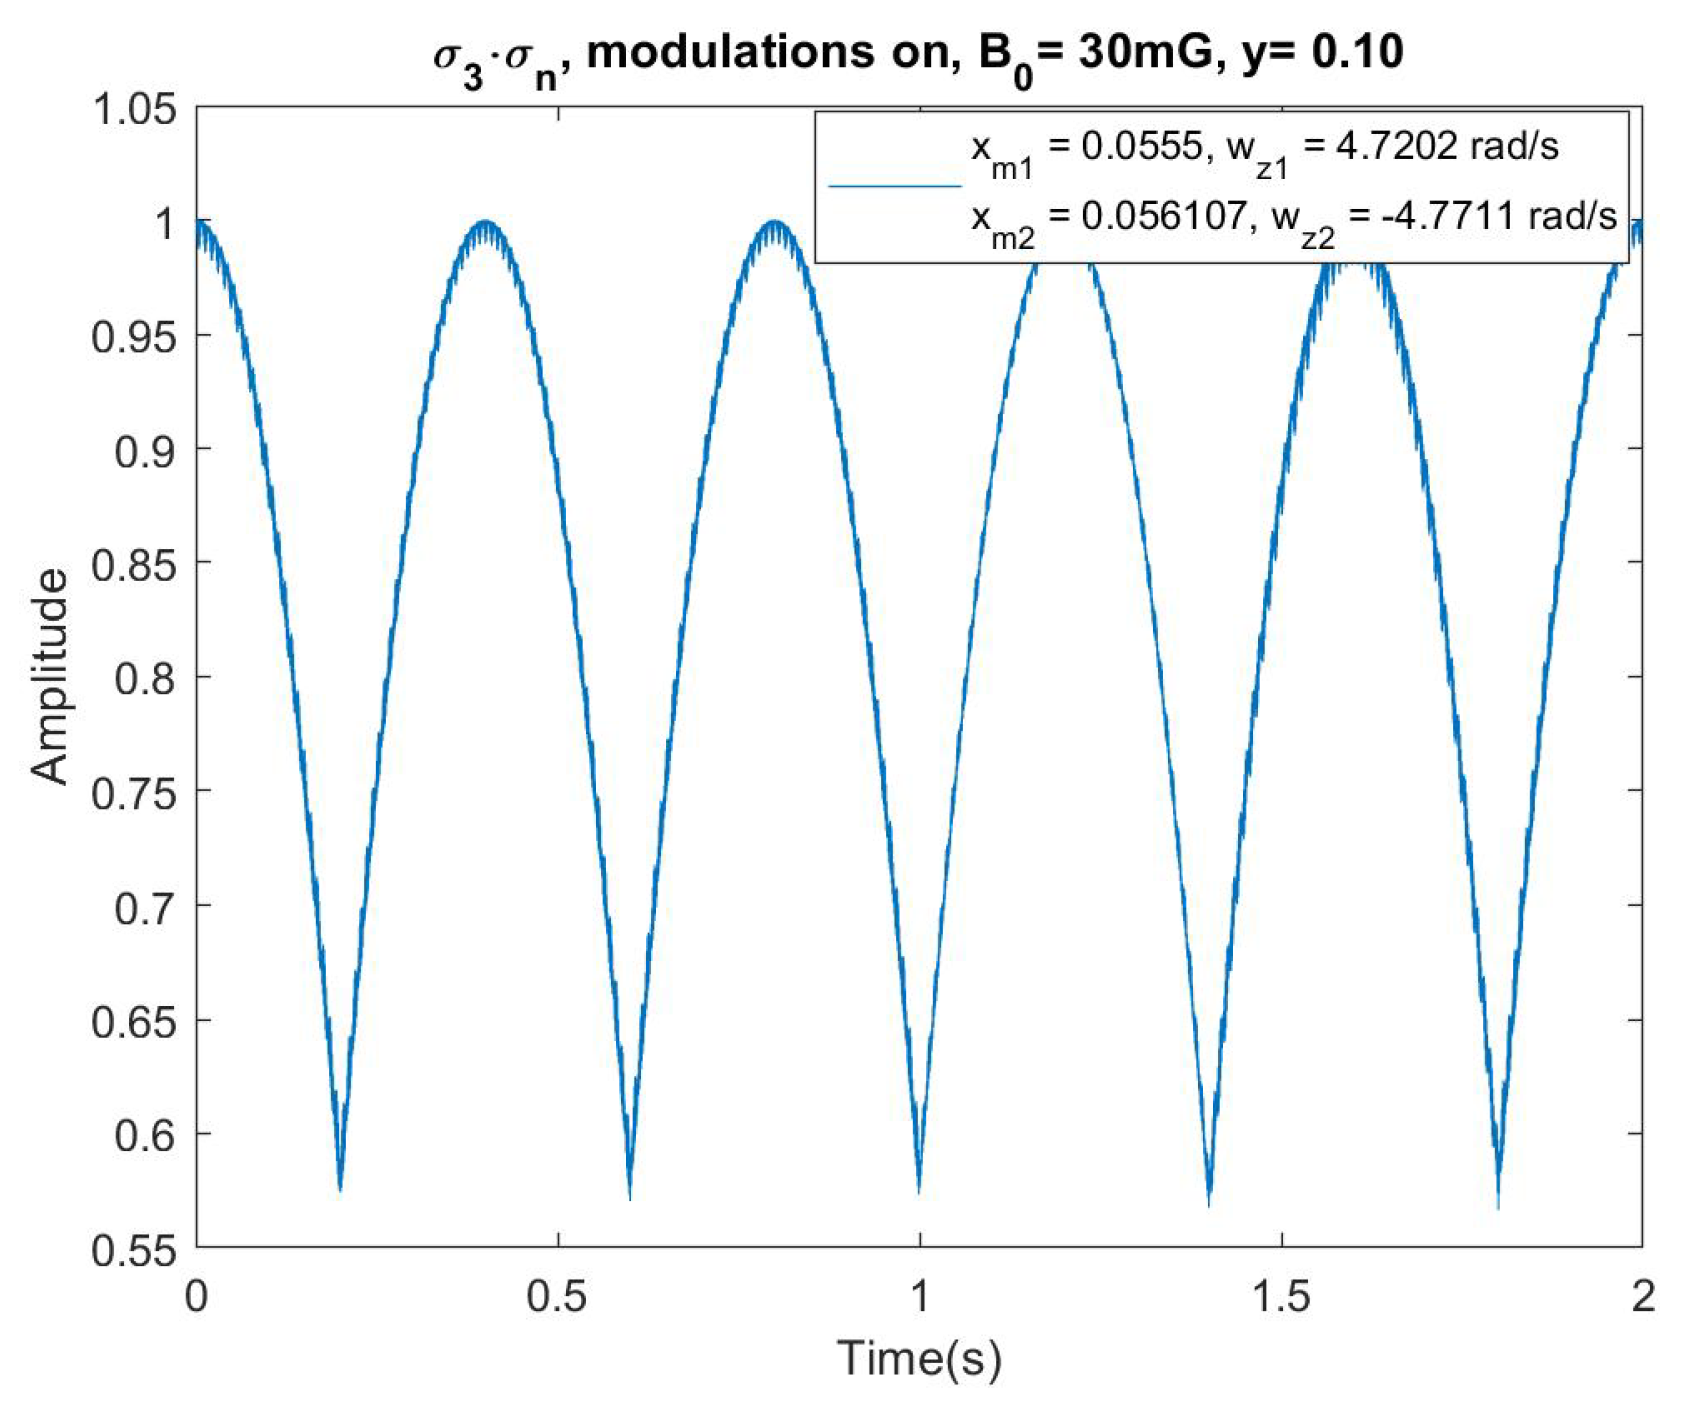
Figure 25.
vs time for no modulation and the pseudomagnetic field off (orange) and on (blue). The magnitude of is about 100 times larger than in the experiment.
Figure 25.
vs time for no modulation and the pseudomagnetic field off (orange) and on (blue). The magnitude of is about 100 times larger than in the experiment.
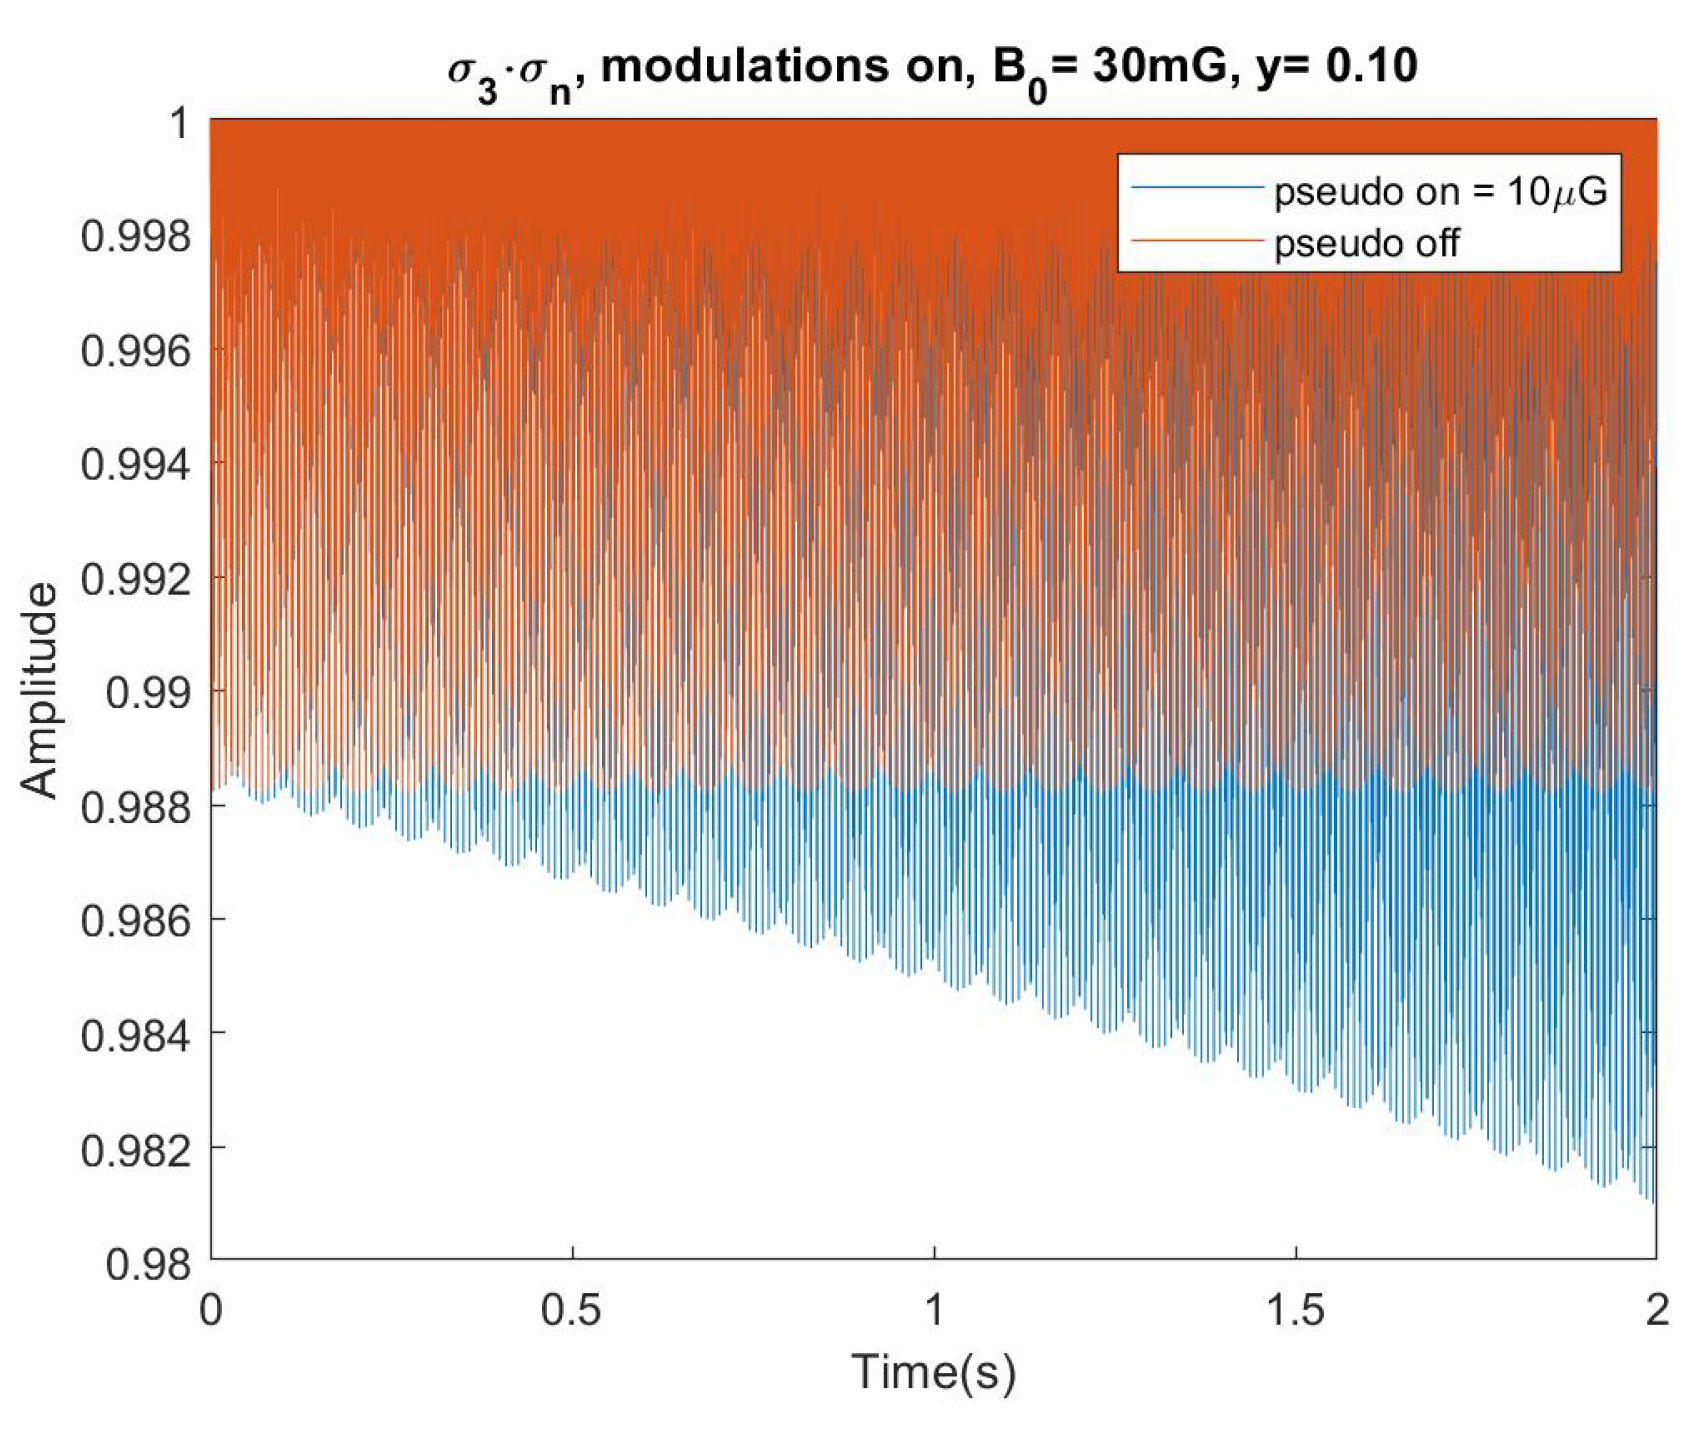
Figure 26.
vs time with modulation and the pseudomagnetic field off (blue) and on (orange). The magnitude of is about 100 times larger than in the experiment.
Figure 26.
vs time with modulation and the pseudomagnetic field off (blue) and on (orange). The magnitude of is about 100 times larger than in the experiment.
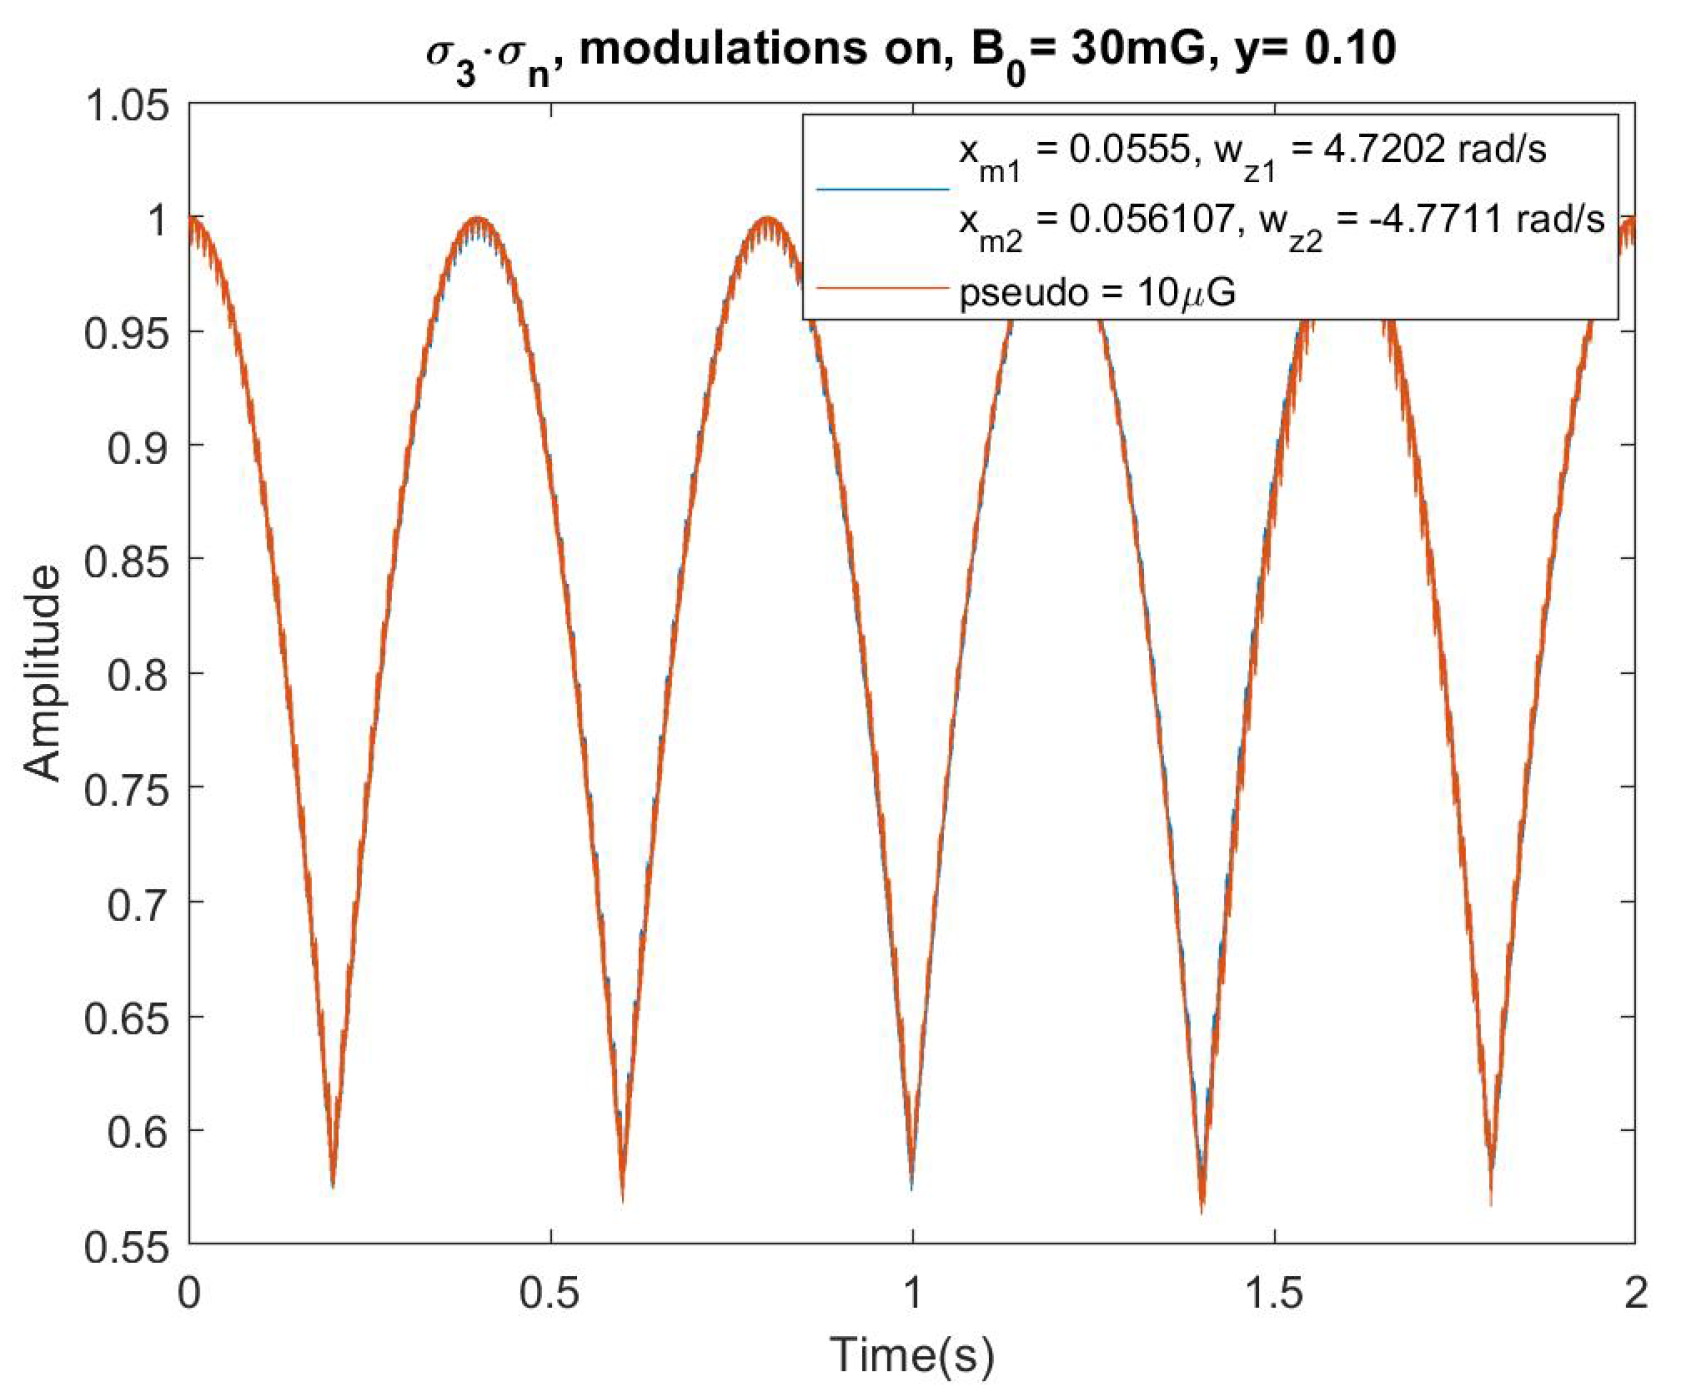
Figure 27.
A zoomed-in view of Figure 26 near 1.0 s.
Figure 27.
A zoomed-in view of Figure 26 near 1.0 s.
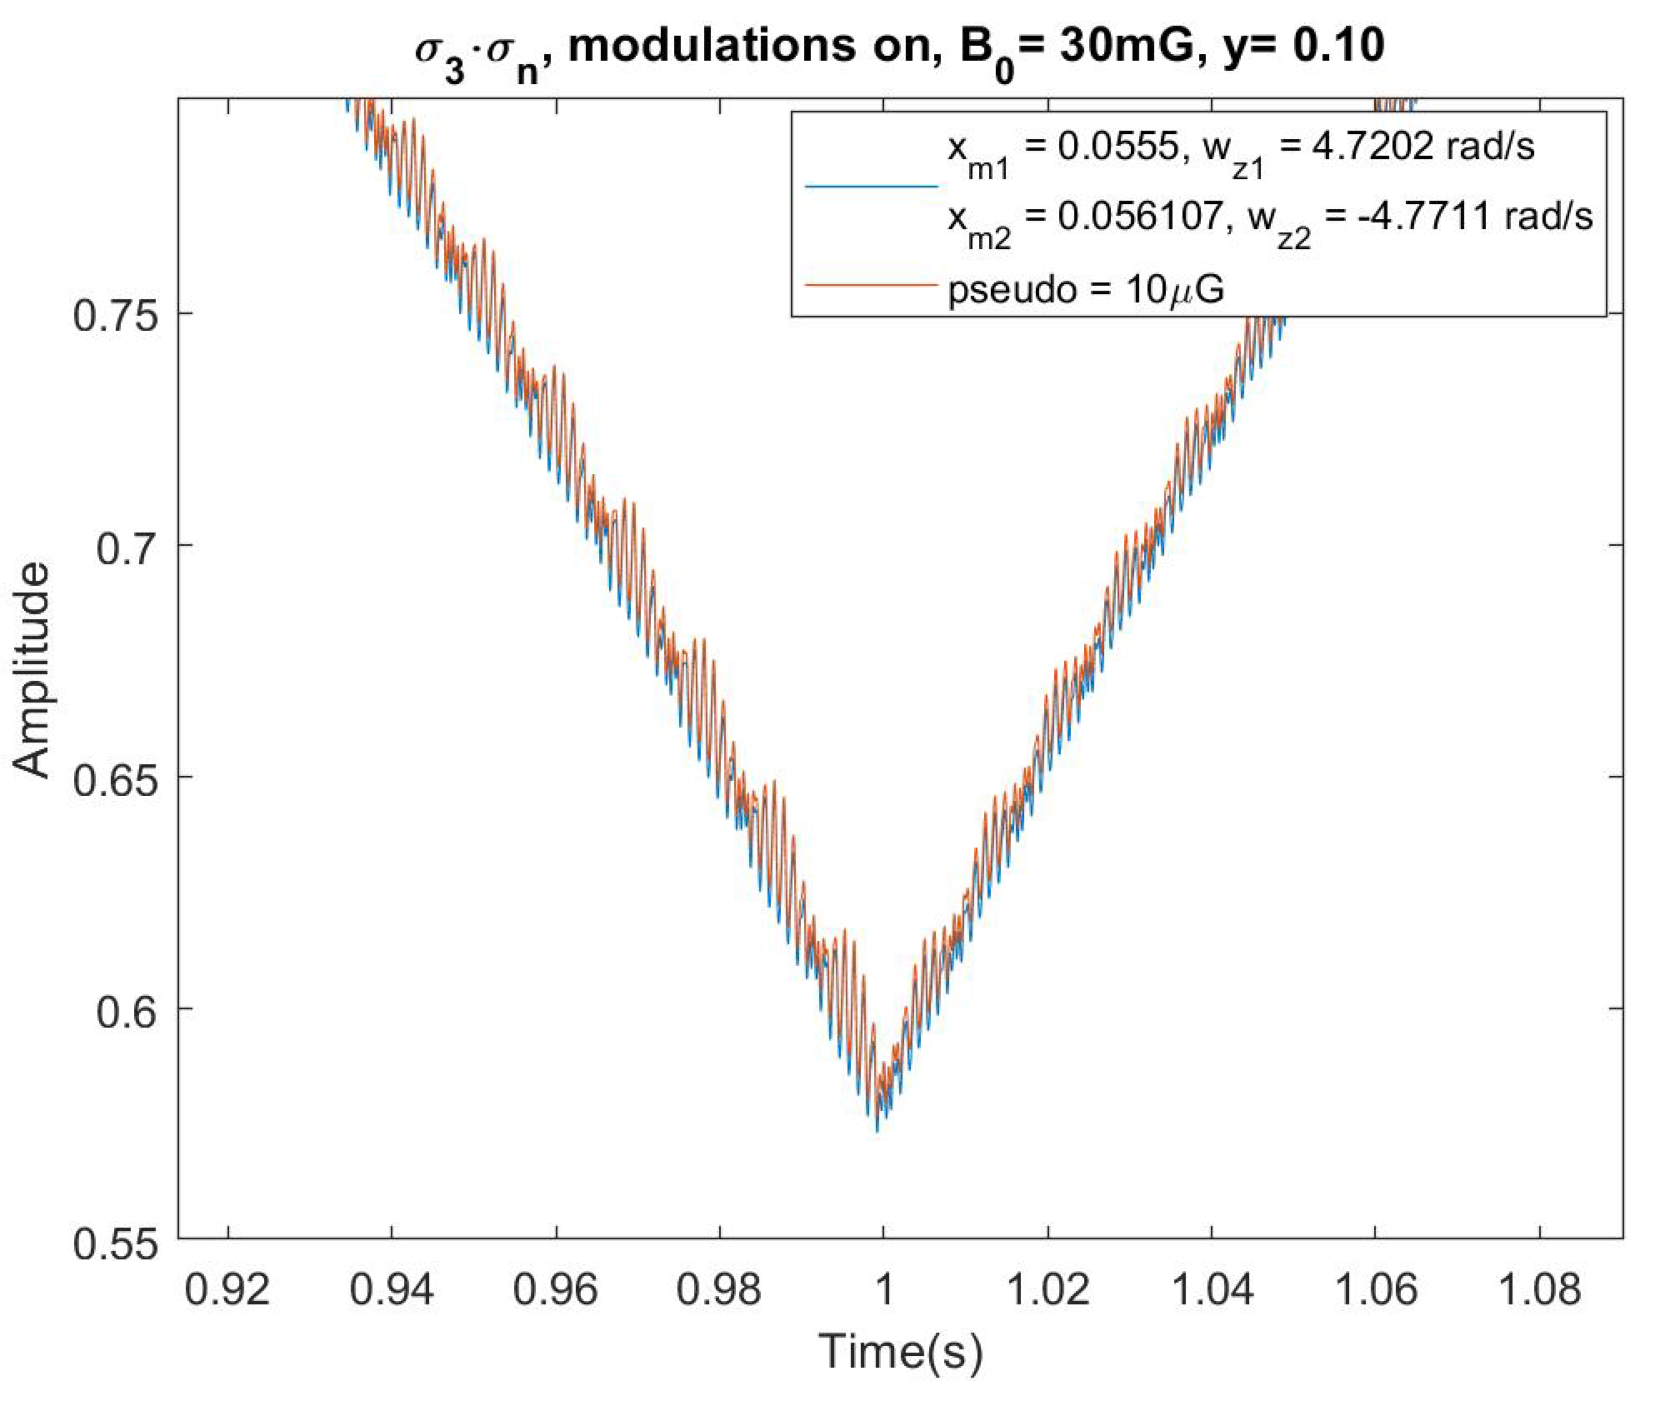
Figure 28.
The FFT of with modulation, zoomed-in on the harmonics.
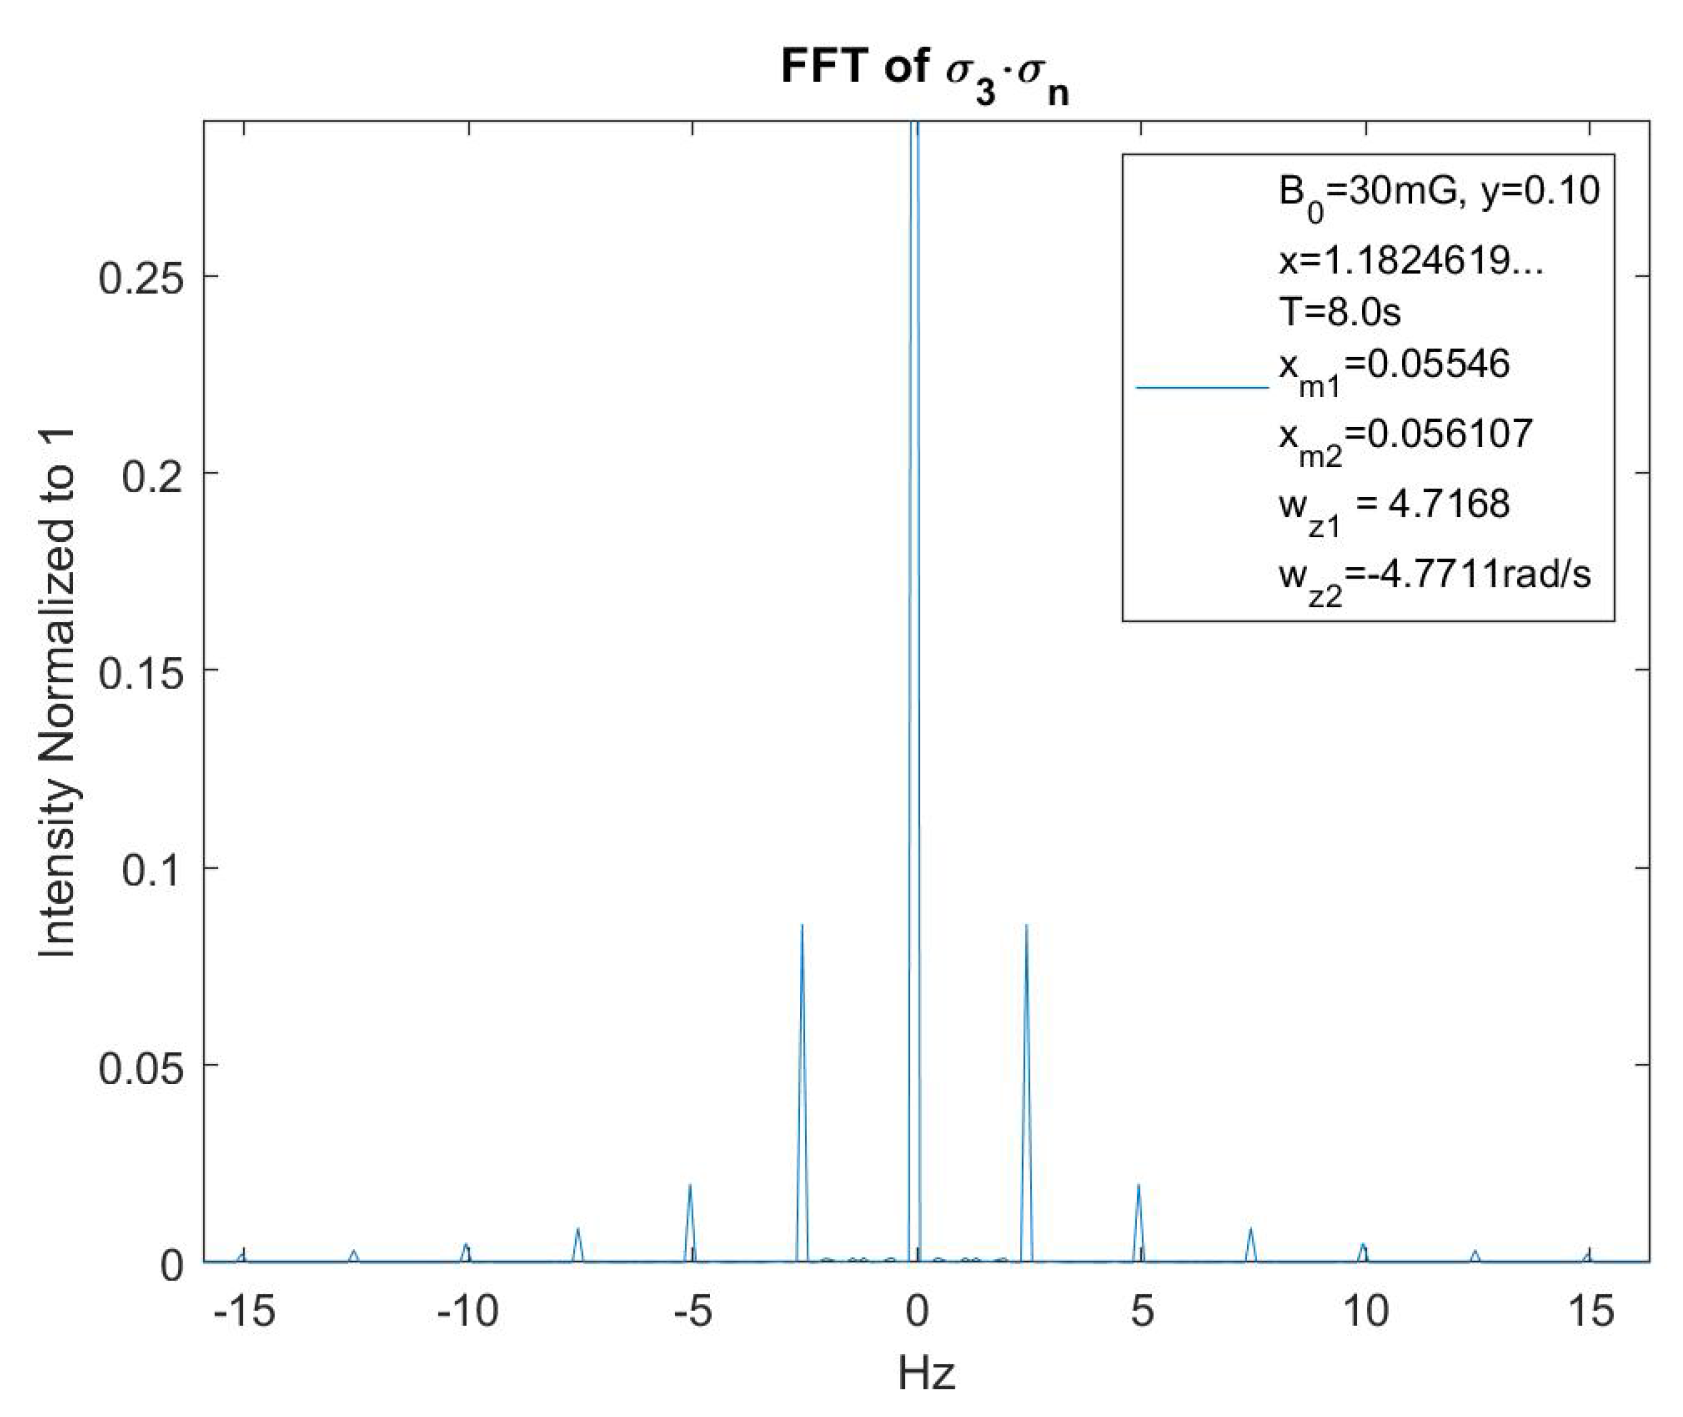
Figure 29.
The first and second harmonics. Their ratios are an indicator of how well modulation is working.
Figure 29.
The first and second harmonics. Their ratios are an indicator of how well modulation is working.
Disclaimer/Publisher’s Note: The statements, opinions and data contained in all publications are solely those of the individual author(s) and contributor(s) and not of MDPI and/or the editor(s). MDPI and/or the editor(s) disclaim responsibility for any injury to people or property resulting from any ideas, methods, instructions or products referred to in the content. |
© 2024 by the authors. Licensee MDPI, Basel, Switzerland. This article is an open access article distributed under the terms and conditions of the Creative Commons Attribution (CC BY) license (http://creativecommons.org/licenses/by/4.0/).
Copyright: This open access article is published under a Creative Commons CC BY 4.0 license, which permit the free download, distribution, and reuse, provided that the author and preprint are cited in any reuse.