
Submitted:
04 September 2024
Posted:
04 September 2024
You are already at the latest version
Abstract
NongXiangXing Baijiu (NBJ) is produced using a solid-state fermentation system, but the impact of stratified fermented grains on fermentation remains unclear. Therefore, in a typical distillery plant, we evaluated the physical and chemical composition, volatile compound profile, and microbial community of fermented grains in NBJ both above (FG-A) and below (FG-B) the Huangshui line. Significant differences in fermentation parameters between FG-A and FG-B were observed after 30 days of fermentation (P < 0.05). Additionally, the partial least squares projection to latent structure discriminant analysis (PLS-DA) revealed distinct differences in volatile compounds between FG-B and FG-A, identifying 26 discriminant markers. The diversity of short-chain fatty acids (SCFAs) and their esters was higher in FG-B compared to FG-A. Furthermore, microbial diversity and abundance differed significantly between the two layers of fermented grains (P < 0.05). Correlation and pathway enrichment analyses indicated that the higher SCFA content in FG-B could be attributed to the greater abundance of acid-producing microorganisms compared to FG-A. This study highlights the differences between the two layers of fermented grains in NBJ fermentation, offering new insights into solid-state fermentation and expanding the current understanding of the traditional NBJ fermentation process.
Keywords:
Baijiu
; solid-state fermentation
; microbial diversity
; volatile compounds
1. Introduction
Baijiu is a traditional fermented liquor deeply embedded in Chinese culture, boasting a rich history that spans centuries. It is considered one of the world’s oldest alcoholic beverages and is typically produced through solid-state fermentation, a process similar to that used in the production of brandy, whiskey, vodka, gin, and rum (Liu & Sun, 2018; X. Song et al., 2020). There are currently twelve recognized types of Baijiu, each distinguished by its unique aroma characteristics and produced in various provinces across China [1]. Among these types, NongXiangXing Baijiu (NBJ) is particularly significant, representing approximately 50% of total Baijiu production in 2021. Since 2013, the annual yield of NBJ has surpassed 10 million kiloliters, with sales revenue reaching billions of dollars [2]. The most renowned production sites for NBJ in China include Yibin, Luzhou, and Suqian, among others.
NBJ is typically made from sorghum alone or a mixture of grains, including corn, rice, wheat, sticky rice, and sorghum. Ethyl caproate, a key aroma compound in NBJ, imparts fruity, floral, and sweet notes [3]. Other important short-chain fatty acid esters (SCFAEs) such as ethyl acetate, ethyl butyrate, and ethyl lactate are also crucial for the aroma of NBJ [4]. The fermentation process begins with a starter culture called Nongxiangxing Daqu, which is mixed with grains to form fermented grains (FG) [5,6]. The FG mixture is then placed in fermentation vessels within an underground cuboid fermentation pit mud (FPM) that measures 2.5–2.8 meters in height, 2.8–3.2 meters in length, and 2.3–2.6 meters in width. After sealing the pit with mud, anaerobic fermentation is carried out for approximately 60-70 days at temperatures ranging from 20 to 34°C [7]. Baijiu is distilled from the FG, and while different manufacturers use similar processes (Figure 1A), there are variations in the final product.
During fermentation, microorganisms consume the nutrients in FG, producing ethanol and volatile compounds [8]. At the start of fermentation, FG contains a substantial amount of starch (over 20%). Starch has strong water absorption properties, which decrease as the starch is consumed, allowing water to seep to the bottom of the pit and form Huangshui[9]. Concurrently, other substances such as reducing sugars and lactic acid also migrate to the pit’s bottom. These changes lead to significant differences between the FG above the Huangshui line (FG-A) and below the Huangshui line (FG-B). Additionally, based on production experience, Baijiu derived from FG-B is often considered higher quality than that from FG-A. This is likely due to the differences in fermentation conditions between FG-A and FG-B, although this has not been extensively documented in previous reports.
Fermentation is a crucial step in NBJ production, involving the active participation of microorganisms from Daqu, pit mud, and the surrounding environment. These microorganisms contribute to the development of NBJ’s unique flavor [10,11,12]. Research on FG derived from various raw materials has shown that differences in microbial community succession can lead to variations in NBJ flavor during processing. Studies on microbial community succession in FG and the Huangshui line indicate that microorganisms from pit mud play a significant role in forming organic acids, suggesting that these microorganisms may contribute to the differences in fermentation conditions between FG-B and FG-A [13]. These findings collectively highlight that FG in NBJ fermentation varies over time and across different layers. However, there has been no research specifically examining the dynamic changes between FG-A and FG-B during NBJ fermentation. Investigating the differences in the quality of Baijiu produced from FG-A and FG-B, along with their fermentation parameters, microbial structure, and aroma components, could provide valuable insights into these variations.
In the present study, a specialized in situ sampler was employed to collect FG samples throughout the NBJ fermentation process. The microbial community structure of these FG samples was analyzed using high-throughput sequencing on an Illumina platform. Moreover, volatile compounds in the samples were detected using headspace solid-phase micro-extraction combined with gas chromatography-mass spectrometry (HS-SPME-GC-MS). Fermentation parameters-including temperature, acidity, starch content, alcohol concentration, and reducing sugars-were measured and analyzed alongside the microbial sequencing data to assess microbial succession in FG during fermentation. The data obtained from this study aim to improve the understanding of the differences between FG-A and FG-B in NBJ fermentation.
2. Materials and Methods
2.1. Experimental Design and Sampling Method
The experiment was conducted at a renowned Nongxiangxing distillery in Yibin City, Sichuan Province, China. To investigate the differences between FG-A and FG-B during the fermentation process, three rectangular fermentation pits were used. Each pit was filled with the same grain materials (sorghum, corn, wheat, rice, and glutinous rice), Nongxiangxing Daqu, and production mix (Figure 1B). The fermentation period was set to 70 days, which is within the normal range of 60-70 days. FG-A samples were collected from one pit at 1, 8, 16, 23, 30, 36, 41, 47, 53, 59, 65, and 70 days after the start of fermentation. FG-B samples were collected at 16, 23, 30, 36, 41, 47, 53, 59, 65, and 70 days, according to the timing of Huangshui formation (Figure1B). All samples from each pit were mixed before analysis. In total, 36 FG-A samples and 30 FG-B samples were collected. Note that sample collection was challenging and time-consuming in the production workshop.
2.2. Fermentation Parameters Analysis
Six standard fermentation parameters were analyzed: temperature, starch content, reducing sugar content, acidity, alcohol content, and the height of Huangshui. Acidity was measured by titration with 0.1 mol/L NaOH, using phenolphthalein as an indicator with a pH endpoint of 8.2. Total reducing sugar and starch content were determined using the methods described in previous studies [14,15]. Alcohol content was measured with an alcoholmeter following distillation. Temperature was monitored with a temperature sensor (FJT-P3-L, Wuhan Fenjin, China), which was fixed in position within the pit. The height of Huangshui was measured using custom-made testing equipment. The data for FG-A and FG-B were analyzed and compared using principal component analysis (PCA) with SIMCA 13.0 software.
2.3. Volatile Compounds Analysis
Volatile compounds in FG-A and FG-B were extracted using headspace solid-phase microextraction (HS-SPME) and analyzed by gas chromatography-mass spectrometry (GC-MS) with an Agilent 7890 GC and 7100C Mass spectrometer (Agilent Technologies, CA). The extraction procedure followed the methods outlined by previous reports [6,16]. For each sample, 50 μL of n-butyl acetate was added as an internal standard. SPME was performed using a fiber coated with 50/30 μm divinylbenzene/carboxen on polydimethylsiloxane (Supelco, Bellefonte, PA, USA), based on the methods described by Gao et al. (2014) and Zheng et al. (2020). The GC conditions were as follows: helium was used as the carrier gas at a flow rate of 1 mL/min, with separations conducted using an Agilent DB-Wax column (60 m × 0.25 mm × 0.25 μm). Detection parameters were set according to Yan et al. (2019). All samples were analyzed in triplicate. To identify and categorize the volatile compounds, mass spectra were compared with the Agilent NIST 17a mass spectral library. Lactic acid and acetic acid were quantified using liquid chromatography (LC) with a 1260 Infinity system (Agilent Technologies, CA). Solvent A comprised 20 mmol/L ammonium acetate and 20 mmol/L acetic acid, while solvent B was 100% acetonitrile. The LC gradient method followed Song et al. (2020). The concentrations of individual volatile compounds in FG-A and FG-B were reported in mg/kg. Peaks of ethanol were excluded, and compounds with concentrations below 0.1 mg/L or with similarity matches below 70% were filtered out. Data were analyzed using partial least squares projection to latent structure discriminant analysis (PLS-DA) with SIMCA 13.0 software. A heatmap was generated using RStudio software to illustrate changes in volatile compound content.
2.4. Microbial Community Structure Analysis
FG samples were pretreated following a previously established method. Total DNA was extracted using the CTAB extraction method according to the manufacturer’s instructions (Xiao et al., 2017). The extracted DNA was analyzed by electrophoresis on a 0.6% (w/v) agarose gel and by spectrophotometry (optical density ratio at 260 nm/280 nm). All DNA samples were stored at -80 °C. For bacterial analysis, the V3/V4 region of the 16S rRNA gene was amplified using PCR with forward primer 338F (5'-ACTCCTACGGGAGGCAGCA-3') and reverse primer 806R (5'-GGACTACHVGGGTWTCTAAT-3'). For fungal analysis, the internal transcribed spacer (ITS) region was amplified using primers ITS1F (5'-CTTGGTCATTTAGAGGAAGTAA-3') and ITS2R (5'-GCTGCGTTCTTCATCGATGC-3'). PCR was conducted in triplicate in a 20 μL reaction mixture using a MyCycler Thermal Cycler (Bio-Rad, USA), with amplification conditions as described by Wang et al. (G. Wang, Li, Zhou, Feng, & Zhang, 2021). The amplified gene sequences were then sequenced using the Illumina MiSeq PE300 and NovaSeq PE250 platforms (Illumina, San Diego, USA) at Meiji Bio-Pharm Technology Co. Ltd. (Shanghai, China). High-throughput sequencing analysis methods were detailed in our previous work [7]. The raw sequence reads have been deposited in the NCBI Sequence Read Archive (SRA) under accession numbers PRJNA720603 and PRJNA720773.
2.5. Biomass Analysis
Real-time PCR technology was used to analyze microbial biomass in FG-A and FG-B. A standard curve was constructed for the same primers used for bacterial (338F/806R) and fungal (ITS1F/ITS2R) sequences. The absolute copy numbers of the 16S rRNA and ITS genes in FG samples (with DNA from each batch of parallel samples pooled) were quantified using absolute qPCR on a PicoReal real-time PCR system (Applied Biosystems, ABI7300, USA). The qPCR protocol followed the method outlined by Zhang et al. (H. Zhang et al., 2020). Each sample was tested in triplicate. Data visualization was performed using Origin 8, and significant differences between groups were analyzed with SPSS 24.0 software (IBM, USA).
2.6. Statistical Analysis
Changes in fermentation parameters were visualized using Origin 2018. Redundancy Analysis (RDA) was performed with Canoco 5 (http://www.canoco.com) to analyze relationships between fermentation parameters, microbial communities, and flavors. Correlation analysis was conducted using RStudio software. A network was created with Cytoscape to categorize and visualize the correlations between microbes and volatile compounds [17]. The function of the 16S rRNA sequences was predicted using PICRUSt2 [18].
3. Results
3.1. Changes in Fermentation Kinetic Parameters during NBJ Fermentation
Fermentation parameters are crucial for monitoring the NBJ fermentation process. In this study, six key parameters were measured: starch content, reducing sugar content, ethanol concentration, total acidity, temperature, and the height of the Huangshui line. Principal Component Analysis (PCA) was used to analyze the data, with the PCA score plots shown in Figure 2A. The first principal component (PC1) explained 66.1% of the variance, while the second principal component (PC2) accounted for 28.2% of the variance, facilitating effective data interpretation.
Initially, on day 23 before fermentation, FG-A and FG-B samples did not exhibit clear separation in the PCA score plots. However, differences between samples became apparent on day 23 after fermentation. PCA results indicated significant differences in fermentation parameters between FG-A and FG-B in the later stages of fermentation. Although FG-A and FG-B samples showed similar trends throughout fermentation, their parameter values differed (Figure 2C).
In the early stages of fermentation, parameters changed rapidly: starch and reducing sugar contents decreased, while acidity, ethanol content, temperature, and the height of the Huangshui line increased. In the later stages, changes in parameters were less pronounced, with temperature showing a substantial decrease. The height of the Huangshui line and the contents of reducing sugar and starch remained relatively stable, while acidity and ethanol content in FG-A gradually decreased. Significant positive correlations were found between the height of the Huangshui line, ethanol, acidity, and starch and reducing sugar contents (P < 0.05) (Figure 2B). Starch consumption and the formation of Huangshui are gradual processes. Huangshui did not form during the initial 10-15 days of fermentation. As fermentation progressed, the height of Huangshui increased, reaching approximately 1.1 meters after 30 days.
3.2. Changes in Volatile Compounds in FG during NBJ Fermentation
A total of 153 volatile compounds were detected in FG during the fermentation of NBJ, including 45 esters, 24 acids, 26 alcohols, 12 ketones, 10 aldehydes, 10 alkenes, 7 furans, and 19 other compounds. Specifically, 133 volatile compounds were identified in FG-A, while 136 were found in FG-B, with 116 compounds present in both sample groups. Partial Least Squares Discriminant Analysis (PLS-DA) was used to analyze the volatile compound data, and the PLS-DA score plots are shown in Figure 3A. R2X, R2Y, and Q2 in the PLS-DA model were 0.819, 0.955, and 0.828, respectively. FG-A and FG-B samples were clearly separated in the PLS-DA score plots. Variable Importance in Projection (VIP) scores greater than 1 highlighted differences in volatile compounds between FG-A and FG-B. Twenty-six volatile compounds were identified as potential markers of aroma quality (Figure 3B). These included: 10 esters (ethyl palmitic, ethyl linoleate, ethyl caproic, ethyl acetate, ethyl lactate, ethyl octanoic, ethyl heptanoate, ethyl valerate, isoamyl acetate, and ethyl butyrate), 7 acids (lactic acid, caproic acid, heptanoic acid, octanoic acid, pentanoic acid, acetic acid, and butanoic acid), 7 alcohols (1-propanol, butanediol, phenethyl alcohol, 1-propanol, butyl alcohol, hexyl alcohol, and 2-furanmethanol), and 2 other volatile compounds (3-methylpyrazine and 3-methylbutane).
To normalize the data, a logarithmic scale (log2(x)) and unit variance scaling were applied to all volatile compound marker values. A heatmap and hierarchical cluster analysis (HCA) were then used to visualize the content of these volatile compounds in the samples (Figure 3C). In the early stages of fermentation, the volatile compound markers in FG-A and FG-B were similar. However, in the later stages, significant differences emerged. Specifically, the contents of certain volatile compounds in FG-B were significantly higher than those in FG-A (P < 0.05). This included all esters and acids, except for ethyl palmitate and ethyl linoleate, as well as short-chain fatty acids (SCFAs) and their esters, such as butyric acid and caproic acid, which warrant further investigation. Conversely, FG-A had significantly higher levels of other volatile compound markers compared to FG-B (P < 0.05), including six alcohols, several furans, and pyrazines. Thus, the differences in volatile compounds between FG-A and FG-B were more pronounced in the later stages of fermentation, with SCFAs and their esters being particularly important markers of these differences.
3.3. Microbial Community Succession during NBJ Fermentation
High-throughput sequencing was used to analyze the microbial community structures in FG samples. After quality control, a total of 1,506,184 high-quality reads were obtained from ITS sequencing, while 1,344,819 high-quality reads were acquired from sequencing the V3-V4 region of the 16S rRNA genes (using the primer pair 338F-806R) from 36 FG-A samples and 30 FG-B samples. For fungal sequences, the average number of reads per sample was 68,463, ranging from 51,224 to 74,917. In contrast, bacterial sequences yielded an average of 61,128 reads per sample, with a range of 42,001 to 74,317 reads. Considering OTUs with more than 5 sequences as valid, a total of 885 OTUs were identified in the ITS sequences, representing 271 genera and 8 phyla. In the 16S rRNA sequences, 3,432 OTUs were identified, corresponding to 1,018 genera and 40 phyla.
Based on the Shannon index, the fungal community diversity was significantly higher in FG-B samples compared to FG-A samples (P < 0.01). Conversely, bacterial community diversity was significantly higher in FG-A samples compared to FG-B samples (P < 0.05) (Figure 4B). Regarding biomass during NBJ fermentation, bacteria had a higher biomass than fungi. Both bacterial and fungal biomasses showed similar trends between FG-A and FG-B: they increased initially, then decreased, and finally stabilized after 40 days of fermentation. Specifically, bacterial biomass in FG-B was significantly higher than that in FG-A (P < 0.05). However, no significant differences in fungal biomass were observed between the samples (Figure 4B).
Subsequently, the microbial community structure of the two sample groups was analyzed to understand the differences in microbial succession patterns during NBJ fermentation. A total of 3 fungal phyla and 282 genera were identified. Among these, 266 genera were found in FG-B samples, while 169 genera were found in FG-A samples. The number of fungal genera in FG-B was significantly higher than in FG-A (P < 0.01) (Figure 5A). Bar plots illustrated changes in the dominant phyla and genera, showing the relative abundance of microorganisms during fermentation (Figure 4C and 4D). Ascomycota and Basidiomycota were the dominant phyla, with their relative abundances showing similar trends in FG-A and FG-B samples. Specifically, the relative abundance of Ascomycota gradually decreased, while the relative abundance of Basidiomycota gradually increased throughout the fermentation process.
The top 20 genera (relative abundance > 2%) were identified. In FG-B, Dipodascus was the most abundant genus, followed by Kazachstania. In contrast, Aspergillus was the most abundant genus in FG-A, followed by Dipodascus. In FG-B, the relative abundance of Kazachstania, Kodamaea, and Thermoascus gradually decreased, while Sterigmatomyces, Apiotrichum, and Pycnoporus increased. Conversely, in FG-A, the relative abundance of Dipodascus gradually decreased, while Trichosporon, Corallomycetella, and Pichia increased. Overall, significant differences were observed in 15 fungal genera between FG-A and FG-B samples. The relative abundances of Dipodascus, Trichosporon, Corallomycetella, Apiotrichum, unclassified_k_Fung, and Fusarium were significantly higher in FG-A compared to FG-B, whereas the relative abundances of the remaining 9 genera were significantly higher in FG-B (P < 0.01) (Figure 4C).
Regarding bacterial phyla, Firmicutes, Proteobacteria, Bacteroidetes, Actinobacteria, Patescibacteria, and Chloroflexi were the most abundant, each with a relative abundance greater than 2%. In FG-A, the relative abundance of Firmicutes gradually decreased during NBJ fermentation, while Proteobacteria, Bacteroidetes, Actinobacteria, Patescibacteria, and Chloroflexi increased. For FG-B, Firmicutes dominated, accounting for approximately 98% of the bacterial community from days 16 to 41 but decreased to 85% after 47 days of fermentation. A significant increase in Proteobacteria and Bacteroidetes was observed in FG-B after 47 days (Figure 4D).
A total of 1,028 bacterial genera were identified, with 606 genera found in FG-B and 981 in FG-A. The number of bacterial genera in FG-A was significantly higher than in FG-B (P < 0.01) (Figure 5A). Among the 19 dominant bacterial genera (relative abundance > 2%), notable ones included Lactobacillus, Acetobacter, Clostridiaceae_1, Caproiciproducens, and Bacillus (Figure 4D). In FG-A, Lactobacillus was the most abundant genus, with a relative abundance greater than 90% during early fermentation stages. As fermentation progressed, Lactobacillus abundance decreased, while Acetobacter, Bacillus, Comamonas, and Sphingobacterium increased. In FG-B, Lactobacillus remained the dominant genus, accounting for over 95% of the bacterial community from days 16 to 41. However, after 47 days, the relative abundances of Acetobacter, Caproiciproducens, norank_f_Clostridiaceae_1, Prevotella_7, Hydrogenispora, and Petrimonas increased. Significant differences were found in 15 bacterial genera between FG-A and FG-B. Lactobacillus, norank_f_Clostridiaceae_1, Hydrogenispora, and Caproiciproducens were significantly more abundant in FG-B compared to FG-A, while the remaining 11 genera were more abundant in FG-A (P < 0.05). Overall, these results indicate significant differences in microbial community structures between FG-A and FG-B during NBJ fermentation.
3.4. Effects of Microorganisms on FG
Redundancy Analysis (RDA) was employed to elucidate the relationship between microbial succession and fermentation stages in NBJ production. The RDA results indicated that the two principal axes accounted for 68.2% of the total variance in the microbial community data. The RDA score plots identified three distinct sections labeled Group1, Group2, and Group3 (Figure 5A), each corresponding to different fermentation stages. In the early-stage fermentation, characterized by high starch content, Group1 reflected this phase where starch was converted into reducing sugars by the enzymatic activity of molds from Daqu. Molds such as unclassified_k_Ascomycota, Aspergillus, and Wallemia showed significant negative correlations with starch content (P < 0.05), indicating their role in starch hydrolysis (Figure 5B). Reducing sugars, essential for microbial growth, serve as substrates for various species, including yeasts, which are crucial for ethanol production. Yeasts demonstrated significant negative correlations with reducing sugar content, while ethanol content showed significant positive correlations with yeast (P < 0.05) (Figure 5B). Additionally, Lactobacillus utilized reducing sugars for lactic acid production, corresponding to Group2. Group1 and Group2 are associated with the early stages of fermentation, during which ethanol and lactic acid accumulate. Group3 represents the late-stage fermentation, where the production of short-chain fatty acids (SCFAs) and their esters becomes prominent. Acetobacter, Clostridiaceae_1, and Caproiciproducens were identified as key functional microorganisms in this stage, contributing significantly to SCFA production.
To elucidate the influence of microbial species on the differences in volatile compounds between FG-A and FG-B, correlation network analysis (Figure 5C) and correlation analysis (Figure 5D) were performed. Yeasts exhibited positive correlations with alcohol content and negative correlations with acid content. This aligns with their role as primary producers of alcohols during NBJ fermentation, where excessive acid production inhibits their growth and metabolism, as supported by both the correlation analysis (Figure 5B) and variations in fungal biomass (Figure 4C).
Additionally, several bacterial genera showed significant correlations with the contents of SCFAs and their esters, including Acetobacter, Bacillus, Hydrogenispora, Caproiciproducens, and Clostridiaceae_1. Specifically, Acetobacter and Clostridiaceae_1 showed significant positive correlations (P< 0.05) with caproic acid and butyric acid contents. Caproiciproducens and Hydrogenispora showed highly significant positive correlations (P < 0.01) with caproic acid and ethyl caproic contents and Lactobacillus showed significant negative correlations with them (P< 0.05).
3.5. Exploring Differences in SCFAs and SCFAEs in FG
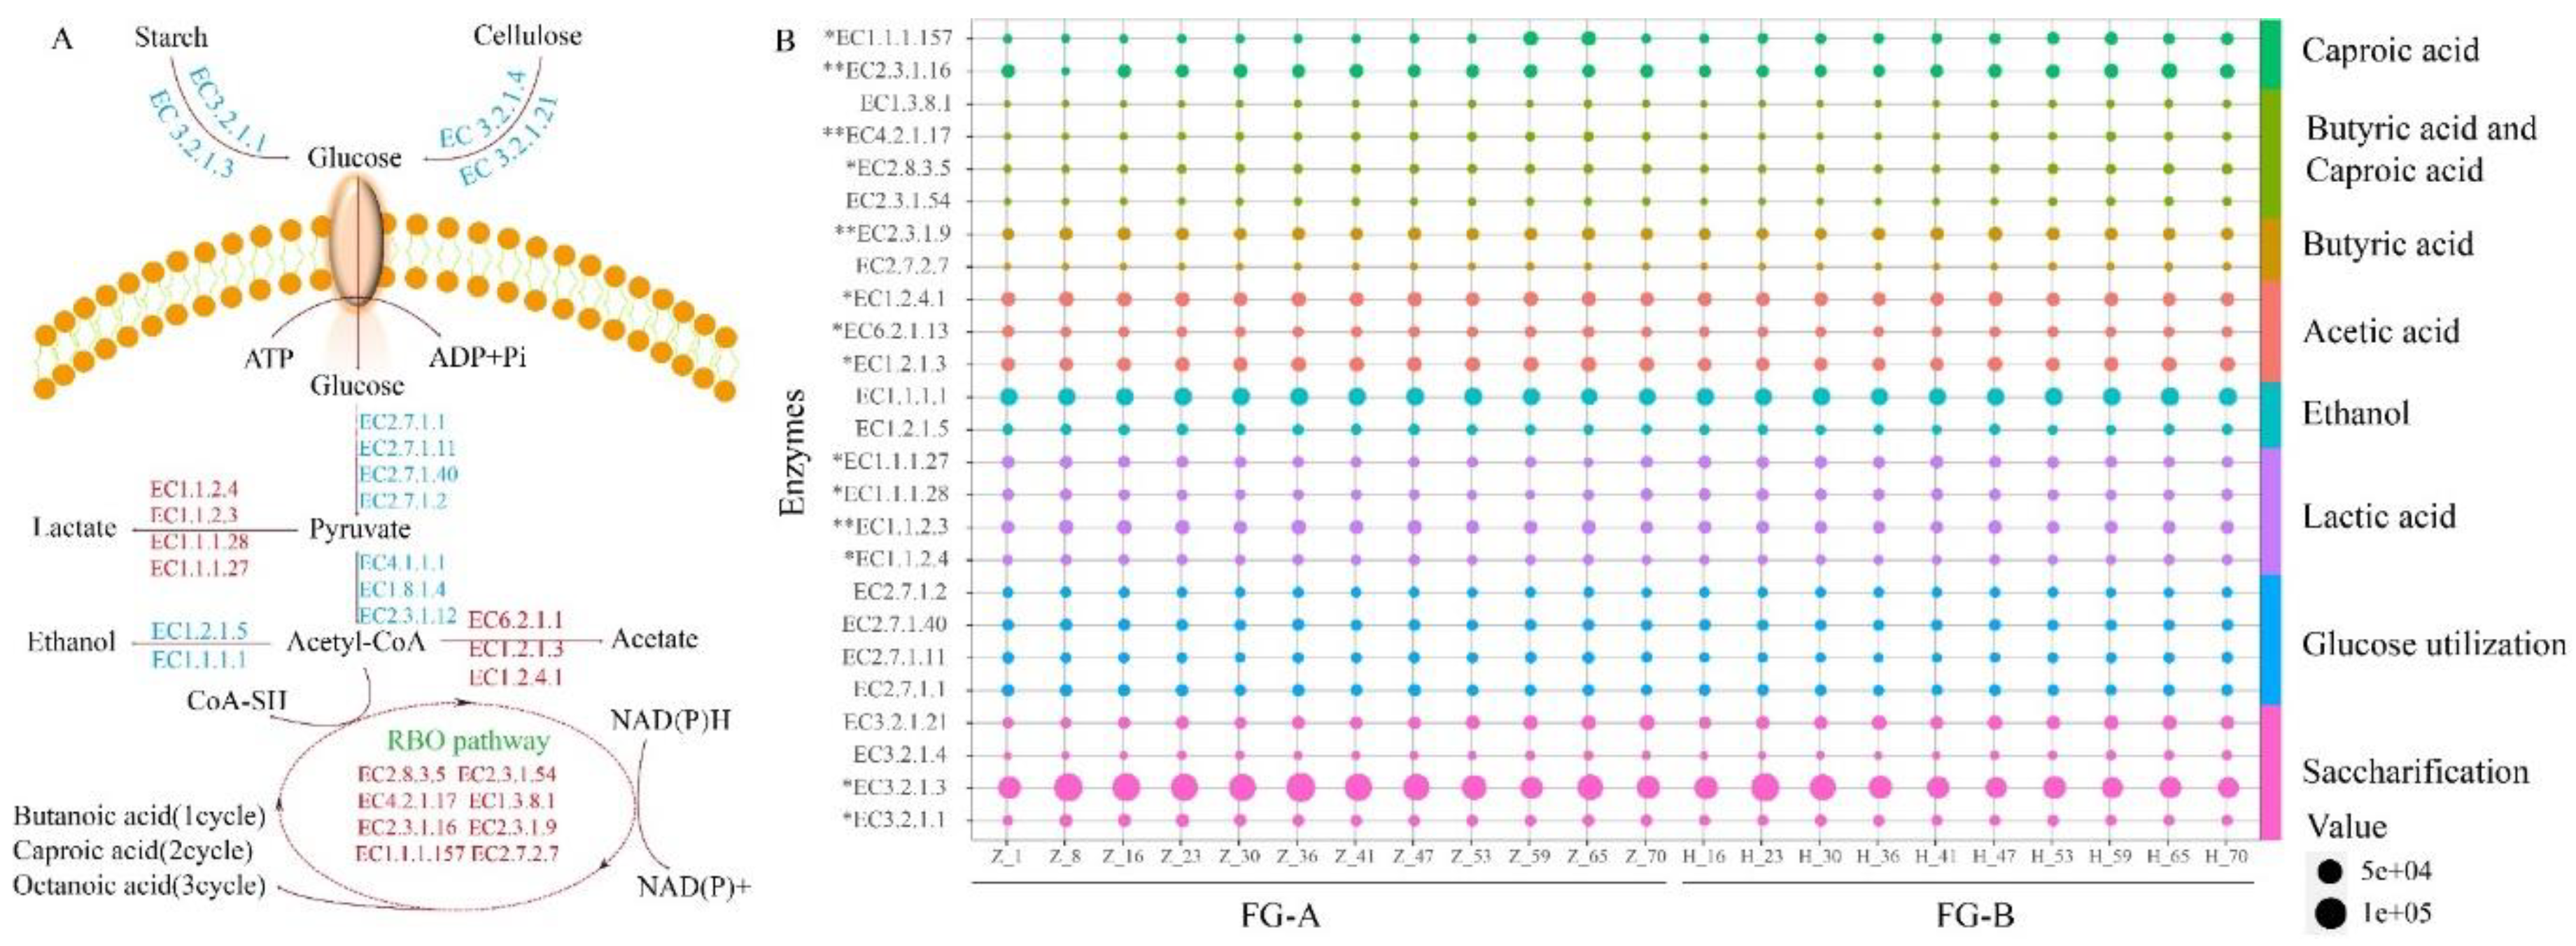
To further understand the effects of microorganisms on volatile compound metabolism, particularly SCFA production, we employed PICRUSt2 to analyze microbial sequencing data and construct microbial metabolic pathways related to SCFA production in FG (Figure 6A). The abundance of key enzymes in these pathways was visualized using bubble charts (Figure 6B).
Starch and cellulose in the FG are first broken down into reducing sugars. This process is facilitated by hydrolytic enzymes from Daqu, particularly amylase (EC 3.2.1.1, EC 3.2.1.3) and cellulase (EC 3.2.1.4, EC 3.2.1.21). The content of amylase was significantly higher in FG-A and FG-B during the early stages of fermentation compared to the late stages, likely due to the higher biomass of molds present initially (P < 0.05).
Microorganisms convert glucose to pyruvate through the Embden-Meyerhof-Parnas (EMP) pathway. This pyruvate can then be anaerobically metabolized into lactic acid and ethanol. Lactobacillus and yeast are the primary microorganisms responsible for producing these substances. The abundance of lactate dehydrogenases, which are crucial for converting pyruvate into lactic acid, was significantly different between FG-A and FG-B, with FG-B showing higher levels (P < 0.05). This explains the higher lactic acid content observed in FG-B during fermentation.
Acetic acid is produced from pyruvate via oxidative dehydrogenation. In FG-B, the abundance of aldehyde dehydrogenase (EC 1.2.1.3) and acetate thiokinase (EC 6.2.1.1) was higher compared to FG-A, whereas pyruvate dehydrogenase (EC 1.2.4.1) was more abundant in FG-A. This differential enzyme abundance impacts the formation and levels of acetic acid in the samples.
SCFAs are produced by reversing the β-oxidation cycle, utilizing ethanol and lactic acid as electron donors and acetyl-CoA as an electron acceptor. In late-stage fermentation, enzymes involved in SCFA production are more abundant. The abundance of five enzymes was significantly different (P< 0.05). In particular, the abundance of acetyl-CoA C-acetyltransferase (EC 2.3.1.9) and acetyl-CoA C-acyltransferase (EC 2.3.1.16), which are critical for chain elongation in SCFA production, was significantly higher in FG-B compared to FG-A (P < 0.01).
4. Discussion
FG serves as the medium for microbial growth during NBJ fermentation, and changes in fermentation parameters reflect the evolving environment within FG, thereby indicating the progress of the fermentation process. By analyzing specific fermentation kinetic parameters, the fermentation state of FG can be inferred. Based on these parameters, NBJ fermentation can be divided into two distinct stages: (i) the early stage, encompassing the first 23 days, and (ii) the late stage, extending from day 24 onwards, which aligns with previous studies (Tan et al., 2019). During the early fermentation stage, the starch content in FG was approximately 180 g/kg. This starch was subsequently converted into reducing sugars by saccharifying enzymes produced by Daqu bacteria and molds. These reducing sugars were then utilized by microorganisms to produce ethanol and lactic acid (Zhu et al., 2022). The reduction in starch content led to decreased water absorption, causing water and other liquids to accumulate at the bottom of the pit, forming Huangshui [xx]. The formation of Huangshui increased the moisture level in FG-B and transformed it into a semi-solid state, facilitating material exchange within FG-B and promoting the migration of microorganisms from the pit mud. Additionally, Huangshui formation allowed for the percolation of certain substances from FG-A to FG-B, resulting in higher levels of reducing sugars, starch, ethanol, and total acidity in FG-B (Z. Gao et al., 2020). Consequently, the formation of Huangshui created distinct fermentation conditions and nutrient compositions in the two layers of FG, which are crucial factors influencing differences in flavor and microbial community structure in NBJ.
NBJ fermentation involves a mixture of FG, Daqu, and grains (Tan et al., 2019), with various microorganisms-including those from Daqu, pit mud, and the environment-contributing to the flavor of NBJ. At the outset of NBJ fermentation, FG-A and FG-B exhibited similar volatile compounds. This similarity can be attributed to the fact that the original FG contained similar volatile compounds, such as ethyl palmitic and ethyl linoleate, whose concentrations remained relatively unchanged throughout the early stages of fermentation. However, their content decreased in FG-B due to dilution from the Huangshui. In the early stages of fermentation, the volume of Huangshui was low, and both layers of FG were in a solid state. Consequently, the volatile compounds in Huangshui were derived from the upper layer of FG, resulting in similar volatile profiles for FG-A and FG-B during this period. As fermentation progressed and the volume of Huangshui increased, initial fermentation products accumulated in the lower layer. This led to a semi-solid state in FG-B after 30 days of fermentation.
The content of alcohols in FG-A was significantly higher than in FG-B, making alcohols a key differential volatile compound (p < 0.05). Alcohols are crucial in NBJ production, as they contribute to the fragrant, mellow, and sweet sensory characteristics of Baijiu. However, excessive alcohol levels can cause headaches after consumption (He et al., 2020). Additionally, FG-B had significantly higher levels of fatty acids and their esters compared to FG-A (p < 0.05), particularly lactic acid, acetic acid, butyric acid, and caproic acid. It is well-established that the main aroma components in NBJ are four esters: ethyl caproate, ethyl lactate, ethyl butyrate, and ethyl acetate. The content and proportion of these esters are critical in determining the type and quality of NBJ (Qian et al., 2021) [xx]. The observed differences in the levels of these fatty acids and esters between FG-A and FG-B reflect variations in aroma composition and the quality of the final Baijiu product. Therefore, the differences in fermentation status and nutrient composition between FG-A and FG-B likely explain the variations in volatile compounds, which in turn may influence the quality of the original Baijiu.
Microorganisms are the primary producers of flavor compounds in NBJ fermentation. During the early stages of fermentation, fungal biomass was notably higher, especially in FG-A. Fungi contribute to the breakdown of starch in FG, resulting in the formation of reducing sugars, which are crucial substrates for the metabolism of ethanol and lactic acid by microorganisms (Tan et al., 2019). Significant differences were observed in bacterial biomass between FG-A and FG-B, although the trends in both were similar. The similarity in bacterial Shannon indexes suggests that FG requires extended periods to sustain high bacterial diversity, consistent with findings from other studies (Lee et al., 2017).
Yeasts are the primary producers of ethanol (Su, Zhang, Cao, & Yang, 2020), while Lactobacillus is the main producer of lactic acid during NBJ fermentation (Du, Wu, & Xu, 2020). An increase in yeast biomass before 23 days of fermentation promoted ethanol production. When Lactobacillus dominated the bacterial community in the early stage, particularly in FG-B, leading to a peak in lactic acid content around 30 days. This peak may be a significant factor contributing to the higher lactate levels observed in FG-B compared to FG-A.
Aspergillus, known for producing amylase and esterase in Baijiu (Ma et al., 2022), was significantly more abundant in FG-B than in FG-A. This abundance likely explains the higher ester content in FG-B. Trichosporon, a basidiomycetous oleaginous yeast capable of converting glucose into grease (Yaguchi, Robinson, Mihealsick, & Blenner, 2017), may account for the higher levels of long-chain fatty acid esters in FG-A. In the late stages of fermentation, a decrease in microbial abundance was observed, likely due to elevated ethanol content and high acidity in FG. These conditions create an anaerobic environment in the pit (Tan et al., 2019), which inhibits further microbial growth.
In late-stage fermentation, the abundance of Acetobacter, Sphingobacterium, and Bacillus increased in FG-A due to environmental conditions, indicating a shift in the bacterial community from lactic acid fermentation to acetic acid fermentation (Li, Zheng, He, Sheng, & Zhi, 2009). In contrast, FG-B saw an increase in Clostridium, Acetobacter, Hydrogenispora, and Caproiciproducens, suggesting a shift towards caproic acid fermentation typical of anaerobic sludge environments (Fu et al., 2021).
Interestingly, the distinct acid-producing bacteria in FG-A and FG-B are closely related to the main volatile compounds in NBJ. Previous studies have identified large populations of Clostridium, Hydrogenispora, and Caproiciproducens in pit mud, with Caproiciproducens alone accounting for up to 34.79% of the total bacterial species on the surface (Chai et al., 2021; Huilin Wang et al., 2021). The presence of these bacteria indicates an enhanced capacity for fatty acid metabolism, which may be transported to FG-B via Huangshui, leading to increased fatty acid production during late-stage fermentation[19]. Thus, the environmental conditions and pit mud microorganisms significantly influence the microbial community structure in FG-B. These differences in microbial composition likely contribute to the observed variations in volatile components between FG-A and FG-B during late-stage fermentation. In particular, acid-producing bacteria play a crucial role in influencing the production of short-chain fatty acids (SCFAs) and their esters in NBJ.
In early-stage fermentation, a significant accumulation of lactic acid and ethanol occurred in FG. Both ethanol and lactic acid serve as electron donors for the production of short-chain fatty acids (SCFAs). Critical enzymes in this process include acetyl-CoA C-acetyltransferase (EC 2.3.1.9) and acetyl-CoA C-acyltransferase (EC 2.3.1.16). Under anaerobic conditions, Acetobacter and Clostridiaceae_1 convert ethanol into acetic acid and butyric acid, with Clostridiaceae_1 being particularly essential for butyric acid production. These acids then serve as precursors for the formation of other acidic chains [20]. Caproiciproducens is the primary bacterial species responsible for producing caproic acid during NBJ fermentation. This species is involved in chain elongation via the β-oxidation cycle to synthesize caproic acid [21], with Hydrogenispora also supporting caproic acid production[22].
Interestingly, despite lactic acid being an electron donor for SCFA production, Lactobacillus exhibited negative correlations with several SCFAs and their esters, including caproic acid, butyric acid, ethyl caproic acid, and ethyl butyrate. This may be attributed to the shift from lactic acid and acetic acid fermentation to caproic acid fermentation, which led to a decrease in Lactobacillus abundance and an increase in Hydrogenispora, Caproiciproducens, and Clostridiaceae_1.
Significant differences were observed in the abundance of acid-producing microbial species between FG-A and FG-B during NBJ fermentation. In particular, the absolute abundance of Clostridiaceae_1, Caproiciproducens, and Hydrogenispora was higher in FG-B compared to FG-A. These microbial species contribute to SCFA production, similar to findings reported in resource recovery studies on caproic acid production [23], [24]. This microbial profile likely promotes the formation of SCFA esters, potentially explaining the higher content of volatile compounds in FG-B compared to FG-A. Overall, significant differences in the abundance of microorganisms and enzymes involved in SCFA production between FG-A and FG-B were observed[25]. These differences help explain the variations in SCFA and ester content between the two sample types during NBJ fermentation.
The levels and equilibrium of SCFAs and their esters directly impact NBJ quality. Environmental conditions and microbial community structure differences between FG-A and FG-B significantly influence the content of SCFAs and their esters. These findings provide valuable insights into the production differences of original Baijiu between FG-A and FG-B and offer potential strategies for standardizing NBJ production. For example, adjusting the Huangshui line height by modifying pit shape could increase the proportion of FG-B. Additionally, understanding the role of microorganisms in pit mud can guide the application of functional bacteria in Baijiu production. Reducing the differences between FG-A and FG-B could further enhance NBJ quality.
5. Conclusions
In the present study, we characterized the microbial community structure of FG-A and FG-B in NBJ fermentation and analyzed the associated fermentation parameters and volatile compounds. Significant differences were observed between FG-A and FG-B in terms of fermentation parameters, volatile compounds, and microbial community structure. These variations in fermentation parameters influenced the microbial community structure, which, in turn, affected the aroma quality of FG. Specifically, differences in the content of short-chain fatty acids and their esters between FG-A and FG-B directly impacted the quality of the resulting NBJ. These findings provide new insights into NBJ production and offer a foundational understanding for better monitoring and optimization of the fermentation process.
Author Contributions
Zhi-Guo Huang designed the research; Jie Deng executed the experiments, analyzed the data and wrote the manuscript; Chaojiu He provided samples and executed the experiments; Chun-Hui Wei reviewed and Zhi-Qiang Ren reviewed and edited this manuscript. All authors have read and agreed to the published version of the manuscript.
Acknowledgments
This study was financially supported by the Sichuan Province Science and Technology Program (grant 2023JDRC0116 and 2022YFS0547), Liquor Making Biological Technology and Application of Key Laboratory of Sichun Province (NJ2022-07).
Conflicts of Interest declarations
The authors declare that they have no known competing financial interests or personal relationships that could have appeared to influence the work reported in this paper.
References
- Zheng, X.-W.; Han, B.-Z. Baijiu (白酒), Chinese liquor: History, classification and manufacture. Journal of Ethnic Foods 2016, 3, 19–25. [Google Scholar] [CrossRef]
- Liu, H.; Sun, B. Effect of Fermentation Processing on the Flavor of Baijiu. Journal of agricultural and food chemistry 2018, 66, 5425–5432. [Google Scholar] [CrossRef] [PubMed]
- Niu, Y.; Zhu, Q.; Xiao, Z. Characterization of perceptual interactions among ester aroma compounds found in Chinese Moutai Baijiu by gas chromatography-olfactometry, odor Intensity, olfactory threshold and odor activity value. Food Res. Int. 2020, 131, 108986. [Google Scholar] [CrossRef] [PubMed]
- Ren, Z.; Xie, J.; Tang, T.; Huang, Z. Short-chain carboxylates facilitate the counting of yeasts in Sub-high temperature Daqu. Pol. J. Microbiol. 2024, 73, 167–176. [Google Scholar] [CrossRef] [PubMed]
- Xu, D.; Yin, Y.; Ali, B.; Zhang, Y.; Guo, L.; Xu, X. Isolation of yeast strains from Chinese liquor Daqu and its use in the wheat sourdough bread making. Food Biosci. 2019, 31. [Google Scholar] [CrossRef]
- Yan, S.; Tong, Q.; Guang, J. Yeast dynamics and changes in volatile compounds during the fermentation of the traditional Chinese strong-flavor Daqu. LWT 2019, 106, 57–63. [Google Scholar] [CrossRef]
- Wang, X.-J.; Zhu, H.-M.; Ren, Z.-Q.; Huang, Z.-G.; Wei, C.-H.; Deng, J. Characterization of Microbial Diversity and Community Structure in Fermentation Pit Mud of Different Ages for Production of Strong-Aroma Baijiu. Pol. J. Microbiol. 2020, 69, 151–164. [Google Scholar] [CrossRef] [PubMed]
- Tan, Y.; Zhong, H.; Zhao, D.; Du, H.; Xu, Y. Succession rate of microbial community causes flavor difference in strong-aroma Baijiu making process. Int. J. Food Microbiol. 2019, 311, 108350. [Google Scholar] [CrossRef]
- Ren, Z.; Chen, Q.; Tang, T.; Huang, Z. Unraveling the water source and formation process of Huangshui in solid-state fermentation. Food Sci. Biotechnol. 2024, 1–11. [Google Scholar] [CrossRef]
- Zhu, M.; Zheng, J.; Xie, J.; Zhao, D.; Qiao, Z.-W.; Huang, D.; Luo, H.-B. Effects of environmental factors on the microbial community changes during medium-high temperature Daqu manufacturing. Food Res. Int. 2022, 153, 110955. [Google Scholar] [CrossRef]
- Xu, Y.; Wang, X.; Liu, X.; Li, X.; Zhang, C.; Li, W.; Sun, X.; Wang, W.; Sun, B. Discovery and development of a novel short-chain fatty acid ester synthetic biocatalyst under aqueous phase from Monascus purpureus isolated from Baijiu. Food Chem. 2020, 338, 128025. [Google Scholar] [CrossRef] [PubMed]
- Sun, H.; Chai, L.J.; Fang, G.Y.; Lu, Z.M.; Zhang, X.J.; Wang, S.T.; Shen, C.H.; Shi, J.S.; Xu, Z.H. Metabolite-Based Mutualistic Interaction between Two Novel Clostridial Species fromPit Mud Enhances Butyrate and Caproate Production. Applied and Environmental Microbiology 2022, 6, e00484–00422. [Google Scholar]
- Gao, Z.; Wu, Z.; Zhang, W. Effect of Pit Mud on Bacterial Community and Aroma Components in Yellow Water and Their Changes during the Fermentation of Chinese Strong-Flavor Liquor. Foods 2020, 9, 372. [Google Scholar] [CrossRef] [PubMed]
- Bravo, L.; Siddhuraju, P.; Saura-Calixto, F. Effect of Various Processing Methods on the in Vitro Starch Digestibility and Resistant Starch Content of Indian Pulses. J. Agric. Food Chem. 1998, 46, 4667–4674. [Google Scholar] [CrossRef]
- Miller, G.L. Use of Dinitrosalicylic Acid Reagent for Determination of Reducing Sugar. Analytical Biochemistry 1959, 31, 426–428. [Google Scholar] [CrossRef]
- Sun, C.; Wang, R.; Wang, T.; Li, Q. Primary evaluation of nine volatile N-nitrosamines in raw red meat from Tianjin, China, by HS-SPME-GC-MS. Food chemistry 2020, 310, 125945. [Google Scholar] [CrossRef]
- Saito, R.; Smoot, M.E.; Ono, K.; Ruscheinski, J.; Wang, P.-L.; Lotia, S.; Pico, A.R.; Bader, G.D.; Ideker, T. A travel guide to Cytoscape plugins. Nat. Methods 2012, 9, 1069–1076. [Google Scholar] [CrossRef]
- Douglas, G.M.; Maffei, V.J.; Zaneveld, J.R.; Yurgel, S.N.; Brown, J.R.; Taylor, C.M.; Huttenhower, C.; Langille, M.G.I. PICRUSt2 for prediction of metagenome functions. Nat. Biotechnol. 2020, 38, 685–688. [Google Scholar] [CrossRef]
- Ren, Z.; Liu, L.; Tang, T.; Huang, K.; Huang, Z. Effectively Increase the L(+)-Isomer Proportion of Ethyl Lactate in Baijiu by Isolating and Applying L(+)-Lactic Acid-Producing Bacteria. Preprints 2024, 2024. [Google Scholar] [CrossRef]
- Tang, T.-X.; Liu, Y.; Wu, Z.-L. Characterization of a robust anti-Prelog short-chain dehydrogenase/reductase ChKRED20 from Chryseobacterium sp. CA49. J. Mol. Catal. B: Enzym. 2014, 105, 82–88. [Google Scholar] [CrossRef]
- Wang, H.; Li, X.; Wang, Y.; Tao, Y.; Lu, S.; Zhu, X.; Li, D. Improvement of n-caproic acid production with Ruminococcaceae bacterium CPB6: selection of electron acceptors and carbon sources and optimization of the culture medium. Microb. Cell Factories 2018, 17, 99. [Google Scholar] [CrossRef]
- Liu, Y.; Tang, T.-X.; Pei, X.-Q.; Zhang, C.; Wu, Z.-L. Identification of ketone reductase ChKRED20 from the genome of Chryseobacterium sp. CA49 for highly efficient anti-Prelog reduction of 3,5-bis(trifluoromethyl)acetophenone. J. Mol. Catal. B: Enzym. 2014, 102, 1–8. [Google Scholar] [CrossRef]
- Han, W.; He, P.; Shao, L.; Lü, F. Metabolic Interactions of a Chain Elongation Microbiome. Appl. Environ. Microbiol. 2018, 84. [Google Scholar] [CrossRef] [PubMed]
- Wang, Q.; Zhang, P.; Bao, S.; Liang, J.; Wu, Y.; Chen, N.; Wang, S.; Cai, Y. Chain elongation performances with anaerobic fermentation liquid from sewage sludge with high total solid as electron acceptor. Bioresour. Technol. 2020, 306, 123188. [Google Scholar] [CrossRef] [PubMed]
- Zhou, L.; Tang, T.; Deng, D.; Wang, Y.; Pei, D. Isolation and Electrochemical Analysis of a Facultative Anaerobic Electrogenic Strain Klebsiella sp. SQ-1. Pol. J. Microbiol. 2024, 73, 143–153. [Google Scholar] [CrossRef]
Figure 1.
Production process of strong-flavor Baijiu (A). Sampling points in mud cellar (B). Black circles (●) indicate fermented grains sampling sites below (FG-B) the Huangshui line , green circles (●) represent fermented grains sampling sites above below (FG-A) the Huangshui line ; the red rectangle represents the final liquid level of Huangshui; the height of Huangshui line was approximately 1.2–1.3 m in the winery in which the experiment was conducted.
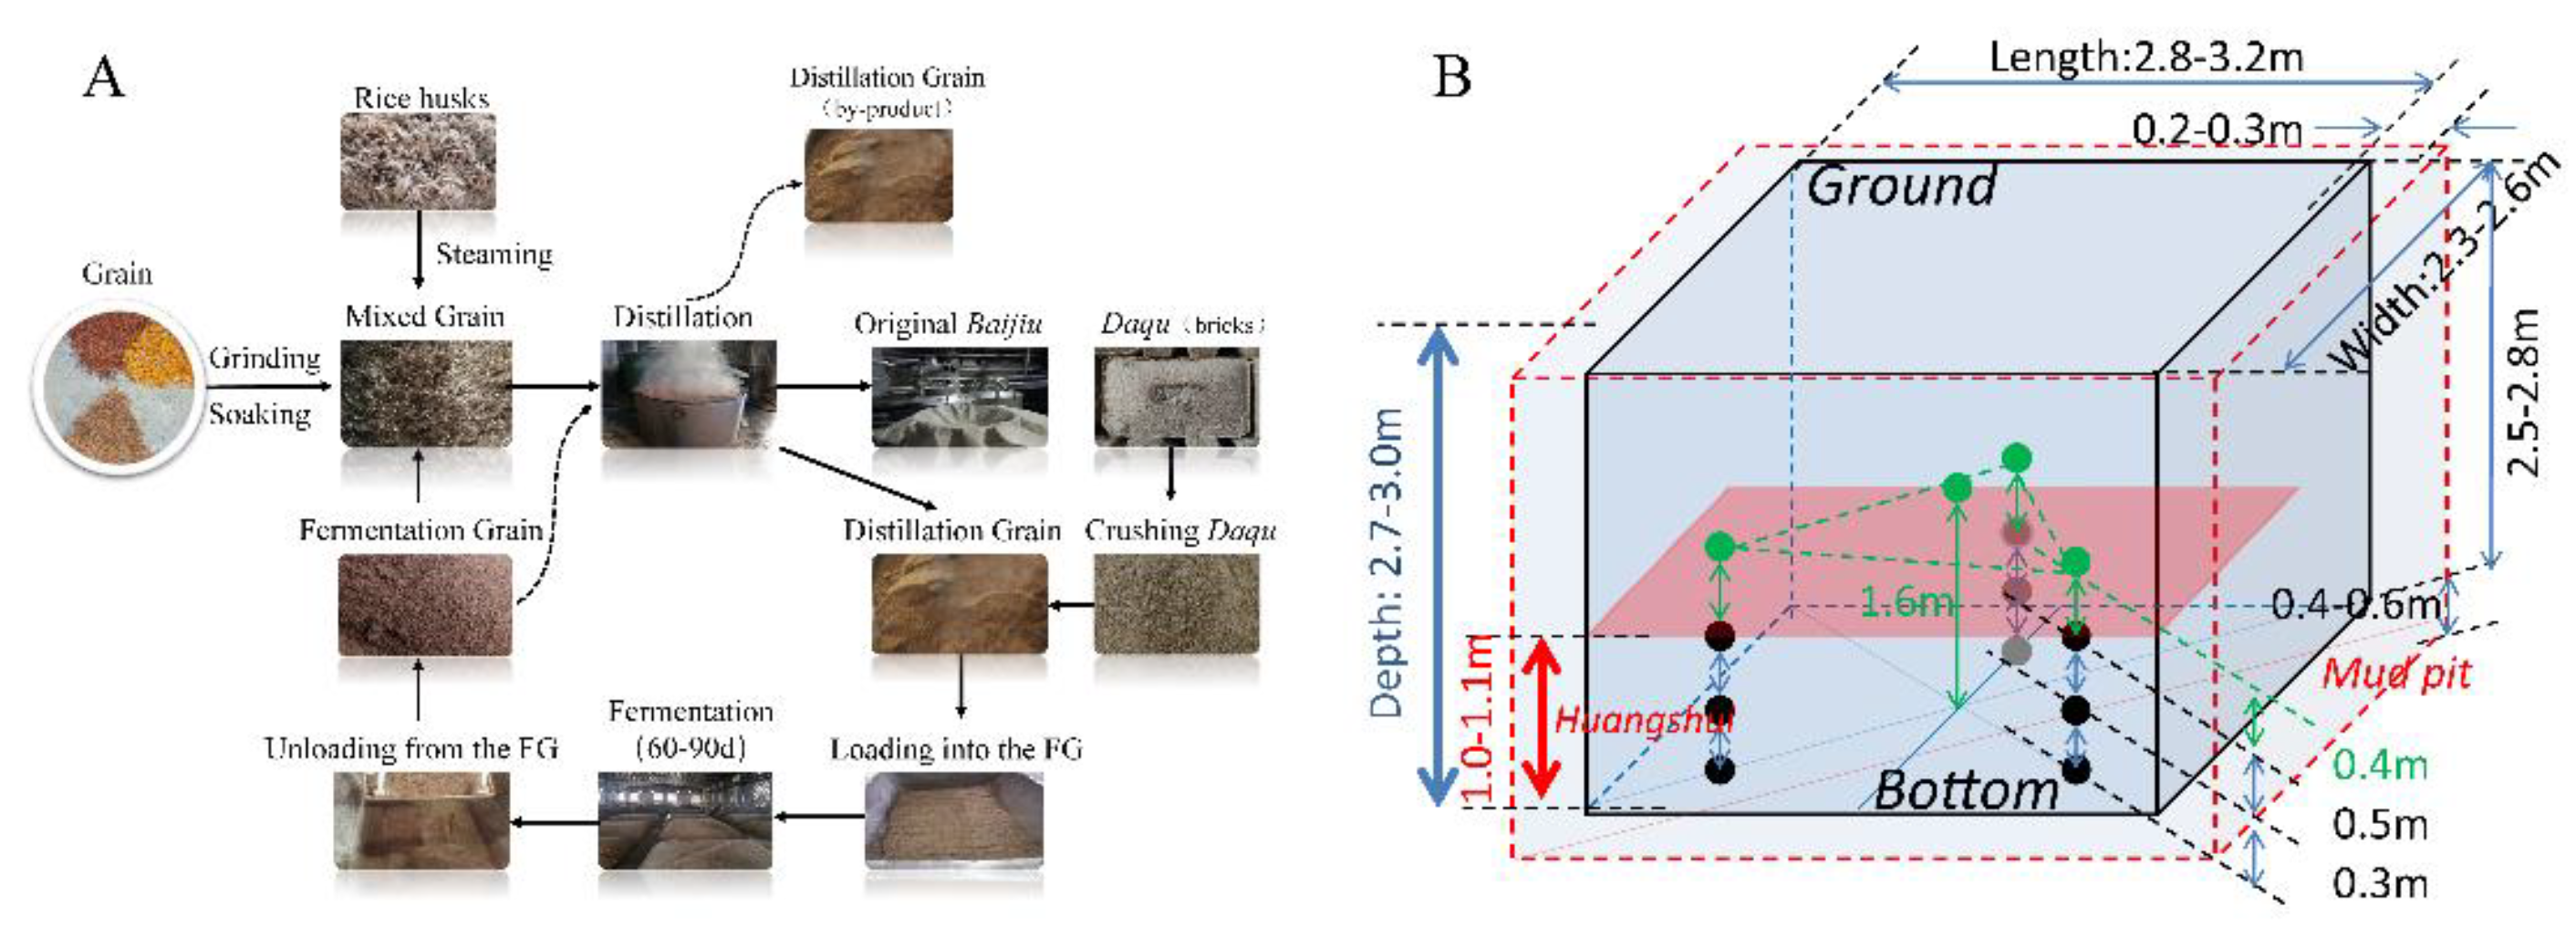
Figure 2.
Changes in fermentation parameters. (A) Stages division according to principal component analysis (PCA) based on the dissimilarity matrix of fermentation parameters. (B) Correlation analysis of fermentation parameters. (C) Change trends in fermentation parameters during NongXiangXing Baijiu (NBJ) fermentation.
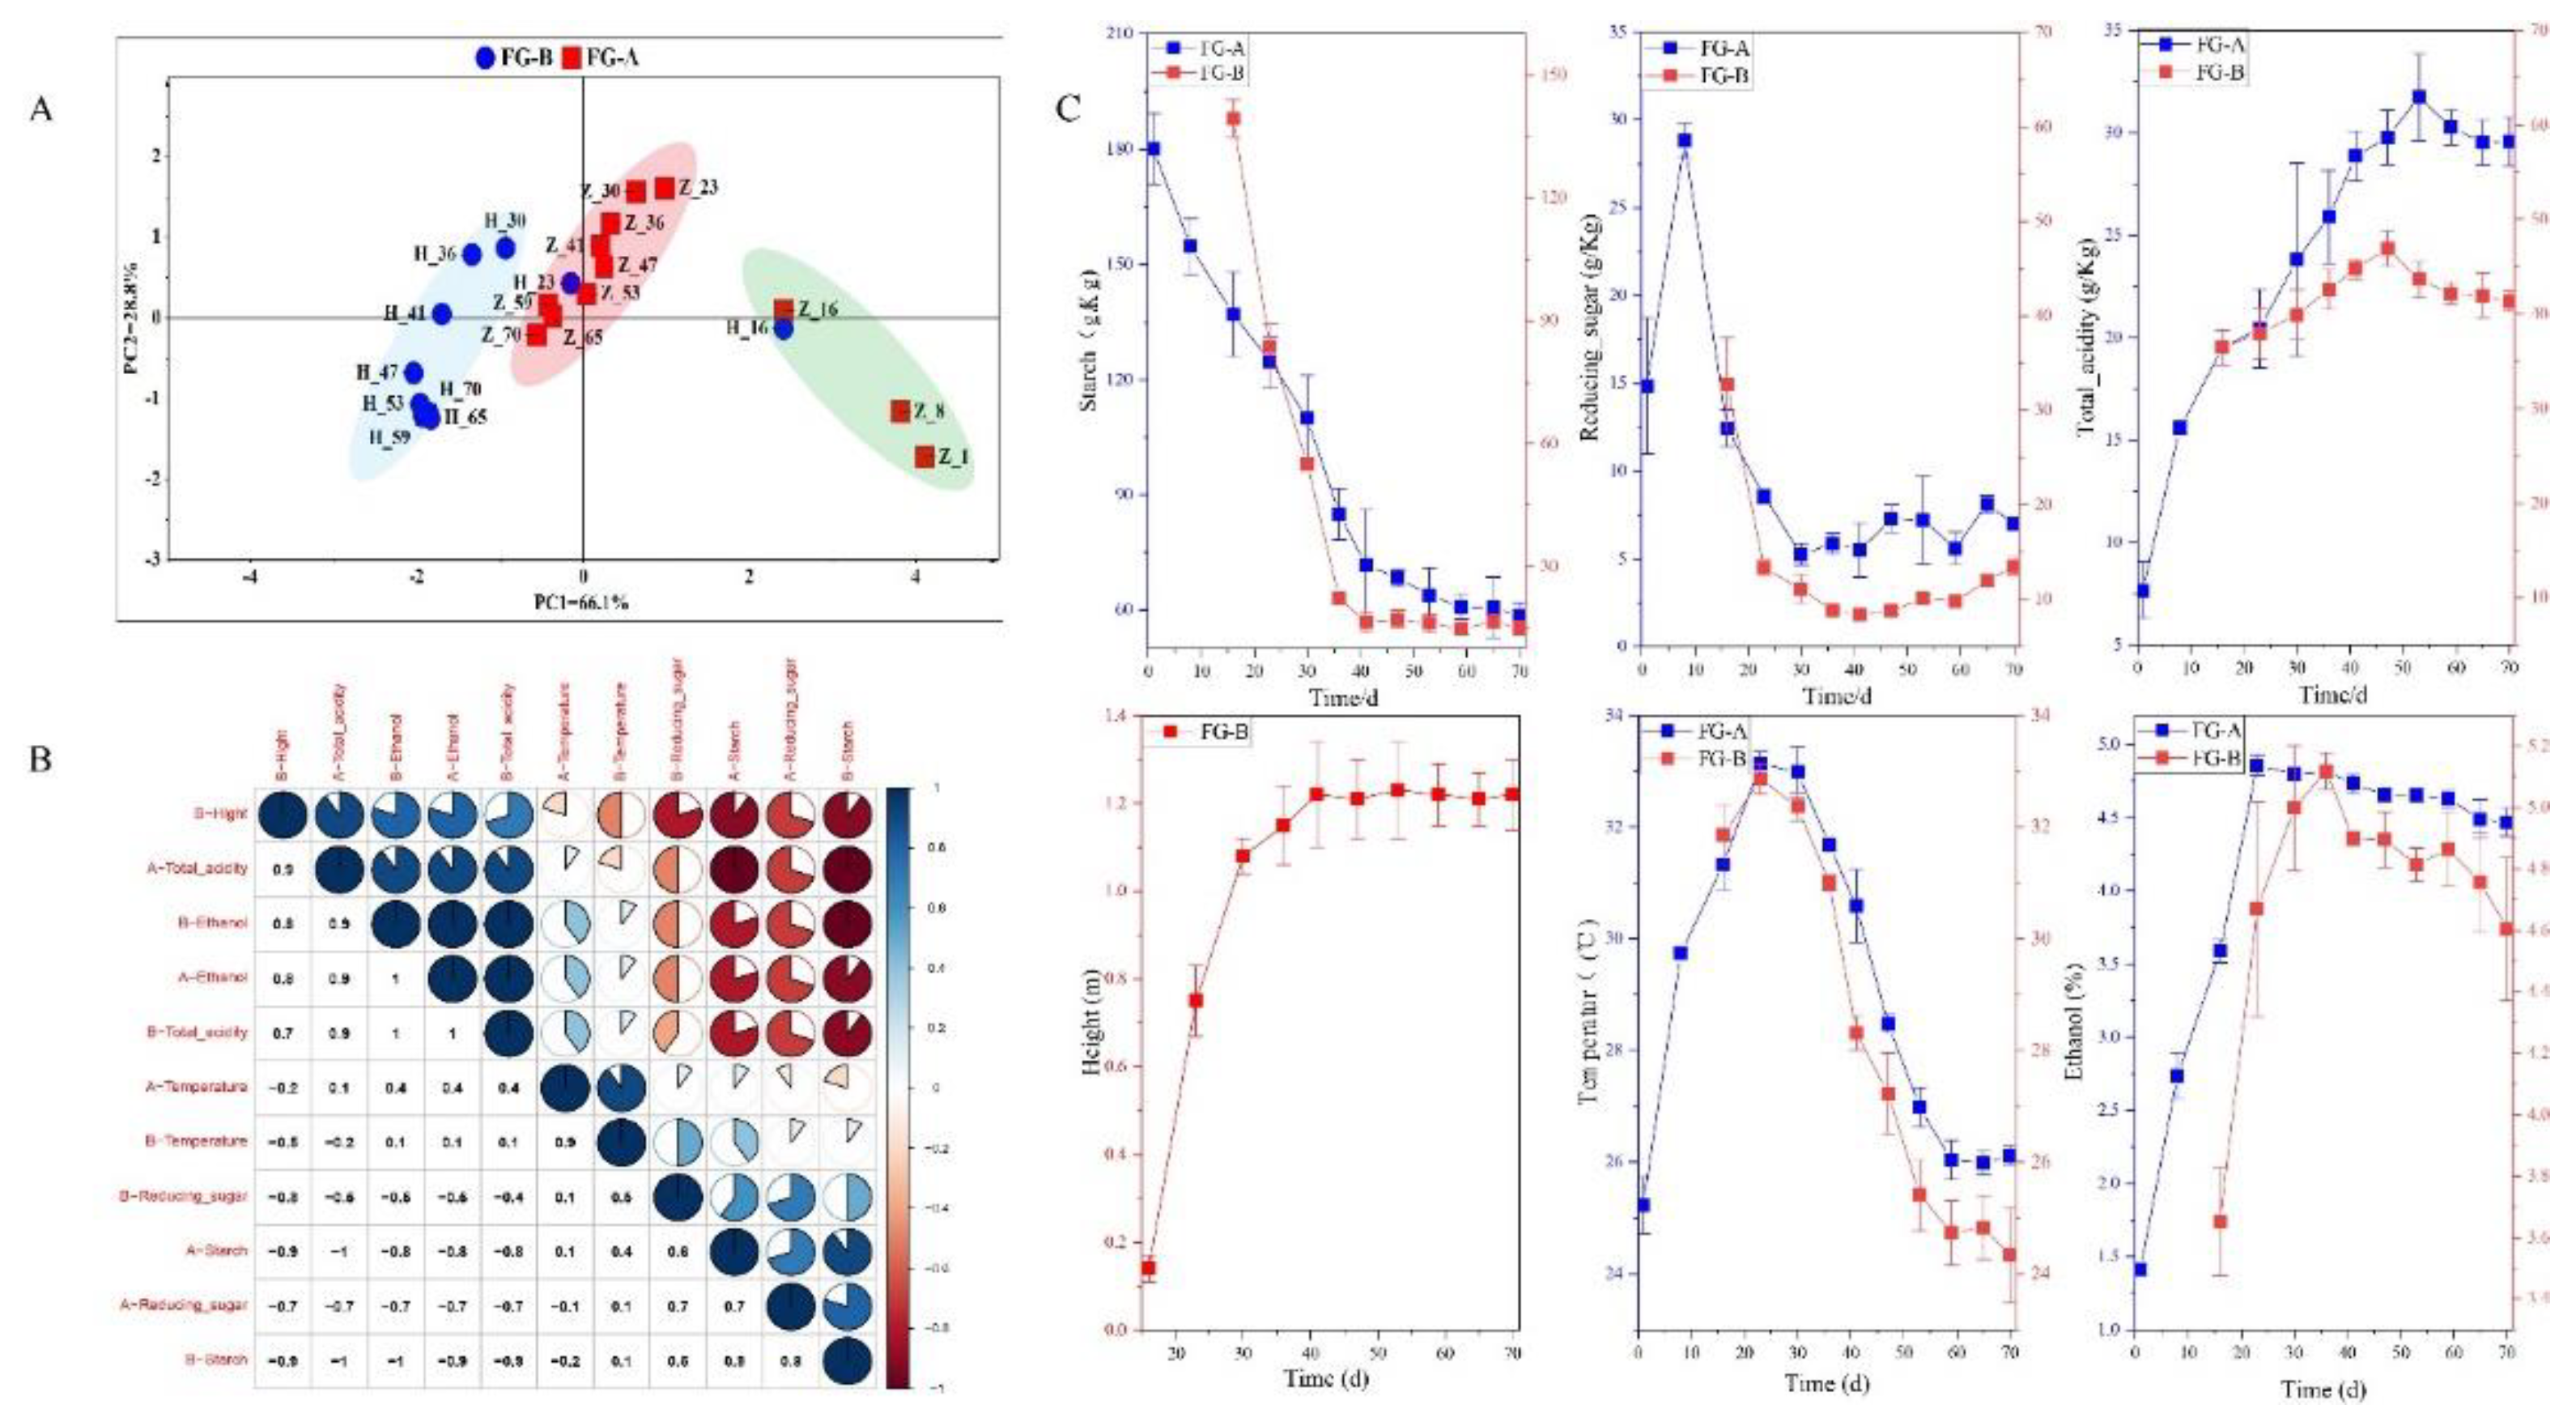
Figure 3.
Changes in volatile compounds. (A) Partial least squares-discrimination analysis (PLS-DA) plots of volatile compounds of fermented grains in NongXiangXing Baijiu (NBJ) above (FG-A) and below (FG-B) the Huangshui line. (B) Variable importance in projection values of the twenty-six markers of volatile compounds. (C) Heatmap of the twenty-six markers of volatile compounds.
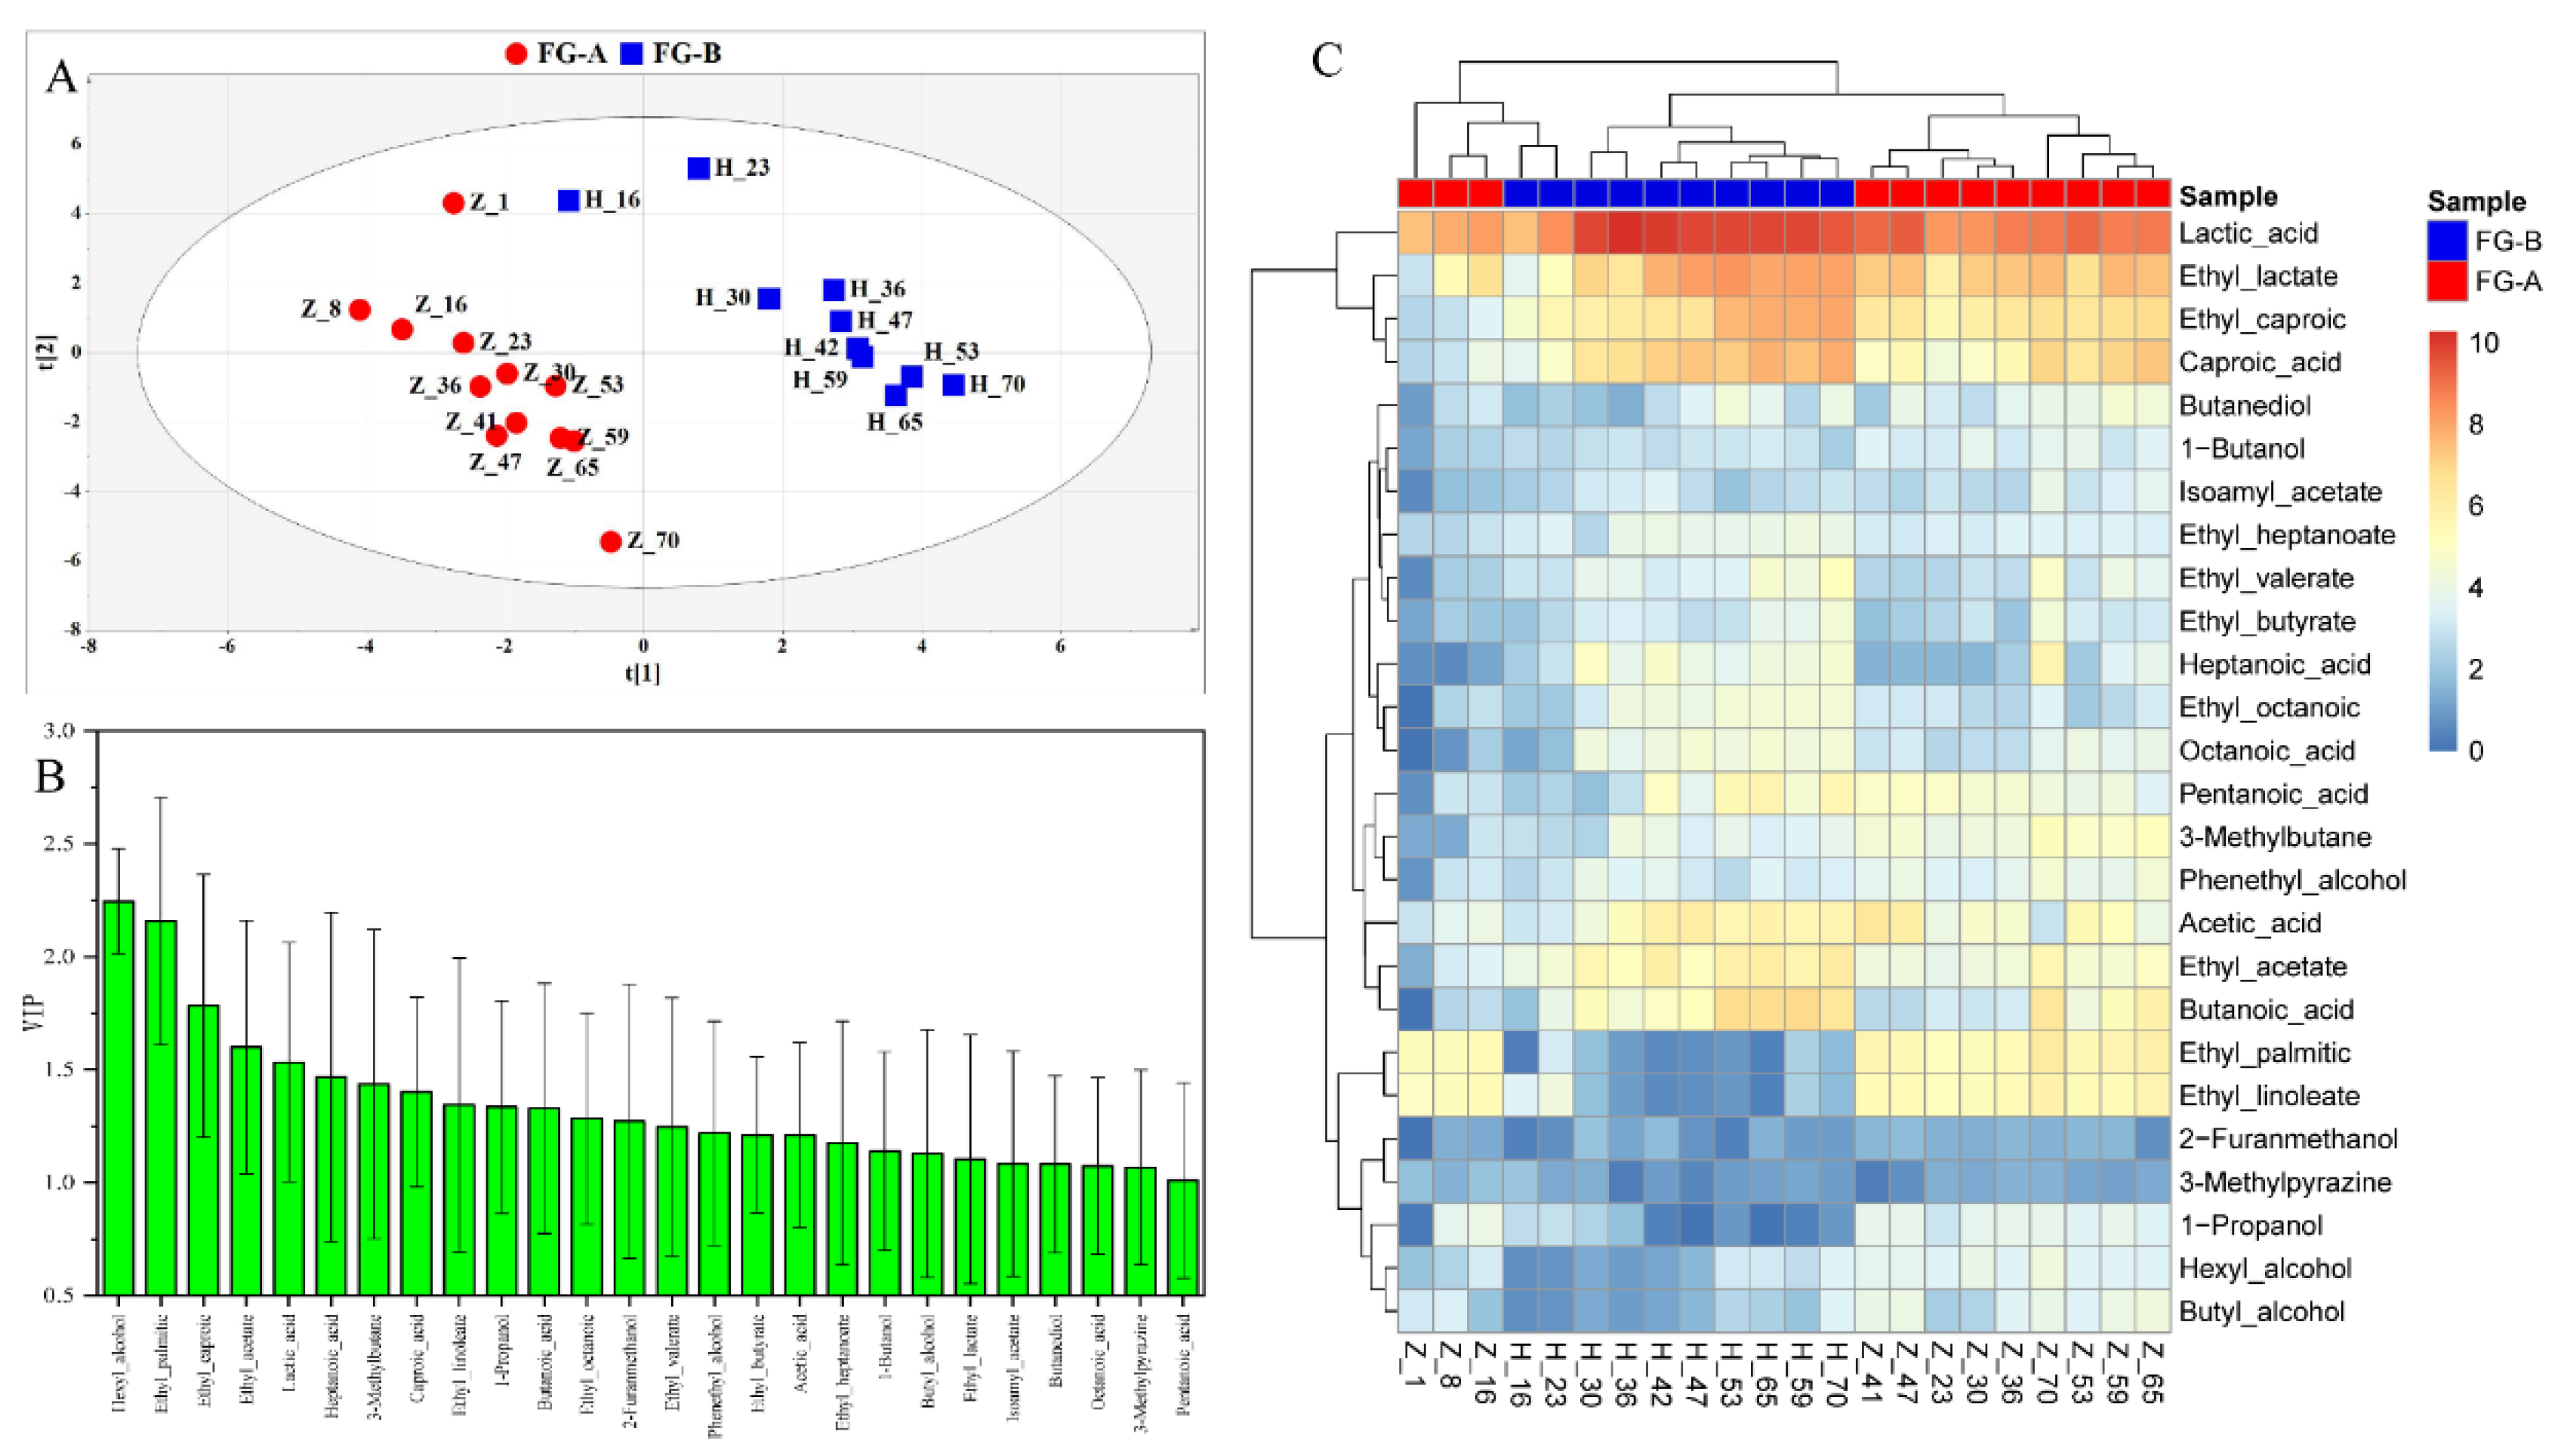
Figure 4.
Microbial diversity and succession of fermented grains in NongXiangXing Baijiu (NBJ) above (FG-A) and below (FG-B) the Huangshui line . (A) Venn diagrams of microbial genera in FG-A and FG-B (**p < 0.01, as determined by one-way ANOVA). (B) Box plots showing Shannon index values for fungi (right) and bacteria (left) (0.01<*p < 0.05; **p < 0.01, as determined by one-way ANOVA). (C) Biomass of bacteria (left) and fungi (right). (D) Bar plots of fungal community structure at the phylum and the genus level. (E) Bar plots of bacterial community structure at the phylum and the genus level. (F) Distinction between fungal and bacterial genera in FG-A and FG-B (0.01<*p < 0.05; 0.001<**p < 0.01; ***p < 0.001, as determined by rank-sank test).
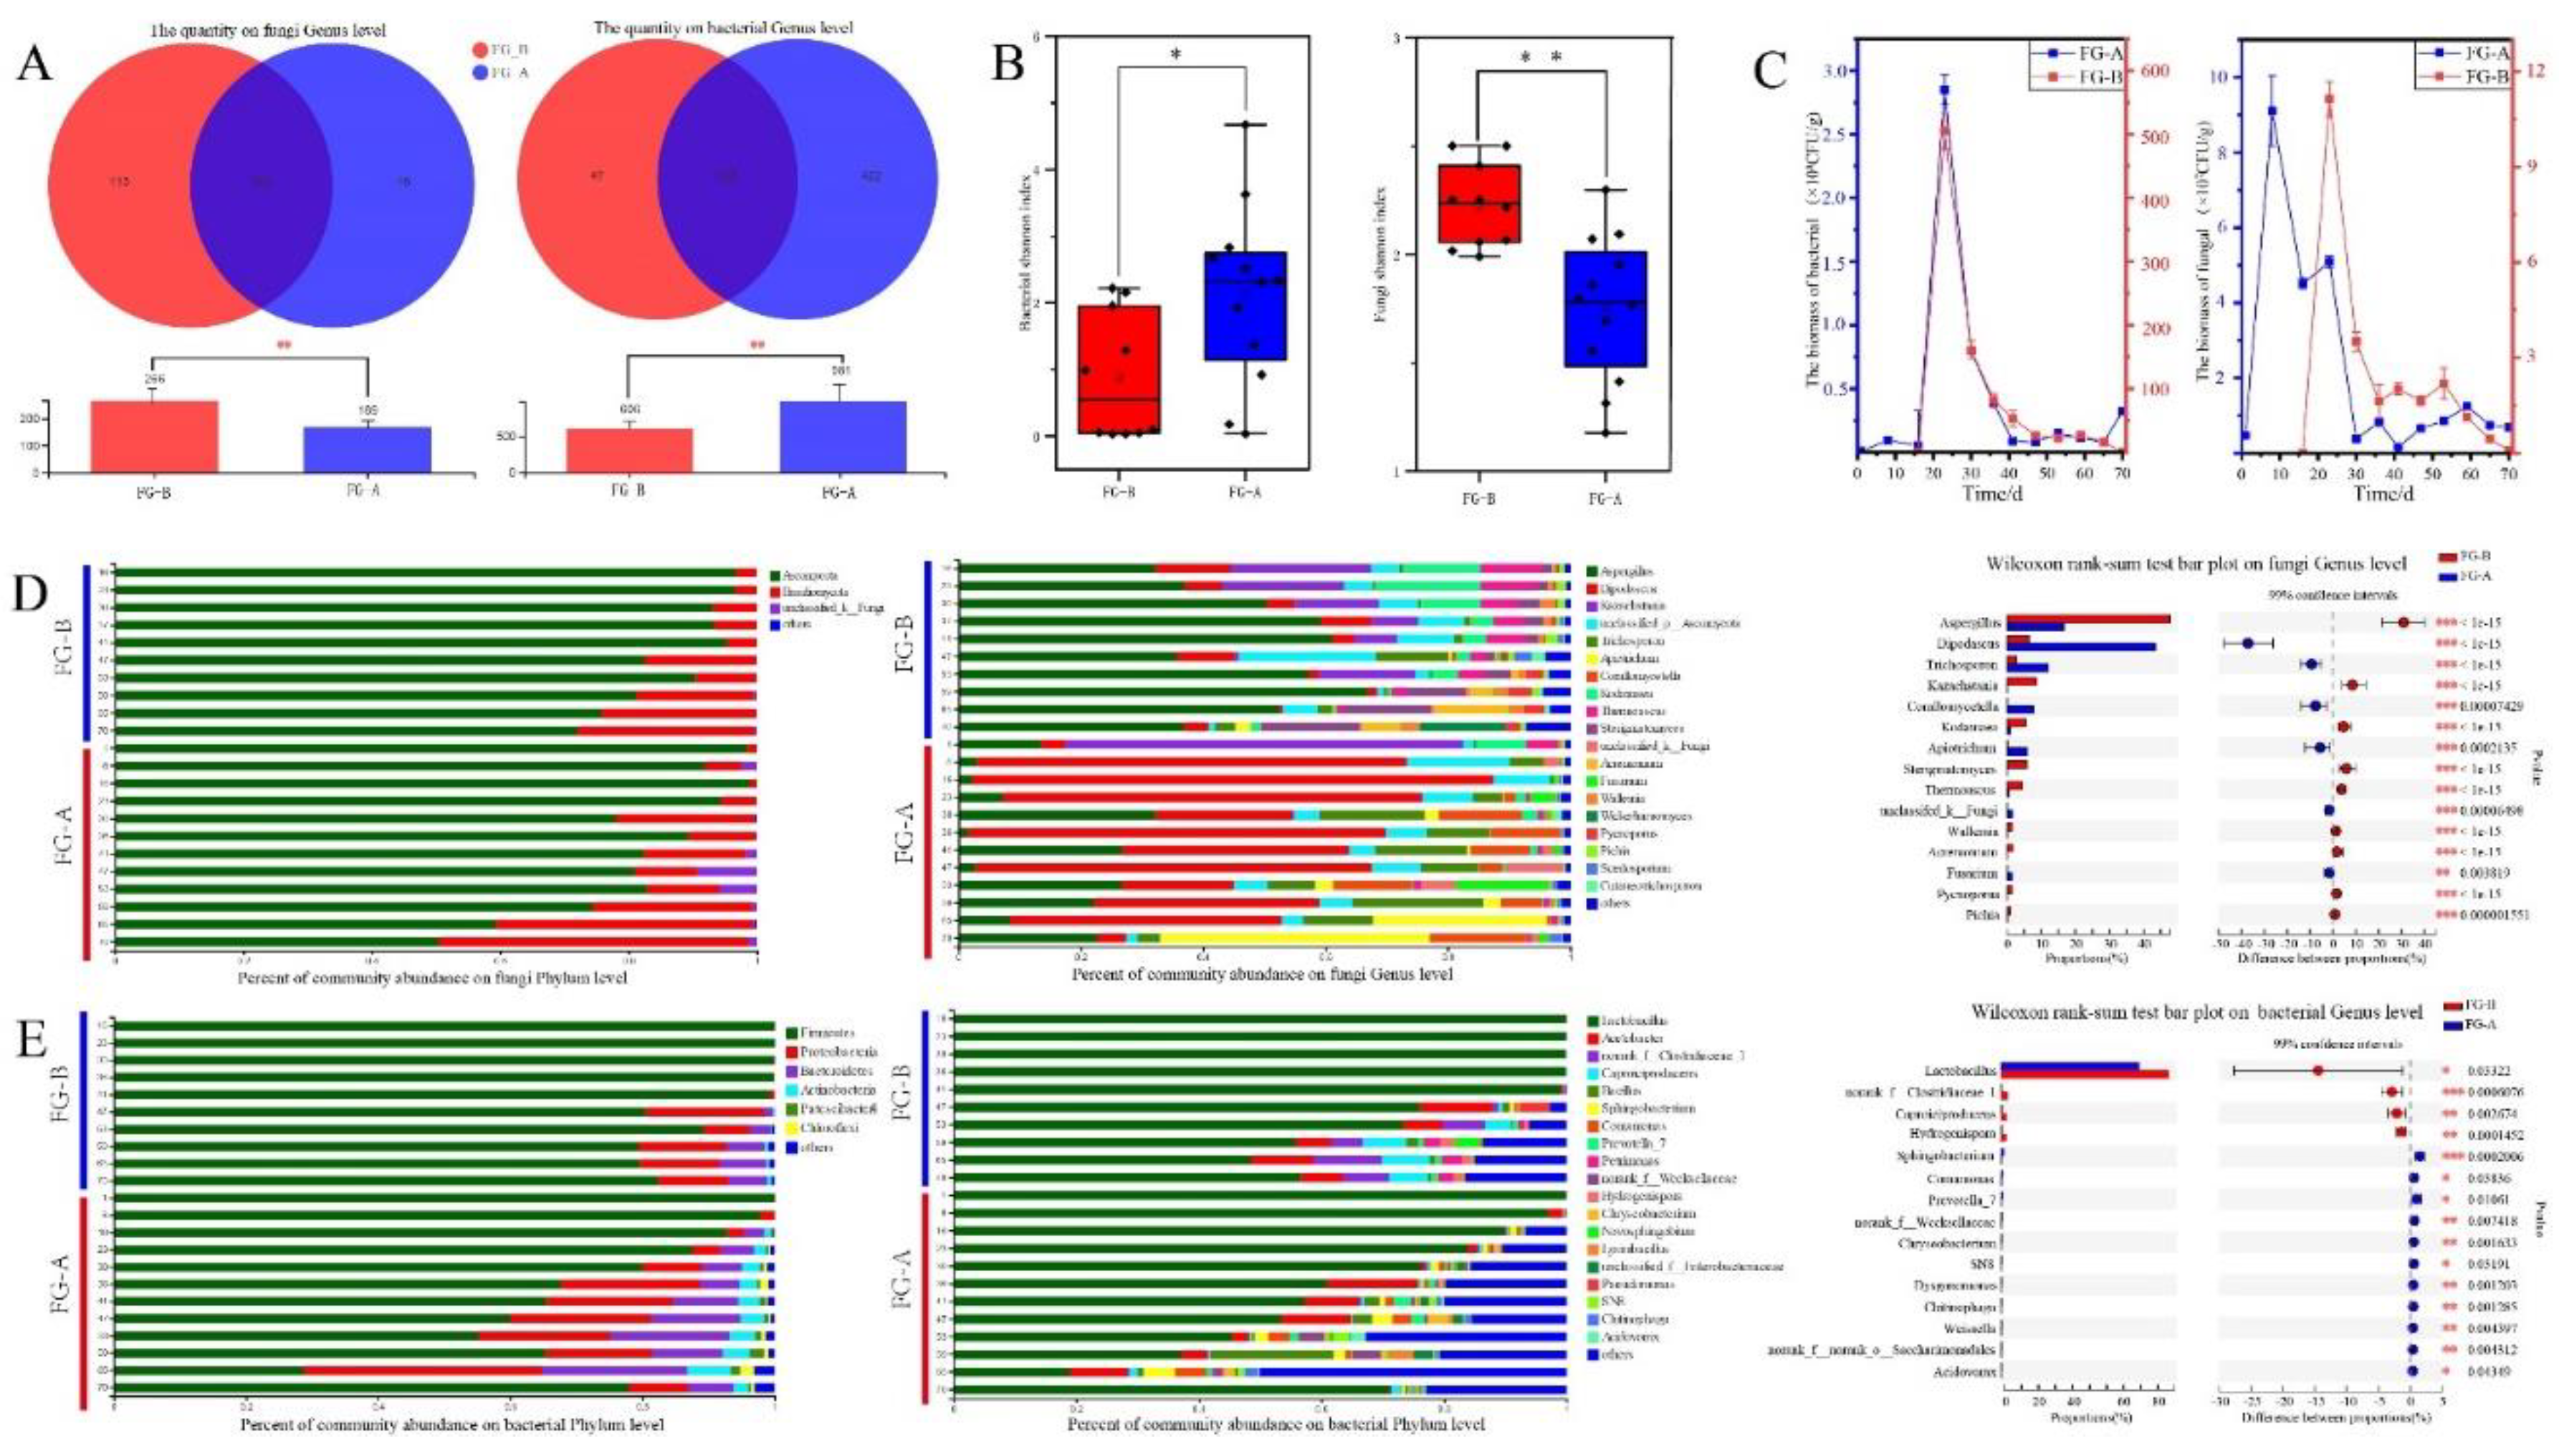
Figure 5.
The relationship among fermentation parameters, flavor and microbial communities in in NongXiangXing Baijiu (NBJ) above (FG-A) and below (FG-B) the Huangshui line. (A) Redundancy analysis (RDA) of microbial community composition and fermentation parameters. (B) Correlation analysis of major fungal genera and fermentation parameters (0.01<*p < 0.05; 0.001<**p < 0.01; ***p < 0.001, as determined by one-way ANOVA). (C). Network analysis of microorganisms and flavor. (D) Correlation analysis of major bacterial genera and short-chain fatty acids (SCFAs) and their esters(0.01<*p < 0.05; 0.001<**p < 0.01; ***p < 0.001, as determined by one-way ANOVA).
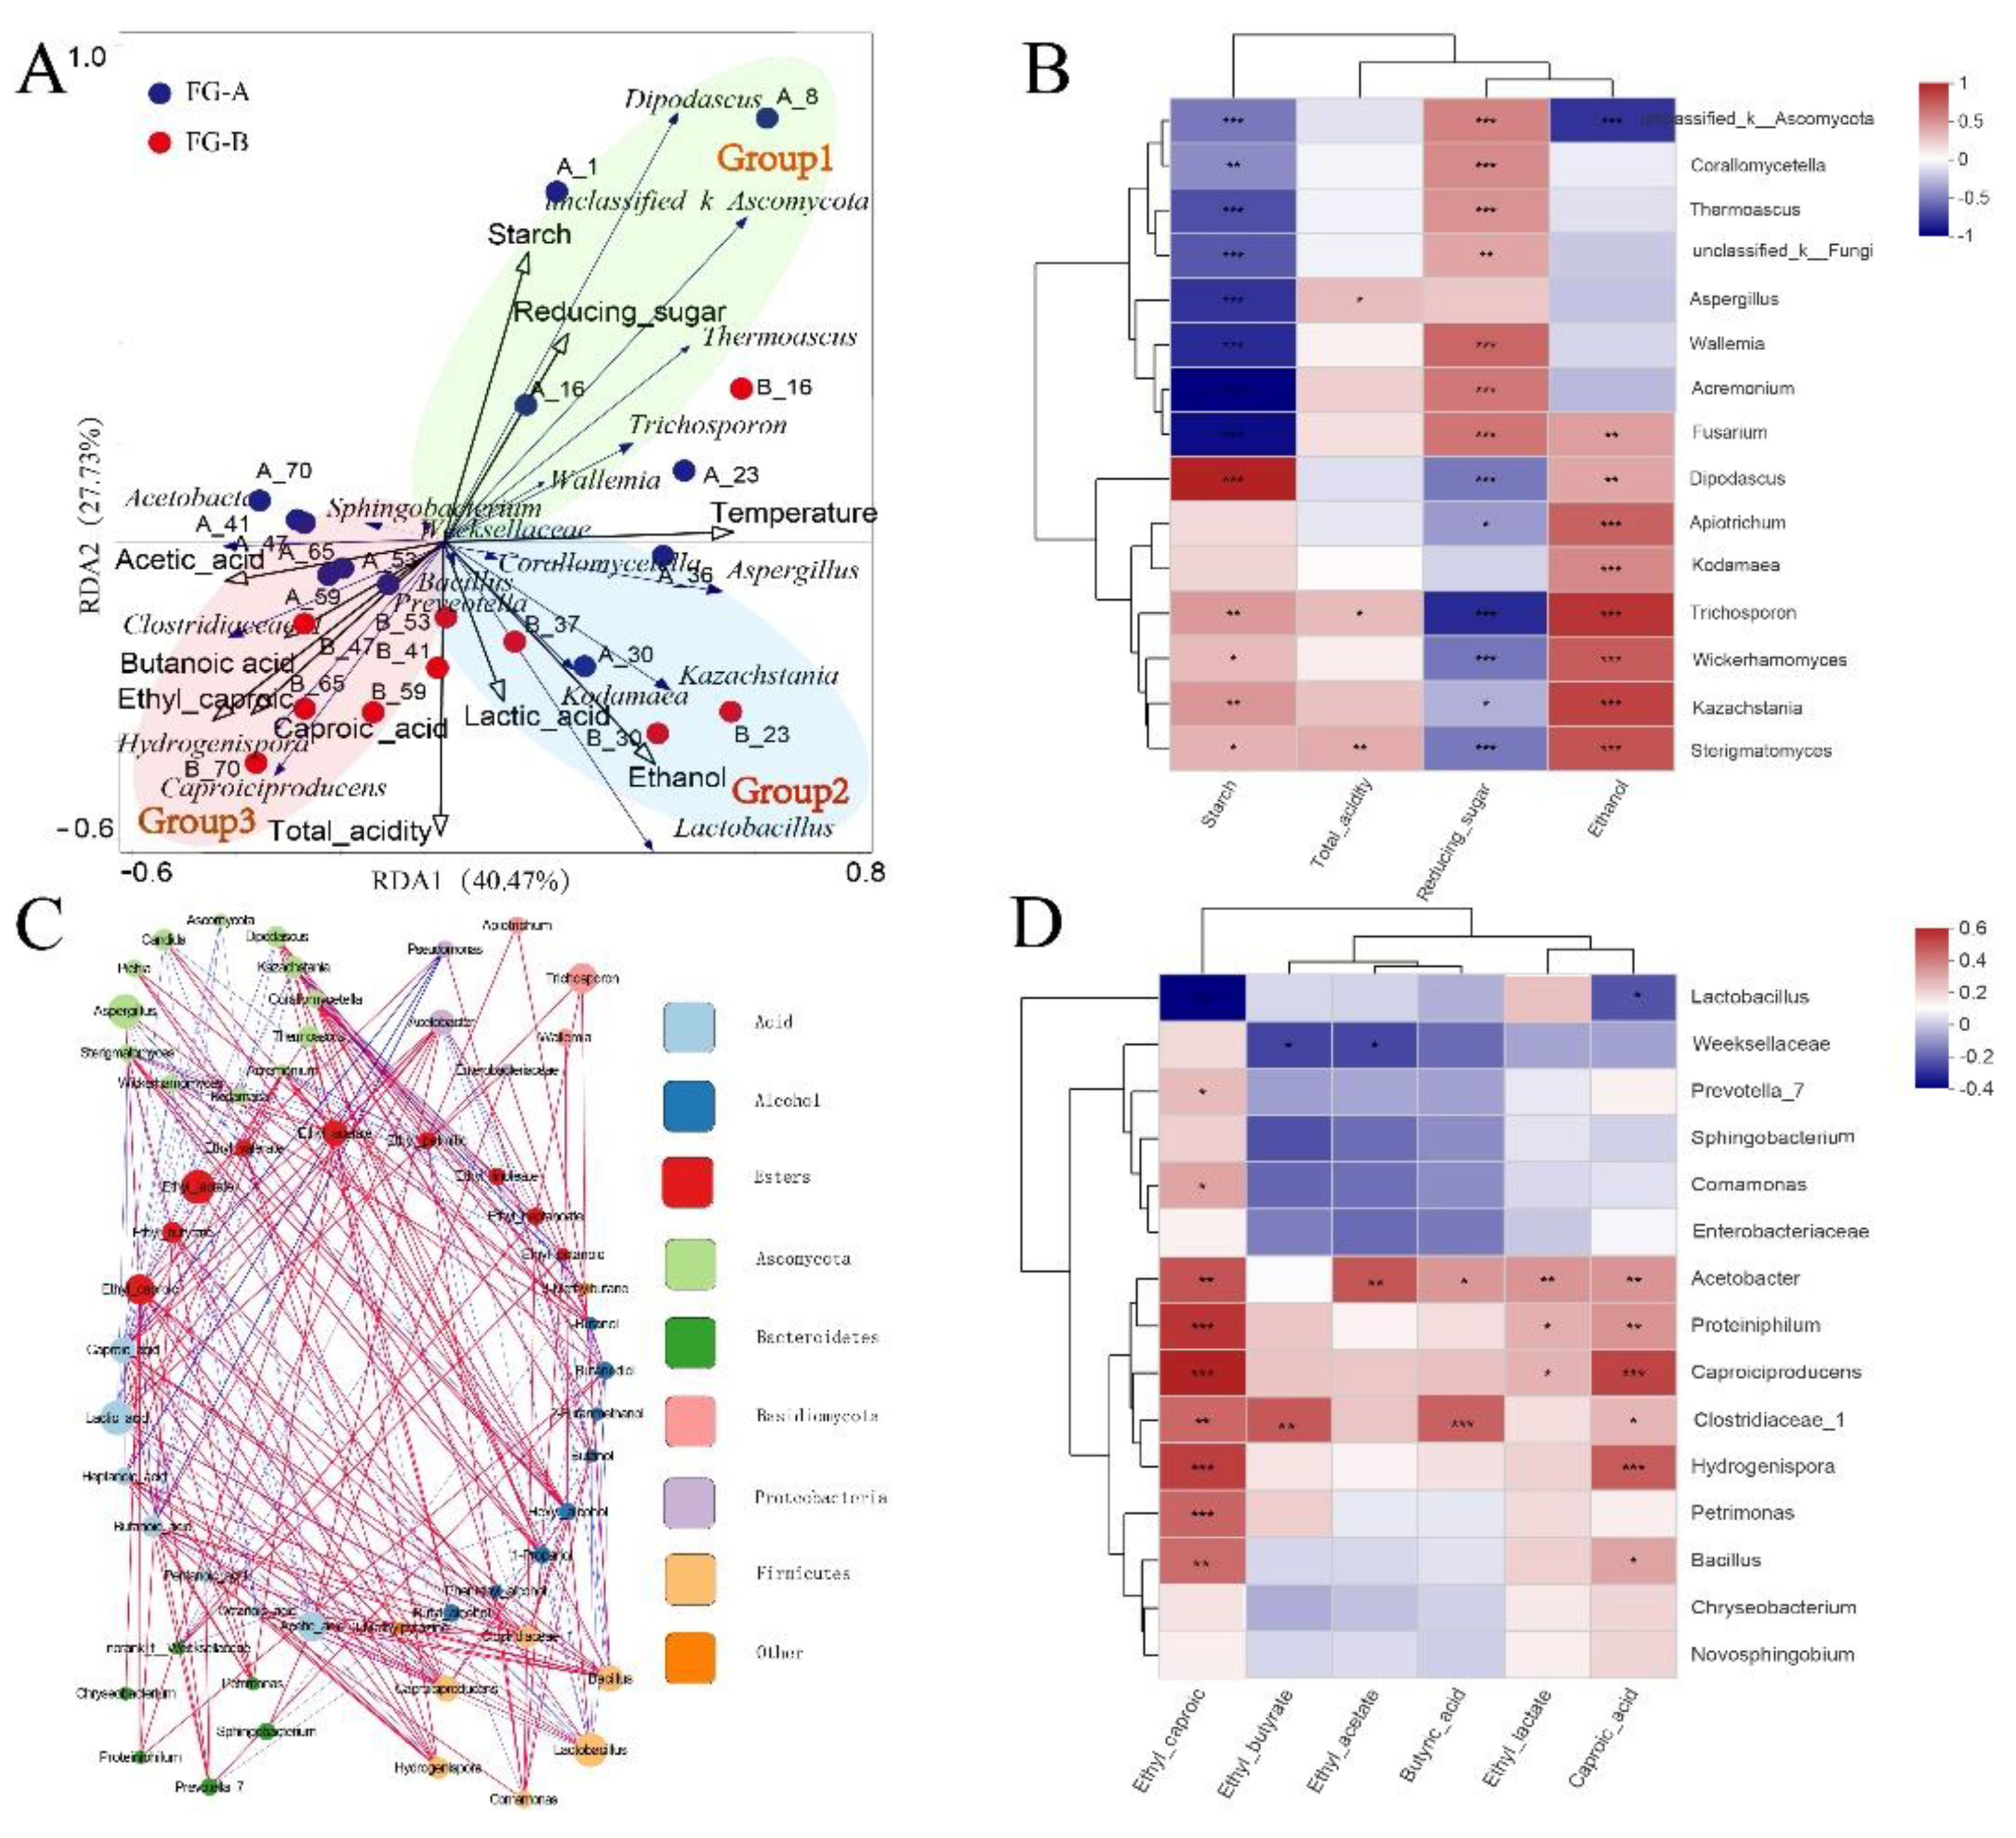
Figure 6.
Potential functions of the microbial community of fermented grains in the production of short-chain fatty acids (SCFAs). (A) SCFAs Metabolic pathways. (B) Differences in the abundance of enzymes involved in SCFAs metabolism in NongXiangXing Baijiu (NBJ) above (FG-A) and below (FG-B) the Huangshui line. . (0.01<*p < 0.05; **p < 0.01, as determined by one-way ANOVA).
Disclaimer/Publisher’s Note: The statements, opinions and data contained in all publications are solely those of the individual author(s) and contributor(s) and not of MDPI and/or the editor(s). MDPI and/or the editor(s) disclaim responsibility for any injury to people or property resulting from any ideas, methods, instructions or products referred to in the content. |
© 2024 by the authors. Licensee MDPI, Basel, Switzerland. This article is an open access article distributed under the terms and conditions of the Creative Commons Attribution (CC BY) license (http://creativecommons.org/licenses/by/4.0/).
Copyright: This open access article is published under a Creative Commons CC BY 4.0 license, which permit the free download, distribution, and reuse, provided that the author and preprint are cited in any reuse.


