Submitted:
03 September 2024
Posted:
04 September 2024
You are already at the latest version
Abstract
Proper blood-brain barrier (BBB) function is essential to maintain homeostasis keeping the central nervous system healthy. Disruption of the BBB has been described in nearly all neurological disease and injury contexts. Given the various physical and metabolic roles of the BBB and gliovascular unit (GVU), dysfunction should be assessed across multiple levels to pinpoint the exact nature of the impairment. Here we describe imaging techniques for evaluating various aspects of BBB and GVU integrity and function, tailored for use in mouse models with protocols for quantitative image analysis. These imaging techniques complement classical dye tracer experiments and reveal underlying molecular causes of BBB dysfunction.
Keywords:
Blood-Brain Barrier
; BBB
; Impairment
; Tight Junctions
; Astrocyte Endfeet
; Endothelial Cells
; Basement Membrane
1. Introduction
The vessels which deliver blood throughout the central nervous system exhibit specialized barrier properties. This barrier restricts and controls the entry of ions, molecules, and cells into the brain from the periphery to protect the brain from potentially harmful substances or toxic concentrations (e.g. concentrations of the excitatory neurotransmitter and amino acid glutamate in the blood are 5-10x higher than in the brain). Yet, the barrier must be permissible to the entrance of oxygen, necessary nutrients, hormones, and other substances important to support and regulate brain function. The exclusionary properties of this blood brain-barrier (BBB) were first described in early rodent dye-tracer experiments [1,2]. Since initial identification of the homeostatic role of the BBB, disruption of BBB integrity and function has been identified as a hallmark of various neurological diseases and injuries, reviewed under [3]. While tracer studies are able to determine whether peripheral factors nonspecifically enter the brain, they cannot distinguish whether leakiness is due to disruption of BBB properties or dysfunction in scar/border-formation by glial cells. Further, the restriction of peripheral factors from the CNS is dependent upon the combined function of endothelial cells, astrocytes, and pericytes, as well as the specialized extracellular matrix secreted by these cells. The selection of protocols described here provides a toolset for assessing multiple aspects of BBB and gliovascular unit (GVU) dysfunction. These methods encompass techniques for the quantification of the distribution of a. BBB proteins expressed within the endothelium (tight junction protein zona occludens-1 (ZO-1) or glucose transporter type 1 (GLUT1), which is part of the metabolic barrier) b. proteins within astrocytic endfeet, including Aquaporin 4 (AQP4), β-Dystroglycan, c. quantification of basement membrane component expression, including Laminin and Collagen IV, and d. quantification of BBB permeability using the glycoprotein fibrinogen, that we have successfully optimized in the last years [4,5]. Additionally provided are methods for the qualitative assessment of tight junctions, astrocytic endfeet, and basement membrane by electron microscopy (EM), as well as astrocytic endfoot coverage of vasculature using astrocyte reporter mice.
2. Materials
2.1. Study of Proteins/Structures Related to BBB and GVU Function
- 1X phosphate buffered saline (PBS), pH 7.3
- 4% paraformaldehyde (PFA), diluted in 1X PBS pH 7.3
- Surgical tools: large surgical scissors, small dissection scissors, curved forceps, spatula (with microspoon), serrated blunt forceps, vaculet blood collection set (see Note 1)
- 15 mL Falcon tubes
- Vibratome
- 24-well plates
- 10X PO4 Buffer, pH 7.2-7.4: 65g NaH2PO4 x H2O, 15g NaOH, 2N HCl, distilled H2O to total volume of 500mL
- Glycerol-based storing solution: 150mL Glycerol, 150mL Ethylene Glycol, 50mL 10X PO4 Buffer pH 7.2-7.4, 150mL distilled H2O
- Rocking platform at room temperature
- Blocking buffer: 10% Normal Goat Serum (NGS), 0.5% Triton X-100, diluted in PBS pH 7.3
- DAPI 1:1000
- Rocking platform at 4ºC
- Paintbrushes
- Positive charged glass microscope slides
- Mounting media (DAPI-free)
- Coverslips
- Clear nail polish
- Epifluorescence microscope
- Confocal microscope
- Image analysis software
- Aldh1l1-tdTomato mice: Tg(Aldh1l1-tdTomato)TH6Gsat
2.2. Evaluation of ZO-1 Expression
- Pepsin solution: 100mg Pepsin, 100mL of 10mM HCl
- Thermomixer
- PBS-T: 150µL Tween-20, 1L of 1X PBS pH 7.3
- 3% H2O2, diluted in millipore H2O
2.3. Electron Microscopy to Assess BBB and GVU Components
- 1X PBS, pH 7.4
- Fixation Solution: 2.5% Glutaraldehyde, 4% PFA in 0.1 M Sodium Cacodylate (Caco) buffer pH 7.4.
- Vibratome
- Dissection microscope
- Tissue Puncher
- 1% Osmium diluted in 0.1M Caco buffer, pH 7.4
- 0.2M Caco buffer, pH 7.4
- Rotator
- Acetone (100%, 95%, 80%, 50% in H2O)
- EPON 812 with accelerator
- Embedding solution: 1 part 100% Acetone to 1 part EPON 812 with accelerator
- Incubator at 60-70º C
- Ultra Microtome
- EM Mesh Grid
- Transmission Electron Microscope
3. Methods
3.1. Assessment of Proteins/Structures Related to BBB and GVU Function
To determine which aspects of BBB or GVU function may be affected (tight junctions, endothelial transporter expression, extracellular matrix and basement membrane, pericytes, or proteins expressed in astrocyte endfeet), immunohistochemistry against proteins involved in these structures and proteins that can permeate a disrupted BBB (e.g. fibrinogen) can be performed (Figure 1) (Table 1). Importantly, while the absence of tight junctional proteins indicates a loss or impairment of tight junctions and thus a broken BBB, astrocyte endfeet proteins such as AQP4 or β-dystroglycan can be absent while endfeet are still present on the vasculature. Their absence may affect the BBB in yet to be determined ways but is not a direct readout for BBB dysfunction. Whether endfeet proteins are absent while endfeet are still in place along the vasculature can be assessed using astrocyte reporter mice, such as Aldh1l1-tdTomato, expressing a fluorescent protein in astrocytes (Figure 1c). Alternatively, astrocyte endfeet coverage can be assessed with electron microscopy (EM) (Figure 2).
- Perfuse the mouse transcardially as described in [6] with PBS (see Note 2) for several minutes (min) until liver is clear of blood. Follow by 4% paraformaldehyde (PFA) perfusion for 7 min or until the tail and neck are stiff.
- Extract the brain from the skull and immerse it in 15 mL Falcon tube with 10 mL of 4% PFA overnight at 4ºC.
- The following day, wash the brain with filtered PBS and store the washed brain in filtered PBS (see Note 3).
- 4. Section the brains using a vibratome in 50 µm slices. Place the slices in PBS for short-term storage at 4ºC. For long-term storage see Note 4.
- Prepare 24 well plate with 300 µL of primary antibodies diluted in blocking buffer (see Note 5). This volume is sufficient for 8-10 slices. Look at Table 1 for antibodies.
- Transfer the slices of one animal to a well with the primary antibody dilution using a paint brush. Leave one section in blocking buffer without primary antibody. This will be the negative control of the staining.
- Incubate the staining overnight at 4ºC on a rocking platform.
- Wash sections three times in PBS, five min per wash (see Note 6).
- Prepare 24 well plate with DAPI and secondary antibody diluted in blocking buffer. The secondary antibody against IgG of the host primary antibody. Every antibody will be conjugated to a fluorophore. Antibodies against different species should not have a fluorophore in the same emission spectrum.
- Transfer the slices to wells with secondary antibody dilution and incubate for 1 hour at room temperature on a rocking platform.
- Wash sections three times in PBS, five min per wash (see Note 6).
- Mount brains on positively charged slides using a paint brush (see Note 7).
- Let the sections dry completely, add fluorescence-protective mounting media and a coverslip that fully covers the sections (see Note 8). Use clear nail polish to coat the edges of the coverslip in order to seal it in place. Let slides dry overnight. If they are not fully dry, the coverslip can move when using oil objectives.
- Acquire images using a confocal microscope, using the negative control of the staining to determine the laser power and photomultiplier gain. Z-stacks encompassing the thickness of the section is recommended. Comparable neuroanatomical regions should be sampled across groups. The imaging strategy may vary depending on the type of experiment, but for having an accurate estimation of expression across the entire cortex, we most often collect a total of five images across 3-5 sections. Laser power and photomultiplier gain must remain constant within the whole experiment. Only stainings within the same batch can be directly compared.
- Images can be processed in image analysis software, such as FIJI. Z-projections are recommended for better visualization and analysis. Different types of analysis can be performed. Some of the most common ones are quantifying fluorescence intensity or distribution of the staining along vasculature. For the latter, we recommend using cluster of differentiation 31 (CD31) staining as a marker for the structure of the vessels.
3.2. Evaluation of ZO-1 Expression
Endothelial cells lining the vasculature within the central nervous system, unlike those in the periphery, are largely not fenestrated and exhibit high levels of tight junctions distributed along vessels [7]. Tight junctions are essential for reducing paracellular transport between the blood and neural tissue [8]. These tight junctions are comprised of several different proteins including ZO-1, with dissociation of ZO-1 from the tight junction complex known to produce increased BBB permeability, reviewed under [9]. Due to the expression pattern of ZO-1 along vessels (Figure 3b), in which it winds around the vessel like a zipper, quantification of ZO-1 staining requires a specifically tailored methodology, as described below (Figure 3).
- Perfuse anesthetized mouse transcardially.
- Extract the brain from the skull and immerse it in 15 mL Falcon tube with 10 mL of 4% PFA overnight at 4ºC.
- The following day, wash the brain with filtered PBS and store the washed brain in filtered PBS (see Note 3).
- 4. Section the brains using a vibratome in 50 µm slices. Place the slices in PBS for short-term storage at 4ºC. For long-term storage see Note 4.
- Prepare in 1.5 mL tubes with pepsin solution (up to 1.4 mL). Prepare one tube per 2-3 brain sections.
- Add sections to the tubes using a paint brush and incubate them for 20 min at 37ºC (no shaking). Make sure that the sections are submerged in the solution (see Note 9 and Figure 4).
- 7.
- Transfer the slices to a 24 well plate and wash the sections in PBS-T two times for 5 min each, rocking at room temperature (see Note 6).
- 8.
- Incubate slices in 3% H2O2 for 10 min at room temperature (with no shaking).
- 9.
- Wash sections three times in PBS, five min per wash (see Note 6).
- 10.
- Incubate anti-ZO-1 primary antibody diluted 1:100 and anti-CD31 1:100 in blocking buffer for at least 48 hours at 4ºC in a rocking platform.
- 11.
- Wash sections three times in PBS, five min per wash (see Note 6).
- 12.
- Incubate in DAPI and fluorescent secondary antibodies against rabbit and rat IgG antibodies for one hour at room temperature.
- 13.
- Wash sections in PBS three times, five min per wash (see Note 6).
- 14.
- Mount brains on positively charged slides using a paint brush. Let sections dry and add fluorescence-protective mounting media and let them dry overnight.
- 14.
- Use a confocal microscope at high magnification, for example 60x, making sure that comparable neuroanatomical regions are sampled across groups. As in the previous section, the imaging strategy may vary depending on the type of experiment, but we recommend sampling multiple regions of interest (ROIs) across several sections. For having an accurate estimation of expression across the entire cortex, we most often collect a total of five images across 3-5 sections.
- 16.
- Open acquired images in image analysis software (for example FIJI) and make a maximum intensity z-projection of all channels.
- 17.
- Split the different channels.
- 18.
- In the ZO-1 channel, threshold the staining and binarize the image. Normally, the automated threshold and binarization of the image analysis software accurately distinguish the signal from background, but the experimenter may need to modify these parameters to ensure that the pixels highlighted correspond to the real staining. For example, this determination can be made based on negative control staining.
- 19.
- Create a new composite image containing the CD31 staining channel, as well as the binarized ZO-1 staining as a separate channel. For this, both images will need to have the same depth (8-bit). For example, in the FIJI software select the image to be converted and click Image > Type > 8-bit.
- 20.
- Use the freehand line tool to trace the ZO-1 signal along the vessel, using the CD31 as a guide and including areas where ZO-1 signal is discontinuous.
- 21.
- Export the gray value of each pixel along the drawn line (pixel values should either be 0 or 255) (see Note 10). To do this in FIJI, select Analyze > Plot Profile > List.
- 22.
- To calculate the percent of vessel length covered by ZO-1, count the number of pixels with a gray value of 255 (these are the ZO-1 positive pixels) and divide it by the total number of pixels comprising the line, following the equation below:
The higher the percentage obtained, the higher the coverage of the vasculature by the tight junction protein ZO-1.
3.3. Electron Microscopy to Assess BBB and GVU Components
Electron microscopy provides the highest resolution assessment of some BBB properties (tight junctions and transcytosis), basement membrane structure and gliovascular unit. It is useful to assess whether astrocyte endfeet cover the vasculature when endfeet proteins localization is impaired. It can be used to quantify transcytosis and assess localization of vesicles within the endothelium (luminal, abluminal). It also allows for a closer look at tight junctions and can help determine structural abnormalities that are impossible to see using IHC combined with light microscopy.
- Transcardially perfuse the anesthetized mouse as described in section 3.1 first with PBS for 5 min followed by fixation solution.
- Extract the brain from the skull and section into 100 - 500 μM slices.
- Under a dissection microscope, capture tissue punches from areas of interest.
- Place tissue punches in fixation solution overnight at 4°C.
- Wash samples 2 times for 15 min in 0.1M Caco buffer, pH 7.4
- Place samples in 1% osmium diluted in 0.1M Caco buffer, pH 7.4 for 50 min at room temperature on a rotator in the dark.
- Wash samples 4 times in 0.2M Caco buffer, pH 7.4.
- Dehydrate samples in 50%, 80%, and 95% acetone in water (5 min at each concentration).
- Wash in 100% acetone for 15 min for 4 times.
- Equilibrate samples for embedding in a solution containing equal parts of 100% acetone and EPON 812 with accelerator on a rotator overnight at room temperature.
- Embed samples in 100% EPON 812 with the accelerator at 60-70°C overnight.
- Cut ultrathin sections.
- Image on a Transmission Electron Microscope (we used a Tecnai T12 120kV to obtain the images in Figure 2).
4. Notes
- Once tools have come in contact with PFA, they can no longer be used for in vivo procedures or with unfixed tissue and cells.
- PBS should be filtered through a sterile 0.2 µm filter.
- Brains can remain stored at 4ºC for months until sliced.
- For long-term storage, slices can be kept in a glycerol-based storing solution. Before starting the staining, wash the slices in PBS twice for 10 min at room temperature in 24 well plates.
- It is important that antibodies raised in the same host are not used at the same time in the staining or it will not be possible to distinguish them. For example, if rabbit anti-GLUT1 is used, any other antibody raised in rabbit should not be used.
- For washing steps, transfer the sections to a different well with the washing solution using a paint brush.
- Prior to mounting all sections, check the staining on one section on the slide in a fluorescence microscope. If it worked, mount all sections. If the staining did not work, identify potential mistakes in following the protocol and repeat antibody staining.
- Make sure that the thickness of the coverslip is compatible with the objective that will be used. Most objectives require coverslips of number 1.5, which have a thickness between 0.16 - 0.19 mm.
- After treatment, slices can be fragile. Handle with care.
- If the values offered by the analysis software differ from 0 or 255, the software is probably interpolating results. Disable this option in your software. Also, make sure that the results are provided in pixels to have discrete values in the distance parameter.
Acknowledgments
The work was supported by the National Institute of Neurological Disorders and Stroke (grant R01NS121145).
References
- Ehrlich P (1885) Das Sauerstoff-Bedürfniss des Organismus: eine farbenanalytische Studie. August Hirschwald.
- Goldmann EE (1909) Die äussere und innere Sekretion des gesunden und kranken Organismus im Lichte der “vitalen Färbung”: Teil 1. H. Laupp.
- Profaci CP, Munji RN, Pulido RS, Daneman R (2020) The blood–brain barrier in health and disease: Important unanswered questions. J Exp Med 217:e20190062. [CrossRef]
- Heithoff BP, George KK, Phares AN, et al (2021) Astrocytes are necessary for blood-brain barrier maintenance in the adult mouse brain. Glia 69:436–472. [CrossRef]
- George KK, Heithoff BP, Shandra O, Robel S (2022) Mild Traumatic Brain Injury/Concussion Initiates an Atypical Astrocyte Response Caused by Blood-Brain Barrier Dysfunction. J Neurotrauma 39:211–226. [CrossRef]
- Marinković P, Godinho L, Misgeld T (2015) Generation of Tissue Sections for Screening Thy1 Mouse Lines. Cold Spring Harb Protoc 2015:pdb.prot087684. [CrossRef]
- Dotiwala AK, McCausland C, Samra NS (2024) Anatomy, Head and Neck: Blood Brain Barrier. In: StatPearls. StatPearls Publishing, Treasure Island (FL).
- Luissint A-C, Artus C, Glacial F, et al (2012) Tight junctions at the blood brain barrier: physiological architecture and disease-associated dysregulation. Fluids and Barriers of the CNS 9:23. [CrossRef]
- Hawkins BT, Davis TP (2005) The Blood-Brain Barrier/Neurovascular Unit in Health and Disease. Pharmacol Rev 57:173–185. [CrossRef]
Figure 1.
Immunohistochemistry for proteins related to BBB and GVU function. Representative images from mouse cortex of (a) glucose transporter type 1 (GLUT1, red) and cluster of differentiation 31 (CD31, cyan), (b) β-Dystrogylcan (β-DG, red) and CD31 (cyan), (c) astrocytic endfeet in reporter mice (Aldh1l1-tdTomato, red) and aquaporin 4 (AQP4, cyan), (d) pan-laminin, (e) collagen IV, and (f) fibrinogen.
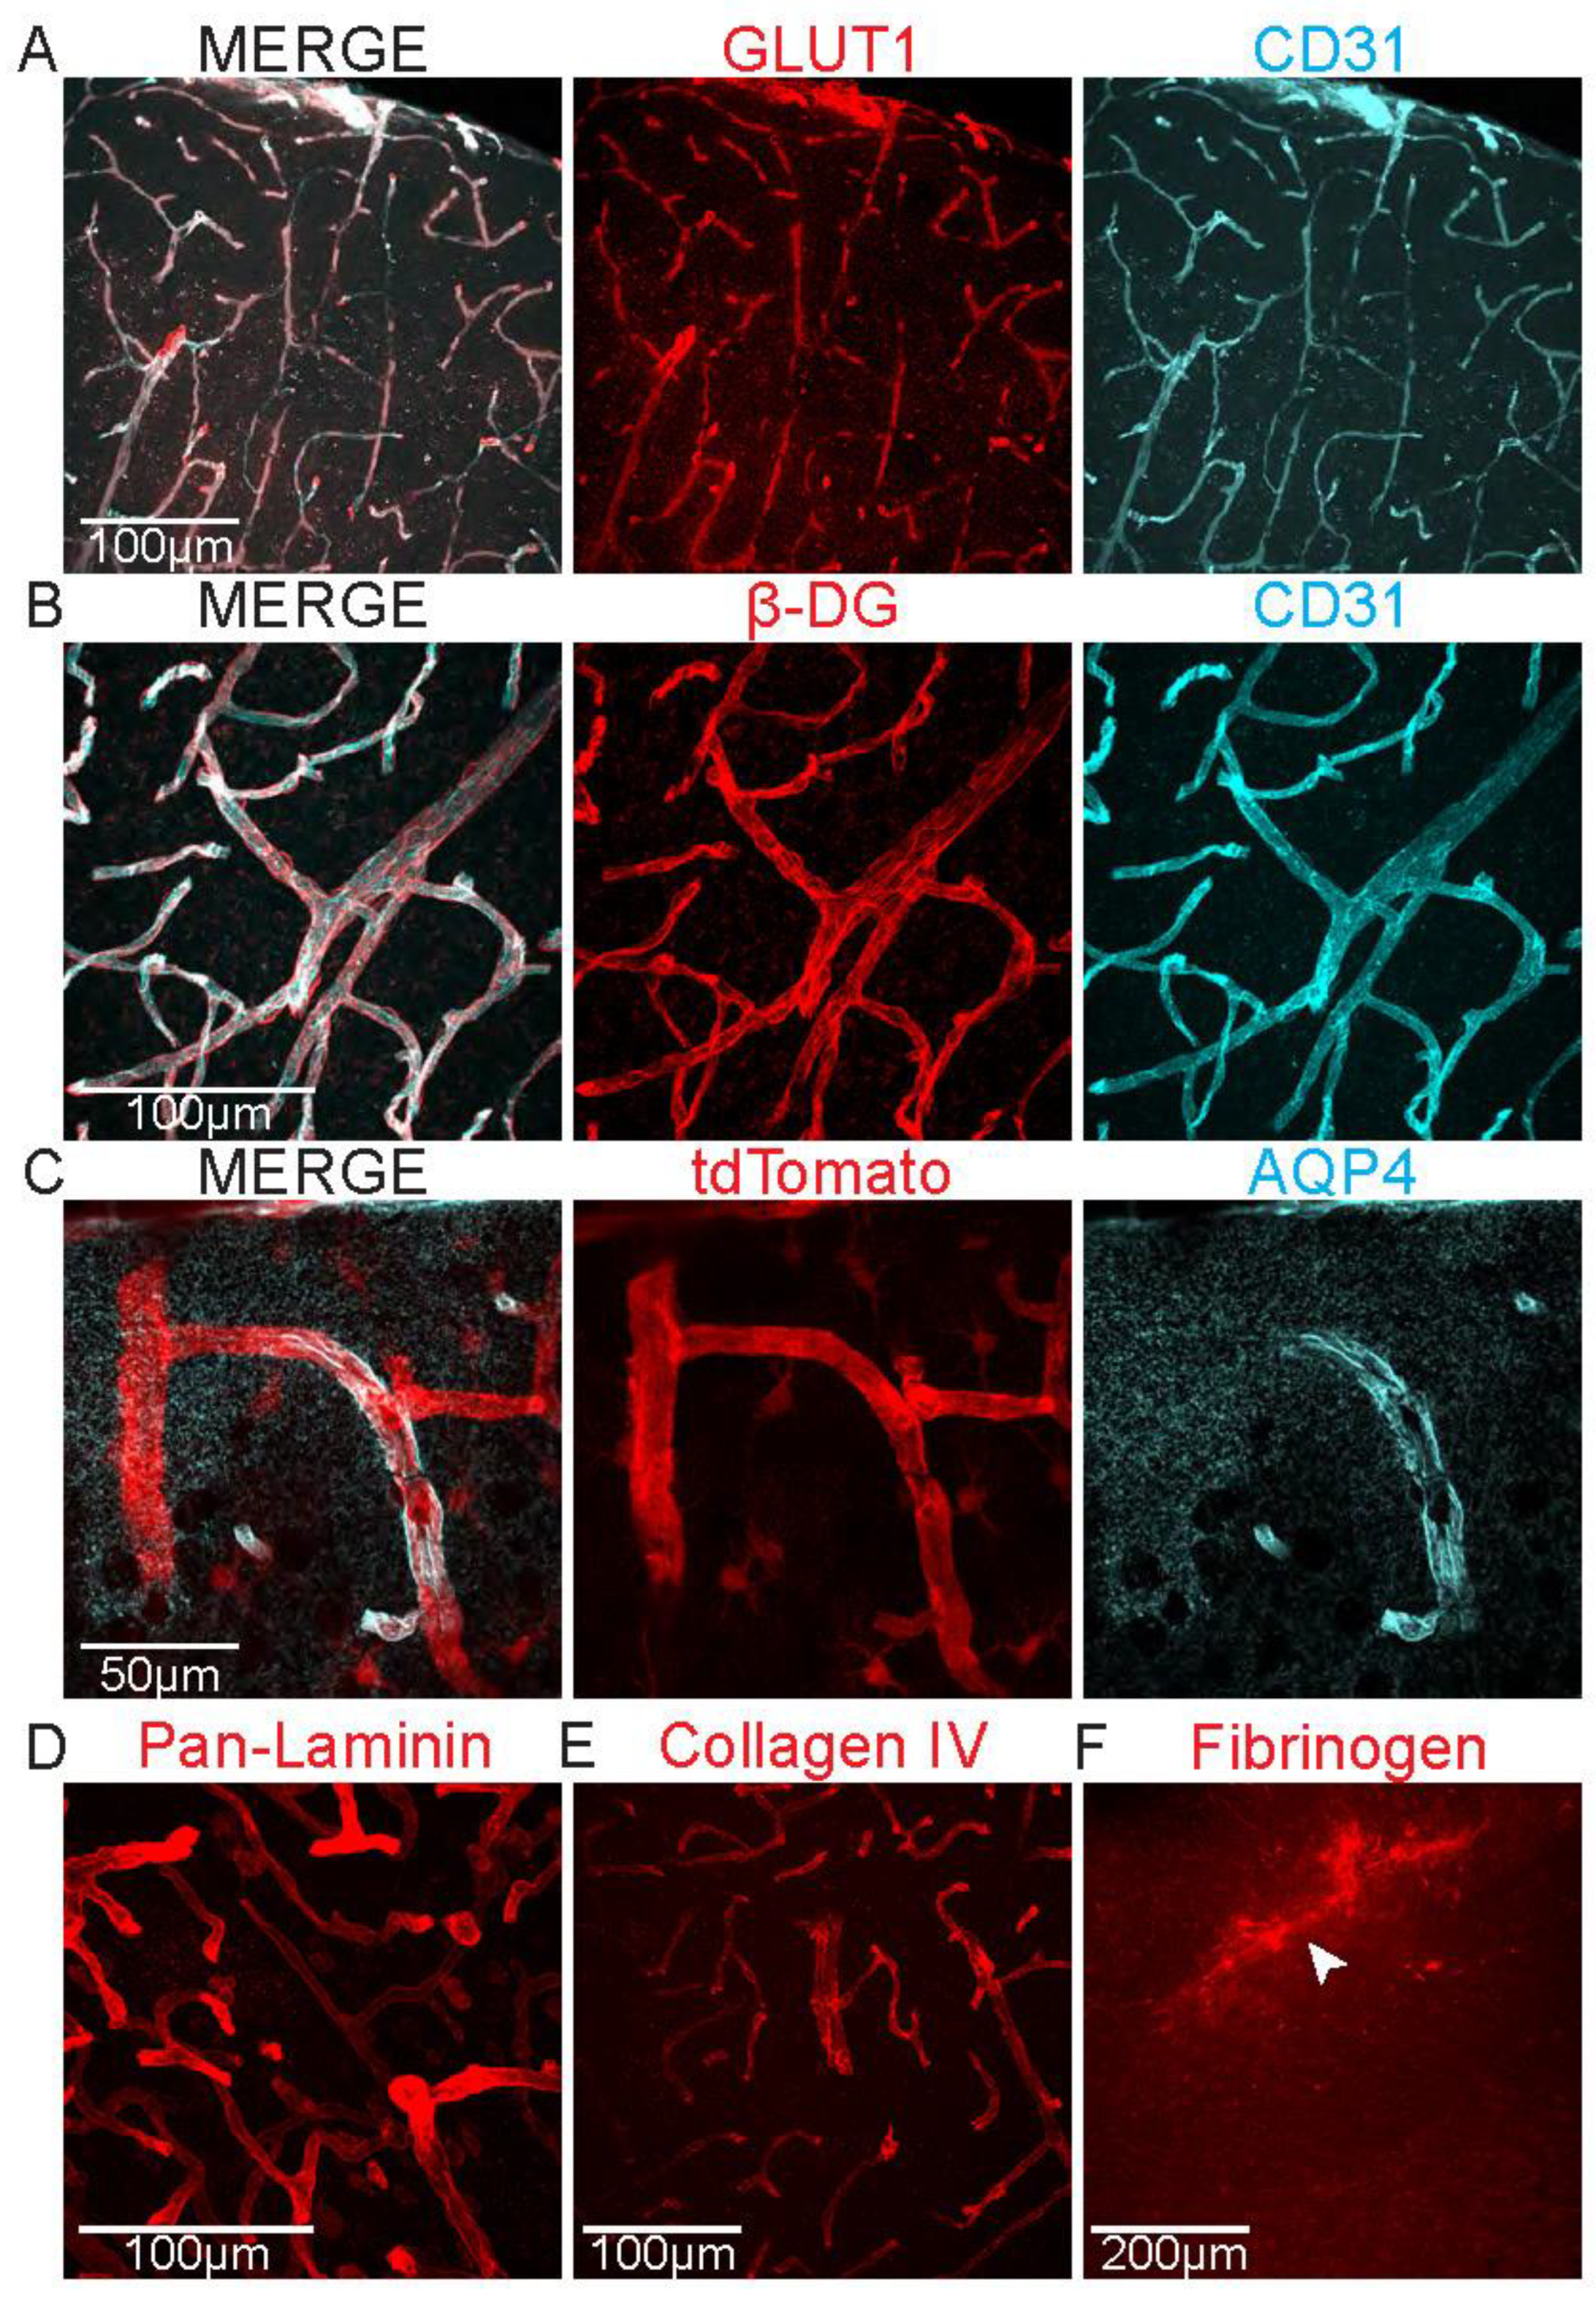
Figure 2.
Electron microscopy for the qualitative assessment of BBB and GVU components. Representative images of (a) astrocytic endfeet (AE) in contact with a vessel, taken at low magnification, (b) basement membrane (BM, red arrows) sandwiched between astrocytic endfeet (AE) and a vessel, captured with mid-range magnification, (c) astrocytic endfeet (AE) and two distinct layers of basement membrane (BM, red arrows) wrapping a vessel with tight junctions (TJ, pink arrows) present at the interface between two adjacent endothelial cells comprising the vessel, also taken with mid-range magnification, and (d) higher magnification image of a portion of the field of view in c, enabling visualization of abluminal vesicles primed for transcytosis (yellow arrows). Basement membrane (BM, red arrows) and tight junctions (TJ, pink arrows) can also be seen clearly at this higher magnification.
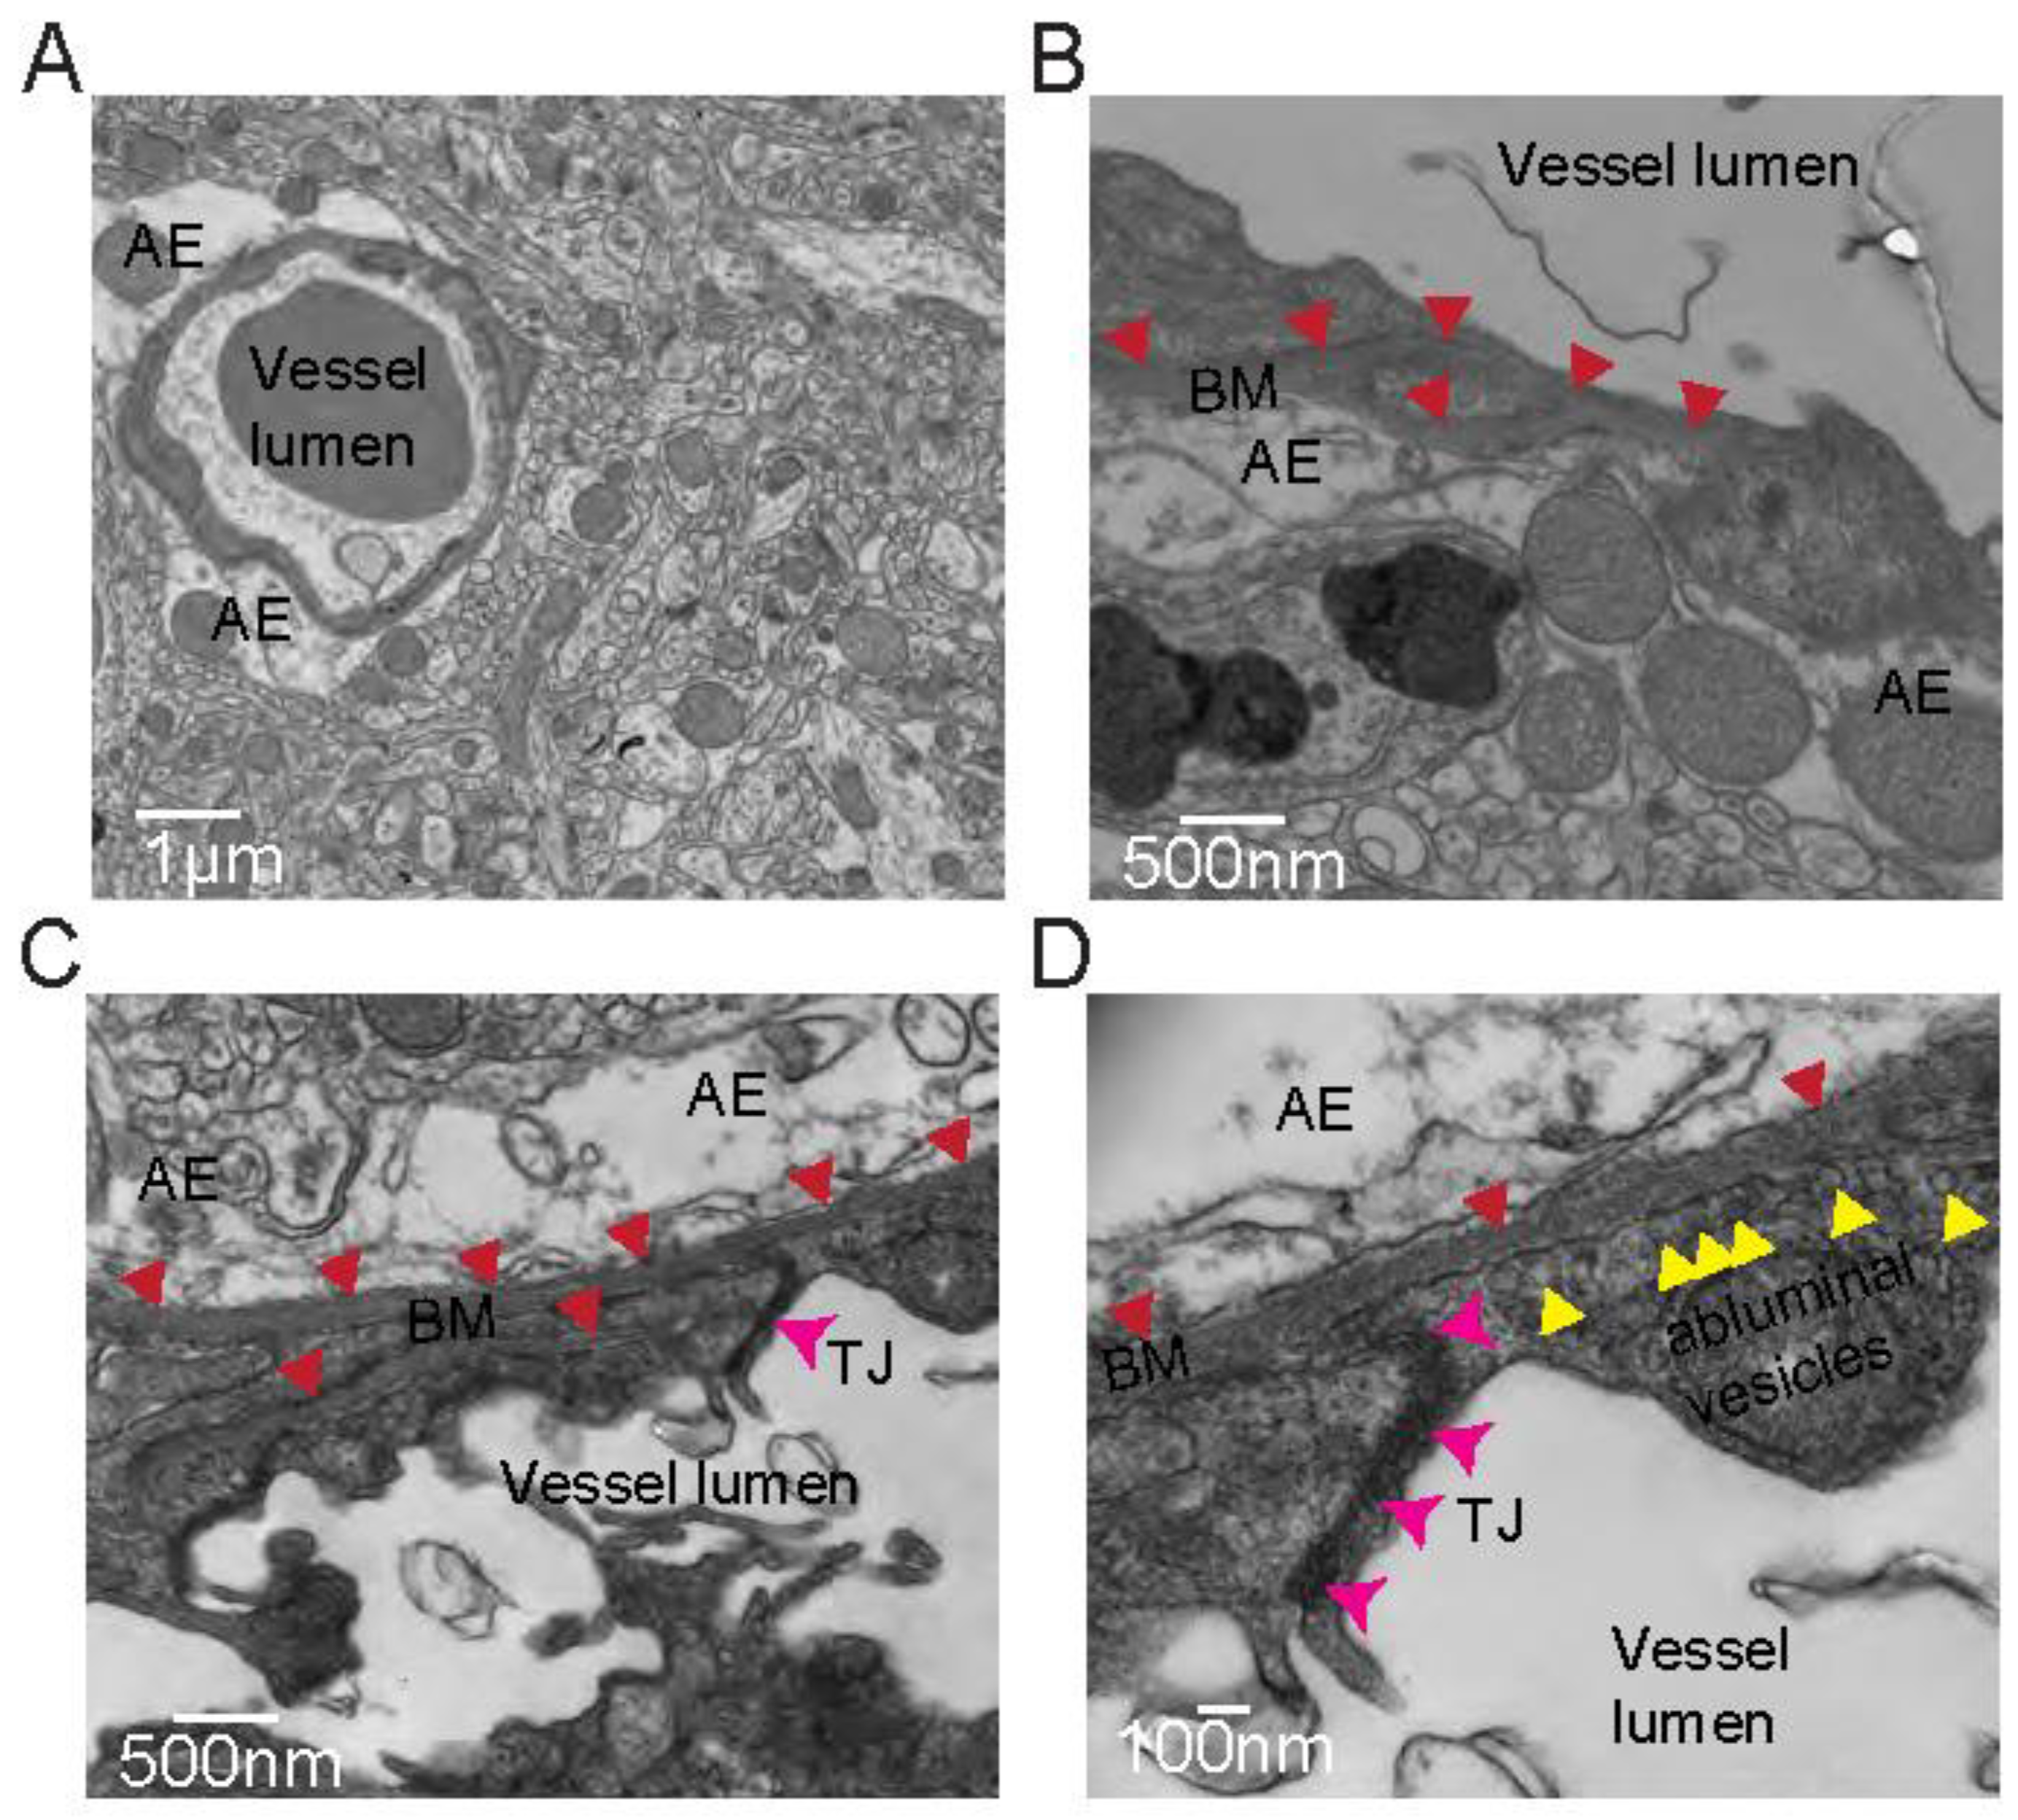
Figure 3.
Step-by-step procedure for quantitative analysis of zona occludens 1 (ZO-1) coverage over a vessel. The panels are in the sequential order needed for the analysis. (a) Initial staining with ZO-1 (red) and CD31 (cyan) in cortex. (b) Image of ZO-1 (red) after splitting the channels. (c) Same image after binarization. Positive pixels (255) are shown in white. (d) Overlap of binarized ZO-1 and CD31. (e) Yellow free-hand line following the profile of ZO-1 over the vessel that will be used to determine the percentage of coverage of ZO-1. The yellow arrows point to the yellow line. (f) Plot profile of the drawn line. It represents the value of each pixel (either 0 or 255) along the distance of the drawn line. Positive pixels get a value of 255 and negative pixels a value of 0. (g) Example of the values taken for each pixel. These values will be entered in the equation 3.2 Step 21.
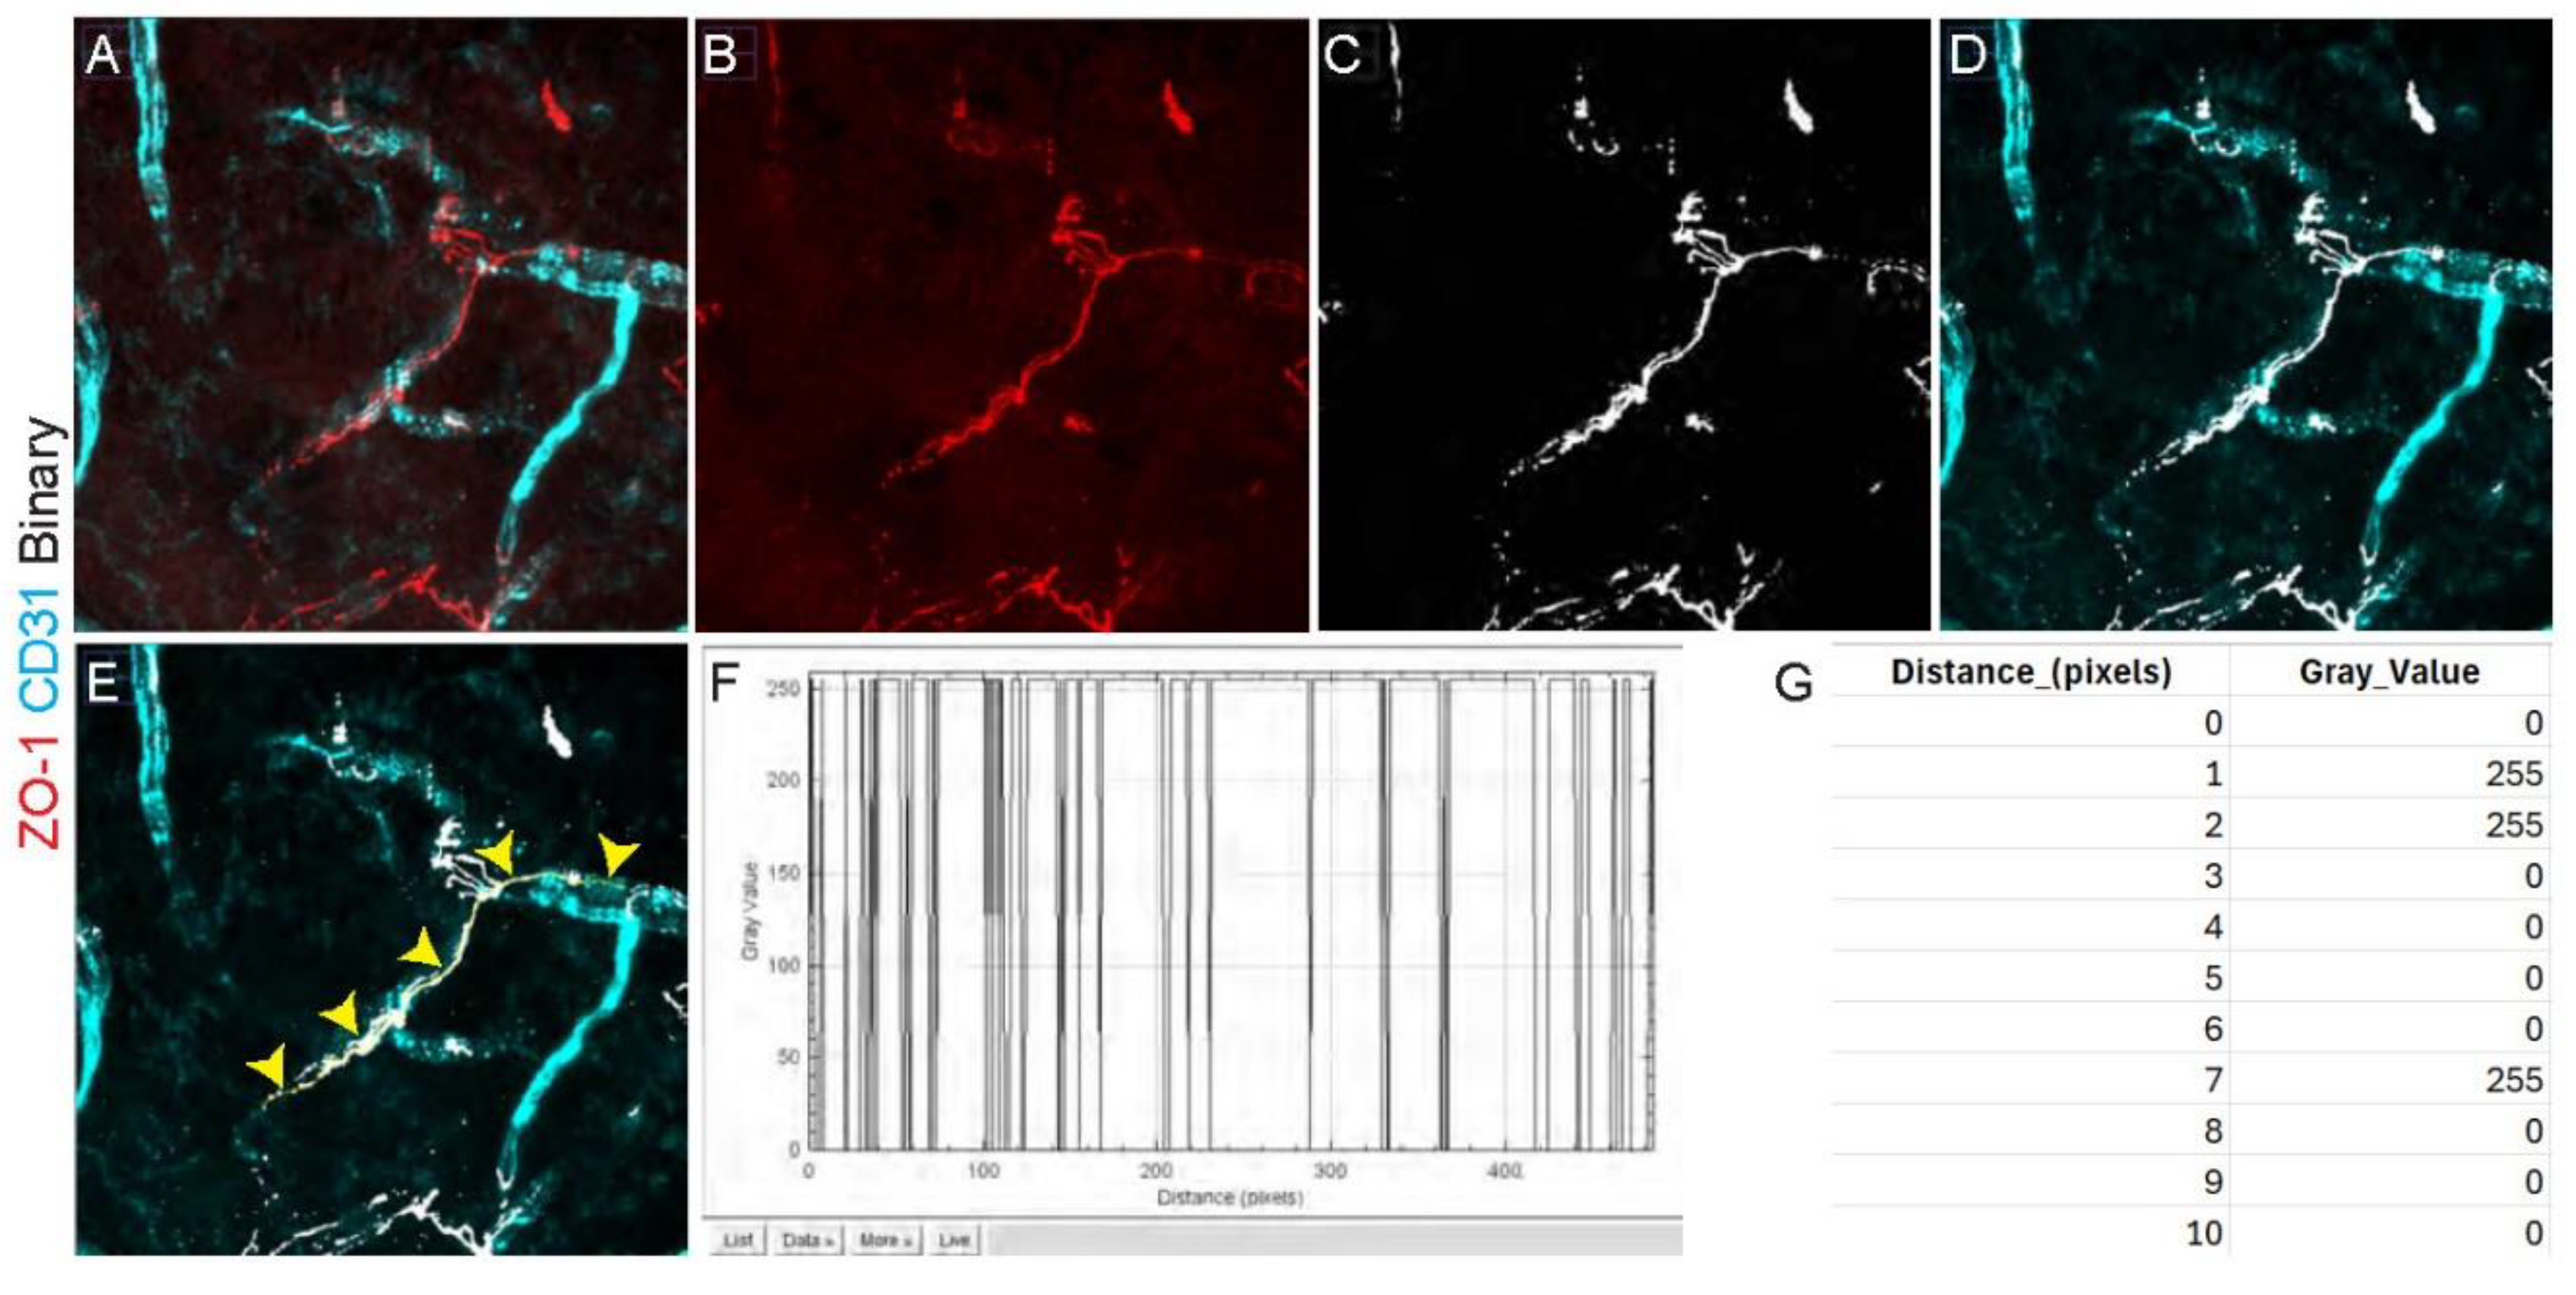
Figure 4.
Immunohistochemistry protocol for zona occludens 1 (ZO-1) staining requires a pre-treatment step in which brain sections are completely submerged in pepsin solution in 1.5mL Eppendorf tubes and subsequently heated at 37º C for 20 min.
Figure 4.
Immunohistochemistry protocol for zona occludens 1 (ZO-1) staining requires a pre-treatment step in which brain sections are completely submerged in pepsin solution in 1.5mL Eppendorf tubes and subsequently heated at 37º C for 20 min.
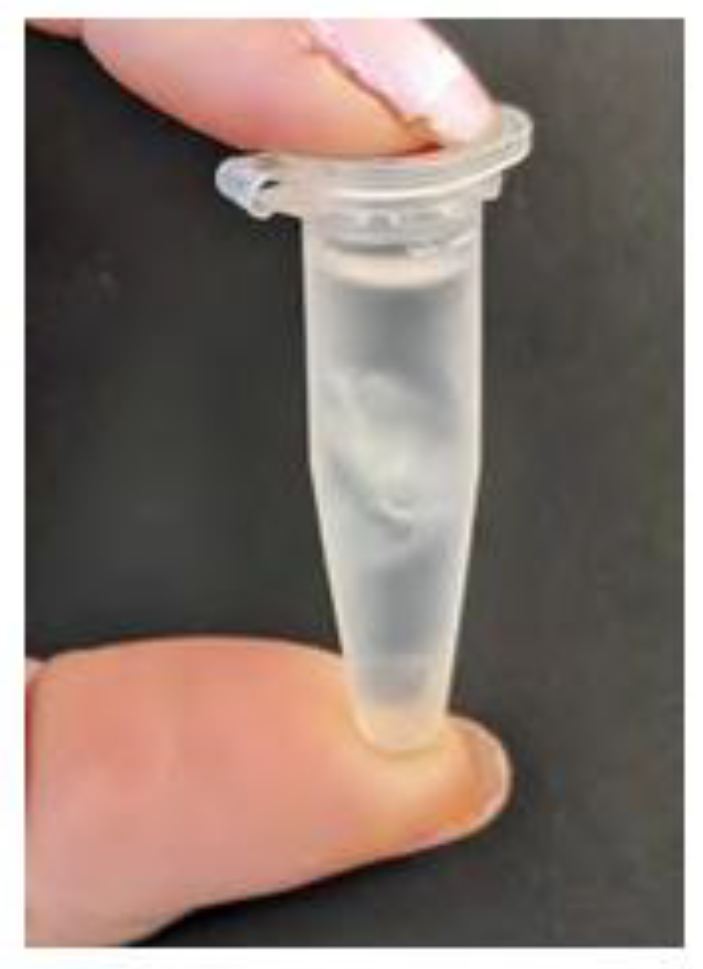

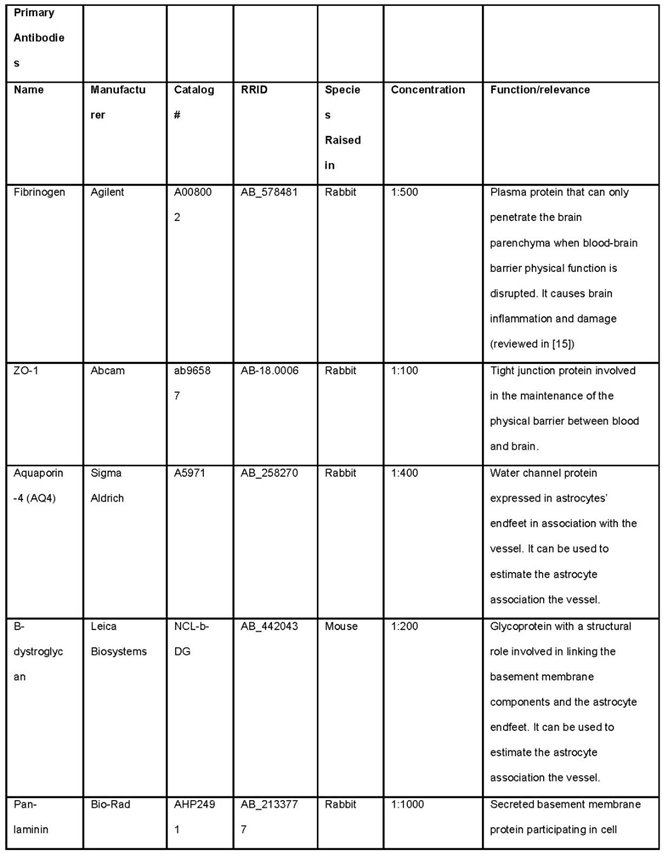
Table 1.
List of primary antibodies required for the outlined methods for analysis of BBB and GVU dysfunction.
Table 1.
List of primary antibodies required for the outlined methods for analysis of BBB and GVU dysfunction.
 |
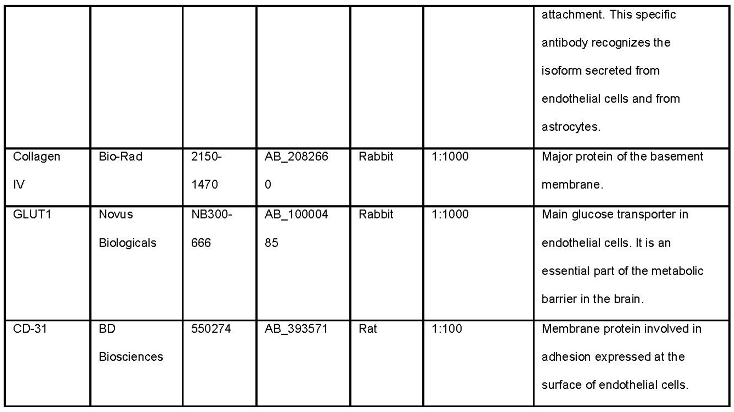 |
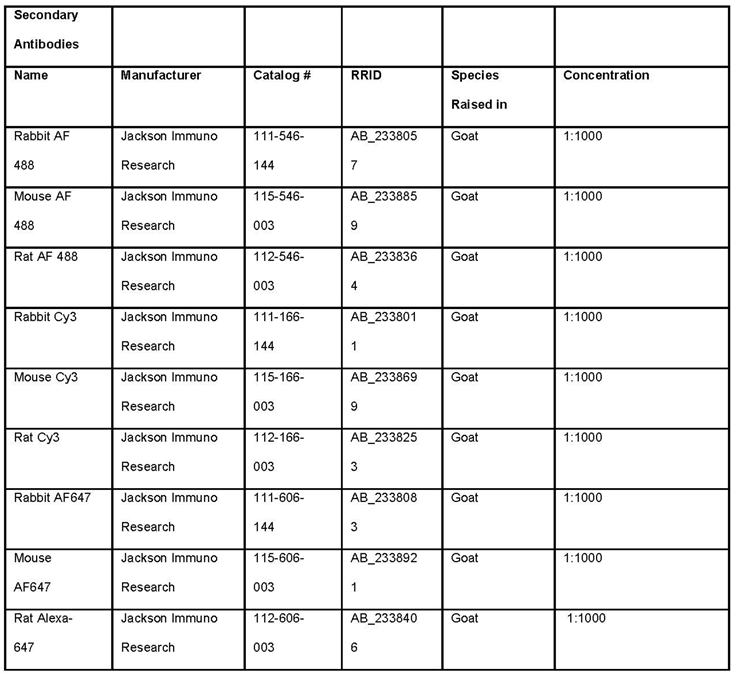
Table 2.
List of secondary antibodies required for the outlined methods for analysis of BBB and GVU dysfunction.
Table 2.
List of secondary antibodies required for the outlined methods for analysis of BBB and GVU dysfunction.
 |
Disclaimer/Publisher’s Note: The statements, opinions and data contained in all publications are solely those of the individual author(s) and contributor(s) and not of MDPI and/or the editor(s). MDPI and/or the editor(s) disclaim responsibility for any injury to people or property resulting from any ideas, methods, instructions or products referred to in the content. |
© 2024 by the authors. Licensee MDPI, Basel, Switzerland. This article is an open access article distributed under the terms and conditions of the Creative Commons Attribution (CC BY) license (http://creativecommons.org/licenses/by/4.0/).
Copyright: This open access article is published under a Creative Commons CC BY 4.0 license, which permit the free download, distribution, and reuse, provided that the author and preprint are cited in any reuse.


