Submitted:
03 September 2024
Posted:
04 September 2024
You are already at the latest version
Abstract
Cooperative and self-enforceable water allocation is a key instrument to manage geopolitical conflict induced by water scarcity, which necessitates concerning the cooperative willingness of the agents and considering their heterogeneity in geography, climate, hydrology, environment and social economy. Based on a multi-indicator system that contains asymmetric information on water volume contribution, current water consumption, water economic efficiency and efforts for eco-environmental protection, this study proposed a water allocation framework by combining the asymmetric power index approach with bankruptcy theory for solving the transboundary water allocation problem under scarcity. The proposed method was applied to the Yellow River Basin in northern China, which is mainly shared by nine provincial districts and frequently suffers from severe water shortage, and its results were compared with six alternative methods. The results highlight the necessity of quantifying agent’s willingness to cooperate under the background of asymmetric negotiation power when making decisions on transboundary water allocations. The proposed method allows to perform transboundary water allocations through simultaneous consideration of the agent’s cooperation willingness, asymmetric negotiation power as well as disagreement allocation points, which ensure the stability, fairness and self-enforceability of allocation results. Therefore, it can offer practical and valuable decision-making insights for transboundary water management under water scarcity.
Keywords:
transboundary water allocation
; asymmetric power index approach
; bankruptcy theory
; water scarcity
; Yellow River Basin
1. Introduction
Water resources are fundamental and strategic natural resources that support high-quality socio-economic development and maintain eco-environmental health [1,2]. Nowadays, intense anthropocentric activities and climatic changes have collectively exerted heavy pressure on the freshwater resources system, inducing serious water deficits and deteriorated aquatic ecosystems in the world. According to the United Nations, by 2025, around 1.80 billion people will face severe water scarcity [3,4], and two-thirds of the global population will live without sufficient clean water [5]. Therefore, it is desired to propose effective tools for dealing with water scarcity to achieve the global water security agenda (SDG 6) [6].
Freshwater resources, especially in transboundary river systems, usually have the attributes of quasi-public goods, that is, non-excludability and competitiveness. It not only emphasizes that the involved agents enjoy equal rights to extract and use this public resource, but also means that any of their unilateral actions may pose negative externalities on others or/and the whole system [7]. In the absence of a prudent co-management regime, water allocation conflict seems inevitable, especially when the transboundary river system encounters severe drought. The situation presumably further worsens as the number of stakeholders with competitive or even conflicting water use objectives increases. Water right allocation is commonly recognized as the main instrument to deal with water shortage and its associated conflicts [8] in the transboundary river context. Nevertheless, it is sophisticated and intractable to accomplish this task successfully since it often involves multiple institutionally-independent decision-making agents [9] with disparate social, economic, and political status and needs [10].
Nowadays, numerous conflict resolution methods derived from various interdisciplinary theories and technologies have been used to facilitate water allocation under water scarcity. Mathematical programming-based methods, such as linear programming [11], non-linear programming [12], dynamic programming [13], quadratic programming [9], multi-objective programming [14], etc., focus on finding the Pareto-optimal solution by maximizing or minimizing the pre-specified primary objective. Nevertheless, it is usually difficult to describe the complex water resources system with objective functions, and meanwhile “the curse of dimensionality” actually may result in a system without an optimal solution [15]. In addition, achieving Pareto-optimal solutions may not be feasible in a real transboundary water management setting due to it allocates water resources only from the social planner’s view without considering the individual rationality [7], strategic interactions [16], and asymmetric external power [10] of local decision-makers.
Game theory-based methods, including non-cooperative game and cooperative game, can provide appropriate frameworks for analyzing water allocation conflict problems by capturing the interactions between agents and reproducing the allocation scenarios under different strategies. The non-cooperative game-based methods, such as the graph theory model, Rubinstein bargaining model, fallback bargaining model, Stackelberg leader-follower game model, etc., generally focus on investigating the strategic behaviors among agents and evaluating feasibility of discrete solutions with qualitative information [17], and allow to offer valuable strategic insights for conflicts resolution in transboundary water allocation [18,19,20,21]. Nevertheless, the widespread application of these methods is limited by their qualitative discrete results [17], high dependence on agent’s risk preference and foresight level [1,7] as well as available information quality [21]. The cooperative game, such as the Shapely Value, Nash-Harsanyi solution, Nucleolus, etc., allow to resolve water conflicts and ensure water efficient utilization by establishing benefit compensations between agents through simultaneous consideration of individual rationality, group rationality and Pareto efficiency [1,7,16,22,23,24,25]. However, conceptualizing the transboundary water allocation problem as a cooperative transferable utility game usually is complicated and challenging due to it highly depends on the transparent and reliable utility information of all agents [17]. Besides, when the transboundary rivers encounter water shortages, the zero-sum game mentality may drive agents to compete for limited water resources instead of computing coalition gains and pursuing some kind of benefit compensation.
In recent years, the bankruptcy theory-based methods, such as the Proportional, Constrained Equal Awards, Constrained Equal Losses, Adjusted Proportional, Talmud, Piniles, etc., have been applied to resolve water allocation conflicts [8,15,17,26,27,28]. Based on common sense [9,28], these methods ration the water resources among the agents directly with respect to their water claims, irrespective of their utility information functions and incremental benefits of cooperation [17], and thereby they are relatively simple and can be easily used by agents and policy makers to address water sharing problems [15]. As described earlier, however, sharing transboundary water resources under scarcity often involve synthesizing far more influencing factors than general enterprise bankruptcy problems, these methods are not sufficient to address this problem as they assume that all agents have homogeneous water contribution, current water consumption, water economic efficiency and efforts for eco-environmental protection.
Equity normally is recognized as the most cardinal principle for water resources planning and management, and related research is gradually emerging [29,30,31,32]. At present, no agreement regarding the general definition of this criterion has been reached yet in the field of public resource management. In economics, equity often coincides with the concept of distributive justice [33], emphasizing on the implementation of egalitarian distribution to ensure all the participants’ expectations are satisfied [34]. Apparently, it is unscientific and irrational to allocate public resources based on egalitarianism [35]. On one hand, it is quite possible that resource shares allocated to some agents by this method exceed their claims, which violates the claim-boundedness principle [7]. On the other hand, agents in the transboundary resources system often present significant differences in terms of geography, socio-economy and environment, which indicates that the assumption symmetry between them seems unrealistic in water allocation problems [8].
The decision outcome of “prisoner’s dilemma game” proves that in the absence of effective agreements, rational decision-makers often tend to choose stable solutions rather than the most efficient solution at the system level [10]. Consequently, concerning the cooperative willingness of the agents and capturing their strategic interactions are the key instrument to settle water geopolitical conflict. The Shapley-Shubik power index method [36] can quantitatively simulate agent’s cooperation willingness, providing a good mathematical framework for identifying stable solutions for shared resources allocations. Since Loehman et al. [37] used this index method to select stable solutions for wastewater treatment cost allocation, it has been widely applied and gained a good reputation in the water resources management [1,17,23,38,39,40]. However, this method still remains the following limitations for successful transboundary water management. For one thing, it is mainly applied in the cooperative game theory literature to identify the most stable solutions from the discrete domain [10], while only a few researchers [10,39,40] employ it to develop continuous solutions for water allocations. For another, agent’s power asymmetries [41,42] (or referred to as external power [7,10] and bargaining power [1,16] and their disagreement utility points, which ensure fairness and self-enforceability respectively, are not simultaneously concerned and included when using this index method to seek continuous water allocation solutions.
To this end, based on a multi-indicator system that contains asymmetric information on water volume contribution, current water consumption, water economic efficiency and efforts for eco-environmental protection, this study proposes a water allocation framework by combining the asymmetric power index approach with the bankruptcy theory for resolving the transboundary water allocation problem under water scarcity. Subsequently, it is applied to the Yellow River Basin, which is mainly shared by nine provincial districts and frequently faces water shortages, for demonstrating the effectiveness by comparing with six alternative methods.
2. Methods
In this study, a hybrid water allocation method is proposed by combining the asymmetric power index approach with bankruptcy theory to tackle the transboundary water allocation problem under scarcity. Figure 1 briefly presents the methodological flowchart of the proposed water allocation method. It includes the following detailed steps:
Step 1. Collect basic data information on transboundary water allocation system.
Basic data information on transboundary water allocation includes the decision-making agents involved and their climatic, geographical, hydrological, ecological, socio-economic, water consumption data, and analyze the mismatch of water availability and claim based on the available water quantity and water demand.
Figure 1.
Methodological flowchart of the proposed water allocation method.
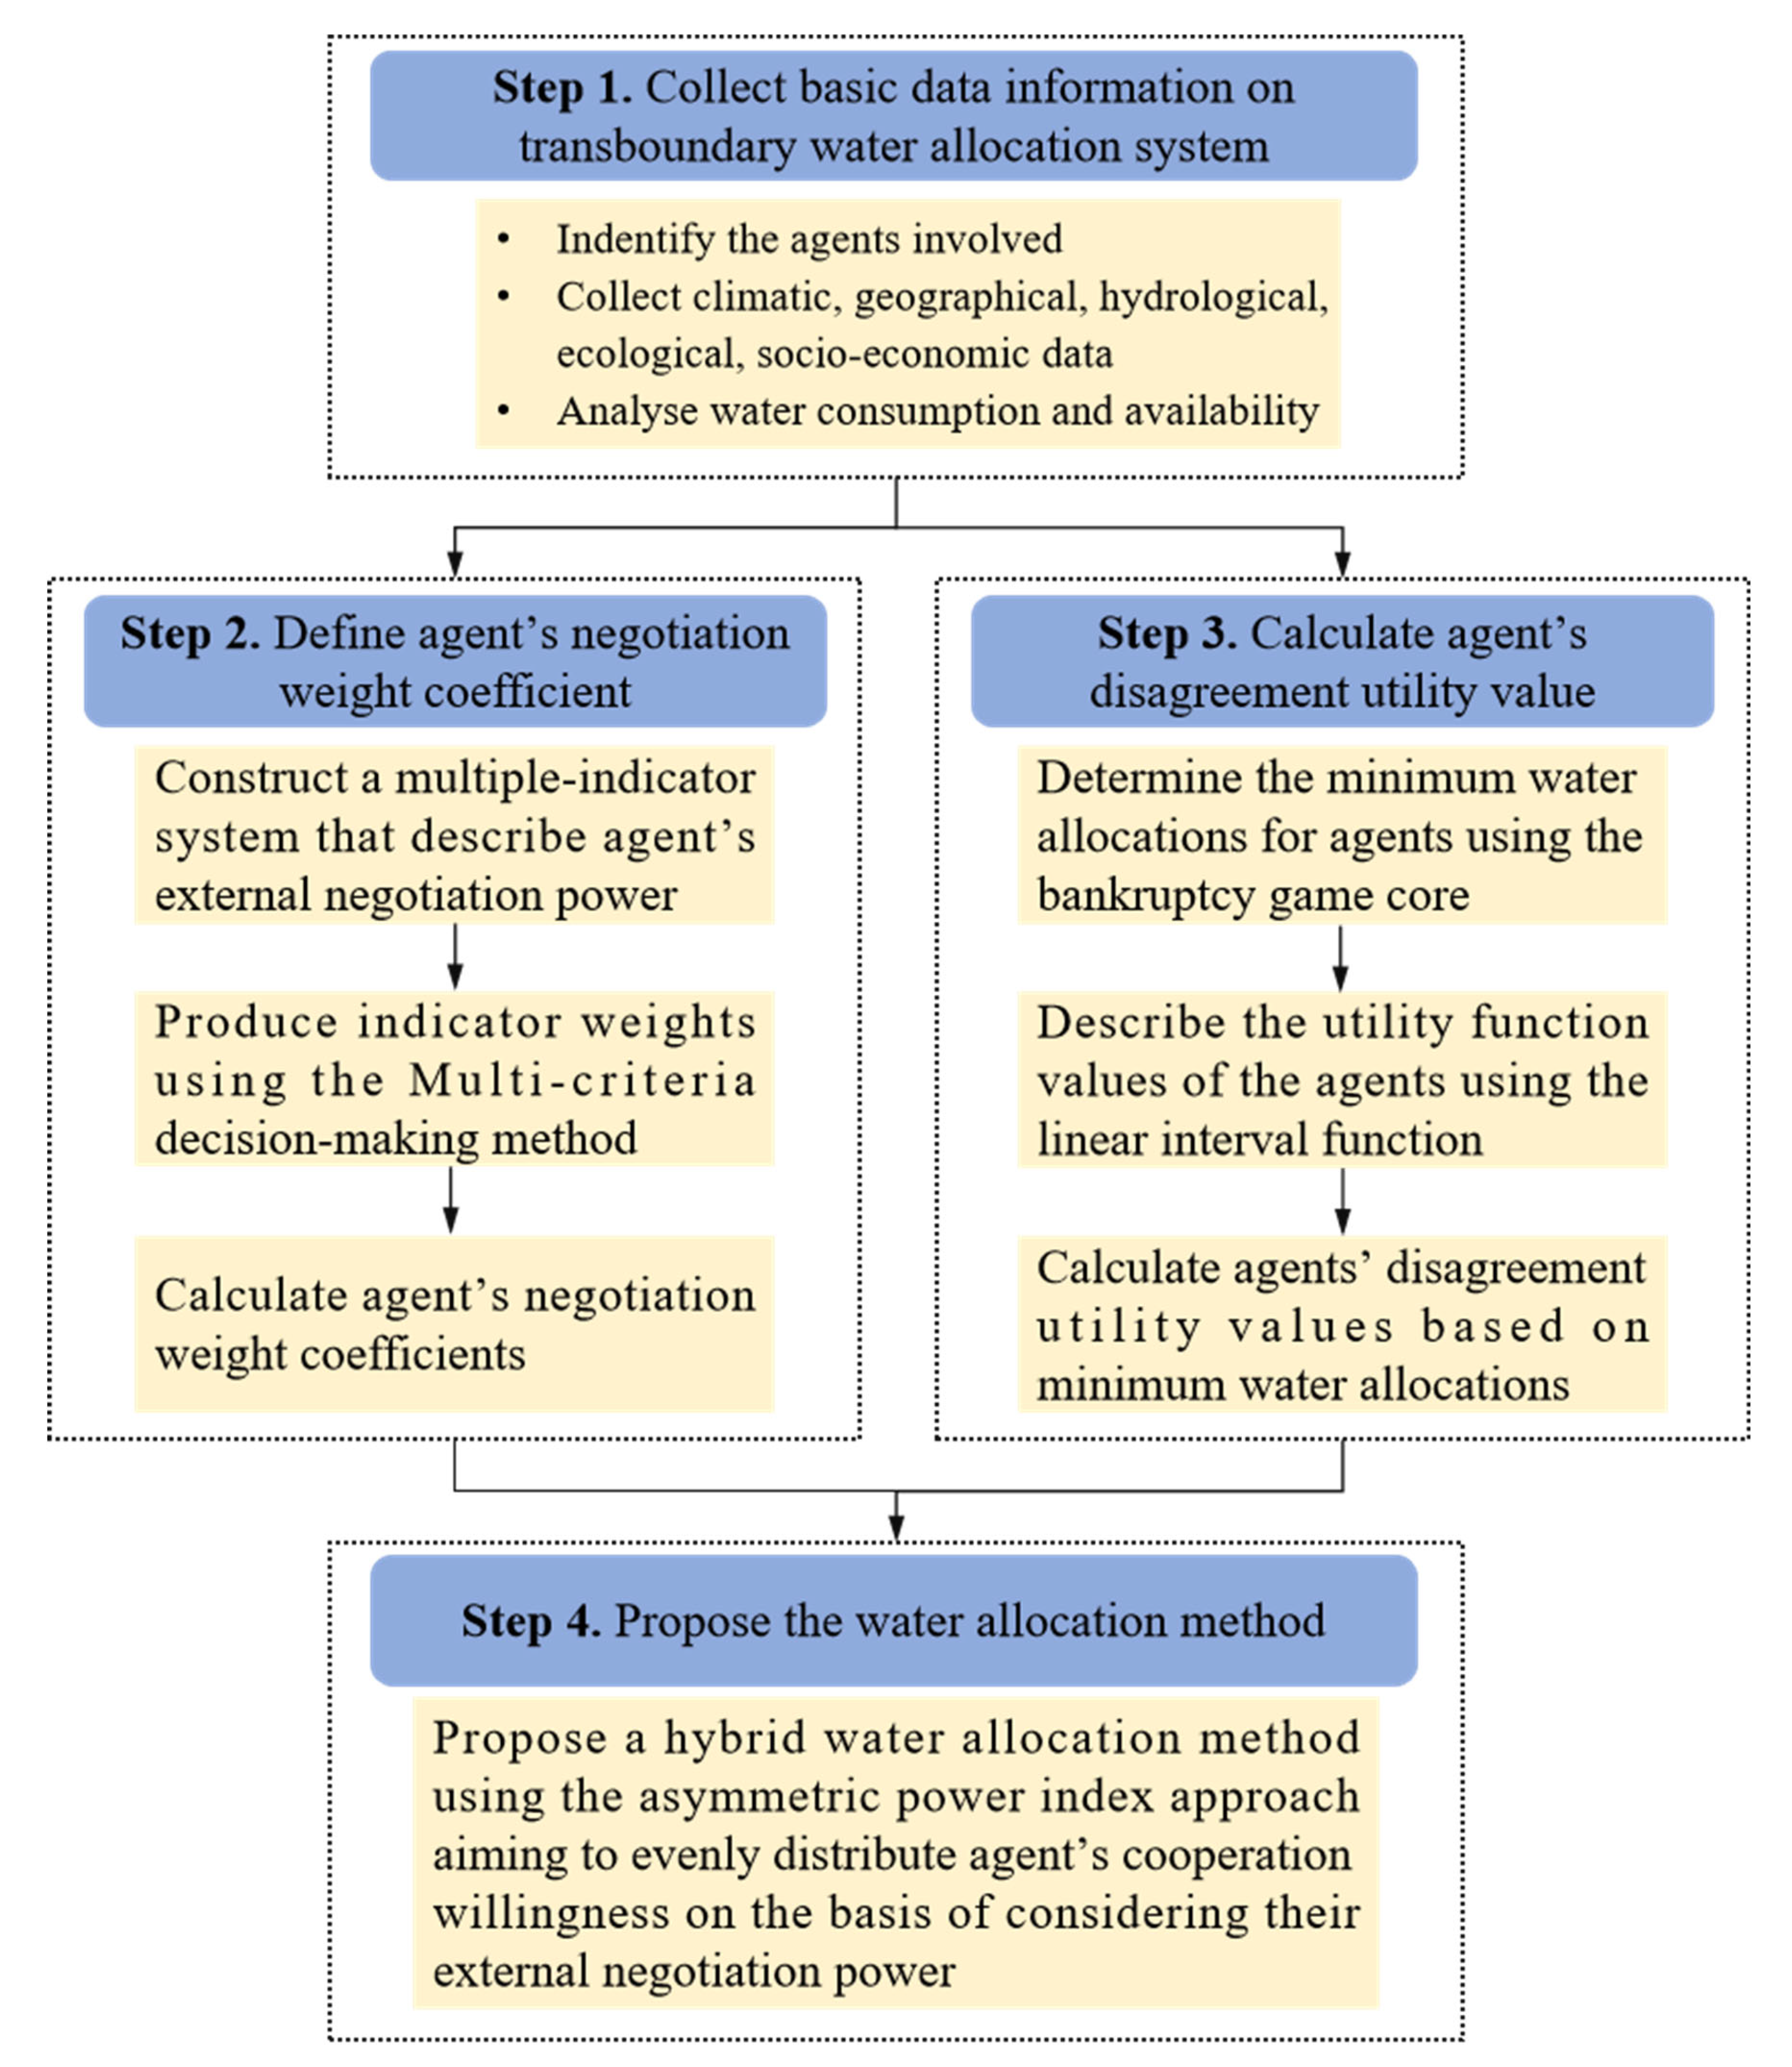
Step 2. Aggregate multiple characteristic factors that affect the decision-making agent’s external power into their negotiation weight coefficients.
Firstly, a multiple-indicator system that used to describe the external negotiation power of decision-making agents from the criteria such as water contribution, respecting the current situation, economic efficiency and eco-environmental sustainability is constructed. The proportion of annual average runoff to the total runoff of the entire watershed is used to quantify the water volume contributions to the entire system, and the agents who contribute more should bear a smaller water deficit [28]. The current water consumption cannot only reflect the existing ability of decision-making agents to develop and utilize freshwater resources [8], but also can express the respect for the status quo principle in the water allocation process. The economic output per cubic meter of water consumption is used to describe the water economic benefits for the agent, and obviously, agents with a larger marginal benefit of water usage deserve higher water allocations [15] from the reasonable perspective. Reserved water for inner-river eco-environment and sewage discharged are used as the representative indicators to quantify the efforts made by the agent towards the entire aquatic ecological environment. Over-exploitation of water resources for socio-economic development may squeezes the inner-river eco-environment water requirements, eventually agents who reserve more water for the river course should be given more water. Too much sewage discharged into the river course can result in the deterioration of water quality and aquatic ecosystems, and consequently it should be regarded as a negative indicator when allocating transboundary water resources with the aim of punishing the agents who cause great damage to water quality. The representative indicators that used to quantify four water allocation criteria are shown in Table 1.
Secondly, it formulates the quantification problem of agent’s external negotiation power in a transboundary water allocation system as a multi-criteria decision-making problem, where agents are regarded as the evaluated solutions, and thus an initial indicator matrix for calculating their negotiation weight coefficients can be constructed as follow:

where cij is the performance value of the alternative i with respect to the indicator j; N = [1,2…,n] is the alternative set, referring to the agents involved in a transboundary water allocation system; M = [1,2…,m] is the evaluation indicator set; n is the number of alternatives (herein agents); m is the number of indicators.
Thirdly, the efficiency coefficient method is employed to standardize the initial indicator data to achieve their unified dimension and attribute:
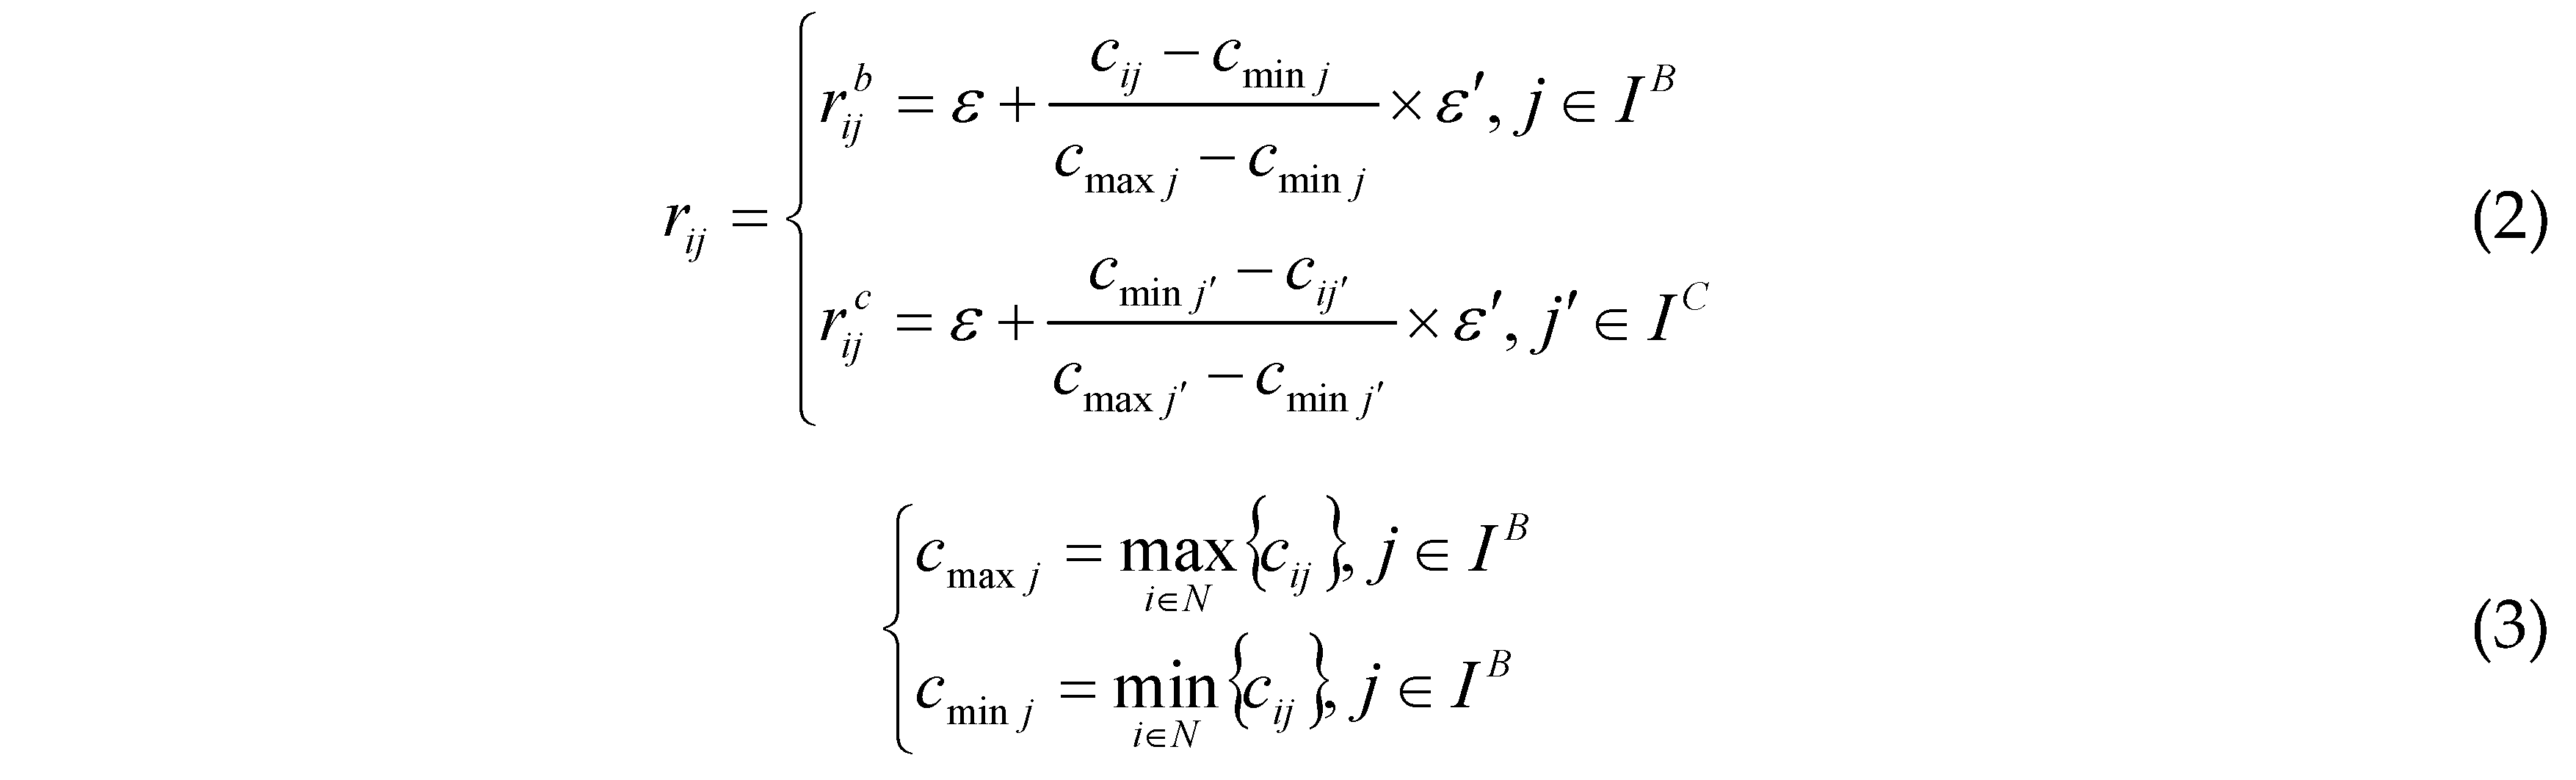

where rij is the standardized value of indicator j under alternative i; rijb and rijc, respectively, are the standardized values of the benefit indicator j (present positive effects on indicator weights) and the cost indicator j′ (present negative effects on indicator weights) under the alternative i; IB and IC are the benefit and cost indicator sets respectively, and IB∩IC = M; cmaxj(cmaxj’) and cminj (cmaxj’), respectively, are the satisfactory value and impermissible value of the indicator j (j′); ε and ε′ are the translation parameter and zoom parameter respectively, herein ε = 10−5 and ε′ = 1 − ε. In this way, the attributes of the original indicator will be unified and their values will be mapped within the range of 0-1.
Fourthly, the CRITIC method [43] is used to produce indicator weights by simultaneously considering the contrast intensity of each indicator and conflict between them [44]:
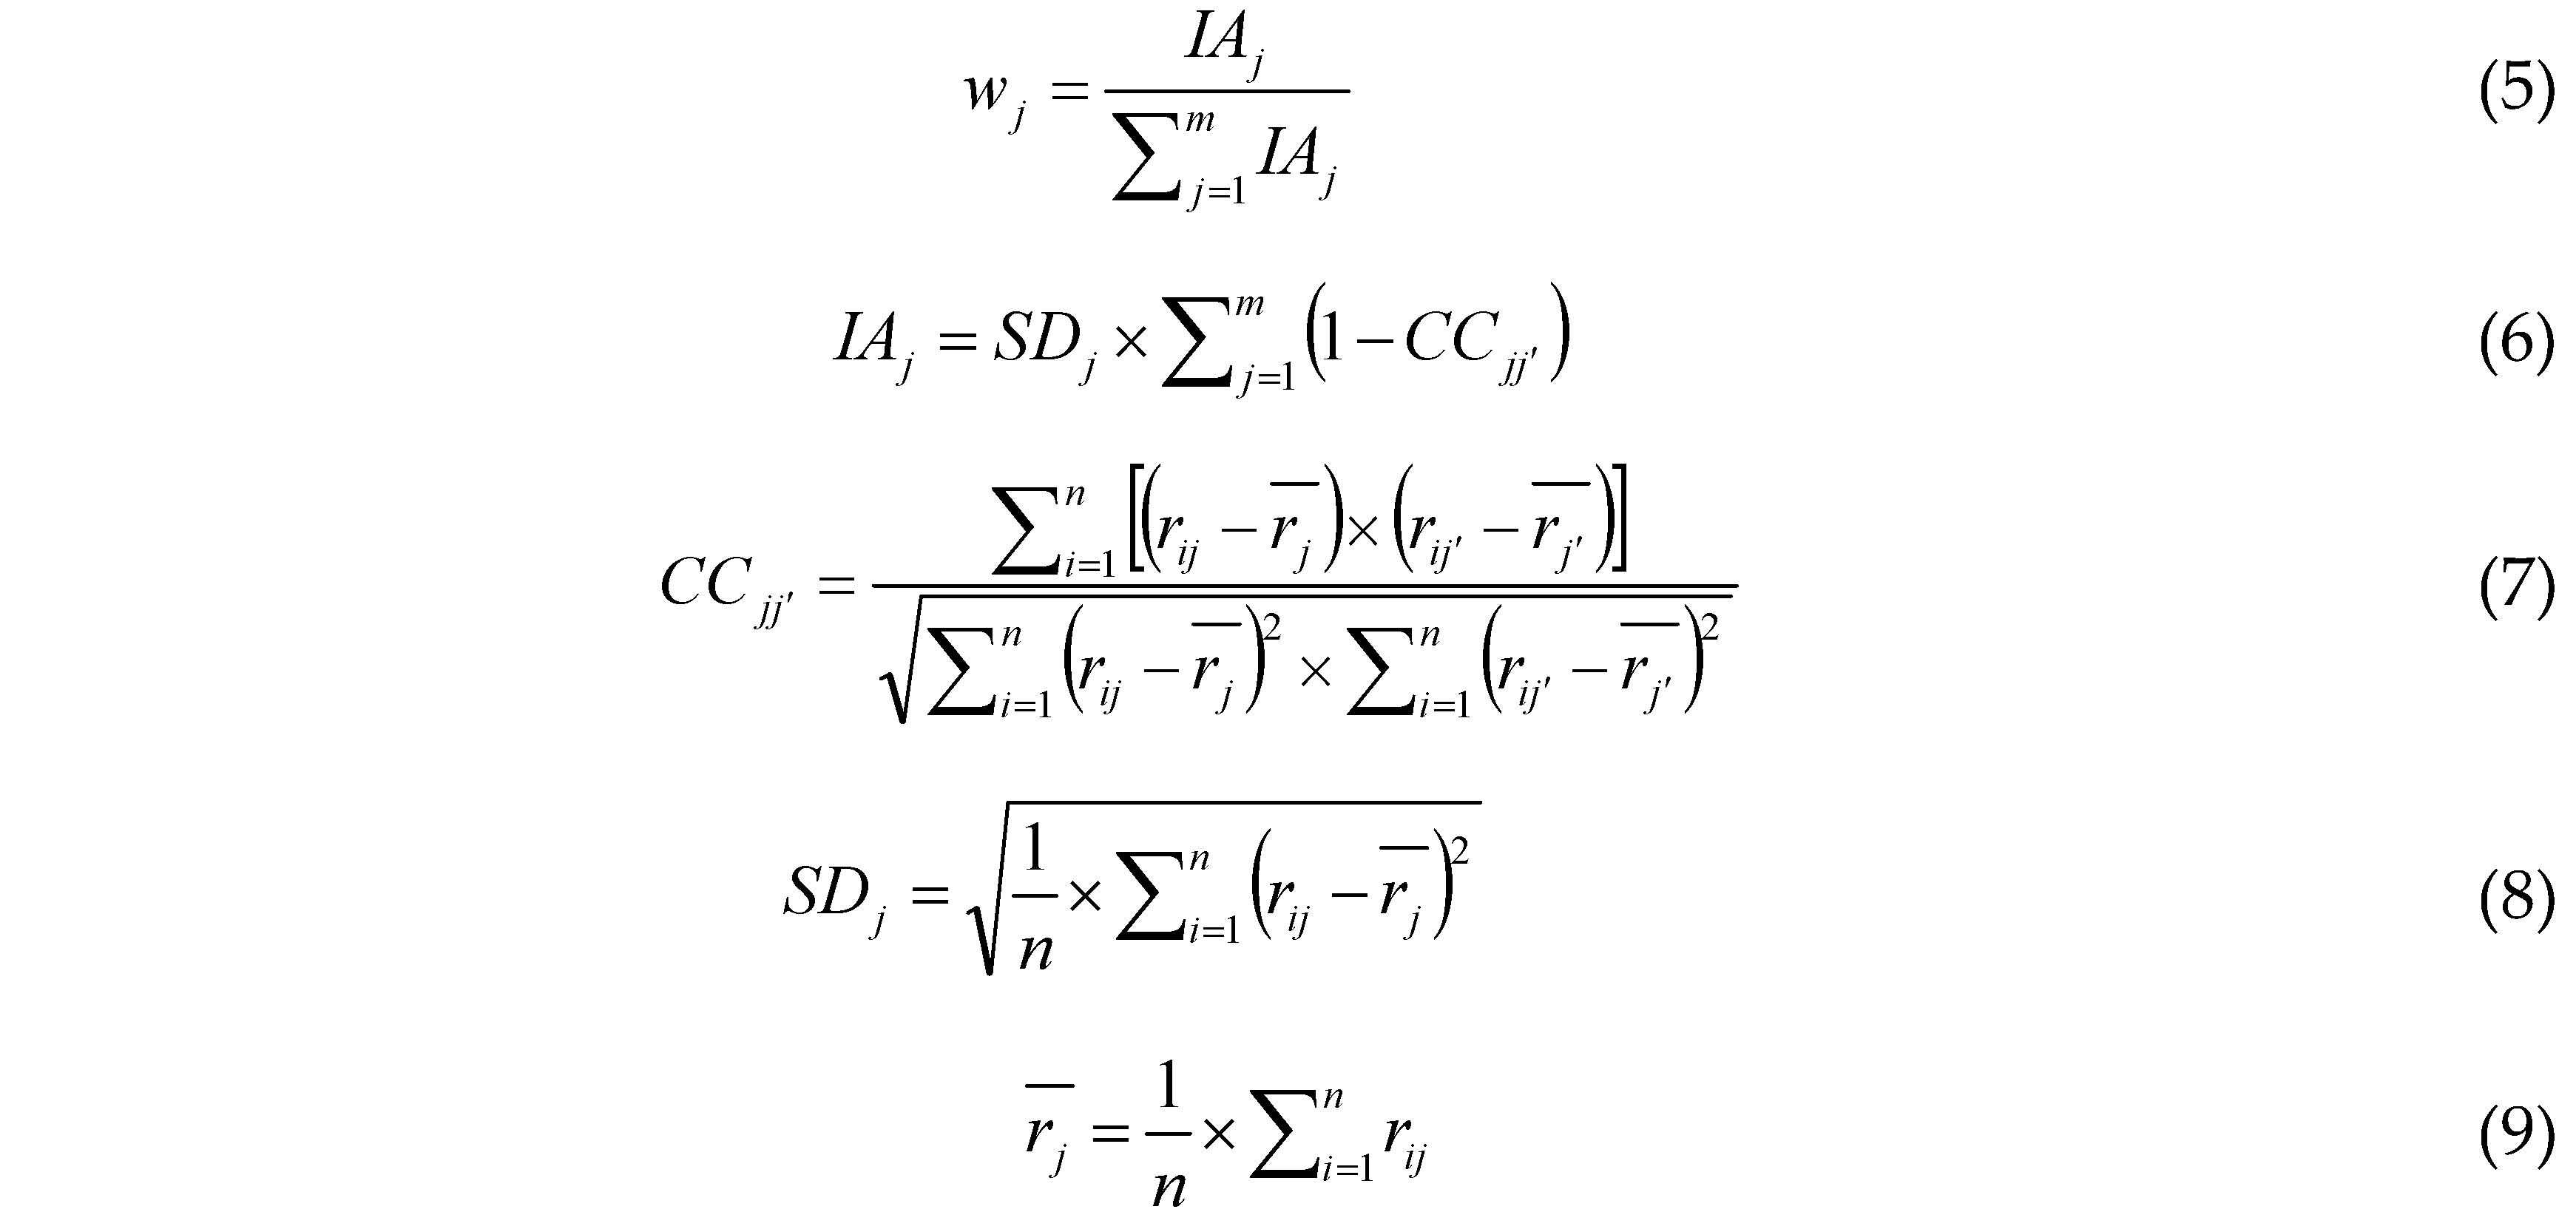
where wj is the indicator weights of the indicator j produced by the CRICIT method; IAj is the information amount contained by the indicator j; CCjj is the correlation coefficient between the indicator j and the indicator j′, which is used to measure the conflict between two indicators [43]; SDj is the standard deviation of the indicator j across all the alternatives, which is applied to quantify the contrast intensity of the indicator [44]; is the average value of the indicator j across all the alternatives.
Finally, the negotiation weight coefficients of decision-making agents can be calculated as:

where ωi is the negotiation weight coefficient of the agent i representing its asymmetric external power [10] or bargaining power [1], and the larger the weight coefficient, the higher power and capability of an agent to affect the final negotiation outcomes [7].
Step 3. Calculate the disagreement utility value of the decision-making agents.
First, the bankruptcy game core [45] is used to determine the minimum water allocations for decision-making agents in the transboundary river system:

Given that:

where is xtmin is the minimum water allocation of the agent i produced by the bankruptcy game core; AW is the available water quantity of the transboundary water allocation system; wci is the water claim of the agent i′, herein, i′ ∈ (N – {i}).
Afterwards, the linear interval function [46] is employed to describe the utility function value of the agents [16]:

where ui() is the utility function value of the agent i; is the water allocation of the agent i (decision variable); wci is the water claim of the agent i. The disagreement utility point of the agent i () can be obtained when equals .
Step 4. Propose the water allocation method using the asymmetric power index approach.
The Shapley-Shubik power index [36], defined as the ratio of an agent’s loss due to its departure from the grand coalition to the sum of all other agents’ losses after they leave the coalition [37], proved to be an appropriate method for simulating agent’s cooperation willingness and identifying the most stable solution in the cooperative game-based water management literature [1,23,38,39,40]. However, this method still fails to find fair and self-enforceable continuous solutions for transboundary water allocation due to agent’s asymmetric negotiation power and their disagreement utility points are not simultaneously concerned and included. Therefore, a hybrid water allocation method is proposed using the asymmetric power index approach based on the quantitative results of agent’s negotiation weight coefficient and their disagreement utility points:

subject to:


where Ω is the objective function of the optimization method, which aims to evenly distribute the willingness of agents to cooperate on the basis of considering their asymmetric external negotiation power; φAPI is the coefficient of variation of agent’s asymmetric power index, the smaller the value, the more stable the obtained solution, and vice versa [38]; σAPI and , respectively, are the standard deviation and average value of agent’s asymmetric power index; APIi is the asymmetric power index of the agent i, and the larger the value, the stronger the willingness of the agent to cooperate [10]. The other abbreviations are mentioned above.
From the above mathematical expression, the following properties of the proposed water allocation method can be summarized: the discrepancy in agent’s willingness to cooperate can be minimized using Equation (14), which can ensure the stability of water allocation solutions. Agent’s willingness to cooperate is quantified in Equation (16) based on simultaneous consideration of agent’s asymmetric negotiation power and the distance between their utility values and disagreement utility points, which allows to ensure fairness and self-enforceability in a bounded space [7,16]. Equations (17) and (18) give the individual rationality, which represents the minimum threshold value of the agent’s water allocation, and must be reflected before the cooperation of the agents [47]. Equation (19) presents the claim boundedness, which helps prevent resource overuse that may cause the tragedy of the commons [7,47]. Equation (20) denotes the Pareto efficiency, which requires that the sum of available water resources must be precisely allocated between all the agents [47].
3. Study Area and Data
3.1. Study Area
The Yellow River, the most chief river in the North China and the fifth longest river in the world, originates from the Bayankala Mountain in Qinghai Province, flows through nine provinces (regions) of Qinghai, Sichuan, Gansu, Ningxia, Inner Mongolia, Shaanxi, Shanxi, Henan and Shandong, and finally merges into the Bohai Sea in Dongying City, Shandong Province (Figure 2). It has a total length of about 5,464 km [48] and drains an area of 795,000 km2 [49], accounting for approximately 8.3% of Mainland China’s total area [50]. The Yellow River Basin (YRB) is characterized by arid and semi-arid continental monsoon climate with a mean annual precipitation of 495 mm [51] and a general decreasing trend from the southeast to the northwest [52]. Although the basin only accounts for about 2% of China’s surface water resources, it feeds approximately 9% of the nation’s population, about 13% of its agricultural land and around 8% of its industrial land [49]. Even some areas outside the basin, such as Hebei Province and Tianjin city, also draw water from this river. Thus, it serves as an irreplaceable role in the social and economic growth of Northern China, and its ecological conservation and high-quality development has been elevated to a great national strategy related to rejuvenating the country [53].
The YRB is mainly characterized by abundant sand, uneven spatial and temporal distribution of water resources, and fragile ecological environment. The stream-flow was cut off at the lower reach of the river every year from 1972 to 1998 because of over withdrawals, which resulted in serious socioeconomic and environmental issues in the downstream areas [54]. During the recent decades, the contradiction between water supply and demand has been increasingly prominent, and the drought disasters frequent [55], and how to allocate its limited water resources have been key issues of water management in the basin. The “Yellow River Water Supply Allocation Plan” (known as the “87” Water Allocation Plan) was promulgated and implemented by the State Council in 1987, which specified the water use permits for each province. The plan reserved 21 billion m3 of the average natural runoff of 58 billion m3 in YRB from 1919 to 1975 for inner-river eco-environment, and assigned the remaining 37 billion m3 to nine riparian provinces and Hebei Province and Tianjin City outside the basin (Table 2). Based on the “87” Water Allocation Plan, the “Yellow River Basin Comprehensive Plan (2012-2030)” (referred to as the Yellow River Basin Plan) was approved by the State Council in 2013. The plan predicted an average natural runoff of 51.98 billion m3 in 2020, and adjusted the water use permit of the Hebei Province and Tianjin City to 0.628 billion m3 based on considering the effectiveness of the East and Middle Route of the South to North Water Diversion Project and the reduced water use permit were divided to nine riparian provinces according to the proportion of the “87” Water Allocation Plan (Table 2). The above two plans provide a basis for water allocation in YRB. Nevertheless, conflict over water resource exploitation in this basin remains prominent with the continuous development of the economic society and the increasing demand for eco-environment protection. Therefore, it is necessary to investigate new theories and methods from the perspective of local decision-makings to adapt to the constantly changing mismatch between water supply and demand.
3.2. Data Collection and Analysis
The raw data used in this study are extracted from the Yellow River Water Resources Bulletin, relevant provincial (city) statistical yearbooks, the “Yellow River Basin Comprehensive Plan (2012-2030)” and the China Urban Construction Statistical Yearbook. The water demand of each province in YRB is defined by their average water consumption from 2013 to 2020 (Figure 3). The total available water quantity of YRB is adopted the “87” Water Allocation Plan and the Yellow River Basin Plan (Table 2). Other raw data of the representative indicators (Table 1) that used to quantify the external negotiation power of nine agents in YRB are extracted from the relevant provincial (city) statistical yearbooks and the China Urban Construction Statistical Yearbook (Table 3).
After deducting the inner-river eco-environment water demand and the water demand outside the basin, the total available water quantity in YRB under the “87” Water Allocation Plan and the Yellow River Basin Plan, respectively, is 35.00 billion m3 and 32.66 billion m3, while the total water demand is 41.91 billion m3 (generated by the annual average water consumption of the basin from 2013 to 2020). Overall, the water resources in the basin are mainly concentrated in the upstream provinces, while the provinces with higher water demand are located in the middle and lower reaches. Hence, the spatial layout of water resources and productivity in YRB does not match. Due to the transboundary water resources have the attributes of quasi-public goods [7], the mismatch between water availability and demand may cause water conflicts in YRB. Therefore, finding an allocation mechanism to resolve water allocation conflicts is both crucial and challenging issue faced by basin authorities.
4. Results and Discussion
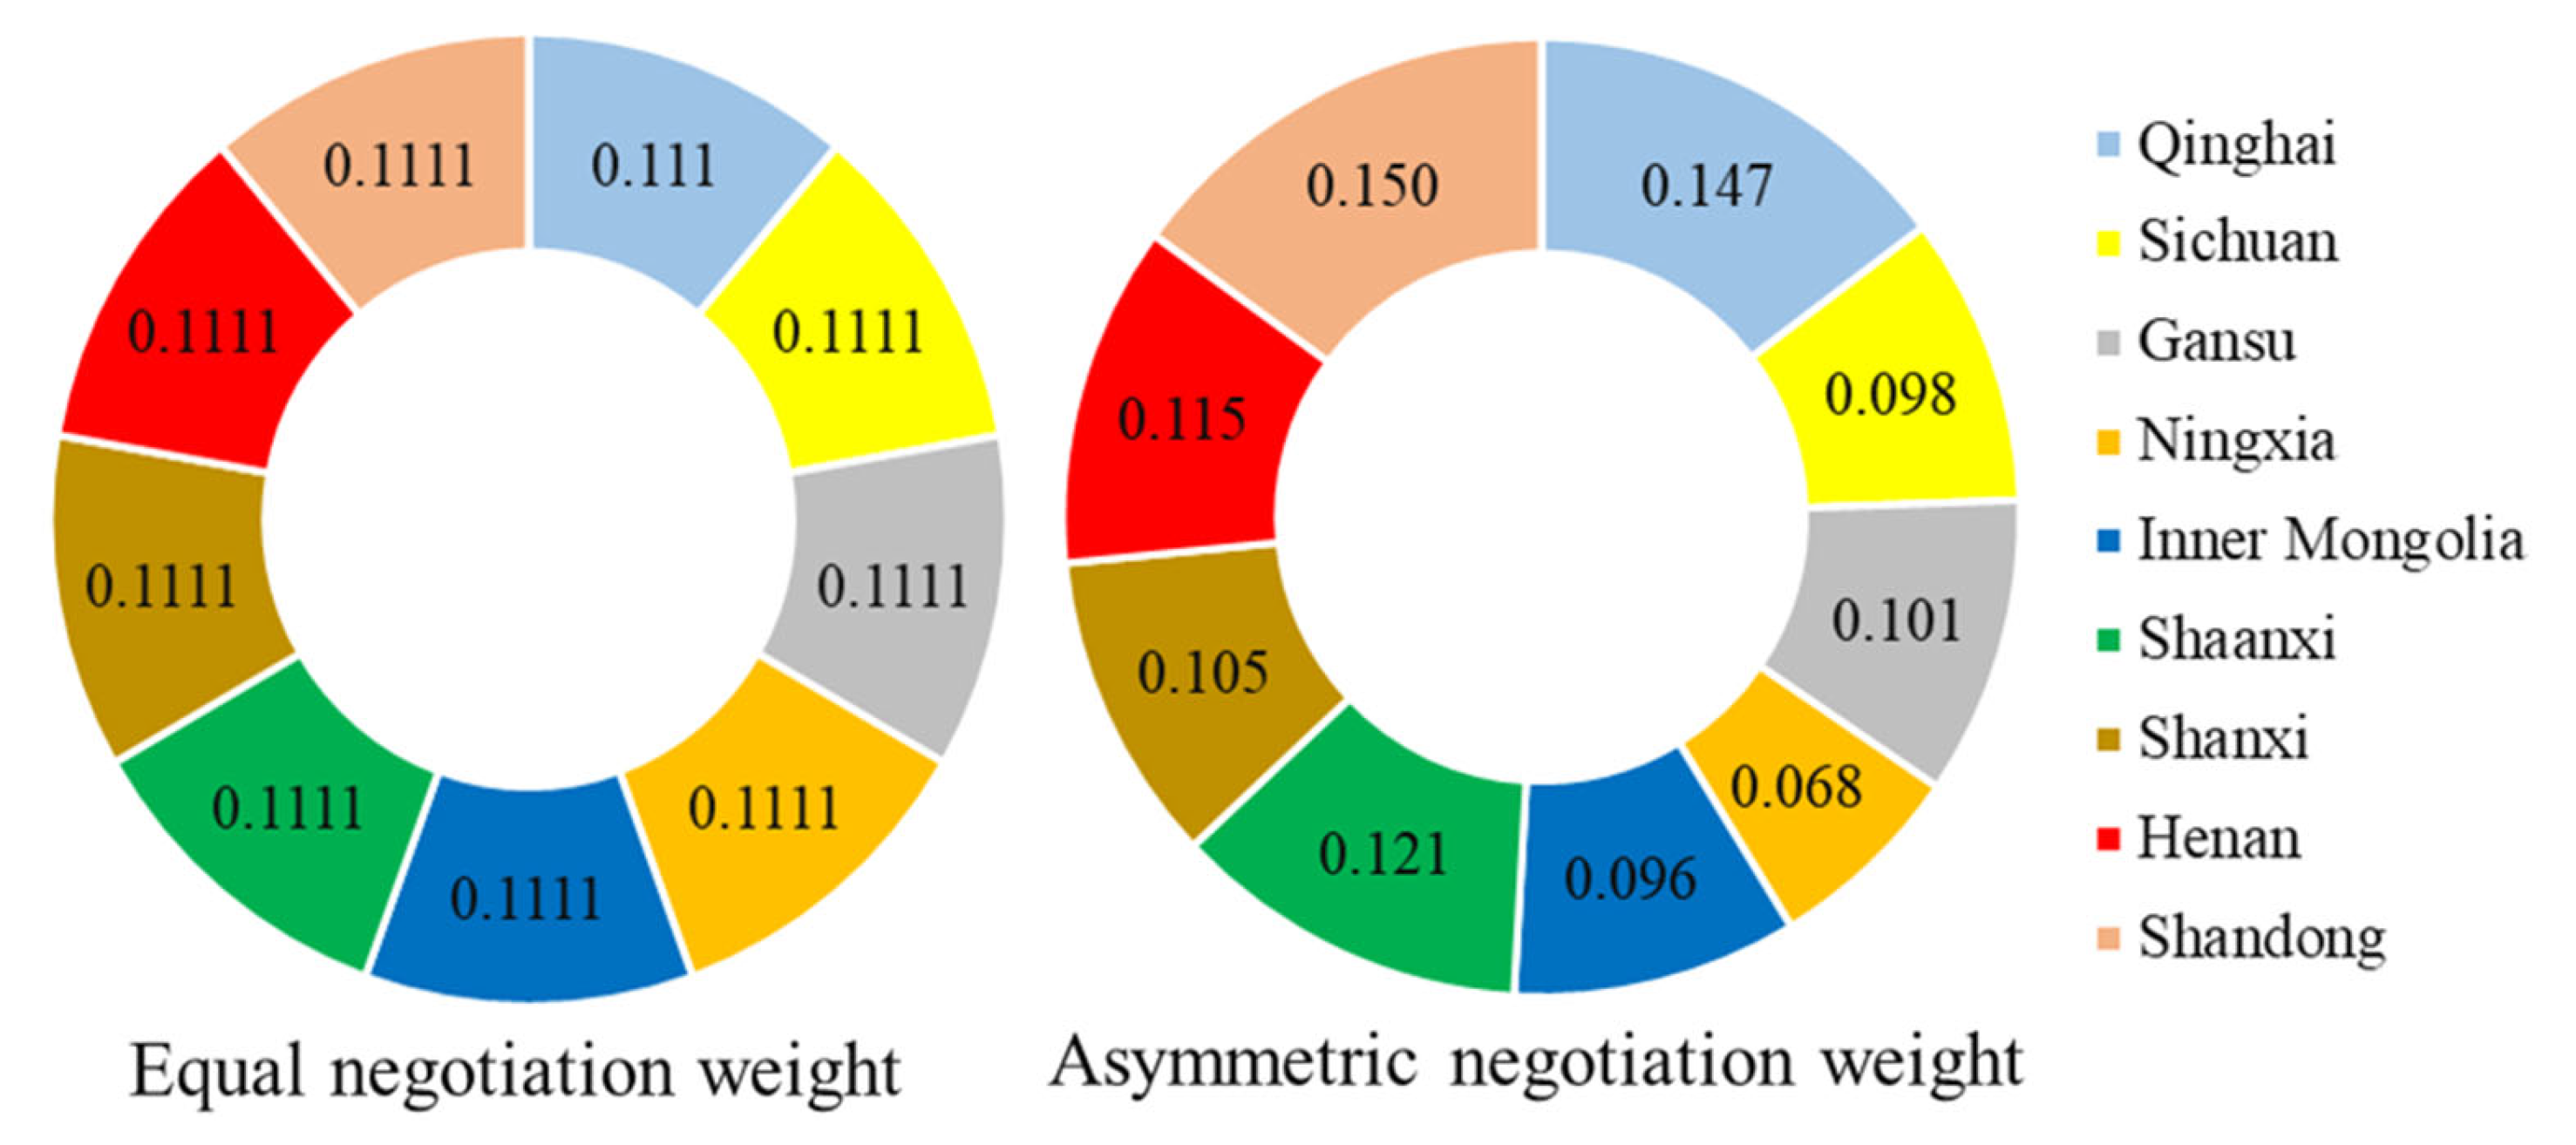
Basic data information on water allocation in YRB is collected and reported in Section 3. Based on the data from Table 3, the CRITIC method [43] is used to produce indicator weights, and subsequently the negotiation weight coefficients of nine agents in YRB representing their asymmetric external negotiation power can be calculated using Equation (8). Furthermore, equal weight, which recognizes the equal status of each agent in water use so that the negotiation weight coefficients of all agents are equal [1], is also considered as a comparison in this study. Figure 4 presents the negotiation weight coefficients of nine agents in YRB determined by the CRITIC method and equal weight method.
Among nine provinces in YRB, Ningxia is given the lowest weight coefficient of 0.068 due to its worst performance in the three criteria of water contribution, water economic efficiency and eco-environmental sustainability. As its relatively higher current water consumption and water economic efficiency, Shandong obtains the largest negotiation weight coefficients of 0.150. The negotiation weight coefficients of other provinces are between those of the two provinces mentioned above. It should be emphasized that the negotiation weight coefficients of the provinces in YRB are multi-factors aggregated values, which are jointly determined by multiple criteria such as water contribution, respecting the current situation, economic efficiency, and eco-environmental sustainability.
Figure 4.
Negotiation weight coefficients of nine agents in YRB.
Based on the available water quantity from the “87” Water Allocation Plan and the Yellow River Basin Plan (Table 2) and water demand of nine agents in YRB (Figure 3), the bankruptcy game core [45] is used to determine their minimum water allocations, and the results are presented in Table 4. Under the “87” Water Allocation Plan, Inner Mongolia and Shandong obtain the minimum initial water allocation of 1.149 billion m3 and 2.379 billion m3, respectively, which are defined on the basis of ensuring that other agents fully satisfy, and therefore can be considered as conceded to them by all the others [17]. The minimum initial water allocations to the other agents are zero because there is no surplus water for them after all the others has been fully compensated in terms of their claims [56]. Under the Yellow River Basin Plan, the minimum initial water amount allocated to Shandong by the bankruptcy game core is 0.038 billion m3, whereas the other agents do not receive initial water allocation. The different results under the two available water quantity scenarios indicate that the bankruptcy game core is highly sensitive to the water shortage degree in the watershed when producing the minimum water allocations.
Based on the minimum water allocation results, the disagreement utility values of the agents are determined using Equation (11), which are the lower bound or starting point for their participation in bargaining [22], and, to some extent, determines the sustainability of the developed solutions or signed agreements [7]. Subsequently, the asymmetric power index approach considering the agent’s minimum water allocation (API-2) is used to perform water allocations in YRB based on the negotiation weight coefficients of nine agents. Moreover, four alternative allocation approaches such as the proportional (PRO) rule, symmetric power index approach without considering the agent’s minimum water allocation (SPI-1), symmetric power index approach considering the agent’s minimum water allocation (SPI-2) and asymmetric power index approach without considering the agent’s negotiation weight coefficients (API-1). Table 5 reports the water allocation results of nine agents in YRB under different allocation methods, and their water distribution satisfactions are presented in Figure 5.
The PRO rule distributes the water resources among the agents proportionally to their claims [28], and hence nine agents in YRB obtain the same water allocation satisfaction of 83.52% and 77.93%, respectively, under the “87” Water Allocation Plan and the Yellow River Basin Plan. It is the best and most widely used bankruptcy rule [9,56] and usually suggested as the definition of fairness for conflicting claims problem [57]. Nevertheless, its “equity” and “rationality” in dealing with common pool resource management issues is questioned as it does not take into account other characteristic factors of decision-making agents other than their demands. For one thing, decision-making agents (provincial districts) who contribute more water volume to the entire system should be allocated more water [28]. For another, agents with higher marginal benefit of water usage should obtain more water allocation from the perspective of reasonable utilization [27]. In short, the based-claim PRO rule does not conform to the normative principle of “equitable and reasonable utilization” defined by the Convention on the Law of the Non-Navigational Uses of International Watercourses [58].

Table 5.
reports the water allocation results of nine agents in YRB under different allocation methods. unit: billion m³.
Table 5.
reports the water allocation results of nine agents in YRB under different allocation methods. unit: billion m³.
| Allocation scenarios | Decision-making agents | PRO | SPI-1 | SPI-2 | API-1 | API-2 | |||||
| xi | di | xi | di | xi | di | xi | di | xi | di | ||
| Available water quantity under the “87” Water Allocation Plan | Qinghai | 9.17 | 1.81 | 9.17 | 1.81 | 9.00 | 1.97 | 10.97 | 0.00 | 10.97 | 0.00 |
| Sichuan | 0.23 | 0.04 | 0.23 | 0.04 | 0.22 | 0.05 | 0.20 | 0.07 | 0.19 | 0.08 | |
| Gansu | 28.53 | 5.63 | 28.53 | 5.63 | 28.01 | 6.15 | 26.04 | 8.12 | 25.76 | 8.40 | |
| Ningxia | 35.09 | 6.92 | 35.09 | 6.92 | 34.46 | 7.56 | 21.40 | 20.62 | 21.17 | 20.85 | |
| Inner Mongolia | 67.28 | 13.27 | 67.28 | 13.27 | 68.12 | 12.43 | 59.96 | 20.59 | 62.04 | 18.52 | |
| Shaanxi | 42.07 | 8.30 | 42.07 | 8.30 | 41.30 | 9.06 | 46.50 | 3.87 | 45.97 | 4.39 | |
| Shanxi | 35.41 | 6.99 | 35.41 | 6.99 | 34.77 | 7.63 | 33.80 | 8.60 | 33.43 | 8.97 | |
| Henan | 54.68 | 10.79 | 54.68 | 10.79 | 53.69 | 11.78 | 58.28 | 7.19 | 57.60 | 7.87 | |
| Shandong | 77.55 | 15.30 | 77.55 | 15.30 | 80.42 | 12.43 | 92.85 | 0.00 | 92.85 | 0.00 | |
| Total | 350.00 | 69.06 | 350.00 | 69.06 | 350.00 | 69.06 | 350.00 | 69.06 | 350.00 | 69.06 | |
| Qinghai | 8.55 | 2.42 | 8.55 | 2.42 | 8.55 | 2.42 | 10.97 | 0.00 | 10.97 | 0.00 | |
| Available water quantity under the Yellow River Basin Plan | Sichuan | 0.21 | 0.06 | 0.21 | 0.06 | 0.21 | 0.06 | 0.18 | 0.09 | 0.18 | 0.09 |
| Gansu | 26.62 | 7.54 | 26.62 | 7.54 | 26.62 | 7.54 | 23.79 | 10.37 | 23.79 | 10.37 | |
| Ningxia | 32.74 | 9.27 | 32.74 | 9.27 | 32.74 | 9.28 | 19.60 | 22.42 | 19.60 | 22.42 | |
| Inner Mongolia | 62.78 | 17.77 | 62.78 | 17.77 | 62.76 | 17.79 | 53.91 | 26.64 | 53.91 | 26.64 | |
| Shaanxi | 39.25 | 11.11 | 39.25 | 11.11 | 39.24 | 11.12 | 42.07 | 8.29 | 42.07 | 8.29 | |
| Shanxi | 33.04 | 9.36 | 33.04 | 9.36 | 33.04 | 9.36 | 30.77 | 11.63 | 30.77 | 11.63 | |
| Henan | 51.02 | 14.45 | 51.02 | 14.45 | 51.01 | 14.46 | 52.44 | 13.03 | 52.44 | 13.03 | |
| Shandong | 72.36 | 20.49 | 72.36 | 20.49 | 72.43 | 20.42 | 92.85 | 0.00 | 92.85 | 0.00 | |
| Total | 326.59 | 92.47 | 326.59 | 92.47 | 326.59 | 92.47 | 326.59 | 92.47 | 326.59 | 92.47 | |
Note: xi denotes the water quantity allocated to agent i; di denotes the water deficit endured by agent i.
From Figure 5, the SPI-1 method generates the same water allocation results as the PRO rule when the minimum water allocations of the decision-making agents are not considered and equal weights are assigned to them. The main reason is that the SPI-1 method adopts the ratio of the allocated water amount of the decision-making agents to their water claims (demands) (i.e. water allocation satisfaction) as their utility functions, and the optimization objective of these methods are to achieve equal utility distribution among the decision-making agents as much as possible without considering their minimum water allocations and asymmetric negotiation weight coefficients.
Figure 6.
Comparison results between symmetric (SPI-1,2) methods and asymmetric (API-1,2) methods under the “87” Water Allocation Plan (a) and the Yellow River Basin Plan (b).
Figure 6.
Comparison results between symmetric (SPI-1,2) methods and asymmetric (API-1,2) methods under the “87” Water Allocation Plan (a) and the Yellow River Basin Plan (b).
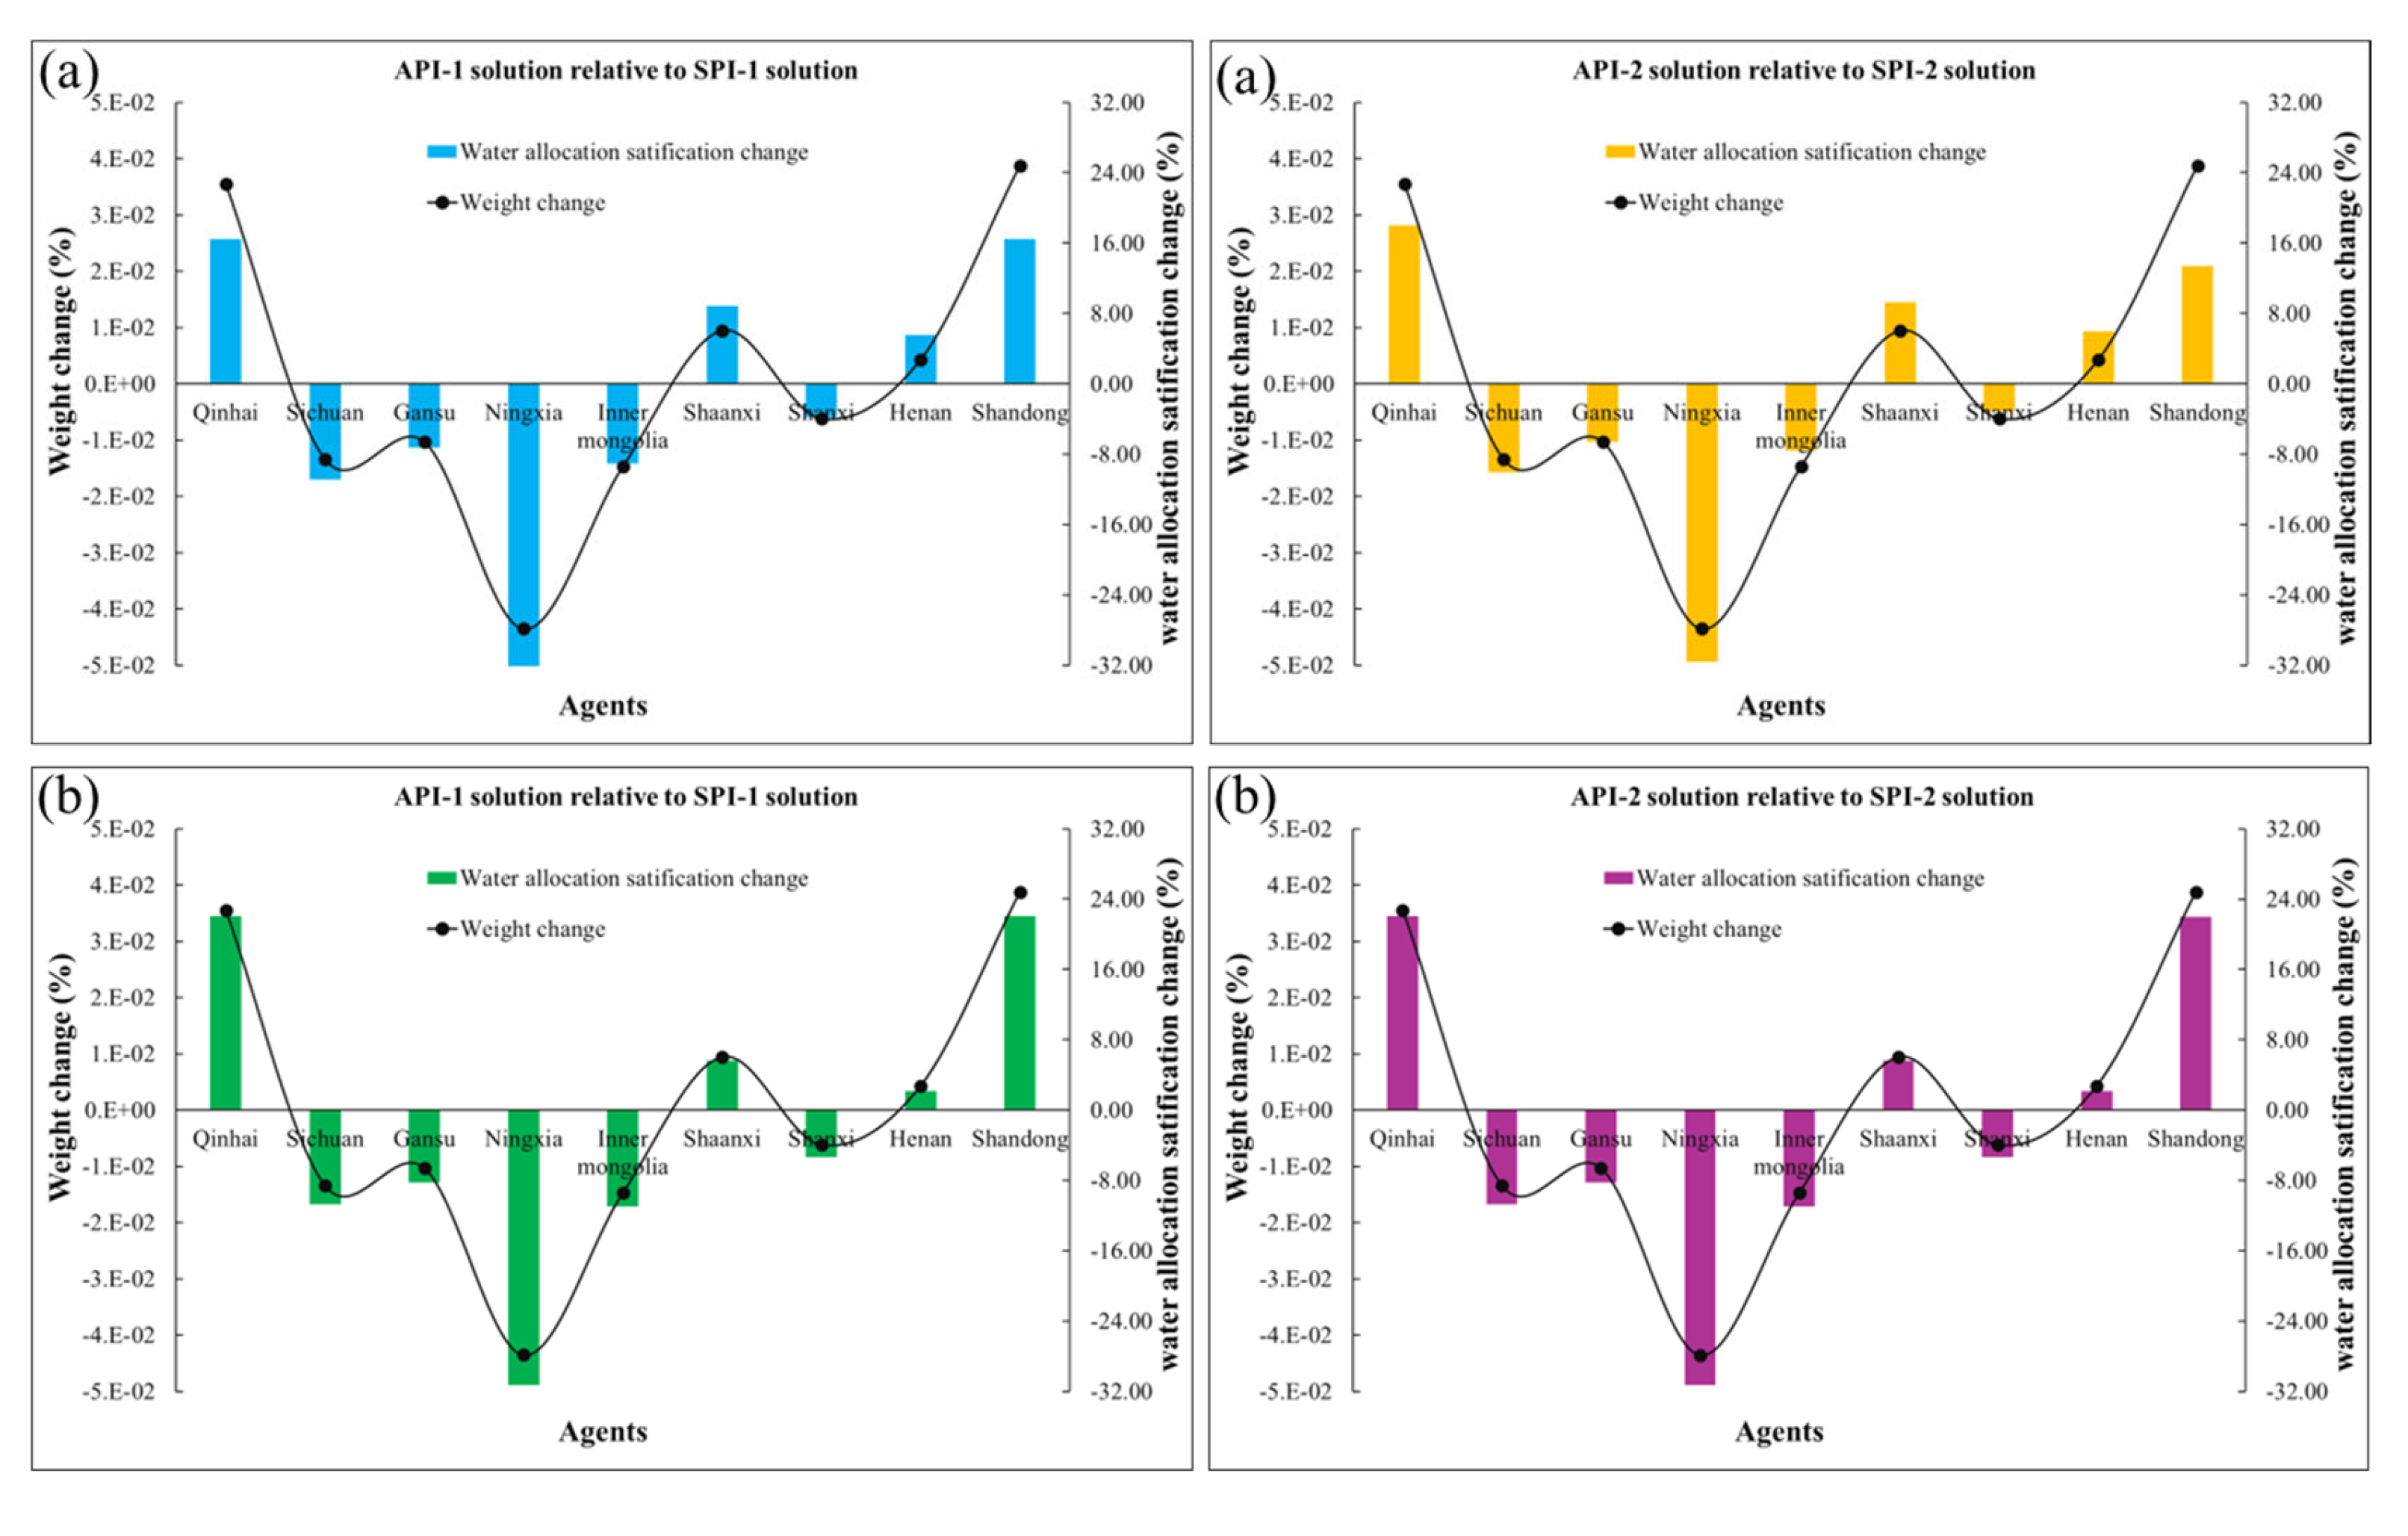
Figure 6 presents the comparison results between symmetric (SPI-1,2) methods and asymmetric (API-1,2) methods under the “87” Water Allocation Plan (a) and the Yellow River Basin Plan (b). It can be seen intuitively from Figure 6 that the water allocation satisfaction of Qinghai, Shaanxi, Henan and Shandong is raised under the asymmetric (API-1,2) methods compared to that under the symmetric (SPI-1,2) methods, whereas the water allocation satisfaction of the other agents decreases. It reveals how the negotiation weight coefficients of the agents modify the allocation solutions derived from the symmetric (SPI-1,2) methods. Alternatively, it can also explain how external negotiation power of the agents affects the internal power distribution among them. Consequently, transboundary water allocation under scarcity is far more complicated than general enterprise bankruptcy problems, and it is not fair or unreasonable to only consider the water claims of the agents when redistributing water without considering their other characteristic factors such as water contribution, current water consumption, water economic efficiency and efforts made for eco-environmental protection.
In brief, two main conclusions can be observed from Figure 6. One is that the water allocation results yielded by the API-2 method is highly sensitive to the variability of negotiation weight coefficients of decision-making agents. Another is that, in the API-2 method, water allocation satisfaction changes of the decision-making agents present positively correlated with the change of their negotiation weight coefficients.
Table 6 reports the water allocation satisfaction changes of the agents under the solutions considering the agent’s minimum water allocation compared to under those without considering the agent’s minimum water allocation. Compared to SPI-1 solution, the water allocation satisfaction of Inner Mongolia and Shandong is increased in SPI-2 solution under the “87” Water Allocation Plan, while that of the other agents is decreased. The reason is that only these two agents obtain a minimum water allocation under the “87” Water Allocation Plan (Table 4). Similarly, the SPI-2 solution gives more water to Shandong than the SPI-1 solution under the Yellow River Basin Plan due to it is the only agent who receives the minimum water allocation. These results verify the impact of the agent’s minimum water allocation on the proposed method for finding continuous optimization solutions.
Inner Mongolia gains more water allocation in API-2 solution under than that in API-1 solution, Qinghai and Shandong remain unchanged, while those of the other agents are reduced. Under the Yellow River Basin Plan, the API-2 and API-1 methods produce the identical water allocation results. The explanation for the differentiated conclusions between symmetric (SPI-2 ~ SPI-1) and asymmetric (API-2 ~ API-1) cases is that not only agent’s minimum water allocation but also their asymmetric negotiation weight coefficients are taken into account in the API-2 method. Besides, due to agent’s minimum water allocation is affected by the water scarcity in transboundary rivers, the API-2 method is sensitive to the water shortage degree when producing water allocation solutions.
Table 7 depicts the comparison results of water allocation satisfaction between the two plans (“87” Water Allocation Plan and Yellow River Basin Plan) customized for division of YRB and the API-2 solution. In the “87” Water Allocation Plan, Qinghai, Sichuan and Shanxi obtain water allocations that exceed their water claims, while Inner Mongolia receives the lowest water allocation satisfaction (72.75%). Based on the average water consumption from 2013 to 2020, this allocation solution, obviously, violates the claim-boundedness constraint [7,47], resulting in the unnecessary waste of limited water resources. Meanwhile, it is also economically inefficient as those who gain lower water allocation satisfaction (Shaanxi, Henan and Shandong) possess higher marginal benefit of water usage. The above analysis explains, to some extent, why the “87” Water Allocation Plan is no longer applicable to the current and future development circumstances of social economy and ecological environment in YRB.
Compared to the “87” Water Allocation Plan, the water allocation satisfaction of Qinghai in the API-2 solution is reduced by 28.49%; however, its water claim is fully satisfied in this solution. Shaanxi, Henan and Shandong obtain higher water allocation satisfaction under the API-2 solution than that under the “87” Water Allocation Plan. Qinghai, located in the upper reaches of YRB, contributes the most to water volume and has made the most efforts to protect the eco-environment, and therefore, it ought to receive a higher water distribution satisfaction. Shaanxi, Henan and Shandong, which are located in the middle and lower reaches, have relatively good socio-economic development, larger current water consumption as well as higher economic benefits of water usage, and hence, it is reasonable for them to achieve a higher water distribution satisfaction under the API-2 solution than that under the “87” Water Allocation Plan, which is more conducive to the efficient and intensive utilization of water resources in YRB. Due to the fact that the Yellow River Basin Plan is formulated by reducing the “87” Water Allocation Plan according to a certain proportion, analogous conclusions can be drawn by comparing it with the API-2 solution.
Based on the minimum water allocation and disagreement utility point of the agents, the Shapley-Shubik power index approach are used to quantify agent’s willingness to cooperate and the stability of the various solutions, respectively, in equal and asymmetric negotiation cases, and the results are presented in Figure 7. From Figure 7(a), the power index values of nine agents under the SPI-2 solution are exactly the same of 0.111 in equal negotiation case, which indicates that agents’ internal power is evenly distributed among them, and thus the highest stability of the solution [10]. Conversely, the “87” Water Allocation Plan is identified as the most unstable solution in this case. Apparently, Qinghai and Sichuan enthusiastically embrace the “87” Water Allocation Plan, whereas Shandong, Inner Mongolia and Shaanxi are very likely to oppose. Compared to the symmetric (SPI-1,2) solutions, the asymmetric (API-1,2) solutions are more unstable from the power index values of nine agents. From Figure 7(b), the “87” Water Allocation Plan is also considered as the most unstable solution in the asymmetric negotiation case due to agents’ internal power is extremely unevenly distributed among them. In this solution, Sichuan and Ningxia are most likely to remain in the negotiation and seeks agreement rather than leave prematurely, whereas Shandong, Shaanxi and Inner Mongolia are reluctant to continue the negotiation and hope to seek other options. Compared to the symmetric (SPI-1,2) solutions, the asymmetric (API-1,2) solutions are more stable from the asymmetric power index values of nine agents.
From the comparison between Figure 7(a) and 7(b), the willingness of nine agents in YRB to cooperate under the same solution and the stability of this solution differ significantly in equal and asymmetric negotiation cases. Although the “87” Water Allocation Plan is considered the most unstable option in both cases, the power index value of the agents and the stability index value of this solution both are significantly different. In equal negotiation case, the SPI-2 solution is chosen as the most stable solution, while the API-2 solution is the one in asymmetric negotiation case. These numerical results highlight the necessity of considering the negotiation power of the agents in the decision-making process of transboundary water allocations. It is important to emphasize that the same insights and conclusions can be obtained when using the above-mentioned methods to allocate the available water quantity in the Yellow River Basin Plan, and consequently repeated analysis is not necessary to conduct.
5. Conclusions
A pervasive and critical problem related to manage transboundary water resources is how to effectively resolve the competition conflicts among agents when the available water is not sufficient to satisfy all claims. Concerning the cooperative willingness of the involved agents and capturing the strategic interaction among them are the key instrument to settle water geopolitical conflict. The Shapley-Shubik power index can provide a mathematical tool to describe agent’s cooperation willingness, while it fails to take into account multiple heterogeneous features of the agents besides their aspiration claims. This study proposed a water allocation framework by combining asymmetric power index approach with the bankruptcy theory for solving the transboundary water allocation problem under scarcity, and applied it to YRB together with six alternative methods including the “87” Water Allocation Plan, Yellow River Basin Plan, PRO solution, SPI-1 solution, SPI-2 solution and API-1 solution. The major conclusions can be summarized as follows:
(1) Shandong is assigned the largest negotiation weight coefficients of 0.150 among nine provinces in YRB by aggregating multiple criteria such as water contribution, respecting the current situation, economic efficiency, and eco-environmental sustainability, while that of Ningxia is the lowest.
(2) The SPI-1 method and the PRO rule yield the same water allocation results when the minimum water allocations of decision-making agents are not considered and equal weights are assigned to them. Nevertheless, their practical feasibility is difficult to guarantee since they use some mathematical criteria to perform allocations only according to agents’ aspiration claims without considering other characteristic factors that affect their actions.
(3) Compared to the “87” Water Allocation Plan and the Yellow River Basin Plan, the water allocation satisfaction of Qinghai in the API-2 solution is reduced; however, its water claim is fully satisfied. Shaanxi, Henan and Shandong obtain higher water allocation satisfaction under the API-2 solution than that under those two plans. The API-2 method is relatively superior in terms of fairness and reasonableness, as it can ensure the water allocation satisfaction of those who contribute the most and improve the water allocation satisfaction of those with higher water economic benefits.
(4) Apart from the basic principles of Pareto efficiency, individual rationality and claim boundedness, the proposed allocation method satisfies fairness, stability and self-enforceability, which makes it more reasonable and realistic than other alternative methods.
(5) Agent’s willingness to cooperate should be quantified under the background of asymmetric negotiation power and considered when making decisions on transboundary water allocations.
The results demonstrate the advantages of the proposed integrated allocation method over other alternative methods in terms of multidimensional desirable properties such as fairness, stability, and self-enforceability. Besides, all the methods it used are relatively objective and easy to implement, and consequently, it can not only be applied to YRB, but also can be easily transplanted to other transboundary water management.
Due to the fact that the study only considered the water allocation under two available scenarios in YRB, and the water demand of nine agents obtained from their historical water use data, the application effect of the model in other allocation scenarios has not been fully explored. In the future, uncertainty in hydrological conditions, socioeconomic development status, and water management policies can be taken into account to further enhance the proposed method’s ability and adaptability.
Author Contributions
Conceptualization, J.Q. and X.F.; methodology, J.Q. and X.F.; data curation, J.H., J.W. and J.Z.; formal analysis, J.Q. and J.H.; investigation, J.Q. and J.Z.; writing-original draft, J.Q.; writing-review & editing, X.F., X.W. and J.L.; visualization, X.C; project administration, J.W; supervision, X.F. and X.W. All authors have read and agreed to the published version of the manuscript.
Funding
This study was supported by the China Postdoctoral Science Foundation (No. 2023M731040), and National Natural Science Foundation of China (Nos. 12271061, U21A2002).
Data Availability Statement
Data are contained within the article.
Conflicts of Interest
The authors declare no conflicts of interest.
References
- Tian, J.; Yu, Y.; Li, T.; Zhou, Y.; Li, J.; Wang, X.; Han, Y. A cooperative game model with bankruptcy theory for water allocation: a case study in China Tarim River Basin. Environ. Sci. Pollut. Res. 2022, 29, 2353-2364. [CrossRef]
- Yang, L.; Pan, Z.; Li, H.; Wang, D.; Wang, J.; Wu, C.; Wu, X. Study on the Spatiotemporal Evolution and Driving Factors of Water Resource Carrying Capacity in Typical Arid Regions. Water 2024, 16, 2142. [CrossRef]
- Liu, J.; Yang, H.; Gosling, S.N.; Kummu, M.; Florke, M.; Pfister, S.; Hanasaki, N.; Wada, Y.; Zhang, X.; Zheng, C.; et al. Water scarcity assessments in the past, present and future. Earths Future 2017, 5, 545-559. [CrossRef]
- Ssekyanzi, G.; Ahmad, M.J.; Choi, K.S. Sustainable Solutions for Mitigating Water Scarcity in Developing Countries: A Comprehensive Review of Innovative Rainwater Storage Systems. Water 2024, 16, 2394. [CrossRef]
- Eliasson, J. The rising pressure of global water shortages. Nature 2015, 517, 6. [CrossRef]
- UN. The Sustainable Development Goals Report 2022; UN: New York, NY, USA, 2022.
- Qin, J.; Fu, X.; Peng, S.; Xu, Y.; Huang, J.; Huang, S. Asymmetric Bargaining Model for Water Resource Allocation over Transboundary Rivers. Int. J. Environ. Res. Public Health 2019, 16, 1733. [CrossRef]
- Zeng, Y.; Li, J.; Cai, Y.; Tan, Q. Equitable and reasonable freshwater allocation based on a multi-criteria decision making approach with hydrologically constrained bankruptcy rules. Ecol. Indic. 2017, 73, 203-213. [CrossRef]
- Giuliani, M.; Castelletti, A.; Amigoni, F.; Cai, X. Multiagent systems and distributed constraint reasoning for regulatory mechanism design in water management. J. Water Resour. Plan. Manag. 2015, 141, 04014068. [CrossRef]
- Read, L.; Madani, K.; Inanloo, B. Optimality versus stability in water resource allocation. J. Manag. Eng. 2014, 133, 343-354. [CrossRef]
- Housh, M. Optimizing bilinear multi-source water supply systems using mixed-integer linear programming approximations: An analysis of the Israeli seawater desalination array. Adv. Water Resour. 2023, 178, 1-13. [CrossRef]
- Nematollahi, B.; Nikoo, M.R.; Gandomi, A.H.; Talebbeydokhti, N.; Rakhshandehroo, G.R. A Multi-criteria Decision-making Optimization Model for Flood Management in Reservoirs. Water Resour. Manag. 2022, 36, 4933-4949. [CrossRef]
- Ayele, W.T.; Tenagashaw, D.Y.; Belew, A.Z.; Andualem, T.G. Optimal Water Allocation Under Climate Change, Based on Stochastic Dynamic Programming Model Approach in Ribb Reservoir, Amhara, Ethiopia. Water Conserv. Sci. Eng. 2022, 7, 33-44. [CrossRef]
- Yao, Z.; Wang, Z.; Zhao, C.H. Research on multi-objective optimal allocation of regional water resources based on improved sparrow search algorithm. J. Hydroinform. 2023, 25, 1413-1437. [CrossRef]
- Li, S.; He, Y.; Chen, X.; Zheng, Y. The improved bankruptcy method and its application in regional water resource allocation. J. Hydro-Environment Res. 2020, 28, 48-56. [CrossRef]
- Yuan, L.; He, W.; Liao, Z.; Degefu, D.M.; An, M.; Zhang, Z.; Wu, X. Allocating Water in the Mekong River Basin during the Dry Season. Water 2019, 11, 400. [CrossRef]
- Madani, K.; Zarezadeh, M.; Morid, S. A new framework for resolving conflicts over transboundary rivers using bankruptcy methods. Hydrol. Earth Syst. Sci. 2014, 18, 3055-3068. [CrossRef]
- Eleftheriadou, E.; Mylopoulos, Y. Game Theoretical Approach to Conflict Resolution in Transboundary Water Resources Management. J. Water Resour. Plan. Manag. 2008, 134, 466-473. [CrossRef]
- Kucukmehmetoglu, M. An integrative case study approach between game theory and Pareto frontier concepts for the transboundary water resources allocations. J. Hydrol. 2012, 450-451, 308-319. [CrossRef]
- Mehrparvar, M.; Ahmadi, A.; Safavi, H.R. Resolving water allocation conflicts using WEAP simulation model and non-cooperative game theory. Simulation, 2020, 96, 17-30. [CrossRef]
- Madani, K.; Hipel, K.W. Non-Cooperative Stability Definitions for Strategic Analysis of Generic Water Resources Conflicts. Water Resour. Manag. 2011, 25, 1949-1977. [CrossRef]
- Houba, H.; Do, K.H.P.; Zhu, X. Saving a river: A joint management approach to the Mekong River Basin. Environ. Dev. Econ. 2012, 18, 93-109. [CrossRef]
- Madani, K.; Hooshyar, M. A game theory-reinforcement learning (GT-RL) method to develop optimal operation policies for multi-operator reservoir systems. J. Hydrol. 2014, 519, 732-742. [CrossRef]
- Noori, M.; Emadi, A.; Fazloula, R. An agent-based model for water allocation optimization and comparison with the game theory approach. Water Sci. Tech-W. Sup. 2021, 21, 3584-3601. [CrossRef]
- Wu, X.; Whittington, D. Incentive compatibility and conflict resolution in international river basins: a case study of the Nile Basin. Water Resour. Res. 2006, 42, 336-336. [CrossRef]
- Far, S.M.; Ashofteh, P.S. Optimization Operation of Water Resources Using Game Theory and Marine Predator Algorithm. Water Resour. Manag. 2024, 38, 665-699. [CrossRef]
- Janjua, S.; Hassan, I. Use of bankruptcy methods for resolving interprovincial water conflicts over transboundary river: Case study of Indus River in Pakistan. River Res. Appl. 2020, 36(1): 1-11. [CrossRef]
- Mianabadi, H.; Mostert, E.; Zarghami, M.; van de Giesen, N. A new bankruptcy method for conflict resolution in water resources allocation. J. Manag. Eng. 2014, 144, 152-159. [CrossRef]
- Fletcher, S.; Hadjimichael, A.; Quinn, J.; Osman, K.; Giuliani, M.; Gold, D.; Figueroa, A.J.; Gordon, B. Equity in water resources planning: a path forward for decision support modelers. J. Water Res. Plan. Man. 2022, 148, 02522005. [CrossRef]
- Gullotta, A.; Campisano, A.; Creaco, E.; Modica, C. A Simplified Methodology for Optimal Location and Setting of Valves to Improve Equity in Intermittent Water Distribution Systems. Water Resour. Manag. 2021, 35, 1-18. [CrossRef]
- Nyahora, P.P.; Babel, M.S.; Ferras, D.; Emen, A. Multi-objective optimization for improving equity and reliability in intermittent water supply systems. Water Sci. Tech-W. Sup. 2020, 20,1592-1603. [CrossRef]
- Yang, G.; Giuliani, M.; Castelletti, A. Operationalizing equity in multipurpose water systems. Hydrol. Earth Syst. Sci. 2023, 27, 69-81. [CrossRef]
- Koh, H. Why do nations obey International Law? Yale Law J. 1997, 106, 2599-2659.
- Konow, J. Which is the fairest one of all? A positive analysis of justice theories. J. Econ. Lit. 2003, 41, 1188-1239. [CrossRef]
- Rahaman, M.M. Principles of transboundary water resources management and water-related agreements in Central Asia: an analysis. Int. J. Water Resour. Dev. 2012, 28, 475-491. [CrossRef]
- Shapley, L.S.; Shubik, S.M. A method for evaluating the distribution of power in a committee. Am. Polit. Sci. Rev. 1954, 48, 787-792.
- Loehman, E.; Orlando, J.; Tschirhart, J.; Whinston, A. Cost allocation for a regional wastewater treatment system. Water Resour. Res. 1979, 15, 193-202. [CrossRef]
- Dinar, A.; Howitt, R.E. Mechanisms for Allocation of Environmental Control Cost: Empirical Tests of Acceptability and Stability. J. Manag. Eng. 1997, 49, 183-203. [CrossRef]
- Masood, M.; Ahmad, I.; Sarwar, M.K.; Khan, N.M; Waseem, M.; Nabi, G.; Saleem, M. A Bilevel Multiobjective Model for Optimal Allocation of Water Resources in the Punjab Province of Pakistan. Arab. J. Sci. Eng. 2021, 46, 10597-10612. [CrossRef]
- Wu, W.; Zhao, X.; Zhang, X.; Wu, X.; Zhao, Y.; Guo, Q.; Yao, L.; Liu, X. An ordered multi-objective fuzzy stochastic approach to sustainable water resources management: a case study from Taiyuan City, China. Water Sci. Tech-W. Sup. 2024, 24, 10-11. [CrossRef]
- Hussein, H.; Grandi, M. Dynamic political contexts and power asymmetries: The cases of the Blue Nile and the Yarmouk Rivers. Int. Environ. Agreem. 2017, 17, 795-814. [CrossRef]
- Zeitoun, M.; Mirumachi, N.; Warner, J.F. Transboundary water interaction II. Int. Environ. Agreem. 2011, 11, 159-178. [CrossRef]
- Diakoulaki, D.; Mavrotas, G.; Papayannakis, L. Determining objective weights in multiple criteria problems: the critic method. Comput. Oper. Res. 1995, 22, 763-770. [CrossRef]
- Rostamzadeh, R.; Ghorabaee M.K.; Govindan, K.; Esmaeili, A.; Nobar, H.B.K. Evaluation of sustainable supply chain risk management using an integrated fuzzy TOPSIS-CRITIC approach. J. Clean. Prod., 2018, 175, 651-669. [CrossRef]
- Curiel, I.J.; Maschler, M.; Tijs, S.H. Bankruptcy games. Math. Methods Oper. Res. 1987, 31, 143-159.
- Wu, Q.; Xu, N. Improved interactive methods of multi-objective decision-making based on target satisfaction degree. J. Manag. Eng. 1996, 4, 217-222.
- Janjua, S.; Ali, M.U.; Kallu, K.D.; Zafar, A.; Hussain, S.J.; Gardezi, H.; Lee, S.W. An Asymmetric Bargaining Model for Natural-Gas Distribution. Appl. Sci. 2022, 12, 5677. [CrossRef]
- Shen J.; Zhang, H.; Zhao Y.; Jianfeng Song, J. An examination of the mitigation effect of vegetation restoration on regional water poverty: Based on panel data analysis of 9 provinces in the Yellow River basin of China from 1999 to 2019. Ecol. Indic. 2023, 146, 109860.
- Gao, R.; Chen, H.; Wei, C.; Jiang, Y.; Zeng, S.; Zhang, C.; Jin, Y.; Zhang, W. Research Hotspots and Trends in the Environment Condition of the Yellow River Basin (2014-2024): A Bibliometric and Visualization. Water 2024, 16, 2359. [CrossRef]
- Omer, A.; Ma, Z.; Xing, Y.; Zheng Z.; Saleem, F. A hydrological perspective on drought risk-assessment in the Yellow River Basin under future anthropogenic activities. J. Manag. Eng. 2021, 289, 112429. [CrossRef]
- Yin, L.; Feng, X.; Fu, B.; Wang, S., Wang, X., Chen, Y.; et al. A Coupled Human-Natural System Analysis of Water Yield in the Yellow River basin, China. Sci. Total Environ. 2021, 762, 143141. [CrossRef]
- Zhao, F.; Ma, S.; Wu, Y. Changes in Dry-Season Water Availability and Attributions in the Yellow River Basin, China. Front. Environ. Sci. 2021, 9, 762137. [CrossRef]
- Sun, X.; Zhou, Z.; Wang, Y. Water resource carrying capacity and obstacle factors in the Yellow River basin based on the RBF neural network model. Environ. Sci. Pollut. R. 2023, 30, 22743-22759. [CrossRef]
- Yang, Y.; Zhao, J.; Cai, X. Decentralized Optimization Method for Water Allocation Management in the Yellow River Basin. J. Water Res. Plan. Man. 2012, 138, 313-325. [CrossRef]
- Zhou, K.; Wang, Y.; Chang, J.; Zhou, S.; Guo, A. Spatial and Temporal Evolution of Drought Characteristics Across the Yellow River basin. Ecol. Indic. 2021, 131, 108207. [CrossRef]
- Herrero, C.; Villar, A. The three musketeers: four classical solutions to bankruptcy problems. Math. Soc. Sci. 2001, 42, 307-328. [CrossRef]
- Thomson, W. Axiomatic and game-theoretic analysis of bankruptcy and taxation problems: an update. Mathe. Soc. Sci. 2015, 74: 41-59. [CrossRef]
- U.N. Watercourses Convention. Convention on the Law of the Non-navigational Uses of International Watercourses, Adopted by the General Assembly of the United Nations on 21 May 1997.
Figure 2.
Geographical location of the Yellow River Basin in China.
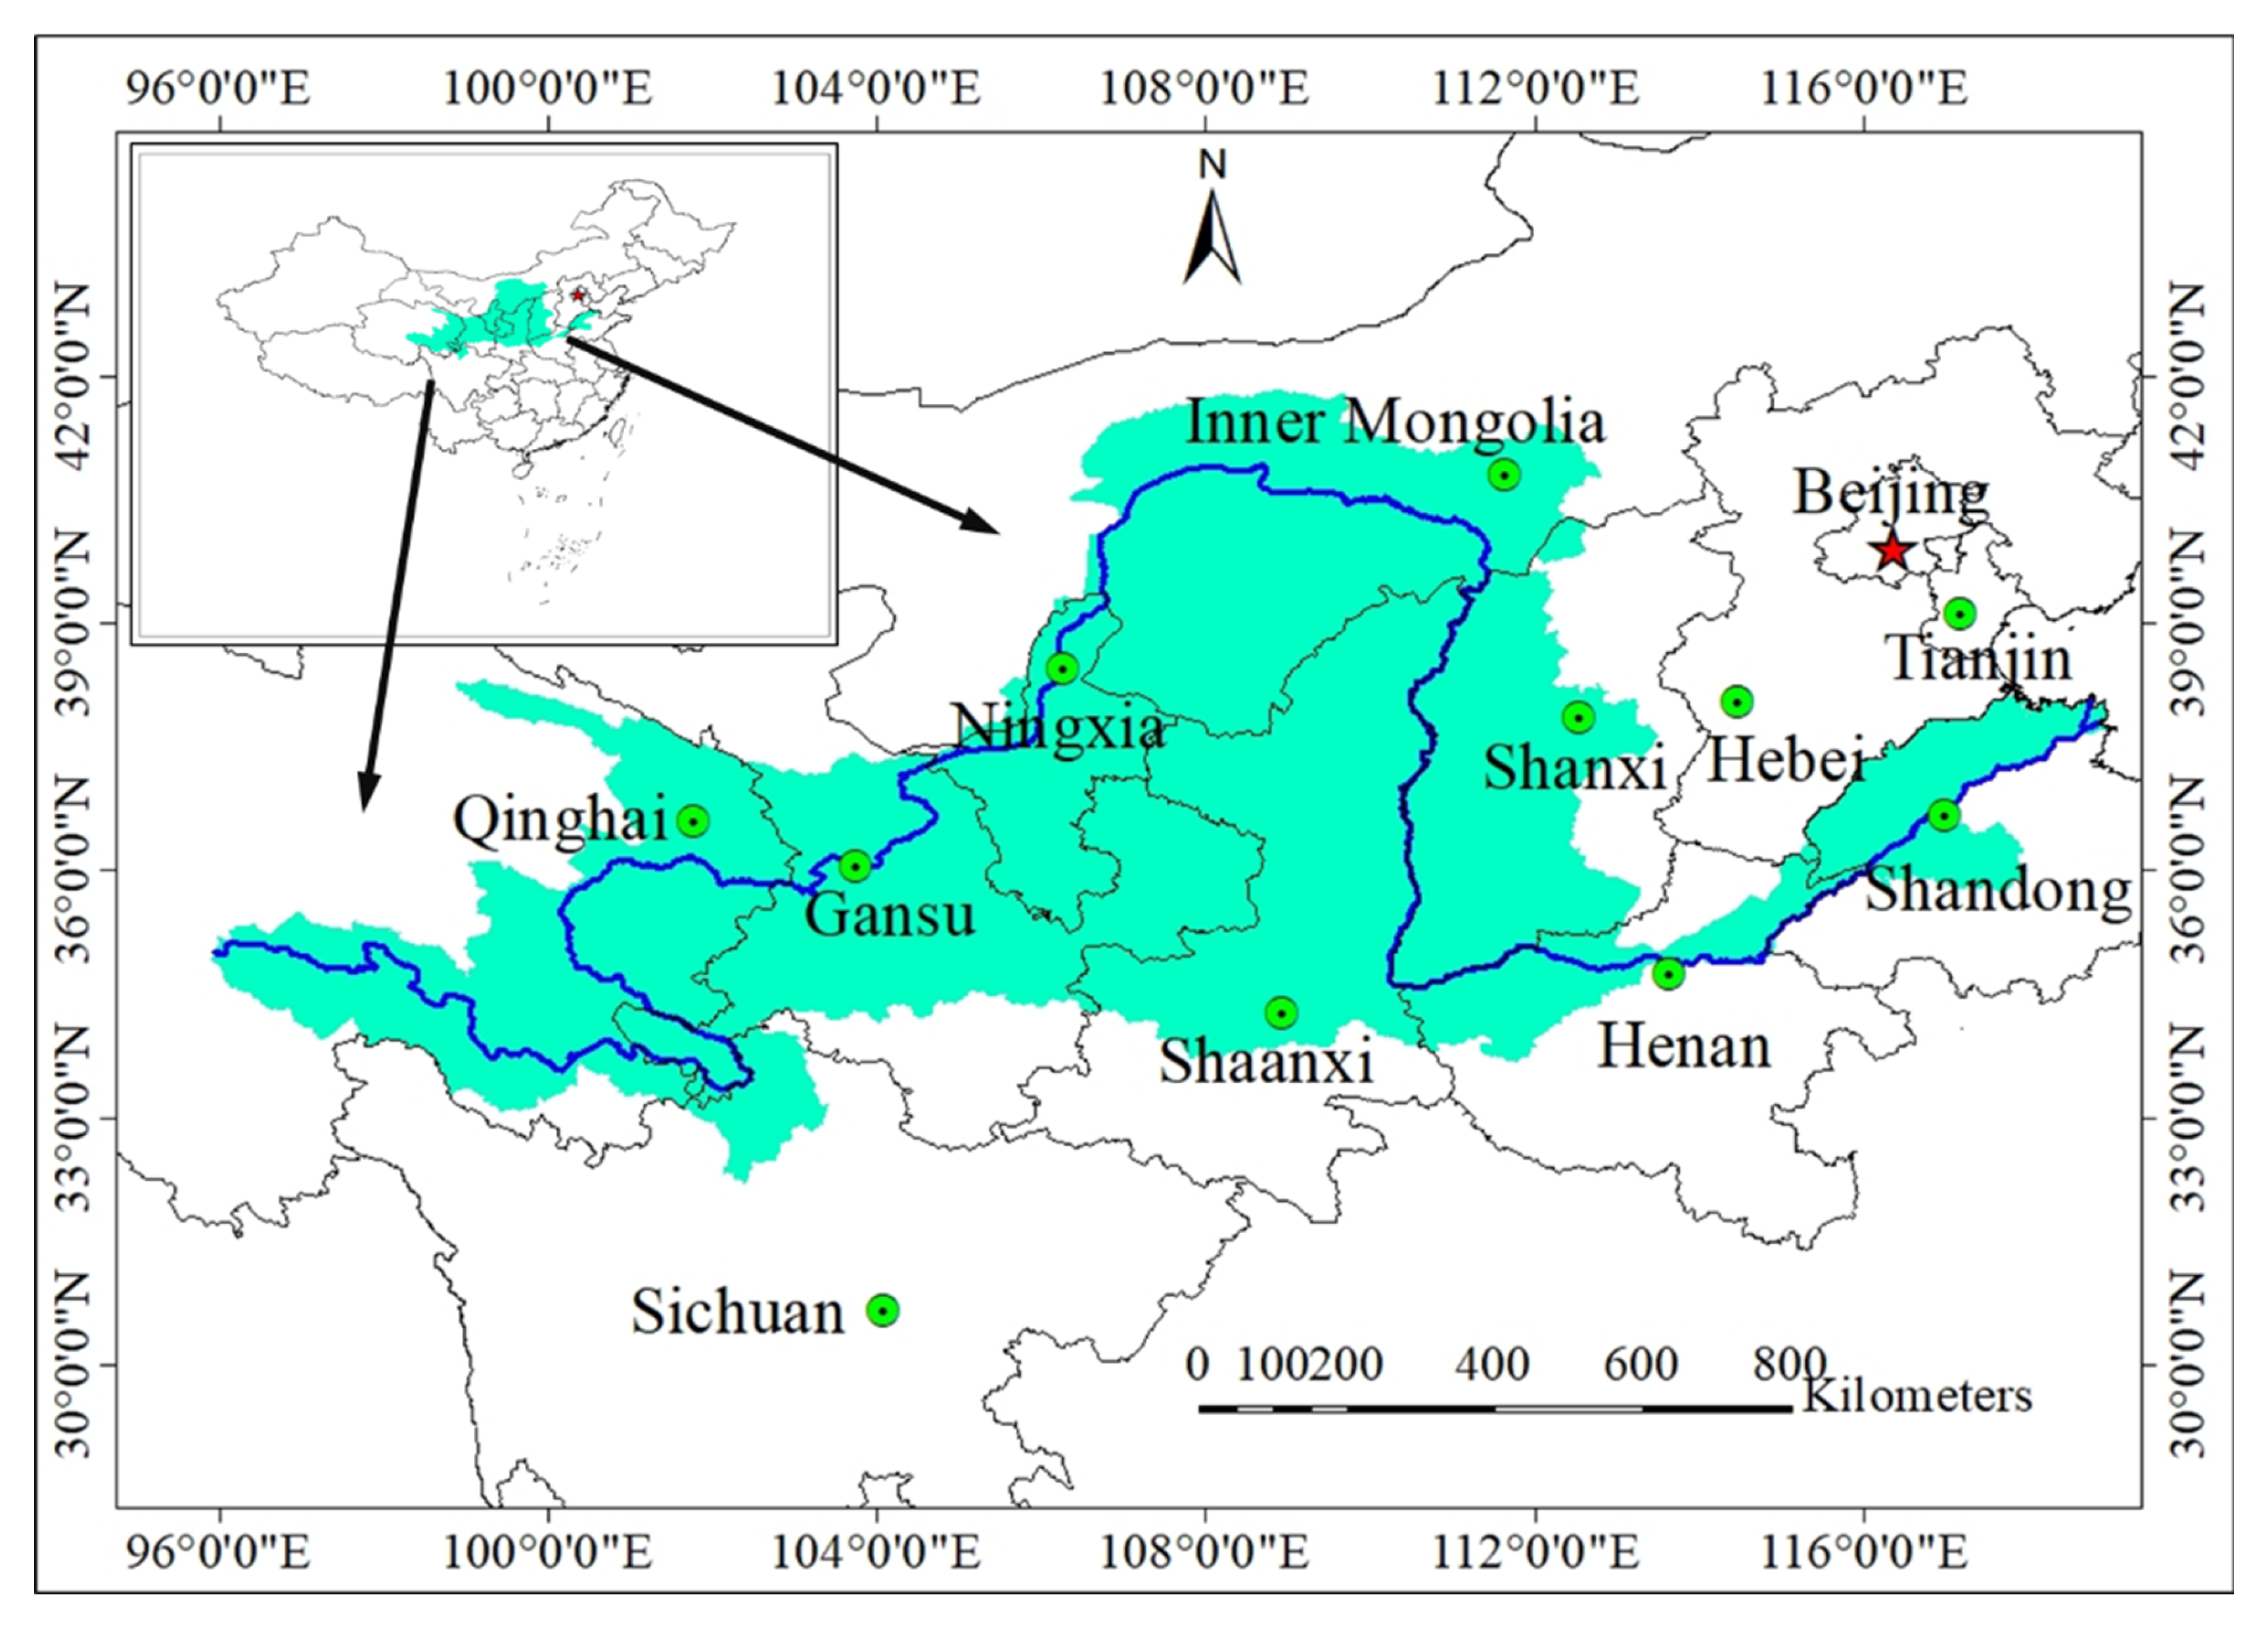
Figure 3.
Water consumption of each province in YRB.
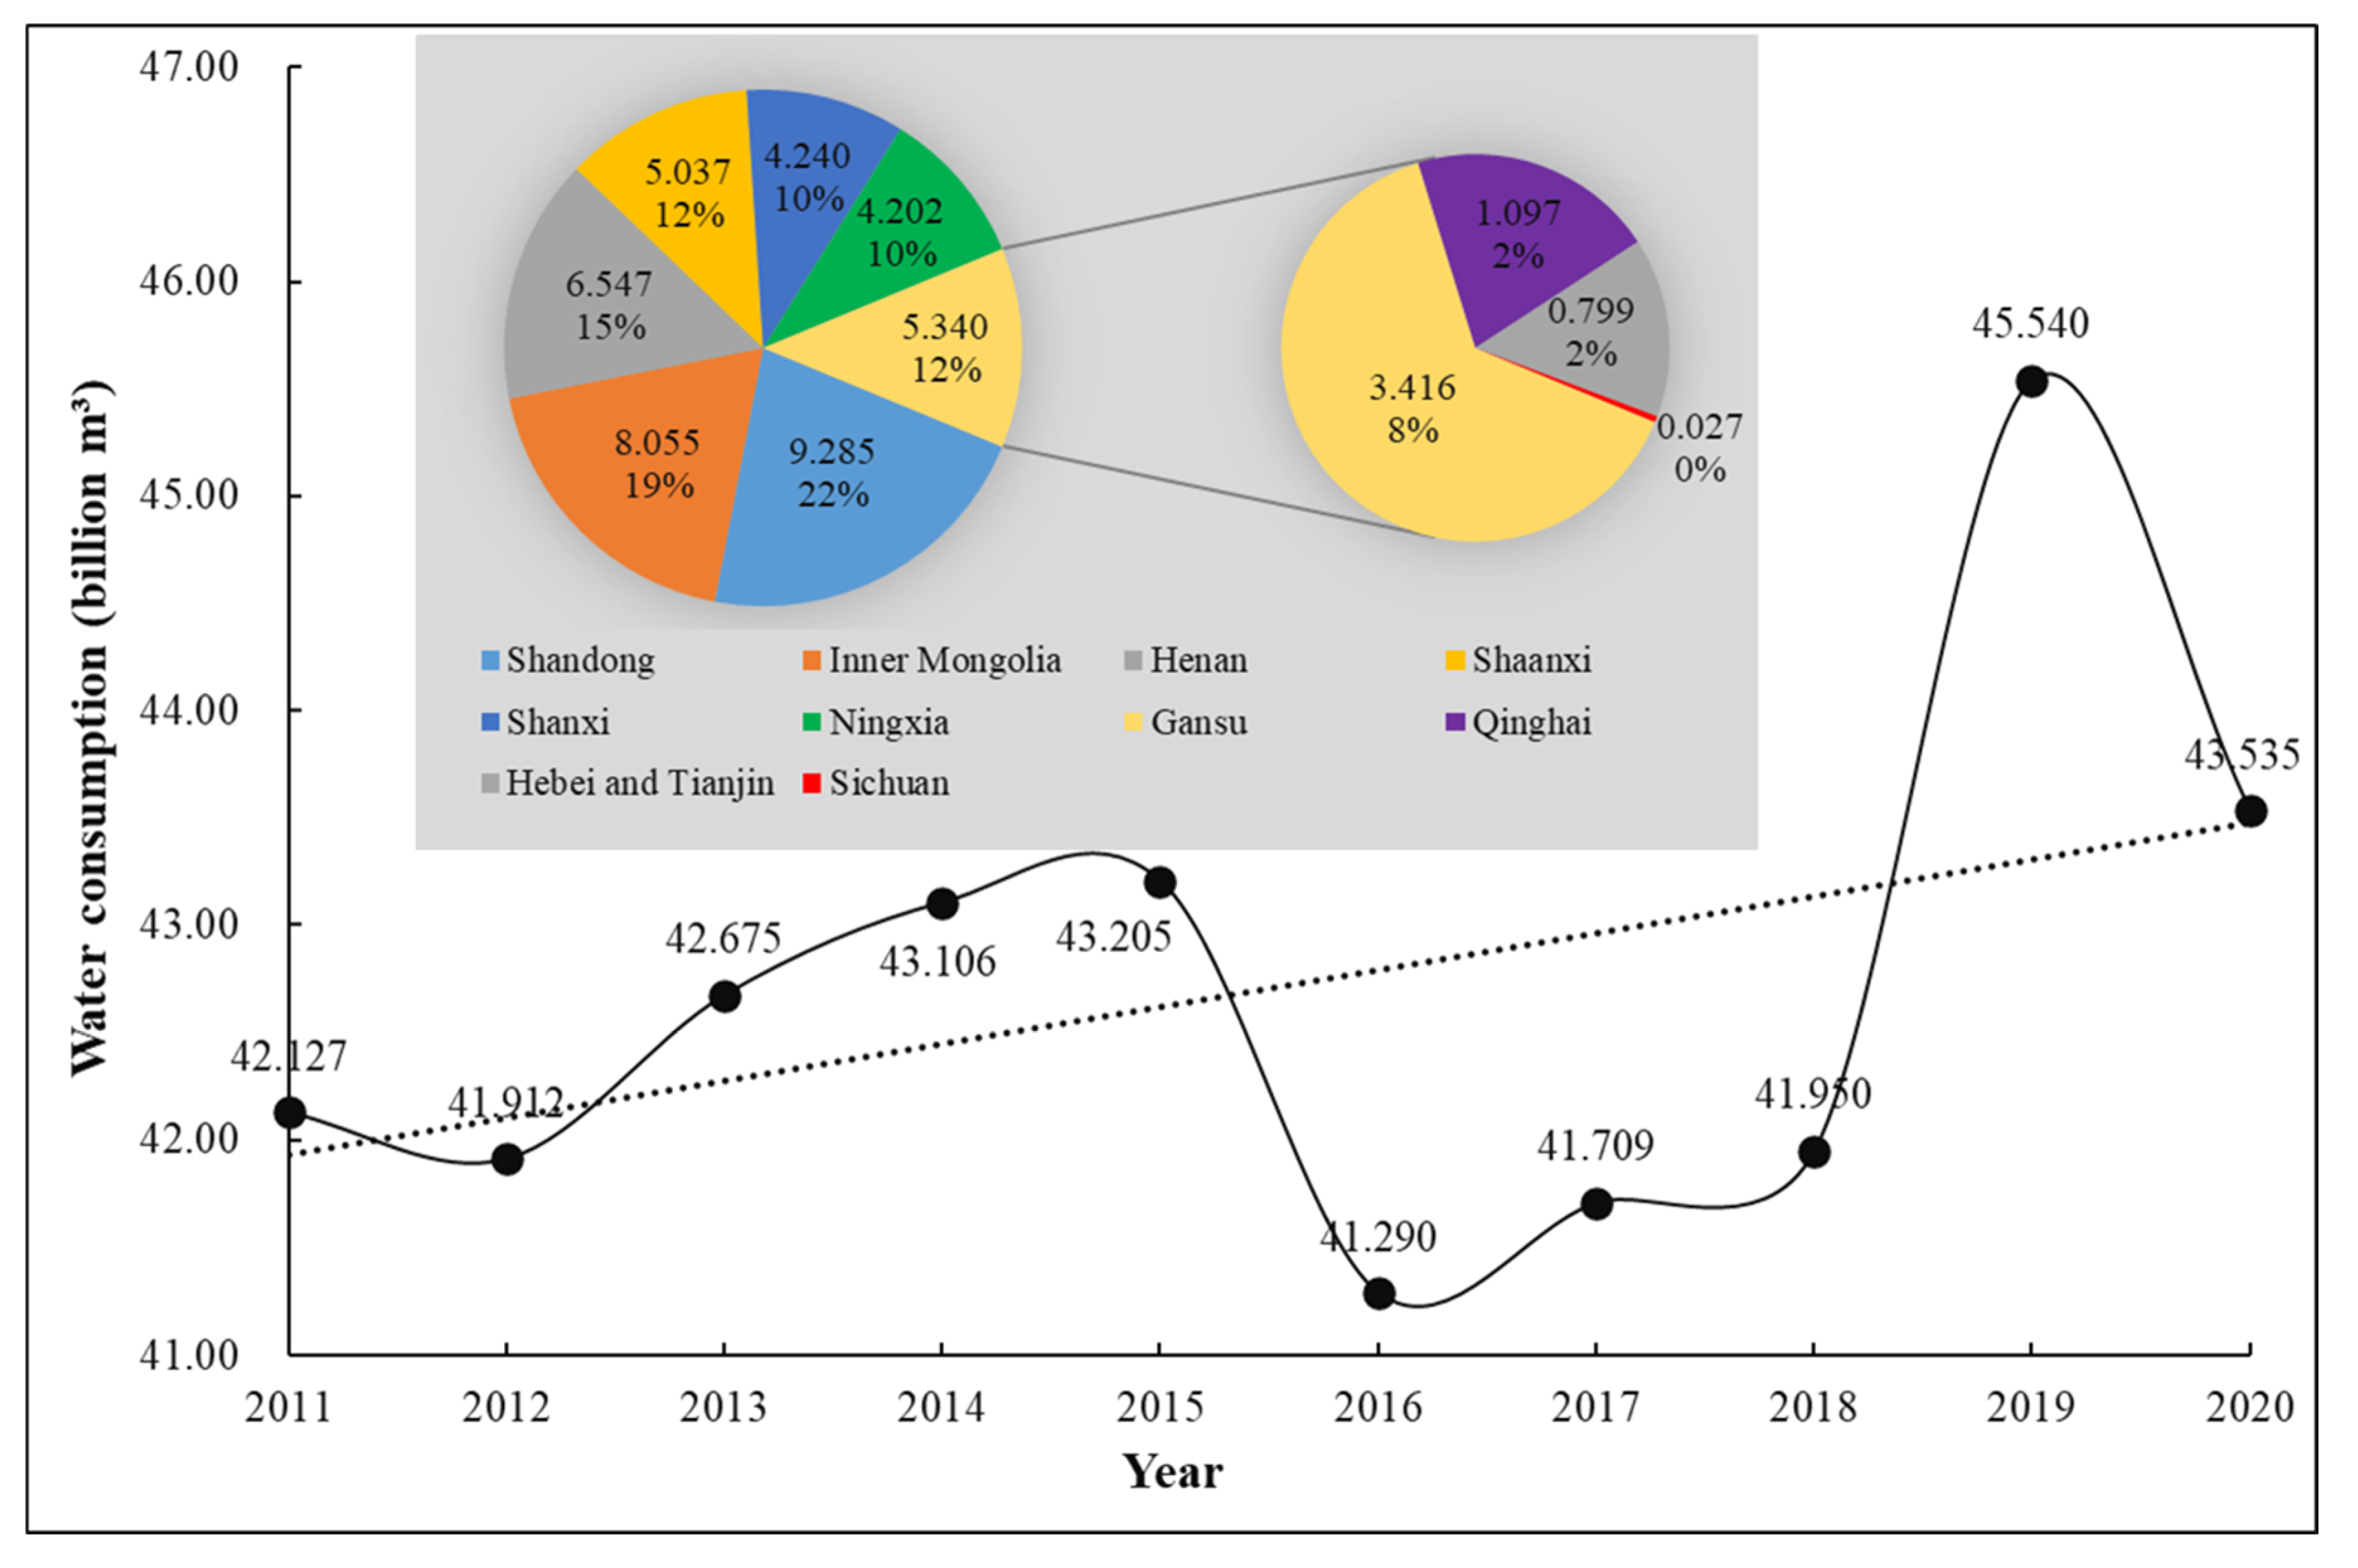
Figure 5.
Water allocation satisfaction of nine agents in YRB under different allocation methods.
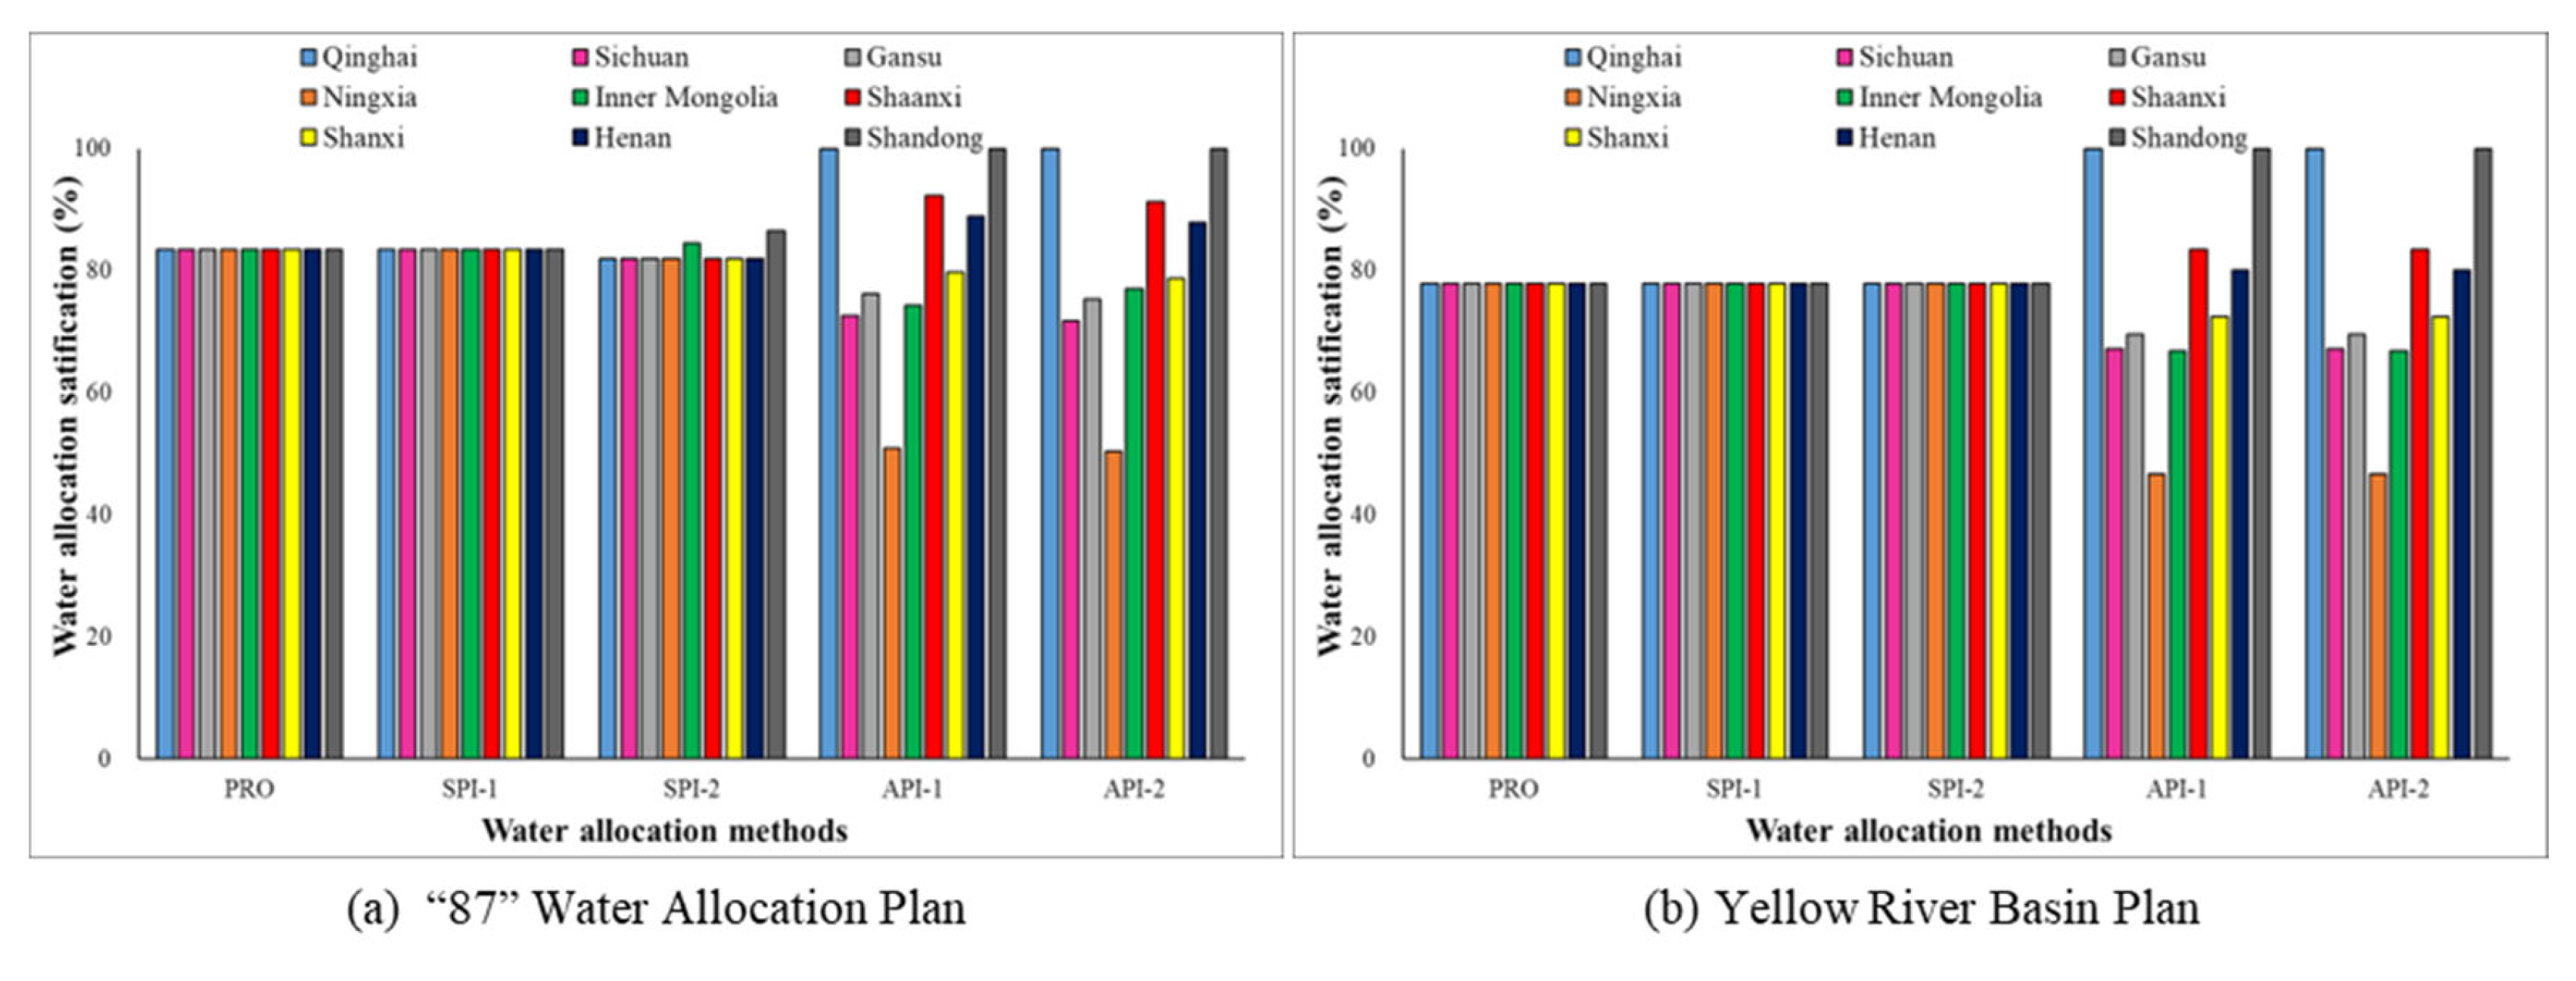
Figure 7.
Quantitative results of the willingness of nine agents in YRB to cooperate and the stability of the solutions in equal and asymmetric negotiation cases.
Figure 7.
Quantitative results of the willingness of nine agents in YRB to cooperate and the stability of the solutions in equal and asymmetric negotiation cases.
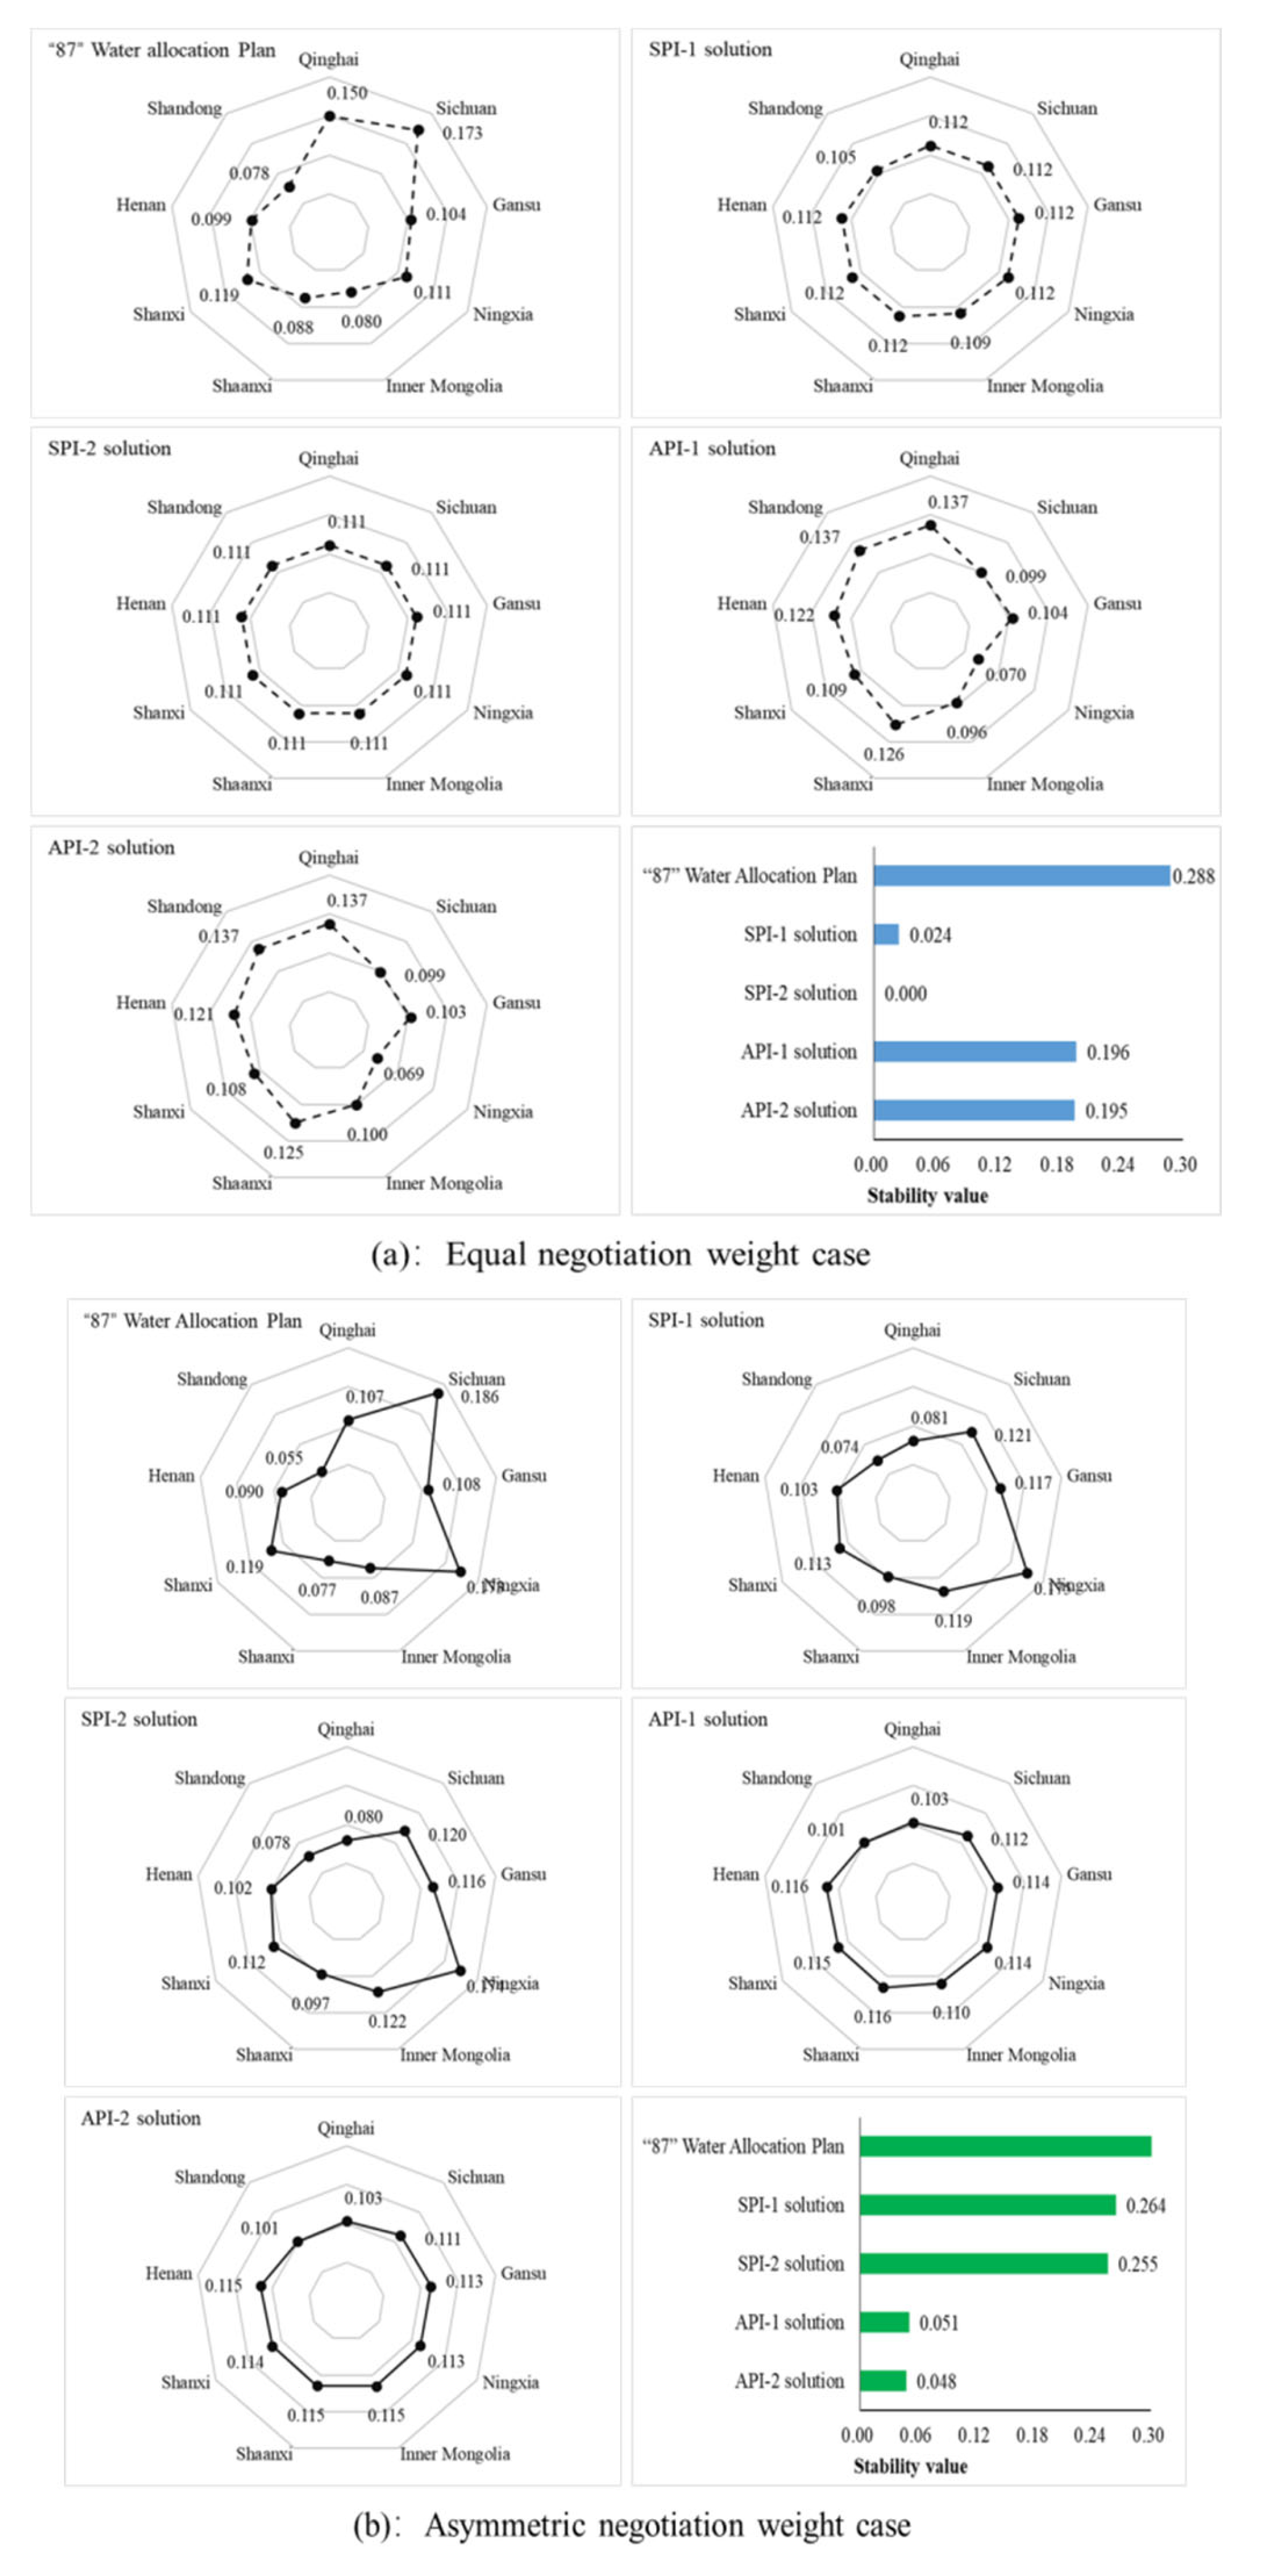
Table 1.
Representative indicators that used to quantify agent’s external negotiation power.
| Objective layer | Criterion layer | Indicator layer | Unit | Attribute |
|---|---|---|---|---|
| Solving the transboundary water allocation conflicts under scarcity | Water contribution | Proportion of annual average runoff to the total runoff of the entire watershed | % | Positive |
| Respecting the current situation | Current water consumption | 108 m3 | Positive | |
| Economic efficiency | Economic output per cubic meter of water consumption | Yuan/m3 | Positive | |
| Eco-environmental sustainability | Reserved water for inner-river eco-environment | 108 m3 | Positive | |
| Sewage discharged | 108 ton | Negative |
Table 2.
Water allocations of the “87” Water Allocation Plan and the Yellow River Basin Plan unit: billion m³.
Table 2.
Water allocations of the “87” Water Allocation Plan and the Yellow River Basin Plan unit: billion m³.
| Existing planning | Decision-making agents | Off-stream water allocation | Inner-river water allocation | Total | |||||||||
| Qinghai | Sichuan | Gansu | Ningxia | Inner Mongolia | Shaanxi | Shanxi | Henan | Shandong | Hebei and Tianjin | ||||
| “87” Water Allocation Plan | 1.410 | 0.040 | 3.040 | 4.000 | 5.860 | 3.800 | 4.310 | 5.540 | 7.000 | 2.000 | 37.000 | 21.000 | 58.000 |
| Yellow River Basin Plan | 1.316 | 0.037 | 2.837 | 3.732 | 5.468 | 3.546 | 4.022 | 5.169 | 6.532 | 0.620 | 33.279 | 18.700 | 51.979 |
Table 3.
Representative indicators that used to quantify the external negotiation power of nine agents in YRB.
Table 3.
Representative indicators that used to quantify the external negotiation power of nine agents in YRB.
| Indicator | Unit | Decision-making agents | ||||||||
| Qinghai | Sichuan | Gansu | Ningxia | Inner Mongolia | Shaanxi | Shanxi | Henan | Shandong | ||
| Proportion of annual average runoff to the total runoff of the entire watershed | % | 34.05 | 7.82 | 20.11 | 1.56 | 3.44 | 14.94 | 8.15 | 7.18 | 2.75 |
| Current water consumption | 108 m3 | 10.64 | 0.20 | 30.30 | 44.19 | 84.52 | 50.09 | 43.03 | 65.18 | 88.87 |
| Economic output per cubic meter of water consumption | Yuan/m3 | 123.80 | 205.18 | 82.05 | 55.85 | 89.30 | 288.98 | 242.47 | 231.96 | 328.67 |
| Reserved water for riverine eco-environment | 108 m3 | 71.51 | 16.43 | 42.22 | 3.29 | 7.23 | 31.36 | 17.12 | 15.08 | 5.78 |
| Sewage discharged | 108 ton | 1.41 | 0.03 | 4.72 | 3.12 | 5.72 | 9.89 | 6.64 | 6.94 | 5.54 |
Table 4.
Minimum water allocations of nine agents in YRB unit: billion m³.
|
Existing planning |
Decision-making agents | Total | ||||||||
| Qinghai | Sichuan | Gansu | Ningxia | Inner Mongolia | Shaanxi | Shanxi | Henan | Shandong | ||
| Water demand | 1.097 | 0.027 | 3.416 | 4.202 | 8.055 | 5.037 | 4.240 | 6.547 | 9.285 | 41.906 |
| “87” Water Allocation Plan | 0 | 0 | 0 | 0 | 1.149 | 0 | 0 | 0 | 2.379 | 3.528 |
| Yellow River Basin Plan | 0 | 0 | 0 | 0 | 0 | 0 | 0 | 0 | 0.038 | 0.038 |
Table 6.
Comparison results of water allocation satisfaction between the solutions with and without considering the agent’s minimum water allocation unit: %.
Table 6.
Comparison results of water allocation satisfaction between the solutions with and without considering the agent’s minimum water allocation unit: %.
| Agents | “87” Water Allocation Plan | Yellow River Basin Plan | ||
|---|---|---|---|---|
| SPI-2 ~ SPI-1 | API-2~API-1 | SPI-2 ~ SPI-1 | API-2~API-1 | |
| Qinghai | -1.52 | 0.00 | -0.02 | 0.00 |
| Sichuan | -1.52 | -0.71 | -0.02 | 0.00 |
| Gansu | -1.52 | -0.81 | -0.02 | 0.00 |
| Ningxia | -1.52 | -0.53 | -0.02 | 0.00 |
| Inner Mongolia | 1.05 | 2.58 | -0.02 | 0.00 |
| Shaanxi | -1.52 | -1.04 | -0.02 | 0.00 |
| Shanxi | -1.51 | -0.87 | -0.02 | 0.00 |
| Henan | -1.52 | -1.04 | -0.02 | 0.00 |
| Shandong | 3.10 | 0.00 | 0.07 | 0.00 |
Note: (1) SPI-2 ~ SPI-1 denotes the water allocation satisfaction changes of the agents under SPI-2 solution relative to SPI-1 solution; (2) API-2 ~ API-1 denotes the water allocation satisfaction of the agents under API-2 solution relative to API-1 solution.
Table 7.
Comparison results of water allocation satisfaction between the two plans customized for division of YRB and the API-2 solution unit: %.
Table 7.
Comparison results of water allocation satisfaction between the two plans customized for division of YRB and the API-2 solution unit: %.
| Agents | Water allocation satisfaction | Relative changes in water allocation satisfaction | ||
|---|---|---|---|---|
| “87” Water Allocation Plan | Yellow River Basin Plan | “87” Water Allocation Plan | Yellow River Basin Plan | |
| Qinghai | 128.49 | 119.92 | -28.49 | -19.92 |
| Sichuan | 148.15 | 137.04 | -76.25 | -69.82 |
| Gansu | 88.99 | 83.05 | -13.58 | -13.40 |
| Ningxia | 95.20 | 88.82 | -44.81 | -42.19 |
| Inner Mongolia | 72.75 | 67.88 | 4.26 | -0.96 |
| Shaanxi | 75.45 | 70.41 | 15.83 | 13.13 |
| Shanxi | 101.65 | 94.86 | -22.80 | -22.29 |
| Henan | 84.62 | 78.95 | 3.37 | 1.15 |
| Shandong | 75.39 | 70.35 | 24.61 | 29.65 |
Disclaimer/Publisher’s Note: The statements, opinions and data contained in all publications are solely those of the individual author(s) and contributor(s) and not of MDPI and/or the editor(s). MDPI and/or the editor(s) disclaim responsibility for any injury to people or property resulting from any ideas, methods, instructions or products referred to in the content. |
© 2024 by the authors. Licensee MDPI, Basel, Switzerland. This article is an open access article distributed under the terms and conditions of the Creative Commons Attribution (CC BY) license (http://creativecommons.org/licenses/by/4.0/).
Copyright: This open access article is published under a Creative Commons CC BY 4.0 license, which permit the free download, distribution, and reuse, provided that the author and preprint are cited in any reuse.


