Submitted:
02 September 2024
Posted:
03 September 2024
You are already at the latest version
Abstract
Malta produces approximately 15,000 tons of bluefin tuna every year, by-products are estimated to count for 55% of the harvest. Maltese tuna farmers established a company that processes these by-products into fish meal and oil that are sold to the pet food industry. In this study the logistic of tuna farming and management in Malta was analysed and the environmental impact of the activity was estimated. The biomass quality and the preservation state of tuna head and liver was assessed. The head had the highest ash content (1.68±0.02%) while the liver had the highest protein content (16.18±0.02%) and the highest crude fat, (34.87±0.76%). The highest concentration of oil was found in the head’s skin (50.07±0.84%). The predominant saturated fatty acids (SFAs) were c14:0, c16:0 and c18:0. Monounsaturated FAs (MUFAs) were the major fatty acids present in all samples, with the highest values in the tuna head. The oxidation levels found in the by-products upon arrival at the processing plant doesn’t compromise their quality. No histamine formation was predicted. Some oxidation was observed in the oil after extraction. The Life Cycle Assessment estimated that the environmental score of the activity is 105pts per ton of fishmeal and 25kg of oil produced (2.82 tCO2 eq). It is concluded that the processing of tuna by-products in Malta is a sustainable alternative to traditional disposal methods and their quality is high enough to be used as a source of proteins and lipids in farmed-animals feed.
Keywords:
aquaculture by-products
; lipid oxidation
; preservation
; fatty acids profile
; protein content
; life cycle assessment
1. Introduction
Bluefin tuna (Thunnus thynnus) is one of the most valuable fishery species in the world[1]. Commercial tuna fisheries represent a significant part of the blue economy since tunas are among the most commercially valuable fish species on the planet [2]. Atlantic bluefin tuna is historically part of the fishing tradition in Maltese waters. Maltese tuna exports have been expanding since the 1990s as consequence of an increasing demand for tuna fillet from the Japanese sushi and sashimi industry[3]. Tuna farming represents about 96% of Maltese aquaculture production [4]. In 2022, Malta produced 15,816 tons of bluefin tuna. However, tuna farming is also associated with several environmental concerns[5]. One of the problems is the management of the residual biomass that remains after filleting the fish. This biomass is constituted mainly by heads, guts and bones and it is estimated that it represents 55% of the fish biomass[6]. In the Mediterranean area this by-product is usually either dumped offshore or incinerated. These management systems are highly unsustainable. Malta is one of the few Mediterranean countries that implemented a system to turn tuna by-product into a valuable resource. Maltese tuna farmers came together to create a company, Aquaculture Resources Limited (ARL), that built a processing plant on the state island to process the tuna by-products into fishmeal and fish oil. These products are then sold to the pet food industry.
Tuna by-products are a valuable source of high-value nutrients such as proteins[7] and lipids[8]. However, the high content of lipids and the presence of pro-oxidants in the biomass such as haemoglobin and enzymes, makes fish by-products very susceptible to lipid oxidation, causing detrimental effects to the quality of the biomass[9]. The formation of histamine is a further deterioration process that must be managed to avoid toxicity of the final products[10]. For these reasons, the utilisation of these by-products is often hampered by logistic challenges that generate obstacles to the preservation of the biomass before its processing. Moreover, the high percentage of bones in the biomass can be also an obstacle to its valorisation.
While the Maltese case is recognised as a successful example of reutilisation of tuna by-products within a circular economy system, little is known about the quality of the biomass when it is processed and how this is preserved during transportation to the processing plant. Moreover, the environmental impact of the processing plant should also be analysed to assess the sustainability of the system developed.
The aim of the present study was to analyse the quality of the bluefin tuna by-products generated by Maltese tuna farms and assess their potential utilisation in the farmed animals feed industry. In particular, the study focused on the compositional analysis and the preservation state of the by-products. The study started with an interview with a representative of ARL to gather information about the logistics of tuna farming and by-products management. Samples of tuna by-products were then collected and analysed to determine the preservation state and the protein and lipids content. Finally, the environmental impact of the tuna by-products processing into fishmeal and fish oil was estimated through a Life Cycle Assessment (LCA).
Overall, the study investigates the application of the principles of circular economy on a small island, it highlights the importance of logistics for the successful implementation of circular economy, and it poses the bases for the utilisation of tuna by-products in the sector of farmed-animal feed.
2. Results and Discussion
2.1. Tuna Farming and By-Product Management in Malta
This section reports information gathered from official government websites and from the answers provided by a representative of ARL during the interview carried out in summer 2022. The complete interview is reported in Supplementary Material I.
According to the Aquaculture Operations Register of Malta[11], the Maltese tuna industry is sustained by six companies (Table 1). The tuna farmers operate in a specifically assigned Aquaculture Zone located on the North coast and 6 km off the South-East coast.
The shareholders of ARL are AJD Tuna Ltd, Fish and Fish Ltd and MFF Ltd. Together, they represent 75% of the bluefin tuna farming operations in Malta. The company has received a granting of the permit for a period of 10 years (case number IP 00103/22).
The bluefin tuna harvesting season starts in October and ends in January/February. Harvest and processing operations are under the guidance of the Maltese Department of Aquaculture and Fisheries (DFA). Due to the limited number of processing vessels, there are usually three of the six farmers processing together. The tuna is harvested from the pens and transferred to the processing vessels by auxiliary boats. The tuna is sorted into two main sizes: small (160 kg on average, range between 100 and 190 kg) and big (225 kg on average, range between 190 and 250 kg). The fish processing, which includes cleaning, gutting, and filleting, takes about 20 minutes before the fillets are stored at -60°C. The final product is then shipped to Asian markets. The by-product (head, viscera and bones) is stored on the vessel´s dock, not refrigerated. Until 2021, the by-products were discharged into the sea at 12 nautical miles from the coast within the day. Starting from 2022, the discharge of the tuna by-products into the sea is regulated by a new operational arm of the Federation of Maltese Aquaculture Producers (FMAP) named Aquaculture Resources Limited (ARL), which is responsible of the transformation of the tuna by-products into fishmeal and fish oil using a new processing plant specifically built on the Maltese island.
Tuna by-products are packed into Jumbo bags and transported from the processing vessels to the freeport in Birżebbuġa (MT), where are transferred into bins of approximately 1ton inside a refrigerated container. After an inspection by the health authority, they are moved to ARL’s processing facility.
The plant has a maximum storage capacity of 100tons. All by-products are processed within 24h from the harvesting. Different components of the by-product are not separated, the mixture is processed into fish meal and fish oil following the procedure described in Windsor (2011). The plant processes exclusively tuna by-products. About 6,000tons of biomass are processed every year (approximately 100tons per day during harvest season). Following the treatment process, the plant can store about 25tons of fish meal (equivalent to about 1 day of operations) and 90m3 of fish oil (equivalent to about 3 days of operation). The investment in the ARL’s facility has been made to aim at the manufacture of products intended for human consumption (e.g. food supplements) and for the pharmaceutical and cosmetic industry. However, at present, the fishmeal and fish oil produced by ARL are used for the pet food industry. The major challenges identified that prevent the utilisation of the tuna by-product for different purposes are the lack of refrigerated space on the vessels and the difficulties in separating efficiently the product into different parts (e.g. head, liver, guts). Given the effort that would be required to separate the by-products, the price of extracted bio-active compounds would be probably very high.
2.2. Proximate Composition
The analysis of the proximate composition of the samples showed a variation in the DM across different body parts, ranging between 25.81±0.11% in the head and 51.95±0.74% in the liver (Figure 1a). The highest ash content (Figure 1b) was found in the head samples (1.68±0.02%), followed by the mixed samples (1.49±0.01%) and by the liver (0.78±0.02%). The liver had the highest CP content (16.18±0.02%) (Figure1c), compared to the head (3.32±0.36%) and the mixed samples (11.22±0.18%). The crude fat, expressed as Ether Extract (EE), was highest in the liver (34.87±0.76%), while the head and the mixed samples contained 20.68±0.45% and 30.78±0.14% of EE, respectively (Figure1d).
When comparing the results of this study with other published results, the heads collected in the Maltese farm have higher lipids content and lower protein and ash content. In a study published in 2020[13], the authors analysed the composition of the heads of yellowfin tuna (Thunnus albacares) and they reported that the biomass had a composition of 15.1% protein, 7.7% lipid and 5.18% ash. Similar results were also reported in another study analysing the composition of yellowfin tuna head [14]. Another study carried out in 2012[15] focused on the composition of the head of bluefin tuna and the authors reported that the biomass had a composition of 12.1% protein, 10.4% lipid and 7.9% ash. The reduced protein content in the samples might be due to protein degradation during the hours between samples collection and storage. As highlighted before, the refrigerated space on the vessel is used for the fillets, while the tuna by-products are kept on the deck for several hours before being transported to the processing plant. This highlights the importance of adapting logistic operations to improve the utilisation of fish by-products.
It is also important to notice the high ash content that is probably due to the presence of bones in the raw material [16]. The high ash content might reduce the availability of nutrients such as phosphorus and calcium in the bones which can affect overall animal performance[17]. A way to avoid such detrimental effect would be to remove the excess of bones before processing to obtain a better quality of the final product.
2.3. Fatty Acids Profile in the Entire By-Product’s Biomass
The Fatty Acid (FA) composition of the different samples is presented in Table 2. A total of 25 FA was identified. The predominant Saturated Fatty Acids (SFAs) were c14:0, c16:0 and c18:0. The predominance of these SFAs is in accordance with the results of Messina et al.[8], who compared the FA profile of tuna by-products from tuna farmed in Sicily (IT) and wild caught. The author found, for farmed tuna, approximately 6%, 20% and 4.5% of c14:0, c16:0 and c18:0, respectively. The main difference between the present study and the study carried out in by Messina et al., is that, in the latter, the tuna by-products were not separated. In the present study, the percentages of c14:0, c16:0 and c18:18 in the mixed samples (head + liver) were 2.8%, 9% and 2.8%, respectively. These percentages are slightly lower than those measured in the tuna by-products sampled in Sicily. The difference can be due to annual environmental variations as well as to different amount of different by products components present (e.g., skin, bones, guts). The percentages reported by Messina et al.[8] are similar to those measured in another study[18] in the tuna head’s meat (5.6%, 18.8% and 5.8% of c14:0, c16:0 and c18:0, respectively). Honrado et al.[18] found, in the tuna liver, 5.74%, 16.9% and 5.94% of c14:0, c16:0 and c18:0, respectively. These percentages are also slightly higher than those measured in the liver in the present study (0.8%, 4.4% and 2.2%, respectively).
Considering the total FA (TFA) and compared to polyunsaturated fatty acids (PUFA) and SFA, monounsaturated FA (MUFA) were the major fatty acids present in all samples, with highest values recorded in the head and in the mixed samples.
The same results occurred for PUFAs, DHA and EPA contents, with head and mixed samples containing the highest amounts compared to the liver. Both head and mixed samples had also higher levels of n3 and n6 than the liver.

Table 2.
Fatty acids profile in tuna head, liver and mixed samples (head + liver). The results are expressed in mg·g Dry Matter -1. N=2.
Table 2.
Fatty acids profile in tuna head, liver and mixed samples (head + liver). The results are expressed in mg·g Dry Matter -1. N=2.
| Fatty Acid | Head | Liver | Mixed samples | ||||
| Mean | St DEV | Mean | St. Dev. | Mean | St. Dev. | ||
| c12:0 | lauric acid | 25.6 | 8.04 | 15.66 | 0.78 | 24.15 | 3.80 |
| c14:0 | myristic acid | 2827.55 | 401.76 | 777.69 | 38.06 | 2784.87 | 89.03 |
| c15iso | 13-methylmyristic acid | 84.59 | 9.80 | 27.71 | 0.21 | 69.57 | 1.87 |
| c15aiso | 12-methyltetradecanoic acid | 18.23 | 3.95 | 7.00 | 1.44 | 17.38 | 3.38 |
| c14:1+c15 | myristoleic acid + Pentadecanoic acid | 299.49 | 39.68 | 117.13 | 5.35 | 249.29 | 3.59 |
| c16:0 | palmitic acid | 9428.36 | 1291.51 | 44537.19 | 51709.6 | 9024.02 | 2.32 |
| c17iso | 15-methyl hexadecanoic acid | 340.25 | 73.32 | 325.43 | 25.07 | 282.76 | 5.18 |
| c17aiso | aiso-heptadecanoic acid | 168.43 | 24.39 | 259.46 | 0.13 | 230.71 | 3.72 |
| c16:1c9 | palmitoleic acid. | 2881.90 | 327.62 | 1764.88 | 75.62 | 2453.24 | 40.23 |
| c17:0 | heptadecanoic acid | 338.99 | 54.36 | 199.94 | 5.61 | 307.33 | 0.85 |
| c17:1c9 | cis-10-heptadecenoic acid | 183.74 | 37.29 | 164.69 | 5.25 | 163.98 | 0.59 |
| c18:0 | stearic acid | 2766.42 | 559.67 | 2242.45 | 118.91 | 2297.96 | 2.32 |
| c18:1t | trans-oleic acid | 625.93 | 32.82 | 2034.81 | 27.29 | 919.31 | 14.69 |
| c18:1c9 | cis-oleic acid | 8725.76 | 987.67 | 8341.31 | 922.76 | 8015.32 | 41.78 |
| c18:1c11 | cis-11-octadecenoic acid | 1777.76 | 253.61 | 1792.63 | 20.55 | 1621.24 | 19.53 |
| c18:2n6 | linoleic acid | 785.70 | 103.04 | 423.50 | 17.98 | 745.78 | 34.10 |
| c20:0 | arachidic acid | 131.77 | 2.86 | 89.83 | 1.72 | 156.52 | 29.78 |
| c18:3n6 | gamma-linolenic acid | 84.63 | 16.92 | 73.55 | 1.99 | 74.82 | 3.78 |
| c20:1n9 | eicosenoic acid | 2270.22 | 10.12 | 2558.33 | 142.92 | 2410.18 | 56.24 |
| c20:1n11 | eicosenoic acid | 146.11 | 3.61 | 90.33 | 0.11 | 89.84 | 1.81 |
| c18:3n3 | alpha-linolenic acid | 483.61 | 64.86 | 282.65 | 10.54 | 573.96 | 17.52 |
| c20:2n6 | eicosadienoic acid | 1359.55 | 201.42 | 382.95 | 58.24 | 1512.63 | 82.82 |
| c22:1n9 | erucic acid | 483.20 | 0.83 | 439.66 | 5.03 | 480.20 | 10.53 |
| c20:3n3 | cis-11,14,17-eicosatrienoic acid | 139.38 | 5.28 | 87.29 | 2.92 | 114.36 | 9.24 |
| c20:4n6 | arachidonic acid | 430.21 | 88.66 | 92.78 | 20.39 | 248.30 | 41.24 |
| EPA | eicosapentaenoic acid | 5293.22 | 975.68 | 2570.07 | 147.47 | 4110.60 | 104.58 |
| DPA | docosapentaenoic acid | 956.78 | 122.90 | 925.97 | 39.87 | 874.09 | 23.29 |
| DHA | docosahexaenoic acid | 6559.28 | 40.48 | 2356.13 | 120.63 | 4925.16 | 183.39 |
| SFA | Saturated Fatty Acids | 15518.69 | 2318.21 | 11362.75 | 59.59 | 14594.85 | 128.11 |
| BCFA | Branched-Chain Fatty Acids | 611.49 | 111.46 | 619.58 | 26.43 | 600.42 | 3.78 |
| MUFA | Monounsaturated Fatty Acids | 17394.09 | 1691.58 | 17303.77 | 867.67 | 16402.58 | 35.80 |
| PUFA | Polyunsaturated Fatty Acids | 16092.34 | 1619.23 | 7194.85 | 410.22 | 13179.67 | 370.89 |
| n3 | n-3 Fatty Acids | 13432.26 | 1209.18 | 6222.09 | 315.60 | 10598.16 | 291.43 |
| n6 | n-6 fatty Acids | 2660.08 | 410.04 | 972.76 | 94.63 | 2581.52 | 79.45 |
| n3/n6 | n-3:n-6 ratio | 5.08 | 0.33 | 6.41 | 0.30 | 4.11 | 0.01 |
| TFA | Trans Fatty Acids | 49616.59 | 5740.49 | 36480.99 | 1310.98 | 44777.51 | 531.02 |
| %EE | Extract Ether | 80.14 | 2.86 | 67.25 | 0.64 | 69.57 | 0.13 |
2.4. Oil Content
The highest concentration of oil was found in the head skin (50.07%), followed by the liver and the head meat, while the higher dry matter was observed in samples of liver. The complete results for oil content and dry matter are shown in Table 3.
While the skin has a higher oil content, it represents a small percentage of the total by-products, and it is more convenient to process all the biomass together to maixmise the fishmeal and fish oil production. However, the skin might contain bioactive compounds such as peptides with antioxidant activity and digestive enzymes of interest for the pharmaceutical industry or other industries that require less biomass and can be sold at higher prices. This possibility should be investigated in further studies.
2.5. Lipid Oxidation Products in the Tuna By-Products
Lipid oxidation is caused by a series of reactions that have a negative impact on quality of food and shelf life. During lipid oxidation, unsaturated fatty acids react with oxygen to form lipid hydroperoxides, which are later degraded into small, volatile molecules such as aldehydes and ketones. The potential use of tuna by-products to produce fishmeal and oil requires the analysis of the primary and secondary oxidation in order to evaluate the initial quality of the raw material.
Two different batches of by-products were analysed for lipid oxidation products. The results show that the primary oxidation (lipid hydroperoxides), expressed as peroxide value (Figure 2a), showed the highest value in the liver (6.11±0.89 meq·g-1), while the lowest value was found in the samples of tuna head (3.08±1.08 meq·g-1). The highest secondary oxidation (Figure 2b), expressed in TBARS concentration, was also observed in the liver (42.8±8.77 meq·g-1) while the lowest concentration was observed in the head (2.2±0.57 meq·g-1). The mix containing head and liver had intermediate values of PV and TBARS. These results can easily be explained by the composition of the different body parts. The liver, rich in blood and enzymes, is more affected by oxidation processes because of the O2 carried by the haemoglobin. The head samples contained more bones, skins and other tissues that were less affected by this process.
The oxidation levels found, still allow the utilization of the by-product to produce fishmeal and fish oil in a situation like the one present in Malta, where the distance between the pens and the processing plant is short, and the time between harvest and processing is reduced. Refrigerated space dedicated to the by-products becomes mandatory in other areas where the by-products must be moved to processing plants located at greater distance. The possibility to treat the by-products with natural antioxidants [19] could also be included in the logistic management of the by-products to retard the oxidation of the biomass. If the results of this study are compared to those observed by Wu et al. [20] in herring’s by-products, it appears clear that refrigeration and use of antioxidants can play an important role in reducing the oxidation of the biomass. These authors observed values of 6 meq·g-1 and below 2,5 meq·g-1 for PV and TBARS, respectively, after preserving the by-products by cold storage (ice for 5 days). In the present study, similar values were observed after 6-8 hours of non-refrigerated preservation. The authors also showed how rinsing the by-products with a 0.9% NaCl solution can help to reduce PV and TBARS.
Improving the management of the by-products before processing can extend the preservation time and improve the quality of the final product.
2.6. Lipid Oxidation in Oil Extracted from By-Products
The oxidative status of oil extracted from the three different types of tuna by-product was assessed after extraction and after 72 hours of storage at -20°C. The highest PV was recorded in the oil extracted from the head meat (4.85 ± 0.08 meq·kg-1) while the lowest was observed in the oil extracted from the liver (0.97 ± 0.12 meq·kg-1). The TBARS was lowest in the liver oil (4.20±0.04 meq·kg-1) and highest in the head skin oil (5.67±0.17 meq·kg-1). After 72 hours at -20°C, all the values of PV and TBARS increased, highlighting the occurrence of a slow oxidation process (Table 4).
Fish oil contains fatty acids, lipidic molecules that represent an important source of energy and play a key role in numerous metabolic processes. These molecules are easily oxidized leading to a decrease in the quality of the oil. Stabilization of fish oil is difficult to achieve, and the effects of oxidation can be observed already at early stages of this process [21]. Oxidation of fish oil is a well-known problem that affects all fish oil-based products[22] regardless the origin of the oil. Oxidized fatty acids have a toxic effect, reducing the availability of vitamins and amino acids [23]. The results observed in the present study are comparable to the results observed by Kop et al. [24]. These authors analysed the oxidation status of fish oil extracted from anchovies, salmon, salmon by-products, sprat and other sources stored at 4, 20, and 30˚C for 0, 30 and 60 days. The initial PVs (freshly extracted oils) varied between 2 and 4 meq·kg-1. After 30 and 60 days the PVs were between 10 and 25meq·kg-1, with positive correlation between storage time and temperature. Different optimal PVs for freshly extracted oil are reported in the literature. The optimal values range between 1 meq·kg-1[25] and 10 meq·kg-1 [26]. If the upper limit is considered, the oxidation status observed in this study in the oil extracted from different parts is acceptable.
2.7. Histamine Formation
The temperature of the samples, recorded through loggers within 3 or 6 hours of collection of the by-products, was affected by the environmental temperature. In October the temperature varied between 24°C and 26˚C. On the 16th of November it varied between 22°C and 24˚C. In the last two sampling dates it varied between 18°C and 20˚C and between 15 and 19˚C, respectively.
The degree to which each bacteria species contributes to the histamine formation is directly linked to the storage temperature. The mesophilic M. morganii proliferates rapidly at high temperatures, while M. psychrotolerans grows better at lower temperatures.
The software FSSP predicted no histamine formation by M. psychrotolerans and M. morganii, in tuna side-streams collected under the summarized conditions (temperature, storage time) (Table 5).
3. Life Cycle Assessment
3.1. Global Environmental Impact of Processing Tuna By-Products into Fishmeal and Fish Oil
Once the life cycle of fishmeal and oil production was modeled and all the data entered, the single score of the activity was calculated. The environmental score of the activity was 105 pts per ton of fishmeal produced and 25 kg of fish oil produced, which is also equivalent to 2.82 tCO2 eq per 1.025 tons of fishmeal and oil produced (Figure 5). According to the greenhouse gas equivalencies calculator from the United States Environmental Protection Agency[27], 2.82 tCO2 eq corresponds to the emissions of one gasoline-powered car traveling for approximately 7 miles.
3.2. Environmental Indicators Most Affected by the Activity
The ReCiPe methodology highlighted that 95% of the environmental score targets human health, followed by ecosystems (3%) and resources (2%) (Figure 3). This activity affects human health by directly enhancing global warming and human toxicity. Indeed, the midpoint analysis showed that 50% of the human health related issues are generated by the formation of fine particulate matter, and 42% are related to global warming enhancement. The 8% left correspond to the global warming effect on ecosystems.
3.3. Environmental Impacts of Single Steps of the Life Cycle
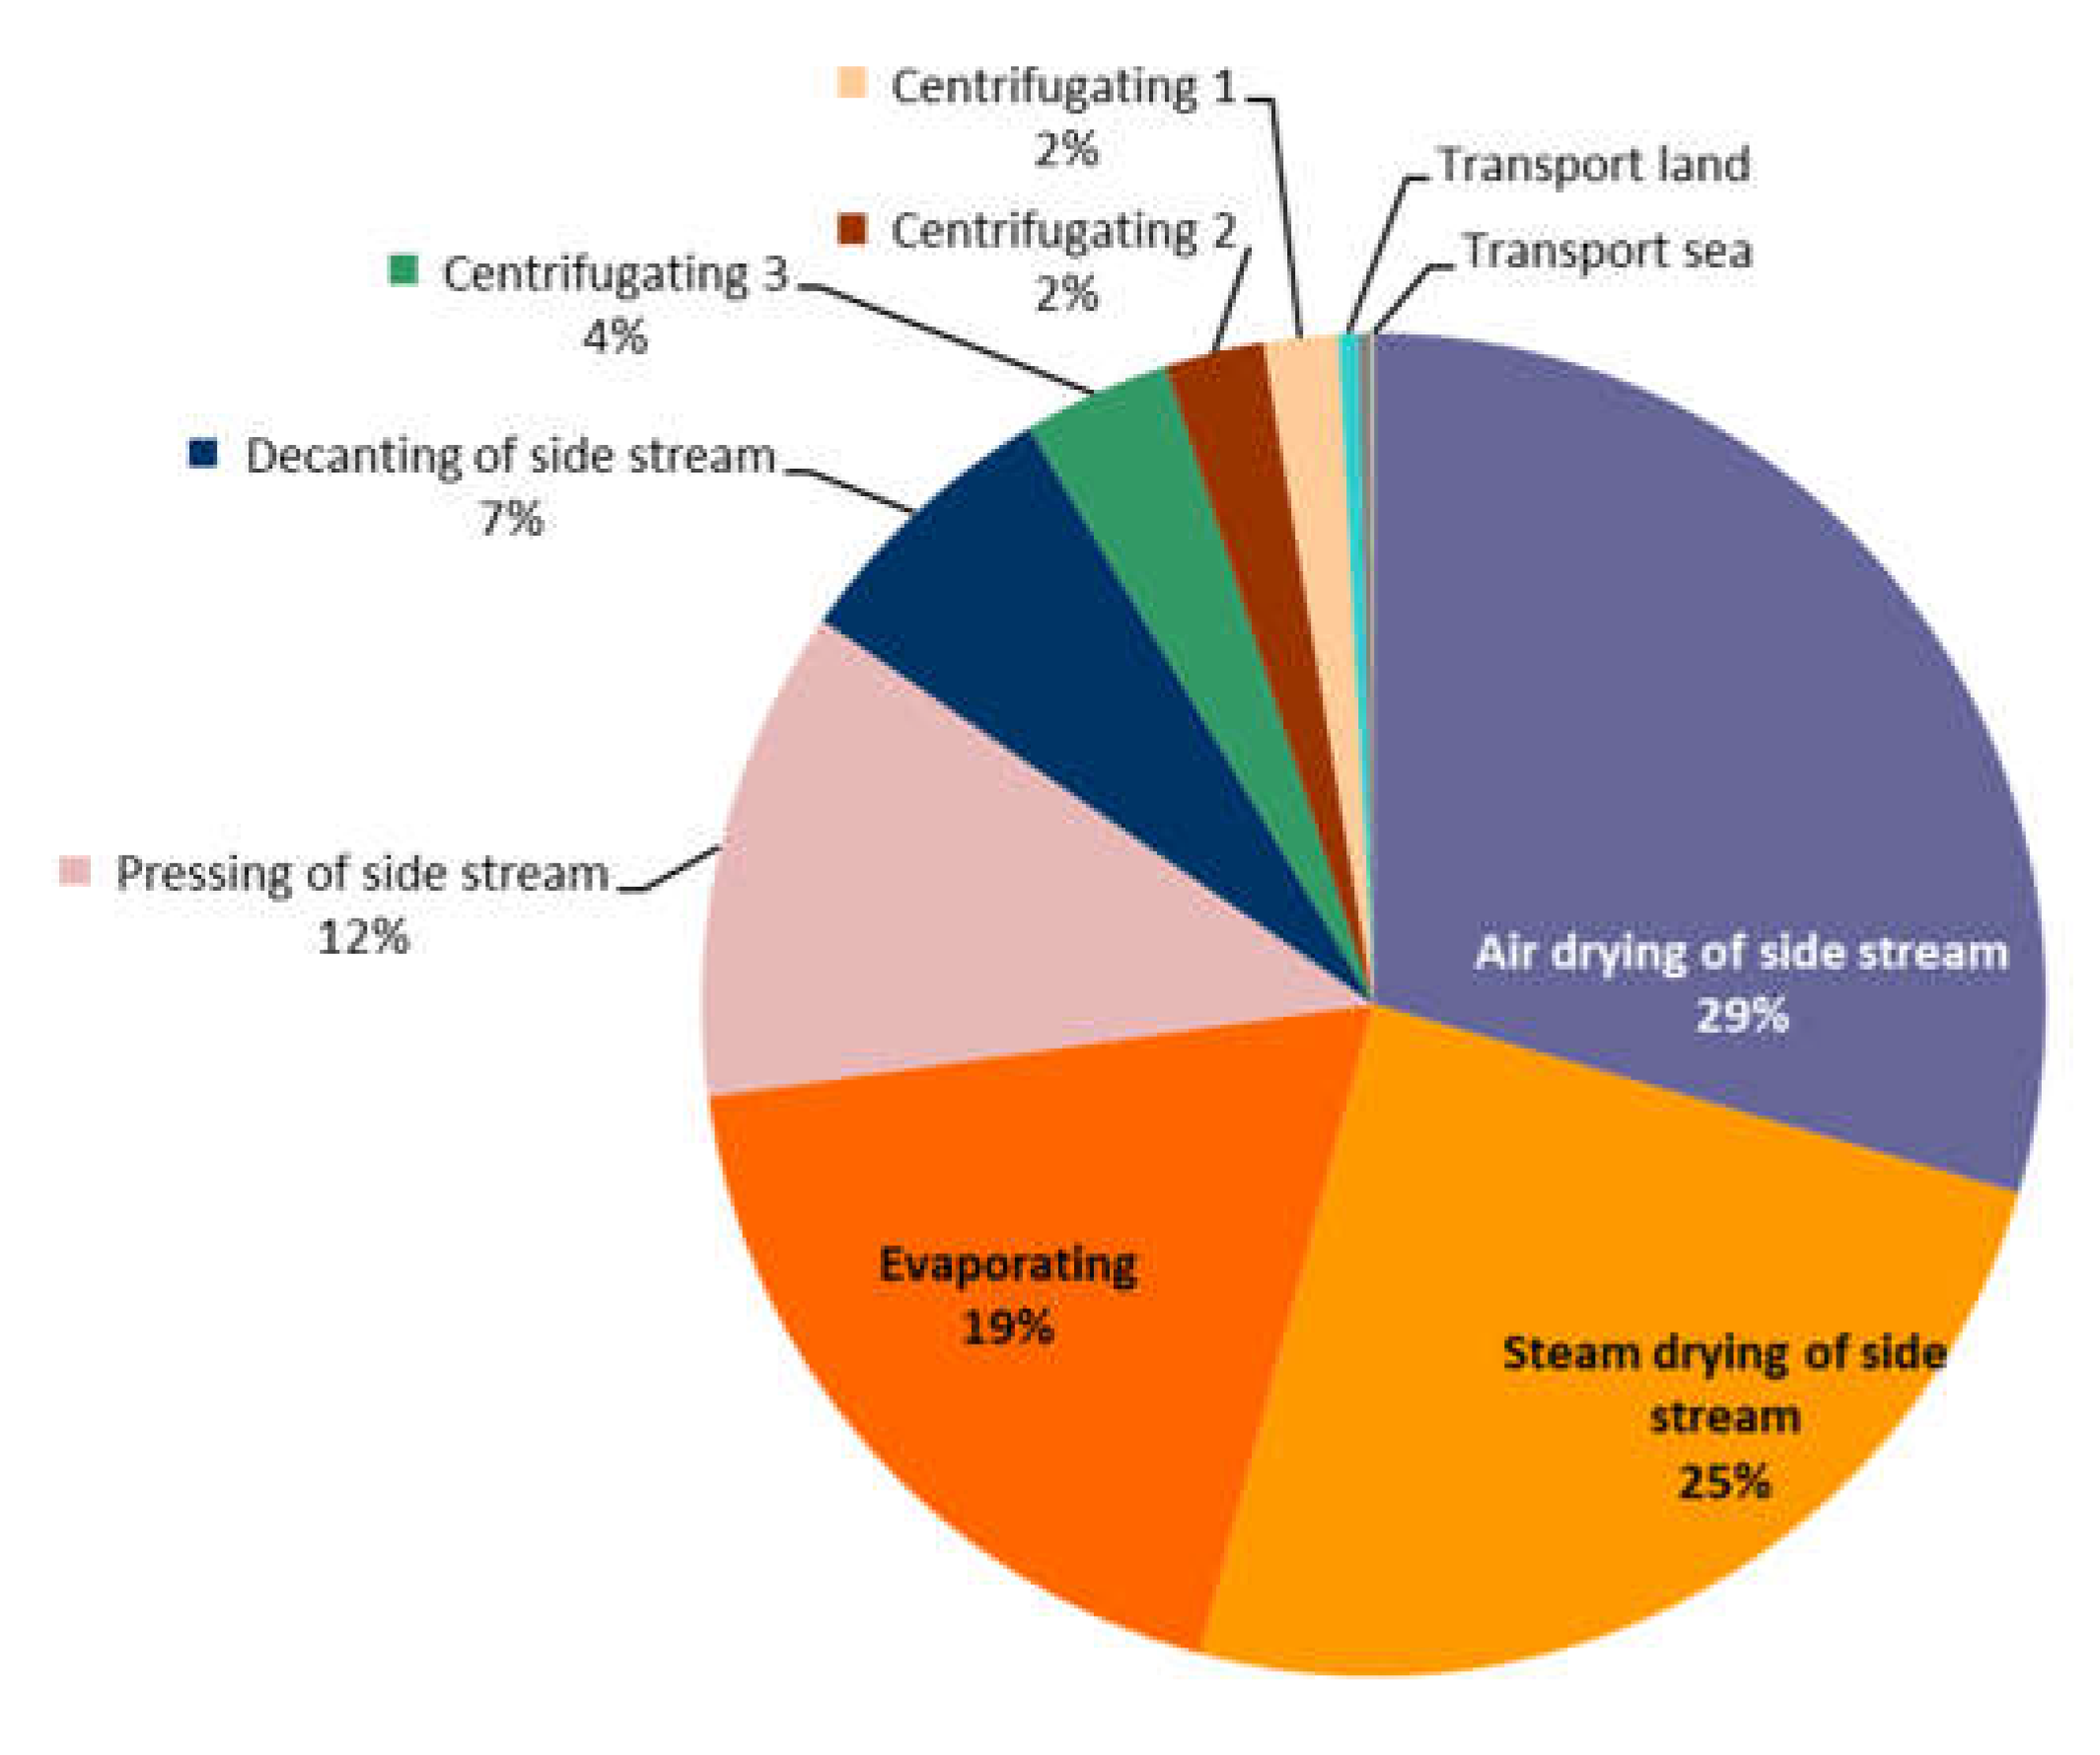
The network calculation function of Simapro was used to identify the step of the life cycle with the highest environmental impact. Overall, the processing of the by-products into fishmeal and fish oil in the plant is responsible for 99.5% of the total impact. The processing contributes to 104.5 out of the total score of 105 points (Figure 4). The supply of raw material has no impact (0 pts) as the tuna by-products used are sourced within the activity of tuna harvesting and the filleting of the tuna is carried out manually on the vessel. The transportation of the by-products, from the tuna cages to the processing plant has a very low impact since it is responsible for only 0.55 pts in the total single score (105 pts). A focus on the impact repartition of the different transformation processes within the facility has been performed to identify the step responsible for the highest impact (Figure 5). The transformation process that appears to have the highest environmental impact is the drying of by-products, contributing in total to 54% of the impact of the activity. After the drying process comes the evaporating process, responsible for 19% of the facility’s impact followed by the pressing of by-products, responsible for 12% of the impact.
It is important to notice that the lack of data related to the specific machines used and to the maintenance operations when modelling the activity affected the accuracy of the results. However, even considering this approximation, it appears clear that the environmental impact of these processes is due to their high energy consumption and to the fact that the source of energy used in the plant is fossil fuel. Hence, to reduce the global emissions of the system, the focus should be put on the utilization of renewable energy sources. The environmental impact on resources depletion and ecosystems degradation would decrease. The impact on global warming and fine particulate matter formation would also decrease, for example, by using solar power instead of oil. On the other hand, human non-carcinogenic toxicity would slightly increase with the use of photovoltaic energy as the production and disposal of the solar panels involves hazardous components such as heavy metal [28].
The energy consumption of the most impactful processes could also be reduced by developing new drying protocols at reduced temperatures or using more efficient machines. In a previous study [29], it was showed that lowering the cooking temperature from 90°C to 85°C led to improvements in fishmeal and oil quality extracted from pelagic species.
Figure 4.
Network representing the environmental impact repartition of each life cycle phases of the production of 1 ton of fishmeal and 25kg of fish oil.
Figure 4.
Network representing the environmental impact repartition of each life cycle phases of the production of 1 ton of fishmeal and 25kg of fish oil.
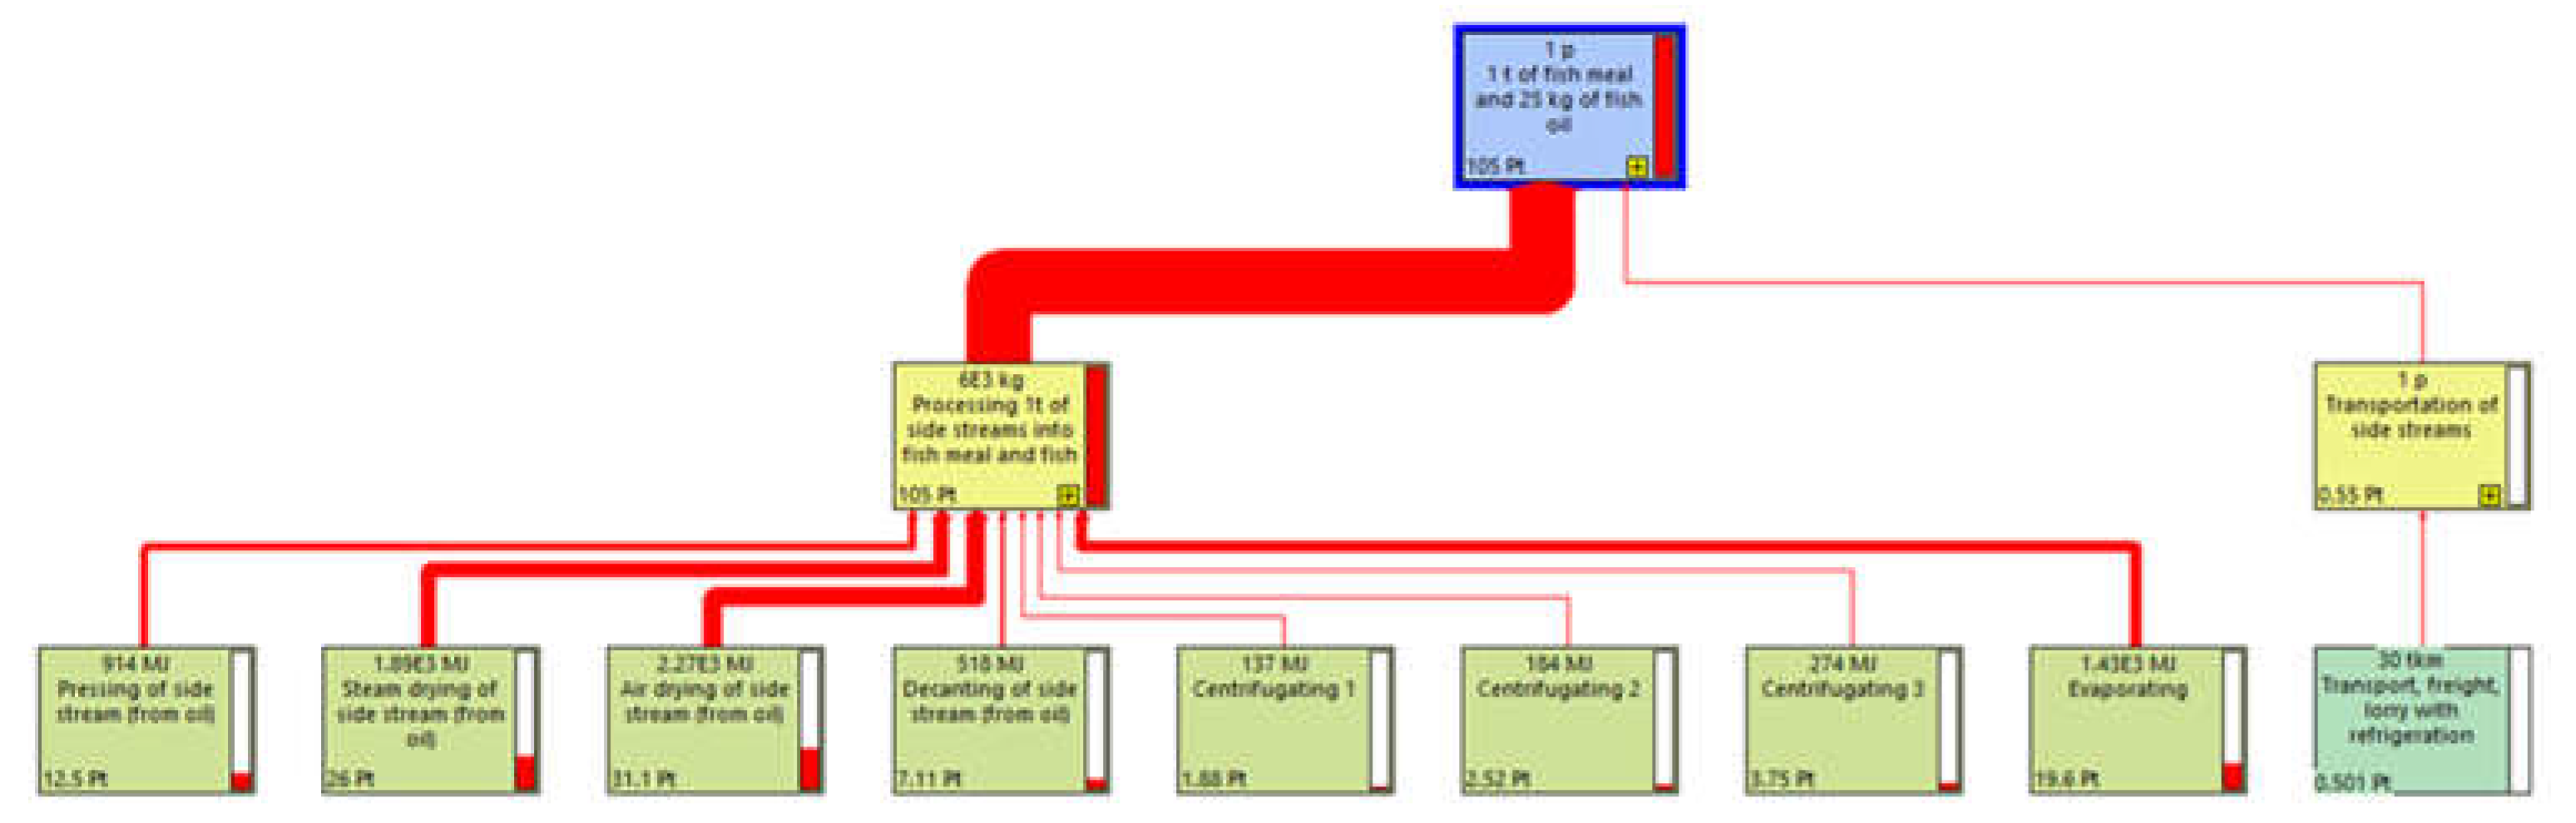
Figure 5.
Pie chart showing the environmental impact of the different steps of the tuna by-product processing into fish meal and fish oil.
Figure 5.
Pie chart showing the environmental impact of the different steps of the tuna by-product processing into fish meal and fish oil.
3.4. Impact of Reusing the Tuna By-Product to Generate Fishmeal and Fish Oil versus Alternative By-Products Management Scenarios
If the tuna by-product generated in the Maltese farms was not processed into fishmeal and fish oil, it would most likely be incinerated in the local incinerator. Alternative scenarios would also be possible. For example, composting and landfilling would be two other options. In a study carried out in 2015[30], the authors compared the environmental impact of fishmeal and fish oil production using fish by-products with composting, incineration and landfilling of the same by-products. The authors found that fishmeal and fish oil production emits in the air 5.14 kg of CO2 eq/ton, composting emits 256.84 kg CO2 eq/ton, Incineration emits 3.97 kg CO2 eq/ton, and landfilling emits 579.66 kg CO2 eq/ton. The authors highlighted that, if energy recovery is considered for incineration and landfilling, a significant reduction of emissions is possible for these two by-products management scenarios. However, incineration of by-products emits several types of compounds targeting the respiratory system with consequent health issues, while landfilling is an option that should be avoided in a small island like Malta, where scarcity of land available represents the main obstacle to this management system. Moreover, the Directive 2008/98/EC[31] indicates landfilling as the last waste management option. Overall, the processing of tuna by-products into fishmeal and fish oil can be considered the best management option in Malta.
3.5. Sustainability of Fishmeal and Fish Oil Originating from Fish By-Products versus Other Proteins and Lipids Sources
The literature was searched to compare the environmental impact of fishmeal and fish oil production using tuna by-products generated in the Maltese tuna farms with the impact assessed to produce fishmeal and fish oil from other sources. A study carried out in Peru by Freon et al. in 2017[32] focused on the LCA of a plant processing anchovies to make fishmeal and fish oil. Similarly to the Maltese plant, the source of energy used in the plant is heavy fuel oil. The environmental indicators repartition reported for the processing of anchovies is similar to the one determined in the present study, with human health being the most targeted environmental indicator. The single score obtained by Freon et al. was 72.5 points. This score is lower than the one obtained in the present study for the production of fishmeal and fish oil using tuna by-products (105 points). However, the Peruvian study did not include the impact of sourcing the biomass processed. On the contrary, in the present study, the boundaries included tuna harvest, separation of the by-products from the fillets and transportation to the processing plant. As shown by Freon et al. in a previous study carried out in 2014[33], sourcing anchovies to produce fishmeal and fish oil has a high environmental impact even before processing the biomass. The impact is due to fuel consumption, hull and structural elements of the vessel, fishing gear, paints and antifouling and solid waste. The authors calculated the single score for one average tonnage of anchoveta impacting on the identified midpoints. Among others, the authors calculated, for example, 95 points for climate change, 95.1 points for marine eutrophication, 95.3 for human toxicity and 95.6 points for ionizing radiation. In the case of processing tuna by-products into fishmeal and oil, the source of the biomass is tuna aquaculture. While it was not possible to find a published study focusing on the LCA of tuna farming, considering the nature of this industry, it is likely that this activity has a very high environmental impact. However, the scope of tuna farming is the production of tuna fillets, and its pressure on the environment would occur also if the tuna by-products were not used to produce fishmeal.
In the present study, the processing of the by-product is responsible for 99.3% of the total activity’s single score, while raw material sourcing and transportation only contributes to 0.7% of the environmental impact. Since the raw material is constituted of by-products, and the separation from the fillets is executed manually, their environmental impact was considered equal to zero. Moreover, the transportation from the cages to the processing plant has low impact because of the short distance from the tuna cages to the landing point and from the landing point to the plant.
In conclusion, when available, utilisation of locally produced fishmeal and fish oil derived from tuna by-products is a more sustainable choice than fishmeal and oil provided by pelagic species sourced through fishery activities.
3.6. LCA Limitations
It is important to remember that, for the present study, the data used related to the processing of the biomass were provided by a company that processes pelagic fish, not tuna by-products. Processing tuna biomass might have a slightly different impact due to different composition and bones’ characteristics. Another limitation of the present LCA is that it did not consider the impact of the building, and the maintenance of the processing plant built in Malta. Moreover, as mentioned above, information about specific machinery used by ARL was not disclosed and generic data available on Ecoinvent were used.
4. Materials and Methods
4.1. Analysis of Tuna Farming Industry and By-Product Management in Malta
Information about history, logistics, processing, storage, transportation and details of tuna farming activity in Malta were collected from the Maltese Government website[34] and through an interview with a representative of Aquaculture Resources Limited (ARL). ARL is the company constituted by four different Maltese tuna farmers that collects tuna by-products and processes the biomass into fishmeal and fish oil, currently sold to the petfood industry. The interview took place in summer 2022 and it consisted of 33 questions (see supplementary material 1) divided into three sections:
- 1.
- General information about the tuna farming industry in Malta
- 2.
- Harvesting, processing, and by-products management
- 3.
- Planned waste management of ARL.
The aim of the interview was to acquire information about the technical and logistic operations involved with the collection of tuna by-product and its processing into fishmeal and fish oil.
4.2. Analysis of Tuna By-Products and Extracted Oil
4.2.1. Samples Collection
Samples of tuna head, liver and mixed (head + liver) were collected in 2022 in 4 different days (October 21st, November 16th and 22nd and December 19th) from freshly harvested tuna, on a tuna vessel operating in a Malta tuna farm located in the east coast. Approximately 2 kg of each type of samples were collected each day and transported to AquaBioTech Group’s facility in Mosta (MT) within six hours from of collection. Temperature loggers (Tinytag, Gemini Data Loggers, Chichester, UK) were placed in samples right after the collection, to record the temperature profile during transport until storage. The distance between the landing site and AquaBioTech Group’s facilities is approximately the same as the distance between the landing site and the processing plant (8-9km). Hence it was assumed that the preservation state of the by-products upon arrival at AquaBioTech Group was comparable to the preservation state of the biomass when it arrives at the processing plant. In the laboratory, the samples were divided into sub-samples of approximately 500 g each, placed in plastic bags and stored at -20˚C until further analysis.
4.2.2. Proximate Composition of the Entire By-Products Biomass
Two sub-samples for each type, were randomly selected and shipped frozen by air freight to the laboratory of DISAFA (University of Turin, Italy) to analyse the composition and the oxidative status. After 18 hours, the samples were delivered to the laboratory and stored at -20°C until further analysis. The samples were chopped into cubes by a bandsaw and then freeze-dried using a 5 Pascal device (Trezzano sul Naviglio, Milan, Italy). After drying, the material was grounded using a cutting mill (MLI 204; Bühler AG, Uzwil, Switzerland) and analysed following the methodology indicated by [35] to determine Dry Matter (DM) (AOAC #934.01), Crude Protein (CP) (AOAC #984.13) and Ash (AOAC #942.05). The crude fat content was analysed as Ether Extract (EE) (AOAC International, 2003, #2003.05).
4.2.3. Fatty Acids Analysis of the By-Products
The fat extraction was performed using the method described by Mopuri et al. [37] while the fatty acids profile was determined following the protocol described bySchmid et al. [38]. Fatty acid methyl esters (FAME) were separated on a capillary column (CP-Sil 88 capillary column (100 m x 0.25 mm ID, 0.20 µm film thickness; Varian Inc., Lake Forest, CA). The column temperature was held at 45°C for 5 min, then raised 20°C per minute, up to 195°C. The final isotherm was maintained for 65 minutes. The temperature of the injector and the flame-ionization detector was maintained at 250°C and 280°C, respectively. The results were expressed as mg fatty acids per 100 g of DM. Each analysis was performed in duplicates.
4.2.4. Oil Content
The oil content in head skin, head meat and liver was quantified in duplicates. The samples were thawed in fridge overnight and then manually split into the three different components. The biomass was cut into pieces and processed with a blender to obtain a coarse mince, then frozen by using liquid nitrogen and blended again into fine minces. The homogenized samples were divided into individual bags and stored at – 20°C before analysis. The oil was extracted following the Bligh and Dyer method[39]. The oil content was determined gravimetrically using a mixture of chloroform, methanol, and water. After centrifugation, two phases were distinguishable (chloroform/oil at the bottom and methanol/water at the top). The total oil content was then determined by evaporating the chloroform and drying the residue in the oven.
4.2.5. Lipid Oxidation in the By-Products
Primary and secondary oxidation were determined in the different tuna by-product samples. Samples of tuna head, tuna liver and mix of the two components were divided into sub-samples of 5.00±0.05g, mixed with 30 ml of a solution of acetic acid and chloroform (ratio 3:2) in a conical flask, and 0.5 mL of saturated potassium iodide solution was added. The mixture was kept in the dark for about 10 min, followed by the addition of 30ml of distilled water and 1 ml of freshly prepared starch (1%). After shaking, the samples were titrated with a solution 0.01 N of sodium thiosulfate until the blue color disappeared. Peroxide value (PV) was evaluated using AOAC #965.33 method[40]. Analyses were performed in duplicate. Results are expressed in milliequivalents (meq) of peroxide per gram (g) of biomass. A high PV value corresponds to a high oxidative status.
The hydroperoxides further react to produce a wide range of compounds, one of them is malondialdehyde (MDA), a secondary oxidation product, which changes the aroma and flavor properties of foods. The quantity of MDA, corresponding to the measured absorbance and expressed as μmol of malondialdehyde per kg of sample, is defined as TBARS. The MDA extracted with trichloroacetic acid (TCA) reacts with the thiobarbituric acid (TBA) and forms a red pigment having maximum absorbance at 530 nm [41], the absorbance is compared with a standard curve.
The secondary lipid oxidation was determined using the modified thiobarbituric acid (TBA) method according to procedure described by Witte et al.[42]. Five grams of sample were mixed and homogenized for 30s with 10% trichloroacetic acid (TCA) using a Polytron tissue homogenizer (Type PT 10–35; Kinematica GmbH, Luzern, Switzerland). The supernatant was filtered through a Whatman #1 filter paper. One ml of filtrate was combined with 1 ml of a 0.02M aqueous TBA solution, heated in a boiling water bath for 20 minutes together with a blank containing 1 ml of a TCA/water mix (1/1) and 1 ml of a TBA reagent and subsequently cooled under running tap water. The samples were analysed in duplicates and the absorbance was read at 532 nm with a Helios spectrophotometer (Unicam Limited, Cambridge, UK) against a blank that contained all the reagents, but not the tuna sample. Results were expressed as mg malonaldehyde/kg of sample.
4.2.6. Lipid Oxidation in Extracted Oil
Primary and secondary oxidation were determined using the same methods described above in oil extracted from tuna head skin, head meat and liver (n=2) after storing at -20°C for 72 hours to evaluate storage stability.
4.2.7. Histamine Formation
Histamine formation by Morganella psychrotolerans and Morganella morganii was predicted using the software Food Spoilage and Safety Predictor (FSSP)[43]. The software is freely available at http://fssp.food.dtu.dk. Seven different temperature profiles of from three to 6.5 hours were recorded and analyzed using FSSP. Predictions were made considering the growth and histamine formation of the two species with an initial concentration of 10 cfu·g-1 for each of them.
4.3. Life Cycle Assessment (LCA)
The LCA of the production of fishmeal and oil from tuna by-products generated within the Maltese tuna farms was carried out using the software Simapro 9.5 in accordance with the Internal Standard Organization (ISO) 14040 and 14044[44] The method ReCiPe[45] was used to generate a general single score describing the whole life cycle’s environmental impact of the activity.
The boundaries of the system focused on three life cycle steps: the separation of the by-products (head, bones, guts) from the fillet, the transportation of the by-products, and the processes to transform the by-products (Figure 6).
4.4. Process Description, Data Collection and Inventory
The data about the tuna harvest, quantity of tuna by-products generated, and their transportation were provided by a representative of ARL. Specific technical data about the processing of by-products into fishmeal and oil were confidential and not disclosed by this company. Therefore, data used in this study were provided by the Icelandic company Matis. The available information is related to a facility that processes different species of pelagic fish (mackerel and herring) into fishmeal and fish oil [46]. The quantity of raw material processed is the main factor that affects the overall energy consumption. Hence, it was concluded that using data from a different raw material is an acceptable approximation.
The filleting of the bluefin tuna is carried out offshore manually; no emissions are estimated for this process. The by-product is transported for approximately 5km from the cages to the landing site by an auxiliary boat, and approximately 5 to 6km from the landing site to the processing plant, by refrigerated truck. The distances were estimated using a distance calculator software.
According to the Maltese factory, a total of 6 tons of by-products is necessary to produce 1 ton of fishmeal and 25kg of fish oil. The energy consumption of machines processing an equal weight of mackerel and herrings was considered. Figure 7 shows the flow of the processing of tuna by-products into fishmeal and fish oil within the production plant.
The tuna by-product is first cooked at a temperature between 85° and 90°C[46]. The biomass is then pressed and decanted so the solid and liquid parts can separate. The solid part, also called cake, is steamed and then air-dried to produce fishmeal. The liquid part separated from the cake goes through a decanting process and the resulting “sludge” is incorporated into the drying process to complete the fishmeal production. The remaining liquid goes through an initial centrifugation, an evaporation process, and two additional centrifugations to produce fish oil. The concentrate from the evaporator, weighing approximately 700 kg, is incorporated into the steam dryer to finalise the fishmeal production.
The process was modelled based on energy consumption without considering the specific models of the machinery used. Materials, construction and maintenance of the machines were also not included in the study. A summary of the inventory for the life cycle phases within the system´s boundaries is provided in Table 6
5. Conclusions
The Maltese experience in the management of tuna by-products represents a case study for good practices in the implementation of circular economy in small islands. Small tuna farmers came together and turned a problem, the management of tuna by-products generated every year, into a valuable resource. Inspired by the principles of circular economy, tons of biomass are converted every year into a source of protein and lipids for pets. In this study it was shown that the composition and quality of tuna by-products could match the requirements needed for farmed animals’ feed. The fatty acid profile shows a high-quality biomass. Moreover, in a small island like Malta, the lack of refrigerated space to store the by-products on the vessel does not constitute a problem for lipids oxidation as the harvest occurs in colder months and the biomass is moved to the processing plant within the same day. On the other hand, the lack of refrigerated storage during transportation has a negative effect on the protein content of the by-products. The high ash content in samples containing bones might generate digestibility problems and reduced feed efficiency in farmed animals, hence, the removal of the bones might be necessary to improve the nutritious characteristics of such product. An investigation of the content of heavy metals in the by-products should also be carried out when considering using them for farmed animal feeds.
The environmental impact of the processing plant is lower than the incineration of the same biomass and it could be further reduced if the processing plant was powered by a renewable source of energy. In conclusion, the management of tuna by-products in Malta is a successful example of re-utilisation of an aquaculture by-product that reduces the environmental impact of this activity and provides the fish farmers with an extra income.
Authors Contribution
Conceptualization, S.P. and G.M.C.; Methodology, S.P., G.M.C., C.A.R., T.R., A.S., A.M.S., P.D., L.G., F.G., J.C.C.; Validation, SP, GMC, CAR, TR, AS, AMS, PDLG, FG.; Formal Analysis, S.P., G.M.C., C.A.R., P.D., J.C.C., A.M.S., A.S.; Investigation, S.P., G.M.C., C.A.R., T.R., A.S..; Resources, X.X.; Data Curation, S.P., G.M.C., C.A.R..; Writing – Original Draft Preparation, SP, GMC, CAR.; Writing – All authors.; Visualization, S.P., G.M.C., C.A.R..; Supervision, S.P..; Project Administration, S.P..; Funding Acquisition, S.P.
Acknowlegements
The present study was carried out within the project PROFIUS funded by the European Union's Horizon 2020 Research and innovation programme under grant agreement 817992. BlueBio - ERA NET co-fund scheme. We would like to thank the Maltese tuna farmers who facilitated the collection of samples and Aquaculture Resources Limited for their availability to be interviewed. We would also like to thank MATIS for providing the data used for the Life Cycle Assessment.
References
- F. de la Gándara, A. Ortega, A. Buentello, Tuna aquaculture in Europe. In Advances in Tuna Aquaculture, Academic Press, London, UK, 2016.
- J. Fernandez-Polanco, I. Llorente, Tuna economics and markets. In: Advances in Tuna Aquaculture From Hatchery to Market, Academic Press, London, UK, 2016.
- M. Briguglio, The Politics of Bluefin Tuna in Malta. , Roczniki Socjologii Morskiej. Annuals of Marine Sociology XXII (2013) 51–61.
- Malta National Statistics Office, Aquaculture: 2022. Accessed on August 14th 2024, (2023).
- M. Metian, S. Pouil, A. Boustany, M. Troell, Farming of bluefin tuna-reconsidering global estimates and sustainability concerns, Reviews in Fisheries Science and Aquaculture 22 (2014). [CrossRef]
- L.M. Murthy, B.M. Rao, K.K. Asha, M.M. Prasad, Extraction and quality evaluation of yellowfin tuna bone powder., Fishery Technology 51 (2014) 38–42.
- M. Abdollahi, I. Undeland, Physicochemical and gel-forming properties of protein isolated from salmon, cod and herring by-products using the pH-shift method, LWT 101 (2019). [CrossRef]
- C.M. Messina, R. Arena, S. Manuguerra, L. La Barbera, E. Curcuraci, G. Renda, A. Santulli, Valorization of Side Stream Products from Sea Cage Fattened Bluefin Tuna (Thunnus thynnus): Production and In Vitro Bioactivity Evaluation of Enriched ω-3 Polyunsaturated Fatty Acids, Mar Drugs 20 (2022). [CrossRef]
- N. Hematyar, T. Rustad, S. Sampels, T. Kastrup Dalsgaard, Relationship between lipid and protein oxidation in fish, Aquac Res 50 (2019). [CrossRef]
- H. Mih, A. Lacherai, Evaluation of Histamine Contents during the Fish Meal Production Process, Ribarstvo, Croatian Journal of Fisheries 78 (2021). [CrossRef]
- G. of M. Aquaculture Directorate, Aquaculture Operations Register of Malta, Accessed On (2024).
- M.L. Windsor, Fish Meal, ADVISORY NOTE No. 49, 2011. https://www.fao.org/3/x5926e/x5926e00.htm#Contents (accessed April 22, 2024).
- D. Oliveira, D. Bernardi, F. Drummond, F. Dieterich, W. Boscolo, C. Leivas, E. Kiatkoski, N. Waszczynskyj, Potential Use of Tuna (Thunnus albacares) by-product: Production of Antioxidant Peptides and Recovery of Unsaturated Fatty Acids from Tuna Head, International Journal of Food Engineering 13 (2017). [CrossRef]
- K.A.A.U. Karunarathna, M.V.E. Attygalle, Nutritional evaluation in five species of tuna, Vidyodya Journal of Science 15 (2010).
- A. Bougatef, R. Balti, A. Haddar, K. Jellouli, N. Souissi, M. Nasri, Protein hydrolysates from bluefin tuna (Thunnus thynnus) heads as influenced by the extent of enzymatic hydrolysis, Biotechnology and Bioprocess Engineering 17 (2012). [CrossRef]
- Batista, C. Ramos, J. Coutinho, N.M. Bandarra, M.L. Nunes, Characterization of protein hydrolysates and lipids obtained from black scabbardfish (Aphanopus carbo) by-products and antioxidative activity of the hydrolysates produced, Process Biochemistry 45 (2010). [CrossRef]
- S. Albrektsen, R. Kortet, P.V. Skov, E. Ytteborg, S. Gitlesen, D. Kleinegris, L.T. Mydland, J.Ø. Hansen, E.J. Lock, T. Mørkøre, P. James, X. Wang, R.D. Whitaker, B. Vang, B. Hatlen, E. Daneshvar, A. Bhatnagar, L.B. Jensen, M. Øverland, Future feed resources in sustainable salmonid production: A review, Rev Aquac 14 (2022). [CrossRef]
- A. Honrado, P. Ardila, P. Leciñena, J.A. Beltrán, J.B. Calanche, Transforming ‘Bonito del Norte’ Tuna By-Products into Functional Ingredients for Nutritional Enhancement of Cereal-Based Foods, Foods 12 (2023). [CrossRef]
- N.B. Rathod, R.C. Ranveer, S. Benjakul, S.K. Kim, A.U. Pagarkar, S. Patange, F. Ozogul, Recent developments of natural antimicrobials and antioxidants on fish and fishery food products, Compr Rev Food Sci Food Saf 20 (2021). [CrossRef]
- H. Wu, S. Ghirmai, I. Undeland, Stabilization of herring (Clupea harengus) by-products against lipid oxidation by rinsing and incubation with antioxidant solutions, Food Chem 316 (2020). [CrossRef]
- Miyashita, Prevention of fish oil oxidation, J Oleo Sci 68 (2019). [CrossRef]
- D. Cameron-Smith, B.B. Albert, W.S. Cutfield, Fishing for answers: Is oxidation of fish oil supplements a problem?, J Nutr Sci 4 (2015). [CrossRef]
- J.B. German, Food Processing and Lipid Oxidation, in: L.S., K.M.G., M.J.N. Jackson (Ed.), Springer, Boston, MA, 1999: pp. 23–50. [CrossRef]
- A. Kop, K. Gamsız, A.Y. Korkut, H. Sayğı, The Effects of Different Storage Temperatures and Durations on Peroxide Values of Fish Feed Ingredients, Turkish Journal of Agriculture - Food Science and Technology 7 (2019). [CrossRef]
- F. Gunstone, Fatty acid and lipid chemistry, First Edition, Blackie Academic & Professional, Glasgow, UK, 1996.
- W. Kolanowski, Omega-3 LC PUFA contents and oxidative stability of encapsulated fish oil dietary supplements, Int J Food Prop 13 (2010). [CrossRef]
- Environmental Protection Agency of United States, Greenhouse Gas Equivalencies Calculator, (2024).
- H.B. Sharma, K.R. Vanapalli, V.K. Barnwal, B. Dubey, J. Bhattacharya, Evaluation of heavy metal leaching under simulated disposal conditions and formulation of strategies for handling solar panel waste, Science of the Total Environment 780 (2021). [CrossRef]
- G.S. Hilmarsdottir, Ó. Ogmundarson, S. Arason, M. Gudjónsdóttir, The effects of varying heat treatments on lipid composition during pelagic fishmeal production, Processes 8 (2020). [CrossRef]
- C. Lopes, L.T. Antelo, A. Franco-Uría, A.A. Alonso, R. Pérez-Martín, Valorisation of fish by-products against waste management treatments - Comparison of environmental impacts, Waste Management 46 (2015). [CrossRef]
- Directive 2008/98/EC of the European parliament and of the council of 19 November 2008 on waste and repealing certain Directives. , Official Journal of the European Union L312/3. (2008).
- P. Fréon, H. Durand, A. Avadí, S. Huaranca, R. Orozco Moreyra, Life cycle assessment of three Peruvian fishmeal plants: Toward a cleaner production, J Clean Prod 145 (2017). [CrossRef]
- P. Fréon, A. Avadí, R.A. Vinatea Chavez, F. Iriarte Ahón, Life cycle assessment of the Peruvian industrial anchoveta fleet: Boundary setting in life cycle inventory analyses of complex and plural means of production, International Journal of Life Cycle Assessment 19 (2014). [CrossRef]
- Malta national statistics services, Aquaculture Directorate, (2023).
- AOAC International, Official Methods of Analysis of AOAC International, 16th ed., Gaithersburg, Maryland, USA, 2000.
- AOAC Internationa, Official Methods of Analysis of AOAC , 17th ed., Gaithersburg, Maryland, USA, 2003.
- R. Mopuri, M. Kalyesubula, A. Rosov, N. Edery, U. Moallem, H. Dvir, Improved Folch Method for Liver-Fat Quantification, Front Vet Sci 7 (2021). [CrossRef]
- A. Schmid, M. Collomb, R. Hadorn, Fatty acid composition of Swiss cooked sausages, Fleischwirtschaft 89 (2009).
- S.K. Jensen, Improved Bligh and Dyer extraction procedure, Lipid Technol 20 (2008). [CrossRef]
- AOAC, AOAC Official Method 942.05, Ash of Animal Feed. Official Methods of Analysis of AOAC International, in: Official Methods of Analysis of AOAC International, 18th ed., 2002.
- W. Vyncke, Evaluation of the Direct Thiobarbituric Acid Extraction Method for Determining Oxidative Rancidity in Mackerel (Scomber scombrus L.), Fette, Seifen, Anstrichmittel 77 (1975). [CrossRef]
- V.C. WITTE, G.F. KRAUSE, M.E. BAILEY, A NEW EXTRACTION METHOD FOR DETERMINING 2-THIOBARBITURIC ACID VALUES OF PORK AND BEEF DURING STORAGE, J Food Sci 35 (1970). [CrossRef]
- Emborg, P. Dalgaard, Modelling the effect of temperature, carbon dioxide, water activity and pH on growth and histamine formation by Morganella psychrotolerans, Int J Food Microbiol 128 (2008). [CrossRef]
- ISO 14044:2006 Environmental Management - Life Cycle Assessment - Requirement and guidelines, (2006).
- Goedkoop, R. Heijungs, M. Huijbregts, A. De Schryver, J. Struijs, R. Van Zelm, ReCiPe 2008 - A life cycle impact assessment method which comprises harmonised category indicators at the midpoint and the endpoint level, 2008.
- G.S. Hilmarsdóttir, Ó. Ögmundarson, S. Arason, M. Gudjónsdóttir, Identification of environmental hotspots in fishmeal and fish oil production towards the optimization of energy-related processes, J Clean Prod 343 (2022). [CrossRef]
Figure 1.
Dry Matter (a), ash content (b), crude protein (c) and Extract Ether (d) in samples of tuna head, liver and mix of head and liver harvested in a tuna farm in Malta. N=2, error bars are standard deviation.
Figure 1.
Dry Matter (a), ash content (b), crude protein (c) and Extract Ether (d) in samples of tuna head, liver and mix of head and liver harvested in a tuna farm in Malta. N=2, error bars are standard deviation.
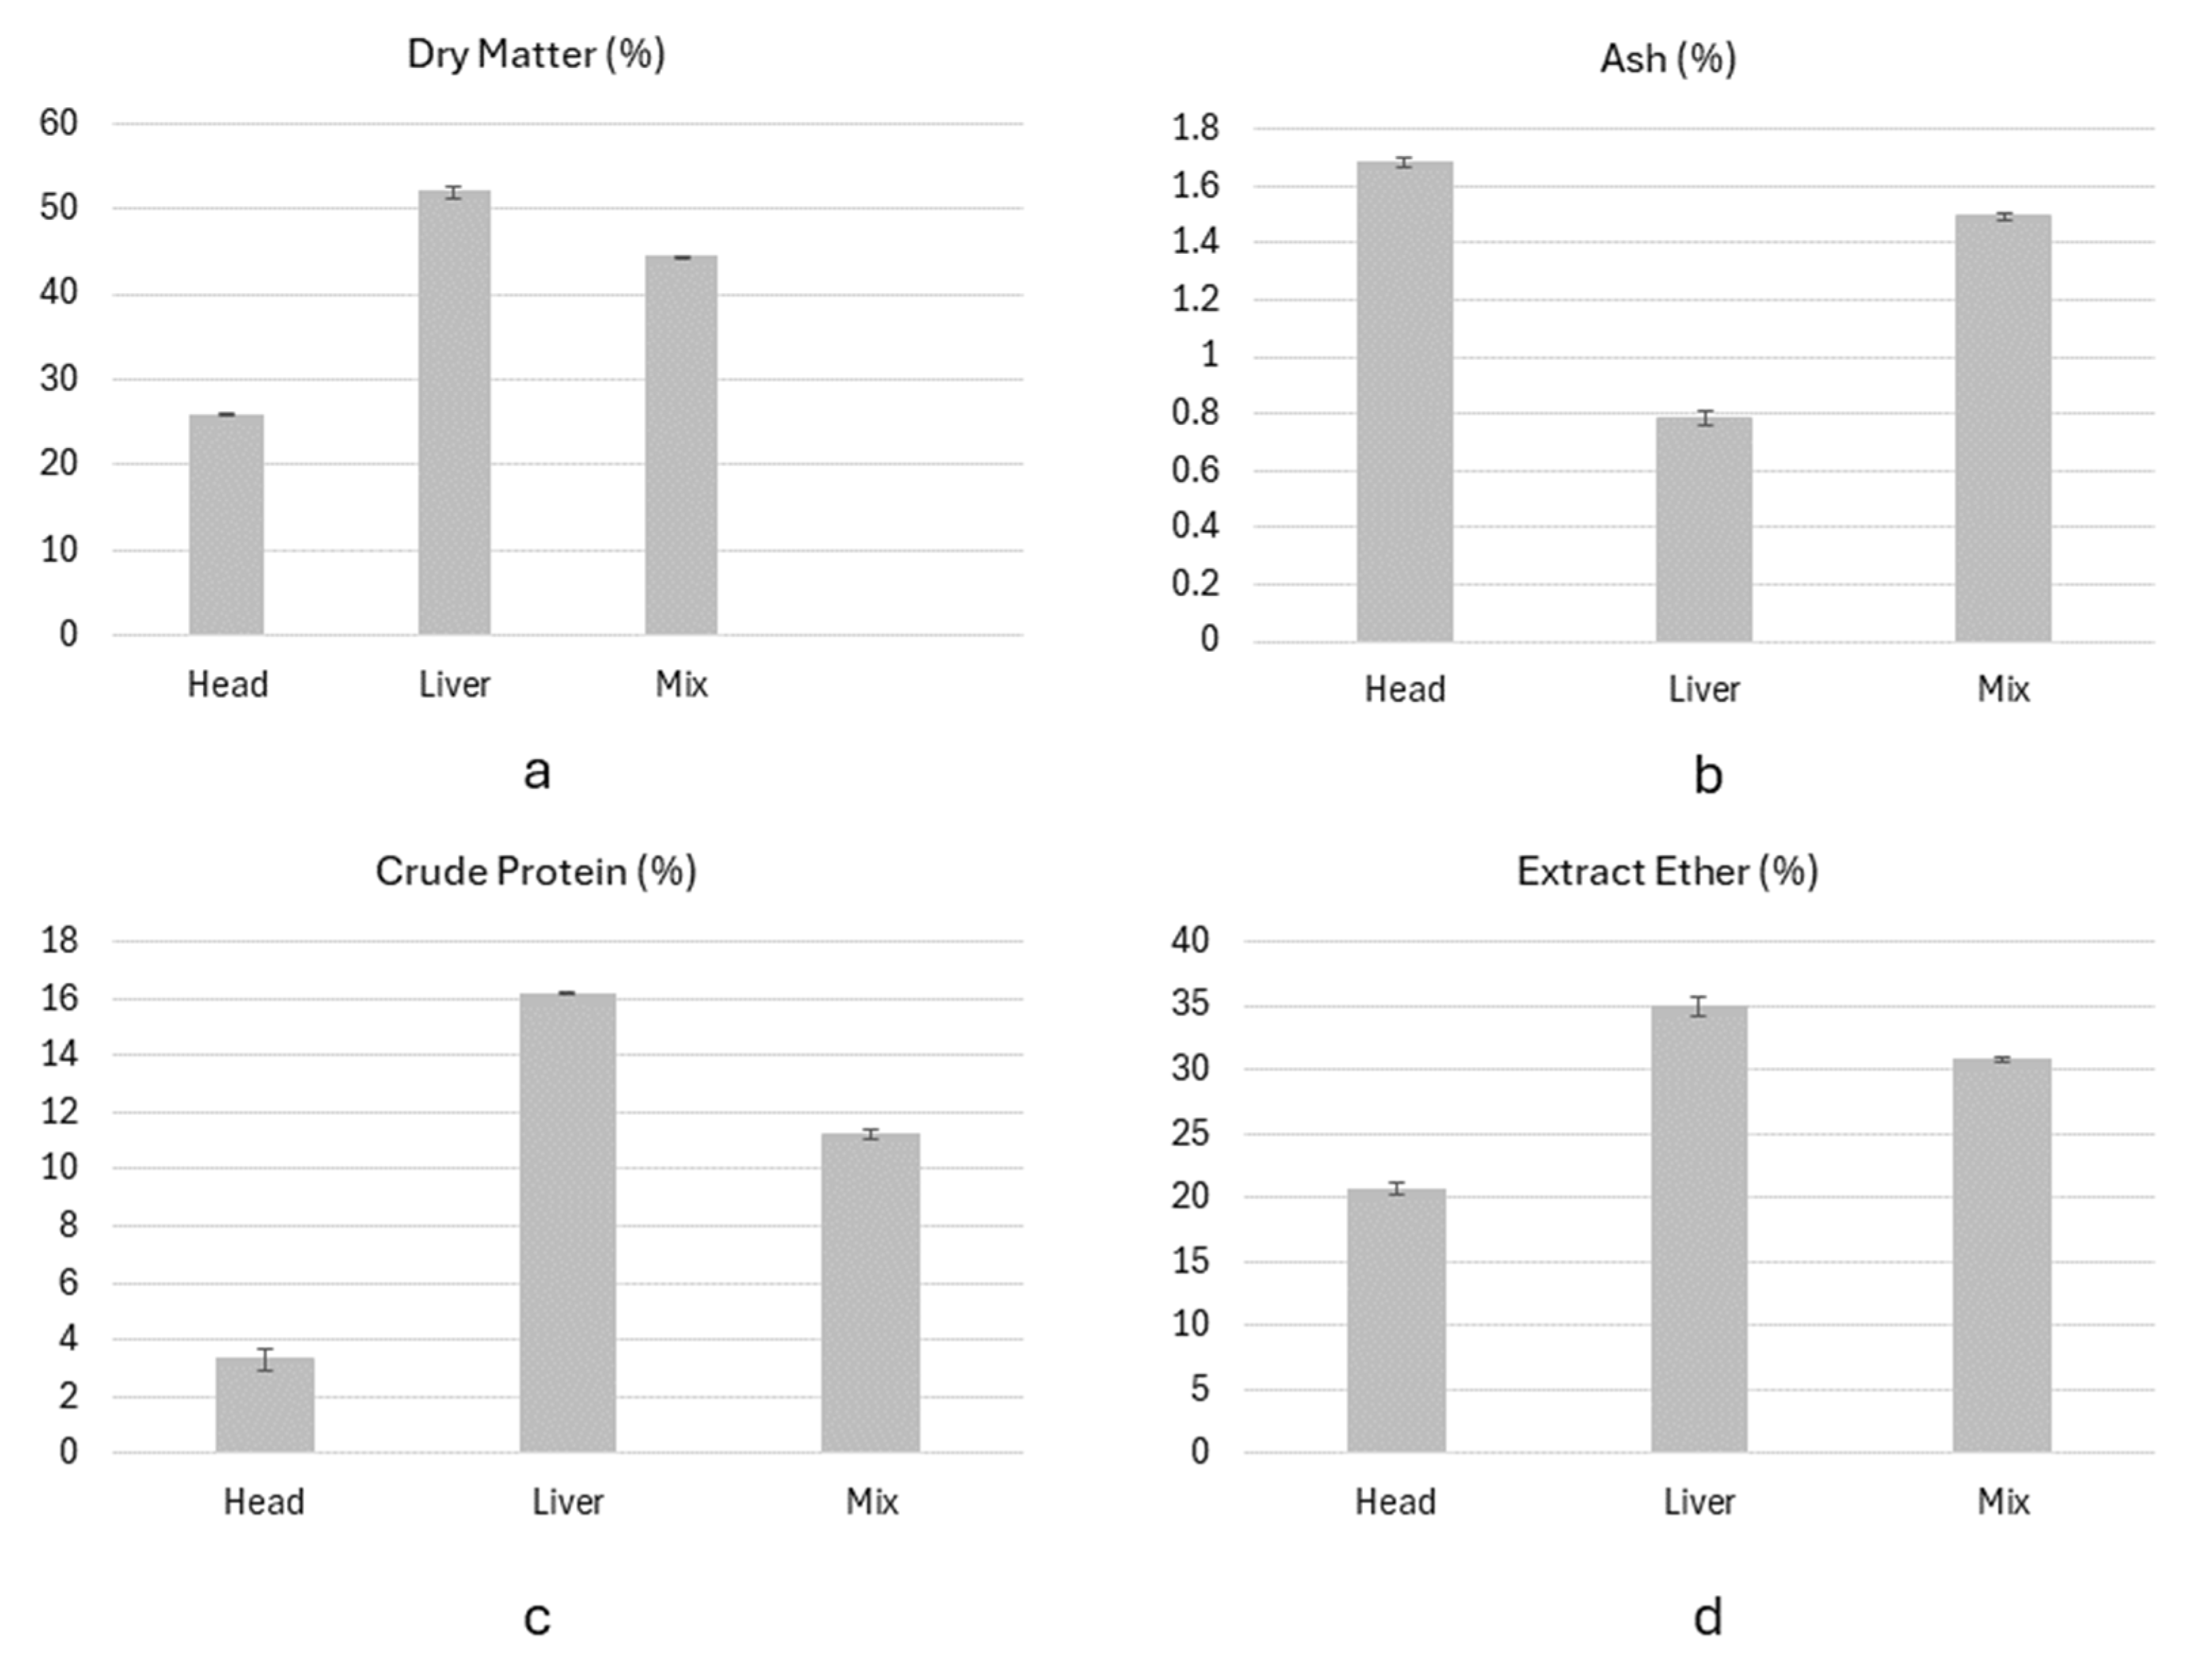
Figure 2.
Primary (a) and secondary (b), oxidation in samples of tuna head, liver and mix of head and liver harvested in a tuna farm in Malta. N=2, error bars are standard deviation.
Figure 2.
Primary (a) and secondary (b), oxidation in samples of tuna head, liver and mix of head and liver harvested in a tuna farm in Malta. N=2, error bars are standard deviation.
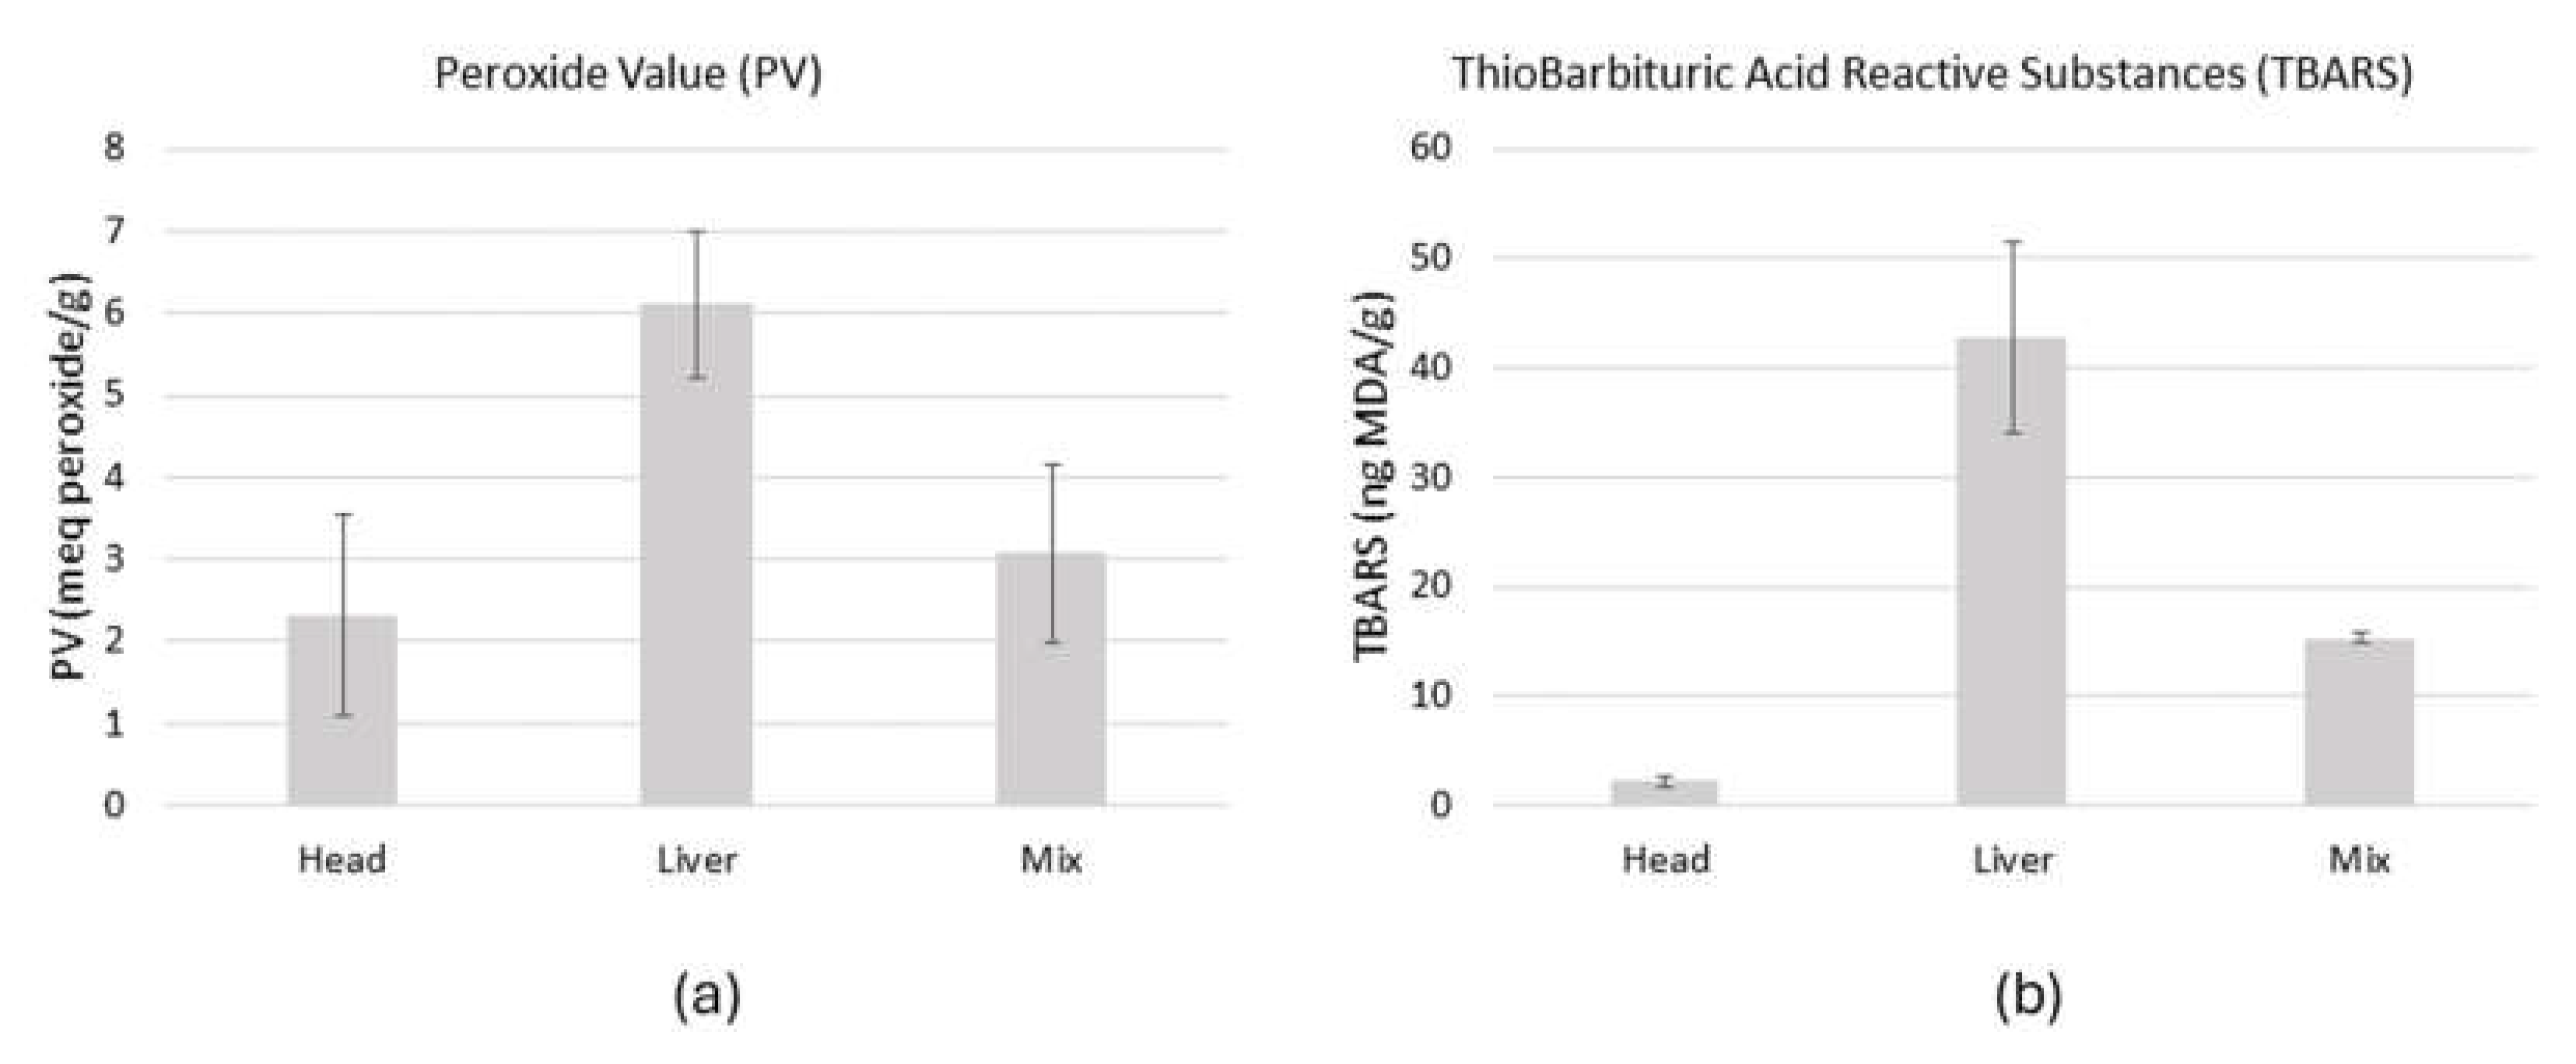
Figure 3.
Environmental indicator distribution within the activity’s total single score.
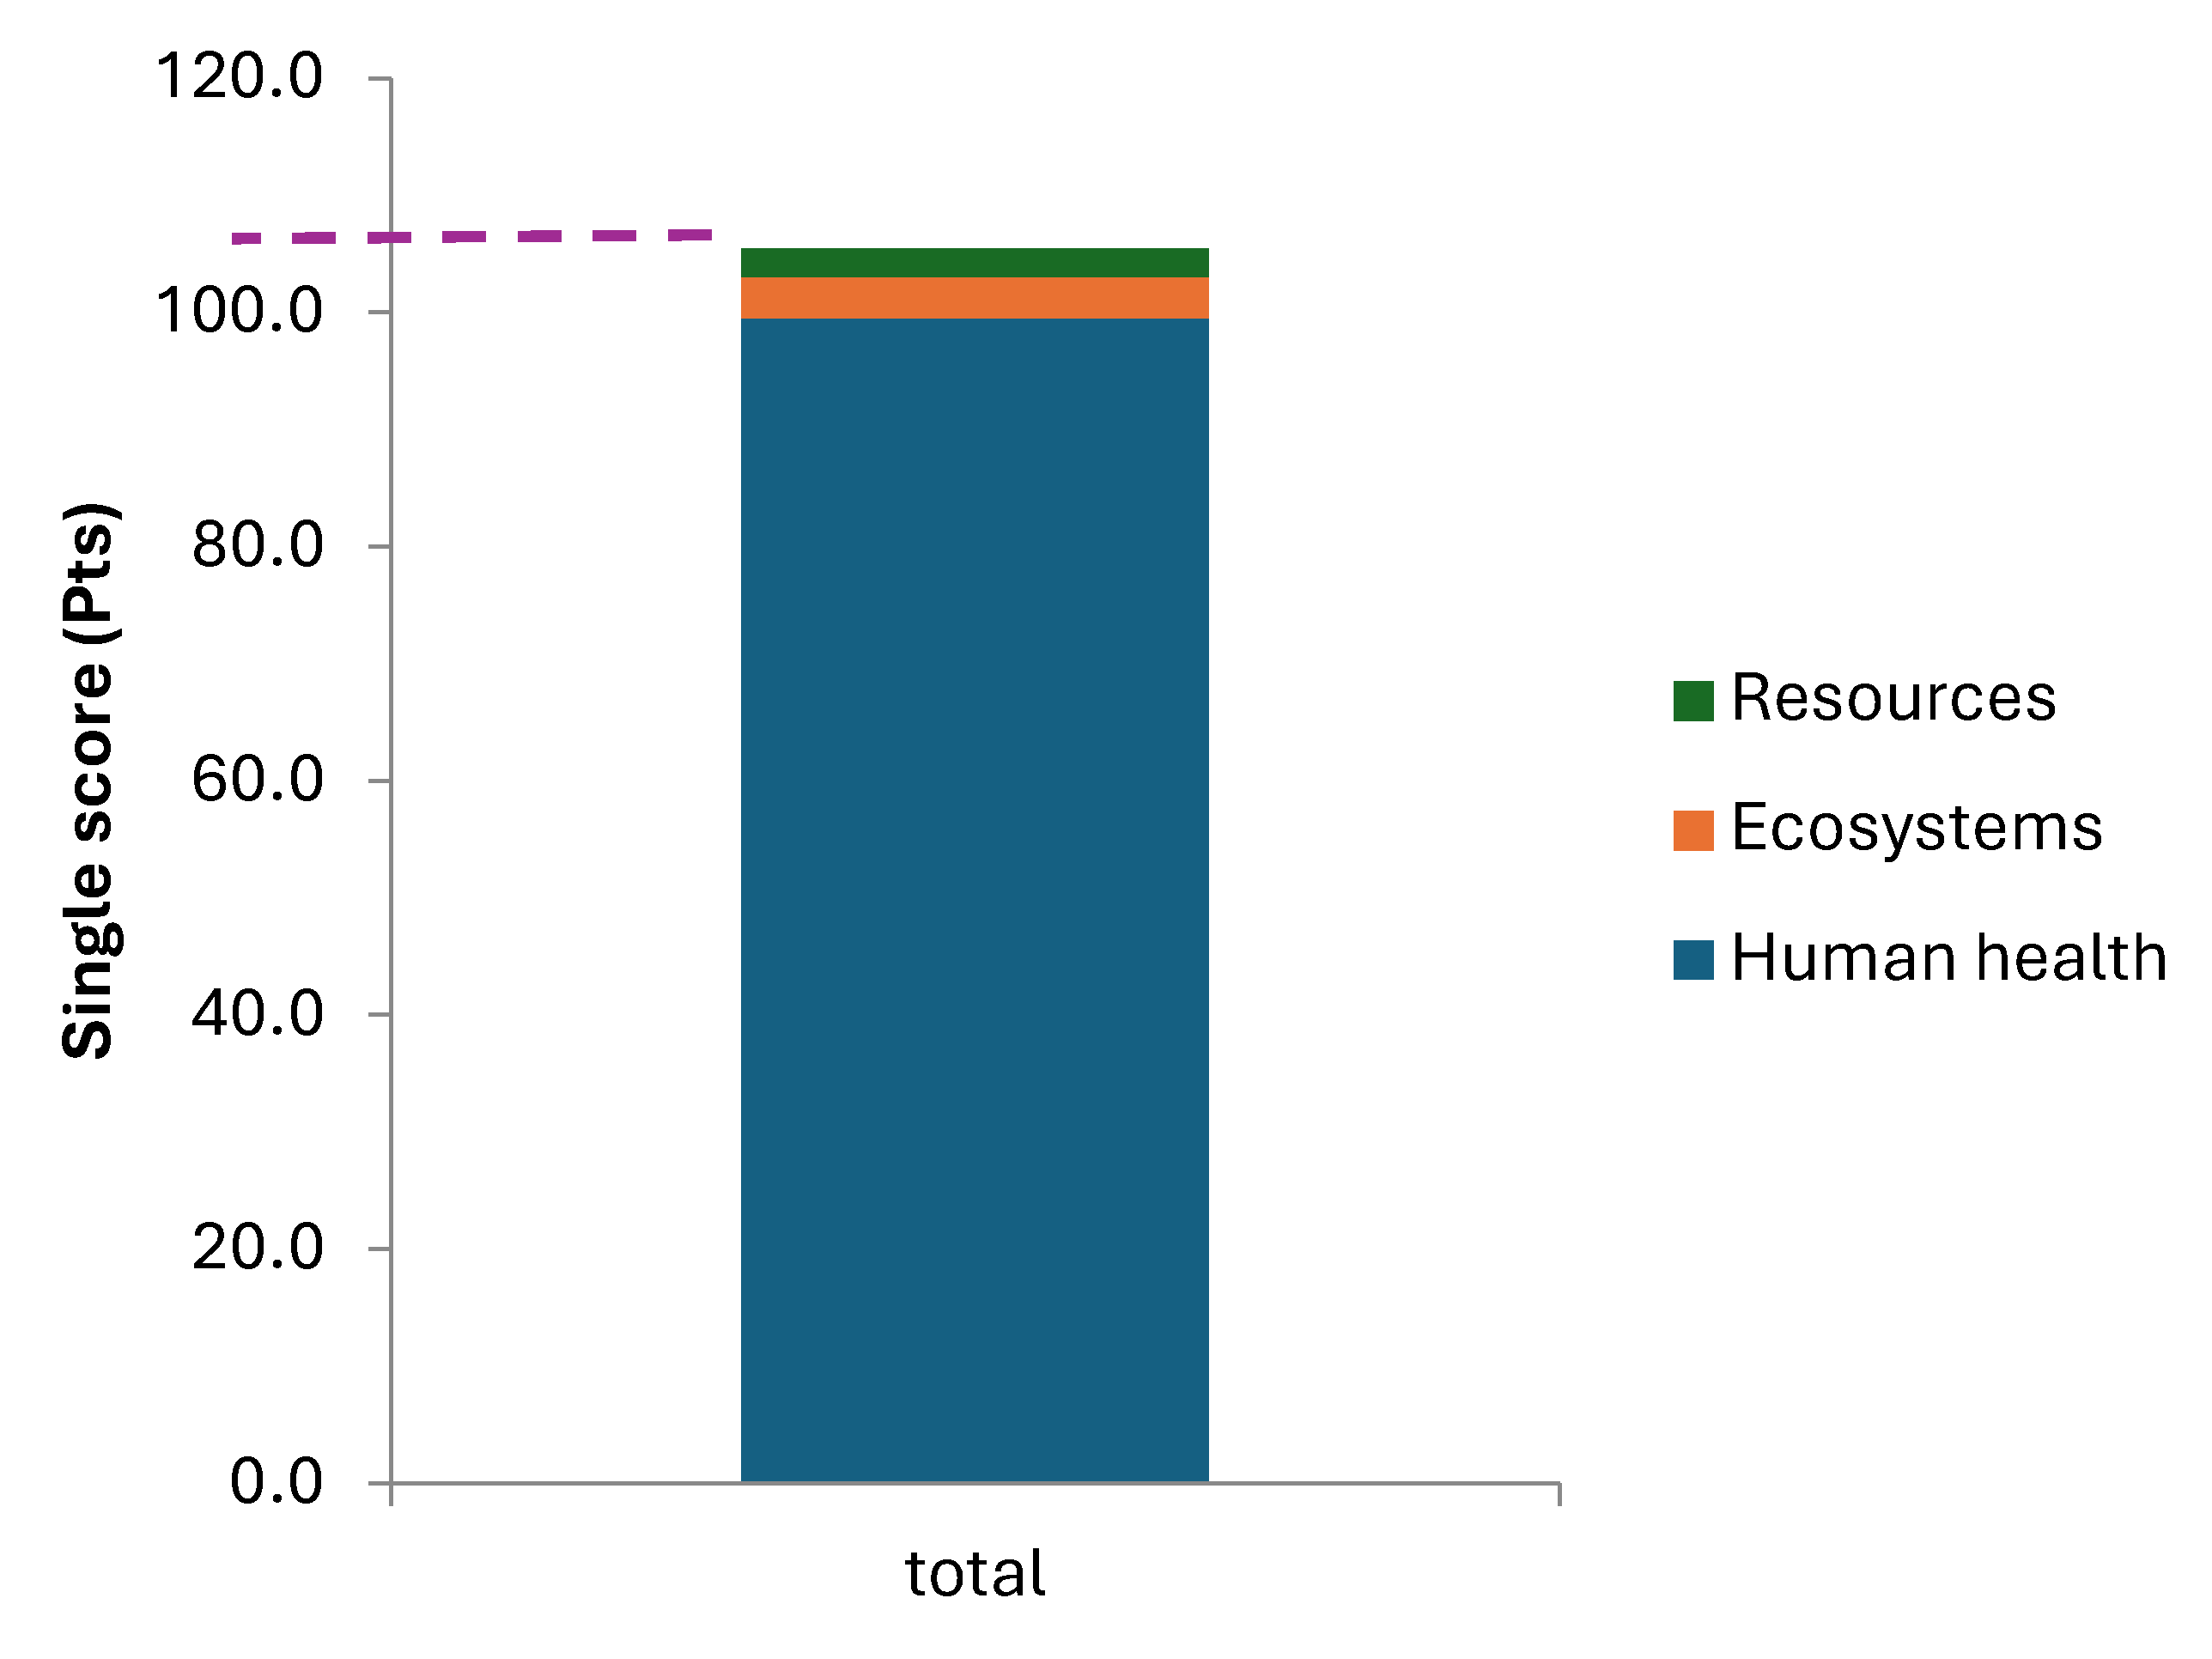
Figure 6.
Model of the life cycle of tuna fishmeal and fish oil, and boundaries of the study.
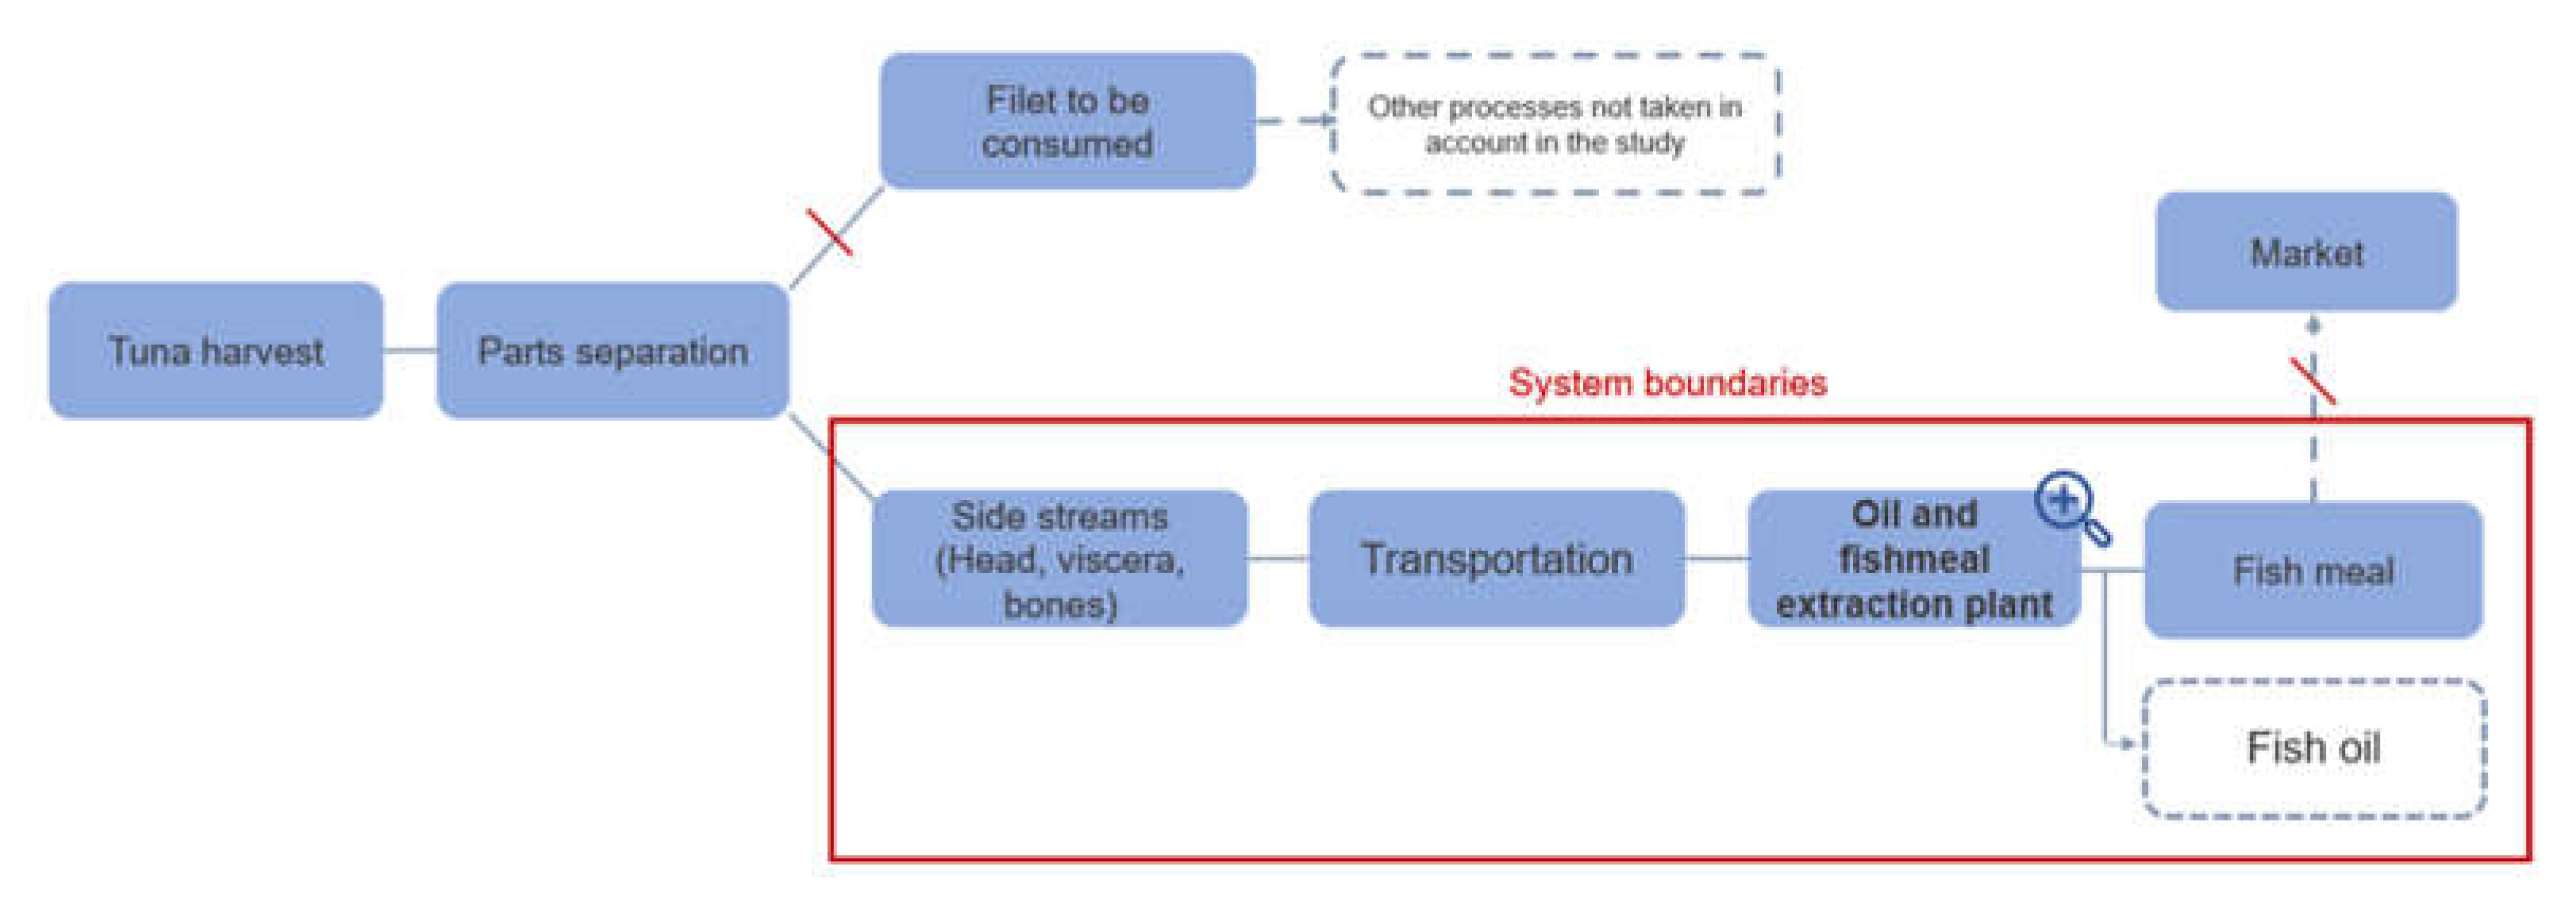
Figure 7.
2 Model illustrating the process flow of the fishmeal/ fish oil production system.
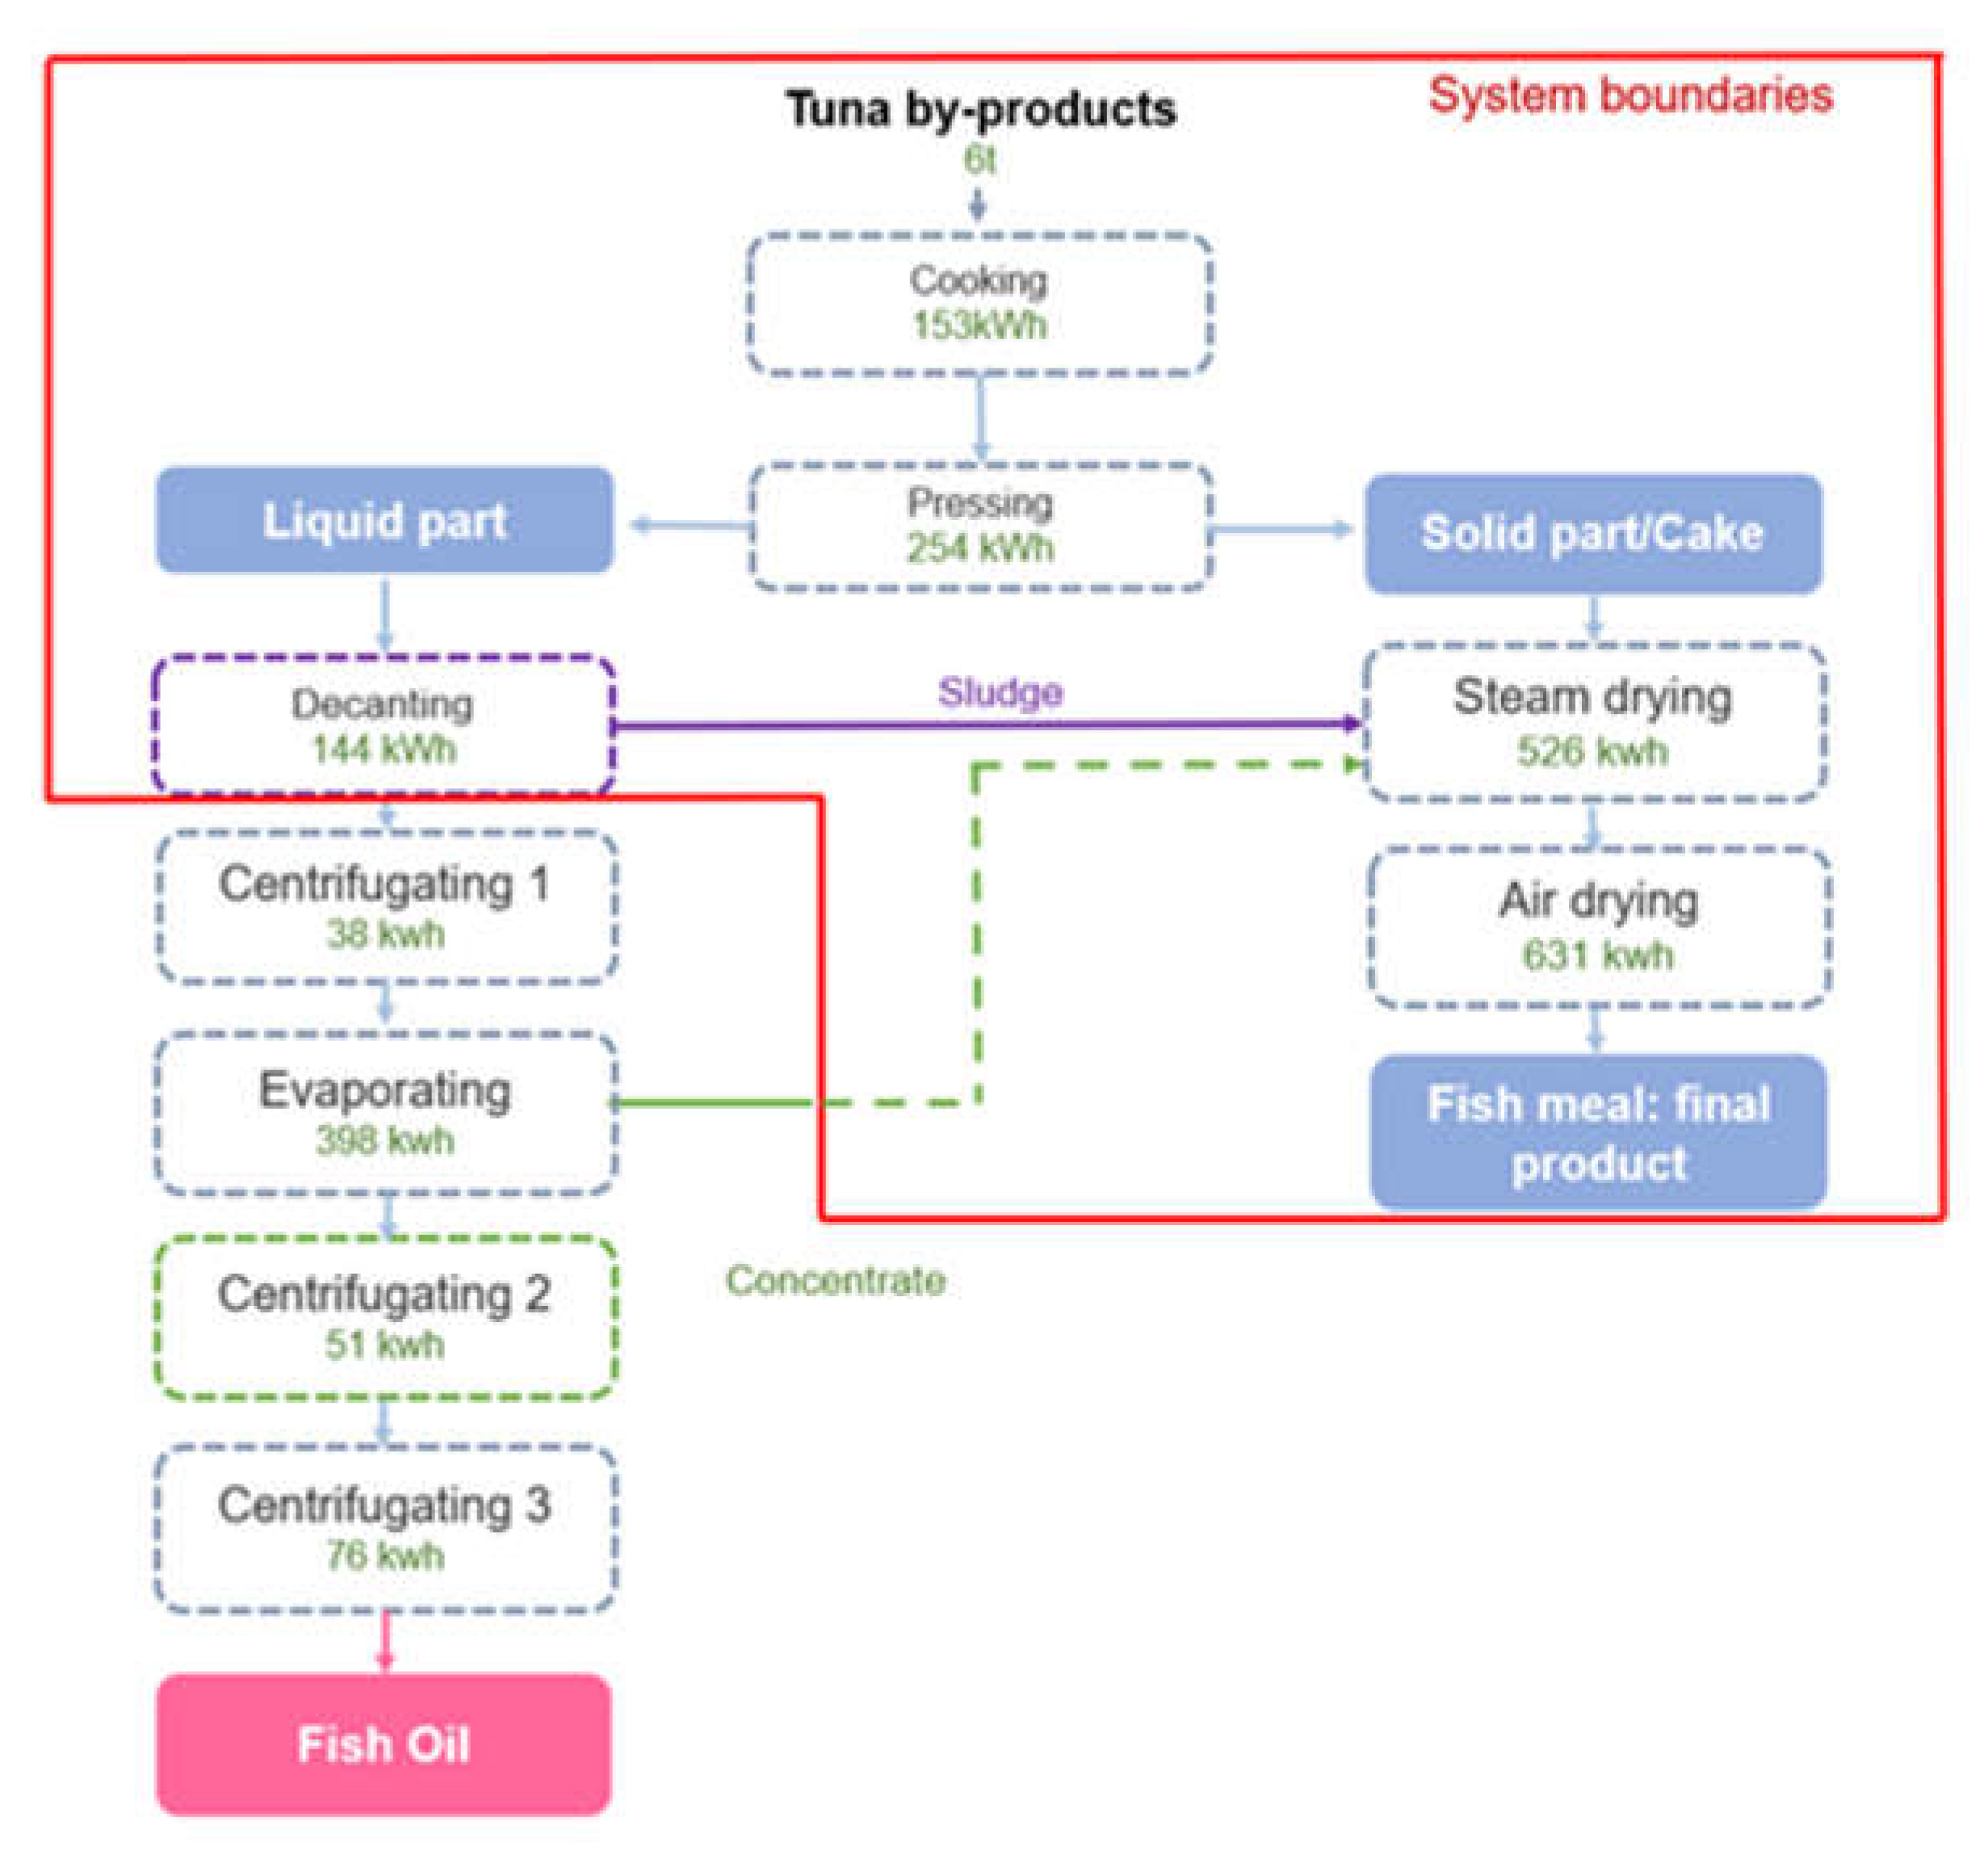
Table 1.
Bluefin tuna farms in Malta. Details of production capacity and location according to the Aquaculture Operations Register of Malta [10].
Table 1.
Bluefin tuna farms in Malta. Details of production capacity and location according to the Aquaculture Operations Register of Malta [10].
| Name | Location | Biomass (tons/year) |
| AJD Tuna Ltd. | St. Paul's Bay | 2500 |
| Fish and Fish Ltd. | South East Aquaculture zone | 3000 |
| Malta Mariculture Ltd | Comino Channel | 800 |
| Mare Blu Tuna Farm | South East Aquaculture zone | 3000 |
| MFF Ltd. 1 | South East Aquaculture zone | 1500 |
| Ta' Mattew Fisheries Ltd. | South East Aquaculture zone | 1500 |
Table 3.
Oil content and dry matter in samples of head skin, head meat and liver. The values are average ± St.Dev.(n=2).
Table 3.
Oil content and dry matter in samples of head skin, head meat and liver. The values are average ± St.Dev.(n=2).
| Oil Content (%) | Dry Matter (%) | |
|---|---|---|
| Head skin | 50.07±0.84 | 54.64±13.15 |
| Head meat | 38.16±1.18 | 47.93±1.77 |
| Liver | 43.09±0.55 | 56.94±4.11 |
Table 4.
Averages±St.Dev. of primary (PV) and secondary (TBARS), oxidation in samples of oil extracted from tuna head skin, tuna head meat and tuna liver after extraction and after storing the oil at -20˚C for 72 hours. N=2.
Table 4.
Averages±St.Dev. of primary (PV) and secondary (TBARS), oxidation in samples of oil extracted from tuna head skin, tuna head meat and tuna liver after extraction and after storing the oil at -20˚C for 72 hours. N=2.
| Oxidation in oil freshly extracted | Oxidation in oil after 72 hours at -20˚C | |||
|---|---|---|---|---|
| Source of oil extracted | PV | TBARS | PV | TBARS |
| Head skin | 3.81 ± 1.53 | 5.67 ± 0.17 | 5.83 ± 2.32 | 5.99 ± 0.16 |
| Head meat | 4.85 ± 0.08 | 4.43 ± 0.10 | 5.29 ± 0.85 | 4.73 ± 0.20 |
| Liver | 0.97 ± 0.12 | 4.20 ± 0.04 | 1.27 ± 0.23 | 4.42 ± 0.04 |
Table 5.
Average temperature of different tuna by-products collected in different dates, during the time between harvesting and processing, and histamine formation predicted by the software FSSP.
Table 5.
Average temperature of different tuna by-products collected in different dates, during the time between harvesting and processing, and histamine formation predicted by the software FSSP.
| Sample | Date | Total time (h) | Average T° | Histamine |
|---|---|---|---|---|
| Tuna head | 21st Oct-22 | 6.5 | 24.89 ± 0.30 | No predicted |
| 16th Nov-22* | 5.0 | 22.49 ± 0.50 | No predicted | |
| 22nd Nov-22** | 3.0 | 18.23 ± 1.00 | No predicted | |
| Tuna liver | 16th Nov-22 | 5.0 | 22.79 ± 0.89 | No predicted |
| 19th Dec-22 | 4.1 | 18.39 ± 0.47 | No predicted | |
| Mixed tuna sample | Nov-22 | 2.7 | 19.07 ± 0.29 | No predicted |
| Dec-22 | 4.1 | 19.98 ± 0.37 | No predicted |
Table 6.
Life Cycle inventory of the production of 1 ton of fishmeal and 25kg of fish oil from 6tons of by-products.
Table 6.
Life Cycle inventory of the production of 1 ton of fishmeal and 25kg of fish oil from 6tons of by-products.
| Life cycle phase | Process | Data required | Data collected | Unit | Data Source |
|---|---|---|---|---|---|
| Processing on boat | Cleaning | NA | NA | NA | NA |
| Gutting | NA | NA | NA | NA | |
| Filleting | NA | NA | NA | NA | |
| Transportation | Transportation on land | Type of transportation | Lorry with refrigeration machine | NA | Estimation made with the Ecoinvent database in Simapro |
| Distance (km) | 5 | km | Data provided by ARL | ||
| Transportation on sea | Type of transportation | Transoceanic ship with refrigeration machine (20m) | NA | Estimation made with the Ecoinvent database in Simapro | |
| Distance (km) | 6 | km | Data provided by ARL | ||
| Fish meal and oil processing | Cooking | Energy consumption | 153 | kwh | Hilmarsdóttir et al; 2022 |
| Pressing | Energy consumption | 254 | kwh | ||
| Steam drying | Energy consumption | 526 | kwh | ||
| Air drying | Energy consumption | 631 | kwh | ||
| Decanting | Energy consumption | 144 | kwh | ||
| Centrifugating 1 | Energy consumption | 38 | kwh | ||
| Evaporating | Energy consumption | 398 | kwh | ||
| Centrifugation 2 | Energy consumption | 51 | kwh | ||
| Centrifugating 3 | Energy consumption | 76 | kwh |
Disclaimer/Publisher’s Note: The statements, opinions and data contained in all publications are solely those of the individual author(s) and contributor(s) and not of MDPI and/or the editor(s). MDPI and/or the editor(s) disclaim responsibility for any injury to people or property resulting from any ideas, methods, instructions or products referred to in the content. |
© 2024 by the authors. Licensee MDPI, Basel, Switzerland. This article is an open access article distributed under the terms and conditions of the Creative Commons Attribution (CC BY) license (http://creativecommons.org/licenses/by/4.0/).
Copyright: This open access article is published under a Creative Commons CC BY 4.0 license, which permit the free download, distribution, and reuse, provided that the author and preprint are cited in any reuse.


