Submitted:
02 September 2024
Posted:
03 September 2024
Read the latest preprint version here
Abstract
There is a pressing need for tools that can rapidly predict PM2.5 concentrations and assess health impacts under various emission scenarios, aiding in the selection of optimal mitigation strategies. Traditional chemical transport models (CTMs) like CMAQ are accurate but computationally intensive, limiting practical scenario analysis. To address this, we propose a novel method integrating a conditional U-Net surrogate model with health impact assessments, enabling swift estimation of PM2.5 concentrations and related health effects. The U-Net model was trained with 2019 South Korean PM2.5 data, including precursor emissions and boundary conditions. Our model showed high accuracy and significant efficiency, reducing processing times while maintaining reliability. By combining this surrogate model with the EPA’s BenMAP-CE tool, we estimated potential premature deaths under various emission reduction scenarios in South Korea, extending projections to 2050 to account for demographic changes. Additionally, we assessed the required PM2.5 emission reductions needed to counteract the increase in premature deaths due to an aging population. This integrated framework offers an efficient, user-friendly tool that bridges complex air quality modeling with practical policy evaluation, supporting the development of effective strategies to reduce PM2.5-related health risks and estimate economic benefits.
Keywords:
Air pollutant prediction
; CMAQ surrogate model
; Health impact assessment
1. Introduction
Although air pollution levels, including those of particulate matter (PM2.5), have shown some improvement over time, the aging population poses a significant challenge. If current emission levels are maintained, the number of premature deaths attributed to PM2.5 is expected to continue rising due to the increasing vulnerability of older adults. Therefore, additional efforts to reduce emissions are necessary to counteract the rise in premature deaths associated with population aging. This study aims to address this issue by establishing a method for predicting PM2.5 concentrations in response to emission reductions and estimating premature deaths based on these predicted concentrations. Specifically, we develop a model that incorporates the aging population’s impact on premature death rates and determines the additional emission reductions required to offset the increase in premature deaths.
The complex nature of PM2.5 pollution in South Korea presents a significant challenge for air quality management. PM2.5 levels in South Korea are influenced by a combination of domestic emissions and transboundary pollution, primarily from China. While domestic emissions are a crucial target for mitigation efforts, the impact of foreign sources, which is beyond the country’s direct control, must also be considered. To address this, the South Korean government is implementing a comprehensive strategy that includes regional assessments, advanced PM2.5 concentration modeling, and dynamic emission reduction policies[1]. Emergency measures are also in place for severe pollution events[2]. Effective management requires the ability to rapidly simulate and evaluate multiple emission scenarios under varying conditions, including the impact of transboundary pollution. Therefore, there is a need for a PM2.5 concentration prediction model that can account for the influence of boundary conditions from neighboring countries, such as China. Developing such models is essential for establishing rational, responsive, and effective policies for managing fine particulate matter and safeguarding public health in South Korea.
Figure 1.
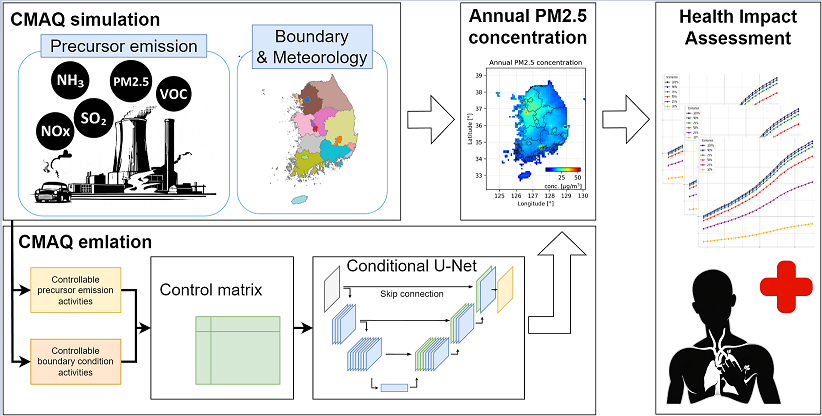
Schematic view of our works. The figure shows how the CMAQ emulator is populated with seven precursor emission activity levels for each of Korea’s 17 regions and outputs a map of the concentrations of five air pollutants at a given time. The details of the model’s operation are explained in the Methods section.
Figure 1.
Schematic view of our works. The figure shows how the CMAQ emulator is populated with seven precursor emission activity levels for each of Korea’s 17 regions and outputs a map of the concentrations of five air pollutants at a given time. The details of the model’s operation are explained in the Methods section.
One of the most well-known air pollutant concentration simulation tools is the Community Multiscale Air Quality Modeling System (CMAQ), developed by the U.S. Environmental Protection Agency (EPA)[3]. CMAQ accurately simulates pollutant dispersion based on physical and chemical processes and is widely used by governments and organizations, including those in South Korea, for air quality management. While CMAQ offers the advantage of incorporating complex chemical reactions and providing sophisticated simulations, its high data management complexity, substantial computational demands, and lengthy processing times for each emission scenario pose significant challenges for efficient policy evaluation across multiple air quality scenarios. To address these limitations, research has focused on developing surrogate models using statistical techniques like polynomial chaos and response surface modeling (pf-RSM) and deep response surface modeling (deepRSM)[4,5,6,7], as well as deep learning approaches such as Convolutional Neural Networks (CNN) and U-Net models [8,9]. These surrogate models have demonstrated the ability to emulate CMAQ with high performance. However, they still face challenges in terms of data handling complexity, which can limit their accessibility for non-experts in air pollution simulation—such as those focused on evaluating health impacts and formulating air pollution policies.
In this study, we present an innovative methodology that bridges the gap between complex air quality modeling and practical policy evaluation. Our approach integrates a high-speed CMAQ surrogate model based on a conditional U-Net architecture with the widely used Environmental Benefits Mapping and Analysis Program (BenMAP) health impact assessment tool [10,11]. This combined framework allows policymakers to swiftly assess the health impacts of various precursor emission strategies. The surrogate model, designed to emulate annual PM2.5 concentrations in South Korea, uses adjustable precursor emission rates and boundary conditions as inputs. It demonstrates high performance and scientific validity, as confirmed by input-output relationship analysis. Notably, the model significantly reduces computational time, enhancing efficiency for specific applications. By leveraging this surrogate model and BenMAP pipeline, we can evaluate how human health impacts shift under different annual emission scenarios and boundary conditions, providing decision-makers with a more efficient and accurate tool for policy development.
The paper is organized as follows: Section 2 (Materials and Methods) provides details on data preparation, explains the conditional U-Net architecture, describes the training and evaluation processes, and outlines the health impact assessment approach using BenMAP. Section 3 (Results) presents the performance metrics of the surrogate model and the outcomes of the health impact assessments. Finally, Section 4 (Discussion) explores the implications of our findings, acknowledges the study’s limitations, and proposes directions for future research. This work represents a significant advancement toward more responsive and effective air quality management, especially in regions dealing with complex PM2.5 pollution challenges.
2. Materials and Methods
2.1. Preparing Datasets
2.1.1. Community Multiscale Air Quality
In this study, we used the Community Multiscale Air Quality (CMAQ) modeling system, version 4.7, to simulate annual average air pollutant concentrations over South Korea for the year 2019. CMAQ, developed by the U.S. Environmental Protection Agency, is a state-of-the-art tool that integrates emissions, transport, chemical transformation, and deposition processes. Our model setup incorporated the SAPRC-99 chemical mechanism and included two nested domains: a Korean domain with a resolution of 9 km (82 × 67 grid cells).
To capture the vertical structure of the atmosphere, we used a 30-layer configuration in our simulations. The SMOKE-Asia system was used to process precursor emissions, using the CREATE v3.0 emissions inventory as the basis. Importantly, our study went beyond standard CMAQ simulations by incorporating varying boundary conditions. This approach allowed us to evaluate the effects of varying regional background pollutant levels on local PM2.5 concentrations. We conducted multiple year-long simulations, each with different boundary conditions, to generate a comprehensive dataset of annual average PM2.5 concentrations. This dataset not only captured the spatial variability of PM2.5 across South Korea, but also reflected the influence of changing regional pollution patterns, providing a robust basis for training and evaluating our conditional U-Net model.
2.1.2. Control Matrix
When the original CMAQ simulation is run, the precursor emissions are represented as a two-dimensional map, and each grid is assigned the corresponding emission value. However, such data is difficult to use easily and has limitations that reduce its usefulness. Here, we have created a one-dimensional control matrix that shows the activity of precursor emissions for each region as a percentage of the reference scenario. By systematically varying the activity levels of five precursor emission activities (, , , , ) in 17 different regions of Korea, 238 unique scenarios were created. Of the 238 scenarios, half of the data are simulated PM2.5 concentrations with boundary conditions set at 0.5x. This approach allowed a broad investigation of potential emission patterns and air quality impacts. To efficiently sample the vast parameter space of emission variations, we used Latin Hypercube Sampling (LHS). This statistical technique allowed us to generate a nearly random but well-distributed set of control factors for each emission sector and region. The control factors were varied between 0.5 and 1.5 times the baseline values, allowing for a comprehensive exploration of potential emissions changes while minimizing the number of simulations required. Of these 238 scenario data, 100 were used to train our model and the remaining 138 were used as test data for evaluation in the text. The training and evaluation data were carefully controlled to ensure no data omissions, and the data were randomly extracted. Table 1 shows an example of a control matrix.
2.2. Emulating CMAQ Simulation
2.2.1. Conditional U-Net Architecture
The basic concept of a conditional U-Net is an architecture used in the diffusion model, which has been widely used in the field of image generation in recent years, especially in the field of stable diffusion [12,13]. In Stable Diffusion, the conditional U-Net is used to predict the diffusion of noise in the latent tensor of a VAE-encoded image at a given time, using an integer representing the latent tensor and time step, and the prompt information encoded in the text encoder. The prompt information encoded by the text encoder is input. In this study, we have applied the structure of the conditional U-Net within stable diffusion, which has as input parameters "the latent tensor of a certain image" and "the condition of a certain time and prompt", to a structure that receives as input "the emission information of the antecedent of a certain scenario" and "the activity of the boundary condition". The structure has been applied to the structure.
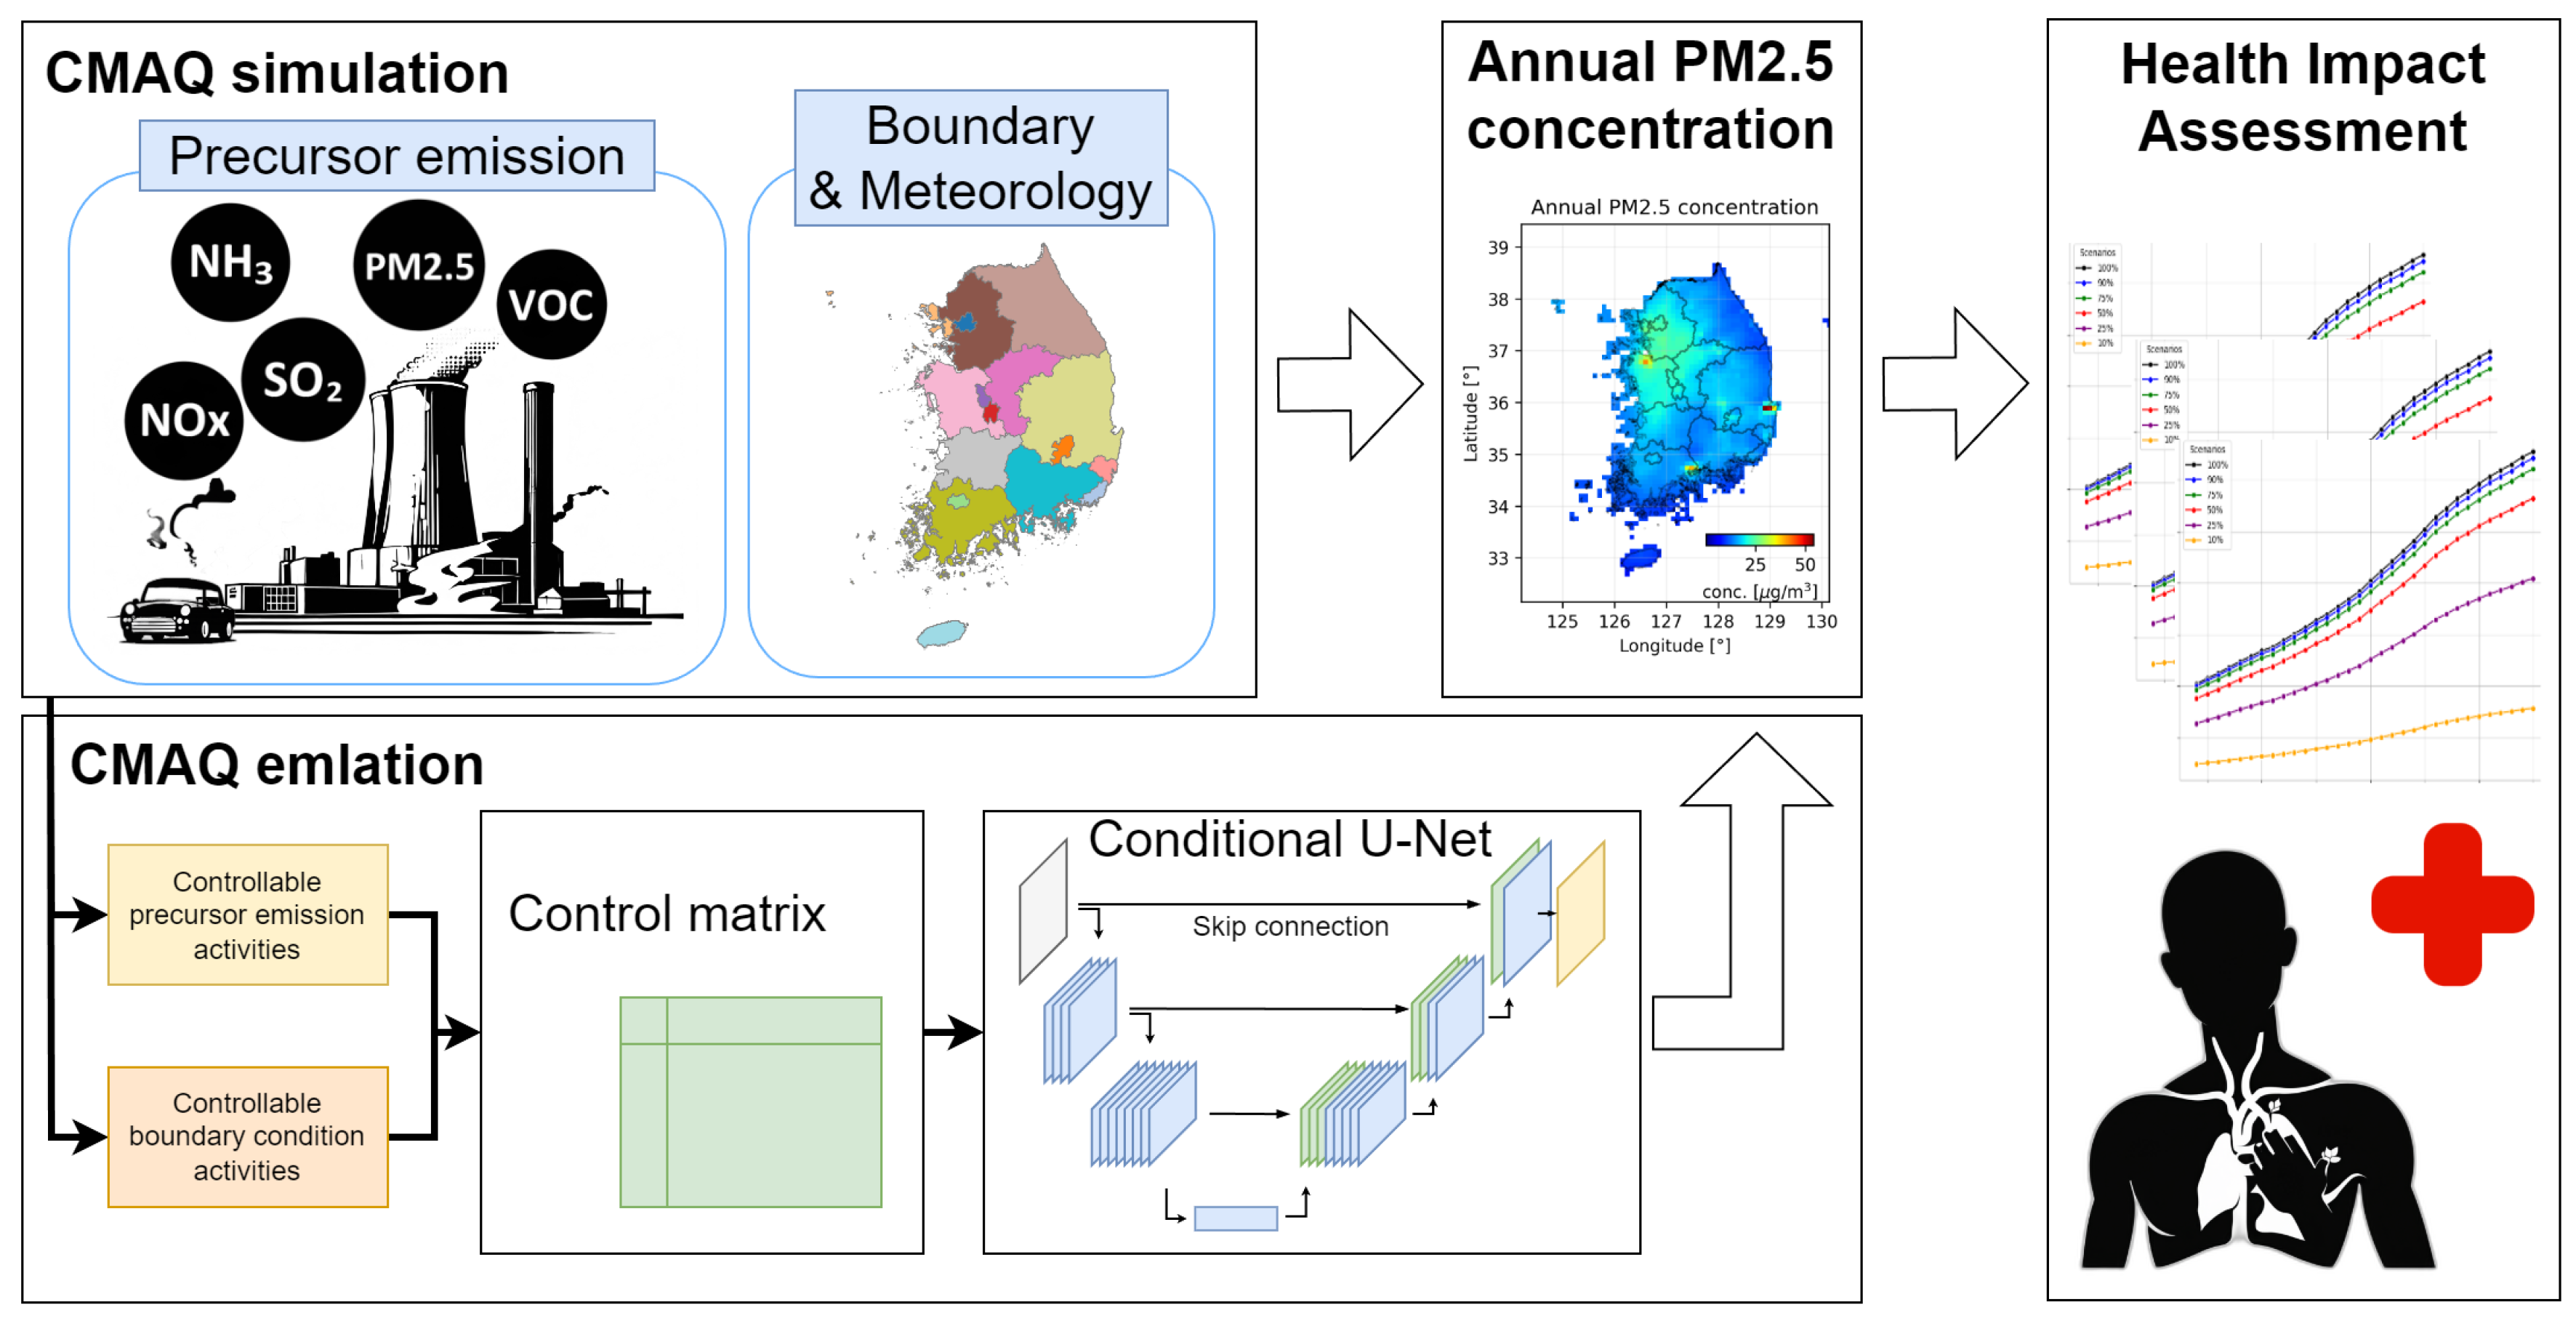
Figure 2 shows a schematic of the conditional U-Net architecture for emulating the annual PM2.5 concentration calculated by the CMAQ simulation. This customized architecture processes two primary inputs: precursor activities (85-dimensional vector) and a boundary condition (scalar). The precursor activities are gridded to produce an initial 82x67x5 spatial representation, which is then resized to 96x64x5 to facilitate efficient CNN computation. This resized input passes through a series of CNN blocks that progressively reduce the spatial dimensions while increasing the feature depth. Simultaneously, the boundary condition is processed through Multi-Layer Perceptrons (MLPs), increasing its dimensionality to interact with the spatially encoded precursor information at multiple scales via element-wise addition. The network includes a bottleneck layer (12x8x40) for maximum feature compression, followed by a decoder path that upsamples features back to the original dimensions. Skip connections between the corresponding encoder and decoder layers preserve fine-grained spatial information. The final output is an 82x67x1 tensor representing the predicted annual PM2.5 concentration, matching the spatial resolution of the CMAQ simulation. This architecture efficiently captures the complex relationships between precursor emissions, boundary conditions, and PM2.5 concentrations, providing a computationally efficient alternative to full CMAQ simulations. It’s worth noting that the hyperparameters shown in the figure, such as layer dimensions and feature depths, can be adjusted to meet specific problem requirements or computational constraints, providing flexibility in model customization.
2.2.2. Gridding Strategy
Our model uses 86-length vector (control matrix with 85 precursor activities and 1 boundary activity) as an input variable. To take advantage of the spatial feature extraction capabilities of convolutional neural networks (CNNs), we developed a preprocessing technique that transforms the input from a simple one-dimensional vector to a structured three-dimensional matrix. This approach involves mapping the data onto an 82 × 67 grid, reflecting the geographical characteristics of Korea, with each grid cell assigned the emission activities of the five precursors. The resulting 82 × 67 × 5 matrix serves as the input to our conditional U-net, which effectively preserves the spatial relationships between regions while capturing the emission patterns of each precursor. The boundary activity input goes to conditional layer without building 2D map. See Figure 2.
This preprocessing is performed automatically by a custom-designed layer that holds index information for each local government as fixed variables and transforms the input one-dimensional control matrix into the appropriate two-dimensional structure. Users of the model can simply provide one-dimensional input data without having to understand the complexities of this transformation process. The administrative divisions and grid index information for Korea used in this study were referenced from [14]. By adopting this spatial structuring approach, our model can more accurately capture the relationship between precursor emissions and PM2.5 concentrations, thus contributing to improved air quality predictions across South Korea.
2.3. Evaluation Methods
In order to increase the level of confidence in the emulation model presented in this study, and to show that there are no problems in using it for health impact assessment and policy making, quantitative and qualitative evaluations were performed simultaneously. The quantitative evaluation was conducted using several indices used to evaluate the predictive results of deep learning models. The qualitative evaluation analyzed the causal relationships between the inputs and outputs of the model and the contribution of the input parameters to show that the model successfully learned the physical and chemical processes between PM2.5 and its precursors and the properties of CMAQ, as reported in previous studies.
2.3.1. Performance Metrics
To quantitatively assess the performance of our Conditional U-Net model in emulating CMAQ simulations, we used three widely used statistical metrics: Mean Absolute Error (MAE), Normalized Mean Absolute Error (NMAE), and Coefficient of Determination (). These metrics provide complementary insight into the model’s accuracy, scale-independent error, and explanatory power, respectively. The Mean Absolute Error (MAE) measures the average size of the errors in the predictions without regard to their direction. It is calculated as
where is the true value (CMAQ simulation result), is the predicted value (Conditional U-Net output), and n is the number of samples. The MAE is expressed in the same units as the PM2.5 concentrations (), providing an intuitive measure of the average prediction error. Normalized Mean Absolute Error (NMAE) expresses the MAE as a percentage of the observed mean, providing a scale-independent measure of error:
where is the mean of the observations. NMAE allows the comparison of model performance over different scales or data sets. The coefficient of determination () quantifies the proportion of variance in the dependent variable that can be predicted by the independent variable(s). It is calculated as
ranges from 0 to 1, with 1 indicating perfect prediction. It provides insight into how well the model captures the variability in the CMAQ simulations. These metrics were calculated for both the training and test datasets to assess the performance and generalizability of the model. By using these complementary metrics, we aim to provide a comprehensive evaluation of our model’s ability to accurately emulate CMAQ simulations of PM2.5 concentrations.
2.3.2. Contribution Analysis Using SHAP Value
To evaluate the relative importance of input variables in the Conditional U-Net CMAQ surrogate model, we used SHapley Additive exPlanations (SHAP) values. SHAP values provide a unified measure of feature importance based on coalitional game theory, providing consistent and locally accurate attributions that satisfy desirable properties such as local accuracy, missingness, and consistency [15]. This approach allows the decomposition of a prediction into the additive contribution of each input feature, enabling both global feature importance analysis and detailed local explanations for individual predictions. The SHAP value for a feature i can be expressed as:
where F is the set of all features, S is a subset of features, and is the model output. This formula captures the average marginal contribution of feature i across all possible feature subsets. SHAP values are prticularly useful in complex models like out conditional U-Net, where the interactions between input variables can be intricate and non-linear.
We used the PermutationExplainer algorithm to compute SHAP values for our conditional U-Net model. This model-independent method estimates SHAP values by permuting feature values and observing the effect on model output. By aggregating SHAP values across multiple predictions, we generated SHAP summary plots to visualize the magnitude, frequency, and direction of each input variable’s effect on model output. This analysis provided insight into the key drivers of PM2.5 concentrations in our surrogate model, allowing for a nuanced understanding of the relative contributions of different input parameters to predicted air quality impacts.
SHAP values have been successfully used in several recent studies to interpret machine learning models for air pollution prediction and source attribution. For example, SHAP values have been used to explain predictions of concentrations in Madrid [16] and to quantify the contributions of meteorological factors to PM2.5 concentrations in Paris [17]. SHAP analysis has also been used to determine the relative importance of different variables in predicting PM2.5 levels in Zhejiang Province, China [18]. More recently, SHAP values were used to analyze the contributions of different sources to air pollution events in Zibo, China [19] and to estimate the source contributions of in Taichung City, Taiwan [20]. These studies demonstrate the growing use of SHAP values in air pollution research to provide interpretable insights from complex machine learning models. The successful use of SHAP analysis in different geographical regions and for different air pollutants supports its validity as an analytical tool in this field.
2.4. Health Impact Assessment
2.4.1. BenMAP-CE Methodology
The health benefits associated with changes in air pollution concentrations were evaluated using the BenMAP-CE tool, which employs the following equation to quantify the relationship between air quality improvements and corresponding health impacts on the population [10].
In this equation, the Health Benefit represents the estimated reduction in adverse health outcomes (e.g., premature mortality) due to changes in pollutant concentrations, calculated separately for different regions and age groups. The variable denotes the baseline incidence rate of the health outcome per unit population, which varies by region and age group. Population refers to the total number of individuals within each specified region and age group. The parameter is the concentration-response function coefficient, reflecting the sensitivity of the health outcome to changes in pollution levels. represents the change in PM2.5 concentration, specific to each region.
The BenMAP-CE framework integrates:
- Air quality data (monitored or modeled)
- Detailed population demographics
- Baseline health incidence rates
- Concentration-response functions from the epidemiological literature
- Economic valuation methods
The tool applies this function at fine spatial resolutions, typically grid cells, to account for local variations in air quality, population, and health status. It can assess impacts for different pollutants, primarily PM2.5 and ozone, at different geographic scales. Also, the analysis process includes defining the study area, specifying air quality changes, estimating population exposure, selecting health impact functions, calculating health outcomes, aggregating results, applying economic valuation, and characterizing uncertainty. Finally, the open source nature of BenMAP-CE ensures transparency and allows for community-driven improvements. By providing a standardized, scientifically rigorous approach to health impact assessment, it plays a critical role in informing air quality management decisions and supporting evidence-based environmental health policies.
2.4.2. Input Parameters of Health Impact Assessment
Regional PM2.5 concentration forecast data by scenario Regional PM2.5 concentrations were estimated using the Conditional U-Net CMAQ surrogate model, with the year 2019 serving as the baseline. Various emission reduction scenarios were modeled by adjusting boundary conditions to 100% and 50% of baseline values and varying precursor emissions to 100%, 90%, 75%, 50%, 25%, and 10% of the baseline. The annual average PM2.5 concentrations were then predicted for each of the 17 provinces in South Korea.
2019 Population Counts and Estimates Population data for 2019 and projections through 2050 were obtained from the Korean Statistical Information Service (KOSIS). The population data included age groups from 30 to 80+ years, segmented into 5-year intervals across the 17 provinces[21].
Mortality rates by disease Mortality rates for cardiovascular diseases (CVD) and respiratory diseases (RD) were derived from the 2019 "Deaths and Death Rates by Cause" statistics provided by KOSIS, segmented similarly by age and region[22]. For future projections up to 2050, it was assumed that these mortality rates would remain constant at the 2019 levels.
Beta Coefficient Beta coefficients for long-term exposure to PM2.5, specific to CVD and RD, were applied using default values provided by the World Health Organization (WHO). These coefficients, as outlined in the WHO’s AirQ+ tool, are based on the findings of [23] and reflect the increased risk per 10 µg/m³ increase in annual PM2.5 concentrations. For individuals aged 30 and above, the beta coefficient for CVD is 0.0104 (95% CI: 0.0086–0.013) and for RD, it is 0.0095 (95% CI: 0.0030-0.017)[23,24].
3. Results
The results of this study can be divided into two main categories. One is the confirmation of the emulation performance of the CMAQ emulator, and the other is the results of the health effect assessment using this emulator and its analysis. In this section, we discuss these results.
3.1. Emulation Performance Evaluation
We first verify the emulation performance of the CMAQ simulation results for the conditional U-Net structure used in our methodology. This is an important step in determining whether the health effects assessment using this conditional U-Net is reliable. The performance is compared from three perspectives: (1) for quantitative evaluation, simulation and emulation results are compared by scatterplotting all grid verbs, (2) the mean absolute error (MAE), normalized mean absolute error (NMAE), and coefficient of determination (), (3) for qualitative evaluation, the importance between model inputs and outputs is analyzed using SHAP values to see how well the model mimics the physical and chemical processes of CMAQ, and finally, (4) the computation time was evaluated.
3.1.1. Emulation Results
Figure 3 presents a comprehensive comparative analysis of the Conditional U-Net model’s inference results against CMAQ simulations, using both training and test data sets. The scatter plots are arranged side-by-side, with the left panel showing the model’s performance on the training data and the right panel demonstrating its capability on the unseen test data. Both scenarios show remarkable agreement with the CMAQ simulations, achieving an impressive value of 0.99. This exceptional correlation underscores the model’s ability to emulate CMAQ with near-perfect accuracy over a wide range of PM2.5 concentration values. The consistently high performance across both training and test data sets not only validates the model’s robust learning, but also confirms its ability to effectively generalize to new scenarios. This consistency is particularly noteworthy because it eliminates concerns about overfitting, a common challenge for machine learning models. The tight clustering of points along the diagonal in both plots further illustrates the model’s precision in capturing the nuances of CMAQ simulations. This visual and statistical evidence reinforces the reliability of the Conditional U-Net as an efficient and accurate surrogate for CMAQ simulations, potentially revolutionizing the speed and scale at which air quality scenarios can be evaluated for policy-making purposes.
Table 2 presents a quantitative evaluation of the performance of the conditional U-Net model, which emulates the CMAQ simulation of PM2.5 concentrations in South Korea in 2019. The accuracy of the model was evaluated using three main metrics: mean absolute error (MAE), normalized mean absolute error (NMAE), and coefficient of determination (). The results showed high accuracy of the conditional U-Net in reproducing CMAQ results, with significantly lower MAE values (training: 0.222 , test: 0.221 ) and NMAE values (training: 1.788%, test: 1.762%). The value of 0.996 for both the training and test sets is particularly impressive, indicating that the conditional U-Net explains 99.6% of the variance in the CMAQ predictions. This near perfect correlation indicates an exceptional level of agreement between the surrogate model and CMAQ.
The consistency of the performance metrics between the training and test sets provides strong evidence that the model effectively learned the underlying patterns without overfitting. Overall, these results confirm the ability of the conditional U-Net to serve as a highly accurate and efficient surrogate model for CMAQ in predicting annual average PM2.5 concentrations across Korea, and may provide important computational advantages for rapid policy scenario evaluation.
3.1.2. Input Contribution Analysis
The effect of input parameters on the output PM2.5 concentration was analyzed using SHAP values to evaluate whether the emulators used in this study accurately reproduce the physical and chemical processes of CMAQ as well as simple emulation performance. First, because our conditional U-Net structure has two major inputs, domestic emissions expressed in terms of emissions of the five precursors and international emissions expressed in terms of activity at the boundary, we evaluated domestic and international impacts on changes in PM2.5 concentrations.
Figure 4 shows the percentage of domestic and international SHAP values for each region. The six regions shown here are the national average, Seoul, Daejeon, Gwangju, Ulsan, and Jeju. In the case of domestic impact assessment, the SHAP values for all input parameters representing domestic precursor emissions were obtained by summing the SHAP values. Figure 4 shows that international influence is greater than or nearly equal to domestic influence in every region. For the national average impact, boundary is rated as more influential, and for the localized results in other inland regions, domestic and boundary are rated similarly. In particular, Jeju Island, located in the southern part of the Korean peninsula far from the mainland, is known to be a particularly foreign-influenced region, with weak influence from land-based precursor emissions and low emission activity of its own, and the emulation model reflects this well [25]. These results are generally consistent with the analysis of factors affecting PM2.5 concentrations in Korea reported in the study by N. Kumar et al. [26] despite differences in the target time period, indicating that the model successfully mimics the scientific process of CMAQ.
The second qualitative assessment examined the nonlinear response between PM2.5 and precursor emissions. Since nonlinear behavior of PM2.5 and its precursors, and , has been reported in previous studies based on simulations and actual measurements [27,28], it is necessary to confirm whether the emulator model we developed behaves in a similar nonlinear manner. Figure 5 presents a comprehensive visualization of the nonlinear response of PM2.5 concentrations to variations in and emission activity ratios over South Korea and five major cities, as in the previous evaluation. The contour maps show different patterns for different regions, highlighting the spatial heterogeneity in PM2.5 formation dynamics. The local trend shows that PM2.5 concentrations generally increase with higher emission ratios of both and , ranging from about 14 to 17 . Seoul shows the highest PM2.5 levels (19-25 ) with strong sensitivity to both precursors, while Daejeon and Gwangju show intermediate levels with a more pronounced response to emissions. Ulsan shows a relatively uniform PM2.5 distribution (13-16 ), and Jeju Island shows significantly lower concentrations (7-9 ) with minimal variation across emission scenarios.
These contour maps underscore the complexity of PM2.5 chemistry and the importance of considering both and emissions in air quality management plans. The observed non-linear responses and regional variations highlight the need for tailored emission control strategies in different areas of South Korea. This detailed analysis provides valuable insights for policy makers and environmental scientists, enabling more targeted and effective approaches to reduce PM2.5 concentrations and improve air quality in different urban and rural areas across the country. Importantly, these results are consistent with trends reported in previous studies, confirming the validity of our findings and reinforcing the established understanding of PM2.5 formation dynamics in relation to precursor emissions in different geographical contexts in South Korea.
3.1.3. Computational Performance
Table 3 presents a comparative analysis of the computational time required for CMAQ simulations and the Conditional U-Net model, highlighting the significant efficiency gains offered by the latter. The CMAQ v4.7 [29] simulation running on one CPU requires approximately 24 hours to complete a single scenario. In stark contrast, the Conditional U-Net demonstrates significantly faster performance in both the training and prediction phases. The Conditional U-Net model was implemented using a custom-developed code based on Tensorflow v2.14 [30], running on Python 3.10.13 within an Ubuntu 22.04 operating system environment, leveraging this powerful software stack to optimize performance and functionality.
During the training phase, the Conditional U-Net processes an epoch in about 10 seconds using a CPU, and this time is further reduced to about 1 second using a GPU, both with a batch size of 256. The most striking efficiency gain is observed in the prediction phase, where the Conditional U-Net can produce results for a single scenario in as little as 10 milliseconds on a CPU and an impressive 1 millisecond on a GPU, with a batch size of 32.
It’s important to note that while the Conditional U-Net offers significant time savings per scenario, it requires initial training on CMAQ simulation data. However, once trained, the model’s ability to generate predictions in milliseconds represents a transformative improvement in computational efficiency compared to the 24-hour runtime of CMAQ simulations. This dramatic reduction in processing time could significantly increase the capacity for rapid scenario analysis and policy evaluation in air quality management.
3.2. Health Impact Assessment
Health benefits were evaluated separately for cardiovascular diseases (CVD) and respiratory diseases (RD), with premature mortality estimated under two boundary conditions: 100% and 50%. Figure 6 illustrates the projected premature mortality due to CVD and RD from 2019 to 2050. Assuming that the predicted PM2.5 concentrations from the 2019 scenario remain constant over time, a continuous increase in premature mortality is observed.
Under the 100% boundary condition, the combined premature mortality for CVD and RD was estimated at 15,934 (95% CI: 10,460-21,855) in 2019, rising to 53,146 (95% CI: 34,216–73,392) by 2050. Under the 50% boundary condition, the combined premature mortality was 11,106 (95% CI: 7,241–15,418) in 2019, increasing to 37,043 (95% CI: 23,679-51,803) by 2050. This represents an approximate 330% increase in premature mortality by 2050 compared to 2019, regardless of the boundary condition.
The substantial rise in premature mortality is largely attributed to the projected growth in the population segments with higher mortality rates, particularly among those aged 65 and older. Specifically, the population in the 65-69 age group is expected to increase by 153%, and the 80+ age group by 434% between 2019 and 2050.
In Figure 7, the projected differences in premature mortality from 2020 to 2050 are compared at five-year intervals, using the scenario with 100% pollutant emissions in 2019 as the baseline. Under scenarios where emissions are reduced to 10% of 2019 levels, premature mortality is projected to remain below the baseline under both the 100% and 50% boundary conditions until 2050. Excluding the 10% emission scenario, premature mortality under the 100% boundary condition surpasses the baseline across all other scenarios starting from 2030. Similarly, under the 50% boundary condition, the 25% emission scenario shows fewer premature deaths compared to the baseline until 2040, after which mortality begins to exceed the baseline. These findings indicate that reducing current emission levels by 10-25% is necessary to counteract the effects of population aging and maintain current premature mortality rates.
PM2.5 reduction strategies are typically developed with five-year targets. Figure 8 outlines the required reduction targets for each region from 2025 to 2050, segmented into five-year intervals, to prevent an increase in premature mortality due to an aging population. To maintain baseline levels of premature mortality from 2019 to 2025, a reduction of 22-42%, averaging 31%, is necessary across 17 provinces. If the 2025 reduction target is met, an additional reduction of 11-35%, averaging 22%, will be required from 2025 to 2030. Similar reductions are needed for the subsequent periods: 24% from 2030 to 2035, 26% from 2035 to 2040, 19% from 2040 to 2045, and 11% from 2045 to 2050. These five-year reduction percentages are consistent under both the 100% and 50% boundary conditions.
4. Discussion and Conclusions
- Development of a CMAQ Emulator Using a Conditional U-Net
In this study, we developed an emulation model that accurately and rapidly simulates the physicochemical processes of CMAQ using deep learning techniques with a conditional U-Net architecture. We also established and validated a series of pipelines that leverage this emulation model for health impact assessments and policy-making applications related to PM2.5 precursor emissions. While CMAQ is one of the most reliable and widely used air pollution simulation tools, it requires extensive background knowledge and suffers from limitations due to its long computational times. These limitations hinder the assessment of air pollution across multiple scenarios and the formulation of effective policies for mitigating respiratory and other health impacts associated with air pollution. The emulation methodology presented here addresses these challenges by linking CMAQ with health impact assessments, thereby facilitating simpler, faster, and more accurate air quality evaluations. This advancement supports more efficient policy-making and enhances the ability to assess health impacts and develop strategies to improve public health outcomes.
For the emulation model that predicts the annual average PM2.5 concentration in Korea for a given precursor emission activity, the PM2.5 concentration calculated from the simulation of CMAQ using the emissions, climate, and weather conditions of 2019 as the baseline for this study was used as training data, and a deep learning model with a conditional U-Net structure specialized in calculating the annual average pollutant concentration described in the text was employed. The emulation model predicts the annual average PM2.5 concentration with an MAE of 0.221 , NMAE of 1.762%, and of 0.996 based on the test data. Also, as shown in Table 3, for the trained model predicting a scenario, based on the machine we used, we were able to perform high-speed computations on the order of 10ms using CPU and 1ms using GPU, which is a significant improvement considering the time required to precalculate the data needed for training with CMAQ. These results demonstrate that the emulation model and methodology we developed significantly contribute to overcoming the limitations of CMAQ and are well suited for the applications presented in this study.
Additional contribution analyses performed using SHAP values to increase the reliability of the emulation model, as well as an analysis of the relationship between input and output values, also show that the methodology does a good job of simulating the physicochemical computational processes behind CMAQ and their associated properties, giving policy makers more confidence in using the methodology we have developed. It is important to note that the SHAP value analysis is qualitative rather than quantitative. The conditional U-Net model uniquely accommodates both domestic precursor emissions and transboundary emissions as inputs, enabling the evaluation of their combined effects on the model’s annual PM2.5 concentration output. Figure 4 illustrates the impacts of domestic and boundary emissions on annual PM2.5 concentrations for both national and provincial averages. The evaluated domestic and boundary influences align well with findings from previous studies, validating that the emulation model’s computational processes are consistent with those observed in previous simulations and CMAQ results. Furthermore, the emulation model accurately reflects the nonlinear relationship between PM2.5 and precursor emissions. Figure 5 highlights the nonlinear interactions between and emissions and PM2.5 concentrations, which corroborates the nonlinear behavior reported in previous research. This validation supports the use of the conditional U-Net as an effective emulation model.
- Health Impact Assessment and Policy Implications
The health impact assessment results, made possible by CMAQ’s rapid simulation of annual PM2.5 concentrations, highlight the critical role of emission reductions in reducing premature mortality in South Korea. While premature deaths are expected to increase significantly from 2019 to 2050 due to an aging population, reducing emissions by 10 to 25% from current levels could counteract this increase. The study recommends an average reduction of 31% by 2025, followed by further reductions of 11% to 26% every five years until 2050. This innovative approach allows for the rapid and accurate evaluation of multiple emissions scenarios, providing policymakers with a powerful tool for real-time decision making. By integrating rapid CMAQ emulation with comprehensive health impact assessments, the methodology significantly advances environmental health research and policy planning. It also benefits society by facilitating more informed, timely, and effective air quality management strategies, potentially saving thousands of lives and improving the quality of life for millions. This multidisciplinary approach can be applied to air quality challenges around the world and represents a major step forward in the integration of environmental science, public health, and policy making.
- Limitations and Future Research
This study presents a novel approach to evaluating the health impacts of PM2.5 by quantitatively assessing the influence of population aging on premature mortality. Unlike previous studies that may have overlooked demographic changes, this research explicitly accounts for the projected shifts in population structure, particularly the increasing proportion of elderly individuals, and its implications for public health. The findings underscore the critical role of demographic factors in amplifying the adverse health effects of air pollution. Notably, our analysis reveals that without substantial emission reductions, the combined effect of aging and air pollution will lead to a significant increase in premature mortality. To counter this, we have proposed specific emission reduction targets, ranging from 10% to 25% of current levels, necessary to stabilize or reduce premature mortality rates over the next three decades. This study is the first to establish emission reduction goals that directly address the compounded risk posed by both air pollution and an aging population, providing essential insights for policymakers aiming to mitigate the future health burden of PM2.5 in an aging society. These findings emphasize the need for integrated strategies that consider both environmental and demographic changes in public health planning.
- Overall Summary and Conclusion
This study introduces a novel methodology that bridges the gap between complex air quality modeling and practical policy evaluation. We developed a high-speed surrogate model based on a conditional U-Net architecture to predict PM2.5 concentrations and integrated it with the BenMAP health impact assessment tool to evaluate health impacts efficiently. The surrogate model, trained using annual PM2.5 data from South Korea, demonstrated impressive performance with an MAE of 0.221 , NMAE of 1.762%, and an of 0.996, significantly reducing computational time compared to traditional CMAQ simulations. This model allows rapid predictions and assessments of health impacts under various emission scenarios.
Furthermore, this research established a method for predicting the number of premature deaths reflecting population aging levels, and developed a technique to calculate the additional emission reductions needed to offset the health impacts of increased premature mortality due to aging. However, the study’s scope is limited to PM2.5, and future research should extend this approach to other pollutants such as , , and . Developing models to predict various metrics like daily averages and incorporating advanced dose-response models that consider age-specific sensitivities and threshold values will offer a more comprehensive evaluation of health impacts. Addressing these areas will enhance air quality management and public health protection, providing more robust tools for policymakers.
Author Contributions
YH.L. conceived the study, developed the methodology, performed formal analysis, wrote the original draft, and created the visualizations. JH.P. contributed to the methodology, conducted formal analysis, and reviewed and edited the manuscript. JS.K. developed the software, collected resources, and performed validation. JH.W. conducted the investigation, collected resources, and administered the project. JH.L. performed formal analysis, reviewed and edited the manuscript, and supervised the study.
Data Availability Statement
The data and source code that support the findings of this study are available from the corresponding authors upon reasonable request.
Acknowledgments
This research was supported by the Environmental Technology Development Project (R&D) for the New Climate Regime and Development of a global integrated assessment modelling system for climate-air pollutants management focused on Northeast Asia projects of the Korea Institute of Environment and Industrial Technology. (Ministry of Environment R&D project number: RS-2022-KE002096).
Conflicts of Interest
The authors declare no competing interests.
References
- National Assembly Budget Office. Analysis of Air Quality and Budget Allocation in South Korea, 2019. Accessed on 2024/08/23.
- Special Act On The Reduction And Management Of Fine Dust Act of 2018. §33491, 2018. Accessed on 2024/08/23.
- US EPA Office of Research and Development. CMAQ: The Community Multiscale Air Quality Modeling System, 2022. [CrossRef]
- Xing, J.; Wang, S.X.; Jang, C.; Zhu, Y.; Hao, J.M. Nonlinear response of ozone to precursor emission changes in China: a modeling study using response surface methodology. Atmospheric Chemistry and Physics 2011, 11, 5027–5044. [Google Scholar] [CrossRef]
- Wang, S.; Xing, J.; Jang, C.; Zhu, Y.; Fu, J.S.; Hao, J. Impact Assessment of Ammonia Emissions on Inorganic Aerosols in East China Using Response Surface Modeling Technique. Environmental Science & Technology 2011, 45, 9293–9300. [Google Scholar] [CrossRef]
- Xing, J.; Ding, D.; Wang, S.; Zhao, B.; Jang, C.; Wu, W.; Zhang, F.; Zhu, Y.; Hao, J. Quantification of the enhanced effectiveness of NOx control from simultaneous reductions of VOC and NH3 for reducing air pollution in the Beijing–Tianjin–Hebei region, China. Atmospheric Chemistry and Physics 2018, 18, 7799–7814. [Google Scholar] [CrossRef]
- Xing, J.; Zheng, S.; Ding, D.; Kelly, J.T.; Wang, S.; Li, S.; Qin, T.; Ma, M.; Dong, Z.; Jang, C.; et al. Deep Learning for Prediction of the Air Quality Response to Emission Changes. Environmental Science & Technology 2020, 54, 8589–8600. [Google Scholar] [CrossRef]
- Xu, J.Z.; Zhang, H.R.; Cheng, Z.; Liu, J.Y.; Xu, Y.Y.; Wang, Y.C. Approximating Three-Dimensional (3-D) Transport of Atmospheric Pollutants via Deep Learning. Earth and Space Science 2022, 9, e2022EA002338. [Google Scholar] [CrossRef]
- Salman, A.K.; Choi, Y.; Park, J.; Mousavinezhad, S.; Payami, M.; Momeni, M.; Ghahremanloo, M. Deep learning based emulator for simulating CMAQ surface NO2 levels over the CONUS. Atmospheric Environment 2024, 316, 120192. [Google Scholar] [CrossRef]
- Sacks, J.D.; Lloyd, J.M.; Zhu, Y.; Anderton, J.; Jang, C.J.; Hubbell, B.; Fann, N. The Environmental Benefits Mapping and Analysis Program - Community Edition (BenMAP-CE): A tool to estimate the health and economic benefits of reducing air pollution. Environ Model Softw 2018, 104, 118–129. [Google Scholar] [CrossRef]
- Sacks, J.; Coffman, E.; Rappold, A.G.; Anderton, J.; Amend, M.; Baker, K.; Fann, N. A Proof-Of-Concept Approach for Quantifying Multipollutant Health Impacts Using Joint Effects Models within the Open-Source BenMAP-CE Software Program. ISEE Conference Abstracts 2018, 2018, https. [Google Scholar] [CrossRef]
- Ho, J.; Jain, A.; Abbeel, P. Denoising Diffusion Probabilistic Models. CoRR 2020, abs/2006.11239, [2006.11239].
- Rombach, R.; Blattmann, A.; Lorenz, D.; Esser, P.; Ommer, B. High-Resolution Image Synthesis with Latent Diffusion Models. CoRR 2021, abs/2112.10752, [2112.10752].
- Ministry of the Interior and Safety, Korea. Ministry of Land, Infrastructure, and Transport Continental Map, 2017, [https://www.data.go.kr/data/15056910/openapi.do]. Accessed: 2024-04-30.
- Lundberg, S.; Lee, S.I. A Unified Approach to Interpreting Model Predictions. arXiv 2017, arXiv:cs.AI/1705.07874]. [Google Scholar]
- Vega García, M.; Aznarte, J.L. Shapley additive explanations for NO2 forecasting. Ecological Informatics 2020, 56, 101039. [Google Scholar] [CrossRef]
- Stirnberg, R.; Cermak, J.; Kotthaus, S.; Haeffelin, M.; Andersen, H.; Fuchs, J.; Kim, M.; Petit, J.E.; Favez, O. Meteorology-driven variability of air pollution (PM1) revealed with explainable machine learning. Atmospheric Chemistry and Physics 2021, 21, 3919–3948. [Google Scholar] [CrossRef]
- Li, X.; Wu, C.; Meadows, M.E.; Zhang, Z.; Lin, X.; Zhang, Z.; Chi, Y.; Feng, M.; Li, E.; Hu, Y. Factors Underlying Spatiotemporal Variations in Atmospheric PM2.5 Concentrations in Zhejiang Province, China. Remote Sensing 2021, 13. [Google Scholar] [CrossRef]
- Li, T.; Zhang, Q.; Peng, Y.; Guan, X.; Li, L.; Mu, J.; Wang, X.; Yin, X.; Wang, Q. Contributions of various driving factors to air pollution events: Interpretability analysis from Machine learning perspective. Environment International 2023, 173, 107861. [Google Scholar] [CrossRef] [PubMed]
- Wu, C.D.; Zhu, J.J.; Hsu, C.Y.; Shie, R.H. Quantifying source contributions to ambient NH3 using Geo-AI with time lag and parcel tracking functions. Environment International 2024, 185, 108520. [Google Scholar] [CrossRef] [PubMed]
- Statistics Korea. Population Projections for Korea, Projected Population by Age(Province). https://kosis.kr/statHtml/statHtml.do?orgId=101&tblId=DT_1BPB001&conn_path=I2, 2024. Accessed 2024-08-12.
- Statistics Korea. Causes of Death Statistics, Deaths and Death rates by cause(104 item), sex, and age(five-year age): province. https://kosis.kr/statHtml/statHtml.do?orgId=101&tblId=DT_1B34E11&conn_path=I2, 2022. Accessed 2024-08-12.
- Hoek, G.; Krishnan, R.M.; Beelen, R.; Peters, A.; Ostro, B.; Brunekreef, B.; Kaufman, J.D. Long-term air pollution exposure and cardio- respiratory mortality: a review. Environmental health 2013, 12, 43. [Google Scholar] [CrossRef]
- WHO. AirQ+: software tool for health risk assessment of air pollution. [accessed 2018 Oct 02] http:// www.euro.who.int/en/health-topics/environment-and-health/air-quality/activities/airq-software-tool-for-health- risk-assessment-of-air-pollution 2018.
- Baek, J.Y. Contributions of domestic and foreign emissions to high PM2.5 concentrations in urban and background areas in Korea. Jeju National University, /: thesis, [https, 2020. [Google Scholar]
- Kumar, N.; Johnson, J.; Yarwood, G.; Woo, J.H.; Kim, Y.; Park, R.J.; Jeong, J.I.; Kang, S.; Chun, S.; Knipping, E. Contributions of domestic sources to PM2.5 in South Korea. Atmospheric Environment 2022, 287, 119273. [Google Scholar] [CrossRef]
- Thunis, P.; Clappier, A.; Beekmann, M.; Putaud, J.P.; Cuvelier, C.; Madrazo, J.; de Meij, A. Non-linear response of PM2.5 to changes in NOx and NH3 emissions in the Po basin (Italy): consequences for air quality plans. Atmospheric Chemistry and Physics 2021, 21, 9309–9327. [Google Scholar] [CrossRef]
- Kelly, J.T.; Jang, C.; Zhu, Y.; Long, S.; Xing, J.; Wang, S.; Murphy, B.N.; Pye, H.O.T. Predicting the Nonlinear Response of PM2.5 and Ozone to Precursor Emission Changes with a Response Surface Model. Atmosphere 2021, 12. [Google Scholar] [CrossRef] [PubMed]
- US EPA Office of Research and Development. CMAQv4.7.1, 2017. [CrossRef]
- Abadi, M.; Agarwal, A.; Barham, P.; Brevdo, E.; Chen, Z.; Citro, C.; Corrado, G.S.; Davis, A.; Dean, J.; Devin, M.; et al. TensorFlow: Large-Scale Machine Learning on Heterogeneous Systems, 2015. Software available from tensorflow.org.
Figure 2.
Schematic diagram of conditional U-Net architecture used in this study. Each parameters listed next to each block in the figure represent the block dimensions set in this study, and these are hyperparameters that can be changed as appropriate depending on the target region, other parameters to be entered, and the number of data used in the study.
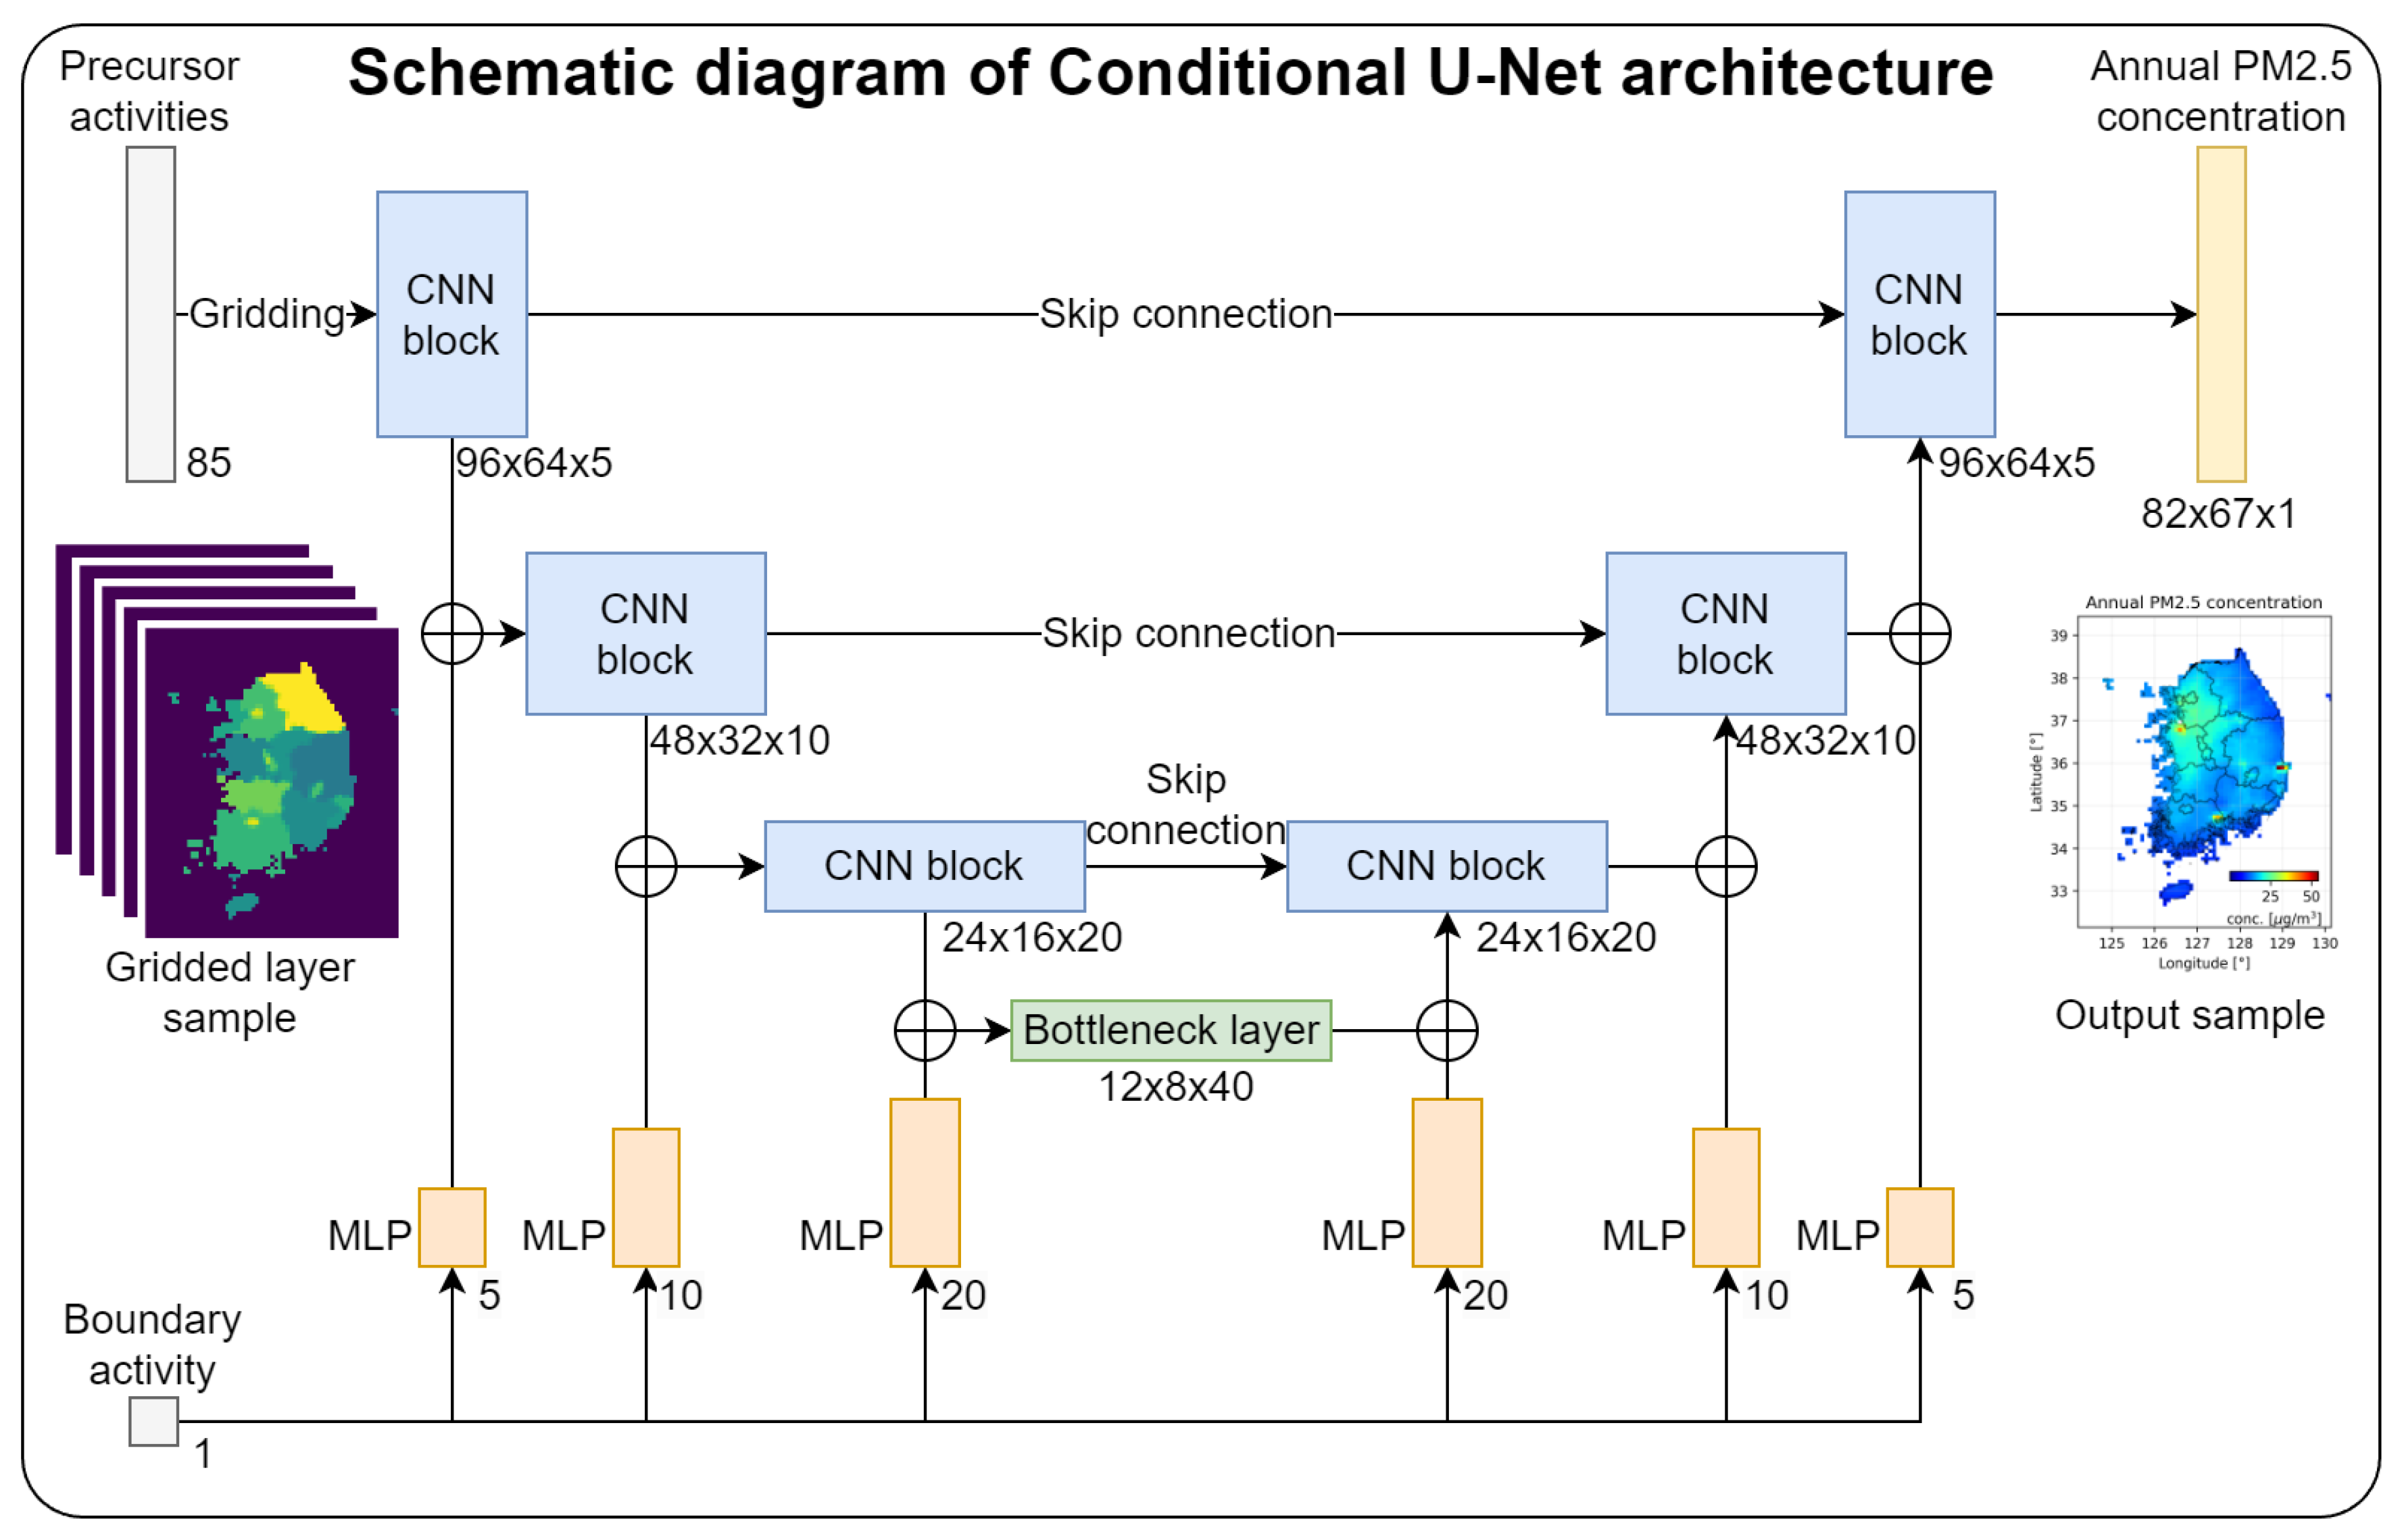
Figure 3.
Scatter plots for emulation performance evaluation. left: plot for training data, right: plot for test data. The left plot is for the training data and the right plot is for the test data. Also, both the training and test data show the same performance, indicating that no overfitting has occurred.
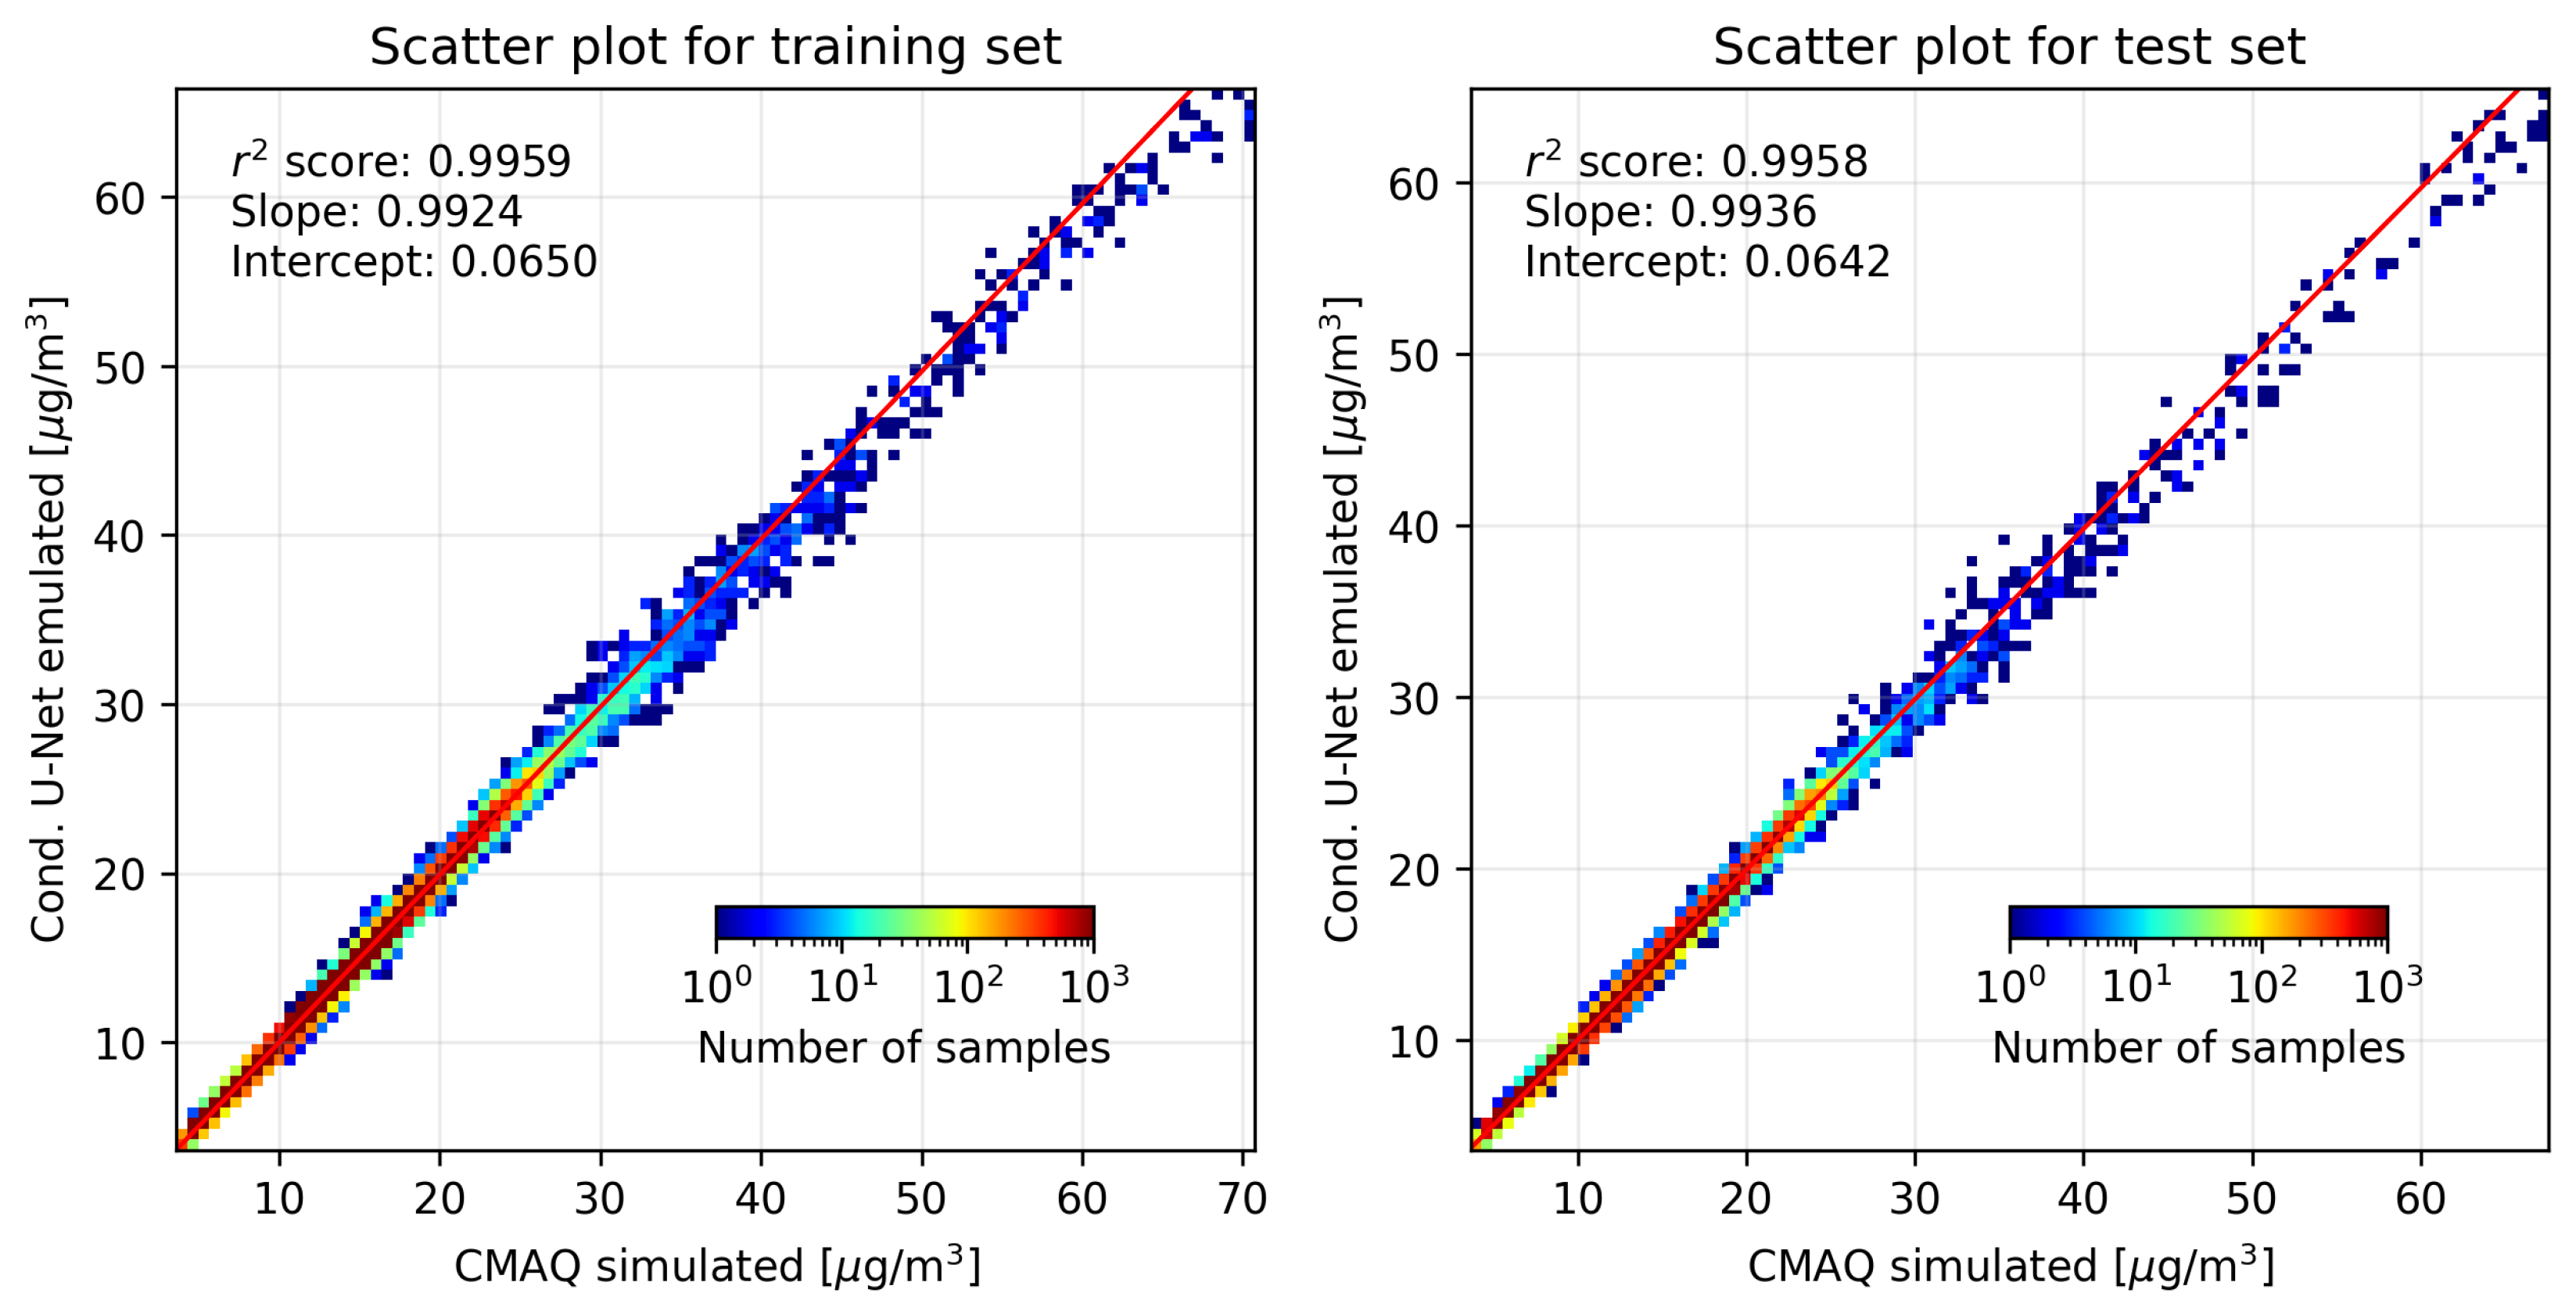
Figure 4.
Results of the graphical representation of the contribution of input variables to the concentration of PM2.5 in two categories, national and international, using SHAP values. The results show that the impact of precursor emissions from outside the country is equal to or greater than the domestic impact, indicating that the simulation results and the actual situation on the Korean peninsula are properly mimicked. From left to right at the top, the results for the whole country, Seoul, Daejeon, Gwangju, Ulsan, and Jeju Island are shown.
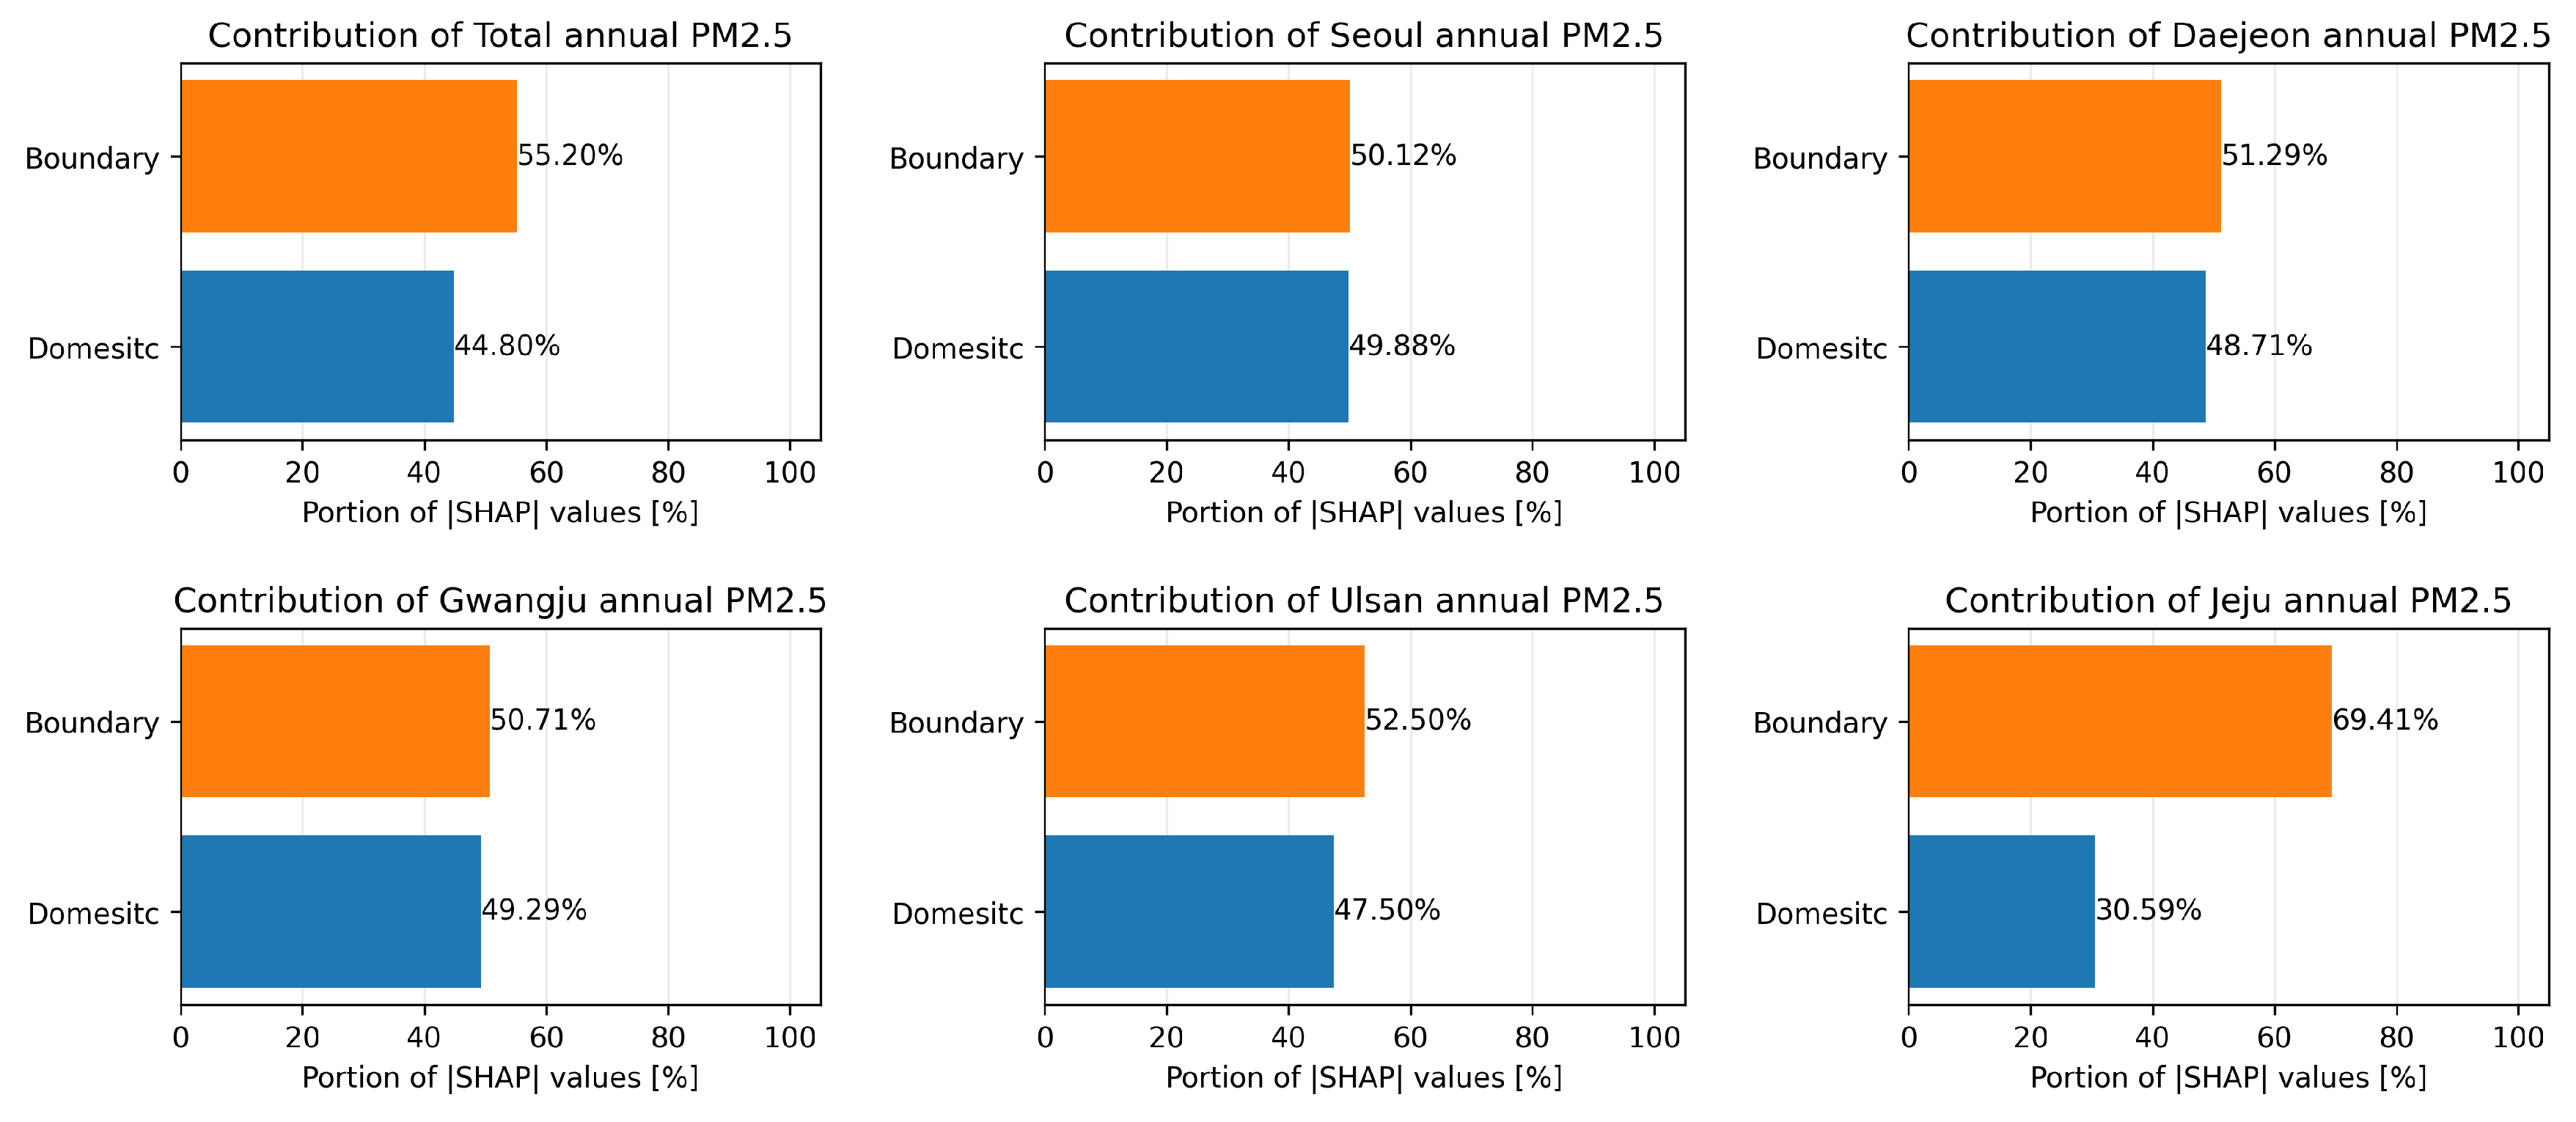
Figure 5.
Contour map showing the non-linear response of PM2.5 to NH3 and NOx emissions, showing, from top left, the response of PM2.5 concentrations for the entire country, Seoul, Daejeon, Gwangju, Ulsan, and Jeju Island.
Figure 5.
Contour map showing the non-linear response of PM2.5 to NH3 and NOx emissions, showing, from top left, the response of PM2.5 concentrations for the entire country, Seoul, Daejeon, Gwangju, Ulsan, and Jeju Island.
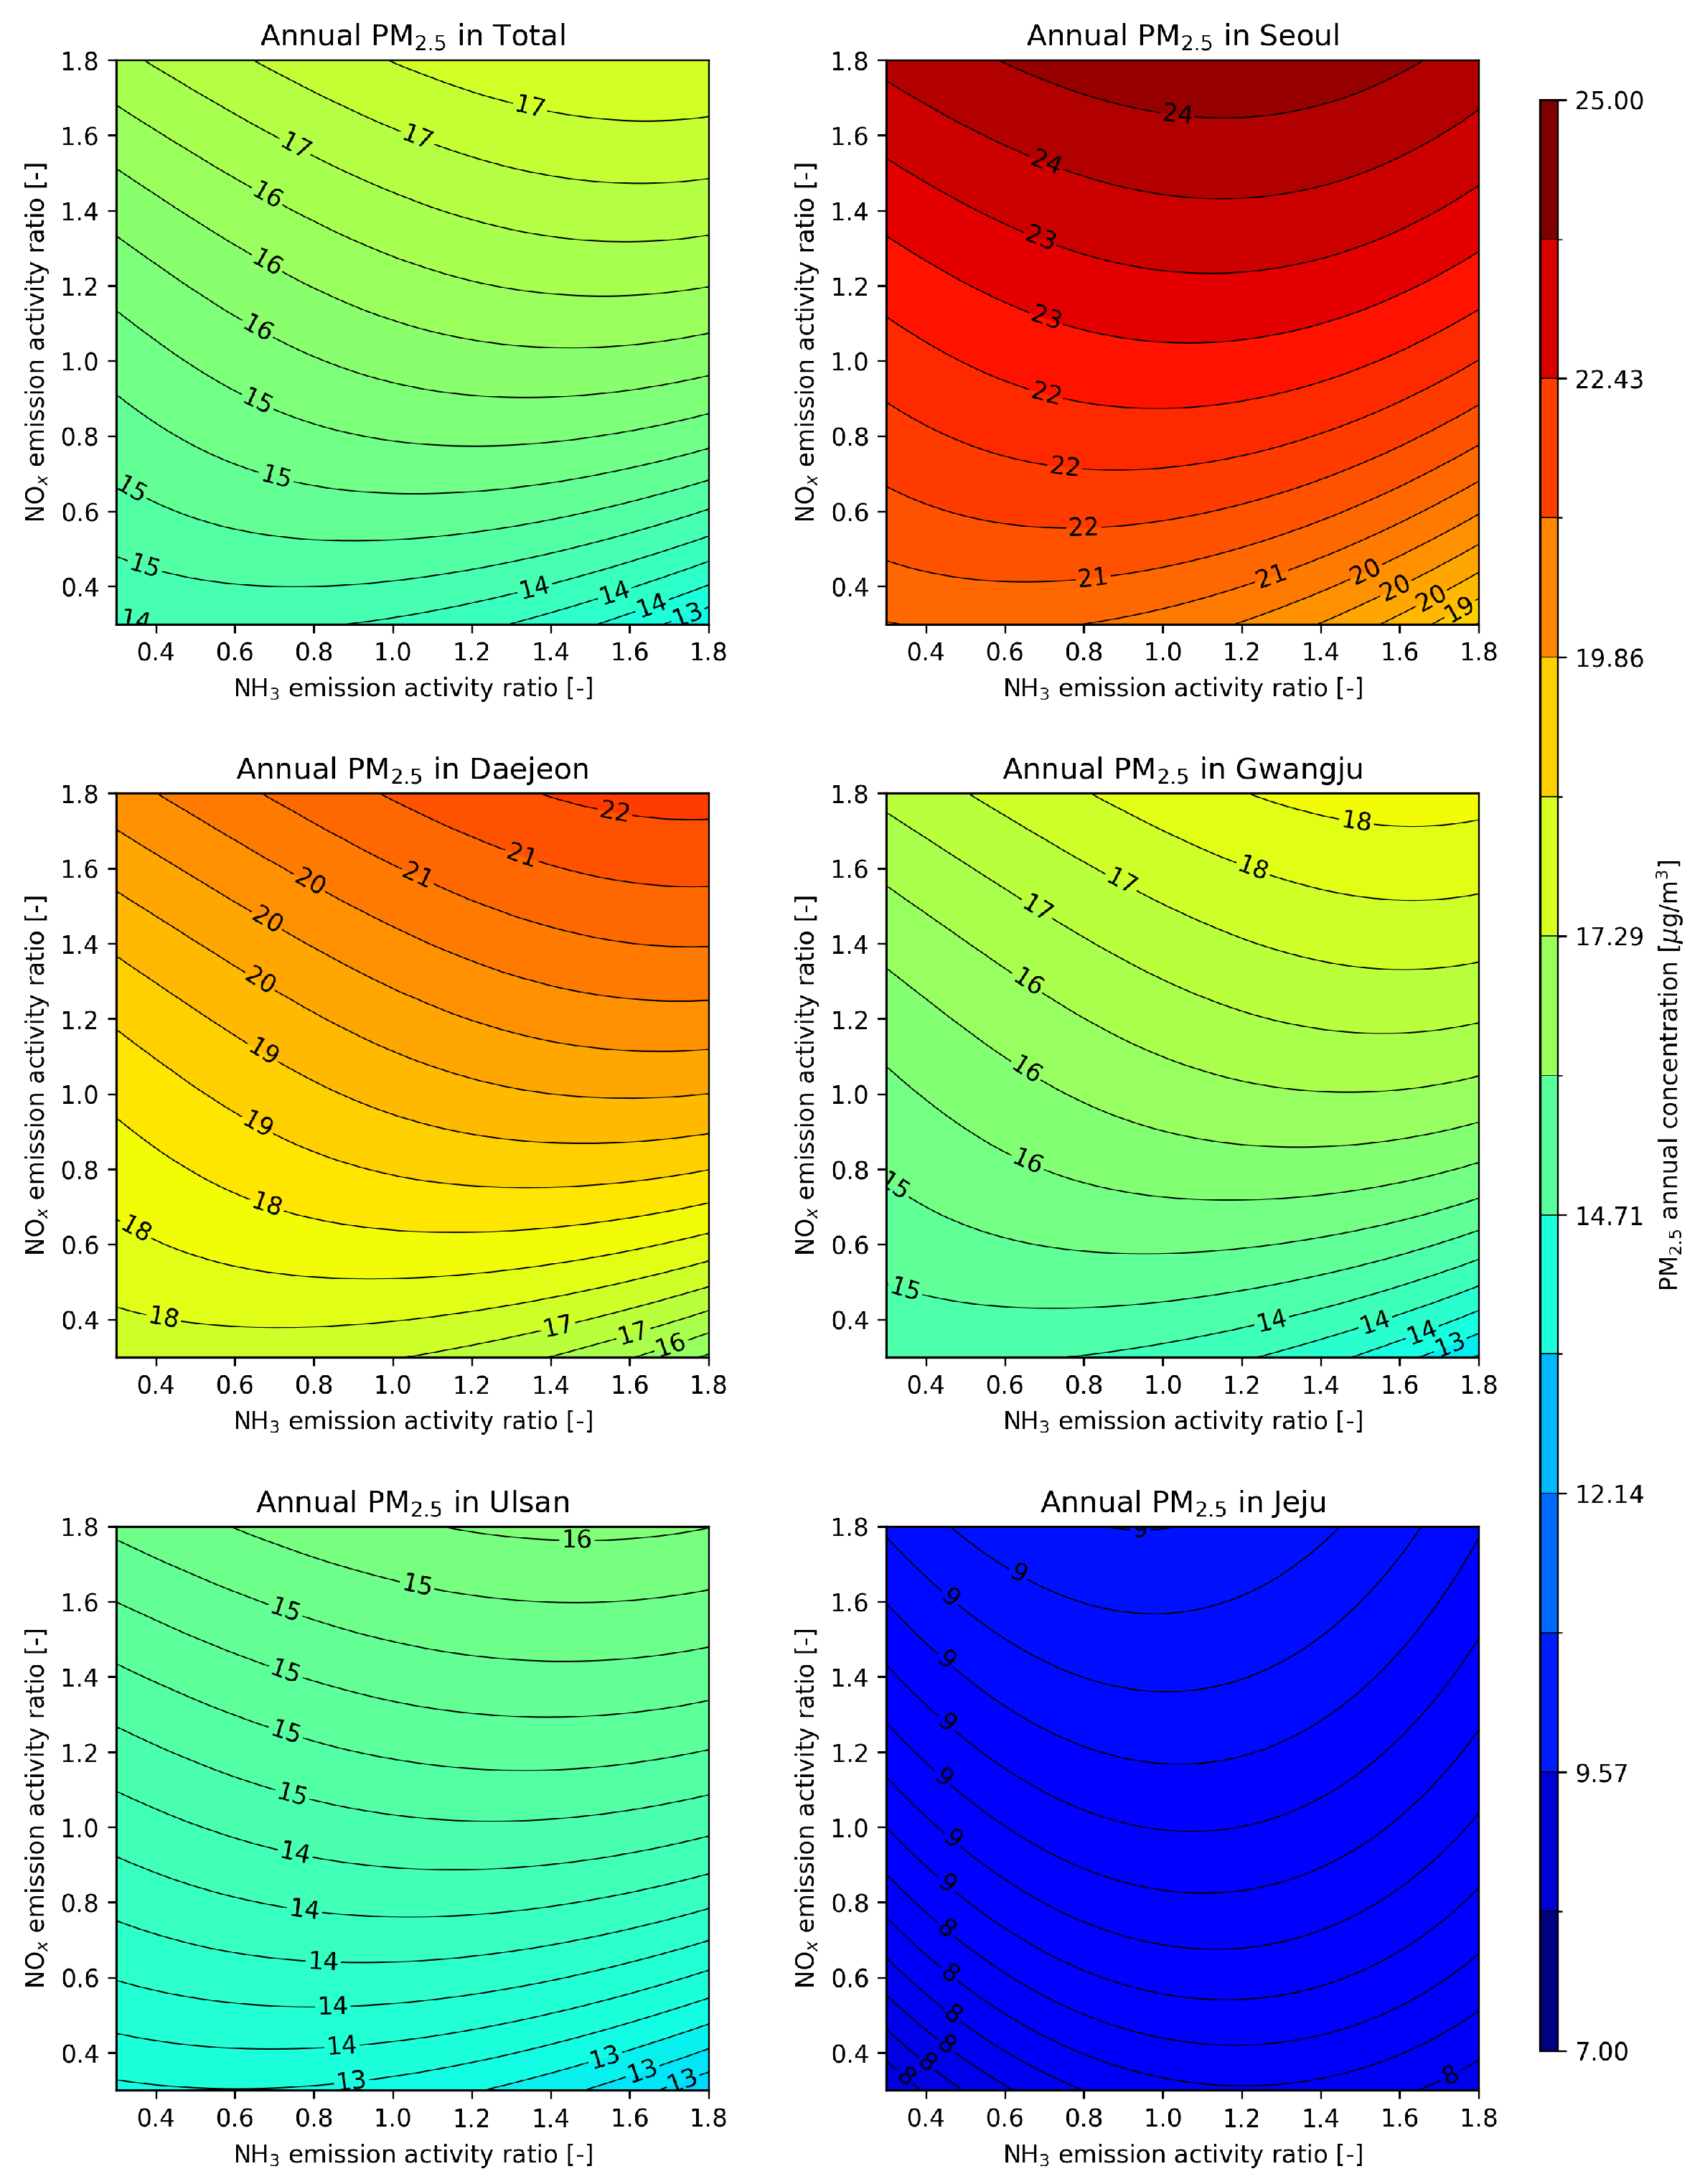
Figure 6.
Annual premature mortality due to various diseases and total diseases (cardiovascular diseases + respiratory diseases) based on PM2.5 concentrations. Panel (a) illustrates the results under a boundary condition of 100%, while panel (b) shows the results under a boundary condition of 50%. Scenarios were applied where precursor emissions were reduced from 100% to 10%. Premature mortality for the entire population of South Korea was calculated annually from 2019 to 2050.
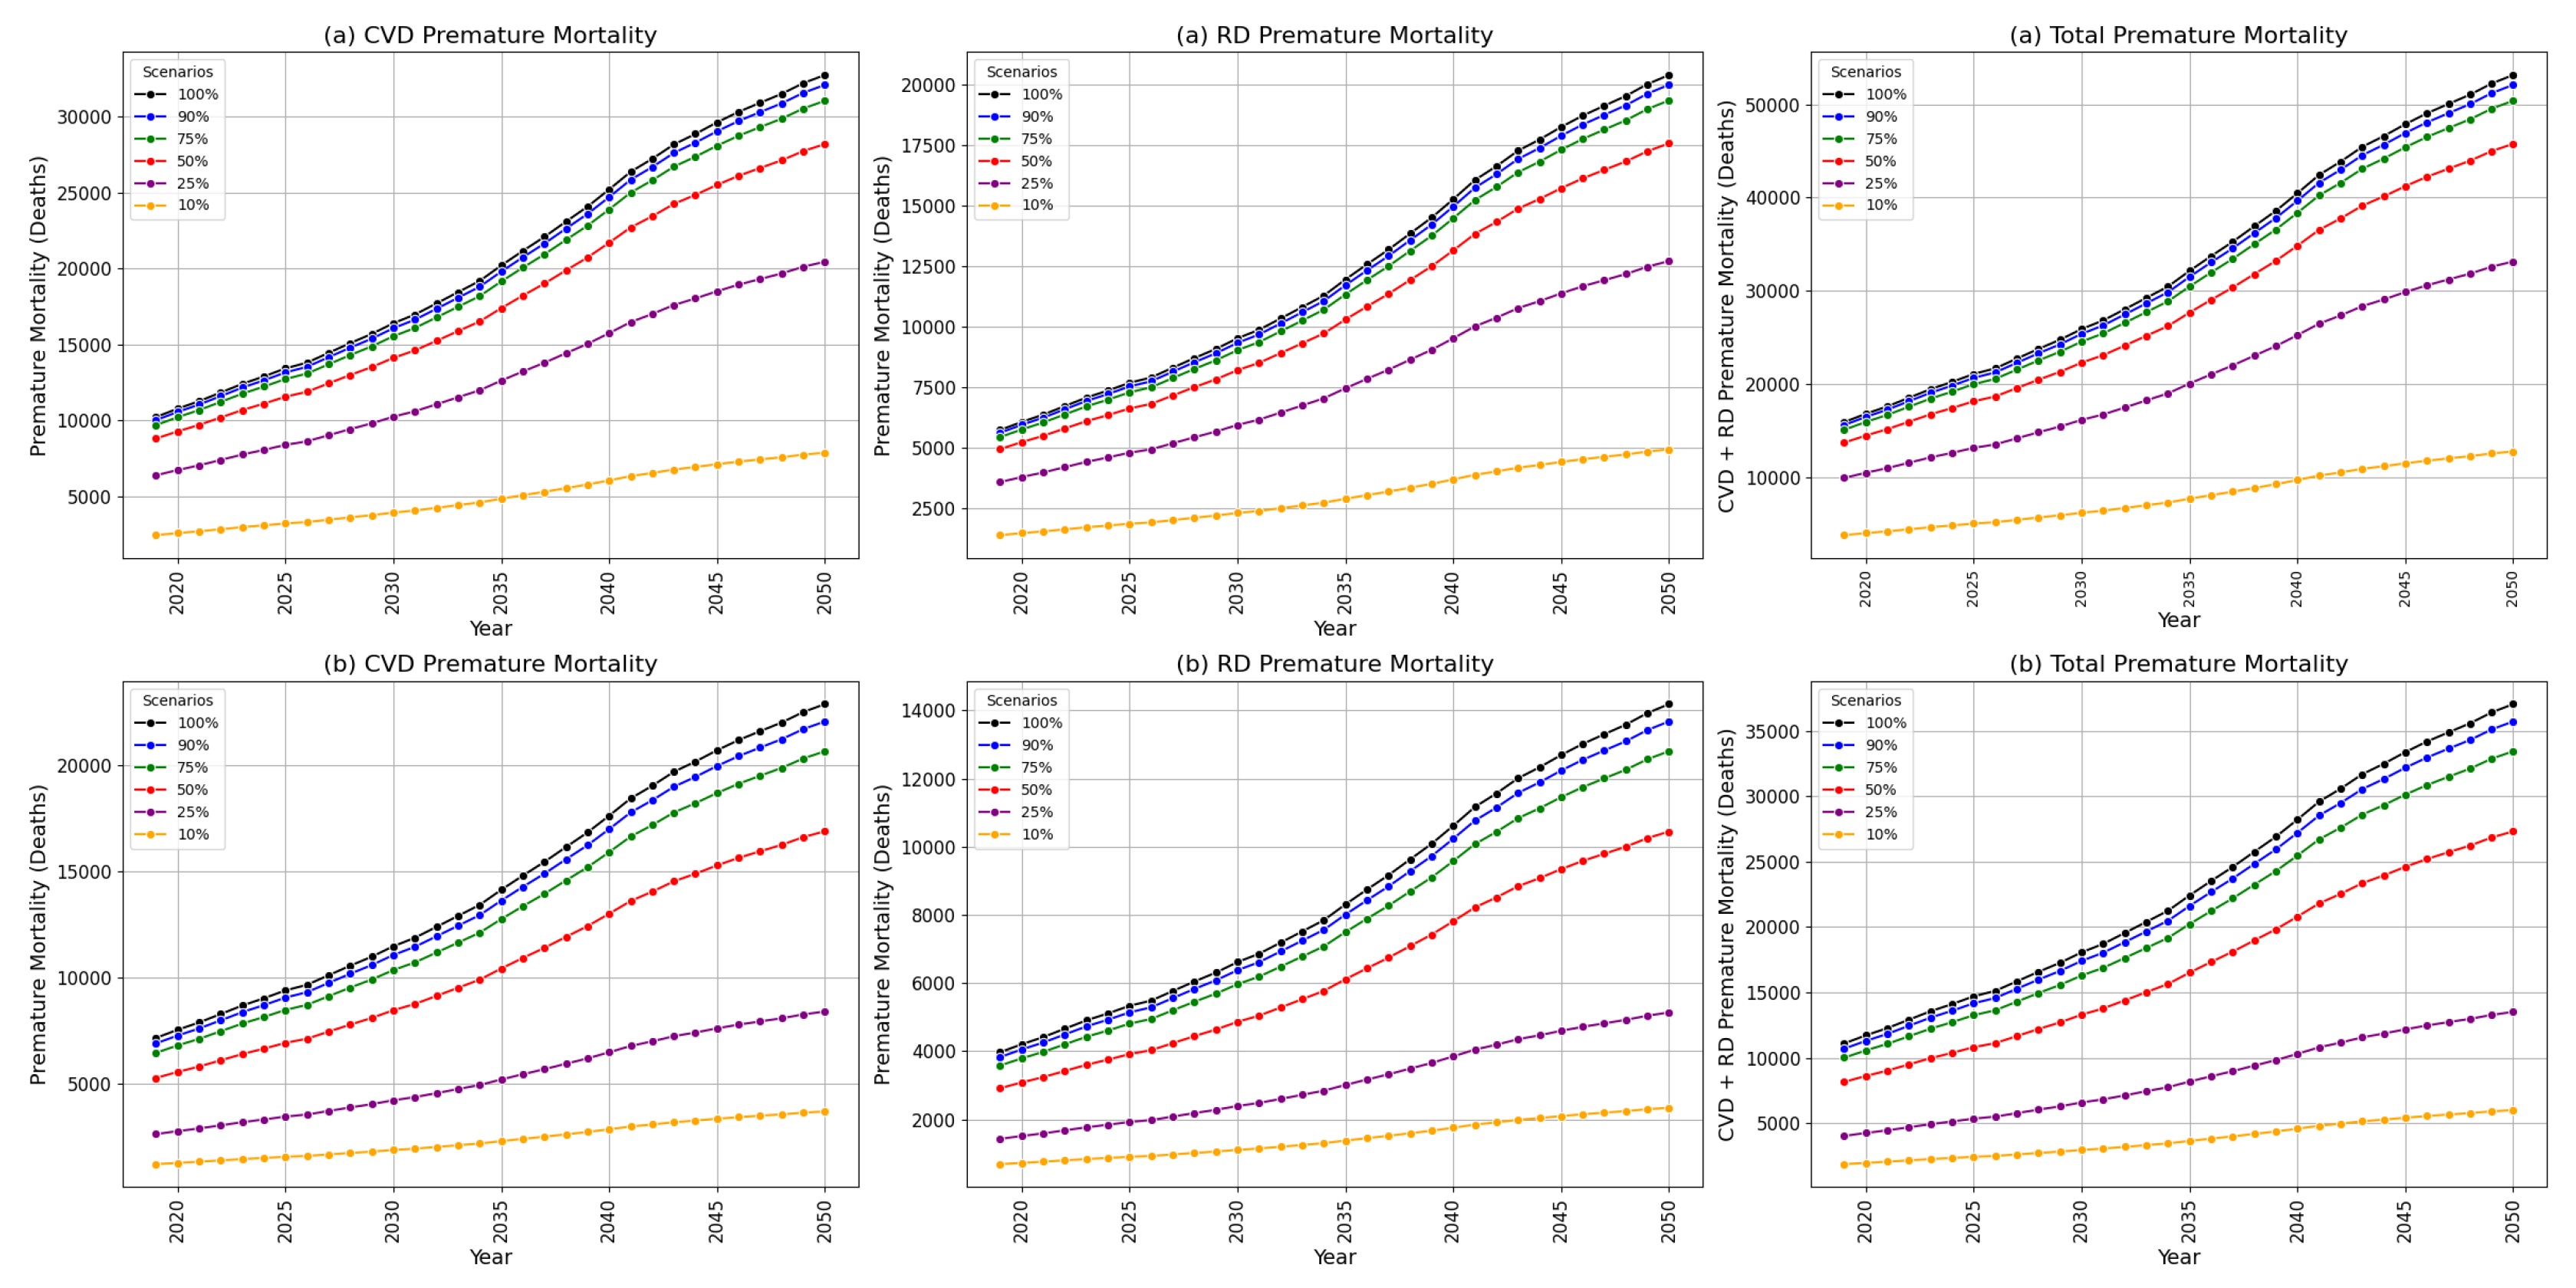
Figure 7.
Differences in premature mortality relative to 2019 under scenarios of precursor emissions at 100%. Panel (a) shows results with a boundary condition of 100%, while Panel (b) shows results with a boundary condition of 50%. The scenarios applied involve reductions in precursor emissions from 100% to 10%. The differences in premature mortality for the entire population of South Korea from 2020 to 2050, calculated in 5-year intervals, are shown relative to premature mortality at 100% precursor emissions in 2019.
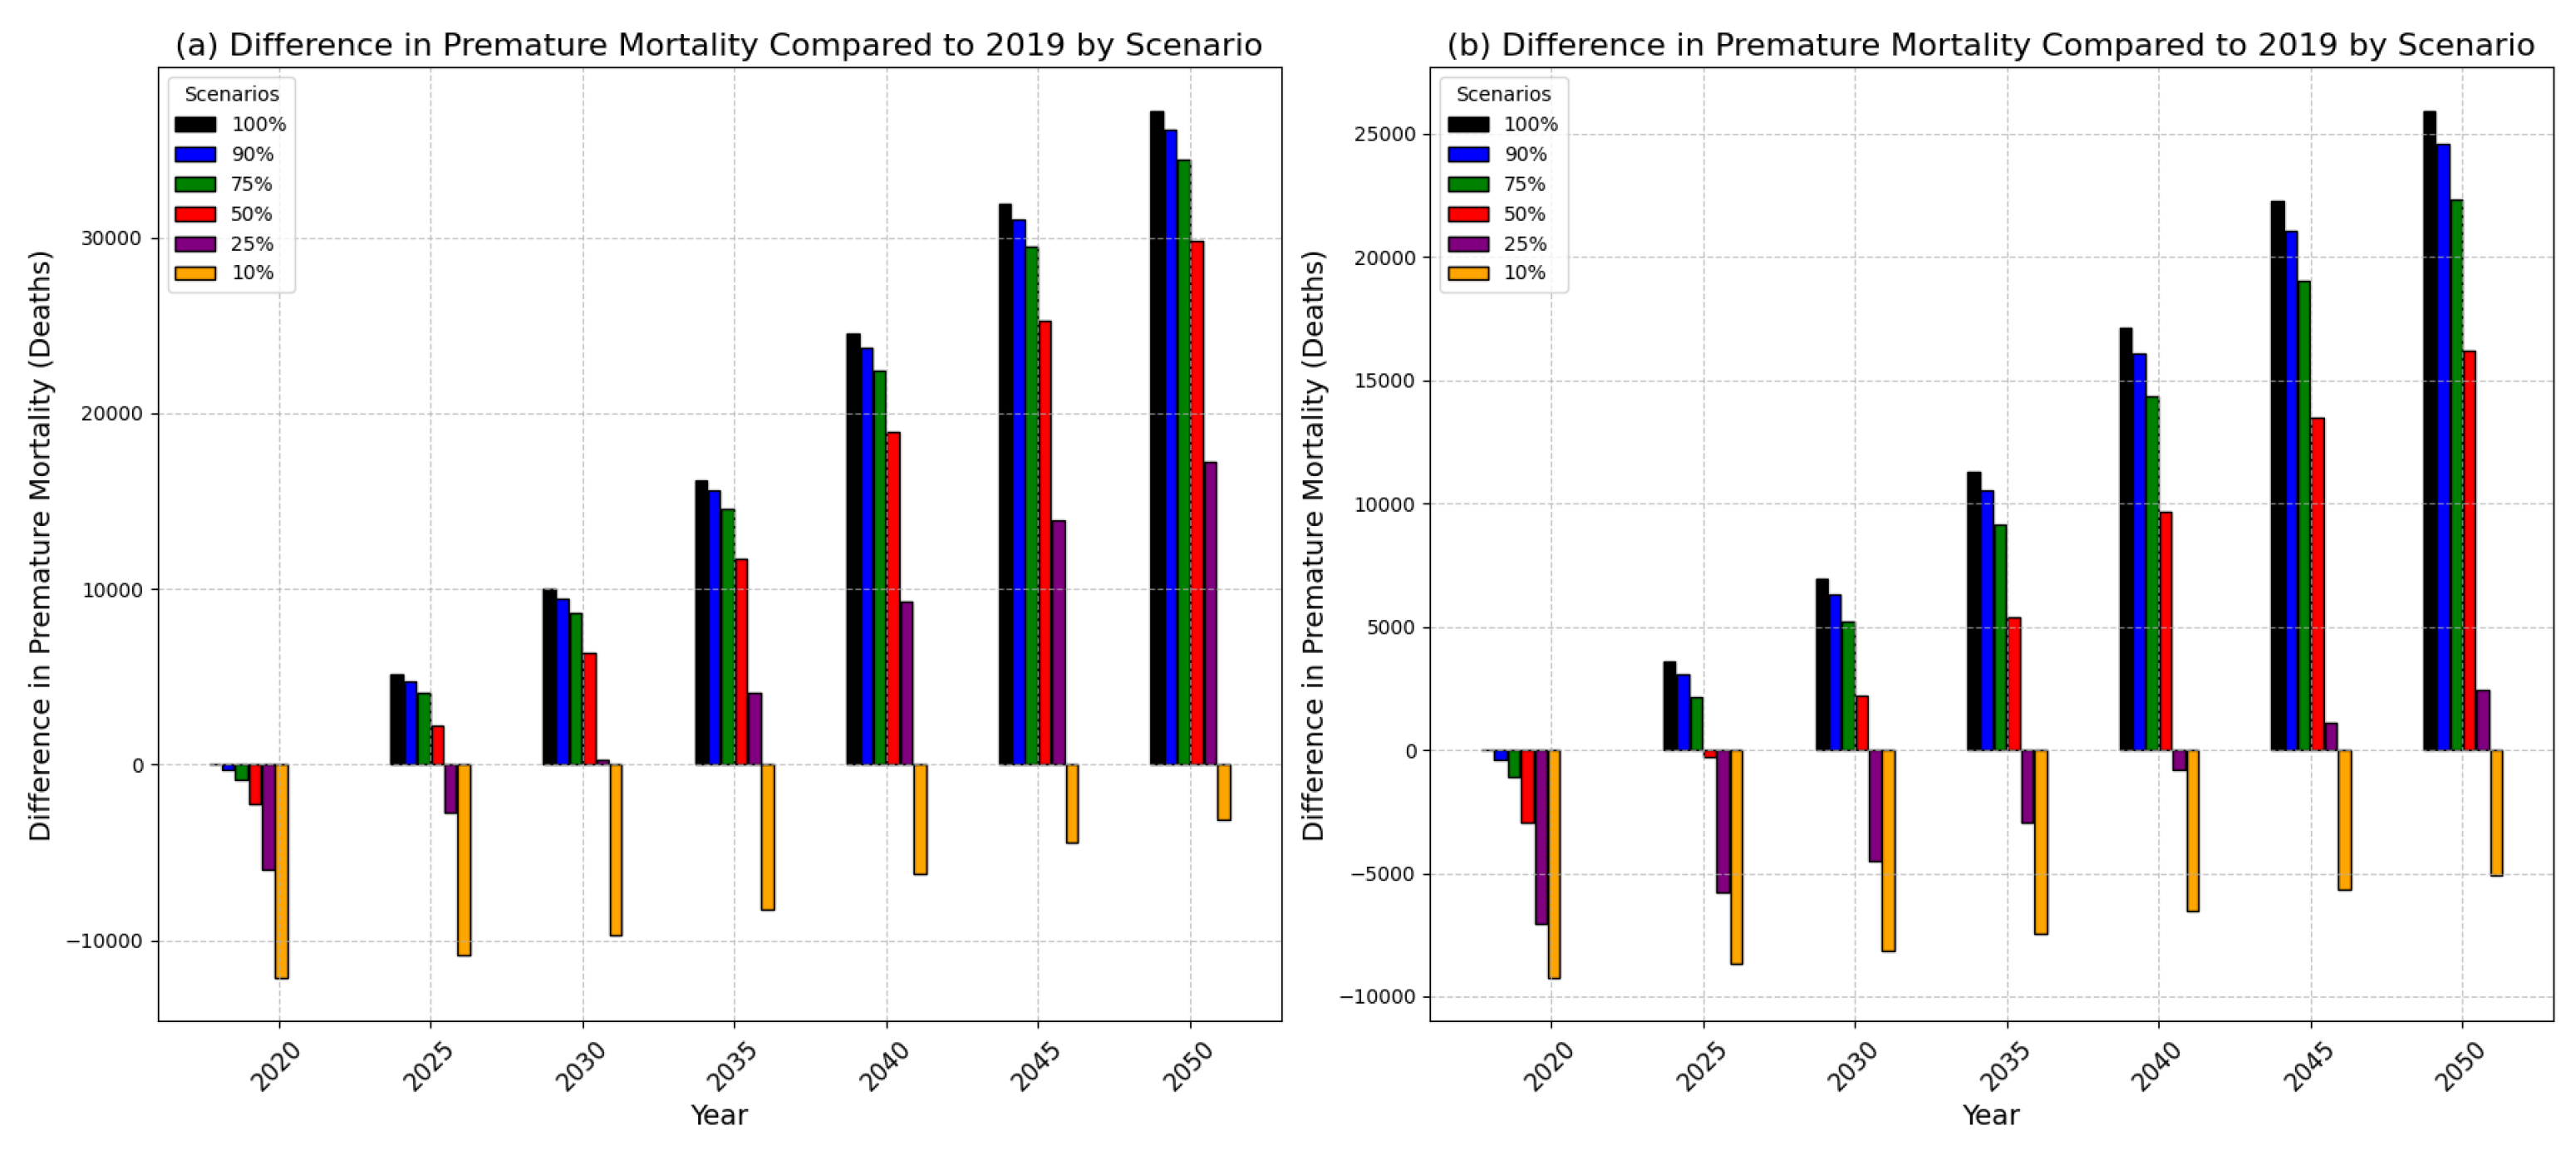
Figure 8.
Reduction percentages of precursor emissions across 17 provinces over five-year intervals to sustain premature mortality rates in 2019. The x-axis represents the average reduction percentages across the 17 provinces. The y-axis denotes the percentage reduction in precursor emissions required from the start year to the end year, based on the emission levels at the start year. This assumes that the emission reduction targets for the previous year were achieved.
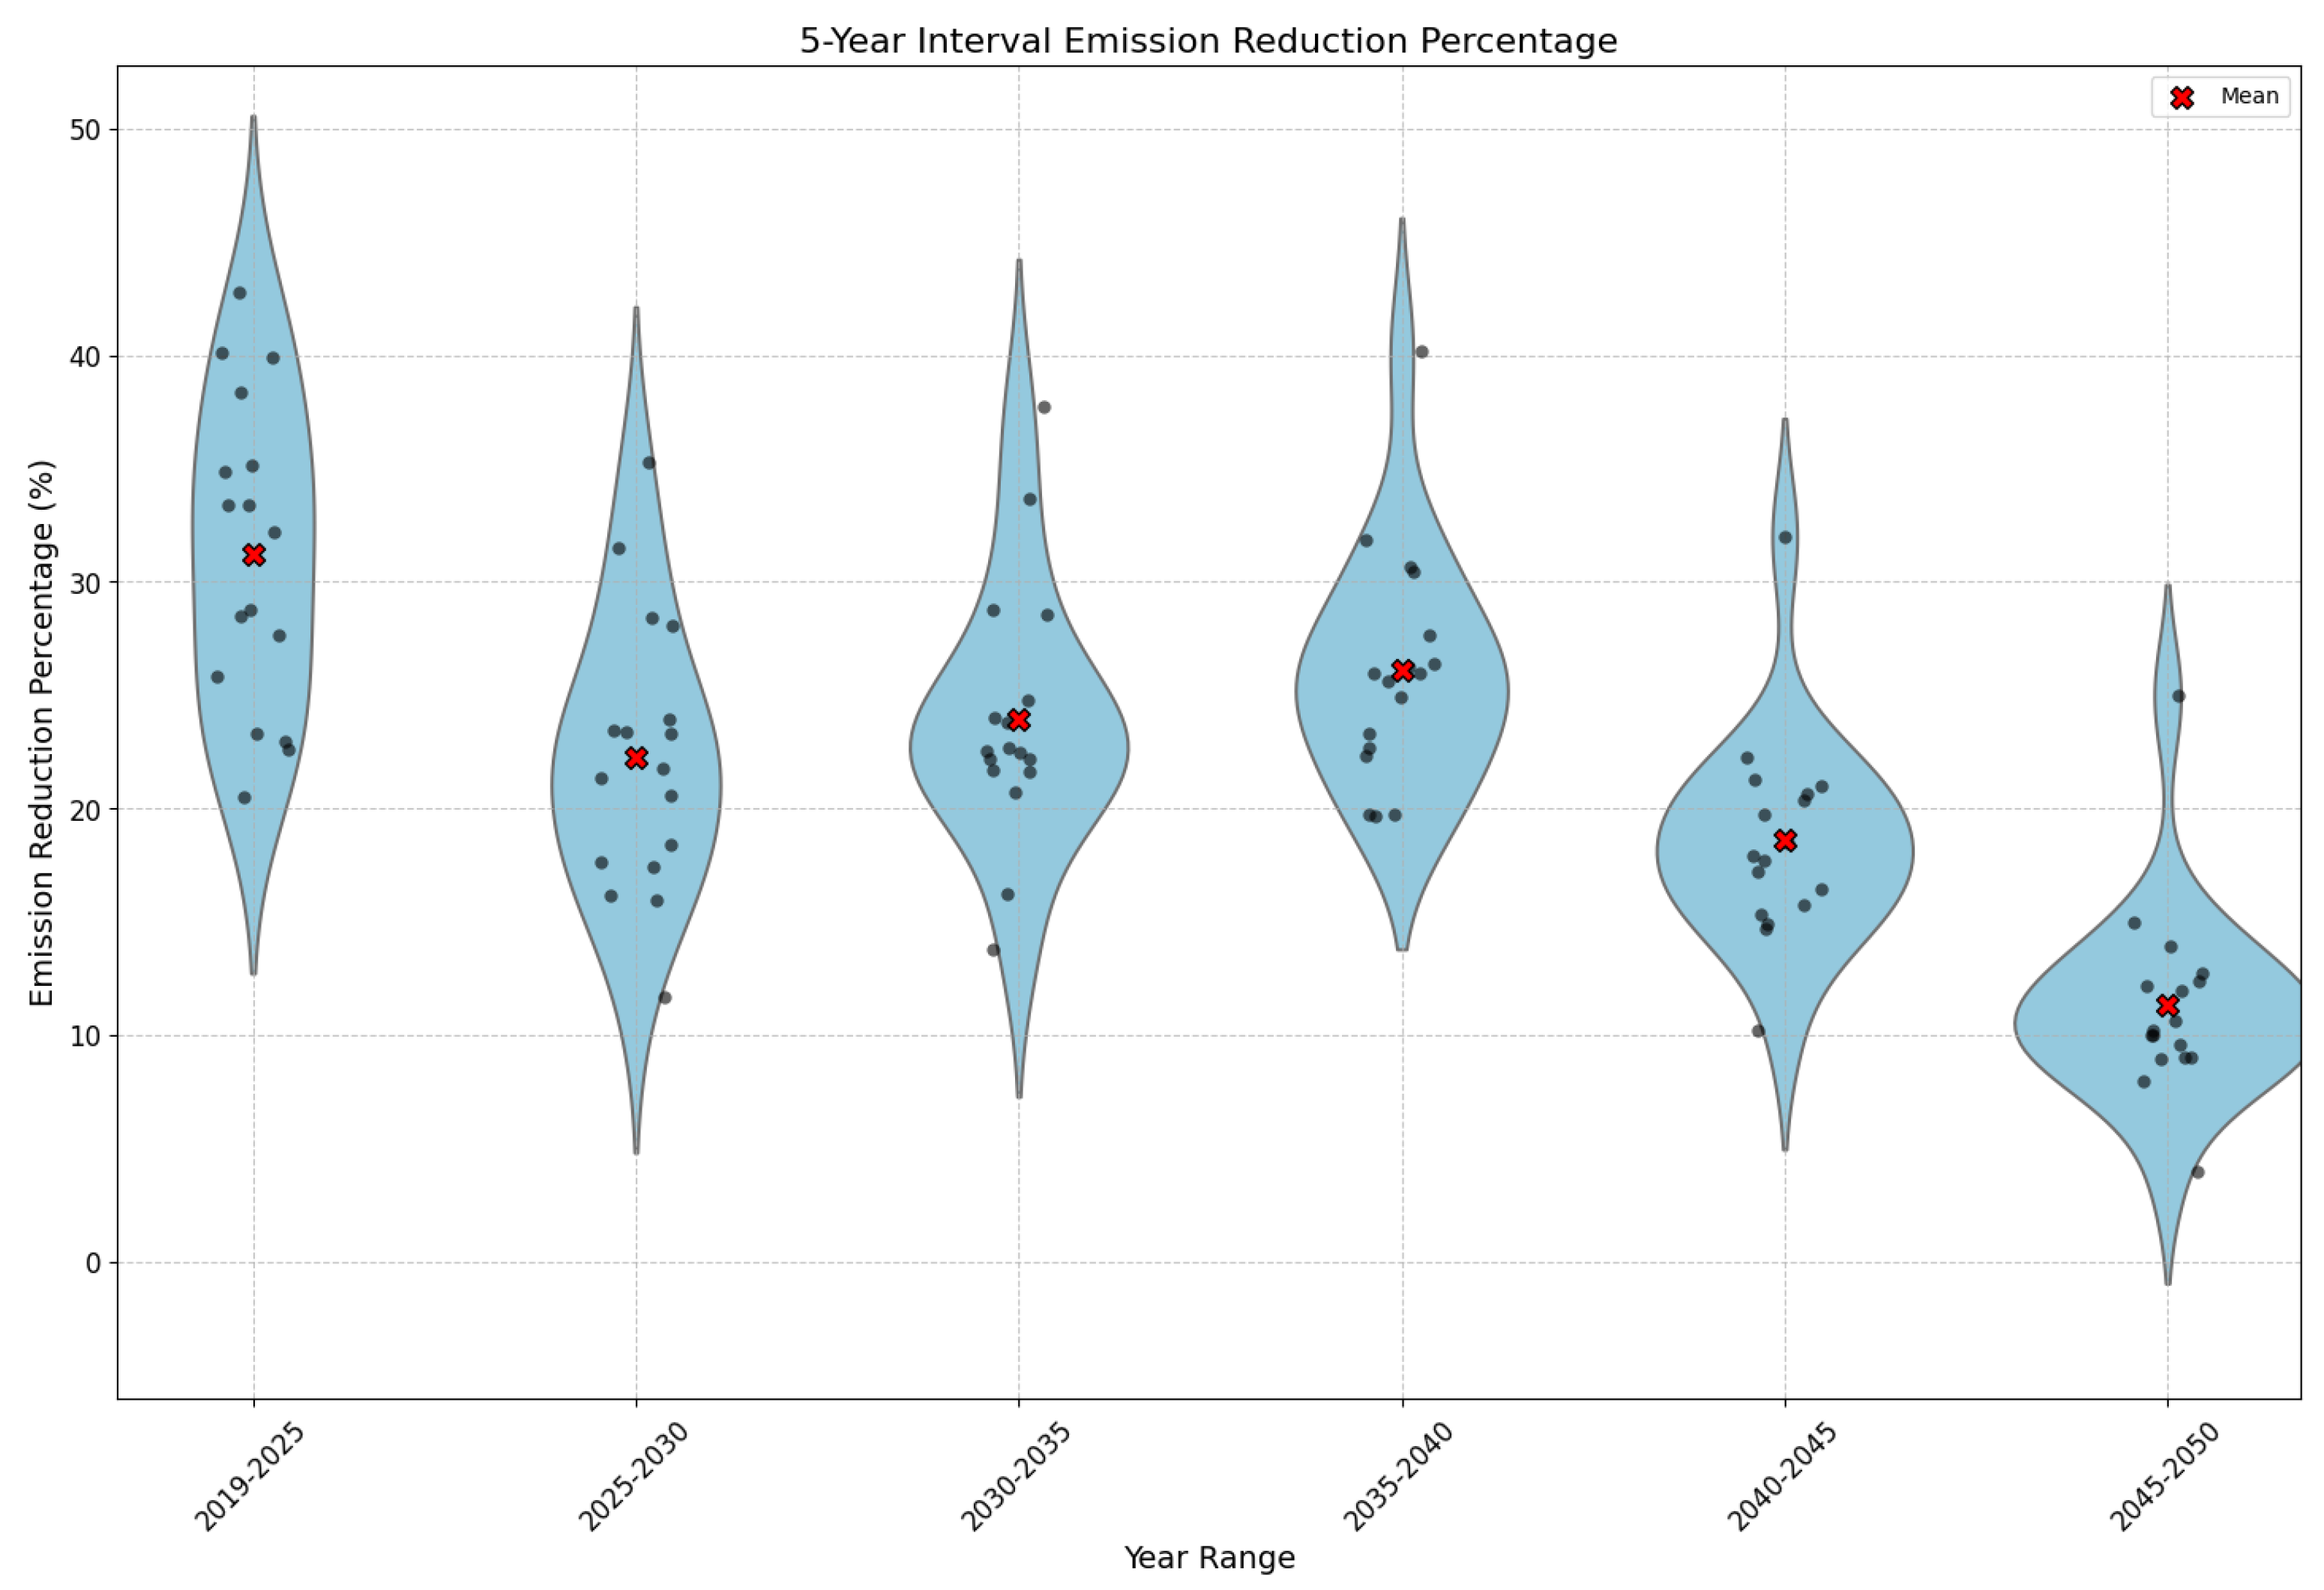

Table 1.
Example of random control matrix scenario. Each scenario is sampled with Latin Hyper Sampling method. Each column indicates the precursor emission activity of each emission source and each row indicates the activity of each region of Korea.
Table 1.
Example of random control matrix scenario. Each scenario is sampled with Latin Hyper Sampling method. Each column indicates the precursor emission activity of each emission source and each row indicates the activity of each region of Korea.
| Region name | NOx | SO2 | VOC | NH3 | PM2.5 | Activity |
| Seoul | 0.514 | 0.927 | 0.945 | 0.692 | 1.109 | - |
| Incheon | 0.611 | 1.087 | 0.949 | 0.546 | 0.778 | - |
| Busan | 0.504 | 1.364 | 1.046 | 1.192 | 1.249 | - |
| Daegu | 1.274 | 0.951 | 0.708 | 1.247 | 0.786 | - |
| Gwangju | 0.872 | 1.069 | 0.621 | 0.840 | 1.497 | - |
| Gyeonggi-do | 0.574 | 1.379 | 1.436 | 0.842 | 1.177 | - |
| Gangwon-do | 1.479 | 1.167 | 0.540 | 1.098 | 1.173 | - |
| Chungbuk-do | 1.134 | 0.710 | 0.725 | 1.410 | 0.503 | - |
| Chungnam-do | 0.520 | 0.562 | 0.812 | 1.021 | 0.994 | - |
| Gyeongbuk-do | 1.063 | 1.073 | 1.192 | 1.343 | 1.045 | - |
| Gyeongnam-do | 0.581 | 1.337 | 1.057 | 0.811 | 0.671 | - |
| Jeonbuk-do | 0.702 | 1.286 | 0.580 | 1.150 | 1.063 | - |
| Jeonnam-do | 1.311 | 1.187 | 1.001 | 1.281 | 0.805 | - |
| Jeju-do | 1.034 | 1.224 | 1.395 | 0.520 | 0.752 | - |
| Daejeon | 1.173 | 0.718 | 1.386 | 0.762 | 0.864 | - |
| Ulsan | 1.197 | 0.919 | 0.528 | 1.284 | 0.534 | - |
| Sejong | 0.996 | 1.394 | 0.549 | 0.787 | 1.343 | - |
| Boundary | - | - | - | - | - | 1.000 |
Table 2.
Quantitative comparison of the performance of Conditional U-Net emulation results. MAE, NMAE and metrics were evaluated here. The results indicate that the Conditional U-Net model emulates CMAQ with very high performance, and the comparison of the results for the training and test data shows that the model also learns successfully without overfitting problems.
| Target year | Target Region | Metrics [Units] | Data category | Score |
| 2019 | South Korea | MAE [] | Training set | 0.222 |
| Test set | 0.221 | |||
| NMAE [%] | Training set | 1.788 | ||
| Test set | 1.762 | |||
| [-] | Training set | 0.996 | ||
| Test set | 0.996 |
Table 3.
Time required to compute each method. Compared to the time required to simulate each scenario in CMAQ, the time saved by the conditional U-Net method is significantly shorter, regardless of the processor type. It should be noted, however, that the CMAQ simulation data must be computed in advance in order to train the conditional U-Net model.
| Method | Processor | Batch size | Time consumed |
|---|---|---|---|
| CMAQ v4.7 | CPU (simulation) | - | ∼ 24h / scenario |
| Conditional U-Net | CPU (training) | 256 | ∼ 10s / epoch |
| GPU (training) | 256 | ∼ 1s / epoch | |
| CPU (prediction) | 32 | ∼ 10ms / scenario | |
| GPU (prediction) | 32 | ∼ 1ms / scenario |
Disclaimer/Publisher’s Note: The statements, opinions and data contained in all publications are solely those of the individual author(s) and contributor(s) and not of MDPI and/or the editor(s). MDPI and/or the editor(s) disclaim responsibility for any injury to people or property resulting from any ideas, methods, instructions or products referred to in the content. |
© 2024 by the authors. Licensee MDPI, Basel, Switzerland. This article is an open access article distributed under the terms and conditions of the Creative Commons Attribution (CC BY) license (http://creativecommons.org/licenses/by/4.0/).
Copyright: This open access article is published under a Creative Commons CC BY 4.0 license, which permit the free download, distribution, and reuse, provided that the author and preprint are cited in any reuse.


