
Submitted:
30 August 2024
Posted:
02 September 2024
You are already at the latest version
Abstract
Spacecraft recovery technology is crucial in the field of aerospace, in which the parachute plays a key role in slowing down the descent speed of the spacecraft and realizing a smooth landing. In order to construct a dynamically adjustable parachute deployment strategy, it is necessary to measure the parachute dynamic load accurately in real time. However, the existing sensor measurement scheme is difficult to meet the measurement requirements due to its large structure and complex wiring. In order to meet the current demand for real-time measurement of parachute cords dynamic load, a miniature measuring instrument is designed.According to the function and technical requirements of the miniature measuring instrument, the hardware modules of the acquisition system are selected and designed, and the integration debugging and performance optimization of the microcontroller module, A/D sampling module, signal acquisition circuit and power supply module are carried out. The software of the parachute cords tension acquisition system based on the miniature measuring instrument is developed. The elastomer is modeled by using SolidWorks and statically analyzed by using AnsysWorkbench finite element analysis software. Then the final structure of the elastomer and the pasting position of the strain gage are determined through the results analysis as well as experimental verification. The hardware module of the signal acquisition system for the miniature measuring instrument is then encapsulated. The force value of the miniature measuring instrument is calibrated and tested many times by using the microcomputer-controlled electronic universal testing machine. The experimental results show that the designed miniature measuring instrument has accurate data, strong stability and good real-time performance, which meets the demand for real-time accurate measurement of miniature measuring instrument, and can provide reliable data for parachute cords parameter validation and stepless unfolding design.
Keywords:
stepless parachute opening
; finite element analysis
; real-time measurement
; wireless data transmission
; static calibration
1. Introduction
Spacecraft recovery and landing technology plays a crucial role in the field of spaceflight, providing the necessary support and guarantee for the successful implementation of space missions. In this process, the role of parachute is crucial, which can effectively slow down the descending speed of the spacecraft and realize a smooth and safe landing [1].
Although spacecraft recovery often employs a staged parachute opening system[2], there are a number of limitations. A staged parachute opening system requires the deployment sequence and the number of the parachutes to be determined in advance, which may limit the adaptability under different atmospheric conditions and flight states. In addition, the design and control of the staged parachute opening system is relatively complex and requires precise planning and execution, which also increases the weight and cost of the system. To solve the limitations of the staged parachute opening systems, the stepless parachute opening system has become a highly sought-after alternative with greater flexibility and adaptability. It is capable of adjusting the angle and degree of parachute deployment according to real-time environmental conditions and flight status, improving the success rate and safety of spacecraft recovery.
To realize the stepless parachute opening system, the parachute dynamic load must be accurately measured. At present, there are some shortcomings in the traditional measurement program, such as the large size of the measurement instrument and the need for wiring, which is difficult to meet the demand for real-time and accurate measurement. The existing parachute cords dynamic load measurement method is also not directly applicable to the parachute opening process of the cords dynamic load measurement[3].
To solve this problem, this paper proposes a wireless strain load measuring instrument, which consists of an elastomer structure and an signal acquisition system, and can be integrated into the parachute system without damage[4]. The instrument is able to measure the dynamic load of the cords during parachute opening in real time and accurately, and transmit the data to the upper computer through wireless transmission, so as to monitor the changes of the parachute cords load in real time. This technology can not only provide reliable data for verifying the technical parameters of parachute cords, but also give important support for the design of stepless cords deployment in the future. Its application scope can also be extended to the research, development and testing of aviation parachutes and sports parachutes, which has great social and economic value.
2. Overall Structure of Miniature Measuring Instrument
2.1. Overview of Miniature Measuring Instrument
The instrument is installed on the parachute cords in the form of “tandem”, and through the signal acquisition system, the strain signal of the elastomer is converted into an electrical signal, and the collected data is sent wirelessly to the upper computer test software, which processes and saves the data. The schematic diagram of the miniature measuring instrument installed in the parachute is shown in Figure 1.
The miniature measuring instrument includes elastomer structure and signal acquisition system, through the strain gages pasted on the elastomer structure to form a Wheatstone bridge[5,6] to transform the strain signal generated by the elastomer into an electrical signal, the data acquisition module will save the data to the micro-controller module, which will send the data through the wireless transmission module to the upper computer test software. Figure 2 is the schematic of the miniature measuring instrument.
2.2. Design Requirements
To fulfill the need for real-time measurement of parachute cords loads, the miniature measuring instrument has to be integrated into the parachute cords in a non-destructive way that does not affect its performance. The signal acquisition system must ensure real-time, accurate and stable data collection, transmission and storage for future analysis. The miniature measuring instrument shall incorporate the following features:
- The miniature measuring instrument meets the needs of miniaturization and light weight;
- The miniature measuring instrument is capable of real-time collection of parachute cords load data;
- The miniature measuring instrument can be calibrated by software;
- The miniature measuring instrument can transmit the data wirelessly to the upper computer test software.
The miniature measuring instrument not only needs to meet the above functional requirements, but also needs to meet the expected indicators which are shown in Table 1.
2.3. R&D Process
In order to meet the required functions and main technical indicators, the design and development of the miniature-measuring instrument is divided into two major parts: signal acquisition system design and elastomer structure design. These two parts interact with each other and an appropriate design research program is proposed to meet the final design requirements, as shown in Figure 3.
2.4. Analysis of Expected Problems (Expected Challenges/Potential Problems)
Comprehensively analyzing the design and functional requirements of the parachute cords load measuring instrument, the researchers need to focus on solving the following four key technical problems:
- Microspace data acquisition: integrating the microcontroller module, data acquisition module, strain gage, power supply module and wireless transmission module in a limited space to ensure the measurement accuracy, sampling frequency and data transmission requirements.
- Elastomer structure design: the elastomer structure needs to withstand high impact loads while maintaining strain gage accuracy and ensuring the stability of the electronic component area to guarantee the stability of the circuit package.
- Encapsulation of electronic instruments in high-load environments[7]: the technology to ensure that the electronic components can still operate normally and stably under impact forces.
- Testing and calibration methods: developing testing and calibrating methods for the miniature measuring instrument to ensure data accuracy and evaluate its performance through actual testing.
3. Design of the Elastomer Structure
3.1. Design Requirements
The measuring principle of the miniature measuring instrument is that when the elastic body is deformed under the action of the pulling force generated by the parachute cords, a tensile and compressive strain in the central web is formed[8].By pasting a resistance strain gage in a larger strain area, the conversion and acquisition of the deformation signal to the electrical signal can be carried out. Thus, the design requirements should be as follows:
- High precision, good stability, durability and other advantages;
- Integrating into a parachute structure in series without influencing the normal opening of the parachute;
- Miniaturization and light weight;
- Being able to accommodate suitable deformations when subjected to high transient impact loads.
3.2. Design of Elastomer Structure I
The elastomer structure I is designed to be an integrated structure, and the two end earrings are connected with the parachute cords. The middle concave web plate is used for installing a strain gage and encapsulating electronic components of an acquisition system, and the eight protruding "baffles" are used to protect electronic components[9]. SolidWorks software is used for 3D modeling, and the design size of elastic structure scheme I is 163. 71 mm × 53.71 mm×30mm, as shown in Figure 4.
The finite element simulation analysis of the elastomer structure is carried out by using AnsysWorkbench. The material is AI304 stainless steel, one side of the earring is fixed, and the other end of the earring is applied with 8000 N. The whole structure is meshed with the size of 3mm, and the web is meshed separately with a size of 1.5mm. The number of grid nodes is 52939 and the number of grids is 29422. The results of the finite element analysis for the elastomeric structural scheme I are shown in Figure 5.
As shown in Fig. 5, the maximum stress of the elastomer structure scheme I is 101.8 Mpa after bearing a force of 8000 N which is far lower than the maximum yield strength of 206.807 Mpa of AI304 stainless steel. It indicates that the material meets the requirements in structure.
As shown in Fig. 5, the maximum strain of the elastomer structural scheme I is 2.53×10⁻⁴ mm/mm after being subjected to a force of 8000 N.
The finite element analysis shows that AI304 stainless steel meets the design requirements as an elastomer structural material. The four corners of the elastomeric structure at the location of the web produce the greatest strain. Therefore, the position of the maximum strain of the elastomer structure can be the place where the strain gage is pasted.
The prototype of the miniature measure instrument is obtained by assembling and welding the hardware module I of signal acquisition system (see Section 4.2) and elastomer structure I. The experimental verification test is conducted on the universal testing machine (see Section 5.1). The experimental results show that the volume size of the elastomer structure I is so large that it is difficult to paste the strain gage in the strain area. Thus, a structural optimization design of the elastomer structure I is necessary.
3.3. Optimized Design of Elastomer Structure
3.3.1. Design of Elastomer Structure
The design of elastomer structure of miniature measuring instrument directly determines the performance of the instrument. In this paper, the structural optimization design is carried out according to the elastomer structure I. The hardware module of that acquisition system is packaged on both sides of the elastomer structure by adopting two assembly schemes. The optimized elastomer structures are called elastomer structure scheme II and elastomer structure scheme III. In elastomer structure scheme II, the battery is on one side, the microcontroller, the A/D sampling module and the charging module are one the other side. The elastomer structure scheme III adopts one side of the microcontroller and the battery, and the other side of the A/D sampling module and the charging module. Elastomer structures II and III are shown in Figure 6 and Figure 7.
On the basis of the elastomer structure scheme I, the elastomer structure scheme II carries out the reduction of the web thickness, the reduction of the overall size and the angle changes of the baffle plate to complete the optimization of the elastomer structure. On the basis of the elastomer structure scheme I, the elastomer structure scheme III is optimized by slotting, reducing the overall size, increasing the thickness of the web and removing the baffle plate. Finally, the size of elastomer structure II is 119. 47 mm×43.47 mm×30 mm, and the size of elastomer structure III is 96 mm×36 mm×22 mm.
3.3.2. Statics Analysis of Elastomer Structures
After determining the structural form of the elastomer, the finite element analysis software AnsysWorkbench is used to carry out the static analysis of the two optimized elastomer schemes to determine the maximum deformation area of the elastomer structure. The elastomer material is AI304 stainless steel with a Young's modulus of 1.9 × 10⁵ MPa, the material density of 8000 kg/m3, and a Poisson's ratio of 0.29. The finite element software AnsysWorkbench is used to mesh the elastomer structure.
One earring end of the elastomer structure is set as a fixed constraint, and the other is set as a load constraint. The finite element analysis results of the elastomer structure are shown in Figure 8 and Figure 9.
It can be seen from Figure 8 that the maximum stress on the elastomer structure II is 72.98 MPa, which is about 134MPa smaller than the yield strength of the selected material AI304, so the material can meet the measuring range of the miniature measuring instrument in theory. The stress concentration area of the elastomer structure II is at the four corners of the web of the elastomer structure, and the strain in this area is 262 με.The strain in the central region of the web is 85 με.
It can be seen from Figure 9 that the maximum stress on elastomer structure III is 178 MPa, which is about 29 MPa smaller than the yield strength of the selected material AI304, so the material can meet the measuring range of the miniature measuring instrument in theory. The stress concentration area of elastomer structure III is in the middle of the web of the elastomer structure, and the strain in this area is 795 με.
3.3.3. Strain Gage Selection and Pasting Position Determination
In this paper, the “T” type strain gage of model BF-350-3BB-A is used. In order to eliminate the influence of the temperature error and further improve the sensitivity of the miniature measuring instrument, two half-bridge strain gages are selected to form a full bridge[10]. According to the principle of “stress concentration”, it is difficult to paste the strain gage on the elastomer structureⅡ.Therefore, the strain gage is pasted at the center of the web with uniform stress. The pasting position of the strain gage of the elastomer structure is shown in Figure 10 and Figure 11.
By using the “probe” function in ANSYS, the strain is collected in the area where the strain gage is attached. Collect every 600N for 14 times, and collect 20 points each time. Take the average value of the collected data and draw the line chart.
From Figure 12, it can be seen that the strain value of the elastomer structure II is much smaller than that of the elastomer structure III under the same force loading. In order to determine the final elastomer structure scheme, experimental verification is required (see Section 5.2 for experimental verification of elastomer structure scheme).
4. Microspace Data Acquisition
4.1. Design Requirements
The function of the signal acquisition system mainly includes the real-time acquisition of parachute cords tension and the data transmission to the upper computer through wireless communication. The microcontroller module, signal acquisition module, strain gage, power supply module and wireless transmission module must be integrated into the elastomer structure within a limited space, and at the same time the requirements of measurement accuracy, sampling frequency and data transmission should be met. So the signal acquisition system needs to meet the following functions:
- The hardware structure of the signal acquisition system needs to be compact;
- The signal acquisition system needs to be both high performance and low power consumption;
- The miniature measuring instrument is battery-powered and supports direct charging without removing the battery. The endurance time is about 20 minutes.
- The sampling rate of the miniature measuring instrument is 1kHz, which can completely record the change of the pull force of the parachute cords in the process of opening and straightening, and conduct wireless data transmission.
4.2. Signal Acquisition System Design and Performance Test
The signal acquisition system of miniature measuring instrument mainly completes the functions of data acquisition and wireless data transmission of the dynamic load of parachute cords. It mainly includes microcontroller module, A/D acquisition module, strain gage, power supply module and wireless communication module. Figure 13 is schematic diagram of the signal acquisition system.
4.2.1. Signal Acquisition System Hardware Module Selection and Design
In order to meet the demand for the miniature measuring instrument, the design scheme of module separation is adopted. The hardware modules are arranged on both sides of the elastomer structure and connected by connecting lines to solve the problem that the overall volume of the circuit board is too large to be installed on the elastomer structure.
According to the design requirements, the results of the selection and design of the signal acquisition system hardware are as follows:
According to Table 2, the relevant electronic components are assembled and welded, and the photos of the acquisition system hardware module Ⅰ with the relevant dimensions 67.8 mm × 33.84 mm × 21.63 mm (L × W × H) is shown in Figure 14.
The performance parameters of the signal acquisition system hardware module Ⅰ are shown in Table 3 below.
4.2.2. Upper Computer Test Software Design and Development
In this paper, Visual Studio 2022 software is used to write the upper computer software[11,12] with the test software interface shown in Figure 15. Click on the “instrument list” to select the instrument to be connected, and click on the “channel 1” to set up the instrument channel. After the instrument is successfully connected, the upper computer test software will plot curves according to the data collected and update in real time.
4.2.3. Communication Test of Signal Acquisition System and upper Computer Test Software
Before the communication test, it is necessary to set the IP address of the hardware module of the signal acquisition system to 10.168.1.101, and at the same time, set the IP address of the wireless router, WiFi name and password, connect the computer equipped with the upper computer test software to WiFi and turn on the software, search for the list of equipments and bind it to channel 1, and receive the data in the upper computer test software after successful connection by pressing the strain gage slightly. The communication test proves that the hardware module Ⅰ of the signal acquisition system and the upper computer test software can communicate normally and receive data and draw curves in real time, as shown in Figure 16.
After the above communication test, it is known that the signal acquisition system hardware module and the upper computer test software have the following design defects and cannot meet the design requirements:
- The size of hardware module Ⅰ of the acquisition system is too large, failing to achieve the design goal of lightweight and miniaturization.
- The large size of the electronic components selected for the hardware selection and design of the signal acquisition system will have an impact on the design size of the elastomer structure Ⅰ. resulting in a very large overall size of the miniature measuring instrument.
- The function of the upper computer test software is not perfect, unable to calibrate and save data, and the number of channels is limited to two. The range of the display interface is large, and it is not possible to visualize the experimental results.
Based on the above design defects, it is necessary to optimize the design of the signal acquisition system hardware module and the upper computer test software to meet the design requirements of the miniature measuring instrument.
4.3. Signal Acquisition System Optimization Design
4.3.1. Signal Acquisition System Hardware Module Optimization
After the experimental test and result analysis, it is known that it is necessary to optimize the design of the hardware module of the signal acquisition system and the test software of the upper computer. The selection design of the optimized signal acquisition system hardware module (later called signal acquisition system hardware module Ⅱ) is shown in Table 4. The signal acquisition system hardware module Ⅱ is shown in Figure 17.
A comparison of the performance of the hardware modules of the signal acquisition system before and after optimization is shown in Table 5:
From the above comparison, it can be seen that the signal acquisition system hardware module Ⅱ improves the resolution of the A/D sampling module while decreases the sampling rate, but it can still meet the design requirements of the miniature measuring instrument.
By comparing the physical objects of the signal acquisition system modules in Figure 18, it can be seen that the volume and size of the signal acquisition system hardware module II are significantly reduced, which is in line with the design requirements of lightweight and miniaturization.
4.3.2. Optimization of the upper Computer Test Software
Aiming at the defects of the upper computer test software, the interface of the upper computer test software is optimized and the software functions are added. The optimized upper computer test software (later called parachute cords tension signal acquisition system) realizes the functions of data calibration and data saving, and at the same time, it also increases the data transmission channels to 10, and realizes real-time display of data, which makes the display of dynamic load of parachute cords more intuitive.
The main interface of the parachute cords tension signal acquisition system is shown in Figure 19 including five areas: Wireless address connection area, Software operation area, Data acquisition plotting display area, Real-time data display area and Parameter calibration area.
4.3.3. Communication Test of Optimized Signal Acquisition System
In order to make the communication test more intuitive, a scaled-down elastomer structure is designed and machined with AI304 as the material. Due to the small size of the structure, the strain gauge is pasted at the center of the web, the cross-positioning line is determined at the center of the structural web with a pencil, and the signal acquisition system module is fixed on the elastomer structure with insulating tape, as shown in Figure 20.
A microcomputer-controlled electronic universal testing machine is used to carry out the experimental test on the communication of the signal acquisition system which includes the wireless communication and wireless data transmission test of the signal acquisition system module II and the parachute cords tension acquisition system software, and the function verification of the parachute cords tension acquisition system software. The wireless communication test of the signal collection system module II and the parachute cords tension acquisition system is shown in Figure 21.
During the experimental verification test, the parachute cords tension acquisition system can operate normally, realize data reception and real-time display, draw real-time curves with the collected data, and carry out the parameter calibration and data saving functions, as shown in Figure 22 and Figure 23.
5. Experimental Verification of Miniature Measuring Instrument
5.1. Experimental Equipment
The hardware equipment required for the experiment includes a computer and a microcomputer-controlled electronic universal testing machine modeled as WDW-50KN. The parachute cords used in the experimental testing of the miniature measuring instrument are provided by the Beijing Space Electromechanical Research Institute. Table 6 shows the relevant parameters of the test parachute cords, and Figure 24 shows the test parachute cords.
5.2. Experimental Verification of the Prototype of Miniature Measuring Instrument
The purpose of this experiment is to verify whether the overall performance of the prototype of the miniature measuring instrument meets the design requirements. Before the start of the test, it is necessary to complete the pasting of the strain gage which is a single strain gauge and is pasted at the corner of the web with instant adhesive, as shown in Figure 25.
The experiment uses a microcomputer-controlled electronic universal testing machine to carry out force loading test of 0-8000N on the miniature measuring instrument. The experimental process is shown in Figure 26. The upper computer software displays the force value waveforms in Figure 27 when the load reaches 8000N.
Analysis of the experimental results through experimental testing shows that the prototype of the miniature measuring instrument has the following design defects and fails to meet the design requirements:
- The size of the acquisition system hardware module Ⅰ is too large, failing to achieve the design goal of lightweight and miniaturization.
- The function of the upper computer test software is not perfect, unable to calibrate and save data, and the number of channels is limited to only two. The range of the display interface is large, unable to visualize the experimental results.
-
The elastomer structure has the following defects:
- (1)
- The area that can produce large deformation under force is too small, which makes it difficult to paste the strain gage.
- (2)
- The “baffle plate” may rub against the parachute cords in the process of opening, causing damage to the parachute cords.
- (3)
- The size of the electronic components selected in the hardware selection and design of the acquisition system is large, which leads to the large size of the elastomer structure.
5.3. Experimental Verification of Elastomer Structure Schemes
According to the design of elastomer structure scheme Ⅱ and Ⅲ, the physical objects are manufactured. And a cross line is drawn at the center of the web plate to facilitate the positioning of the strain gages. Figure 28 and Figure 29 show the physical objects and the strain gage pasted in elastomer structure scheme Ⅱ and Ⅲ respectively. The elastomer structures are mounted on the universal testing machines as shown in Figure 30.
The elastomer structure II and the elastomer structure III are respectively loaded with the force value of 0 ~ 8000 N and the obtained test data are drawn into a curve as shown in Figure 31. The test data of elastomer structure I and II is shown in Table 8.
The linearity can be calculated as 1.0256% for elastomer structure II and 0.0375% for elastomer structure III by using the linearity formula (1).
△Lmax denotes the maximum error value of the static characteristics and the fitted curve.
Meanwhile, the software calibration parameter of elastomer structure Ⅱ in the parachute cords tension acquisition system software is 66519, and that of elastomer structure Ⅲ is 10521. Comprehensively comparing the strain, linearity, and software calibration parameter of elastomer structure Ⅱ and elastomer structure Ⅲ, it can be seen that the sensitivity of elastomer structure Ⅲ is much larger than that of elastomer structure Ⅱ, and the size of elastomer structure Ⅲ is smaller than that of elastomer structure Ⅱ, which meets the demand of the miniature measuring instrument.
6. Encapsulation and Calibration of Electronics in High Load Environment
6.1. Joint Debugging Test of the Miniature Measuring Instrument
Through the comparison of the elastomer structure schemes and the experimental verification test, in this paper it adopts elastomer structure Ⅲ for the miniature measuring instrument, and puts the microcontroller and the battery on one side of the elastomer structure, the charging module and the A/D acquisition module on the other side. The modules on both sides are connected through the wires, and the prototype of the miniature measuring instrument after the soldering and assembling is shown in Figure 32.
After completing the hardware connections, testing of the instrument begins. The miniature measuring instrument is connected to the microcomputer-controlled electronic universal testing machine, as shown in Figure 33. Starting from 0N, stop the universal testing machine action at every 600N and keep the current force value for 30 seconds, while the current data of the parachute cords tension acquisition system is recorded. After the universal testing machine is loaded to 8000 N, record the data and finish the testing. The data collected by the parachute cords tension acquisition system is shown in Figure 34.
Through the processing of the data in Table 9 and the linear fitting of the curve, it is found that the sample points collected by the miniature measuring instrument experiment are almost in a straight line, as shown in Figure 35, and the fitting result proves that the miniature measuring instrument has better linearity in AD sampling, and according to the above data, the linearity of the structure can be calculated by using formula (1), which is 0.1124%. During the experiment, the parameter setting of the parachute cords tension acquisition system, “Gai” gain value is 10521, “offset” bias is 1984.
The joint debugging test experiment proves that the sensitivity and linearity of elastomer structure Ⅲ are better, which meets the needs of miniature measuring instrument. But before the actual test, it is necessary to encapsulate and protect the strain gage and electronic components so as to minimize the influence of external factors on the performance of the miniature measuring instrument.
6.2. Encapsulation of Miniature Measuring Instrument
In order to reduce the impact of external factors on the performance of the miniature measuring instrument, and improve its reliability and durability, 6163-822A/B potting adhesive[13,14,15] is used in the encapsulation. Firstly, encapsulate the strain gage, and continue to encapsulate the hardware module of the acquisition system of the miniature measuring instrument after the encapsulating adhesive is completely cured, as shown in Figure 36. After the encapsulating adhesive is fully cured (about 36 hours), the overall performance of the miniature measuring instrument is tested, and the completed miniature measuring instrument is shown in Figure 37.
6.3. Microgage Calibration and Performance Testing
6.3.1. Calibration of the Miniature Measuring Instrument
After completing the encapsulation, it is necessary to calibrate the parameters of the miniature measuring instrument[16] since the working environment after encapsulation is different from that of the bare state, which directly affects its working state and output accuracy.[17]
Install the miniature measuring instrument to the universal testing machine, and start the parachute cords tension acquisition system software and the universal testing machine at the same time to begin the experimental testing, as shown in Figure 38.
Use the parameter calibration formula (2) to calculate the scale factor that needs to be modified, and then modify the Gai value and Offset value for the light and small parachute cords tension instrument to complete the calibration of the parameters.
The modification of the scale factor (Cmod) can be calculated by using the following formula:
As shown in Figure 39, the parameters of the parachute cords tension acquisition system software after the calibration: “Gai” is 10132, “Offset” is 2030.
6.3.2. Miniature Measuring Instrument Performance Testing
In the experiments, the performance parameters of the miniature measuring instrument are obtained by conducting continuous loading tests from 0 to 8000N on the miniature measuring instrument[18,19,20]:
- Rated range, 0~8000N;
- Resolution of pulling force, 1N;
- Repeatability, refers to the same input quantity of the sensor for continuity, full range, multiple changes, the degree of consistency of the static characteristics of the sensor, the basic formula can be expressed as follows:
△Rm indicates the absolute error value of the output quantity corresponding to multiple cyclic changes of the input quantity in the same direction.
Three data tests are carried out by gradually increasing the force value, the specific data are shown in Table 10, and the repeatability curve corresponding to the experimental data is shown in Figure 40, with a repeatability of 0.1%.
- 4.
- Hysteresis, refers to the degree of non-coincidence of the sensor positive (input volume increased) and negative (input volume decreased) range characteristics in the rated range.The basic formula can be expressed as follows:
△Hm indicates the maximum error value of positive and negative range output.
Three data tests on the standard force value with gradual increase and decrease are carried out respectively, and a group of data with the largest deviation in each test is selected, shown in Table 11. The hysteresis test curve is in Figure 41, the test hysteresis result is 0.1%.
- 5.
- Sensor input and output quantities from the fitted straight line. Its basic formula can be expressed as.
ΔLm denotes the maximum error value of the static characteristics with respect to the fitted curve.
A set of experimental data is detected first and the corresponding fitted data is calculated according to the fitted curve obtained in the previous subsection, as shown in Table 12. The linearity curve of the experimental data is shown in Figure 42, and the linearity of the sensor is tested to be 0.1%.
- 6.
- Precision, refers to the degree of accuracy of the instrument detection data. According to the hysteresis, repeatability, linearity and other test results, the measurement accuracy of the miniature measuring instrument is:
- 7.
- Sensitivity, refers to the output change and the input change ratio of the sensor in the stable operating state. Its basic formula can be expressed as:
∆y is the increment of the output quantity and ∆x is the increment of the input quantity.
By calculating the data in Table 12 with Equation (7), it can be seen that the sensitivity of the miniature measuring instrument is 1mV/V.
After the design and manufacture of the elastomer structure and the hardware design and selection of the signal acquisition system, the assembly and encapsulation of the miniature measuring instrument are completed, and the design and development of the parachute cords tension acquisition system is completed at the same time. Then the joint debugging test and the calibration of the encapsulated miniature measuring instrument are completed. The performance indicators of the miniature measuring instrument is completed according to the experimental test as shown in Table 13.
7. Summary
The following conclusions are drawn from the study:
- In this paper, a miniature measuring instrument suitable for measuring the dynamic load of parachute cords has been developed. The instrument which will not affect the structural performance of the parachute can not only provide reliable data for verifying the technical parameters of parachute cords, but also provide important support for the future design of stepless deployment of cords.
- The hardware module of the signal acquisition system with a microcontroller as the core and the corresponding software of the parachute cords tension acquisition system are designed to complete the functions of the acquisition of the dynamic load of the parachute cords, the wireless transmission of the data, the real-time curve plotting and data saving.
- Based on the hardware module of the acquisition system of the miniature measuring instrument, the design of the elastomer structure is completed, and through the static analysis of the elastomer structure and the corresponding experimental verification, the final design of the elastomer structure and the paste position of the strain gages are determined, which verifies the feasibility of the measurement as well as the reasonableness of the structural design.
- The research on epoxy potting and stabilizing encapsulation technology has been carried out for the electronic instruments under high load environment, and the research on sensor force calibration technology and performance parameter and stability test have been completed by using microcomputer-controlled electronic universal testing machine, which verifies that the performance of the developed miniature measuring instrument is in line with the expected requirements.
Acknowledgments
This study is funded by Zhongshan Research Institute of Changchun University of Science and Technology introduced innovative research team project;Project Number:CXTD2023006.
References
- Bao, J.J.; Lei, J.L.; Jia, H. Simulation and load impact analysis of parachute extraction process. Aerospace Recovery and Remote Sensing 2017, 38, 31–42. [Google Scholar]
- Han, Y.H.; Yang, C.X.; Xiao, H.J.; et al. Key technologies and development trends of precision airdrop systems for paragliders. Ordnance Automation 2012, 31, 1–7. [Google Scholar]
- Bazin, J.; Fields, T. Validation and flight testing of a wireless load distribution measuring system. In Proceedings of the 23rd AIAA Aerodynamic Decelerator Systems Technology Conference; 2015. [Google Scholar]
- Cheng, Y.L.; Yao, M.; Zhang, R.Y.; Ma, M.Y. Design of traction parachute rope tension sensor. Machinery Manufacturing & Automation 2017, 46, 189–191. [Google Scholar]
- Xie, C.Z.; Wang, J.Q.; Li, M.W. Design and simulation of flip-chip graphene pressure sensor structure. Sensors & Microsystems 2022, 41, 32–35. [Google Scholar]
- Tan, X.W.; Han, L. Investigation on the sensitivity of Wheatstone bridge. Journal of Southwest China Normal University (Natural Science Edition), 2008; 149–152. [Google Scholar]
- Zhang, H.Y. Research on the development of microelectronic manufacturing and packaging technology. Information Recording Materials 2024, 25, 51–53. [Google Scholar]
- Kalpesh Singal, Peng Peng, Rajesh Rajamani, and Joan Bechtold. Measurement of tension in a string using an array of capacitive force sensors. IEEE Sensors Journal 2013, 13, February. [Google Scholar] [CrossRef]
- Brandeau, E.; Frandeen, B.; Sanchez, J.; et al. Device for Temporal Measurement of Loads in Parachute Suspension Systems. In Proceedings of the 24th AIAA Aerodynamic Decelerator Systems Technology Conference; 2017. [Google Scholar]
- Ma, M.Y. Development of a tension sensor for heavy equipment airdrop. Master’s thesis, Nanjing University of Aeronautics and Astronautics, 2017.
- Li, M.Q.; Lan, R.M.; Zhai, G.J. Design of upper computer software for ultrasonic data acquisition system based on C#. Electronic Design Engineering 2017, 25, 190–193. [Google Scholar]
- Gong, Y.F.; Wang, S.Y.; Lei, Z.K.; Qiu, N.H. Design of upper computer software for high-speed, high-precision data acquisition system. Electronic Design Engineering 2020, 28, 38–42. [Google Scholar]
- Hao, H.X.; Cao, L.B.; Li, Z.C.; Fan, H.B. Application of two-component heat-conducting potting glue technology in the electronics industry. China High Technology 2023, 38–40. [Google Scholar]
- Yang, Z.J.; Yang, W.L.; Wu, H.P. Development of polyurethane potting compound for electronic packaging. China Adhesives 2016, 25, 30–34. [Google Scholar]
- Wang, H.; Shi, L.; Zeng, Z.K. Preparation and performance study of room temperature curing epoxy potting compound. Bonding 2019, 40, 18–21. [Google Scholar]
- Liu, X.D.; Liu, L.L.; Zhang, M.D.; Yang, X.F.; Sun, H. Static calibration of semiconductor strain gauge high-sensitivity torque sensor. Modern Manufacturing Technology & Equipment 2023, 59, 122–124. [Google Scholar]
- Xia Yong, Zhu Juner, Wang Kai, Zhou Qing. Design and verification of a strain gauge-based load sensor for medium-speed dynamic tests with a hydraulic test machine. International Journal of Impact Engineering 2016, 88, 139–152. [Google Scholar] [CrossRef]
- Cheng, Y.L. Design of a wireless parachute cords tension sensor based on ZigBee. Master’s thesis, Nanjing University of Aeronautics and Astronautics, 2016.
- GB/T 18459-2001. Calculation method for main static performance indicators of sensors.
- Faber, G.S.; Chang, C.C.; Kingma, I.; et al. A force plate-based method for the calibration of force/torque sensors. Journal of Biomechanics 2012, 45, 1332–1338. [Google Scholar] [CrossRef] [PubMed]
Figure 1.
Schematic of miniature measuring instrument installed in a parachute.
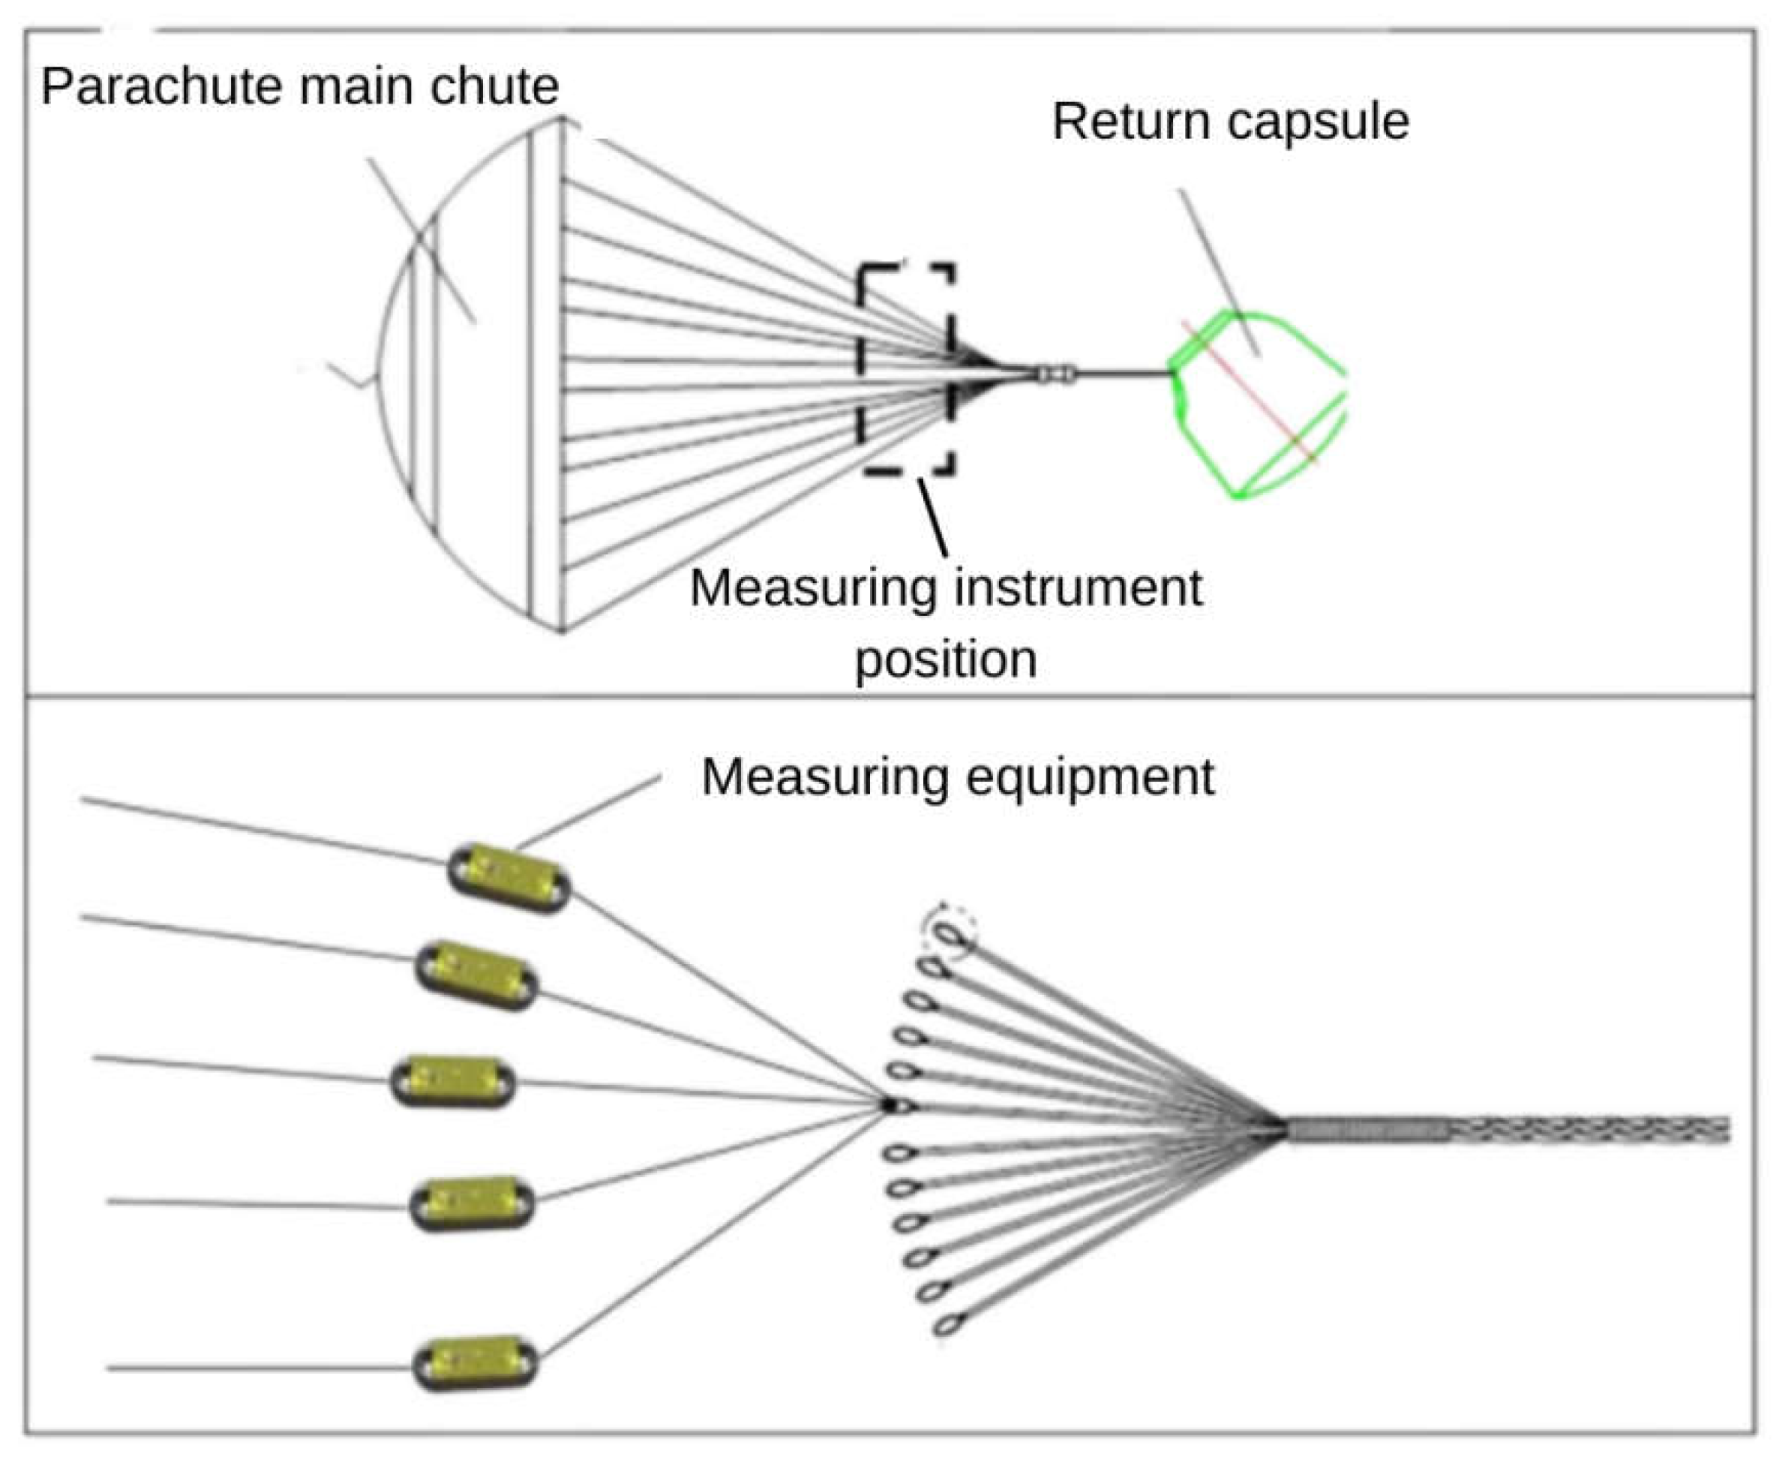
Figure 2.
Schematic of miniature measuring instrument.
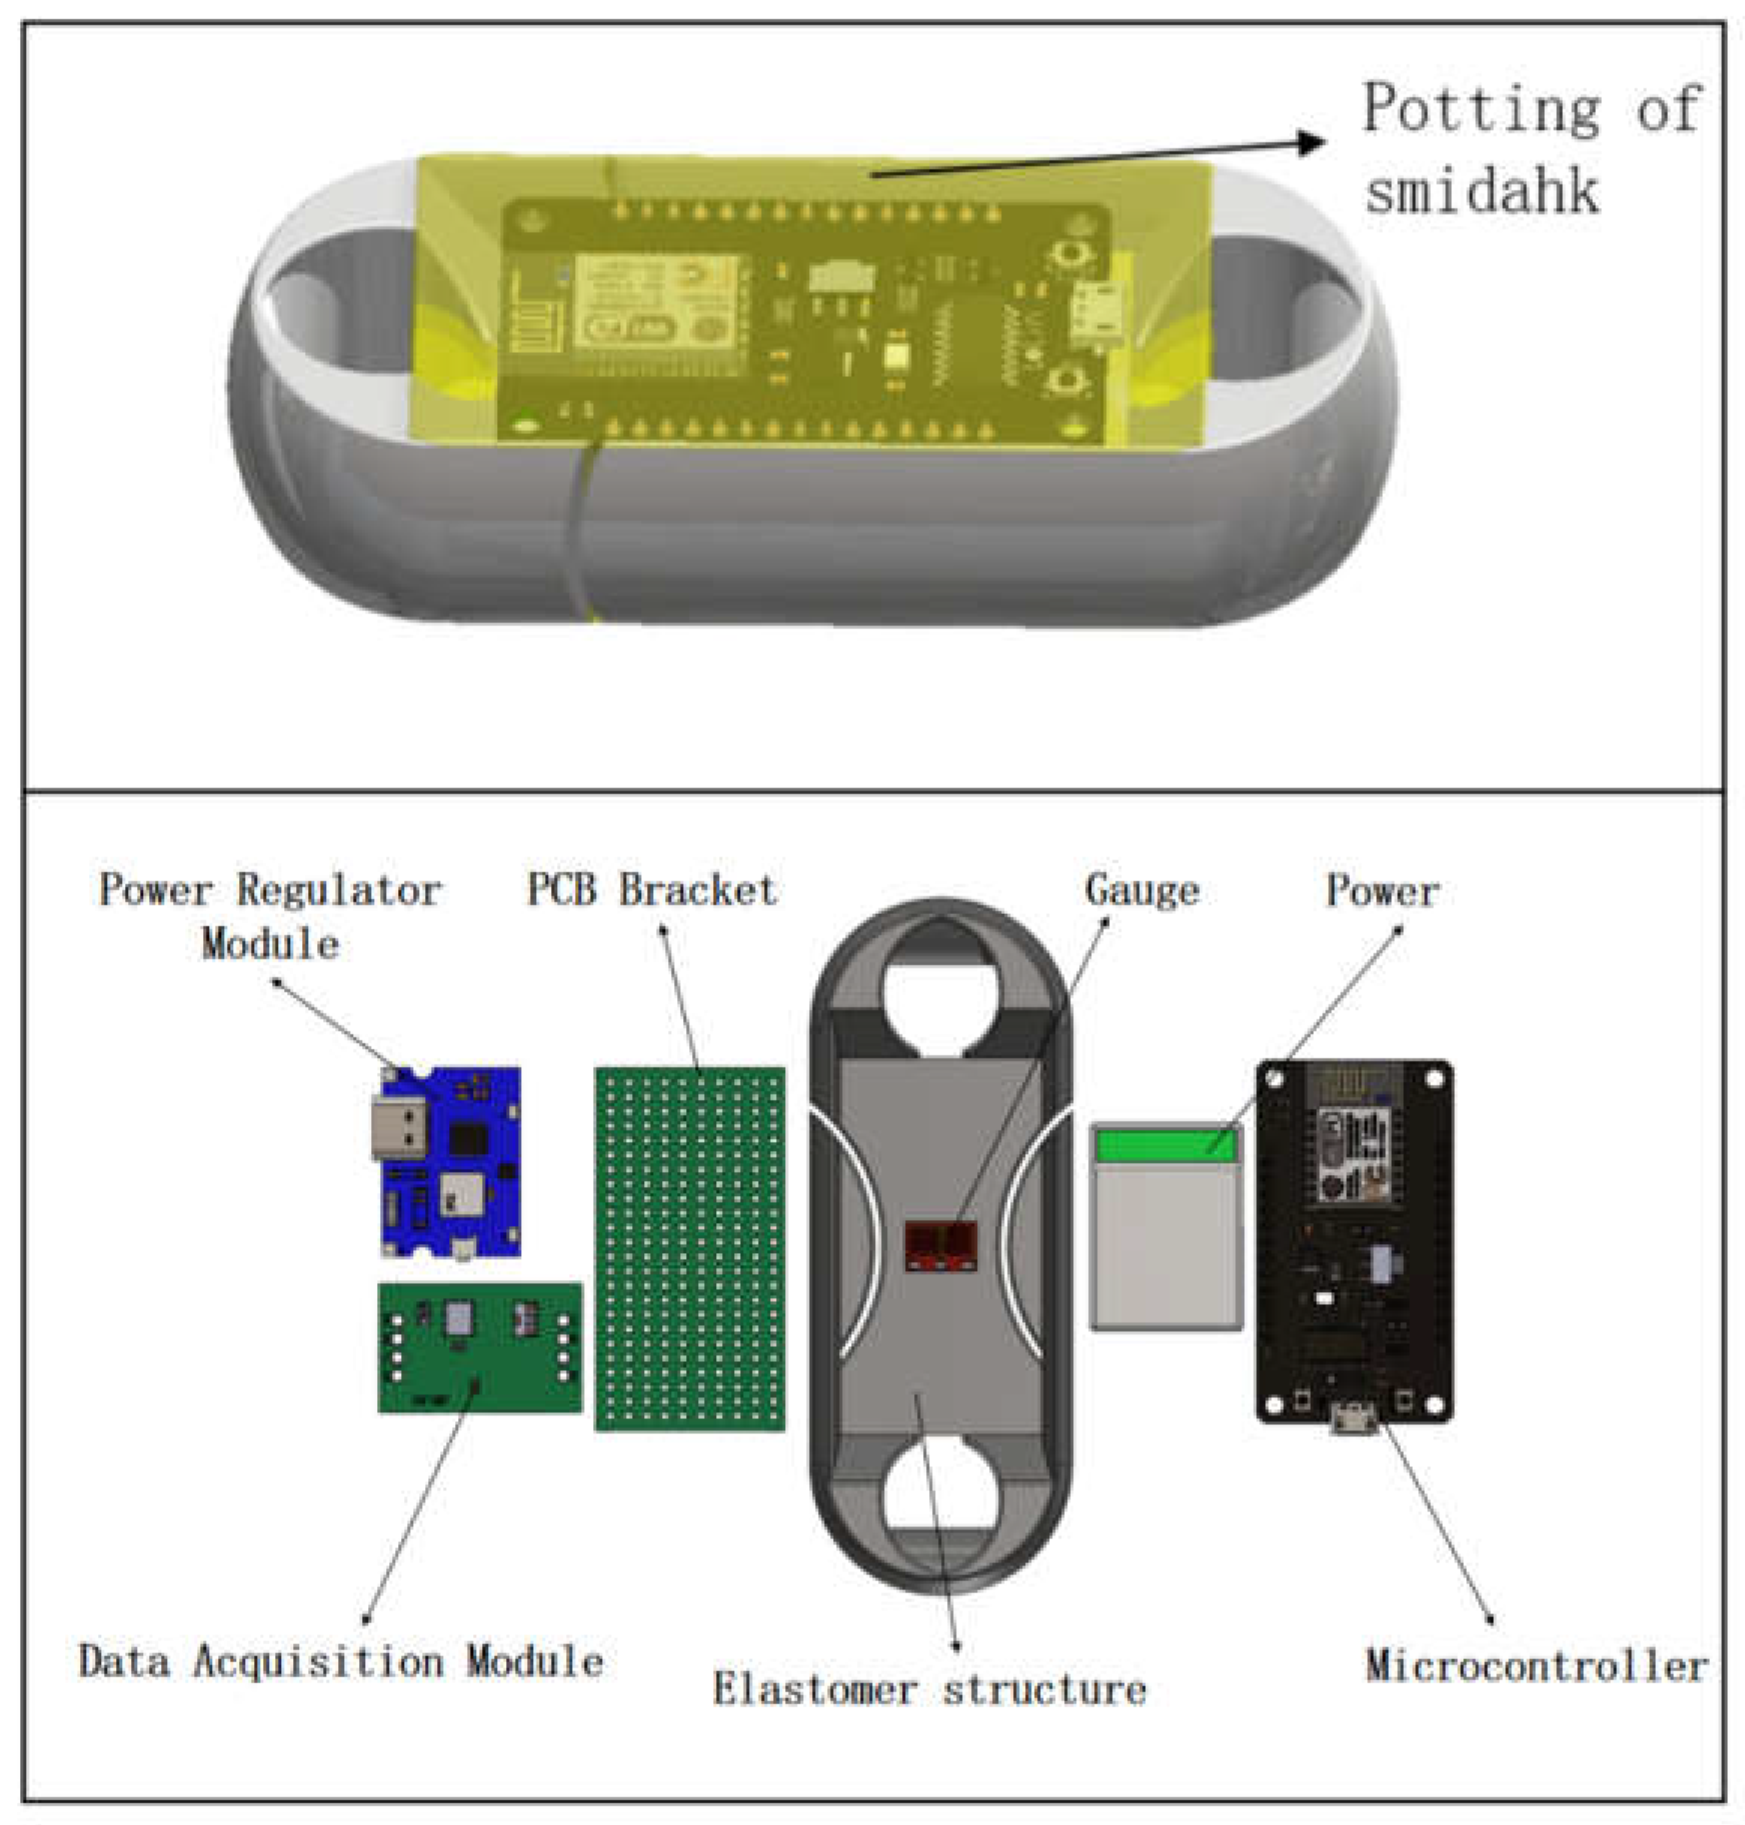
Figure 3.
Parachute Cords Dynamic Load Measuring Instrument R&D Program.
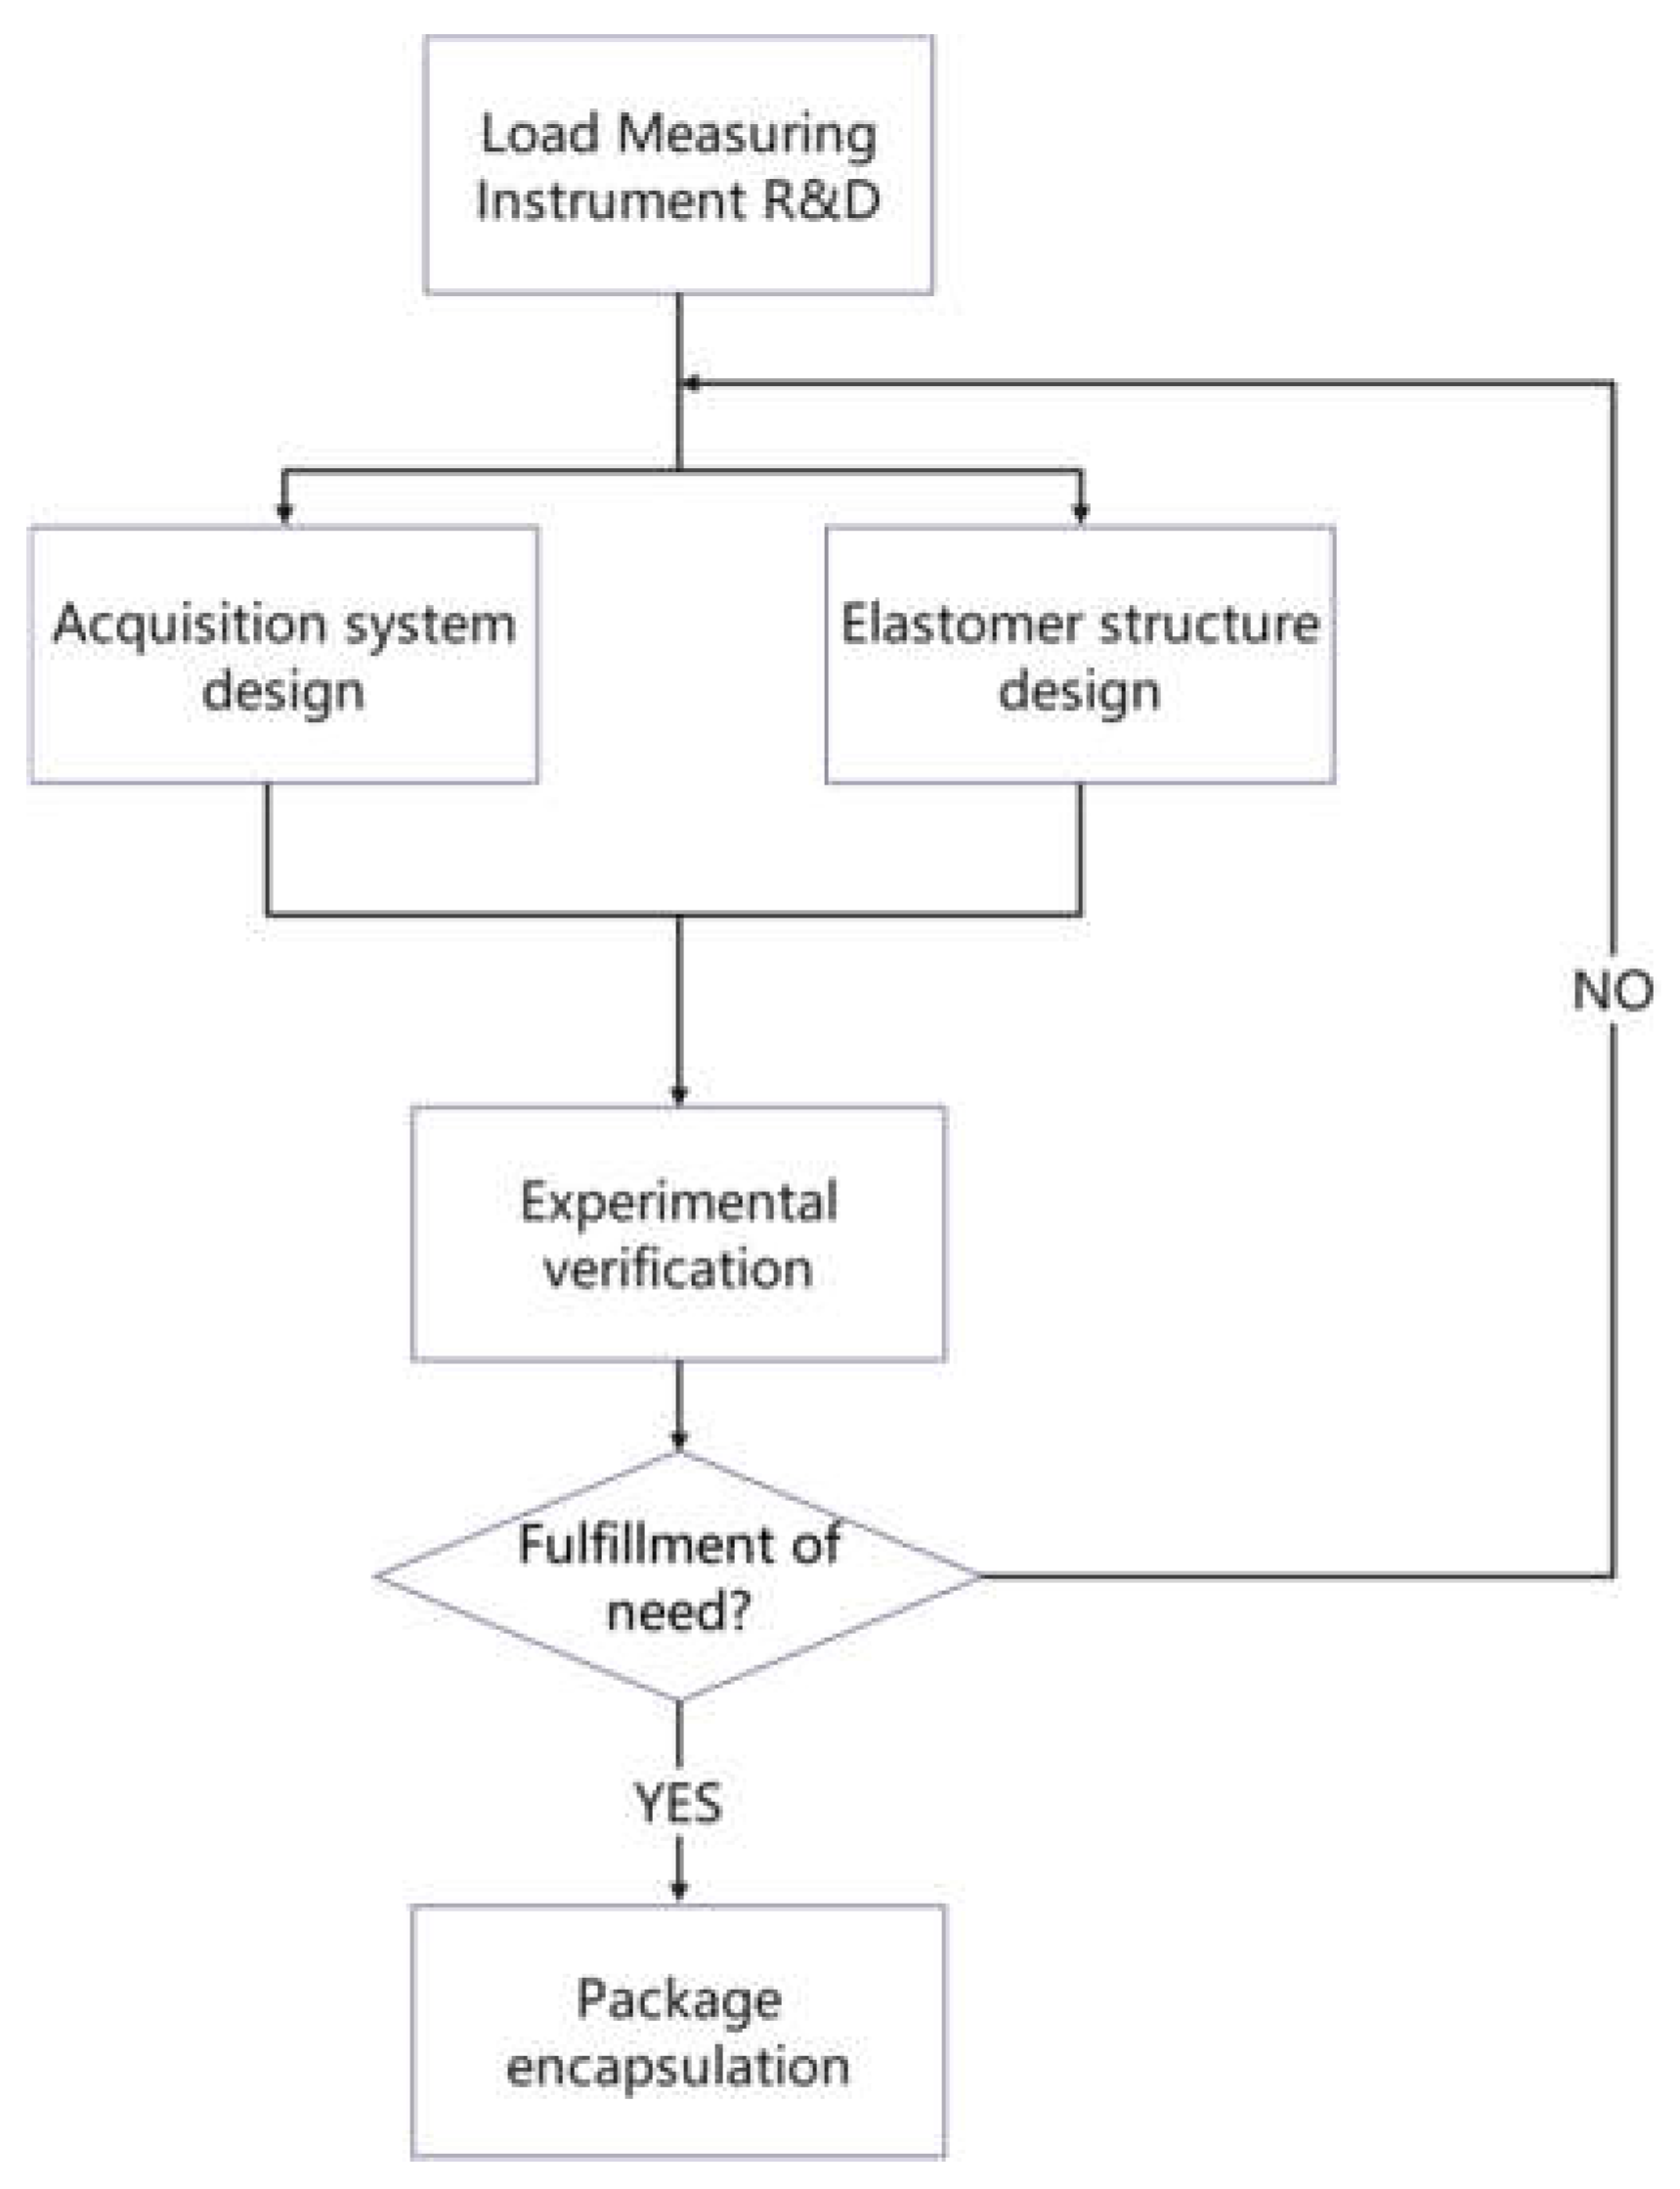
Figure 4.
Design of Elastomer Structure Scheme I.
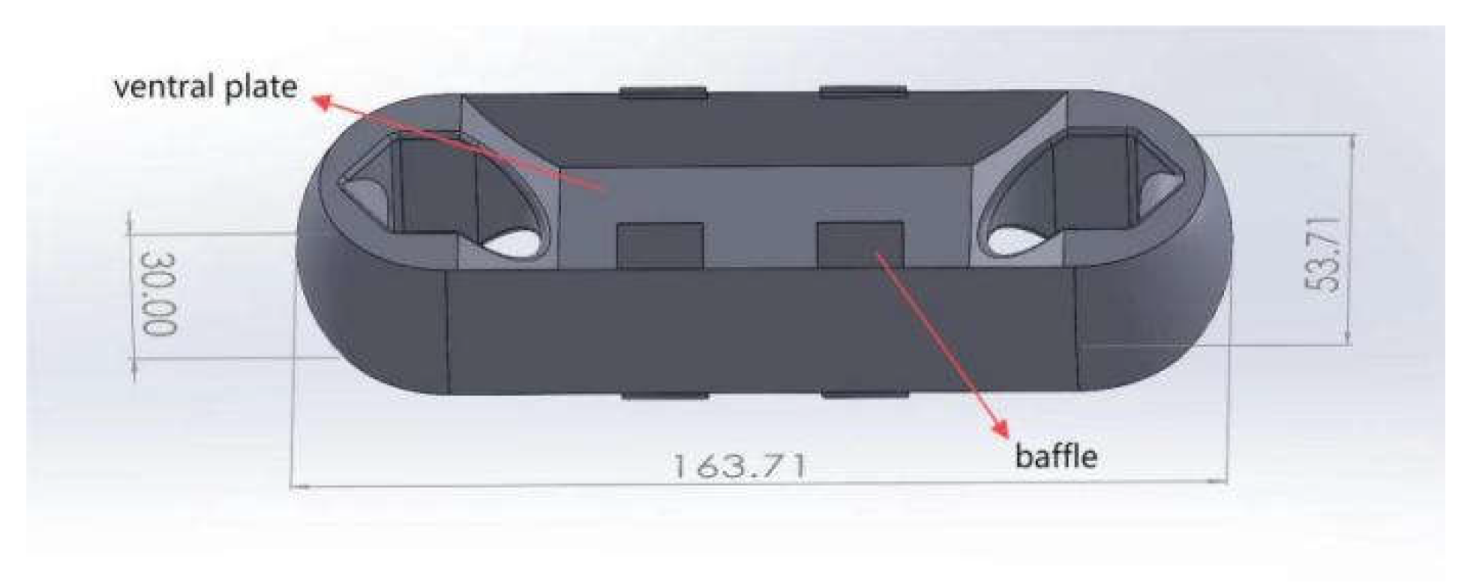
Figure 5.
Strain diagram of Elastomer Structure Scheme I.
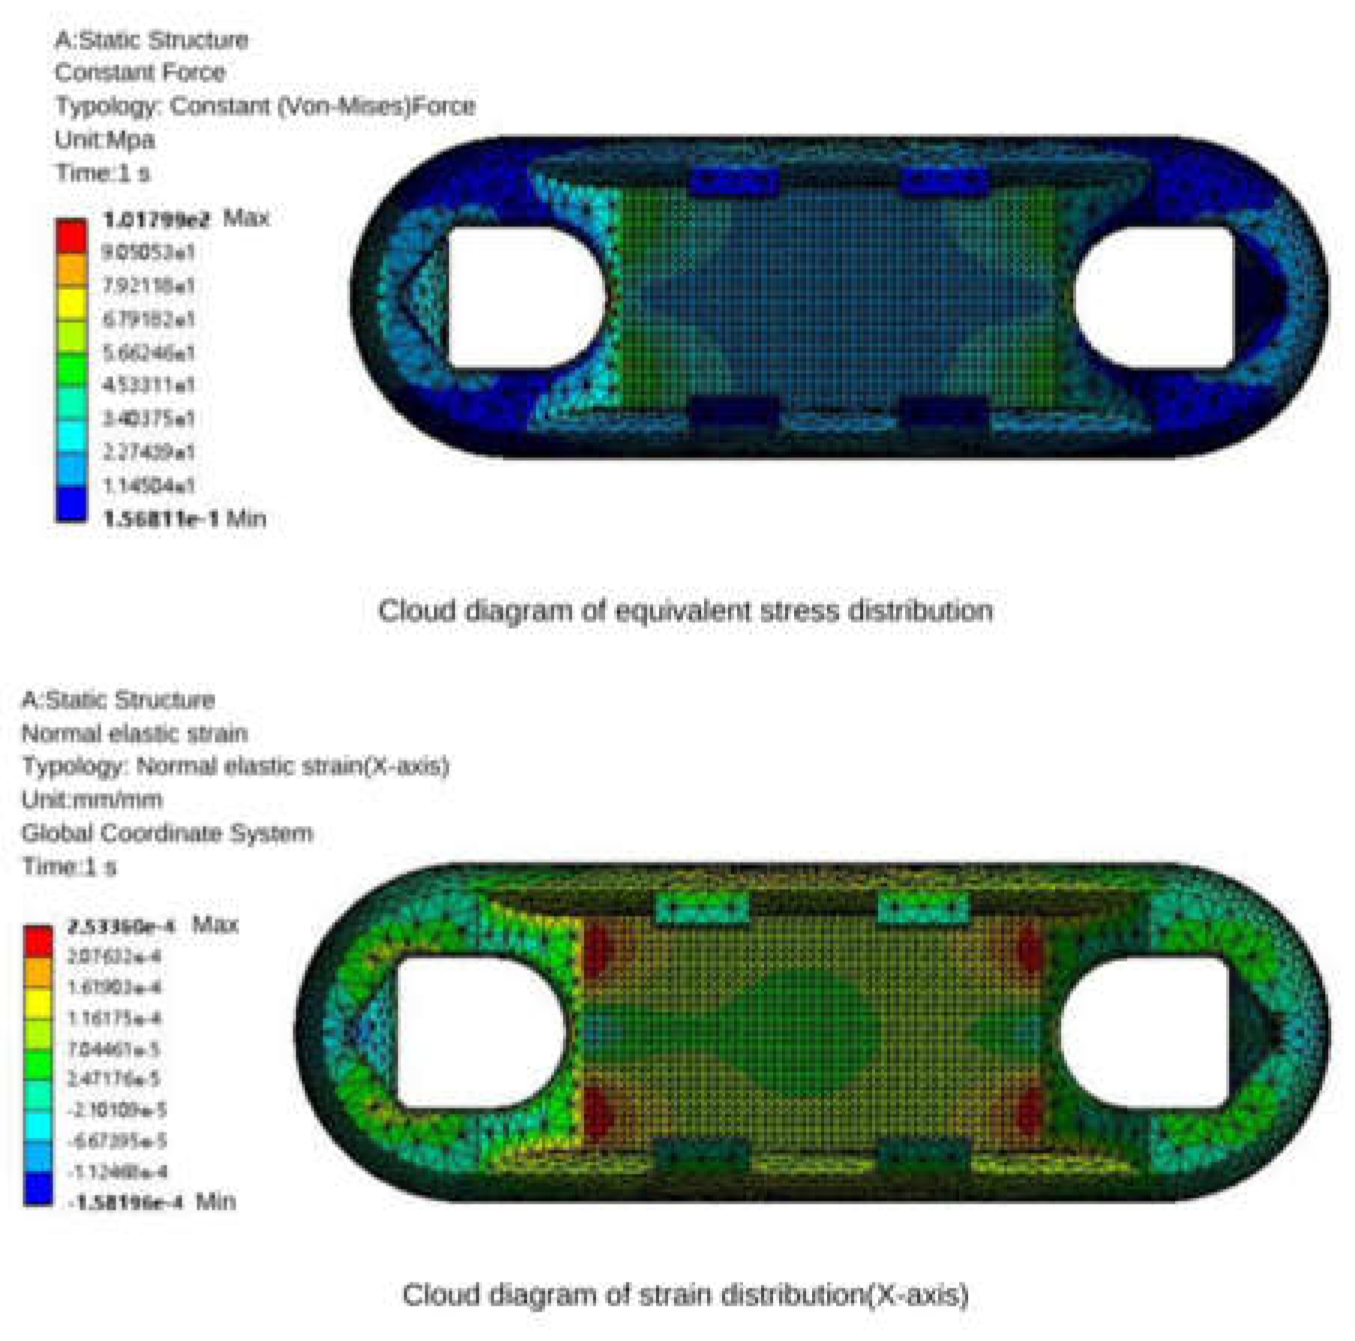
Figure 6.
Elastomer Structure Scheme II.
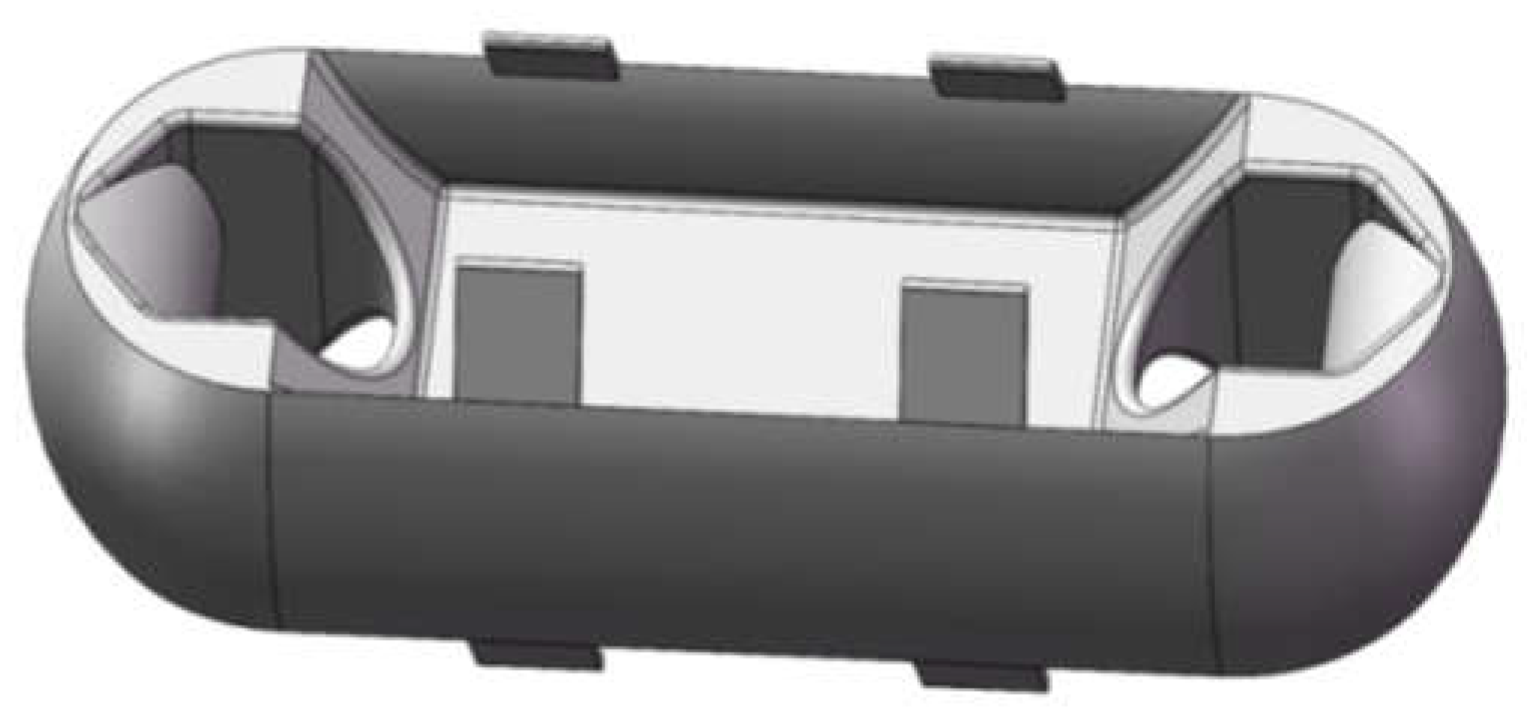
Figure 7.
Elastomer Structure Scheme III.

Figure 8.
Static analysis of elastomer structure scheme II.
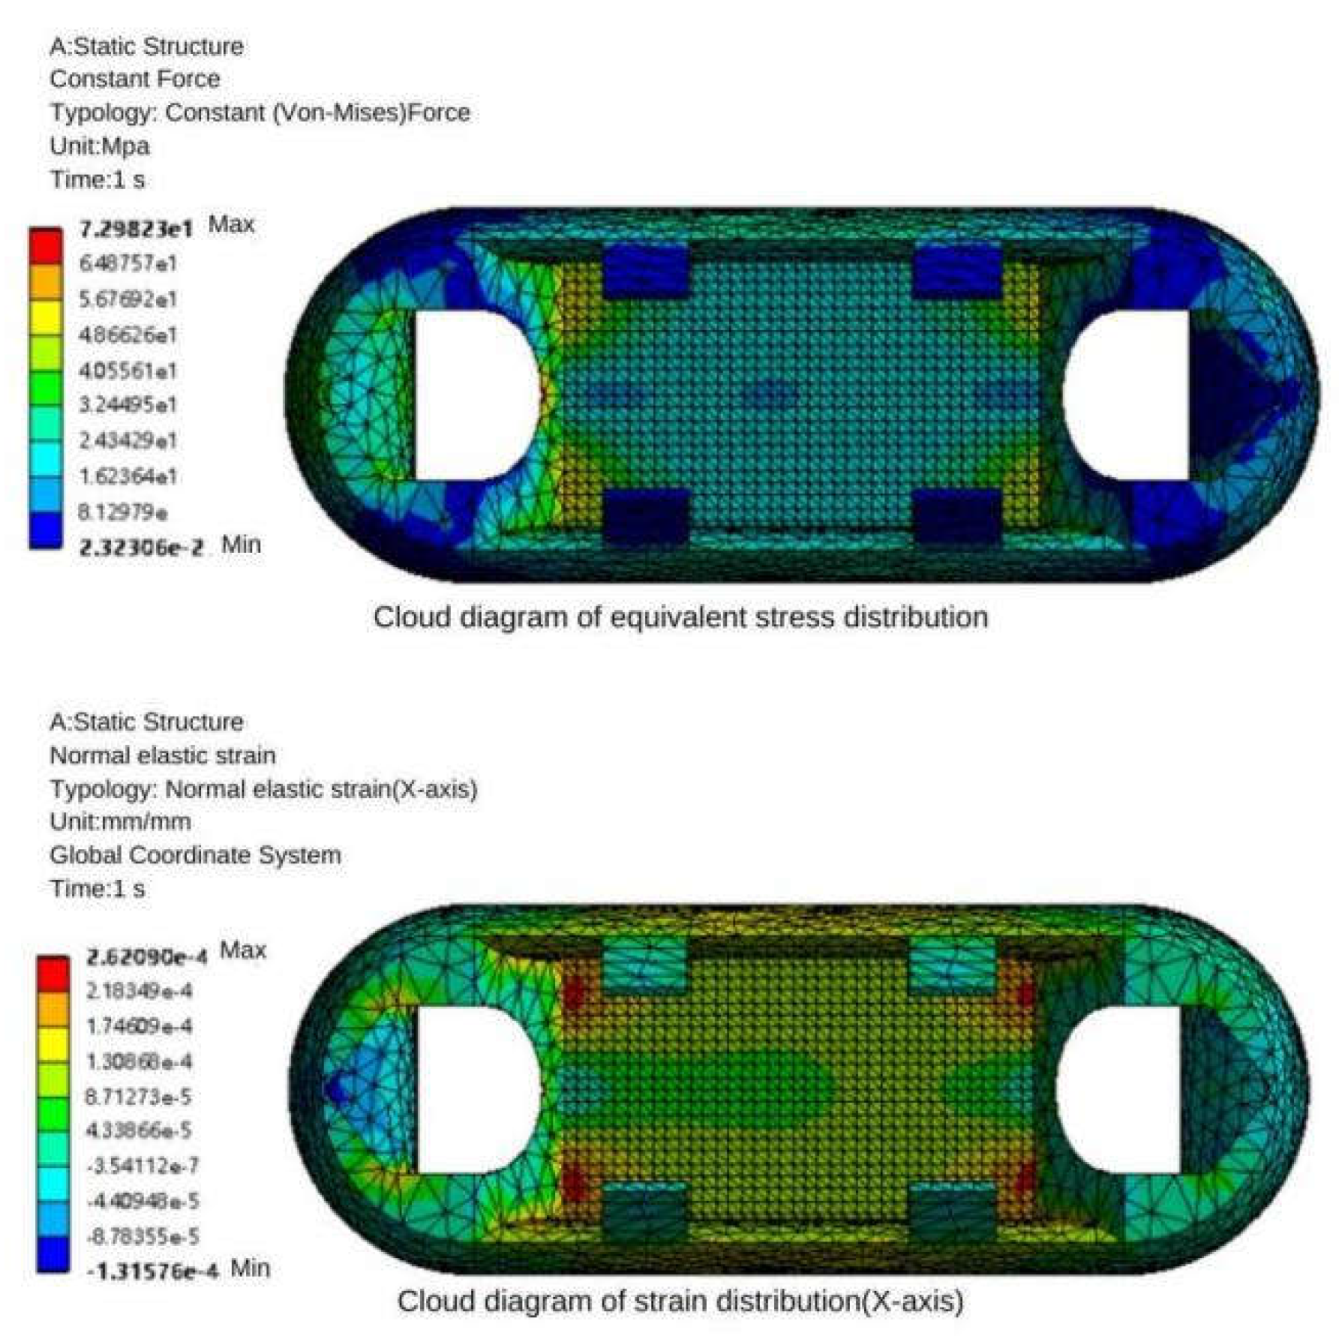
Figure 9.
Static Analysis of Elastomer Structure Scheme III.
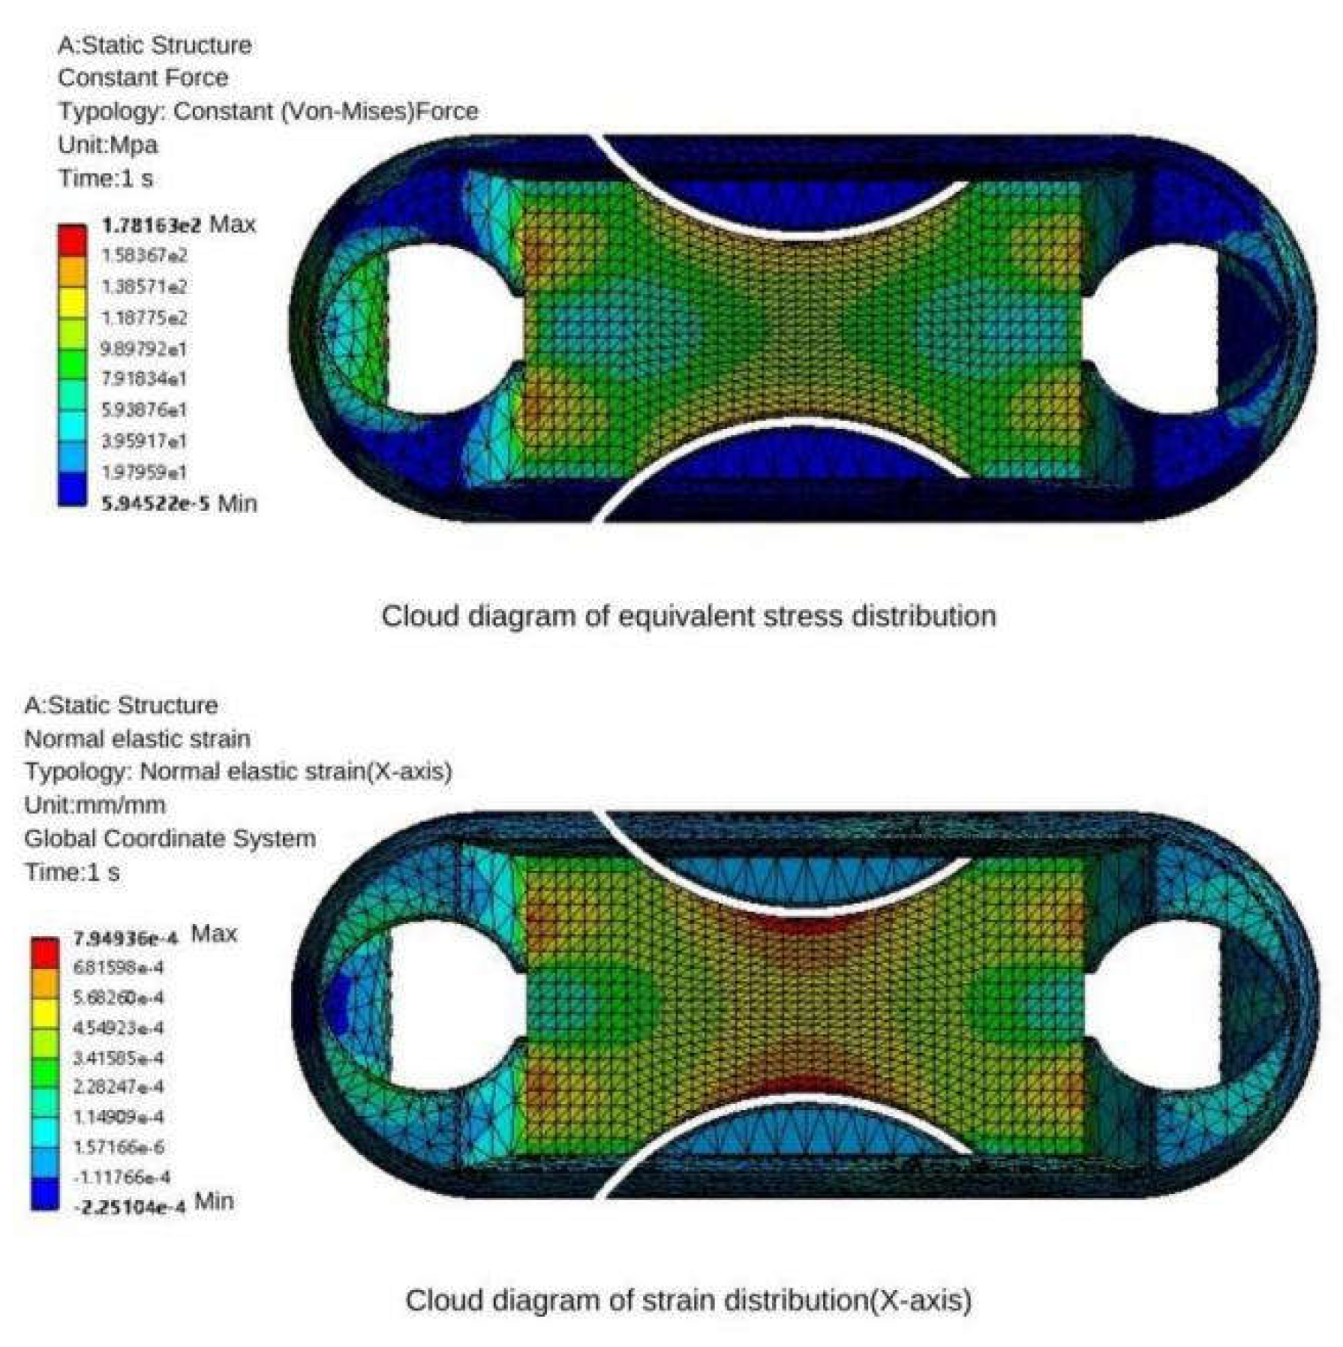
Figure 10.
Strain gage pasting position in elastomer structure scheme II.
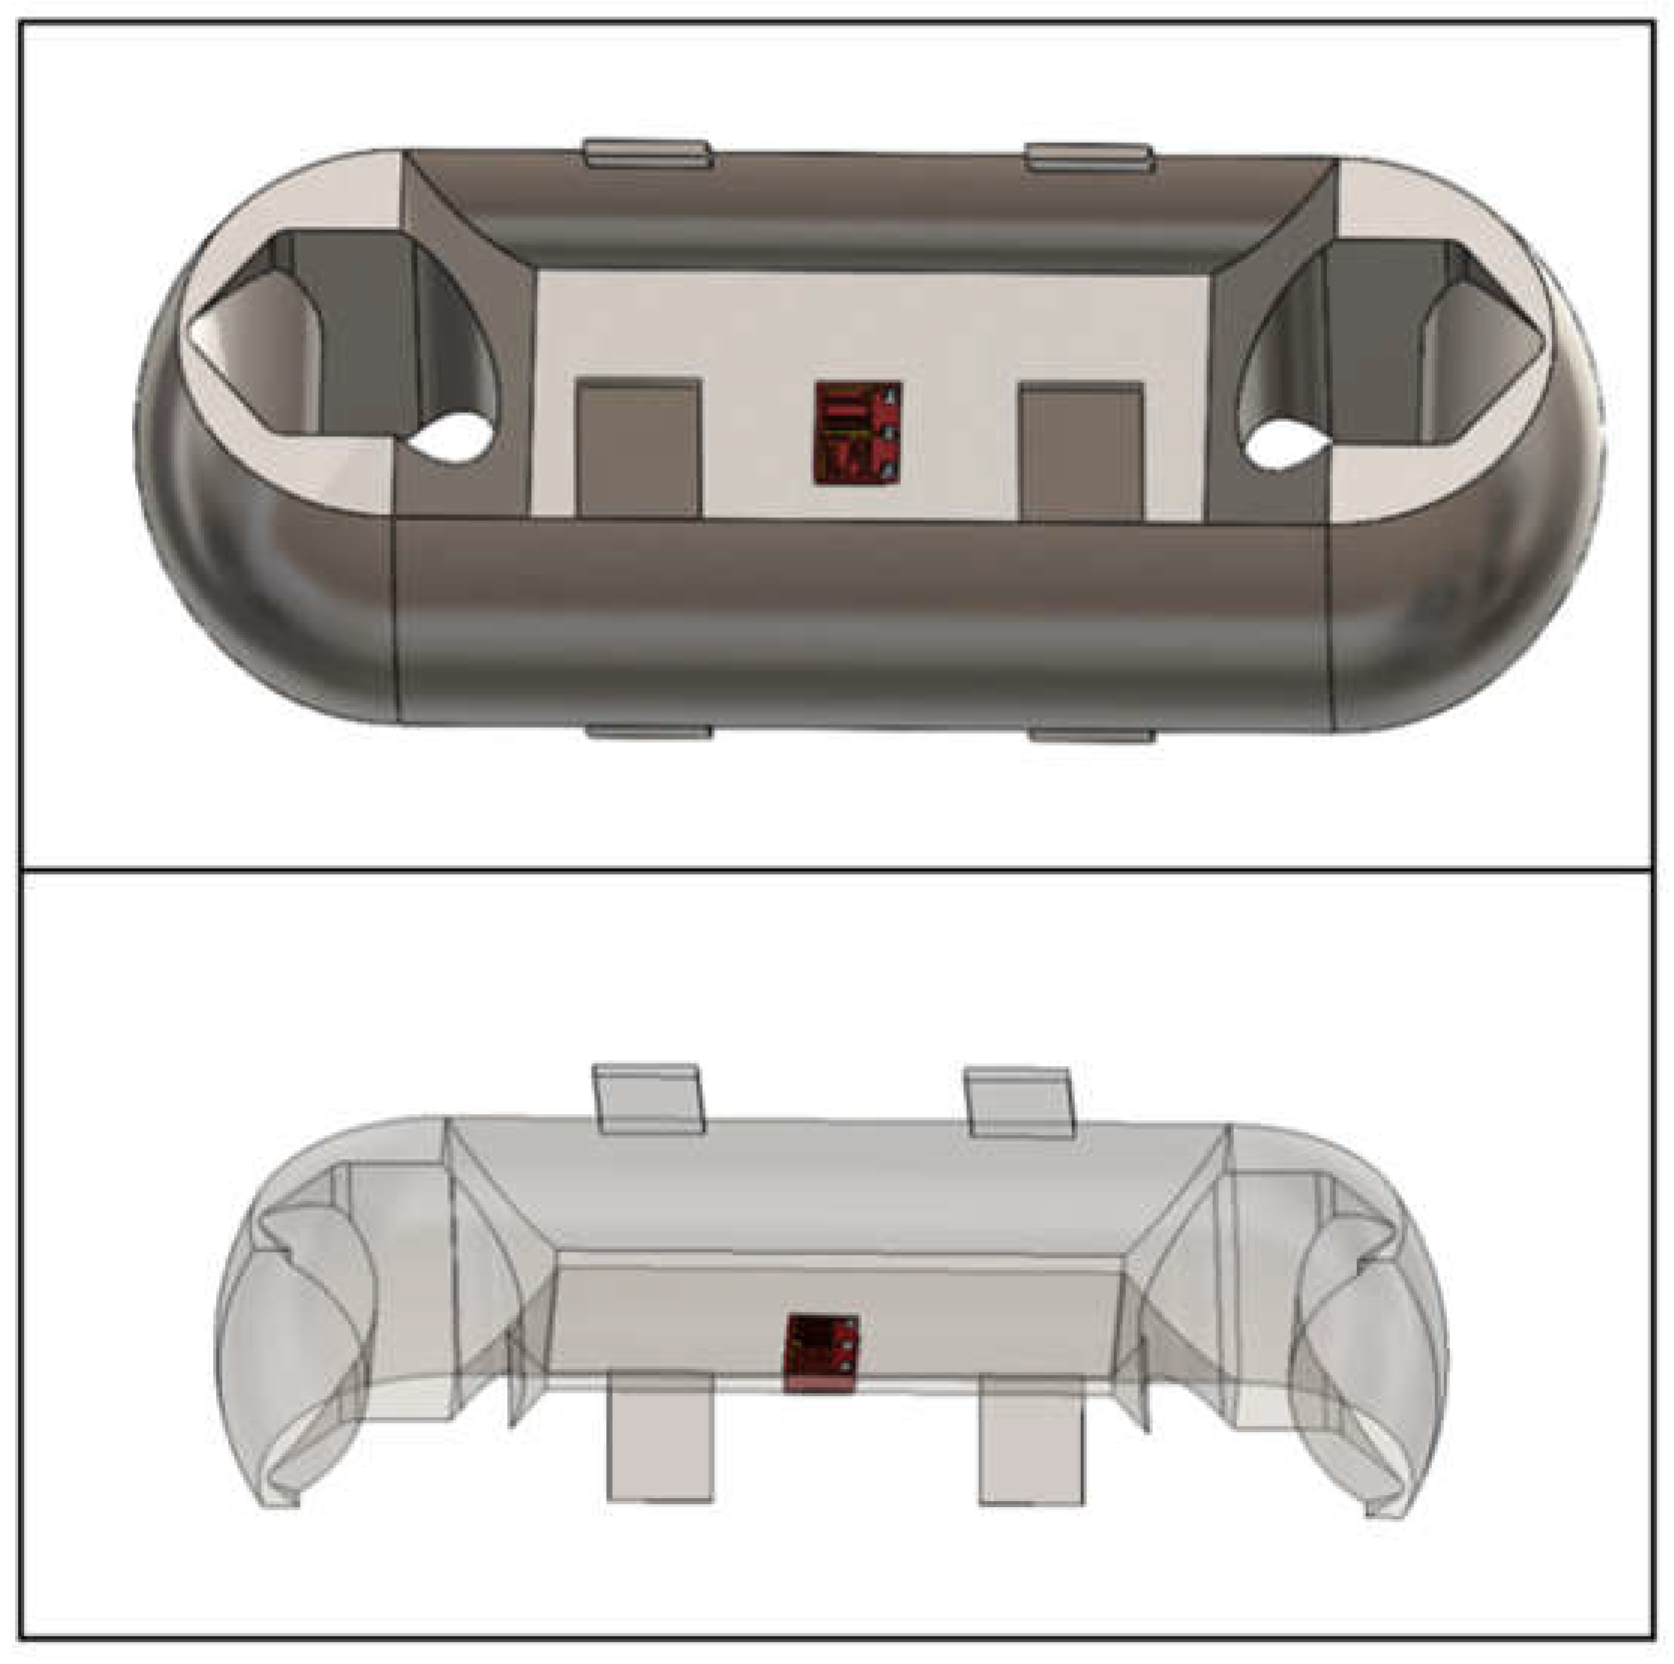
Figure 11.
Strain gage pasting position in elastomer structure scheme III .
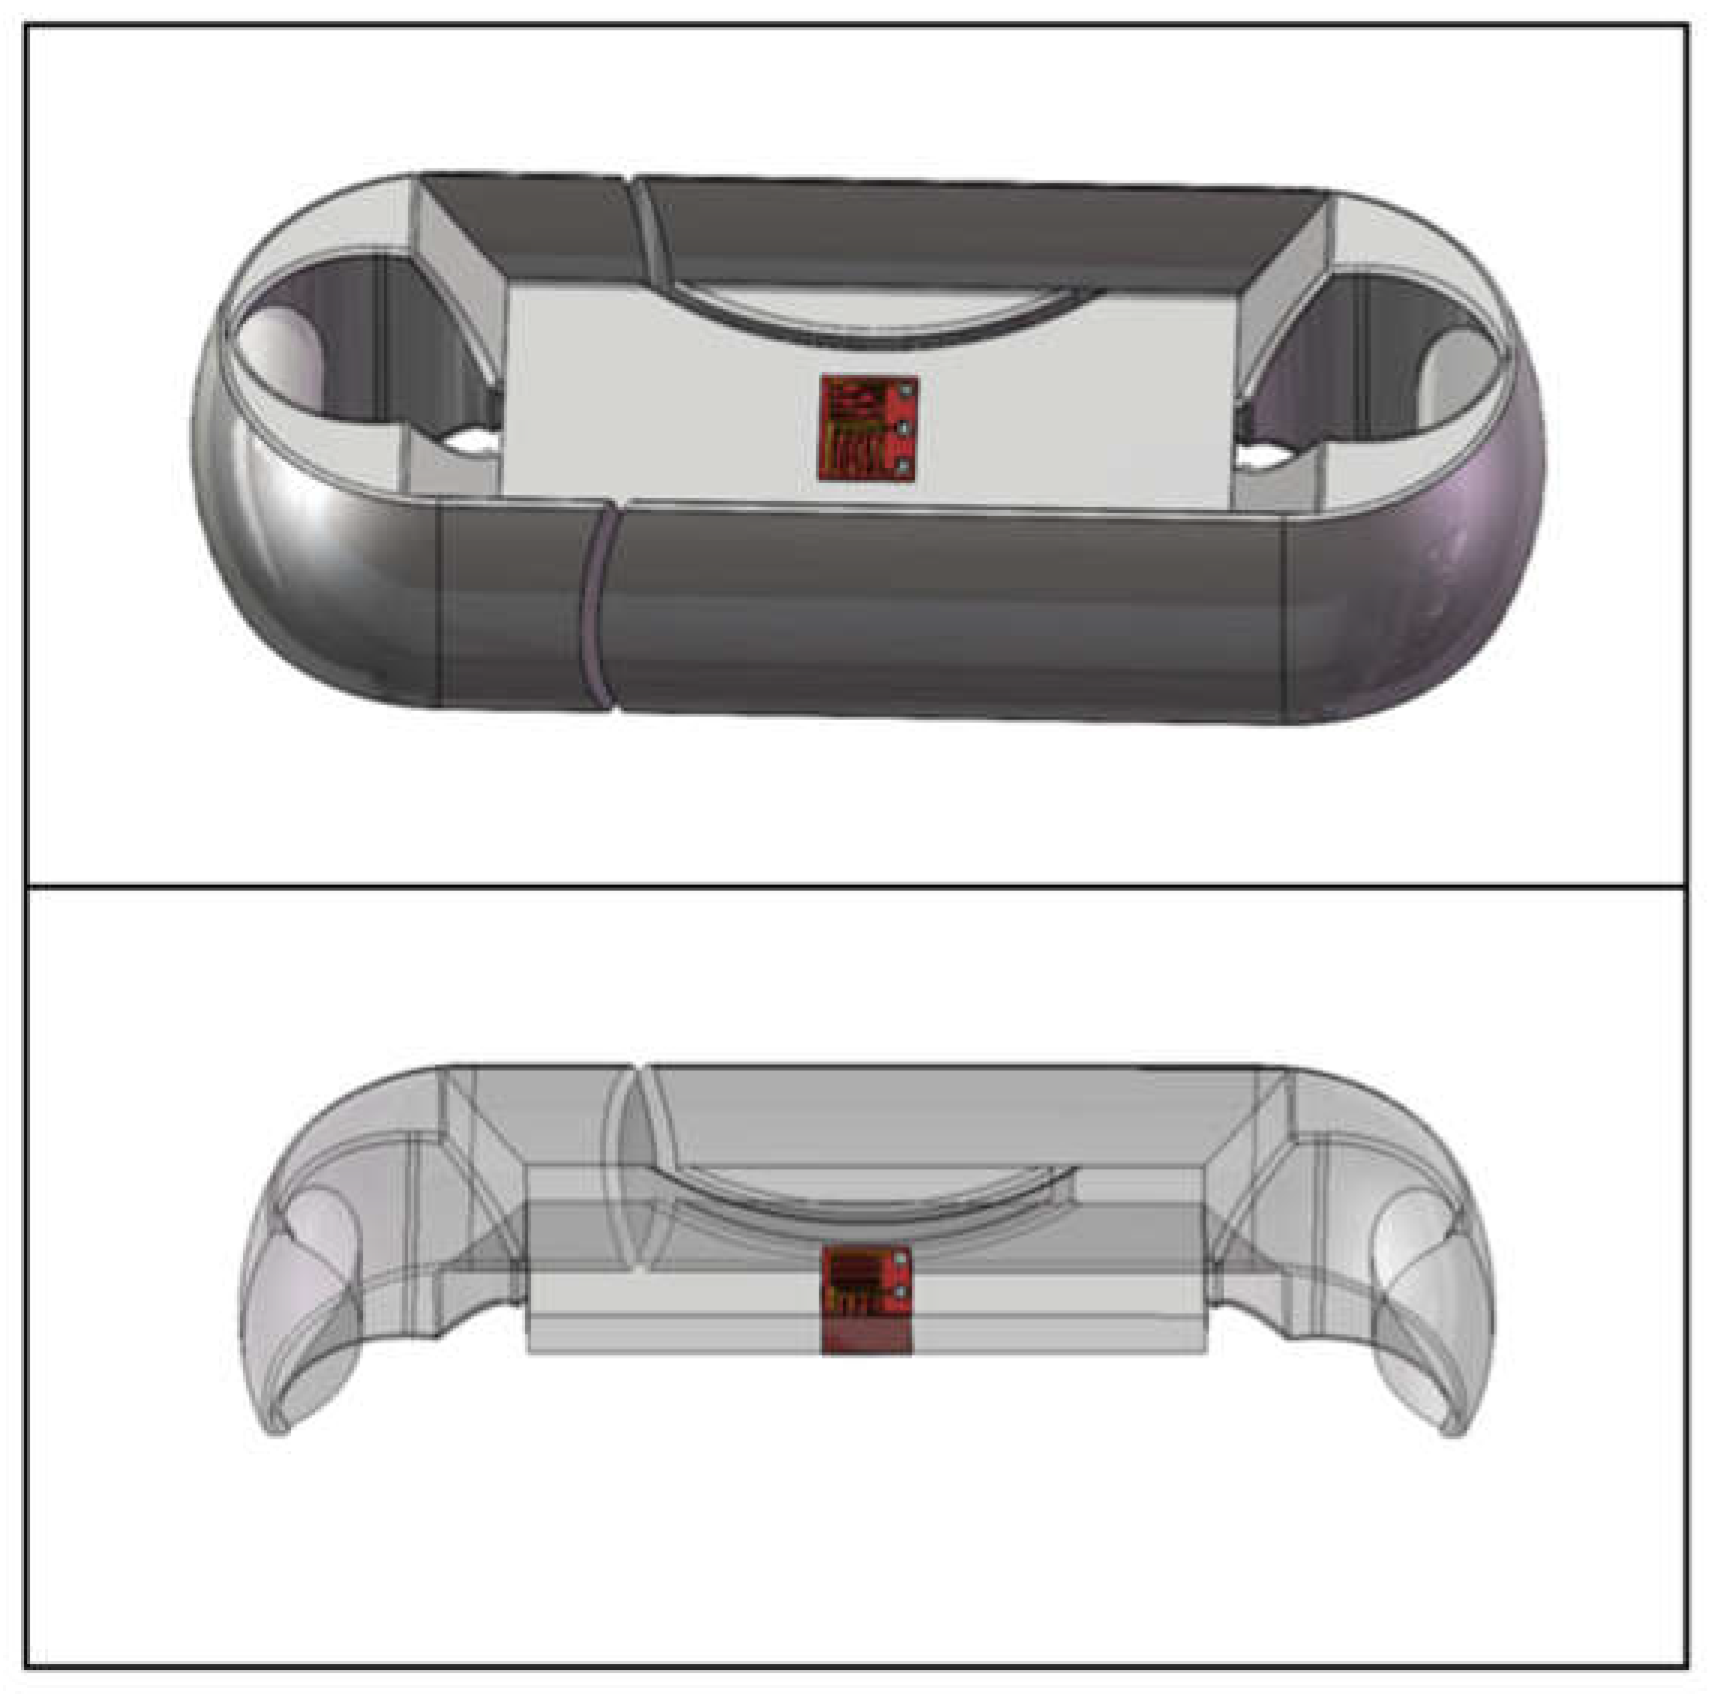
Figure 12.
Axial strain at the center of elastomer structure scheme II and scheme III.
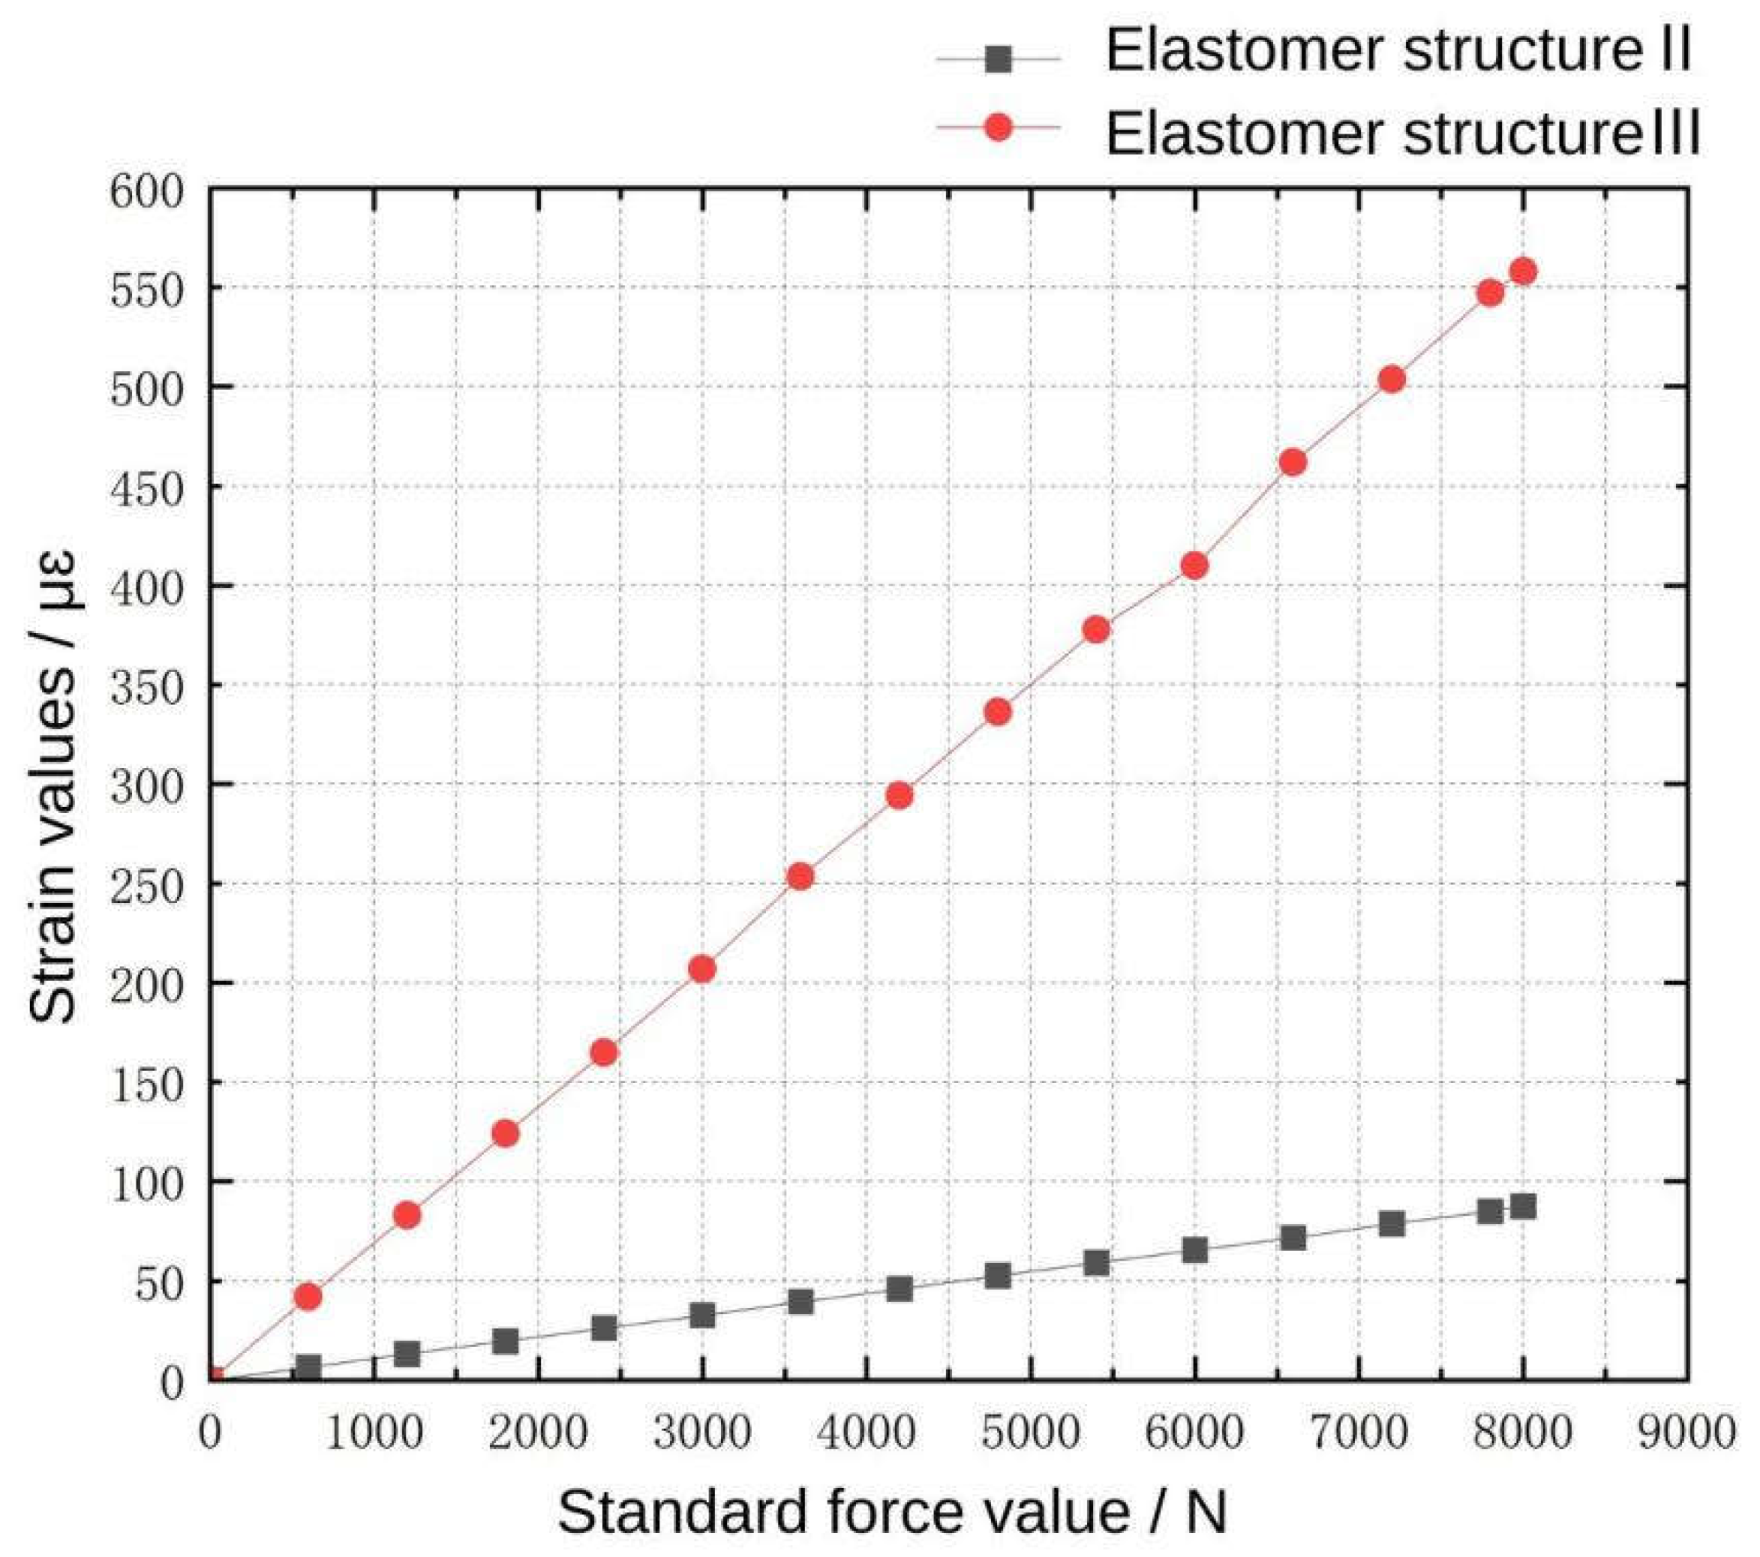
Figure 13.
Schematic diagram of signal acquisition system.
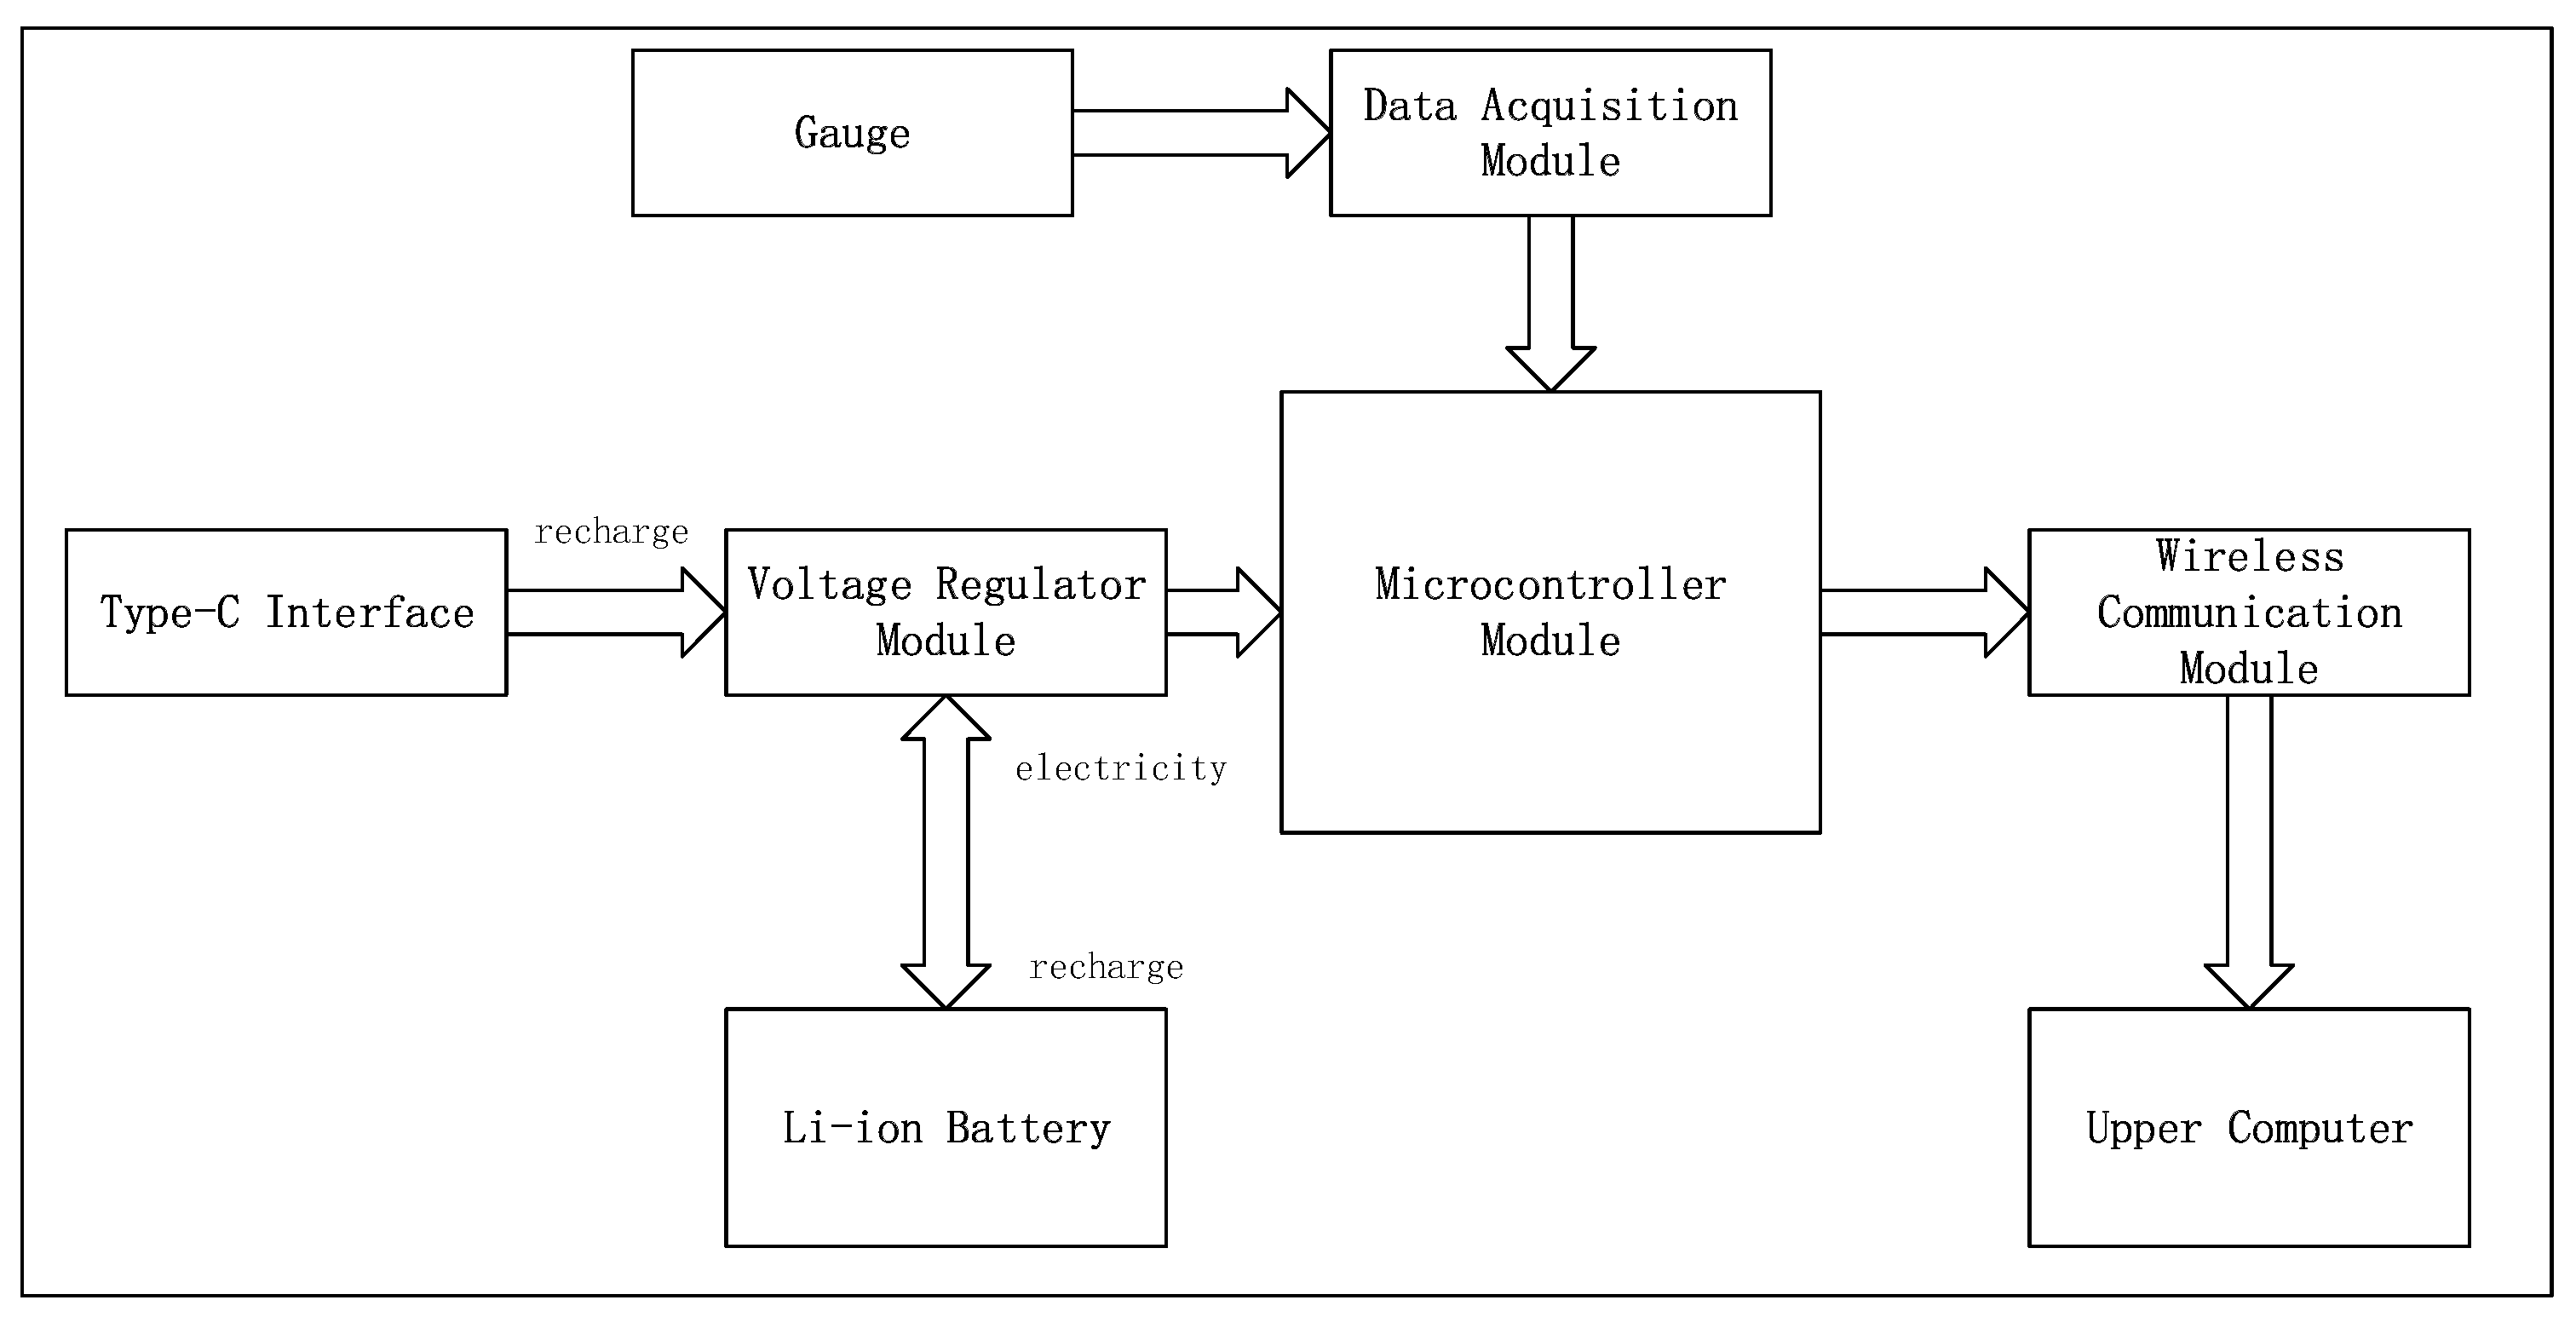
Figure 14.
Photos of signal acquisition system hardware module Ⅰ.
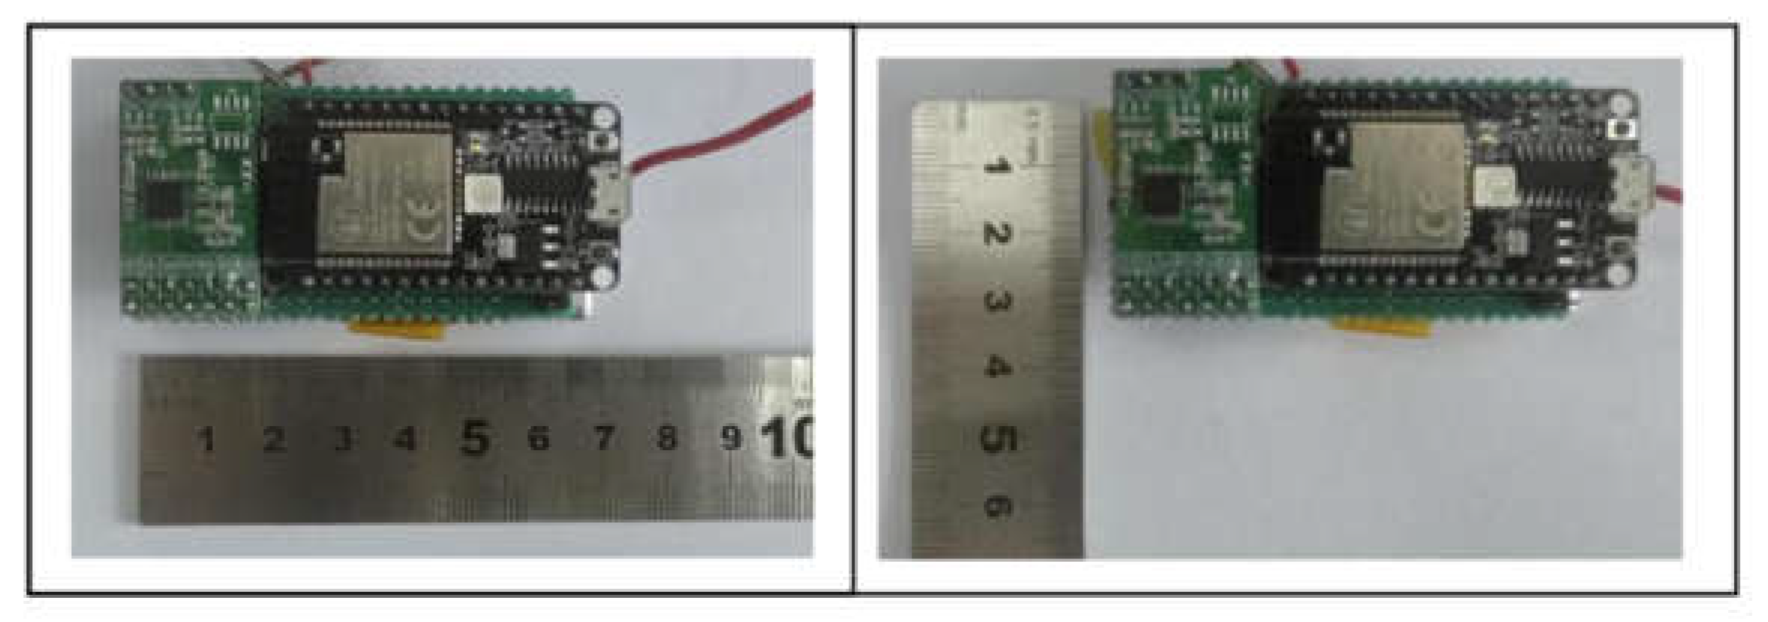
Figure 15.
Signal acquisition system software interface.
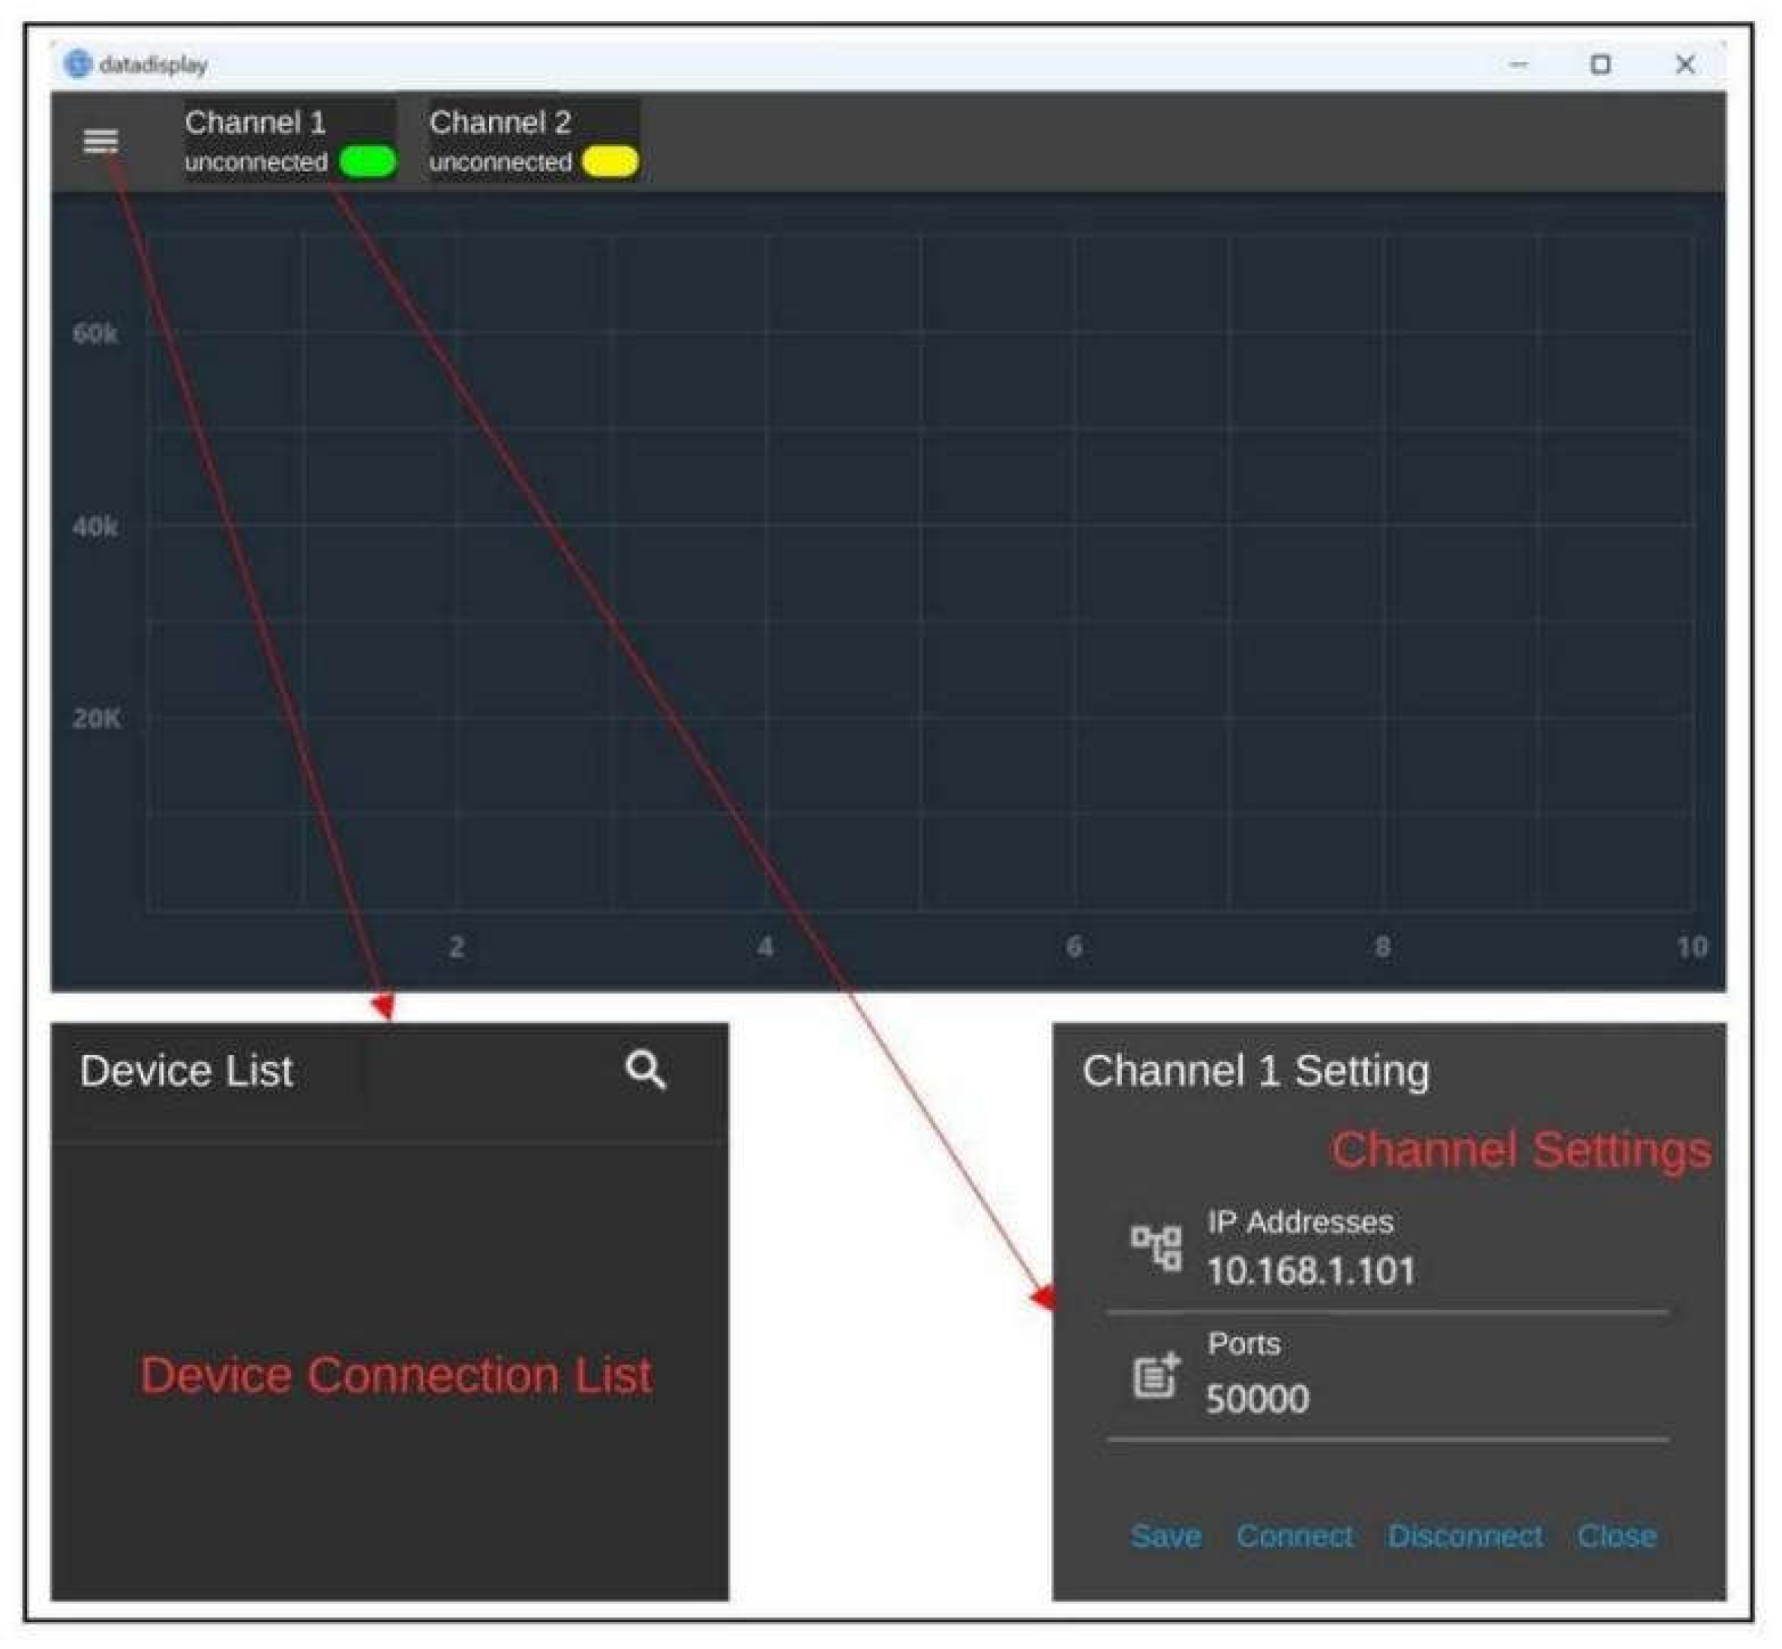
Figure 16.
Upper computer software displaying waveforms.
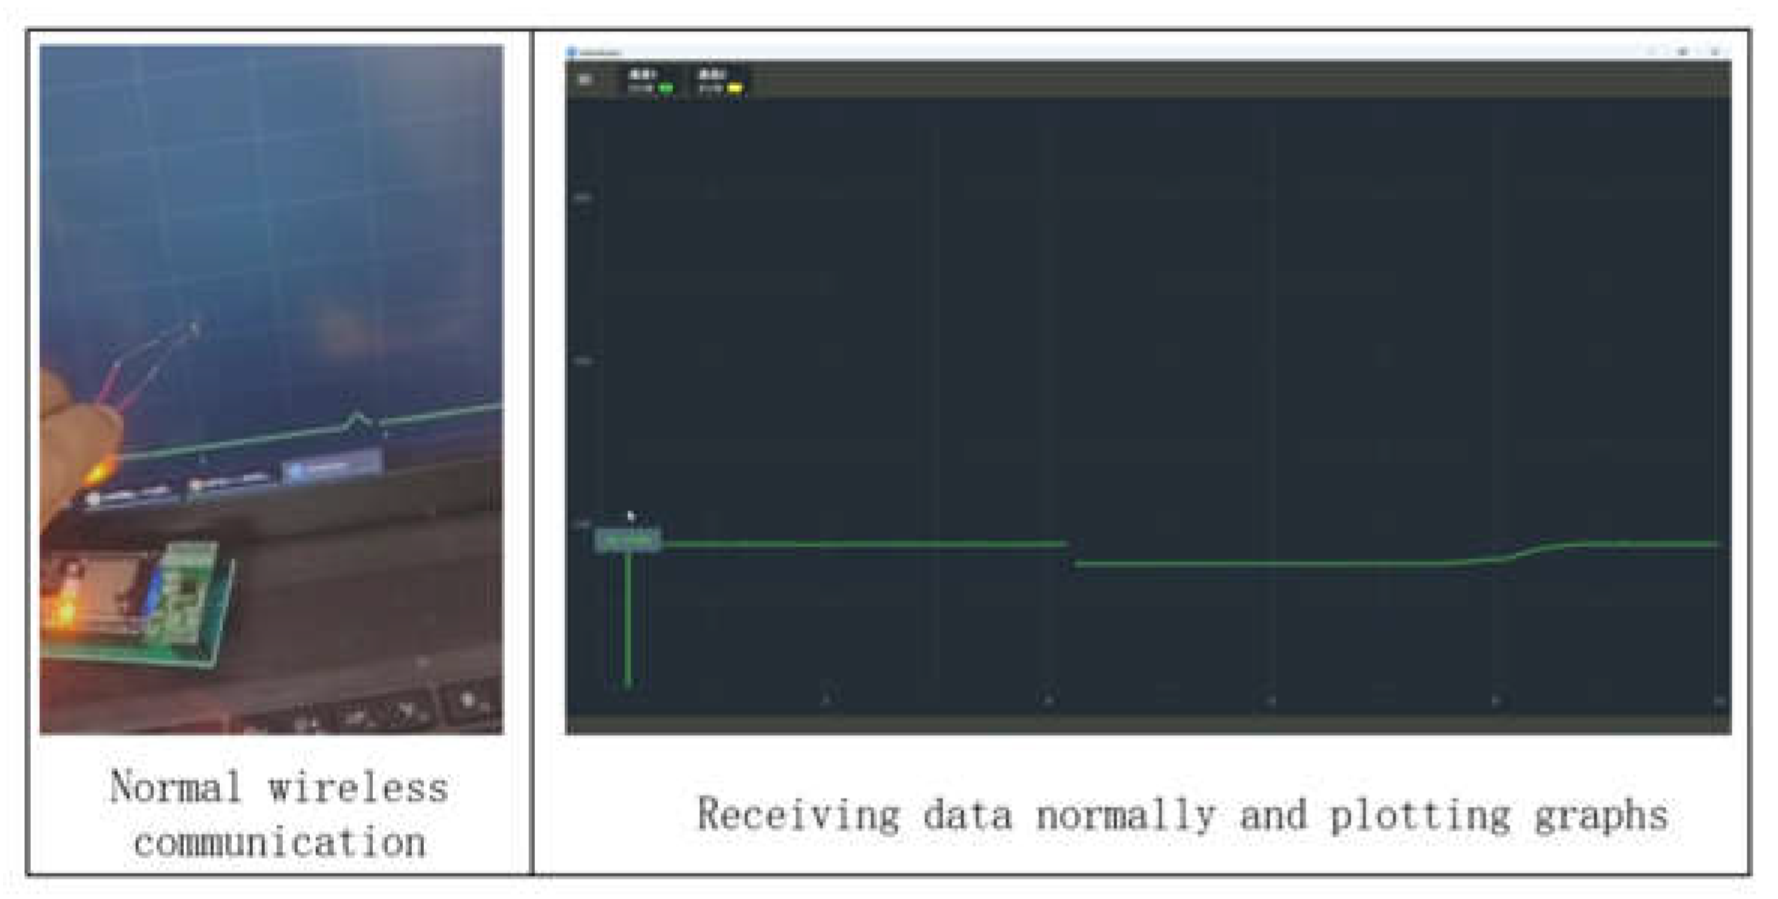
Figure 17.
Photos of signal acquisition system hardware module Ⅱ.
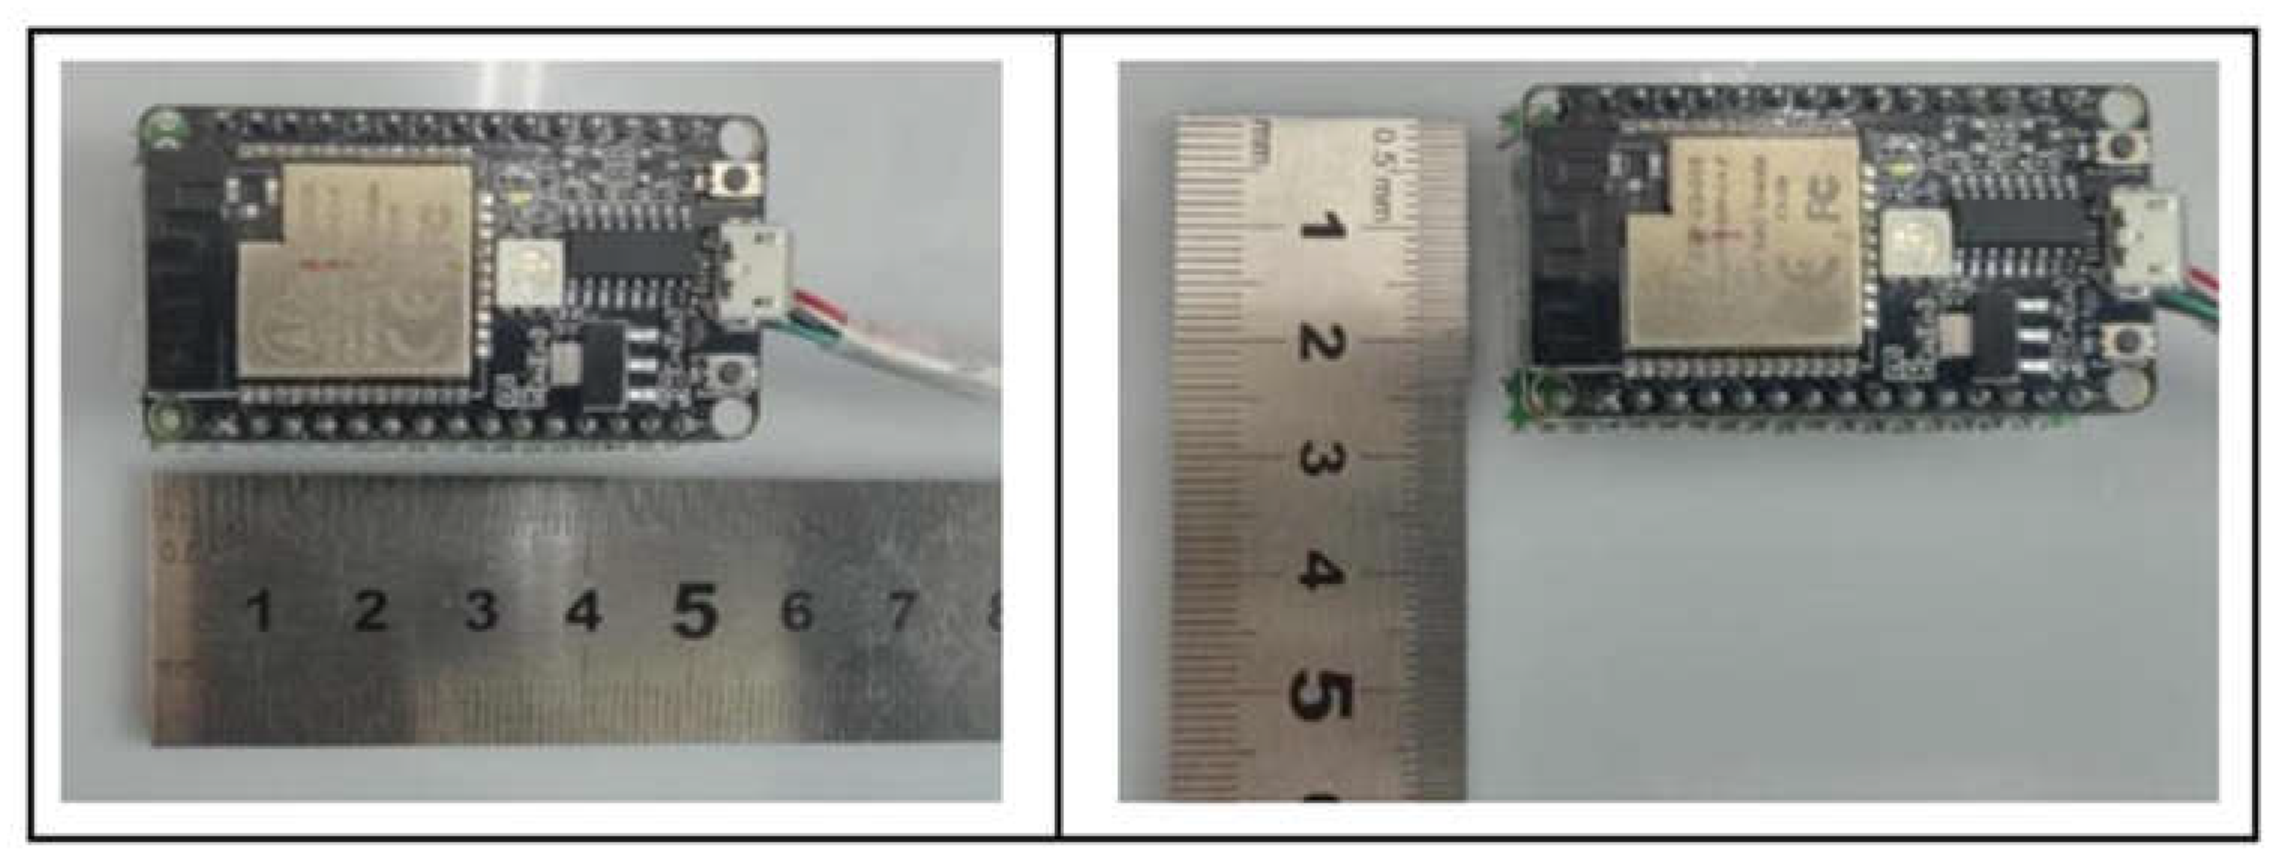
Figure 18.
Comparison of the signal acquisition system hardware before and after optimization.
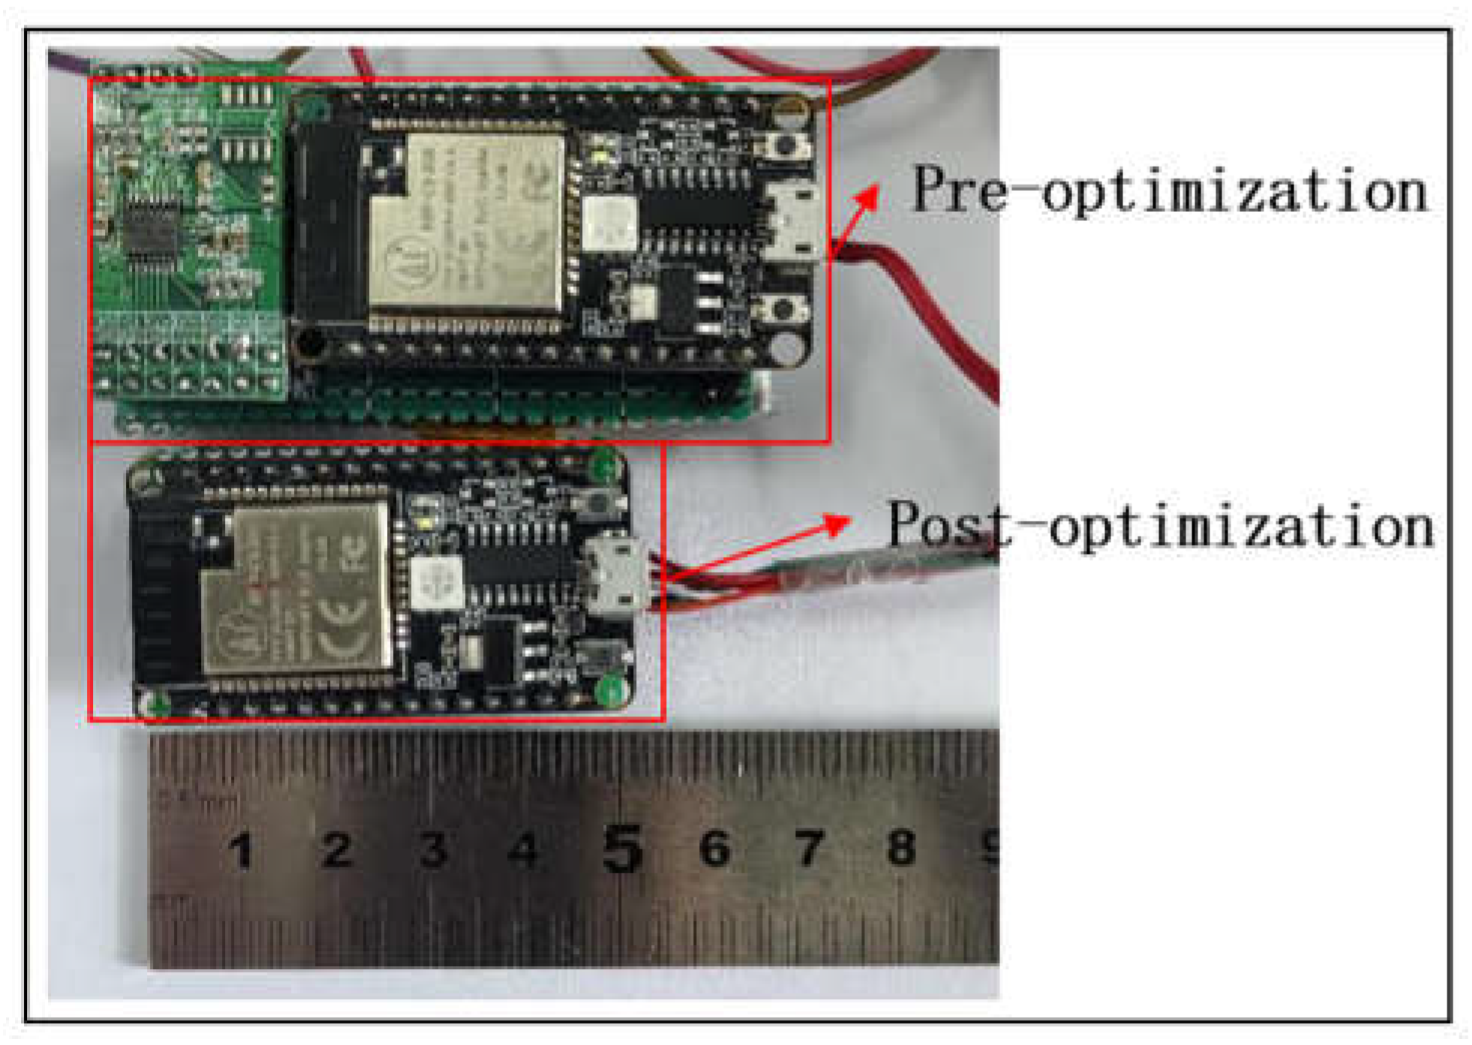
Figure 19.
Upper computer software main interface area division.
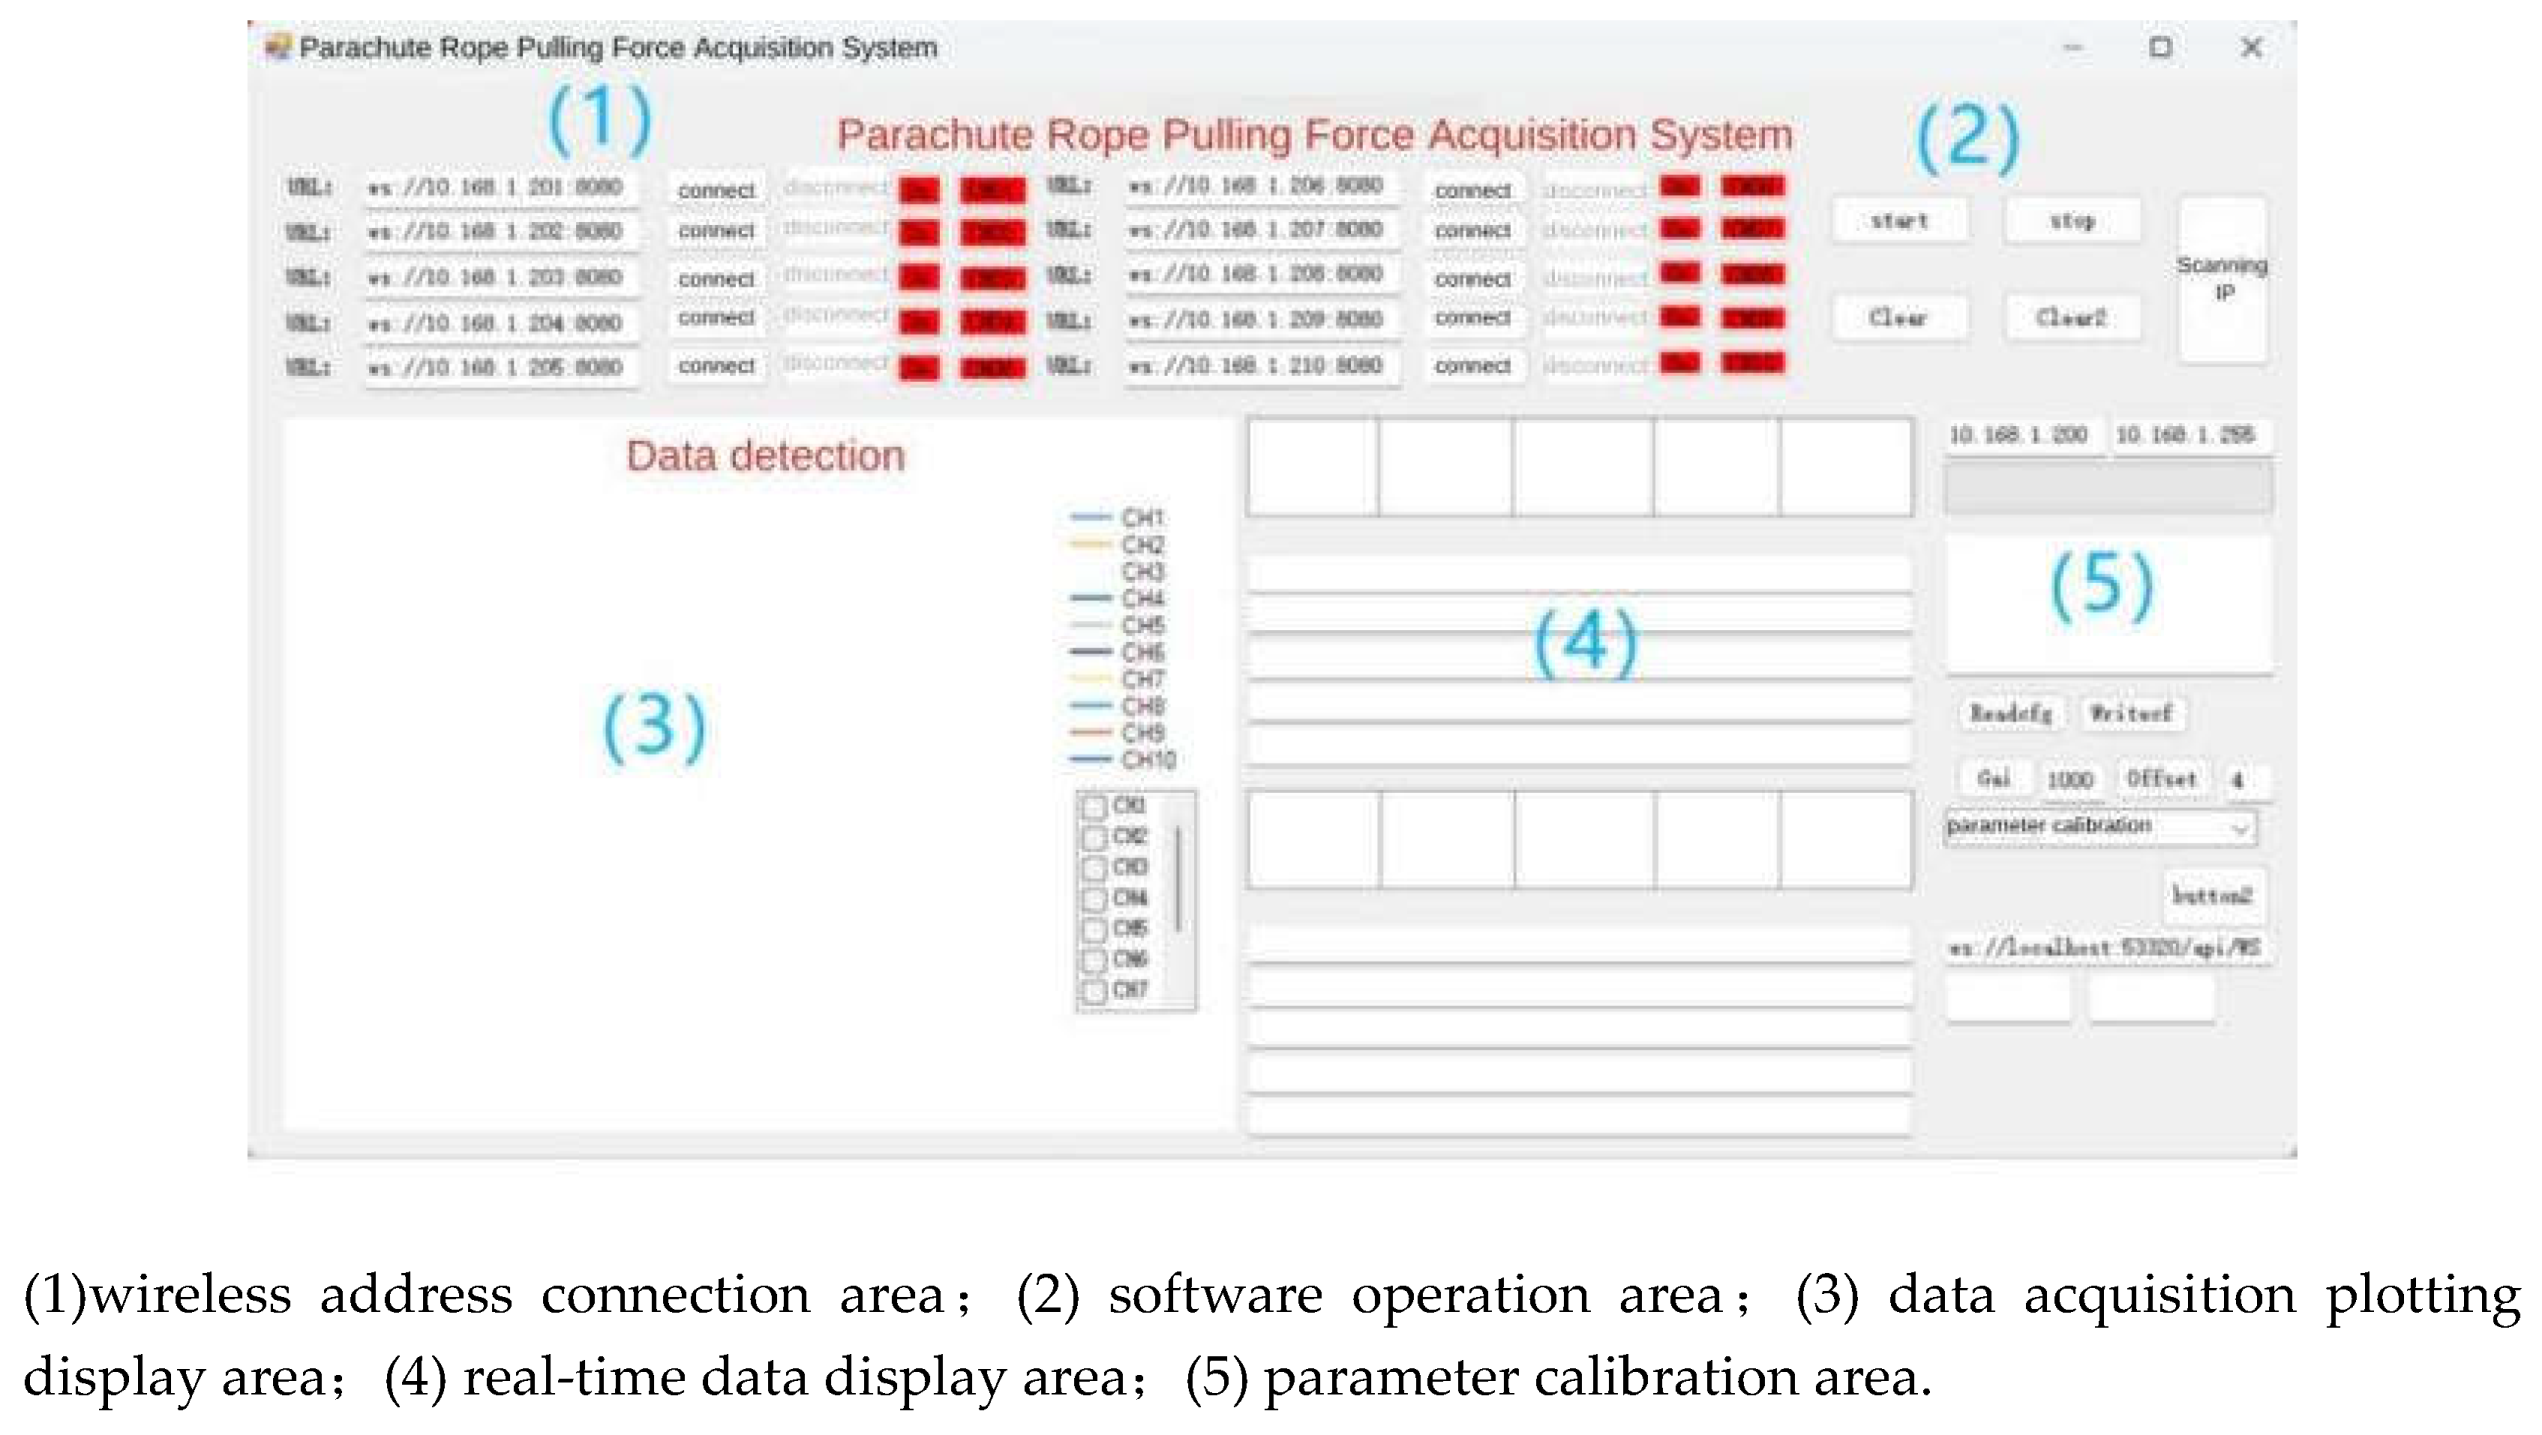
Figure 20.
Miniature measuring instrument fixed to the elastomeric structure.
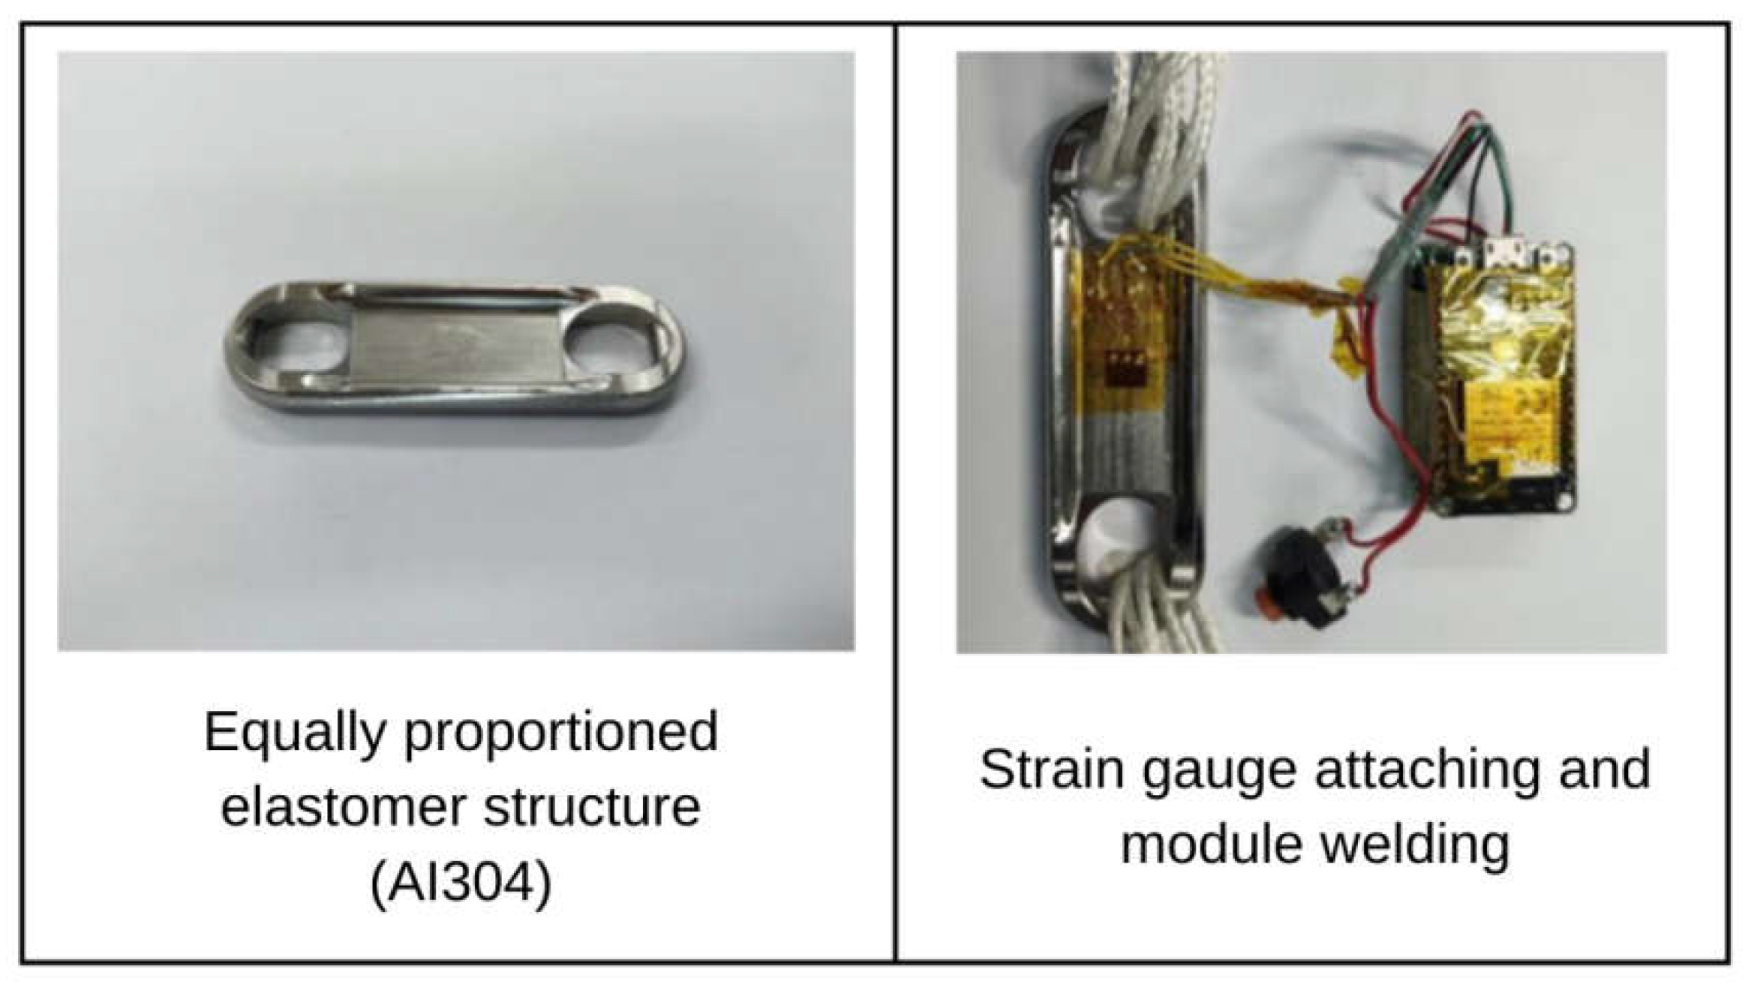
Figure 21.
Signal acquisition system module Ⅱ and wireless communication test of cords tension acquisition system.
Figure 21.
Signal acquisition system module Ⅱ and wireless communication test of cords tension acquisition system.
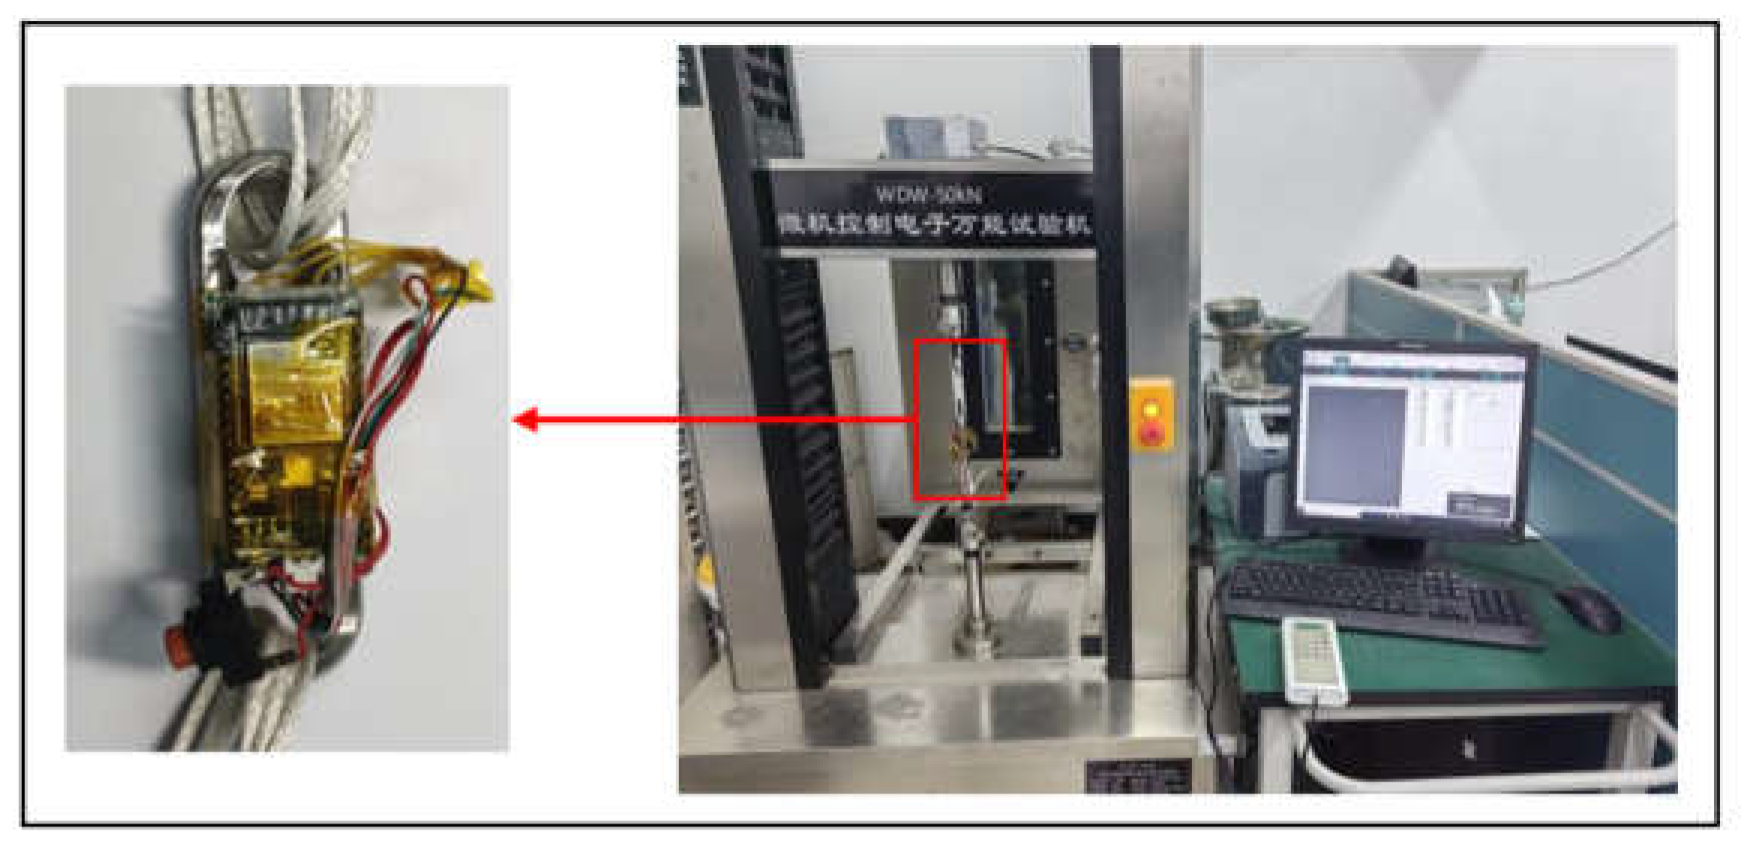
Figure 22.
Normal working condition of parachute cords tension acquisition system.
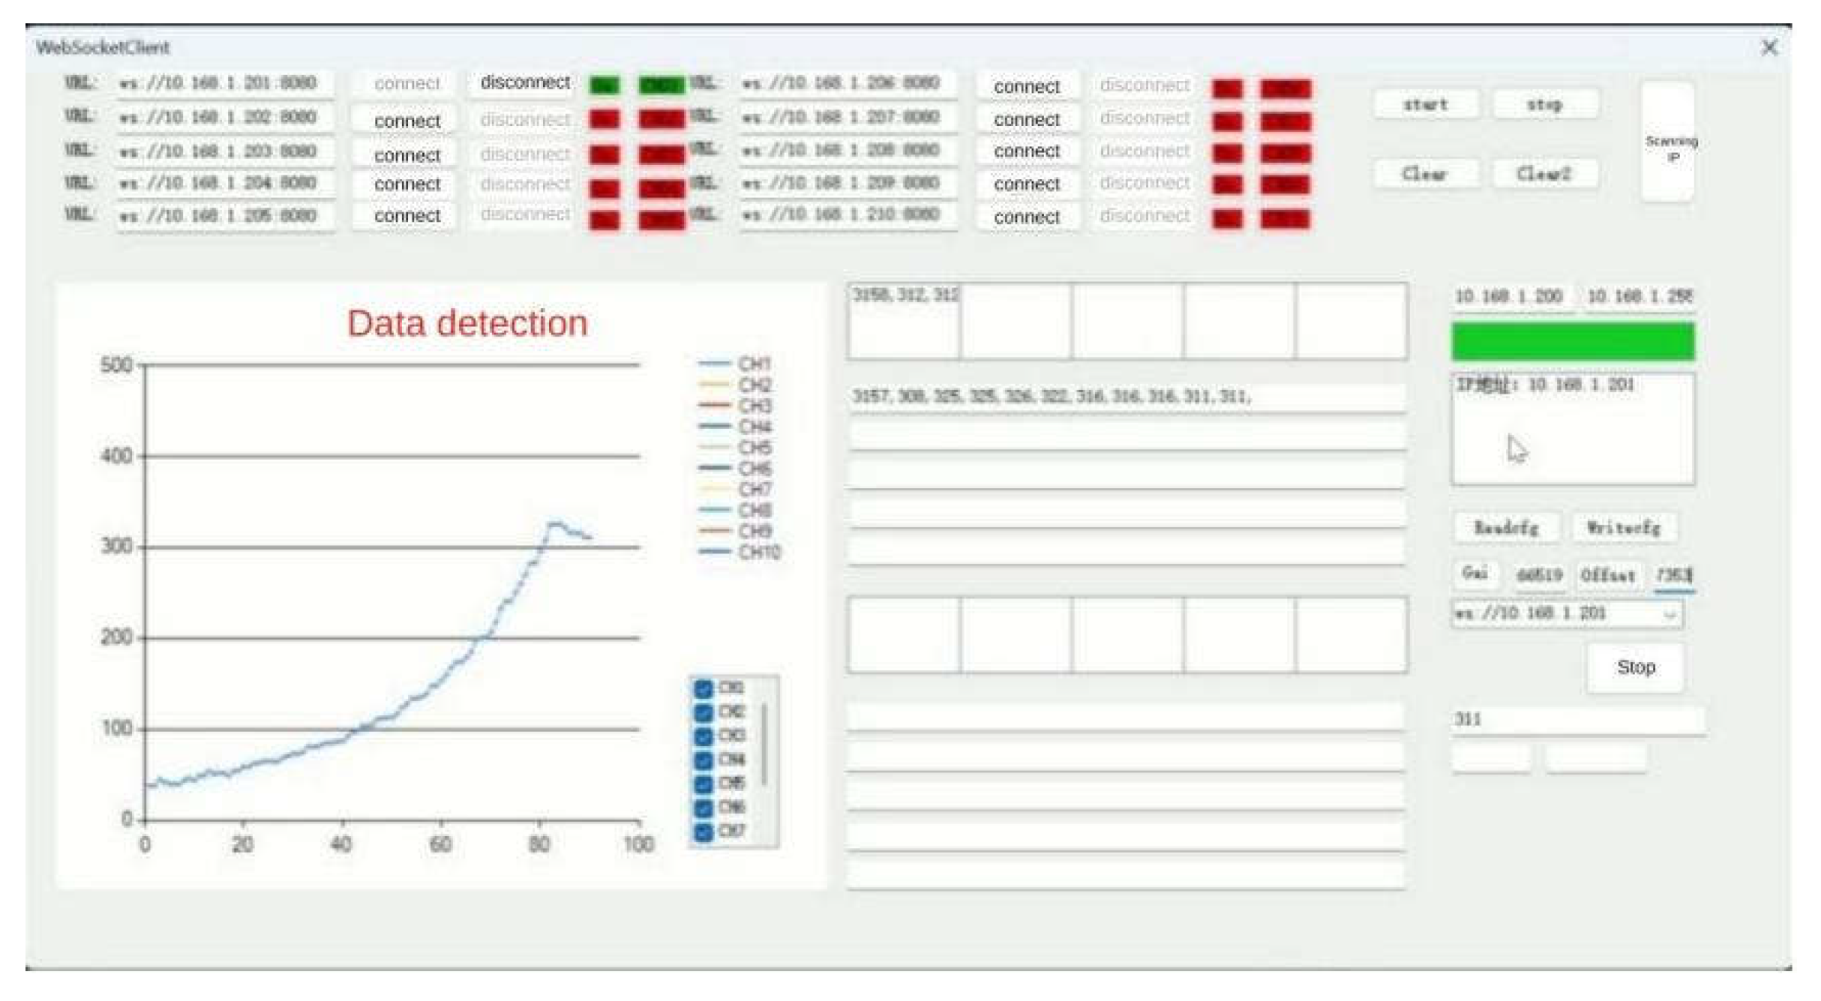
Figure 23.
Data saving for parachute cords tension acquisition syst.
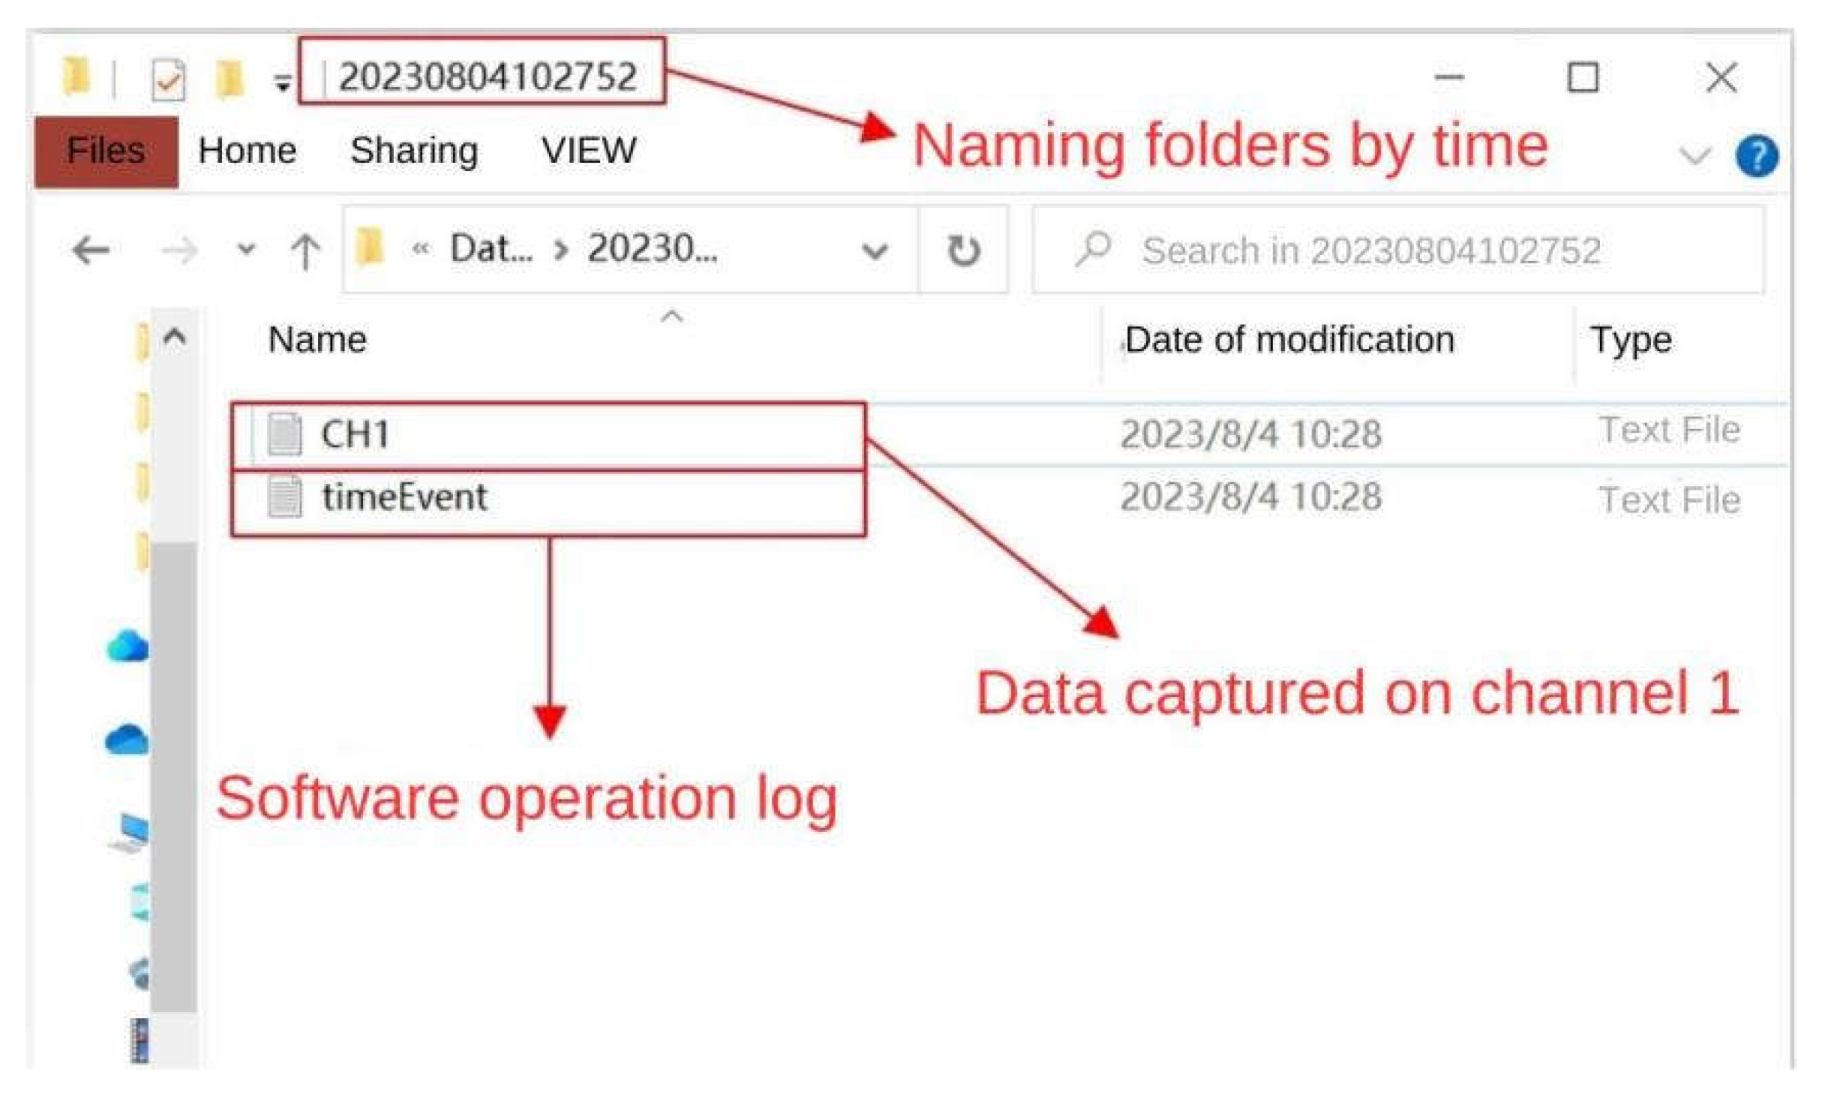
Figure 24.
Photo of the test parachute cords.
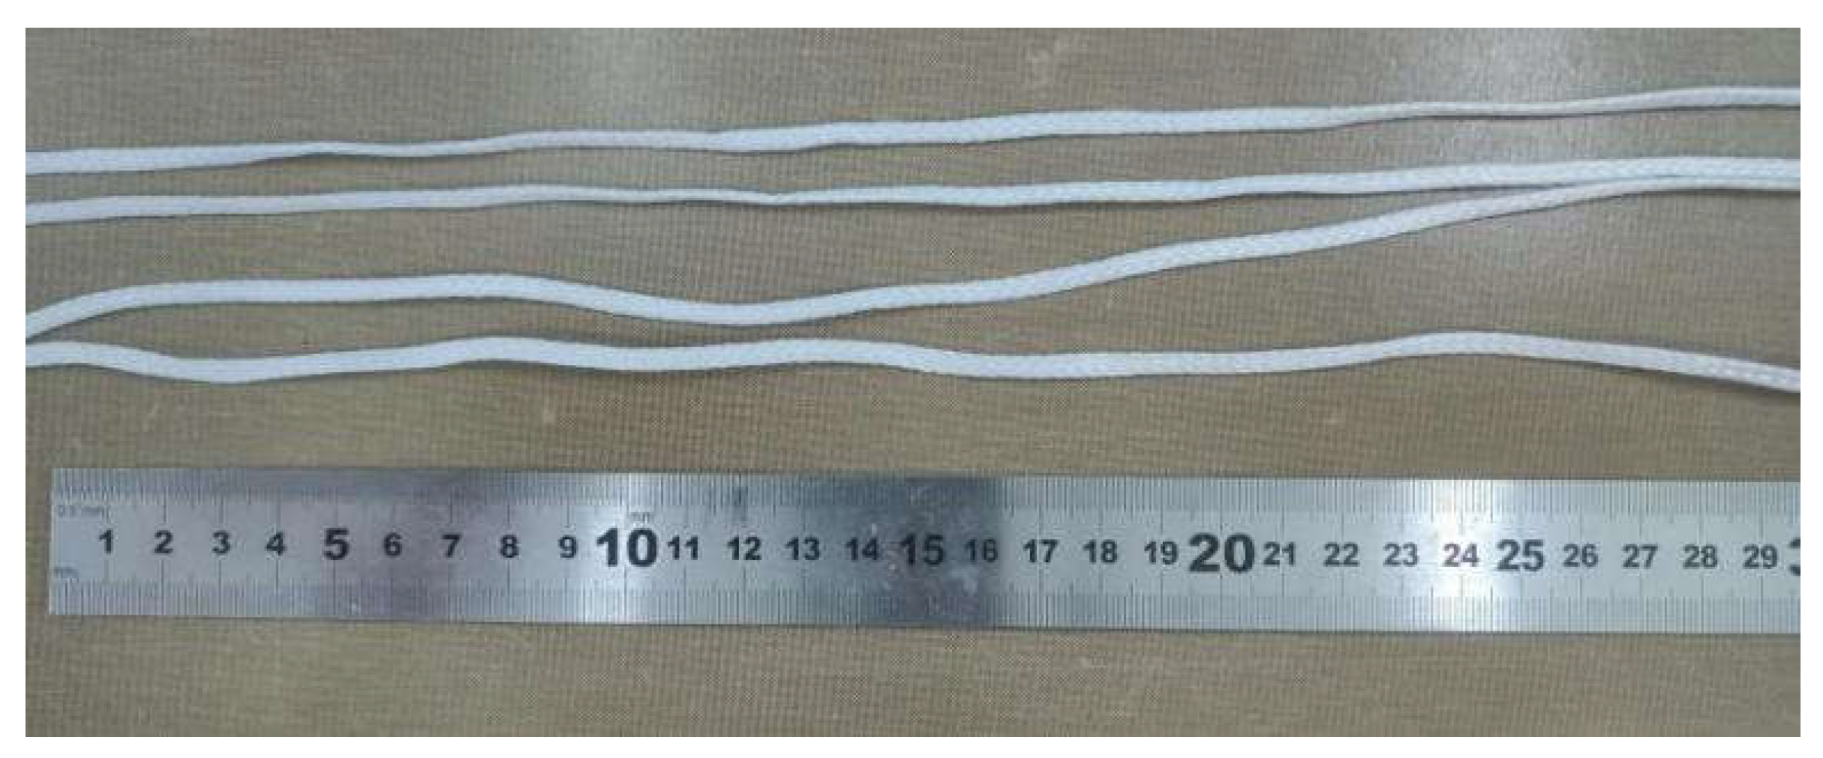
Figure 25.
Elastomer Structure I Strain Gage Pasting.
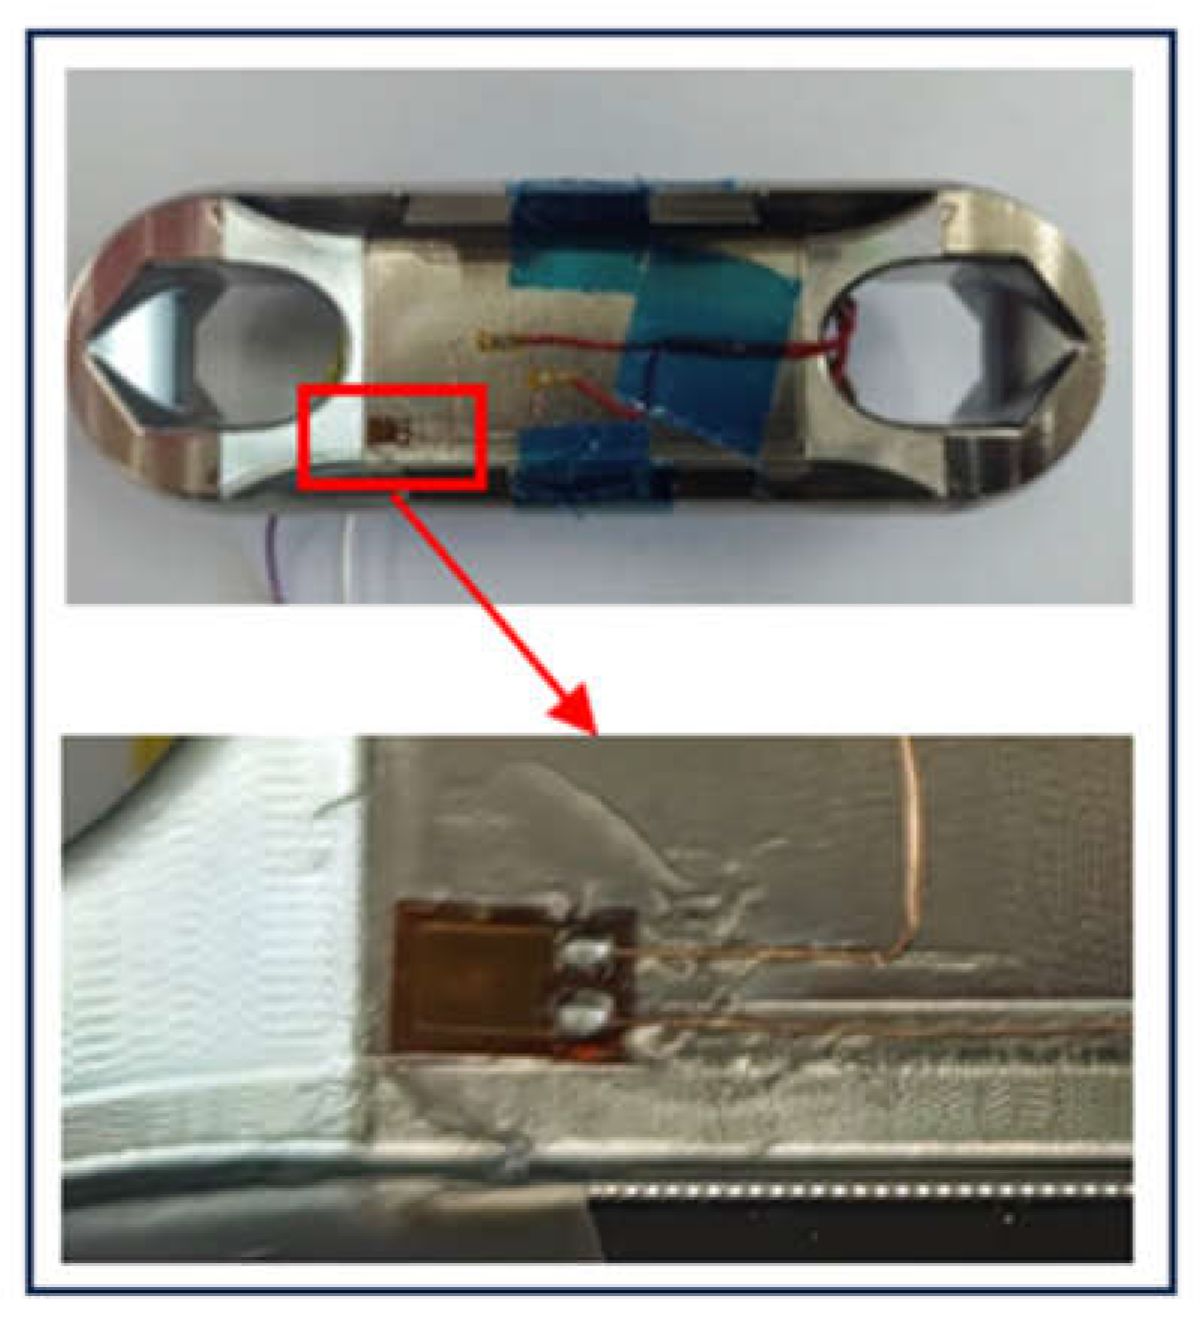
Figure 26.
Elastomer structure Ⅰ static experimental test.
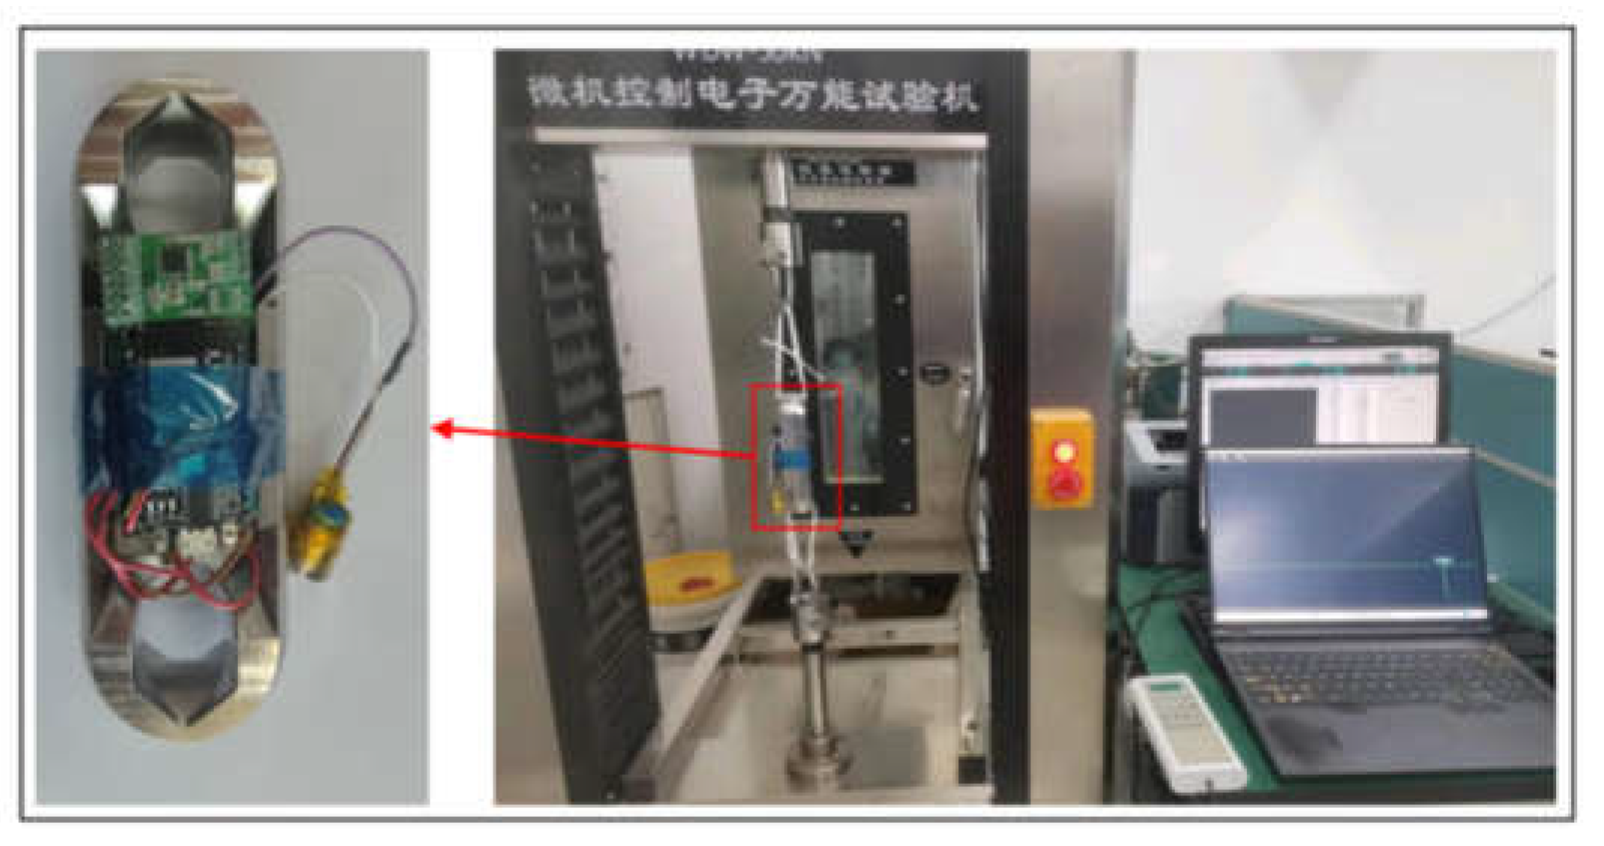
Figure 27.
Waveforms displayed on upper computer software.
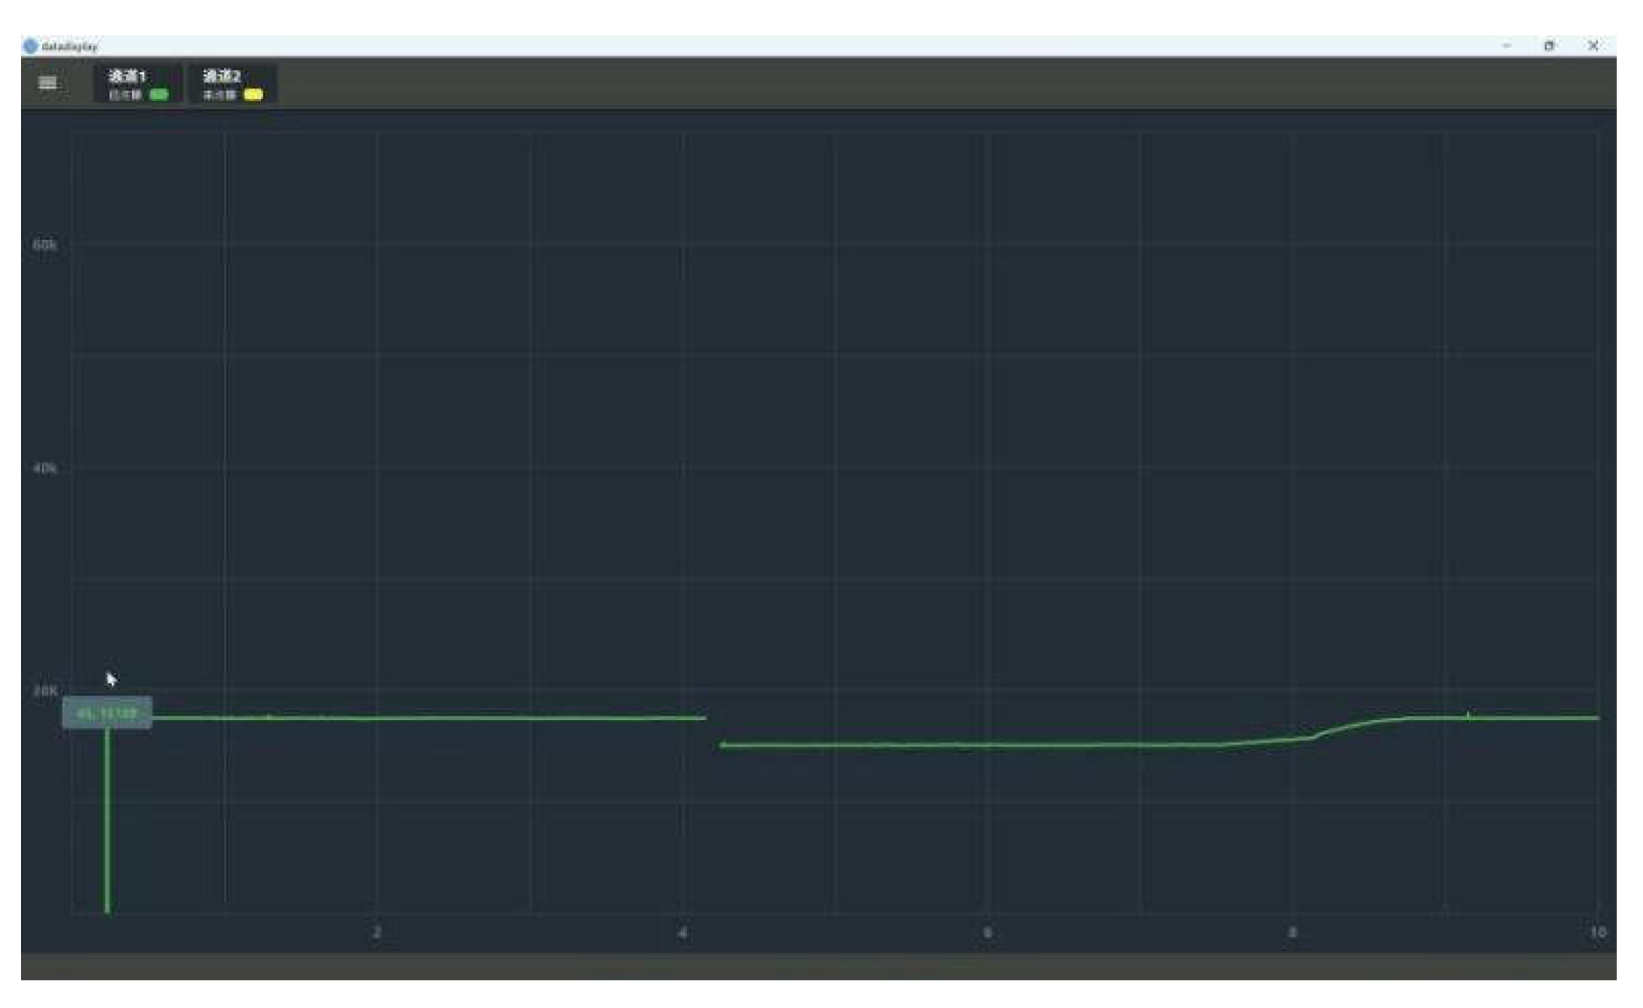
Figure 28.
Physical object and strain gage pasting in elastomer structure scheme II.
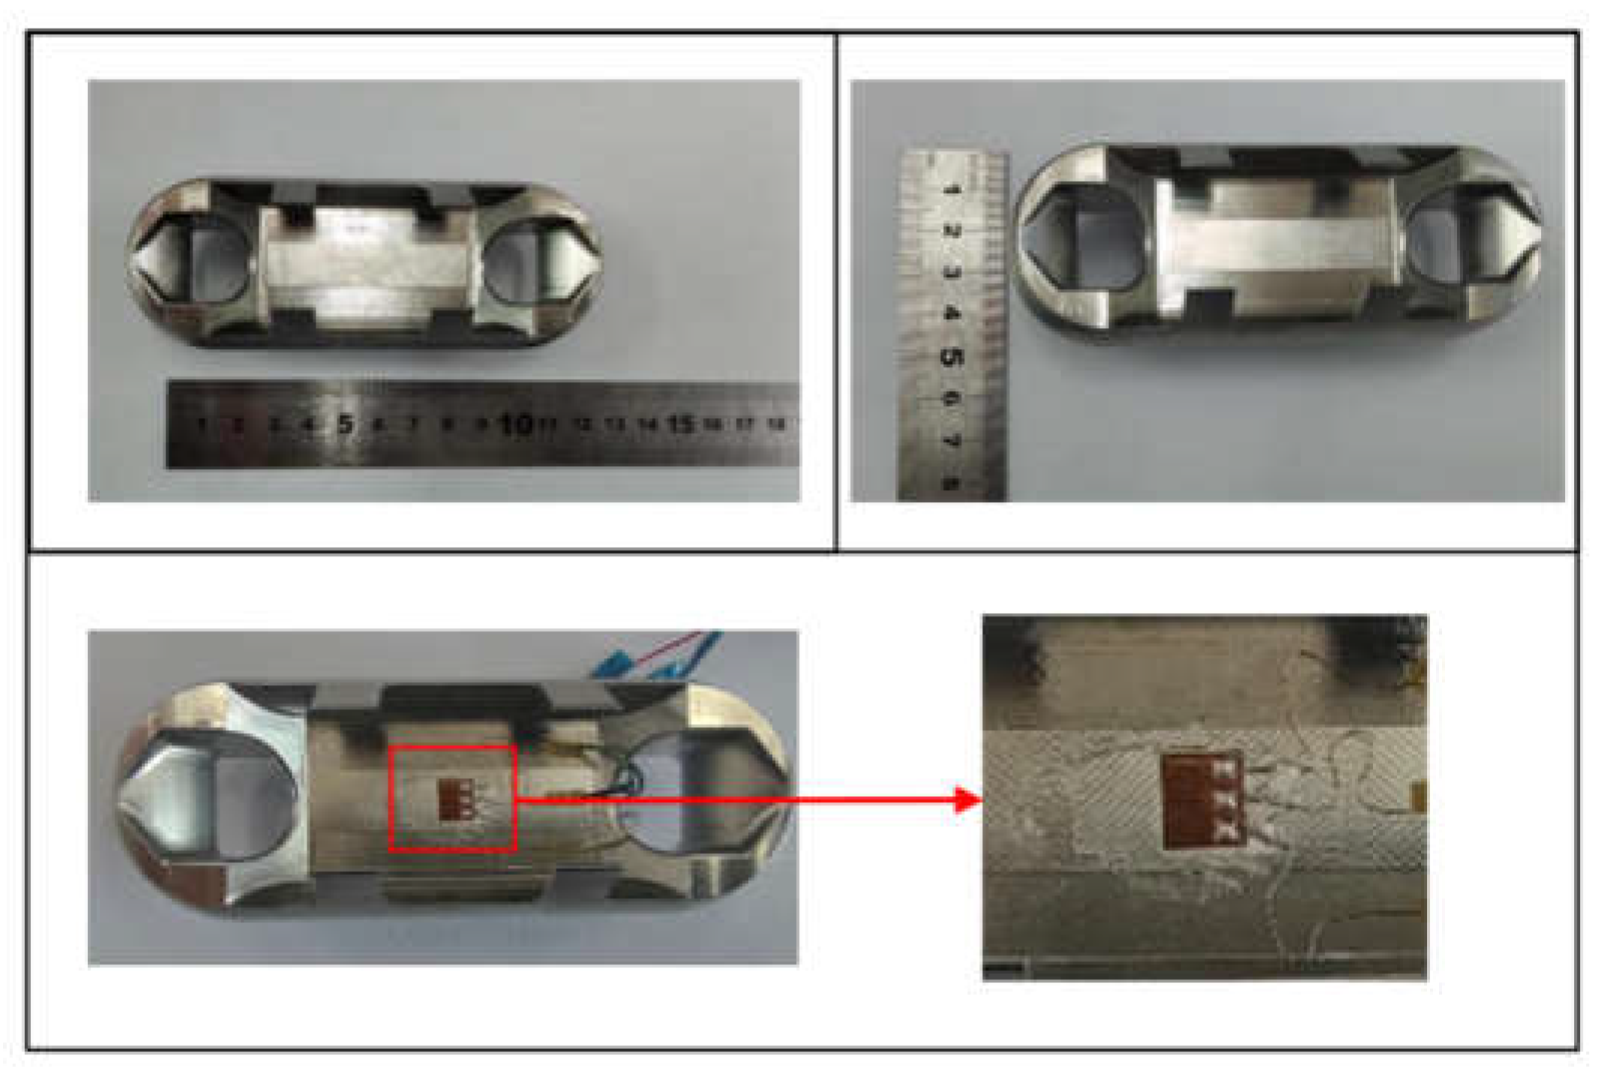
Figure 29.
Physical object and strain gage pasting in elastomer structure scheme III.
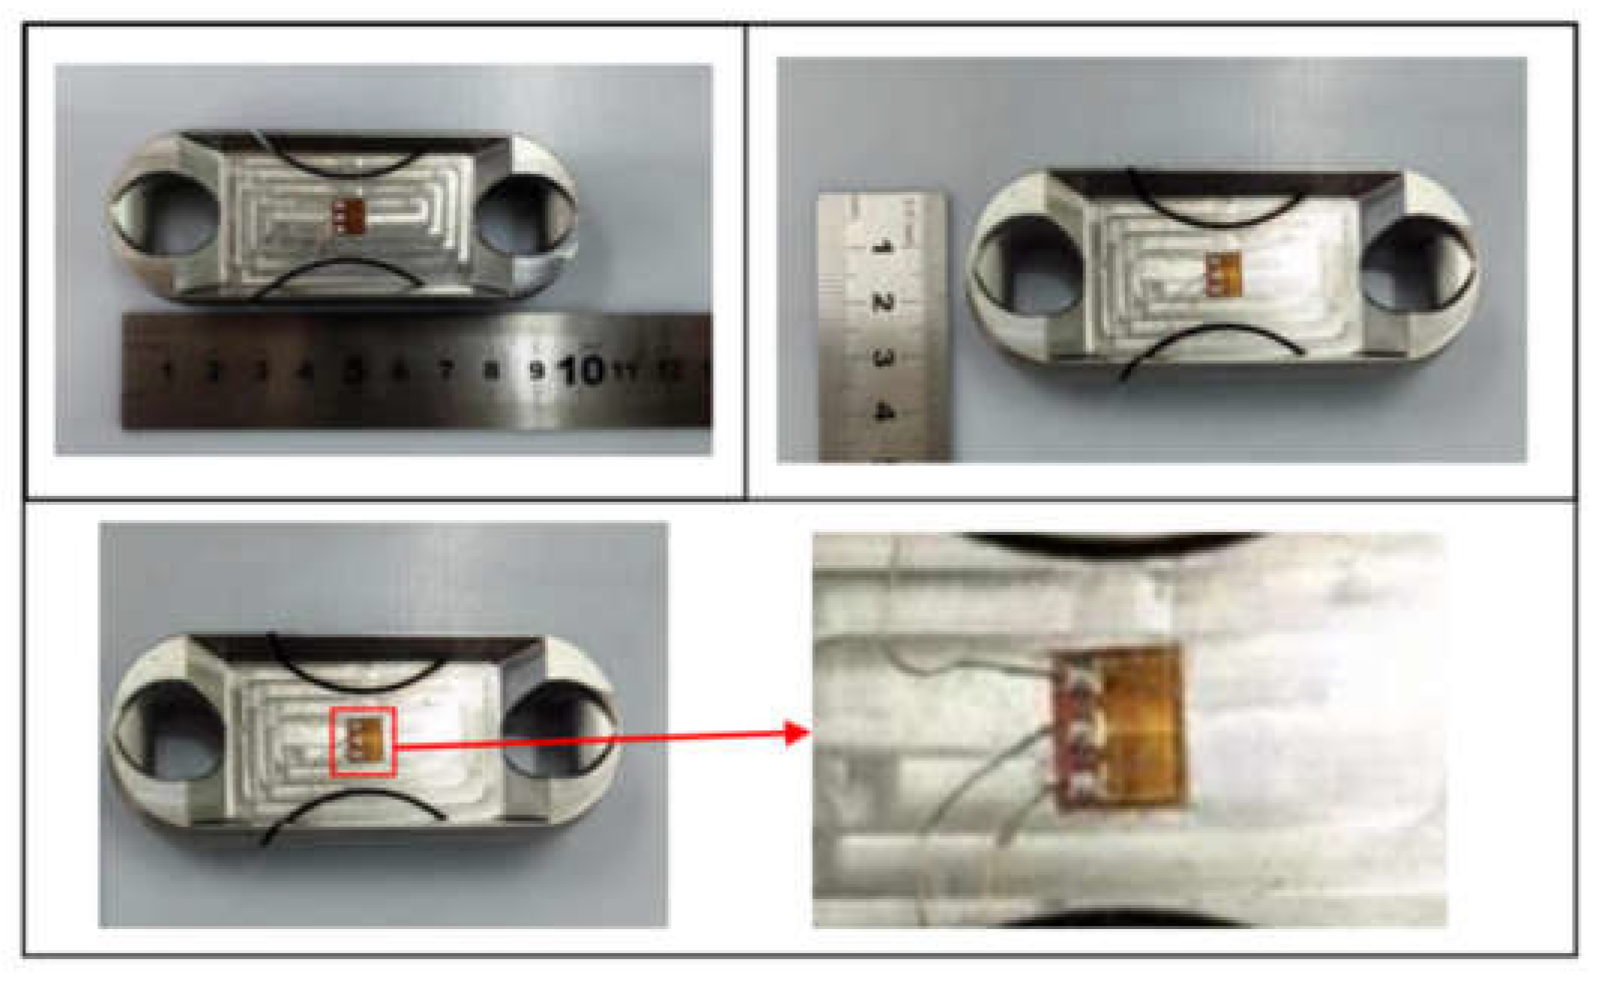
Figure 30.
Mounting of the elastomer structures to the universal testing machines.
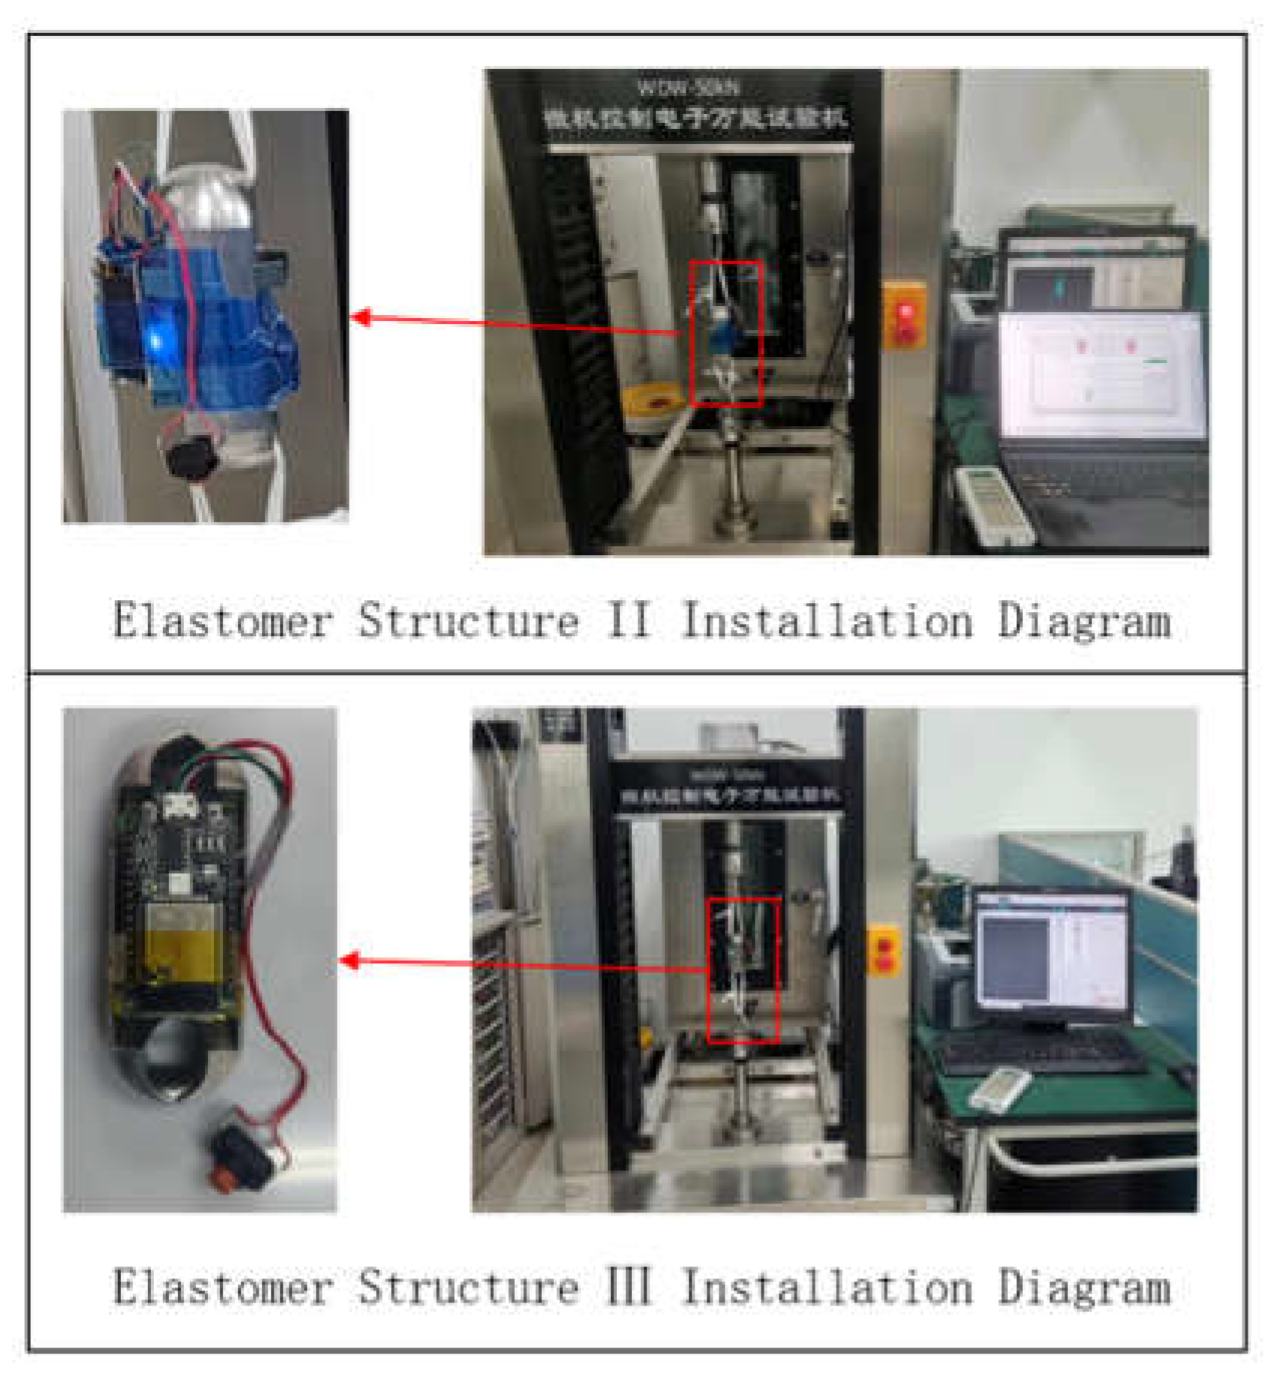
Figure 31.
Elastomer structure test data versus standard force value.
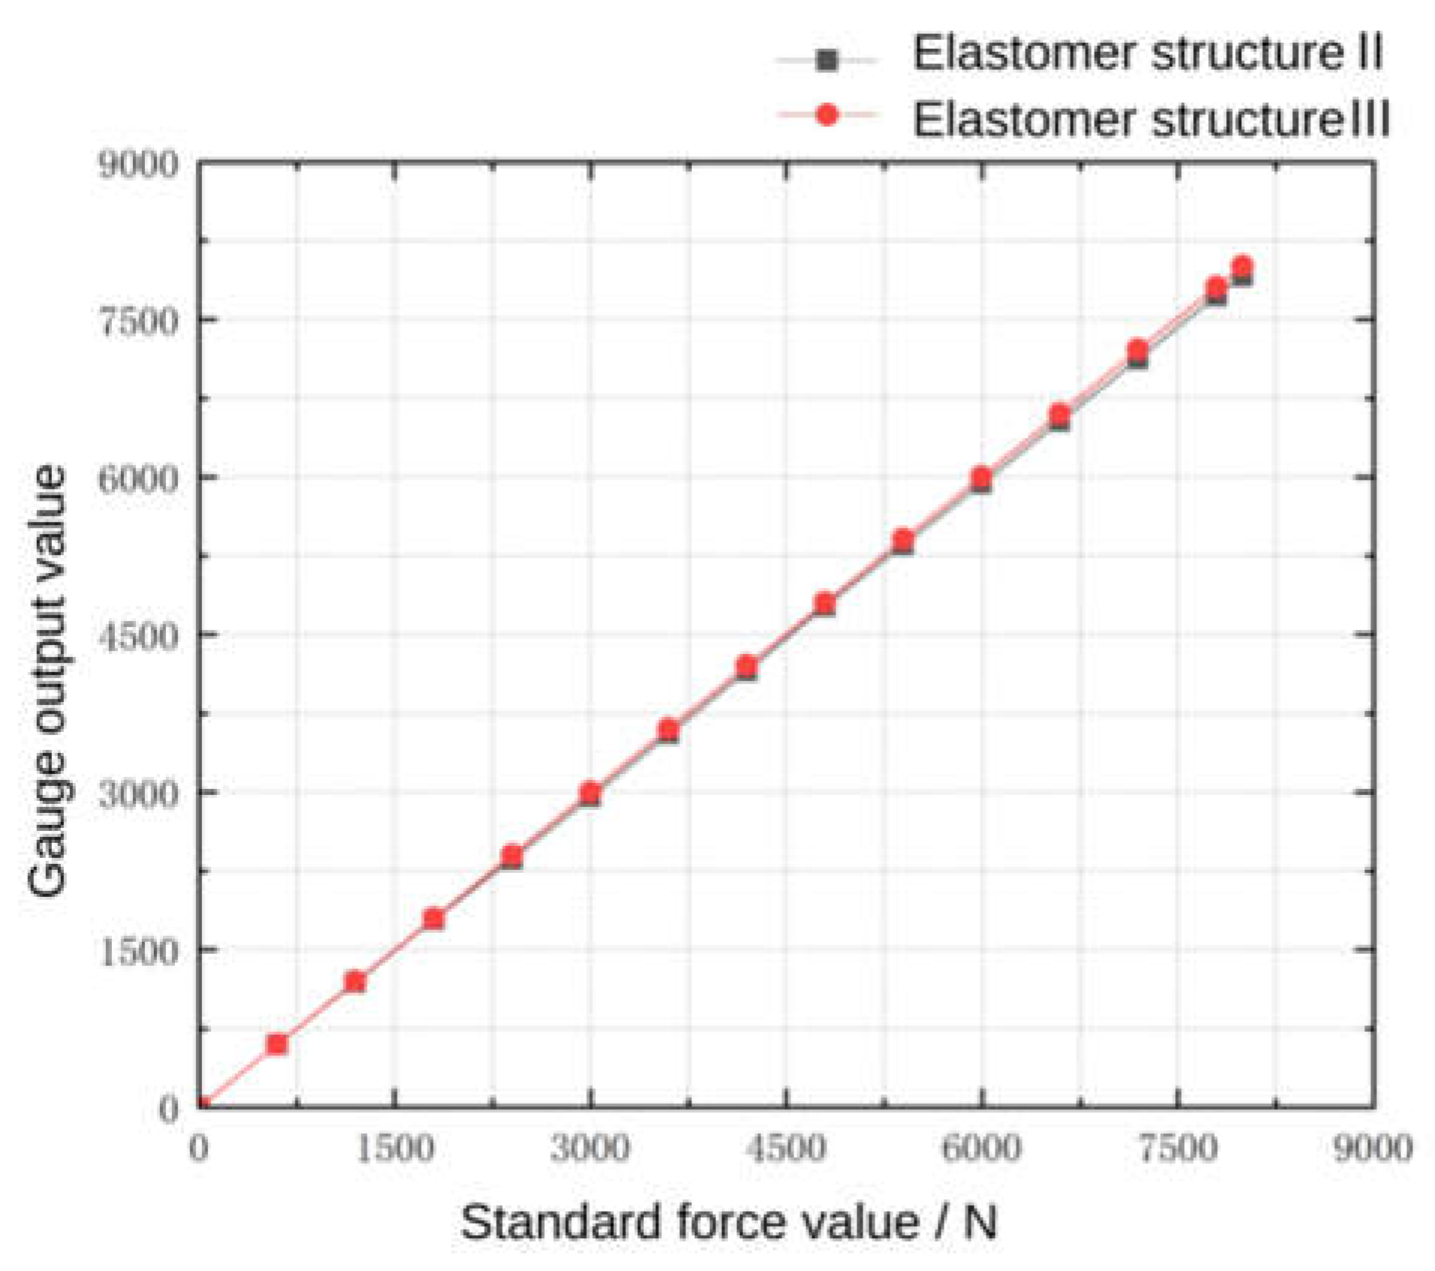
Figure 32.
Miniature Measuring Instrument Prototype.
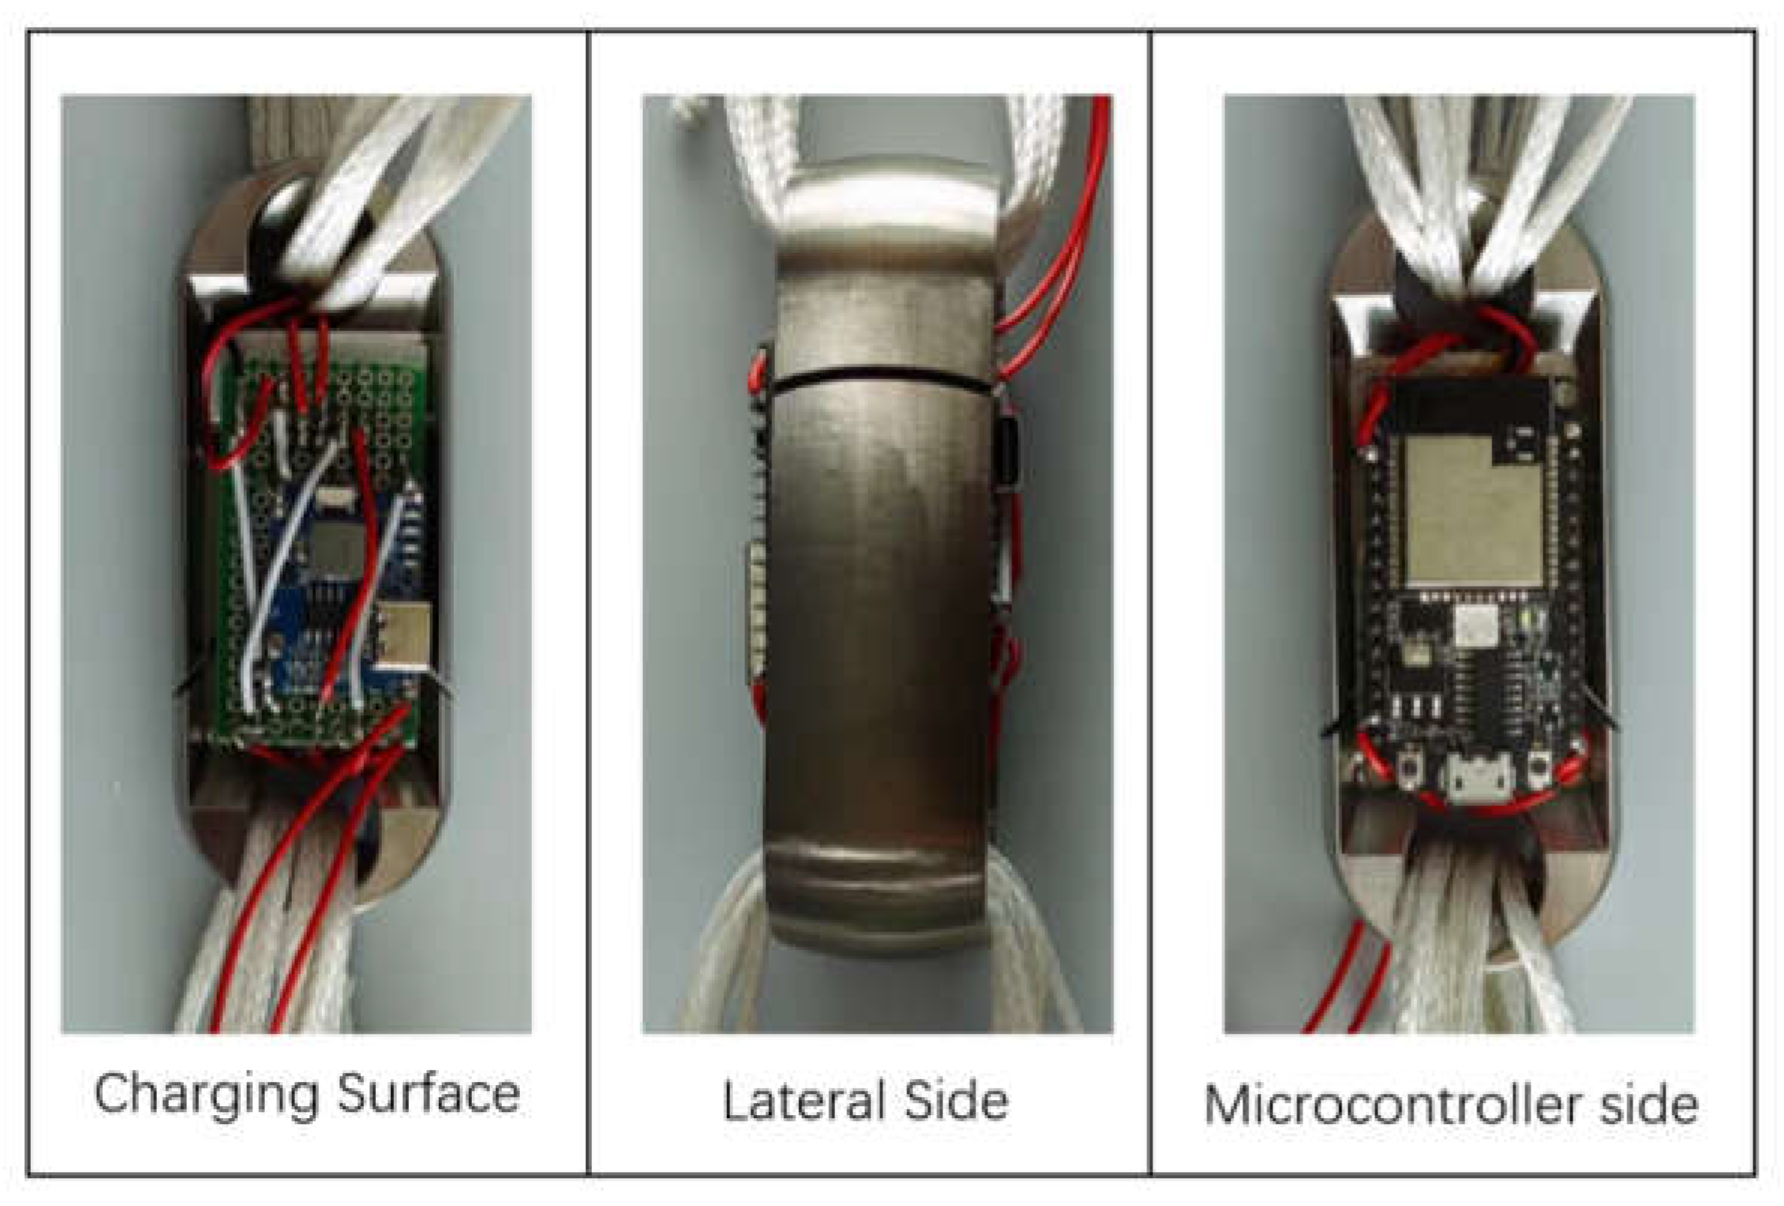
Figure 33.
Joint debugging experiment.
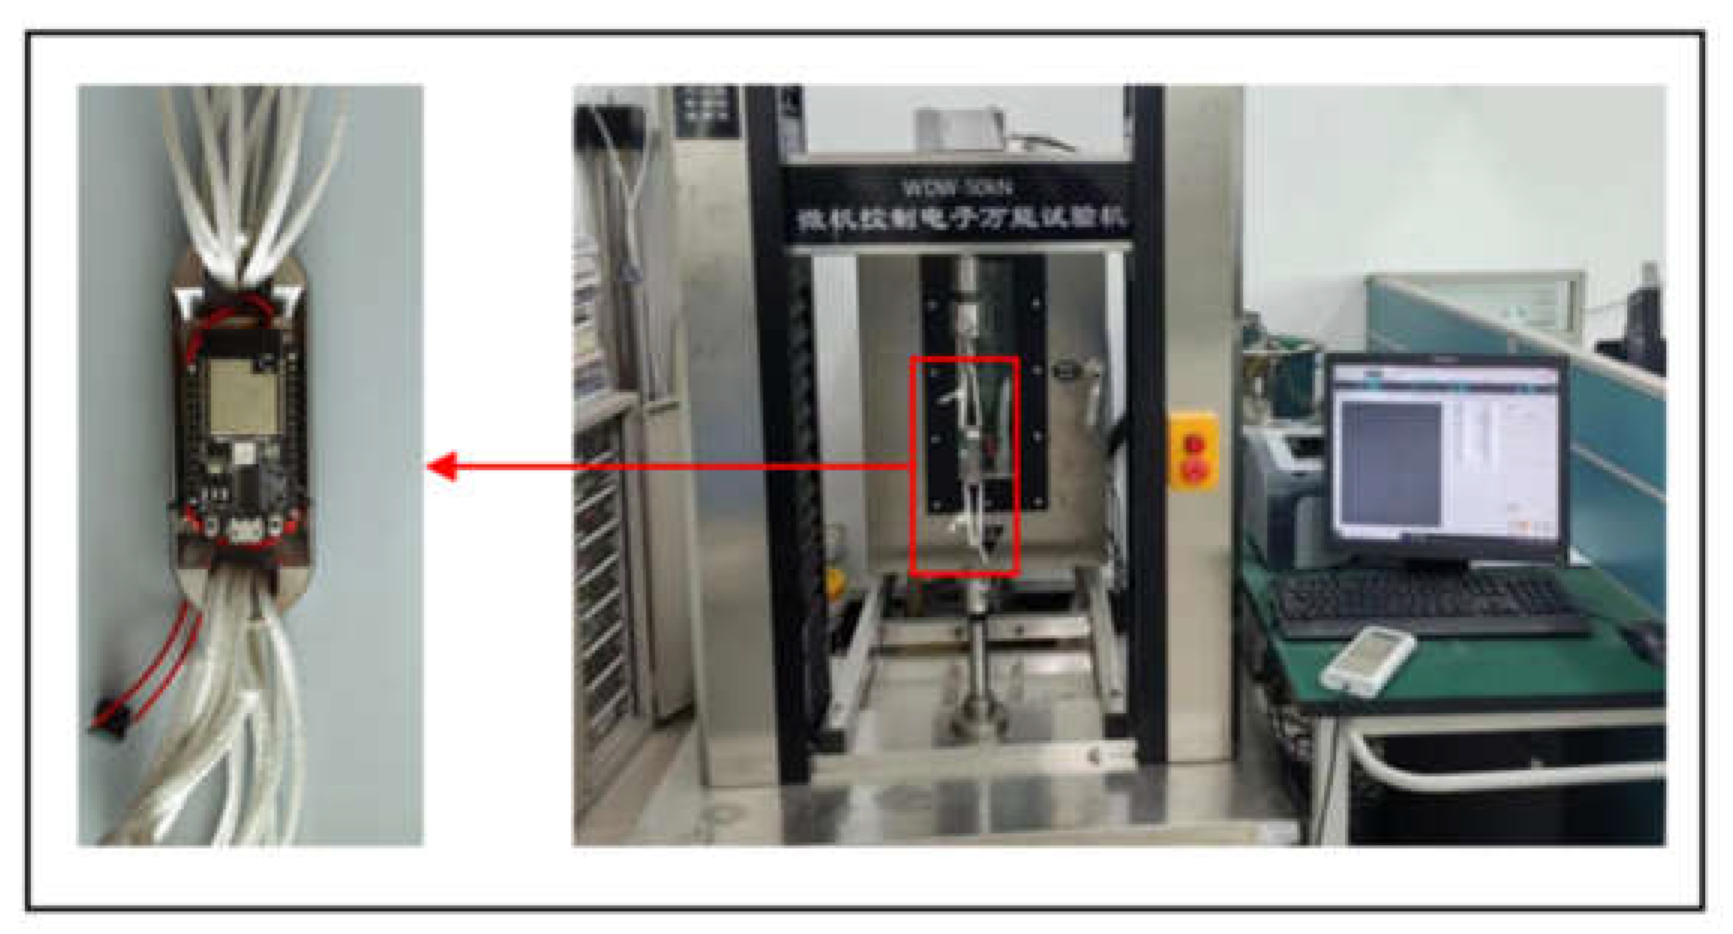
Figure 34.
Data collected by the parachute cords tension acquisition system.
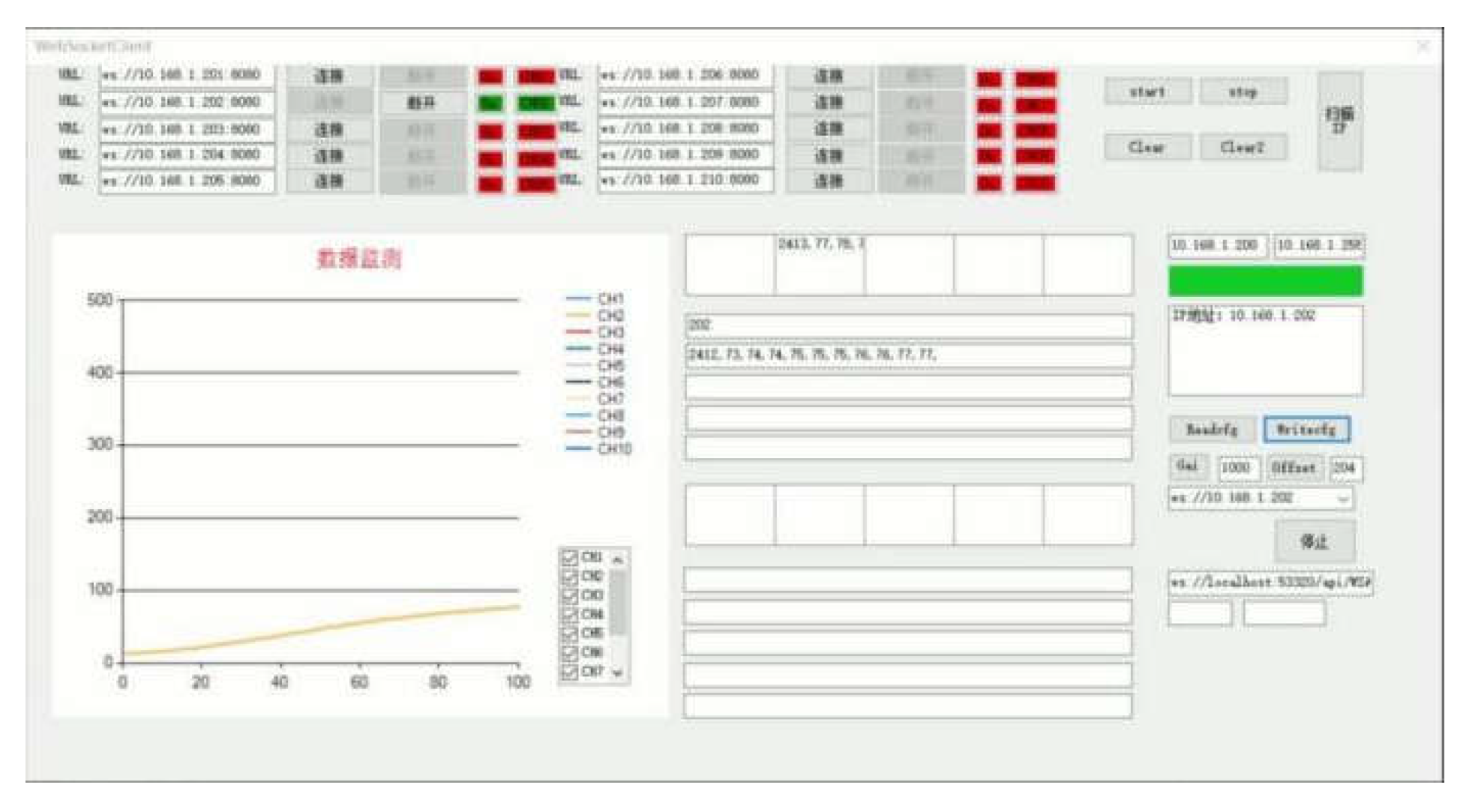
Figure 35.
Elastomer structure AD sampling fitting curve at static state.
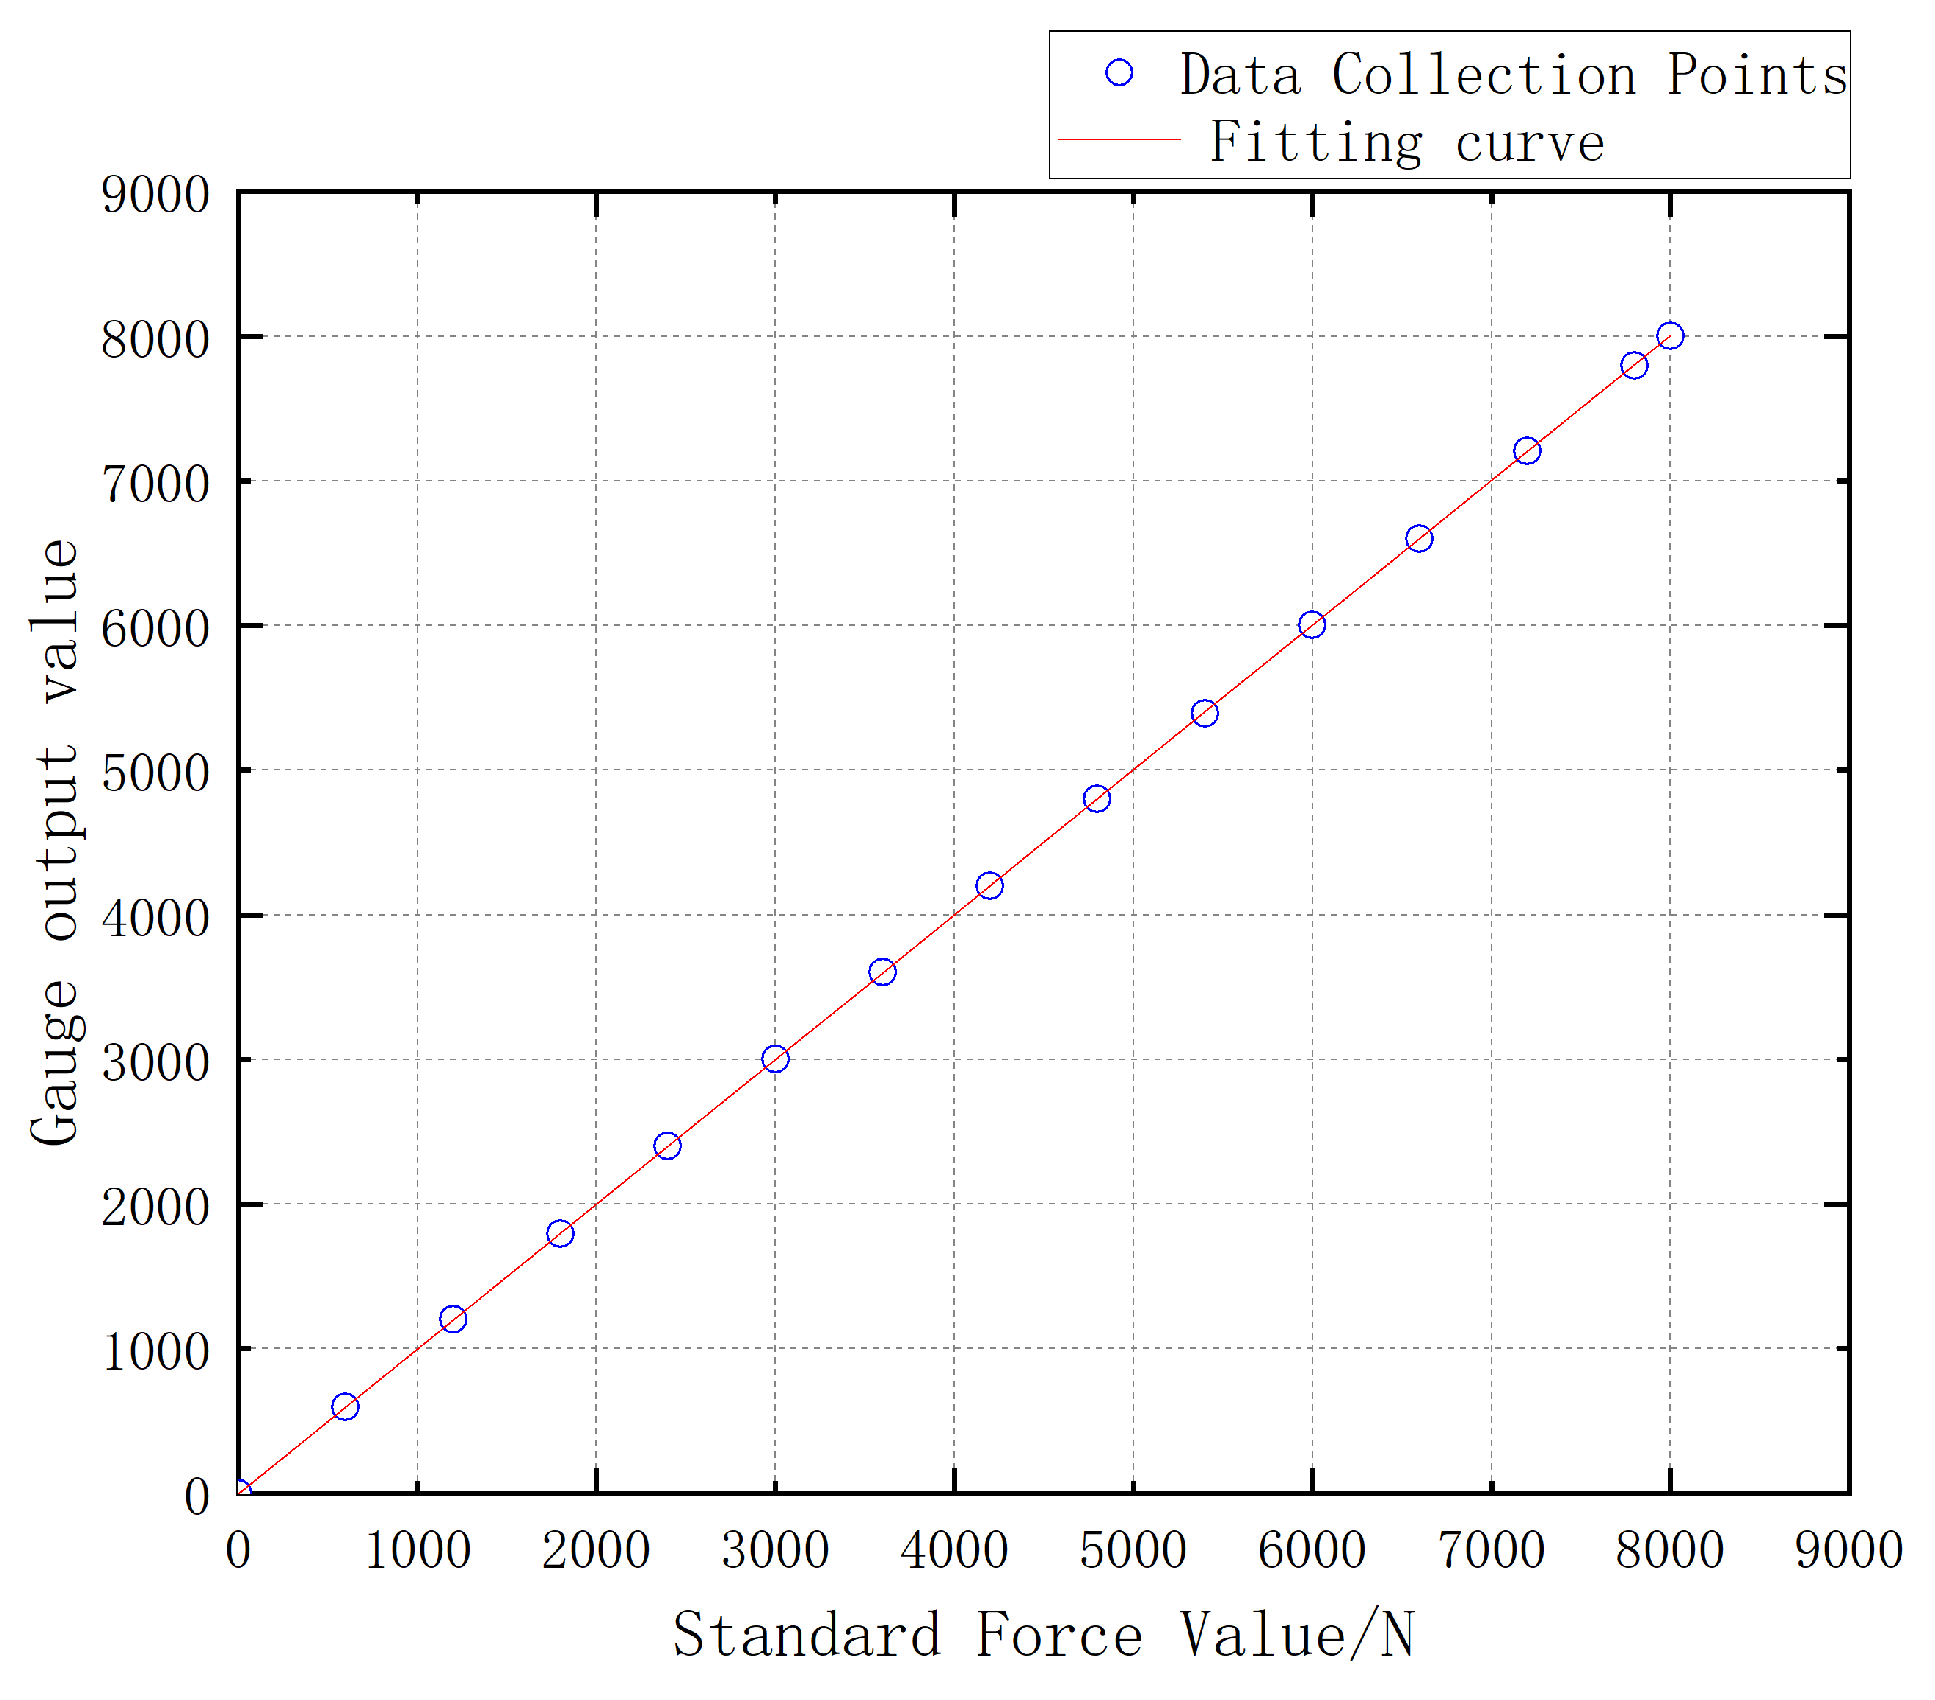
Figure 36.
Miniature measuring instrument encapsulating.
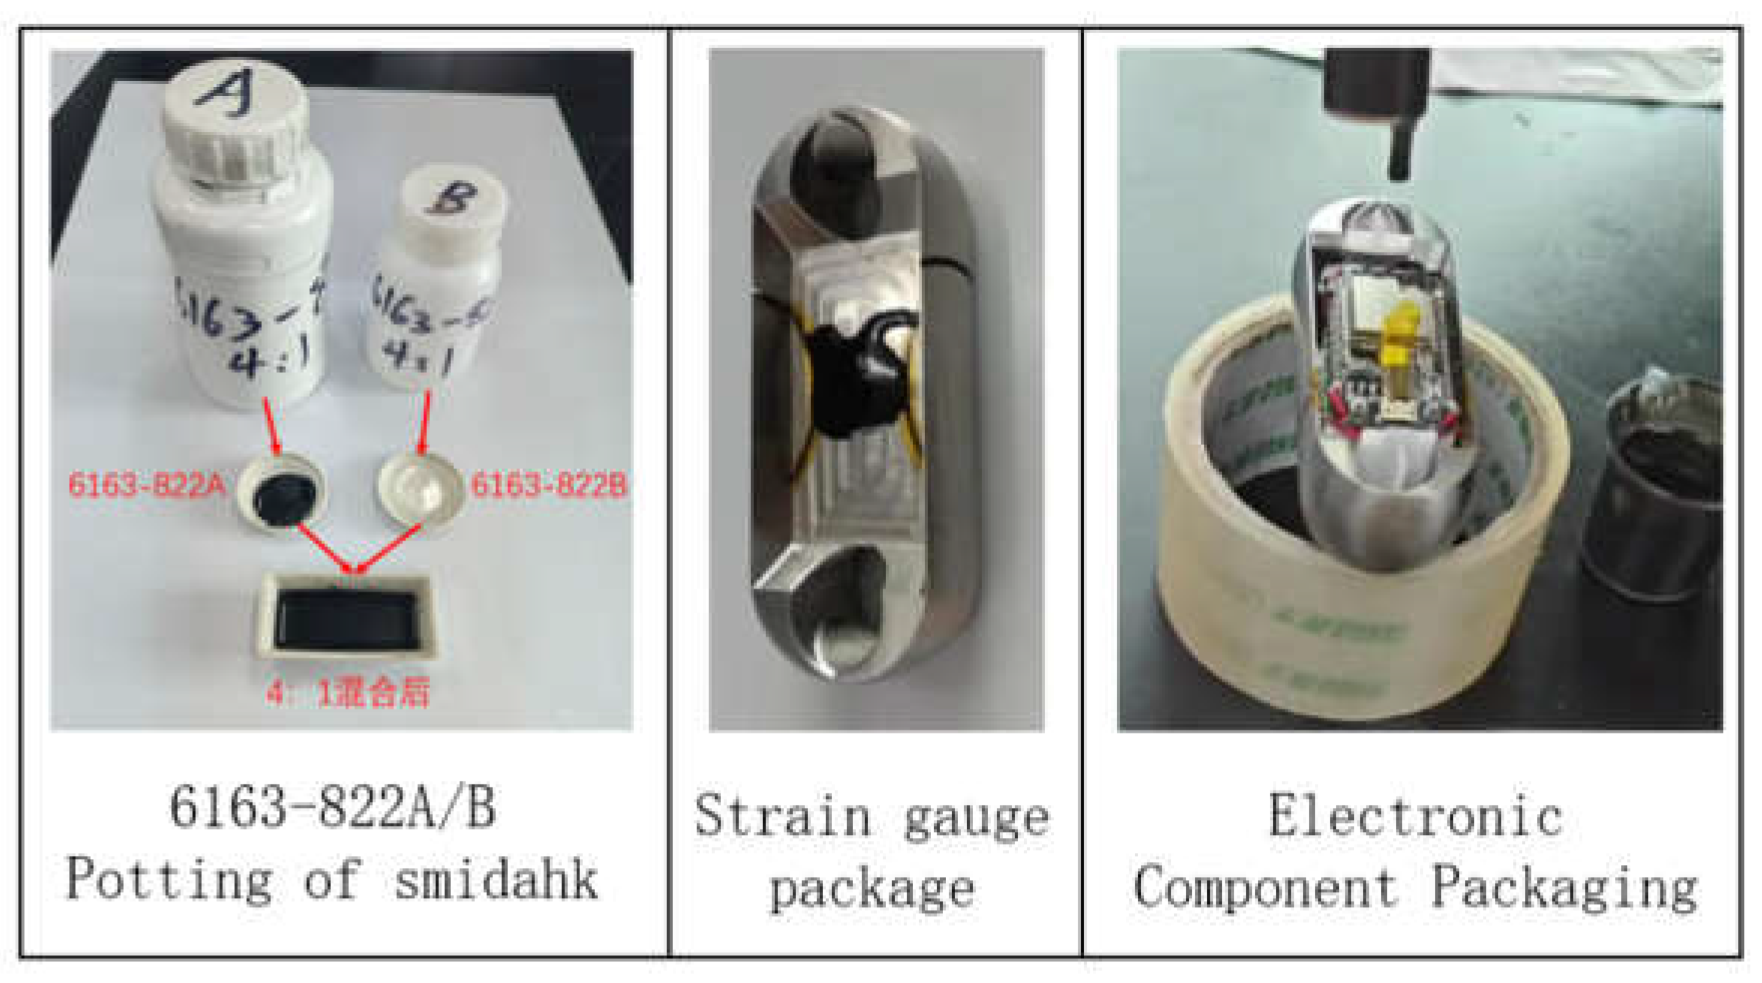
Figure 37.
Miniature measuring instrument after encapsulating and curing.
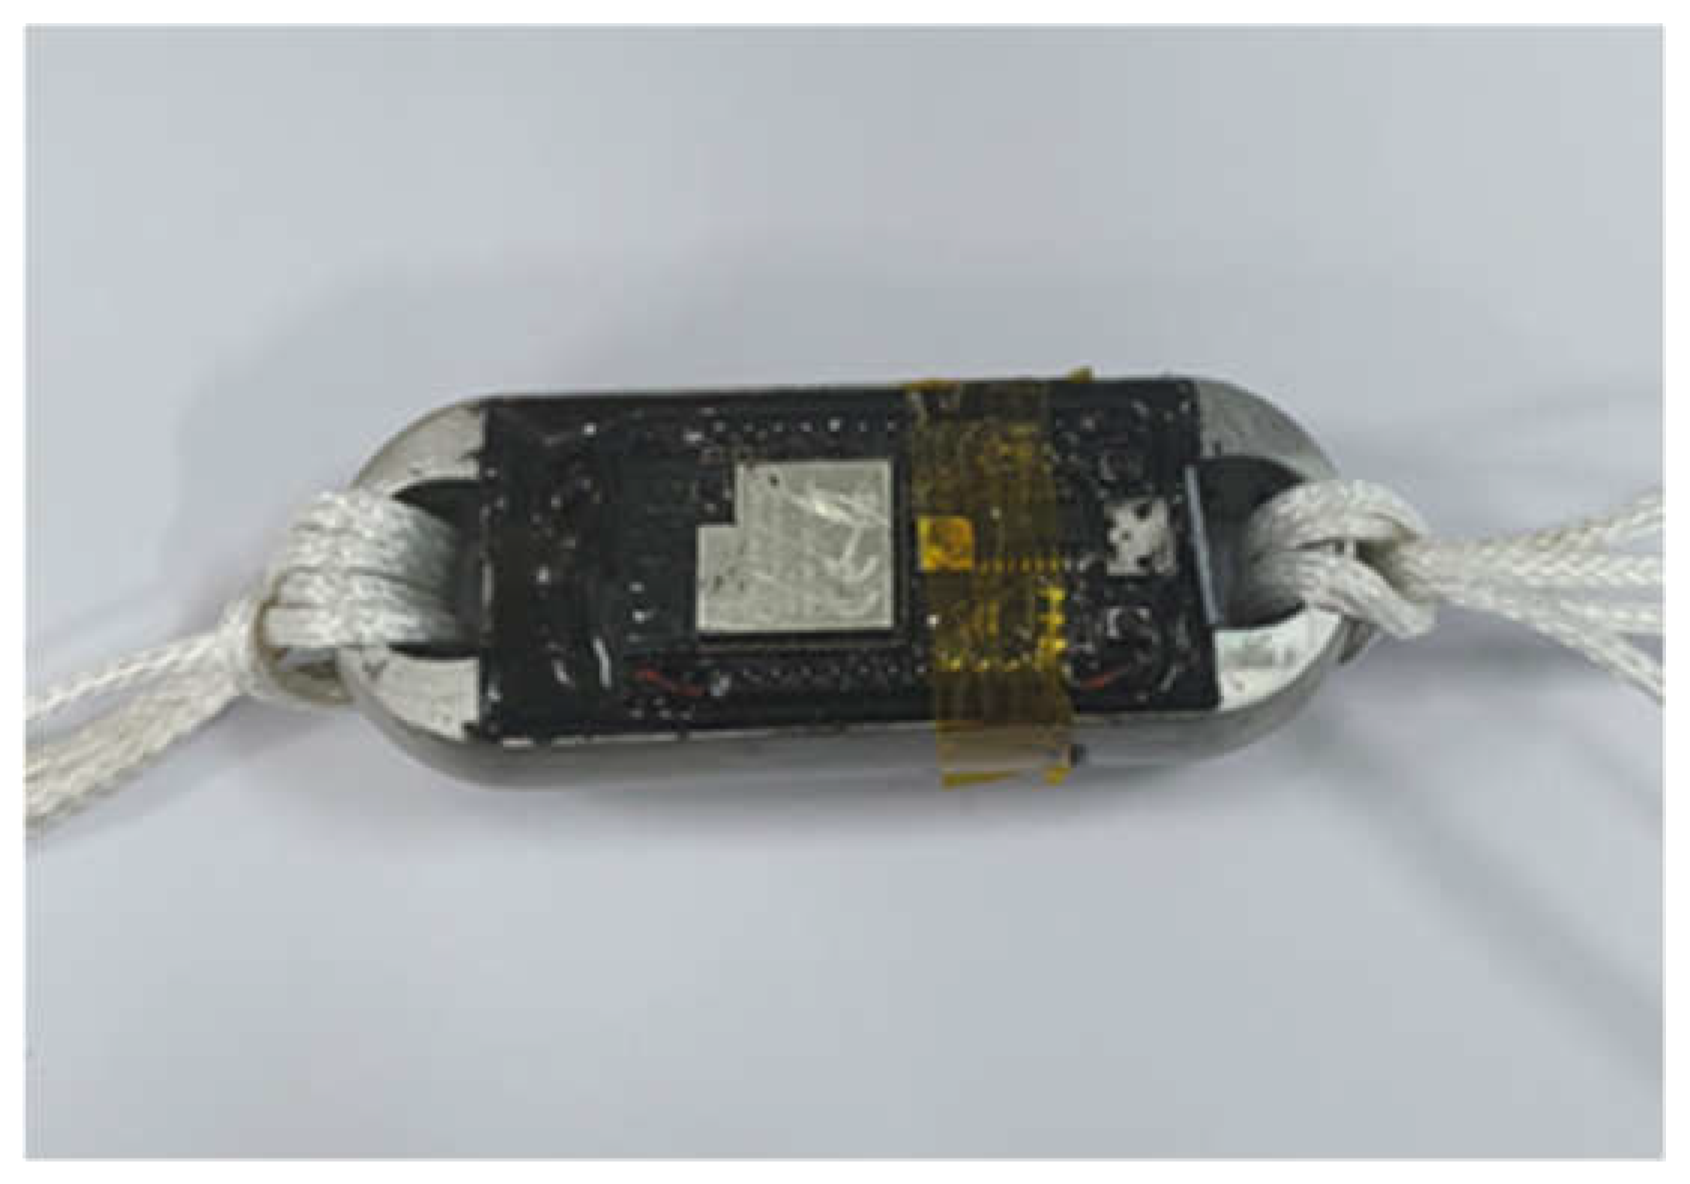
Figure 38.
Miniature measuring instrument experimental testing.
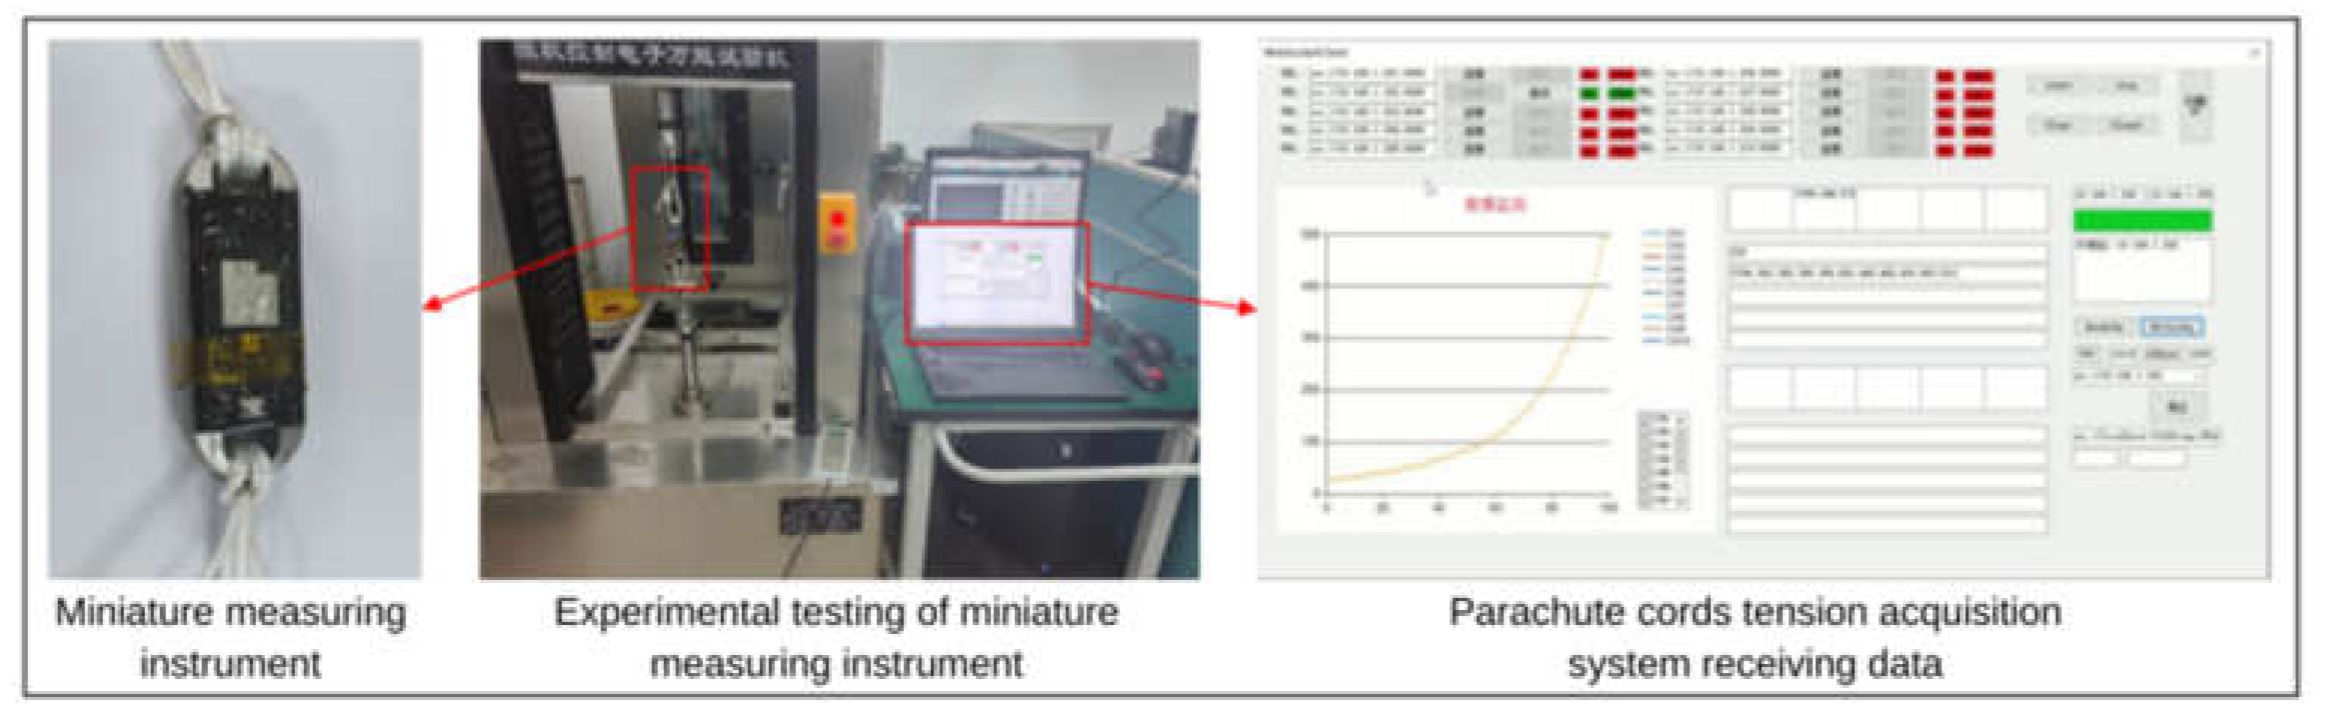
Figure 39.
Miniature measuring instrument calibration.
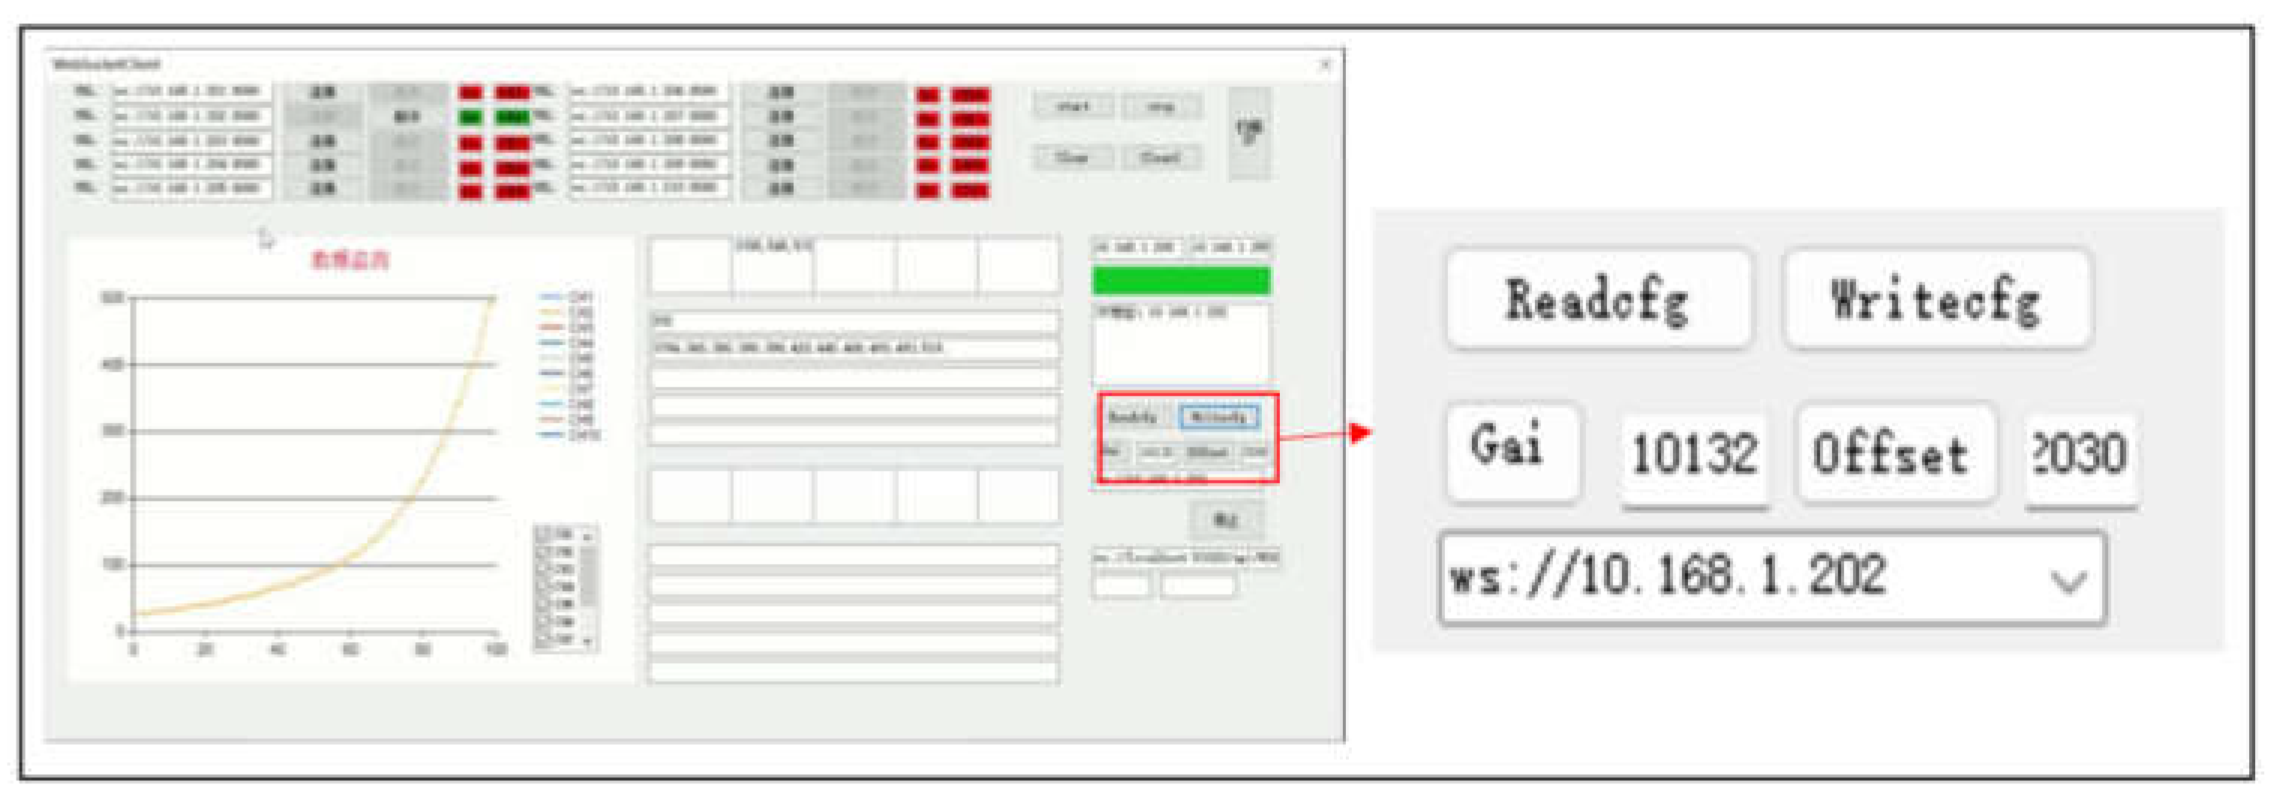
Figure 40.
Repeatability test curves for miniature measuring instrument.

Figure 41.
Hysteresis test curve for miniature measuring instrument.
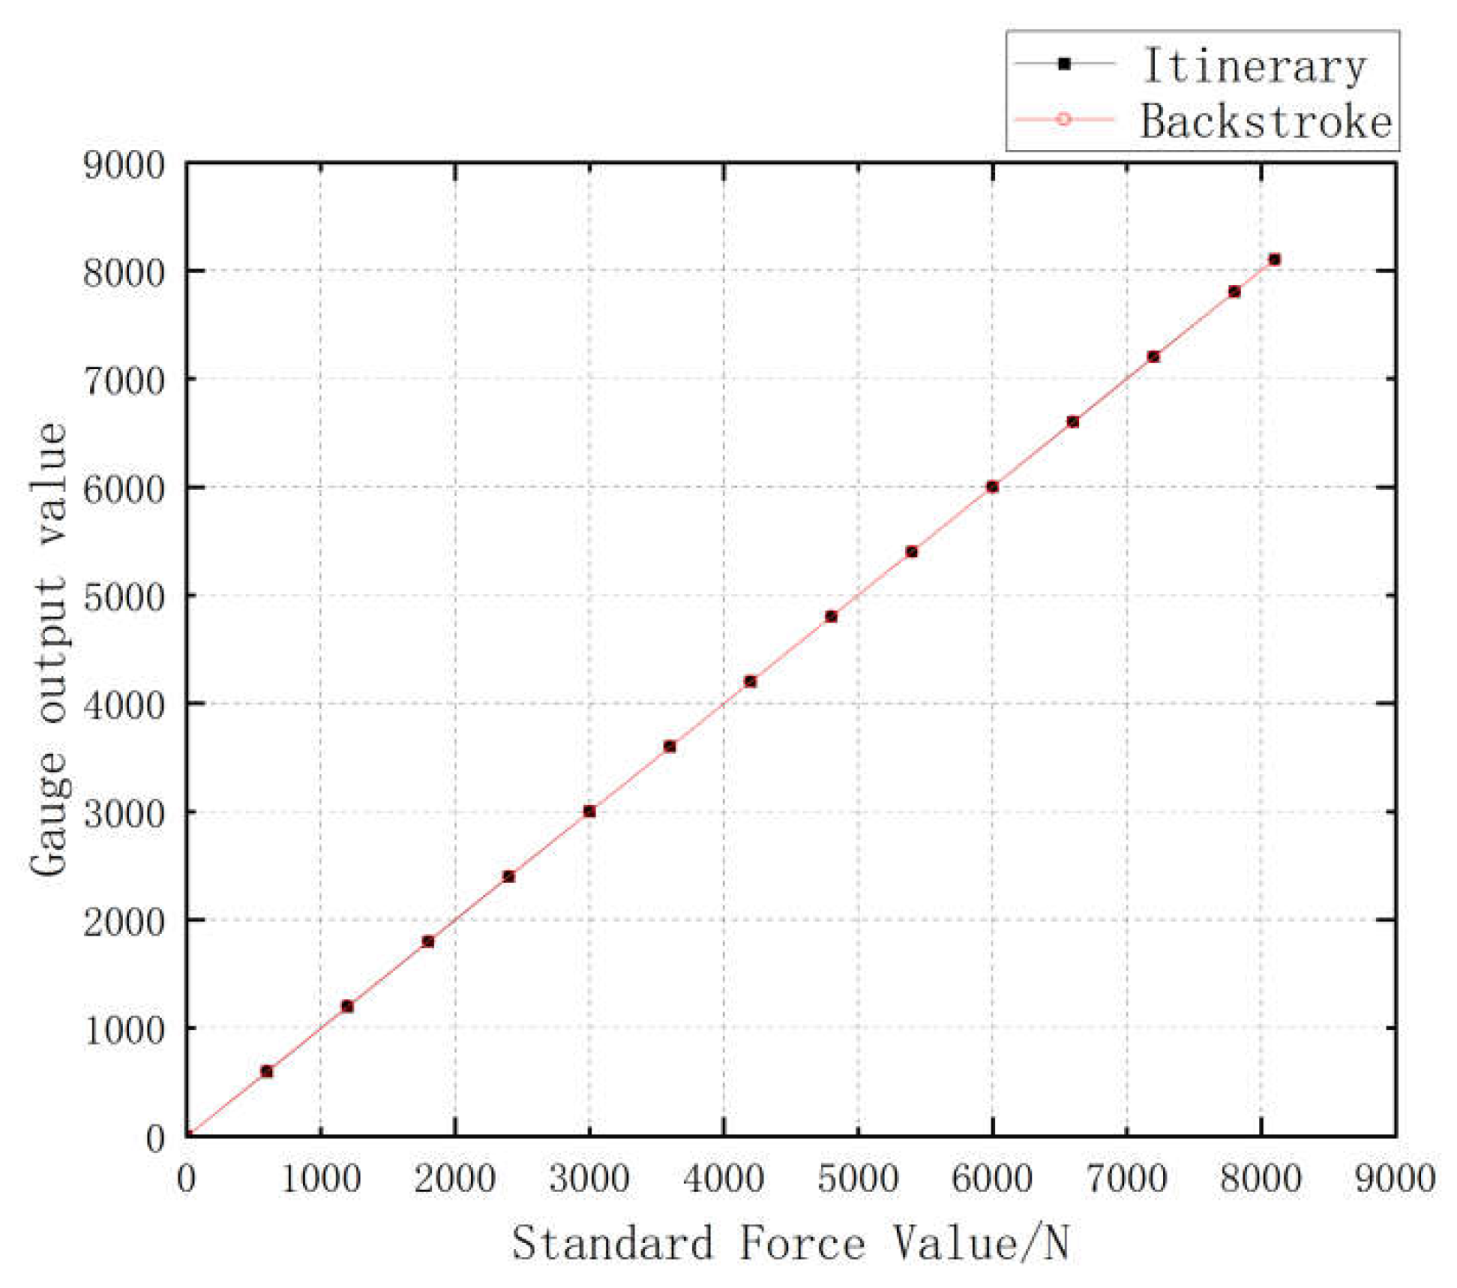
Figure 42.
Linearity test curve for miniature measuring instrument.
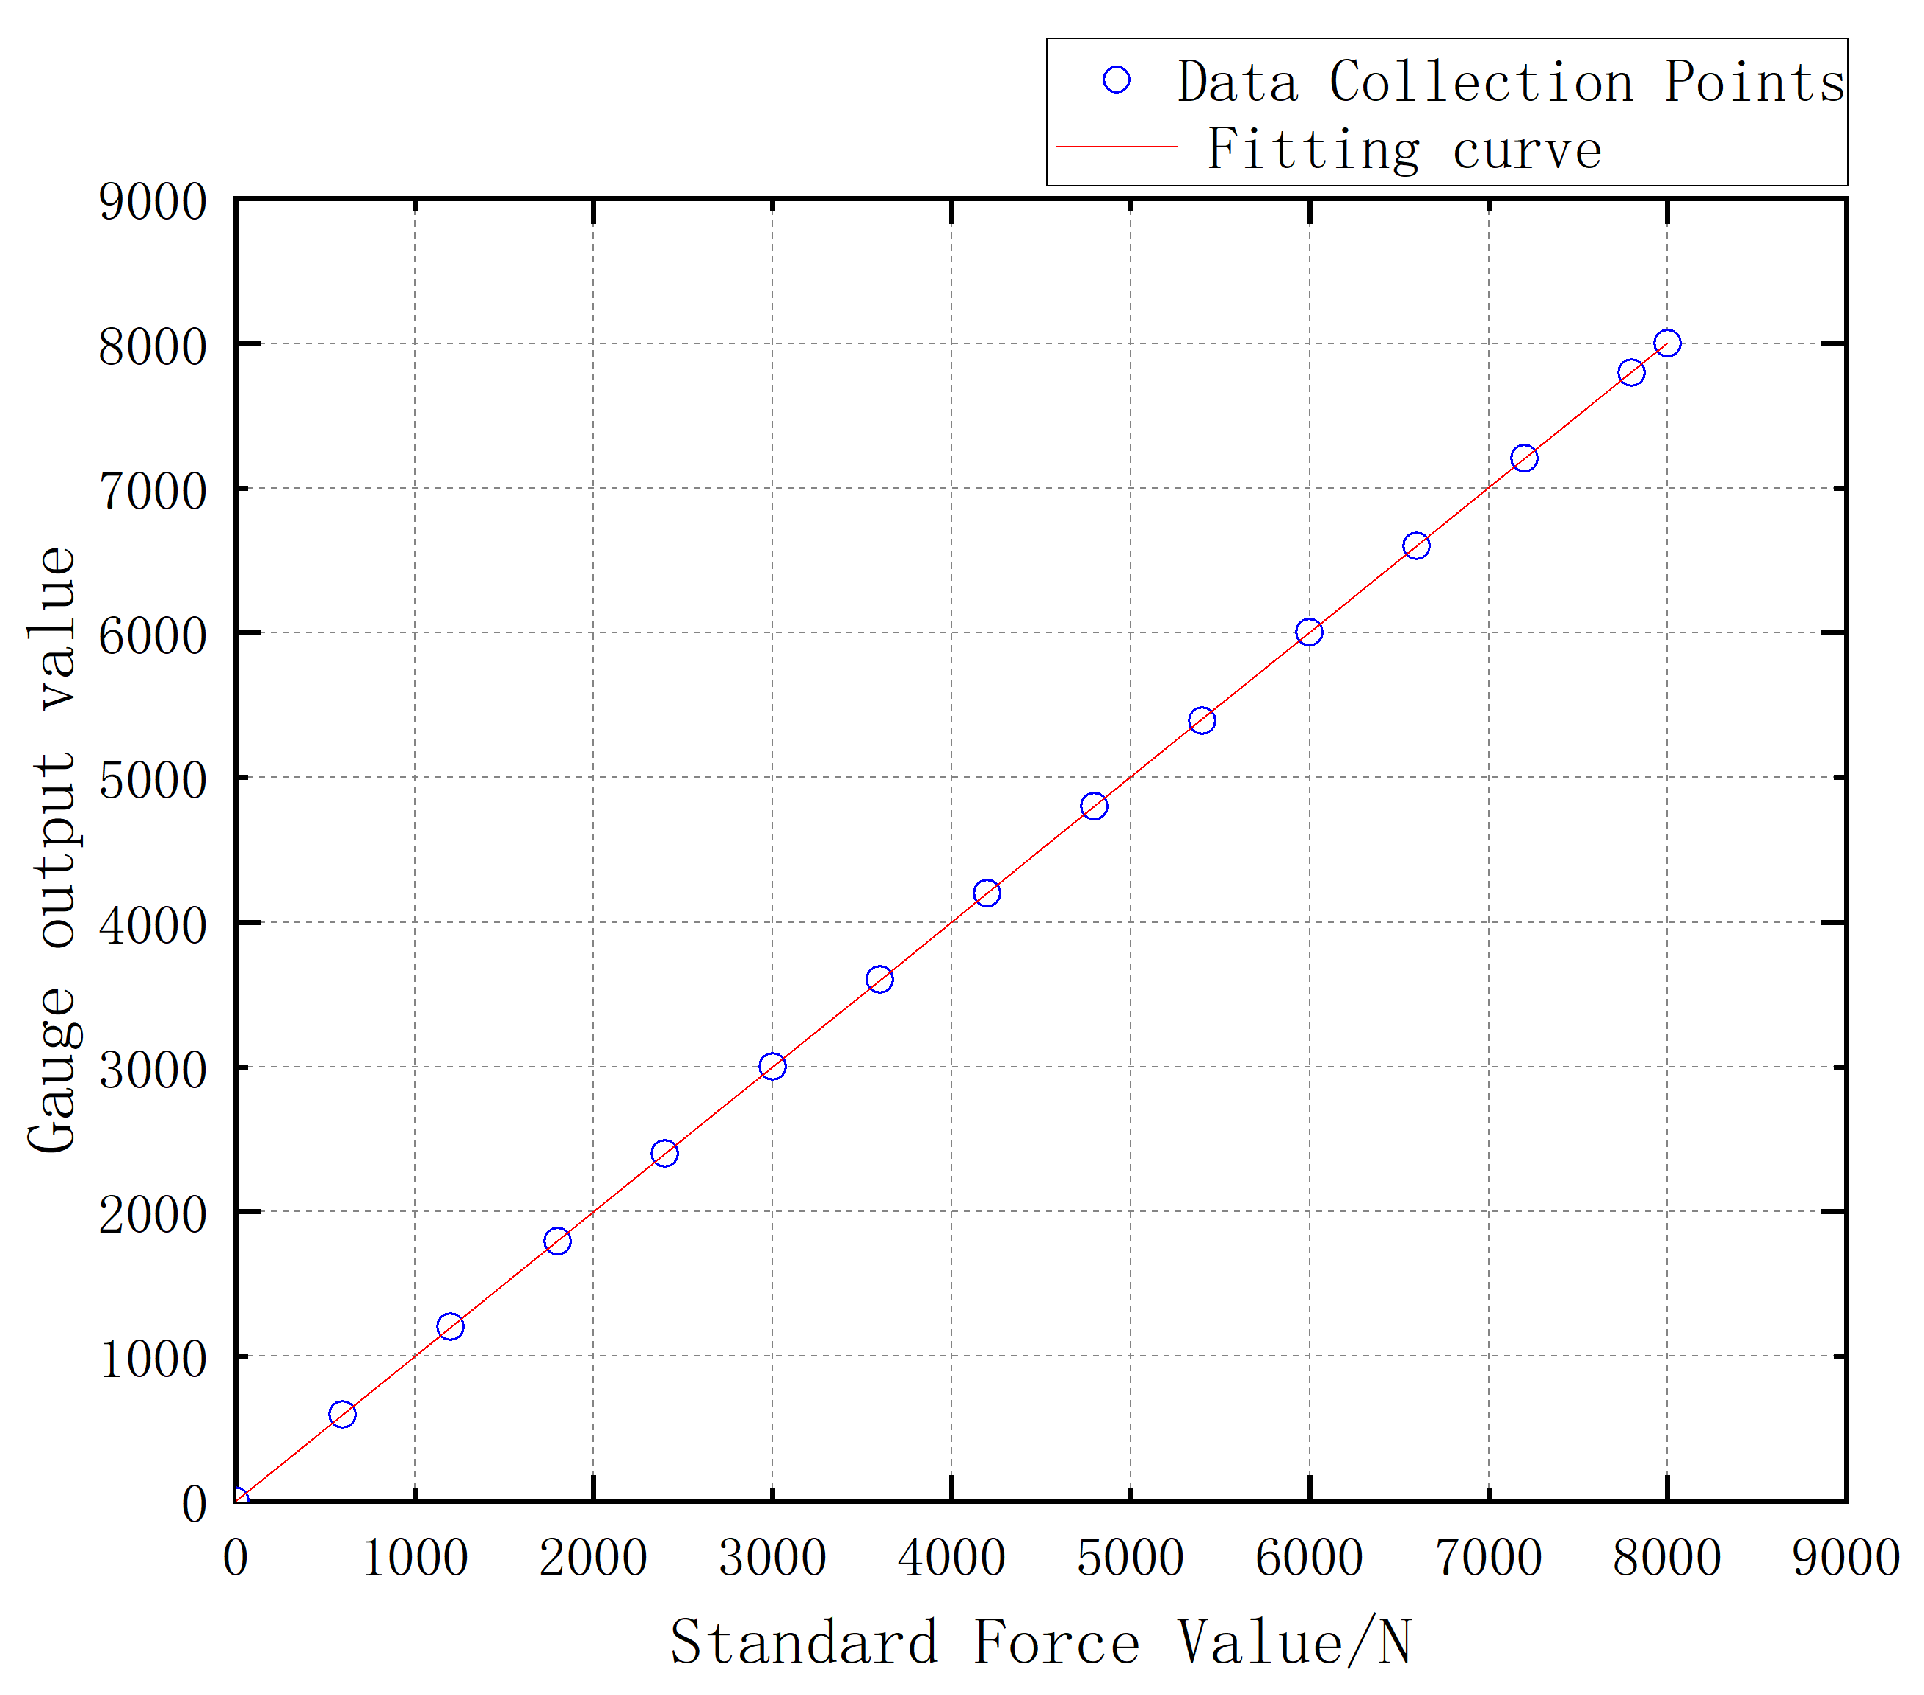

Table 1.
Expected indicators for the miniature measuring instrument.
| Main technical indicators | Expected parameters |
|---|---|
| Range | 0-8000N |
| Sampling rate | 1000Hz |
| Measurement accuracy | 3%FS |
| Measuring time | >20 minutes |
| Weight | <500g |
Table 2.
Selection of hardware module Ⅰ of the acquisition system.
| Designation | Models |
|---|---|
| Microcontroller | ESP32C3-32S-Kit Development Board |
| A/D Sampling Module | ADS8689 Module |
| Strain Gage Module | Single Bridge Strain Gage Module |
| Strain Gage | BF350-3AA |
| Batteries | 603040 |
| Battery Charging Module | ETA9742 Module |
Table 3.
Performance Parameters of Signal Acquisition System Hardware Module I.
| Technical Indicators | Technical Parameters |
|---|---|
| Hardware Module Size | 67.8mm×33.84mm×21.63mm |
| Weights | 56.2g |
| A/D Sampling Module Resolution | 16-bit |
| Sampling Rate | 100kHz |
| Channel Number | 8 channels |
| Supply Voltage | 5V analog power supply, 1.65V-5.12V digital power supply |
| Battery Capacity | 800mAh |
Table 4.
Signal Acquisition System Hardware Module II.
| Designation | Models |
|---|---|
| Microcontroller | ESP32C3-32S-Kit Development Board |
| A/D Sampling Module | ADS8689 Module |
| Strain Gage | BF350-3AA |
| Batteries Battery Charging Module |
603040 ETA9742 Module |
Table 5.
Comparison of technical parameters.
| Technical indicators | Signal acquisition system hardware module Ⅰ | Signal acquisition system hardware module Ⅱ |
|---|---|---|
| Hardware Module Dimensions | 67.8mm×33.84mm×21.63mm | 49.19mm×28.22mm×22.78mm |
| Weight | 56.2g | 30g |
| A/D Sampling Module Resolution | 16 bits | 24 bits |
| Sampling Rate | 100kHz | 1000Hz |
| Number of Channels | 8 channels | Single Channel |
| Strain gage | 1/4 bridge strain gage | Two half-bridge strain gages to form a full bridge |
| Battery Capacity | 800mAh | 400mAh |
Table 6.
Parameters related to parachute cords.
| Material | Width | Thickness | Tensile Strength |
|---|---|---|---|
| Parachute cord | 3.5mm | 1mm | 3KN |
Table 8.
Test data of elastomer structure I and II.
| Standard force value/N | Elastomer structure II test data |
Elastomer structure III test data |
|---|---|---|
| 0 | 0 | 0 |
| 599 | 599 | 598 |
| 1199 | 1190 | 1200 |
| 1799 | 1785 | 1799 |
| 2399 | 2362 | 2401 |
| 2999 | 2953 | 3003 |
| 3599 | 3554 | 3604 |
| 4199 | 4153 | 4208 |
| 4795 | 4771 | 4804 |
| 5395 | 5354 | 5408 |
| 5995 | 5938 | 6003 |
| 6595 | 6532 | 6604 |
| 7195 | 7123 | 7213 |
| 7795 | 7724 | 7808 |
| 7995 | 7913 | 8006 |
Table 9.
Test data received by the upper computer.
| Standard force value/N | Test data | Fitting data | Bias value of the fit|△Lm| | Percentage of error% |
|---|---|---|---|---|
| 0 | 0 | 0 | 0 | 0.00% |
| 599 | 598 | 597 | 1 | 0.17% |
| 1199 | 1200 | 1198 | 2 | 0.17% |
| 1799 | 1799 | 1798 | 1 | 0.06% |
| 2399 | 2401 | 2399 | 2 | 0.08% |
| 2999 | 3003 | 3000 | 3 | 0.10% |
| 3599 | 3604 | 3600 | 4 | 0.11% |
| 4199 | 4208 | 4201 | 7 | 0.17% |
| 4799 | 4804 | 4801 | 3 | 0.06% |
| 5399 | 5408 | 5402 | 6 | 0.11% |
| 5999 | 6003 | 6002 | 1 | 0.02% |
| 6599 | 6604 | 6603 | 1 | 0.02% |
| 7199 | 7213 | 7204 | 9 | 0.13% |
| 7799 | 7808 | 7804 | 4 | 0.05% |
| 8000 | 8006 | 8005 | 1 | 0.01% |
Table 10.
Repeatability test experimental data for miniature measuring instrument (gradual increase in pulling force).
Table 10.
Repeatability test experimental data for miniature measuring instrument (gradual increase in pulling force).
| Standard force value/N | S1 | S2 | S3 | maximum error△Rmax | Percentage of error% |
|---|---|---|---|---|---|
| 0 | 0 | 0 | 0 | 0 | 0.00% |
| 599 | 596 | 598 | 597 | 3 | 0.50% |
| 1199 | 1197 | 1202 | 1200 | 3 | 0.25% |
| 1799 | 1800 | 1795 | 1797 | 5 | 0.28% |
| 2399 | 2397 | 2399 | 2398 | 2 | 0.08% |
| 2999 | 2995 | 3003 | 2997 | 4 | 0.13% |
| 3599 | 3597 | 3602 | 3599 | 3 | 0.08% |
| 4199 | 4200 | 4197 | 4198 | 4 | 0.10% |
| 4799 | 4800 | 4799 | 4797 | 3 | 0.06% |
| 5399 | 5400 | 5391 | 5397 | 8 | 0.15% |
| 5999 | 5995 | 6002 | 6000 | 4 | 0.07% |
| 6599 | 6600 | 6597 | 6599 | 3 | 0.05% |
| 7199 | 7200 | 7204 | 7197 | 5 | 0.07% |
| 7799 | 7803 | 7797 | 7807 | 8 | 0.10% |
| 7999 | 8000 | 8002 | 7996 | 8 | 0.10% |
Table 11.
Experimental data for hysteresis test of miniature measuring instrument.
| Standard force value/N | Positive range test data | Reverse range test data | Difference△Hm | Percentage of error% |
|---|---|---|---|---|
| 0 | 0 | 0 | 0 | 0% |
| 599 | 600 | 601 | 1 | 0.17% |
| 1199 | 1200 | 1202 | 2 | 0.17% |
| 1799 | 1798 | 1801 | 3 | 0.17% |
| 2399 | 2402 | 2403 | 4 | 0.17% |
| 2999 | 3004 | 3007 | 7 | 0.23% |
| 3599 | 3602 | 3604 | 4 | 0.11% |
| 4199 | 4201 | 4202 | 1 | 0.02% |
| 4799 | 4802 | 4803 | 2 | 0.04% |
| 5399 | 5403 | 5405 | 5 | 0.09% |
| 5999 | 6005 | 6006 | 6 | 0.10% |
| 6599 | 6604 | 6606 | 3 | 0.05% |
| 7199 | 7204 | 7205 | 2 | 0.03% |
| 7799 | 7804 | 7805 | 2 | 0.03% |
| 8099 | 8104 | 8105 | 2 | 0.02% |
Table 12.
Experimental data for linearity test of miniature measuring instrument.
| Standard force value/N | Test data | Fitting data | Bias value of the fit|△Lm| | Percentage of error% |
|---|---|---|---|---|
| 0 | 0 | 0 | 0 | 0.00% |
| 599 | 598 | 597 | 1 | 0.17% |
| 1199 | 1200 | 1198 | 2 | 0.17% |
| 1799 | 1799 | 1798 | 1 | 0.06% |
| 2399 | 2401 | 2399 | 2 | 0.08% |
| 2999 | 3003 | 3000 | 3 | 0.10% |
| 3599 | 3604 | 3600 | 4 | 0.11% |
| 4199 | 4205 | 4201 | 4 | 0.10% |
| 4799 | 4804 | 4801 | 3 | 0.06% |
| 5399 | 5405 | 5402 | 3 | 0.06% |
| 5999 | 6003 | 6002 | 1 | 0.02% |
| 6599 | 6604 | 6603 | 1 | 0.02% |
| 7199 | 7209 | 7204 | 5 | 0.07% |
| 7799 | 7808 | 7804 | 4 | 0.05% |
| 8000 | 8006 | 8005 | 1 | 0.01% |
Table 13.
Miniature measuring instrument performance indicators.
| Performance indicators | Technical Parameters |
|---|---|
| Instrument Dimensions | 96mm×36mm×29.5mm(L x W x H) |
| Weight | 291g |
| Endurance | >20min |
| Range | 0~8000N |
| Resolution | 1N |
| Sensitivity | 1mV/V |
| Repeatability | 0.1% |
| Hysteresis | 0.1% |
| Linearity | 0.1% |
| Accuracy | 0.1732% |
Disclaimer/Publisher’s Note: The statements, opinions and data contained in all publications are solely those of the individual author(s) and contributor(s) and not of MDPI and/or the editor(s). MDPI and/or the editor(s) disclaim responsibility for any injury to people or property resulting from any ideas, methods, instructions or products referred to in the content. |
© 2024 by the authors. Licensee MDPI, Basel, Switzerland. This article is an open access article distributed under the terms and conditions of the Creative Commons Attribution (CC BY) license (https://creativecommons.org/licenses/by/4.0/).
Copyright: This open access article is published under a Creative Commons CC BY 4.0 license, which permit the free download, distribution, and reuse, provided that the author and preprint are cited in any reuse.


