Submitted:
30 August 2024
Posted:
02 September 2024
You are already at the latest version
Abstract
Balancing the levels of ammonia, in poultry facilities plays a role in enhancing the welfare and productivity of animals. Various environmental factors such as temperature, humidity, ammonia concentrations, carbon dioxide concentration and exposure to light have an impact on the wellbeing and efficiency of poultry. It is essential to monitor these elements to achieve outcomes necessitating practical, reliable and cost-effective solutions. Leveraging the Internet of Things (IoT) in conjunction with LoRa-WAN (Long Range Wide Area Network) technology presents an opportunity in the industry by enhancing connectivity among devices and facilitating real time data transmission. This research introduces a hardware and software setup for monitoring conditions at poultry farms through LoRa WAN and IoT technologies. More-over researchers employed Random Forest Machine Learning prediction models to tune the concentration of Ammonia (NH3) in poultry facilities across a wide area or multiple Poultry houses. Comparative assessments were conducted to evaluate the proposed system against devices revealing a correlation exceeding 0.9830 between the sensors and standard equipment while costing 28% less than traditional tools. The prototype displayed outcomes underscoring its potential, for managing poultry facilities across multiple farms with centralized oversight.
Keywords:
Machine Learning
; Random Forest
; LoRa (Long range)
; Internet of Things
; Smart Poultry Farm
; Ammonia gas Optimization
1. Introduction
Poultry Industry has made great progresses in the recent years through huge developments in genetics of birds as well as improvements in nutrition, medicine and management. Environmental conditions inside the poultry house have a direct and major effect on maximizing productivity and wellness of the poultry. Conditions such as temperature, humidity, ammonia, light in the poultry house will directly affect health and performance of the poultry. It is required to have regular monitoring on these parameters and adjust the house curtain, open the fans, use the exhaust systems and nebulizers in time for live the best conditions.
These environmental factors had previously been measured either manually or with individual commercially available data loggers, whilst the measurements required a human interaction for the data collection and were also quite costly – and most devices logged the measurements independently of each other, which means that in order to gather measurements for different parameters, one needs to use different devices, which can lead to large number of devices to be used.
Thanks to the development of Information Technology, managing various devices connecting each other and exchanging fast date are now easily performed, making timely decisions to tackle agricultural issues necessary. The choice of modern technology is utilized to assist in training farming expertise and linking more efficient field sensors to data system to utilize IoT device.
To tackle the problems and potential opportunities we proposed a low budget device to monitor temperature, humidity, CO2 level, NH3 level and light more precisely in chicken house. This solution combined LoRa-WAN network and Random Forest prediction model to achieve remote sensing and real-time data transmission over the internet. This technology can also support storage and analysis of huge amount of data, which can be used in improving management of ammonia level more reasonably. The proposed solution can enhance overall environmental management for poultry industry by achieving high production, raising cost-effectiveness and improves animal welfare.
1.1. Environment of Poultry Farming
The welfare and performance of Chicken can be affected by the conditions in which chickens are kept (Janczak & Riber, 2015). The changes in thermal comfort level representing various age groups are important factors to set the ideal temperature range of every shed during chick-up period as stated above. Heat stress and cold stress can negatively affect the welfare, appetite for feed as well susceptibility to diseases leading higher flock mortalities among all types of poultry (Gebregeziabhear & Ameha;, 2015).
The general discriminant humidity in a shed should be maintained within 50% and 70%. Low relative humidity results in the heating effect due to higher rates of evaporative heat dissipation causing dry mucosa and airways. In the other side, grill chicken quality is influenced by high temperatures and humidity (%) (Najafi et al., 2015). Ammonia (NH3) is created by the decomposition of organic matter in litter and excreta (Nkoa, 2014) which decomposed into microorganisms from both types of chicken farms. Airborne ammonia (NH3) concentrations are highly toxic, and should be maintained below 10 ppm (parts per million) to protect human [2] and animal health as well as limit the potential for subclinical lung irritation which may reduce animal performance.
In actuality within a poultry house in India, real-time data shows that concentrations of ammonia (NH₃) range between 20 ppm and 30 ppm during normal functioning conditions. This would always a health issue for birds and ultimately us as well with all of them being together in such close proximity. Our results emphasize the importance of ammonia on poultry health and production, promoting efficient strategies to monitor this compound.
The Light intensity can also alter their development. If daily hours of light do not reach the levels they are supposed to, birds may ingest less food and have delayed sexual maturity (Jácome et al., 2014; Pan et al., 2014). Therefore, temperature (T), relative humidity (RH), ammonia emitted to the air and light intensity inside poultry housing are factors that need to be monitored constantly[1]. This monitoring method will allow poultry farmers to identify a situation in real time and react accordingly, eventually offering the best-living conditions possible for birds.
1.2. Internet of Things
Advances in information technology, the internet and electrical devices have enabled previously isolated gadgets to be connected online (Vanelli & Silva, 2017). This enables production process optimization which is one of the thousands commercial opportunities present by Internet of Things. The term "Internet of things" stems from the realization that Internet protocol can get to everything, and devices communicate with one another in order for new complex functionalities [1] by 2008-09 there were more connected devices than human beings on Earth.
Based on the statement of Gomes and Bianchini 2016 that there is a rapid growth in employing wireless sensor networking technologies, including most important sector that is Agriculture. Wireless networks are the major Internet of Things enabling technology and Wi-Fi is one of its representatives (Al-Falahy, Alani 2018). The Wi-Fi standard (802.11), which arrived in 1990, has done an exceptional job of compatibility. Wi-Fi networks run on frequencies such as 2.4 GHz and 5 GHz with different signal ranges; it is simple to establish a Wi-Fi network (Schreiber et al., 2018).
Now, we have an IoT device that is ESP32, this module has an embedded system because the microcontroller can connect to Wi-Fi networks and it supports network protocols like TCP/IP (Hlaing et al., 2017). This inexpensive module the largest and fastest growing customer base. The ESP32 with the “DOIT ESP32 DEVKIT v1” board that is particularly suitable for Internet of Things applications, in terms user-friendliness also includes all essential features required during development and prototyping (Asnawi & Syukriasari, 2019). This module has the “X-tensa” dual-core 32-bit 6th generation microprocessor, operating at 240 MHz and performing at up to 600 DMIPS (Dhrystone Million Instruction Per Seconds). This is best IoT module for handling the data processing for LoRa module.
1.3. LoRa Technology
LoRa (Long Range) is a wireless system that was developed for low-energy, long range communications used in enhancing the Internet of Things technology. It works in sub-gigahertz frequency bands like 868 MHz for Europe, 915 MHz for North America (Augustin et al.,2016) but at present, Only 915 MHz band is available in India. The LoRa technology enables long-range data transmission of up to a few kilometers in urban environments, and several kilometers in rural areas with reliable connectivity for range of application (Petäjäjärvi et al., 2017). In the LoS (Line of Sight) the LoRa device can provide the connectivity for the range of 12 Kilometers (Approx.).
Low power consumption and Small size is LoRa's main advantage, and devices run on batteries can last for years. According to Sornin et al. This functionality is particularly well suited for remote monitoring where regular maintenance can be difficult task. Another that feature is spread-spectrum modulation, which LoRa also employs to make it more powerful and reliable against interference. The spread spectrum modulation techniques derived from chirp spread spectrum (CSS) technology. It was developed by Cycleo, a company of Grenoble, France, and patented in 2014.
LoRa-WAN (Long Range Wide Area Network) works as the protocol for communication between LoRa devices and gateways, allowing seamless data transmission to central servers. LoRa technology is often deployed with LoRa-WAN. The LoRa technology offers the long range with 0.3 kb/s data rate (the data rate may increase by narrowing the spread factor). Due to its range, energy efficiency and reliable data transmission ability, the LoRa technology is a good candidate for monitoring environmental parameters in poultry farms. This enables the collection of real-time and location-specific data, thus leading to precision farming in animal husbandry i.e. knowledge-based approach towards timely preventive care for their welfare besides other efficiency driven productivity measures that need situation analysis on-ground).
1.3. Random Forest Algorithm
Random Forest is machine learning states for both regression and classification purposes with higher flexibility. It builds multiple decision trees (such as math model consisting of a number of if-then, else rules) during training & outputs the class that is mode of classes or mean prediction for regression tasks [Breiman, 2001]. Combining the benefits from various models, the ensemble method reduces type of overfitting on individual decision trees while improving prediction performance and robustness. Since Random Forests supports both continuous and categorical variables, they are suitable for processing large datasets that have many features. Another advantage of Random Forests compared to Gradient Boosting is that it can rank the importance of features in the prediction process, indicating which factors affect more or less on determining the result.
The Random Forest machine learning algorithm can be used in forecasts ammonia concentrations to improve overall environmental conditions within Poultry houses using real-time data and a number of environmental attributes (such as temperature, humidity, Carbon Dioxide (CO2) Concentration, Light Intensity etc.). The algorithm helps us identify the trends and correlations in data, which are not possible for human eyes to monitor manually allowing changes before levels reach a point of concern. According to Cutler et al., This predictive ability leads not only to welfare and production benefits for animals as outlined above but also can lead into practical management such that ongoing manual observation is much reduced (Paniccia et al. 2007). Combining Random Forest Machine Learning Algorithm with Internet of Things (IoT)-based LoRa monitoring systems is a robust approach to enhance chicken farming precision agriculture.
2. Materials and Methods
The electronic device described in the article uses electronics hardware, LoRa device and Internet of Things (IoT) networking concepts to monitor environmental conditions. People may record and track real-time data on temperature in degree Celsius, humidity in percentage, ammonia (NH3) concentration in ppm (parts per million), carbon dioxide (CO2) concentration in ppm (parts per million) and light intensity in Lux (luminosity) by utilizing this device in conjunction with its intended purpose. With this configuration, quick data analysis is possible, and chicken producers may make decisions more easily based on environmental data.[1]
2.1. Proposed Hardware
In hardware, we used the appropriate sensors those are determined by factors including range and cost. The DHT11 sensor (temperature sensing range -10°C to 60°C and air humidity sensing ranges 10% to 90%) is used for monitoring the ambient temperature and relative air humidity. The concentration of ammonia (NH3) in the air was measured with an MQ-137 electrochemical sensor (2-200 parts per million with response time of 60 seconds). The MQ-135 sensor is used for carbon-dioxide (CO2) sensing, where the detection range is 5 to 3000 parts per million. The light intensity (luminosity) is determined by using the light-dependent resistor (LDR) that has resistance reduced in the light and increased under darkness.
The complete device that we created used an ESP-32 CPU (central processing unit), in which the Bluetooth and Wi-Fi are integrated. The ESP32 with the “DOIT ESP32 DEVKIT v1” board that is particularly suitable for Internet of Things applications. This module has dual-core 32-bit 6th generation microprocessor. The ESP-32 was chosen because the adaptability of this micro can read different sensors. The LoRa (Long Range) communication module, which has a low-power and long-range wireless transmission characteristic, is convenient for agricultural equipment that spreads over large areas.
2.2. Proposed Software
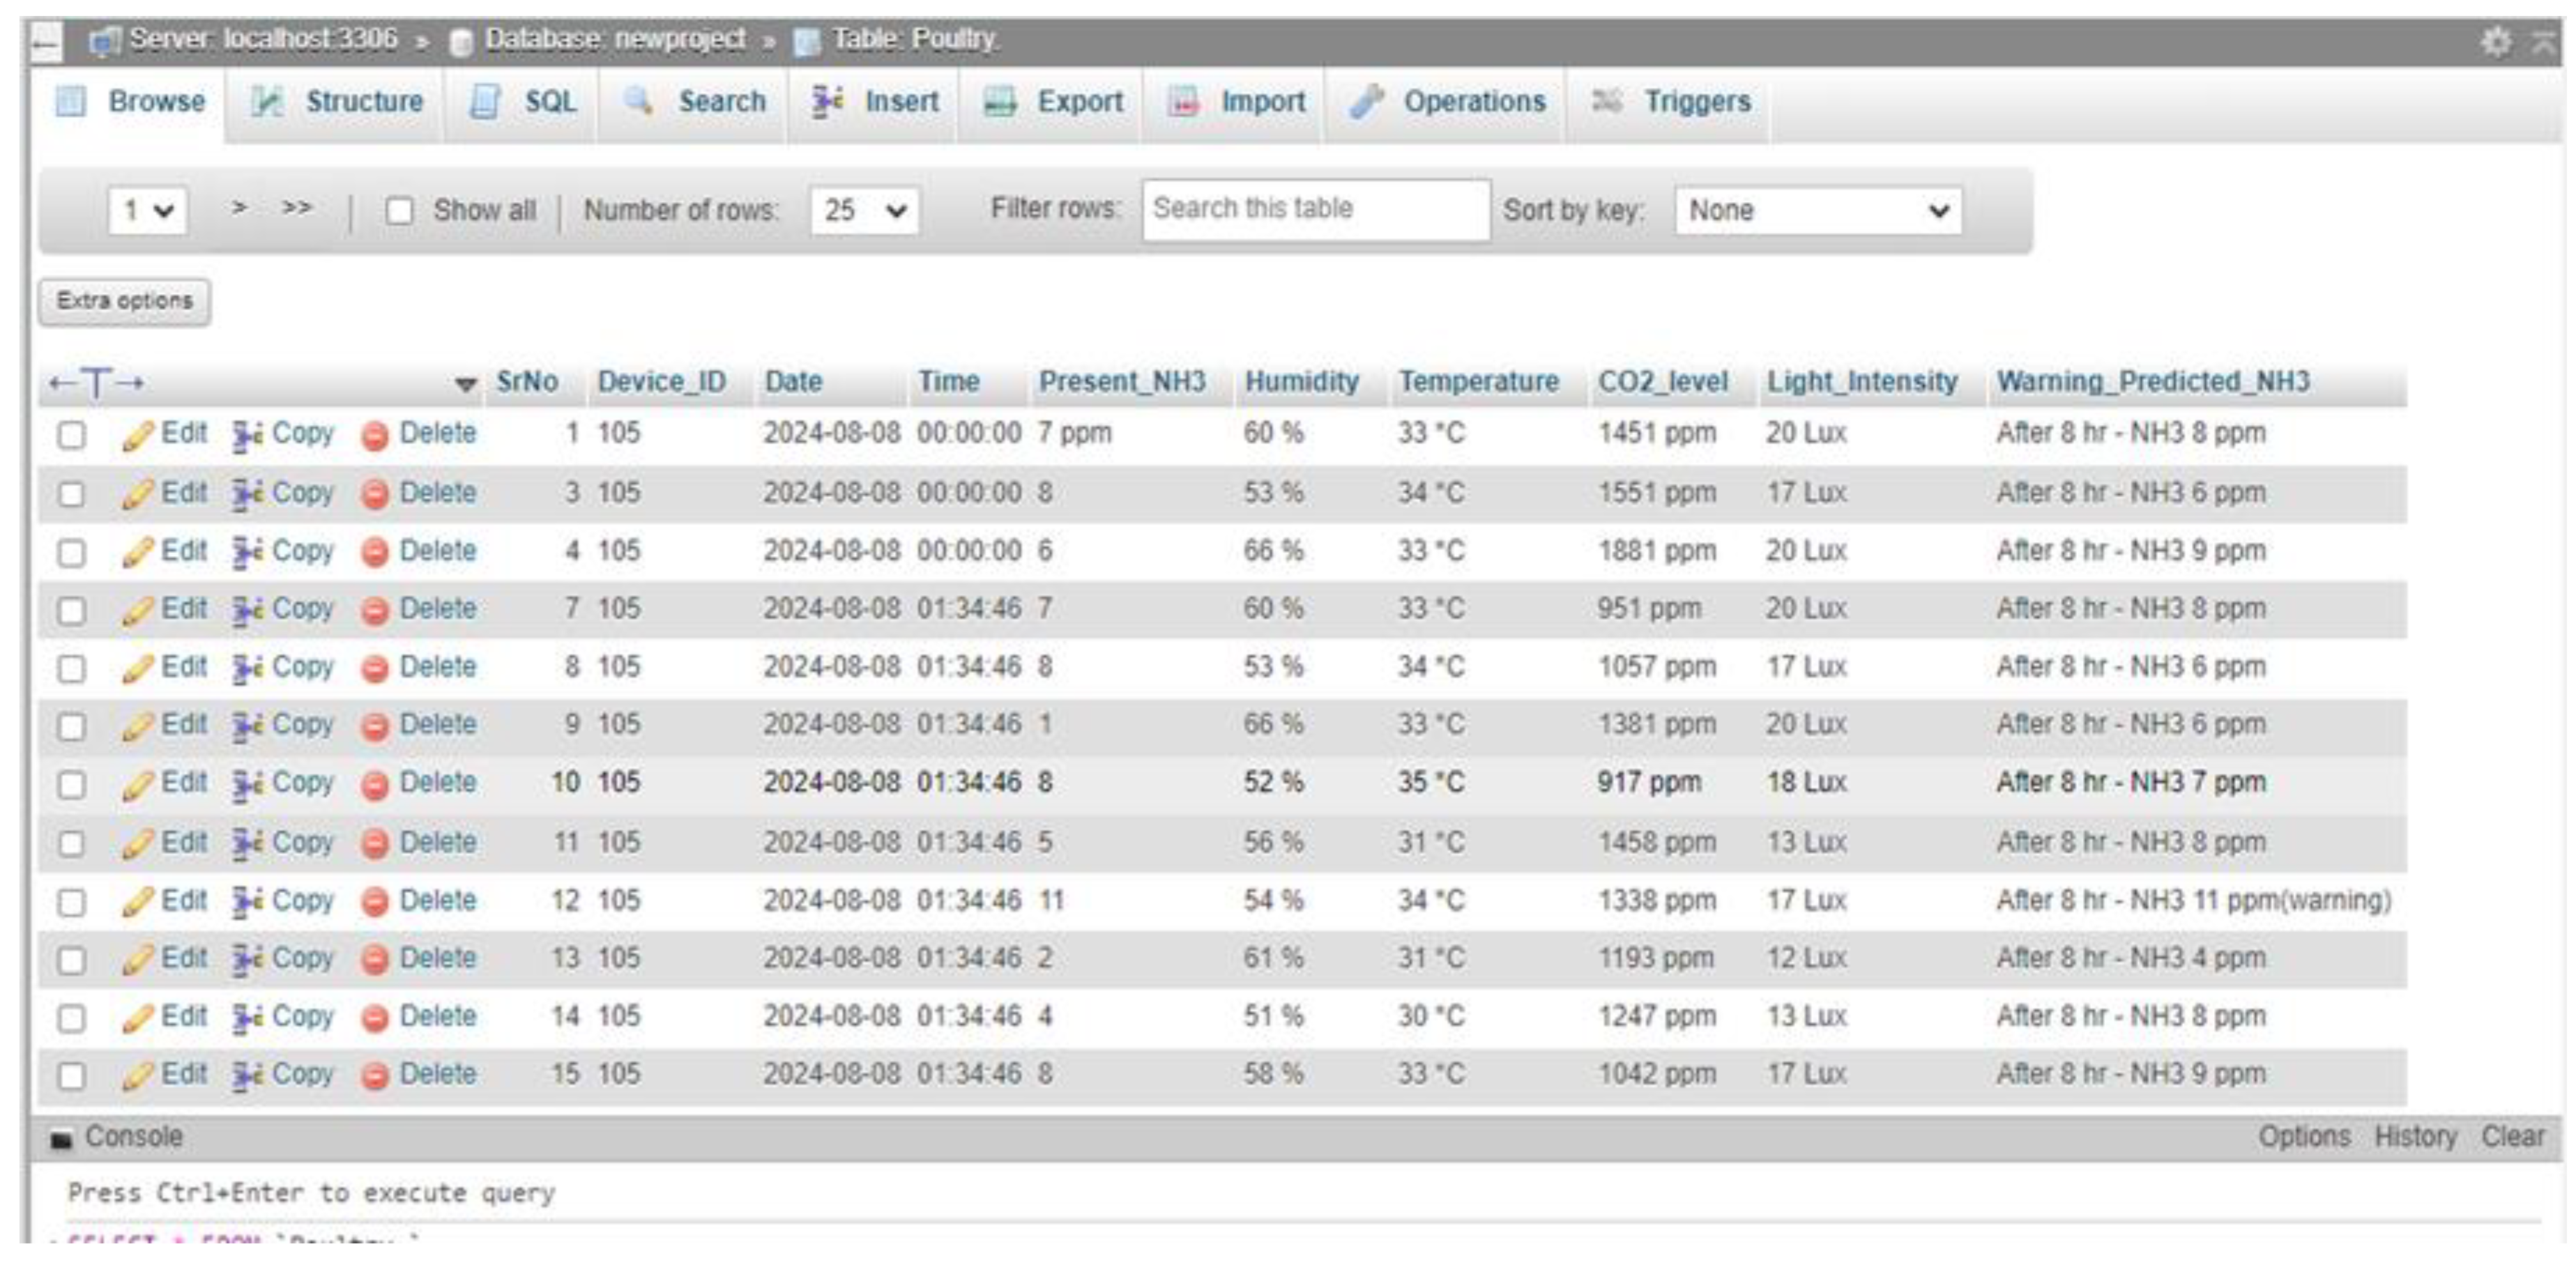
For environmental parameter management and monitoring, we have created a cloud-based solution. For this we used a GoDaddy-based server database, which is able to handle and store environmental sensor data provided by the environmental sensor installed in particular poultry house, with the help of IoT and LoRa based system. We have created the primary data table in the database named as “Poultry” (we can see in Figure 2.2.1), it has the following parameters:
- Sr. No.
- ID (Location Symbol of the Poultry Farm)
- NH3 (Ammonia) Level
- Humidity
- Temperature
- CO2 Level
- Light Intensity
- Status (it has the warning or predictions).
Figure 2.1.1.
Block Diagram of Poultry Houses Monitoring system (LoRa-WAN).
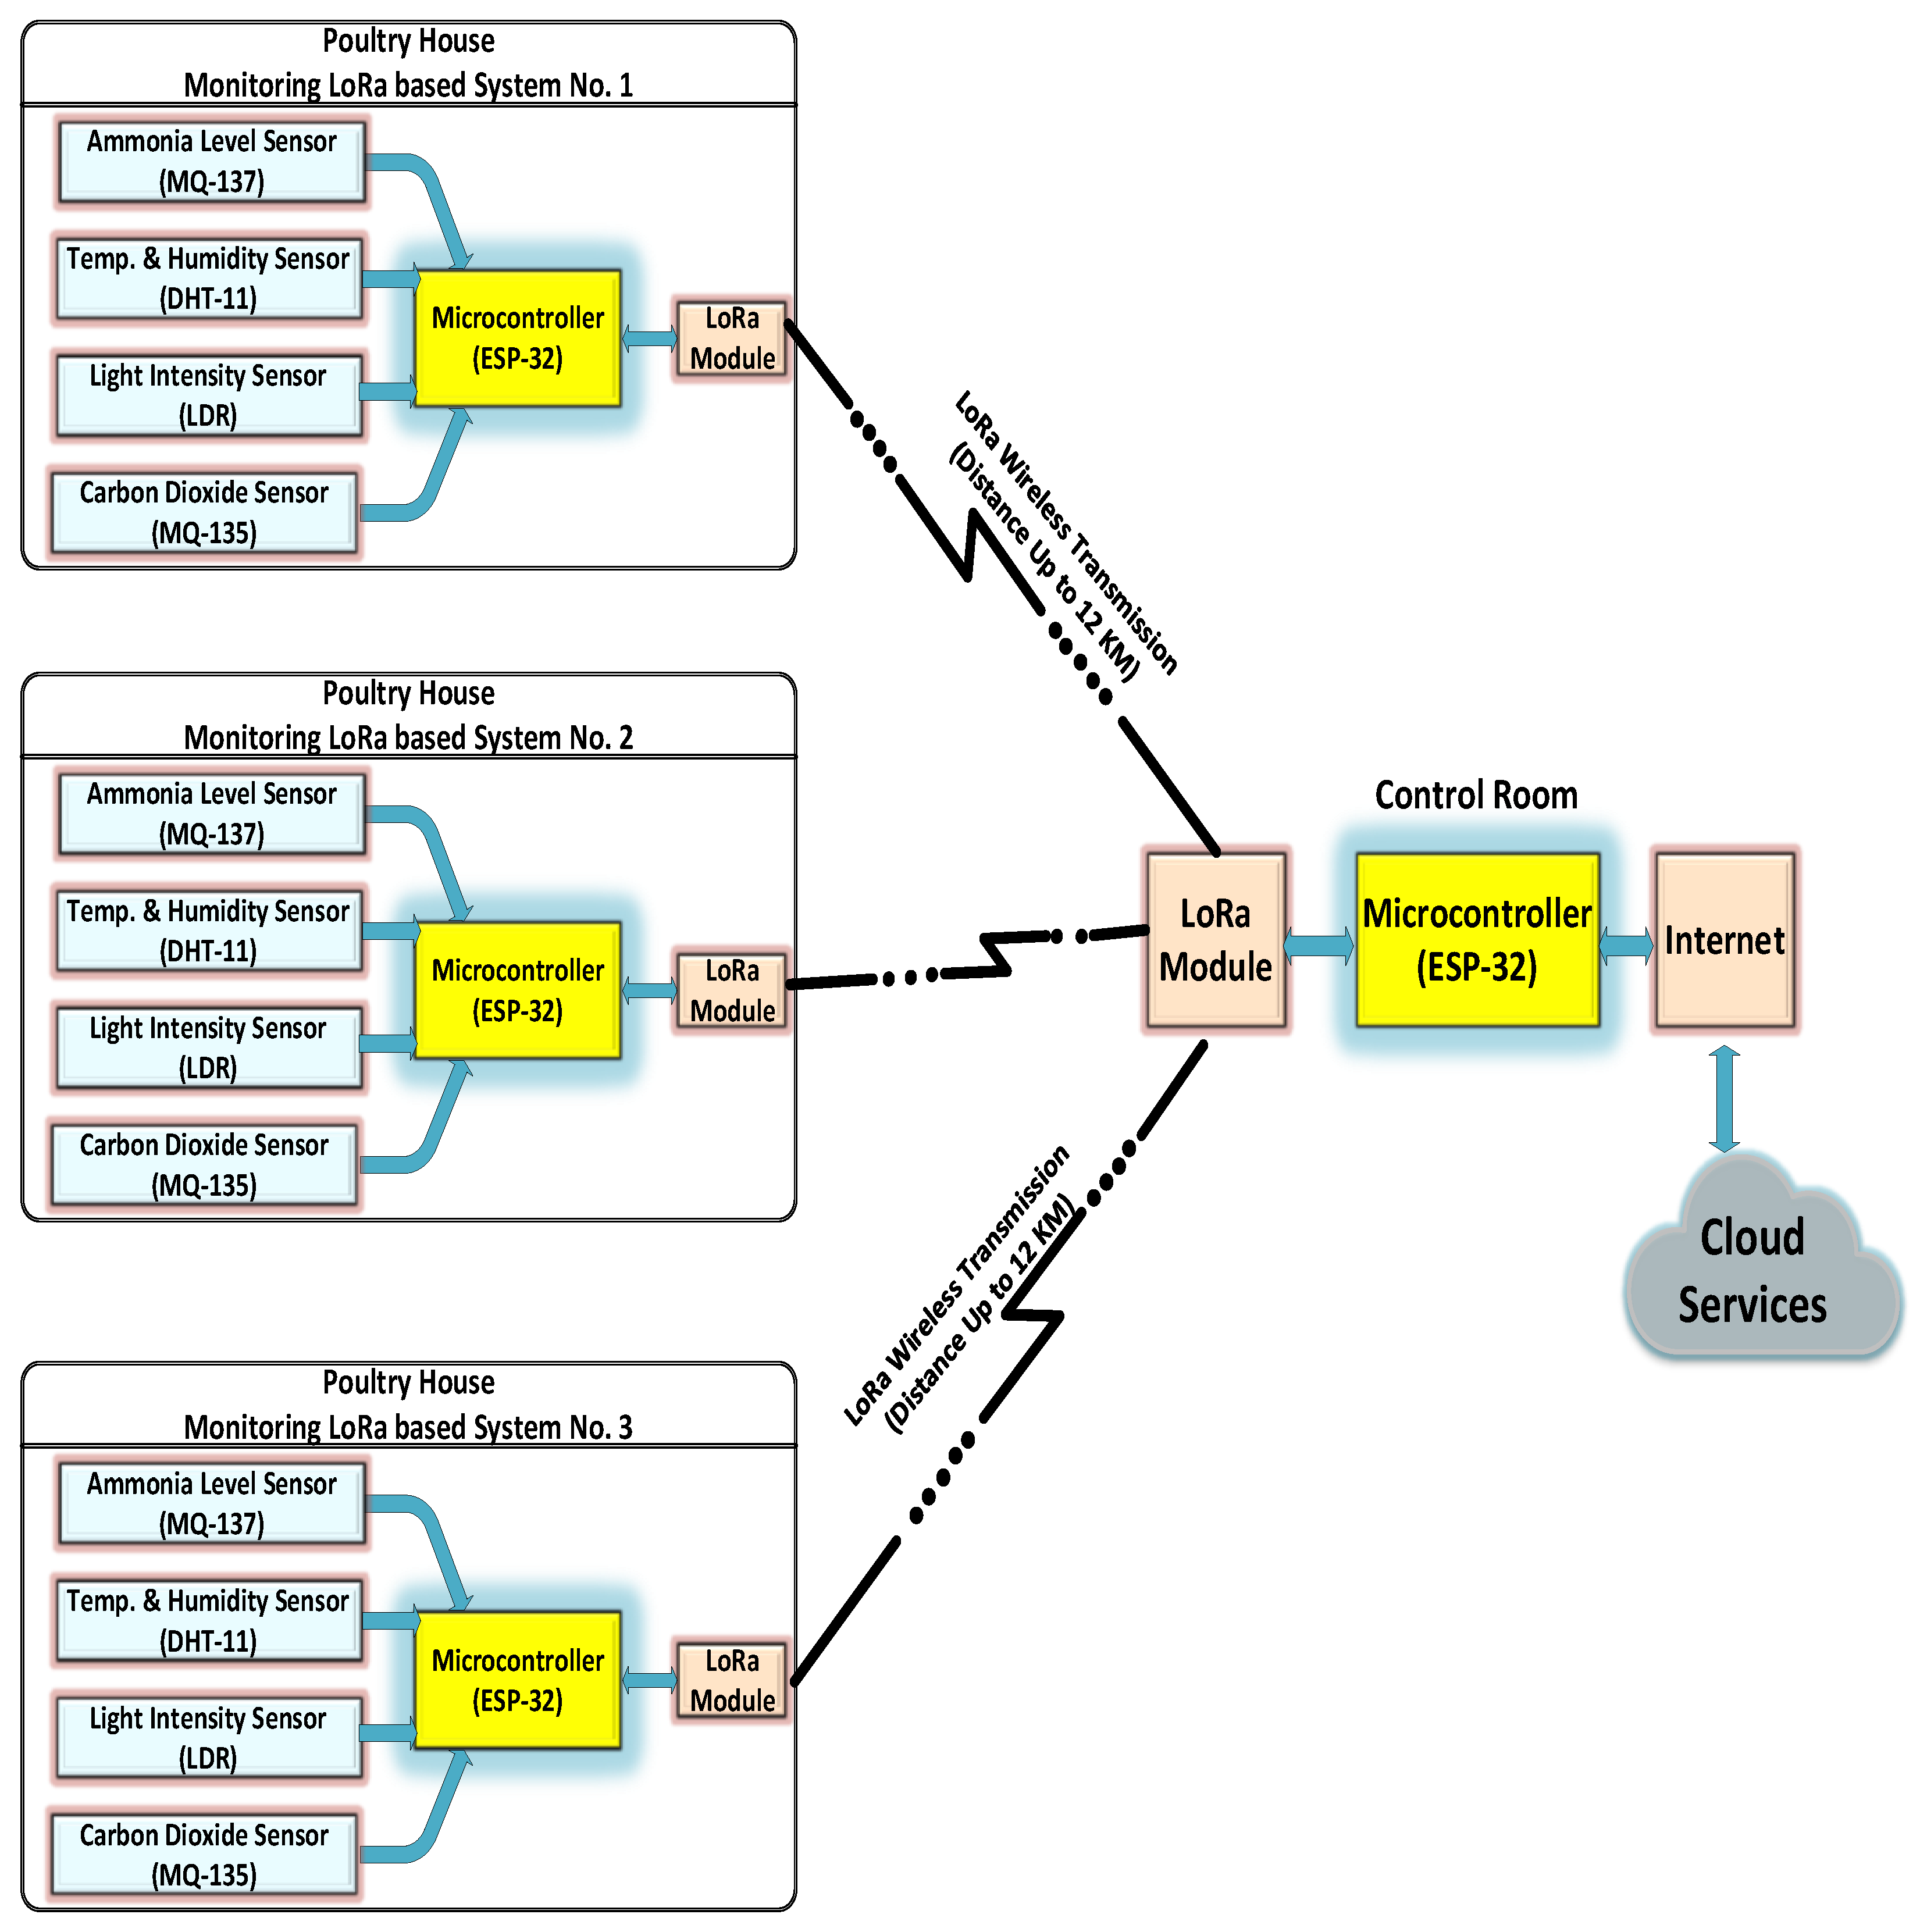
Figure 2.2.1.
Structure of the "Poultry" table in the GoDaddy server database.
2.2.1. Random Forest Machine Learning Model API
We have developed a Random Forest Machine Learning model, and deployed as an API (Application Programming Interface) to predict the concentration values of ammonia (NH3). This API is called by server to take predictions and fetches environmental data from the database and send the prediction back to database for further web page updating. Below is the Work-flow of system: -
- Data Retrieval: The API looks up the table named as "Poultry" and certain environmental parameters data.
- Output: The Random Forest Machine Learning Model predict the Ammonia (NH3) Concentration after processing the data provided.
- Data Update: This data will then get updated at the monitoring web page for the predicted NH3 levels within Database.
2.2.2. Web-Based Monitoring System
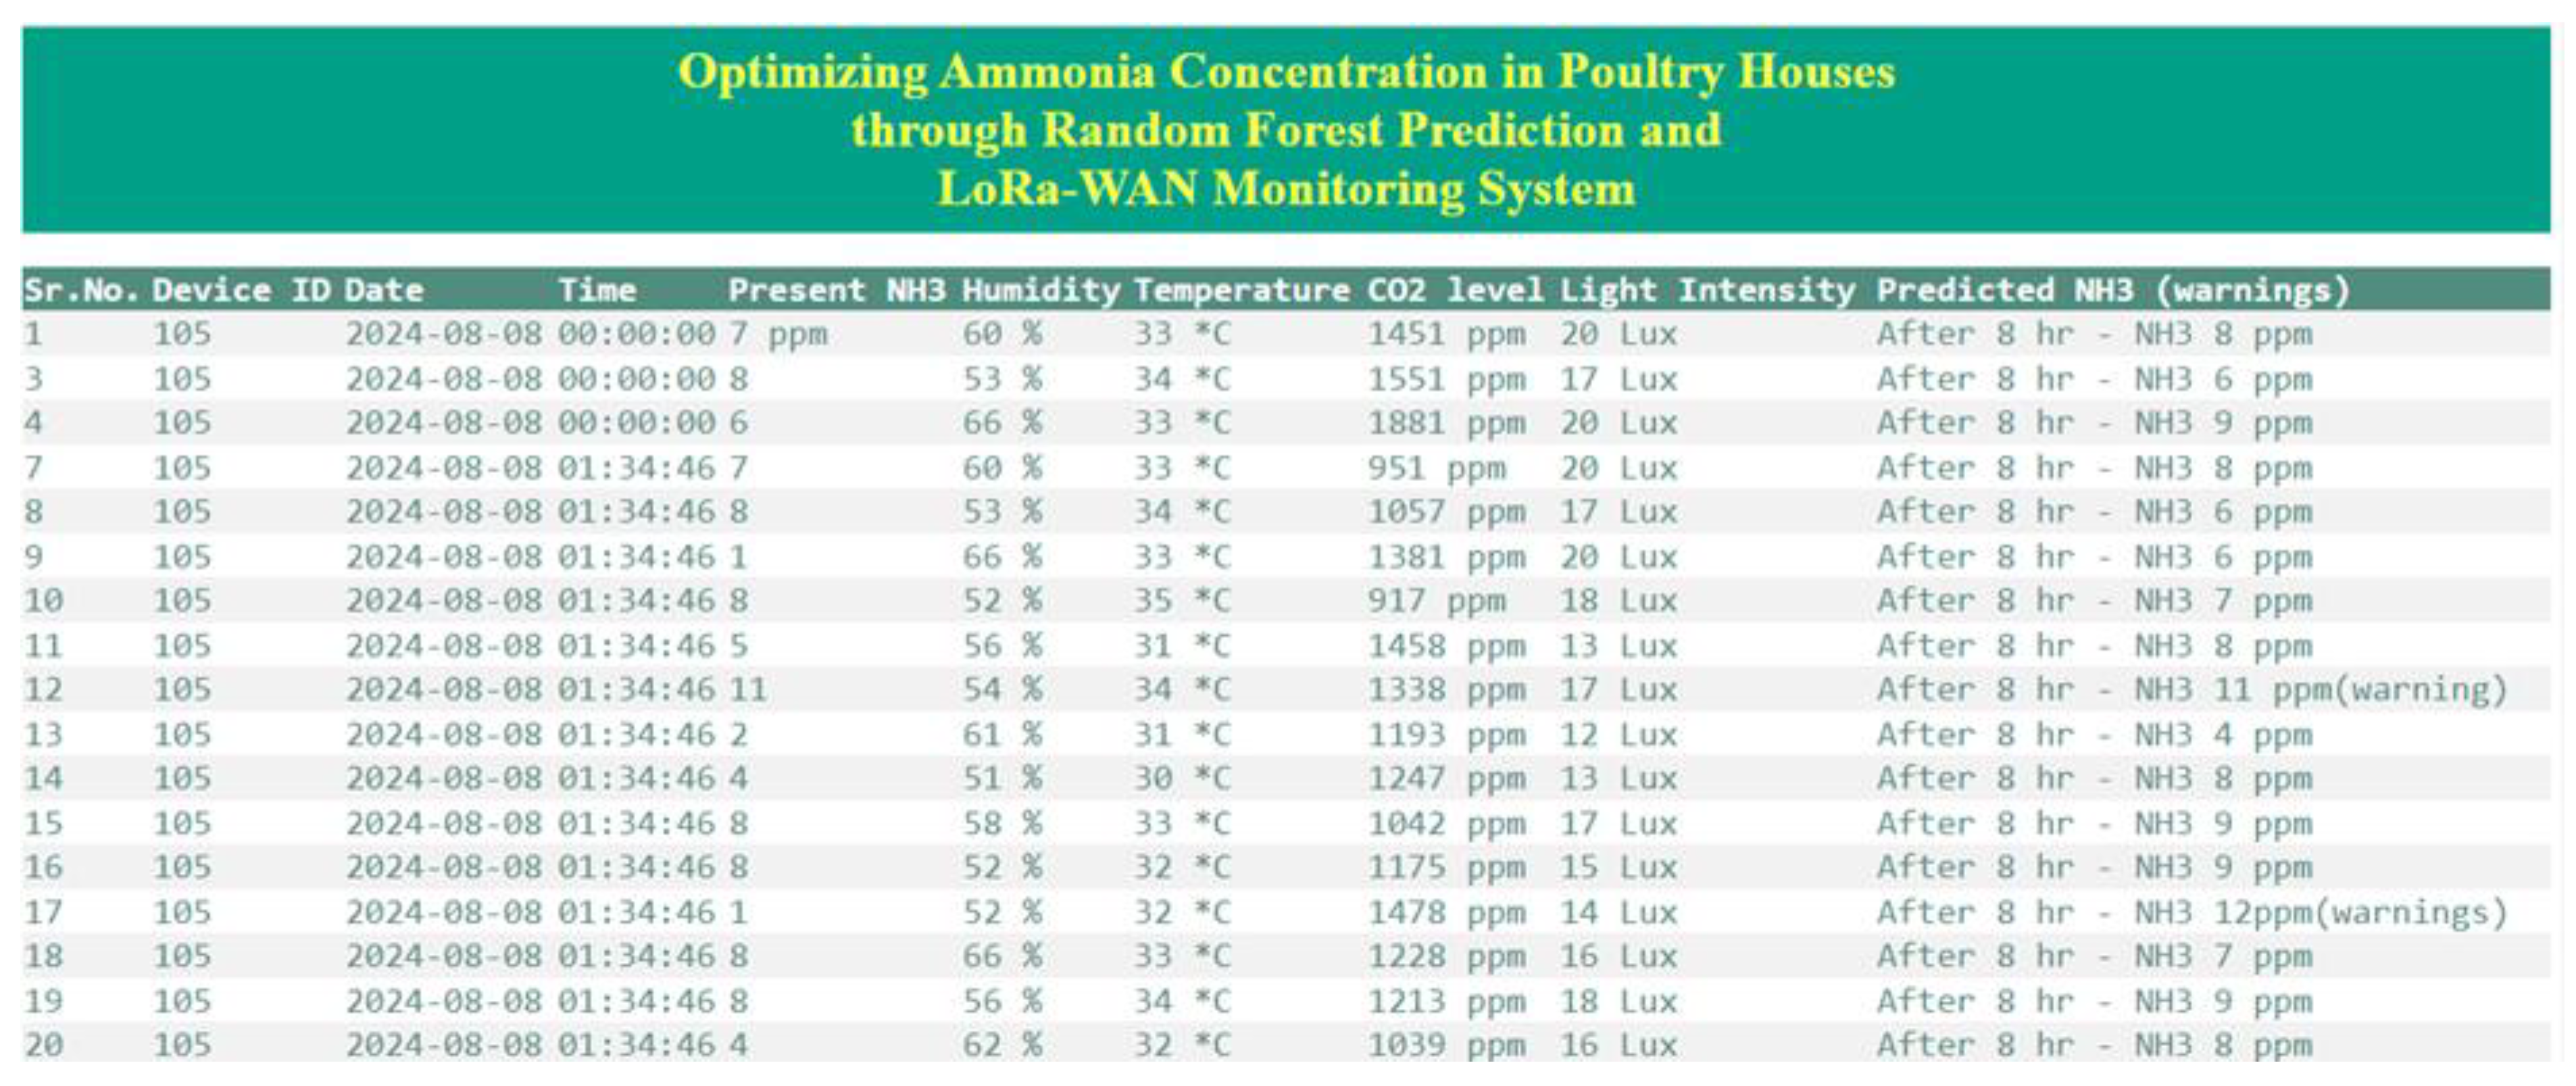
We have developed a very user-friendly web interface which provides farms chicken owners possibility to watch from their building environment condition in real time. The data on this webpage is being updated and visualized in real time from the database Key features include:
- ■
- Display Real-Time data: this shows the environmental parameters (temperature, humidity, CO2 level, NH3 level, Light intensity) intuitively.
- ■
- Prediction Alerts: The web page shows the predicted NH3 levels, and it can provide the alters if the NH3 level is getting close in or exceeds the danger limits (30 ppm).
- ■
- Data Analysis: Users can observe the data to monitor the environment of poultry house and make informed decisions about environmental management.
Figure 2.2.2.
Web page interface for continuous monitoring and NH3 prediction alerts.
2.2.3. Benefits and Implications
Advantages of combining a web interface, machine learning API (Application Programming Interface) and cloud-based database:
- Automated monitoring provides accurate and rapid insights by getting rid of the process manual data gathering & processing.
- Predictive capabilities enable proactive management of ammonia levels, which results in improved ecological farm efficiency and better-quality animal welfare.
- Since the system is web-based, farm owners can monitor their facilities from anywhere at any time.
Delivering a powerful application of leading-edge technology, this software innovation transforms poultry house environmental control by offering superior farm condition optimization and enhanced agriculture practices.
3. Random Forest – Predictive Analysis over Realtime Data
The present study has done during the months of July, August, September and October in a poultry house located at Rajasthan (India). To measure real-time data, the hardware was installed in Poultry Houses with temperature sensor, humidity sensor, luminosity sensor, carbon dioxide (CO2) sensor and ammonia (NH3) sensor.
Our goal is to predict the levels of ammonia (NH3) concentration which can be achieved with this dataset and using the machine learning algorithm called Random Forest (RF). Using this machine learning model, forecast the ammonia (NH3) concentration before reaching the threshold limit and we can reduce the ammonia concentrations by adjusting the environmental parameters such as temperature, humidity and air flow.
3.1. Data Collection
We have collected the Real-time measurements of temperature, humidity, ammonia (NH3) concentration, carbon dioxide (CO2) concentration, and light intensity in a poultry house, and create a 4-months (July, August, September & October) dataset. This dataset, shows the environmental fluctuations in poultry house during the summer season in Rajasthan. it offers a strong basis for training the random forest machine learning model.
data.head() for Month of July is given as

Table 3.1.1.
Data Sample of dataset.
| Sr No | Temperature ( 0C) |
Humidity (%) |
CO2 (ppm) |
Light Intensity (lux) |
NH3 (ppm) |
|---|---|---|---|---|---|
| 1 | 33 | 60 | 1451 | 20 | 7 |
| 2 | 34 | 53 | 1557 | 17 | 8 |
| 3 | 33 | 66 | 1881 | 20 | 6 |
| 4 | 35 | 52 | 1417 | 18 | 9 |
3.2. Model Training
Data Preprocessing: - The first step involves removal of any NULL values and other inaccurate or irrelevant measurements due to some technical issues. After this, the pre-processed data is now split into Training data and Testing data randomly.
Model Training: - Now the Random Forest machine learning model is trained with preprocessed training data. This training allows the model to adjust their internal weight and bias for selection of different logic trees in order to achieve the best performance.
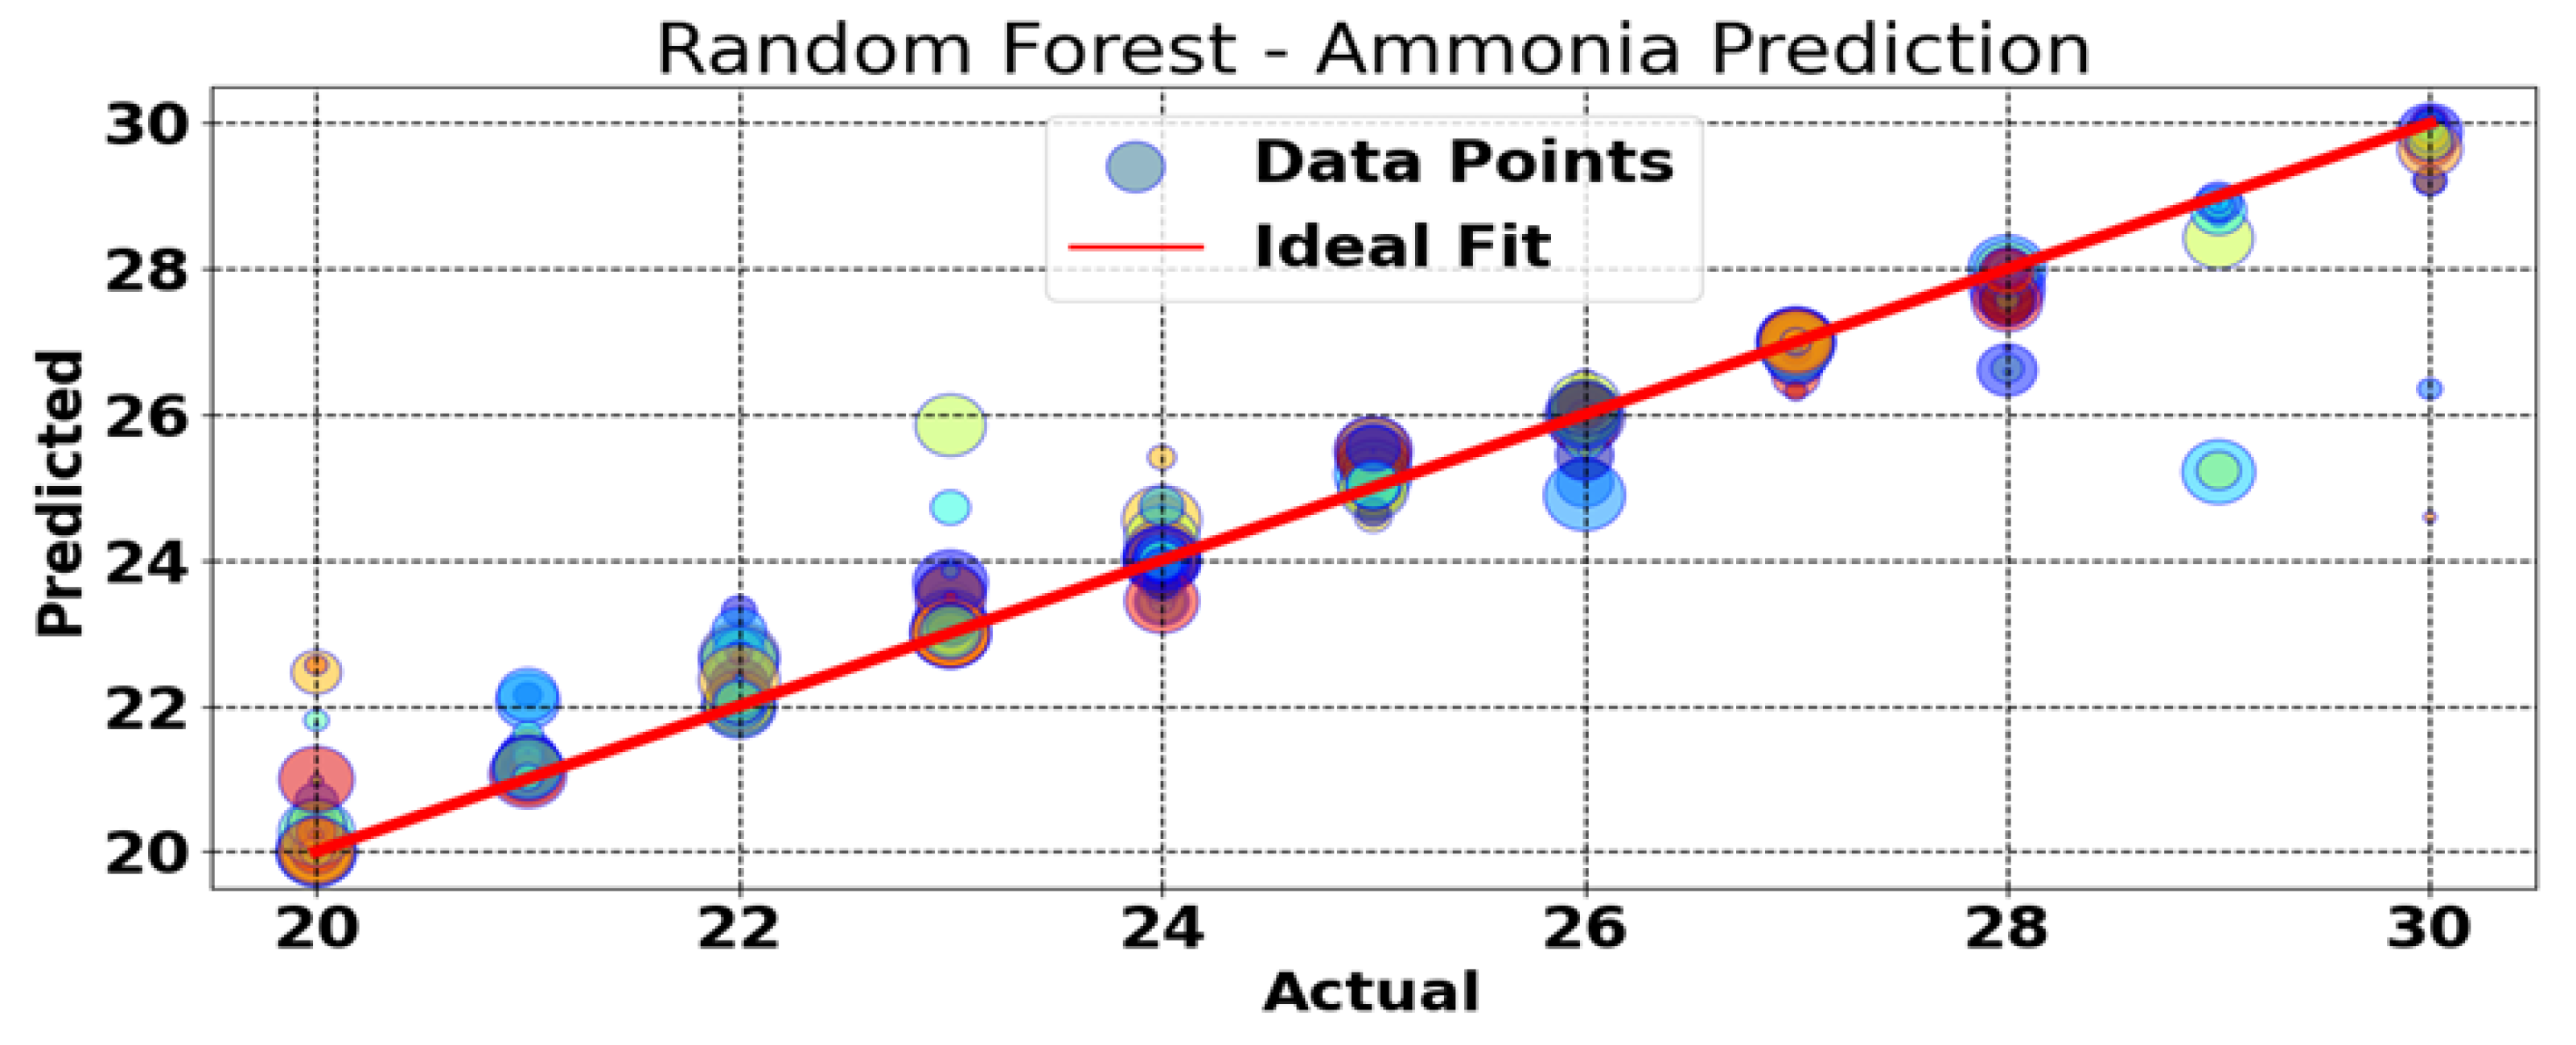
Model Evaluation: - The performance of Random Forest trained model is defined by calculating the R-Square value, Mean Absolute Error (MAE), and Root Mean Square Error RMSE. We can see in Figure 3.2.1, there is a high degree of correlation and prediction with R-Square value of 0.9830. It means the maximum data points are mapped by RF model.
Figure 3.2.1.
Learning Curve.
3.3. Predictive Analysis
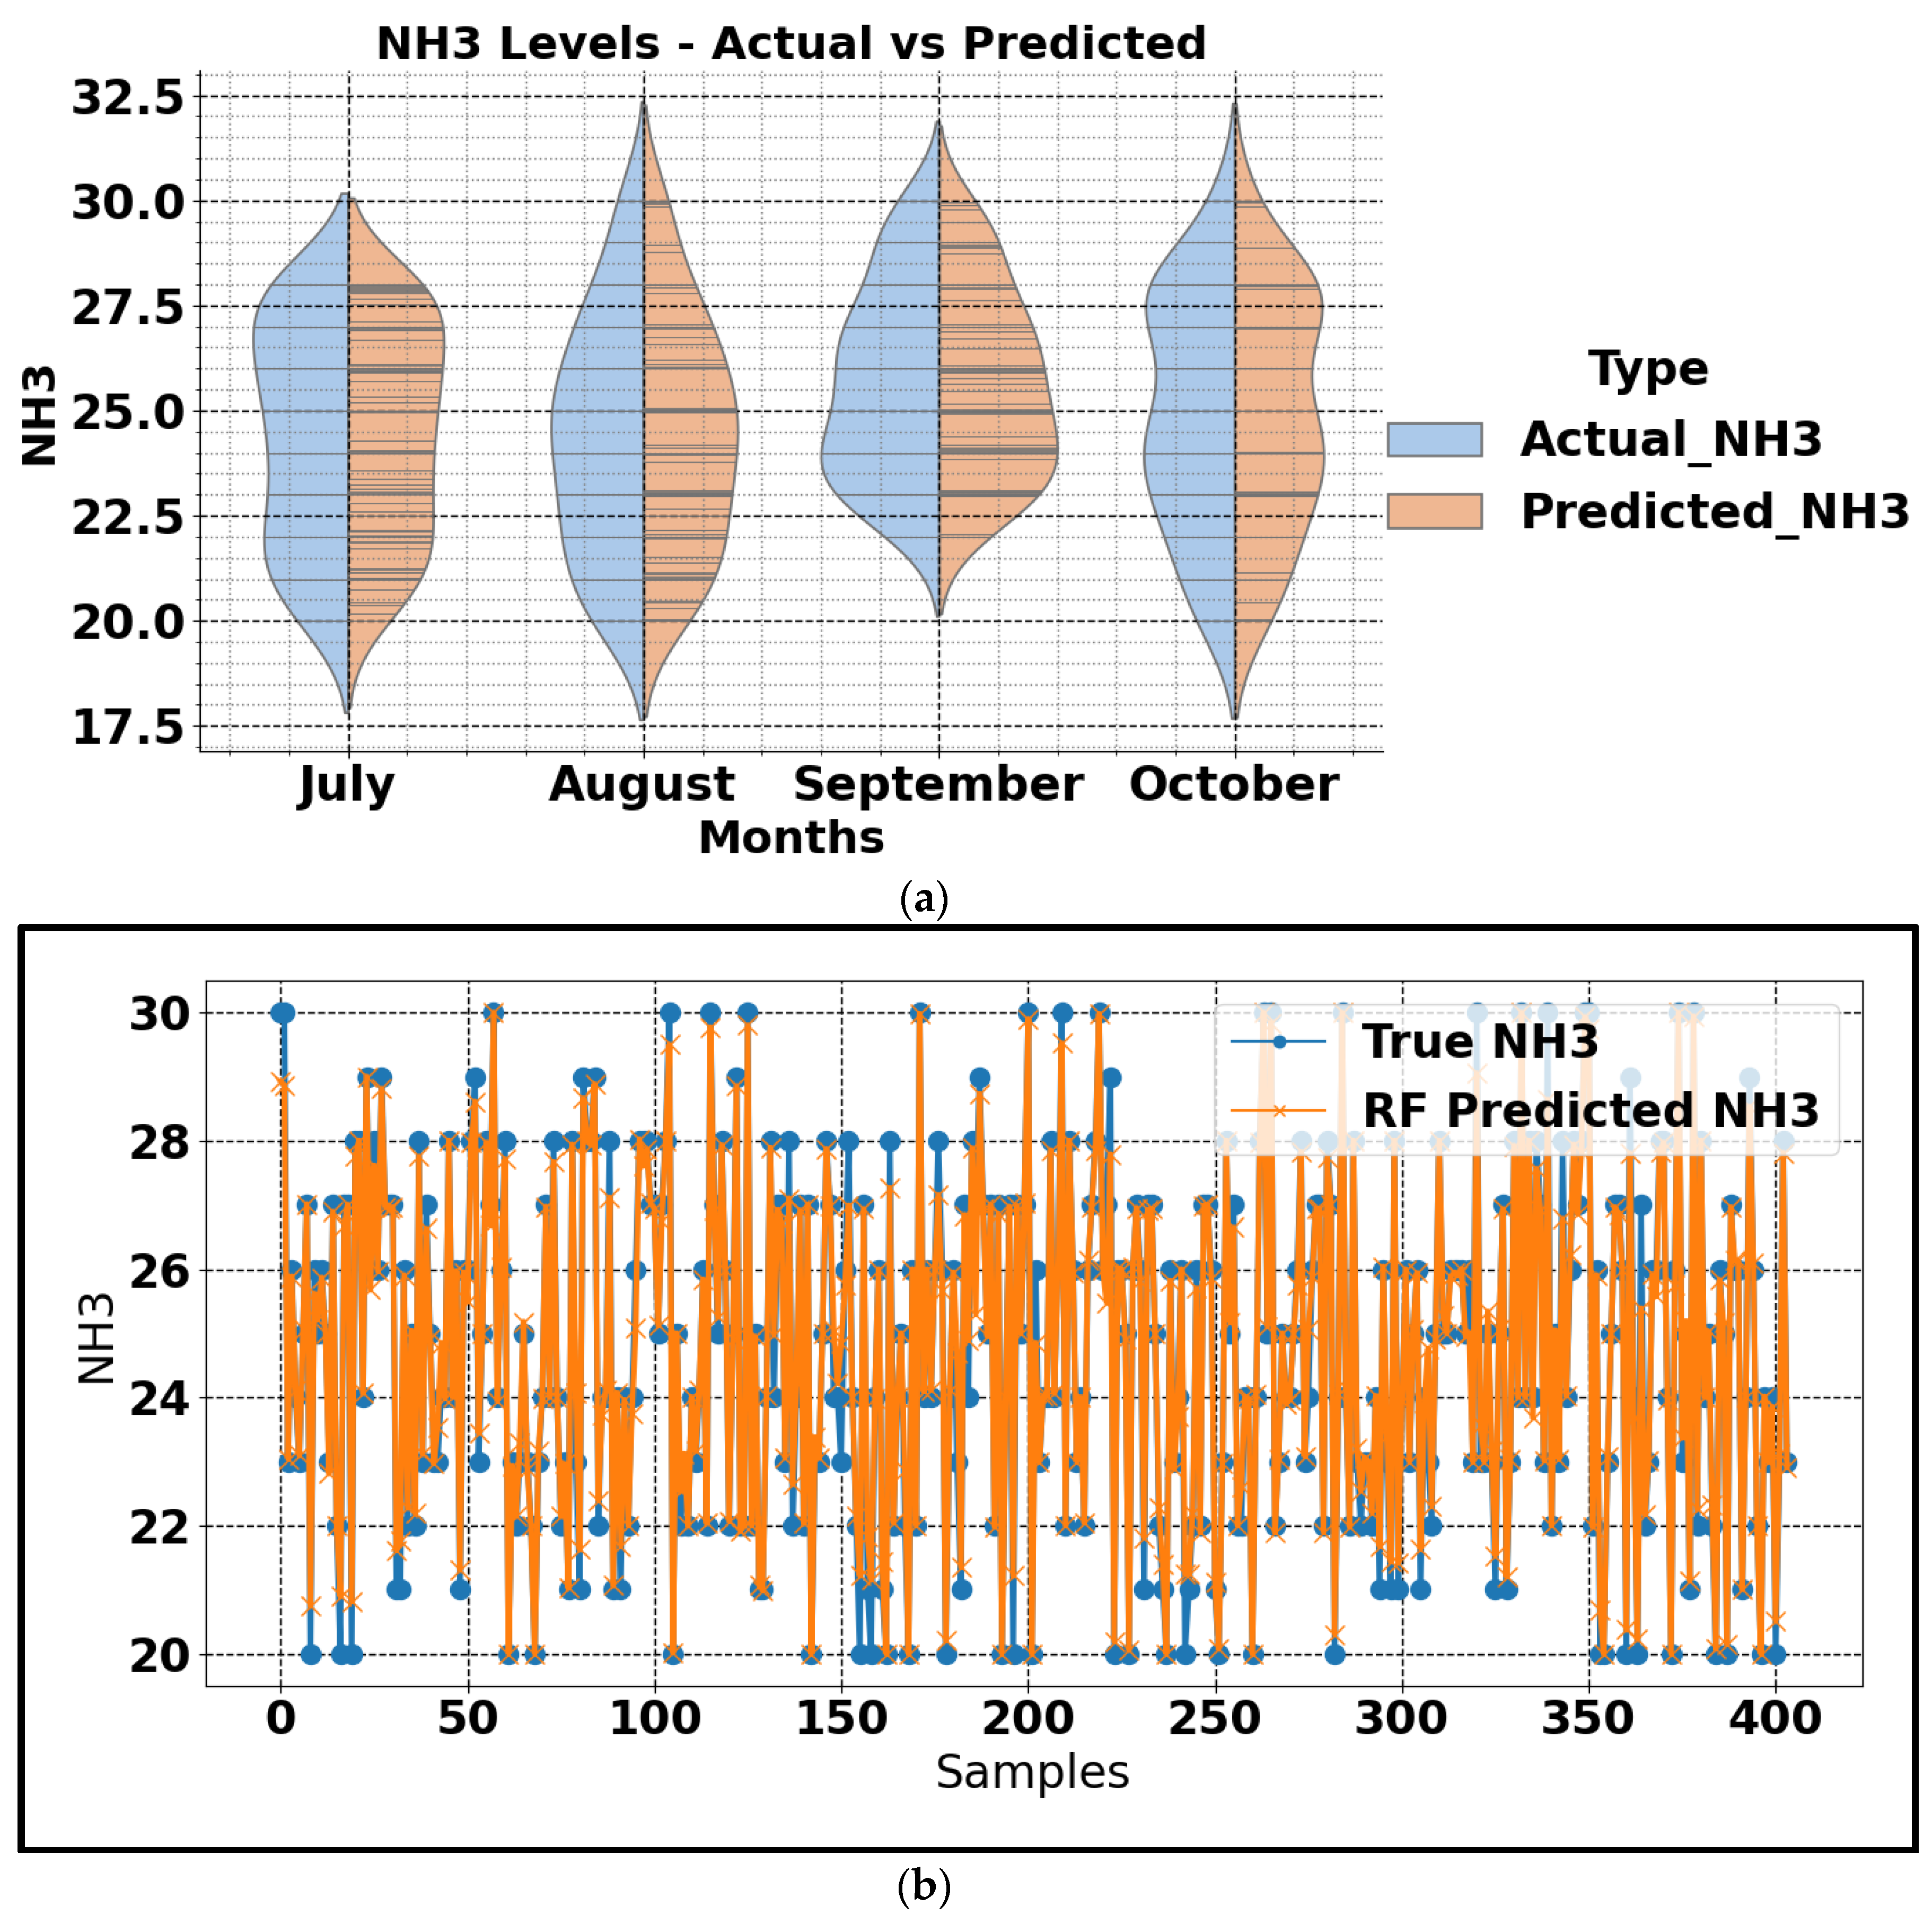
The trained Random forest Model is able to predict the future ammonia (NH3) concentration on the basis of environmental data. These forecasts help poultry farmers to proactively change environmental parameters in order to keep optimal circumstances which can decrease the accumulation of ammonia (NH3). The predictions of the model can be explored and compared with real measurements to help check for accuracy and performance.
This Figure 3.3.1 shows a comparison graph between the predicted ammonia concentration and actual ammonia concentrations. These graphs indicate that our RF trained model is predicting the almost same results as actual results, this shows the good performance of model.
Figure 3.3.1.
(a) monthly Comparison Curve Between Predicted & True Ammonia Level, (b) Comparison Curve Between Predicted & True Ammonia Level.
Figure 3.3.1.
(a) monthly Comparison Curve Between Predicted & True Ammonia Level, (b) Comparison Curve Between Predicted & True Ammonia Level.
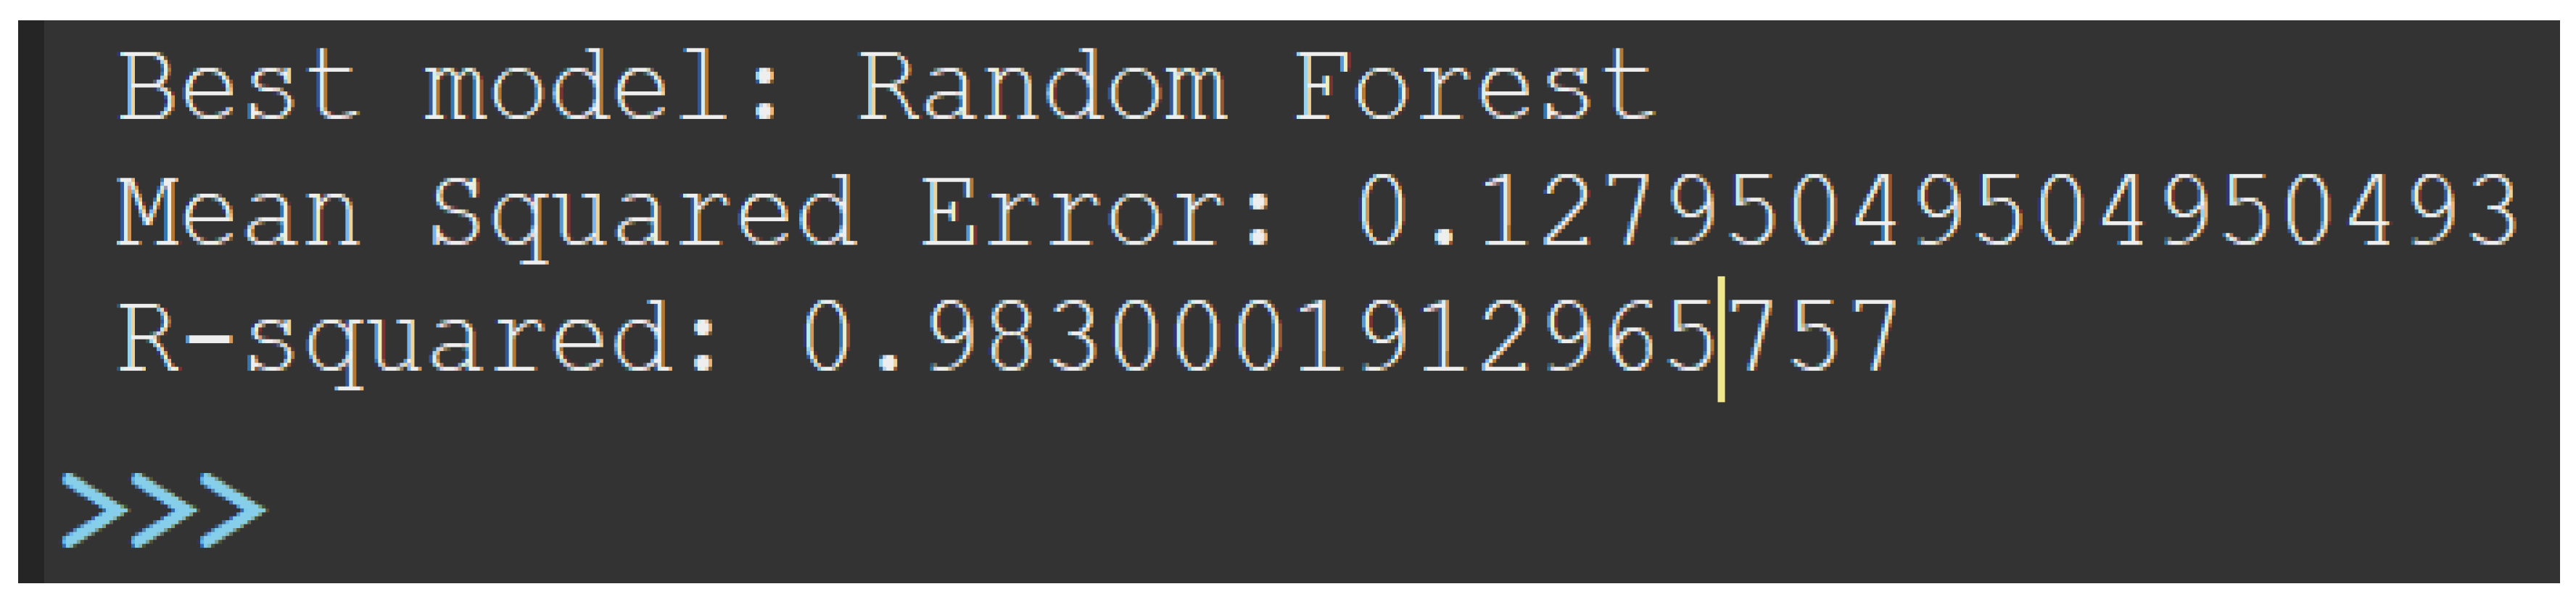
The trained RF model has a high R-Square value (coefficient of determination) that is 0.9830, which indicates the high proportion of variance in ammonia (NH3) concentration prediction is almost expressed by environmental parameters with minimum Mean Square Error of 0.1279, we can see in Figure 3.3.2.
Figure 3.3.2.
Mean-Square-Error & R-square value of model.
As shown in Figure 3.3.1 the predicted ammonia concentration levels closely aligns with actual readings of ammonia. This validation confirms the model has ability to predict ammonia concentrations significantly correctly with geat level of accuracy.
when poultry farmers have predicted ammonia levels in advance, they can then take-action by ventilating better or adjusting humidity and temperature settings to reduce environmental conditions. Obviously, by providing perfect environmental conditions in the house of birds obtain far less stress and disorder will be a reflection better being their production too that added to this causes lower mortality rates. Prediction with great precision and lead time enables early intervention which in turn reduces the need for reactive actions. Leading to cost savings from operational efficiencies at large. Introduction of machine learning models makes the environmental management techniques data-driven which make them more accurate and efficient.
The Random Forest predictive machine learning algorithm for ammonia concentration in poultry houses is a powerful tool for increasing the sustainability of animal welfare and environmental management. Those results verify its potential to be a practical value in Poultry farming due to high performance and reliability with R-Square values.
4. Results and Discussions
The results obtained from predictive approach is shows how the Random Forest model predicts ammonia concentration levels compared with actual data across July, August, September and October months. The random forest machine learning model provides very optimistic results for these months and with minimal error managed to estimate nearly perfect predictions. The MSE (Mean Square Error) and MAE (Mean Absolute Error) express that the trained random forest model is very robust and accurate with strong correlation between real and predicted ammonia.
The random forest machine learning model is an extremely precise ammonia predictor for the month of July with negligible amount of error. As shown in Figure 4.1, the predicted ammonia concentration is very closely matching with its original value. Figure 4.2 demonstrates the error during ammonia prediction, the mean square error (MSE) is 0.0982 and the mean absolute error (MAE) is 0.1704.
Figure 4.1.
Ammonia Concentration Comparison Curve for July - True Concentration vs. Predicted Concentration.
Figure 4.1.
Ammonia Concentration Comparison Curve for July - True Concentration vs. Predicted Concentration.
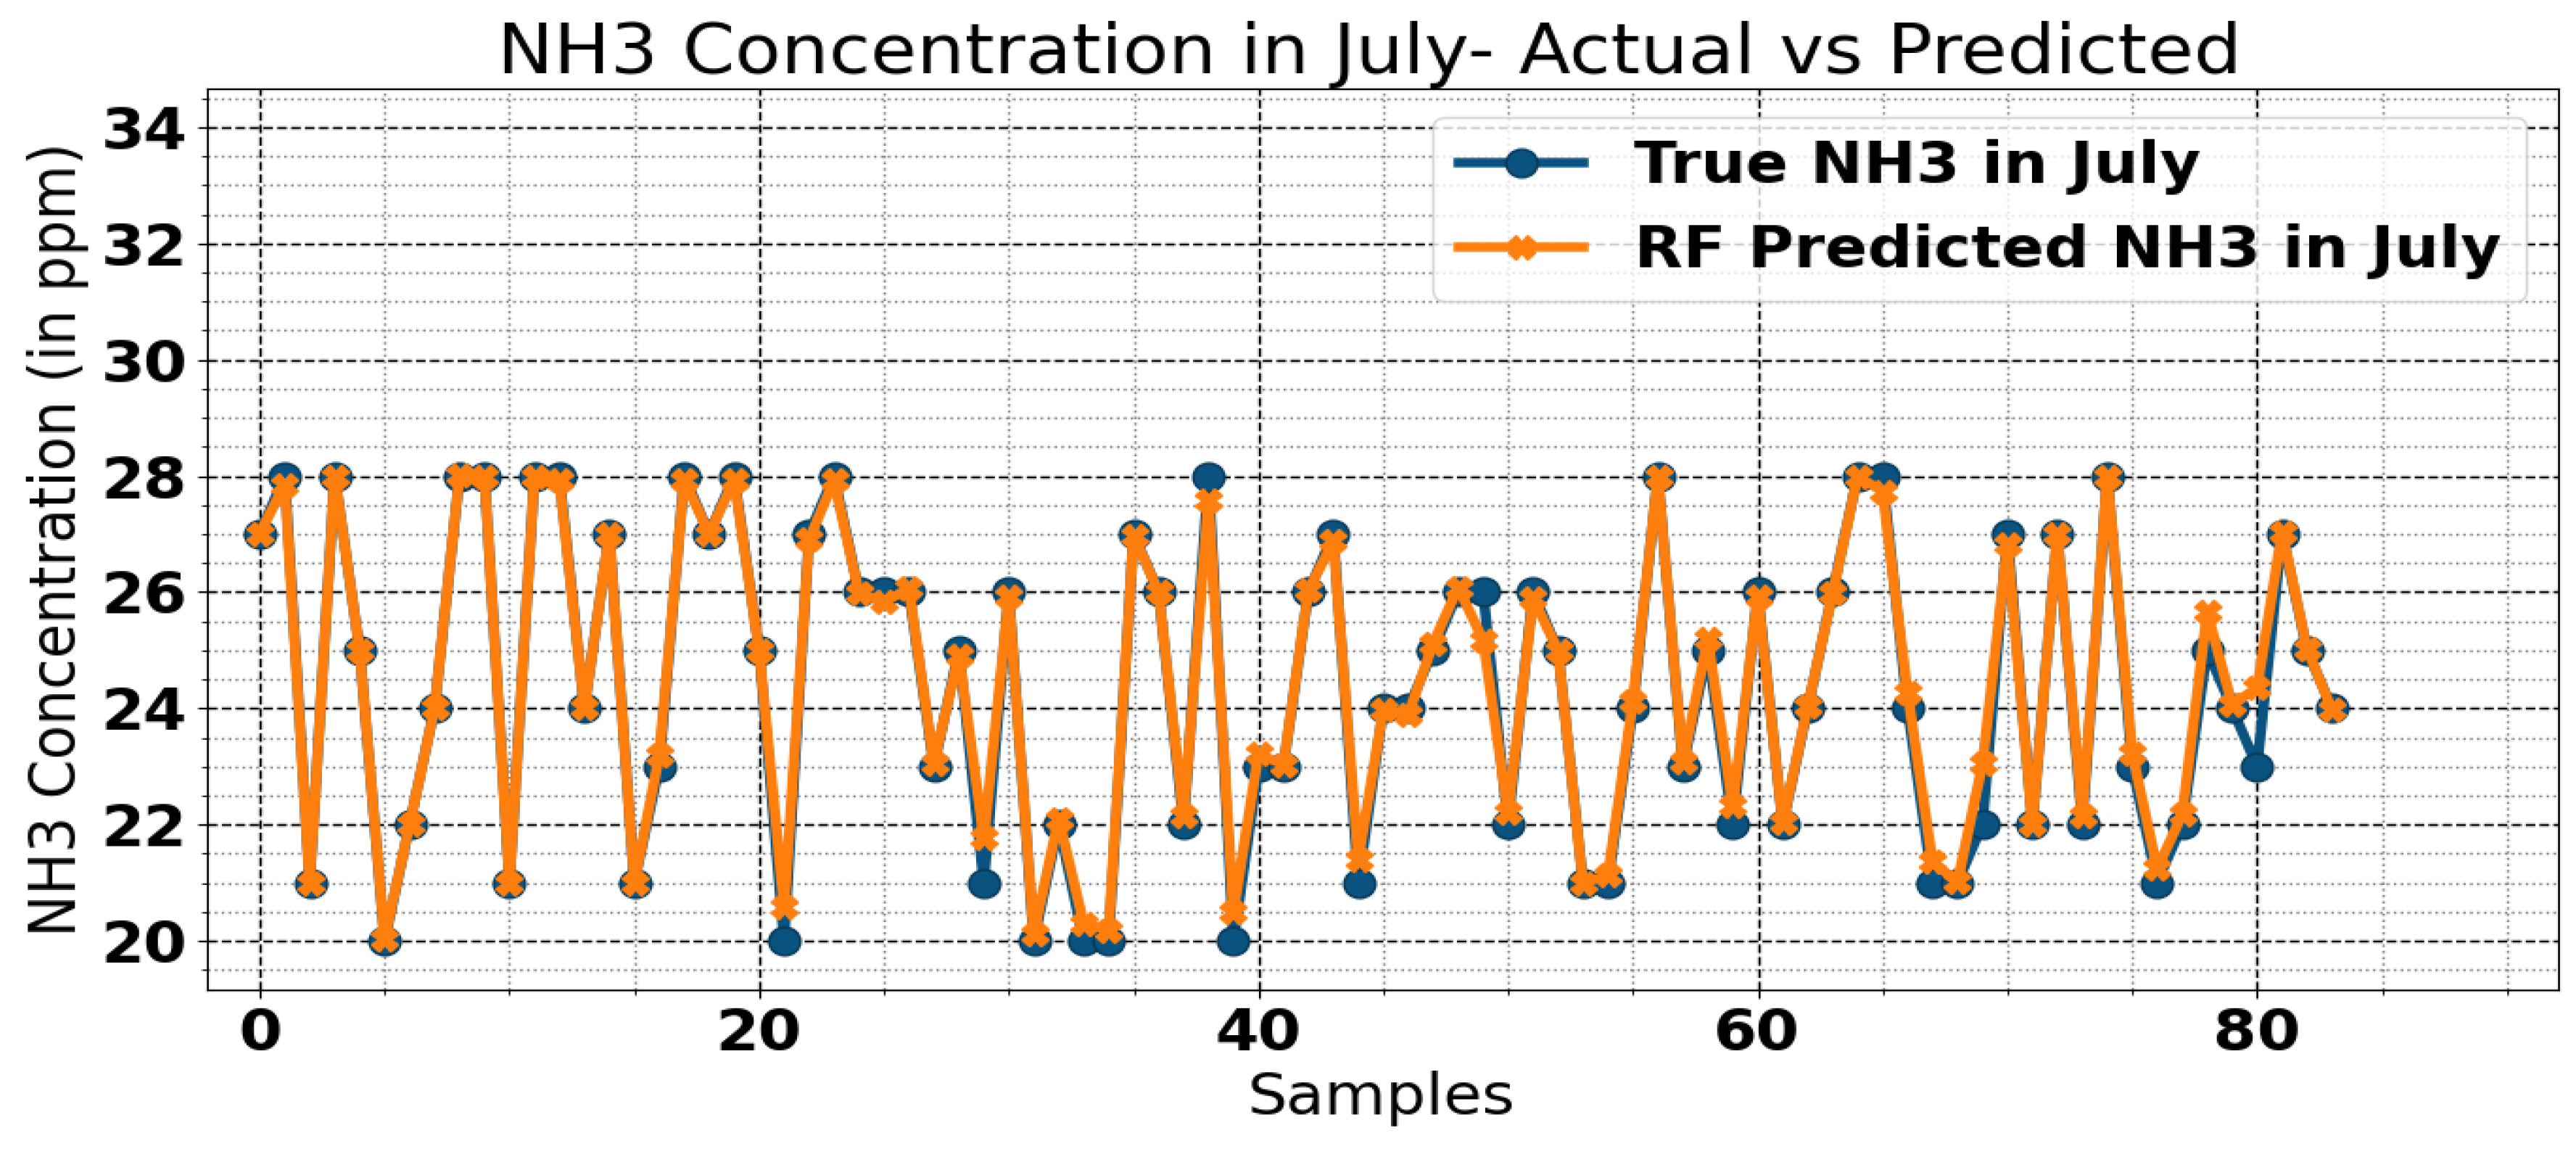
Figure 4.2.
Error Plot for July.
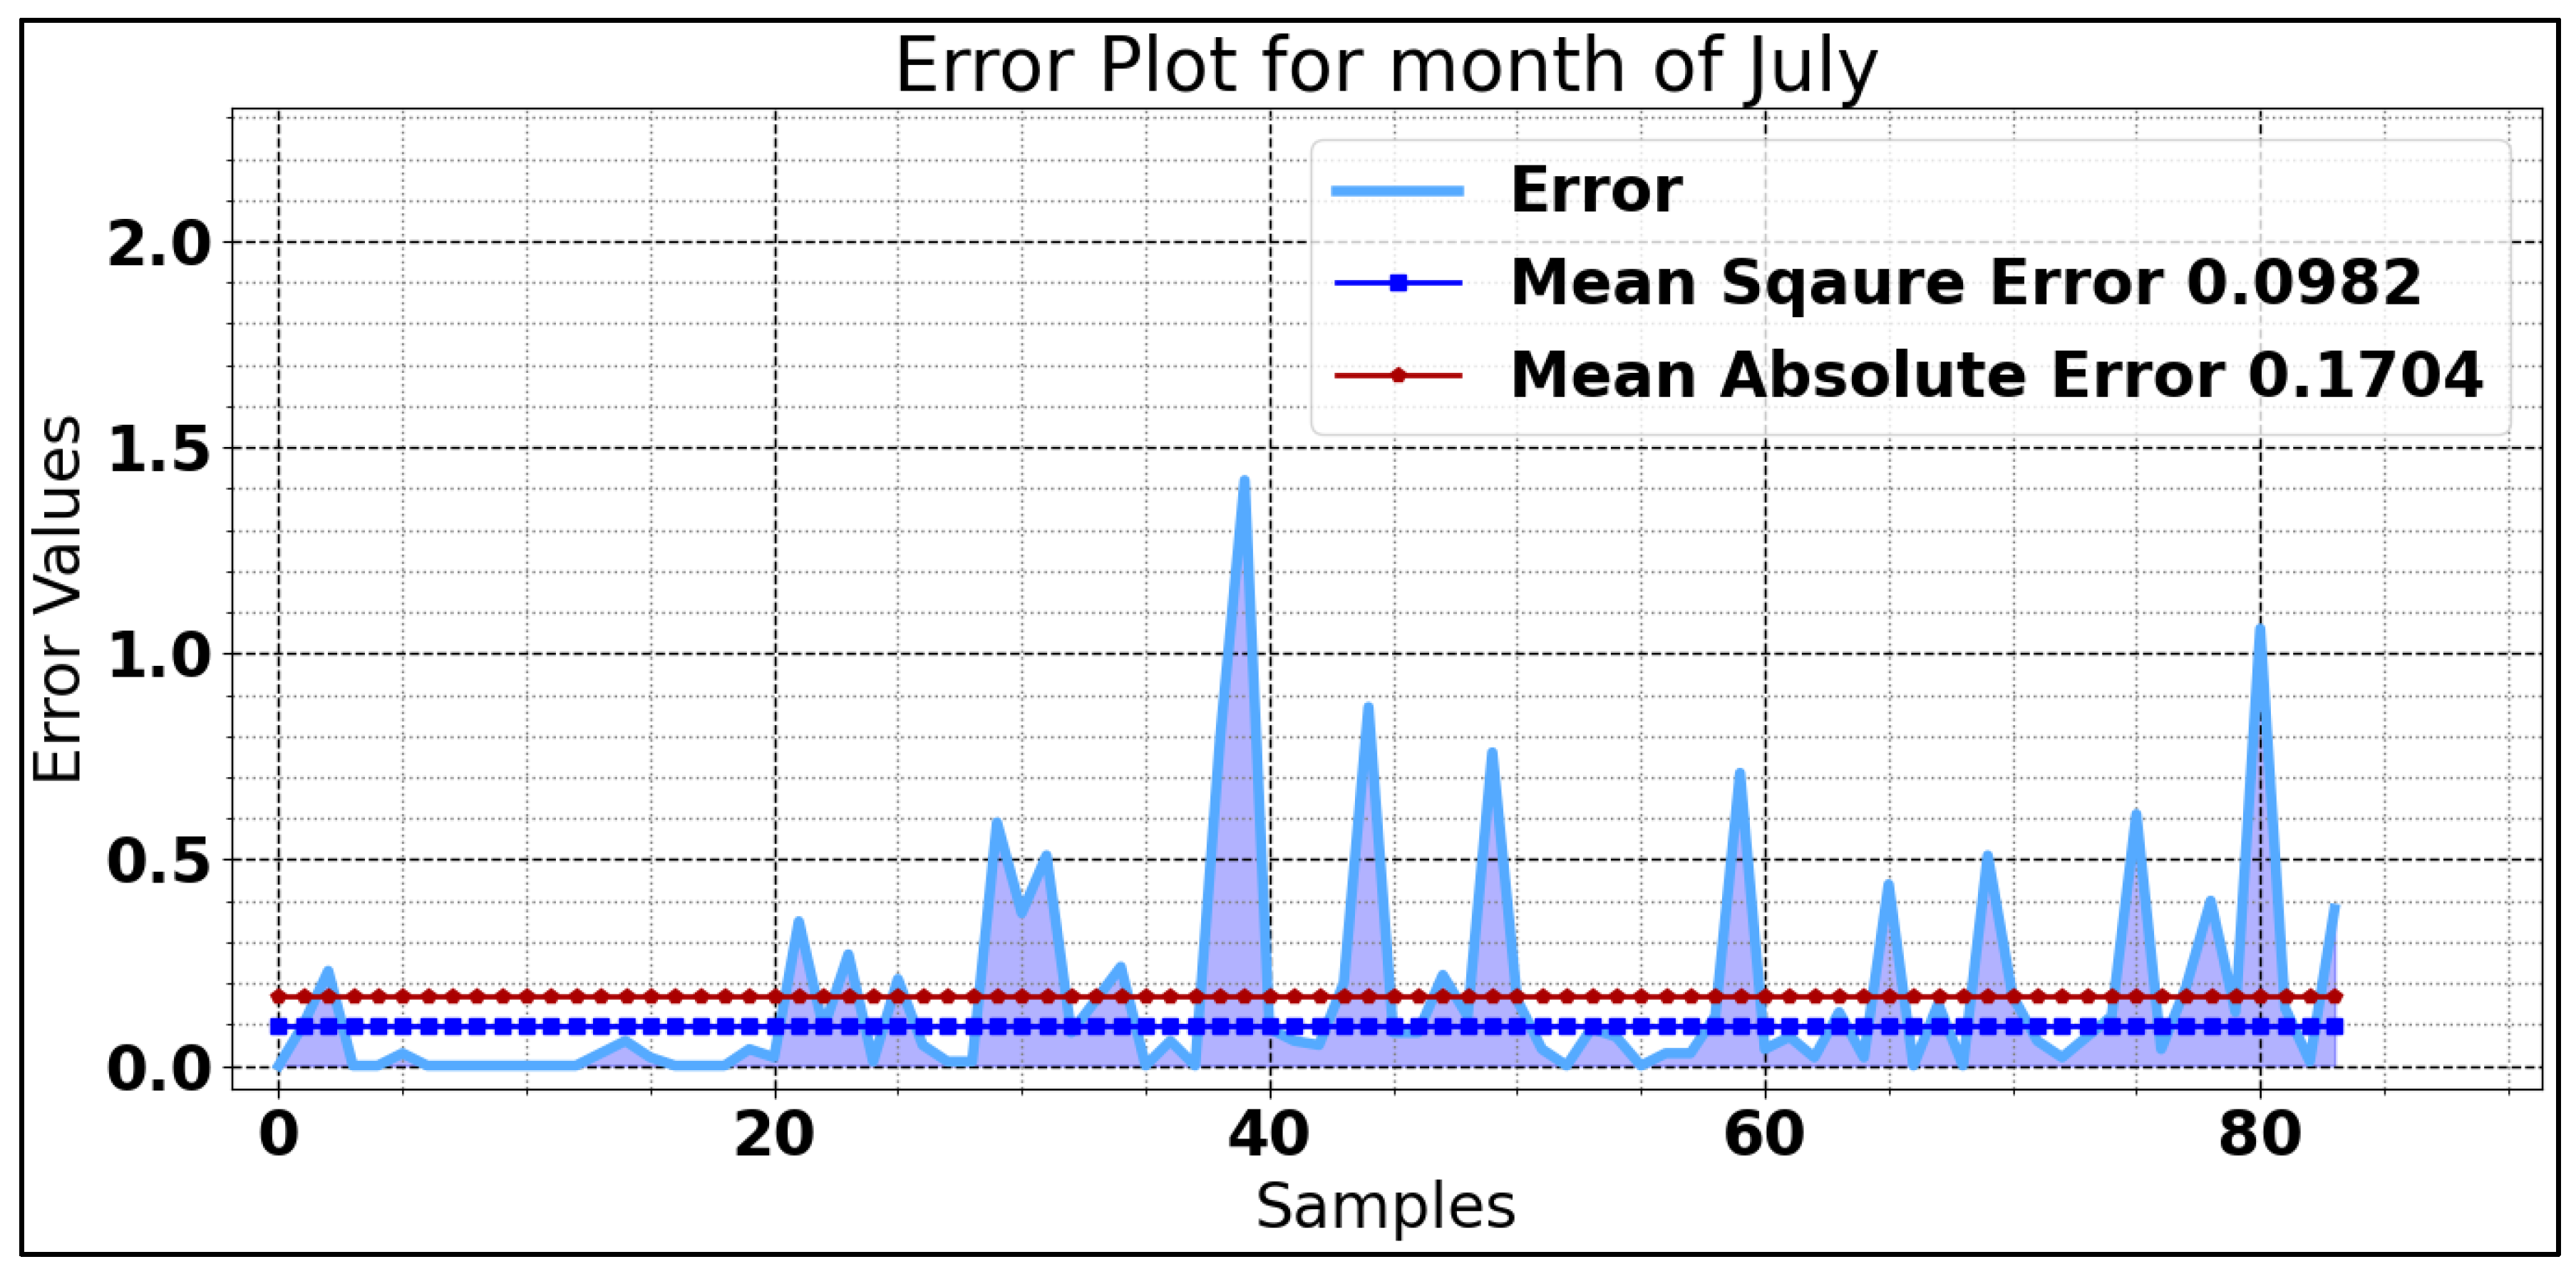
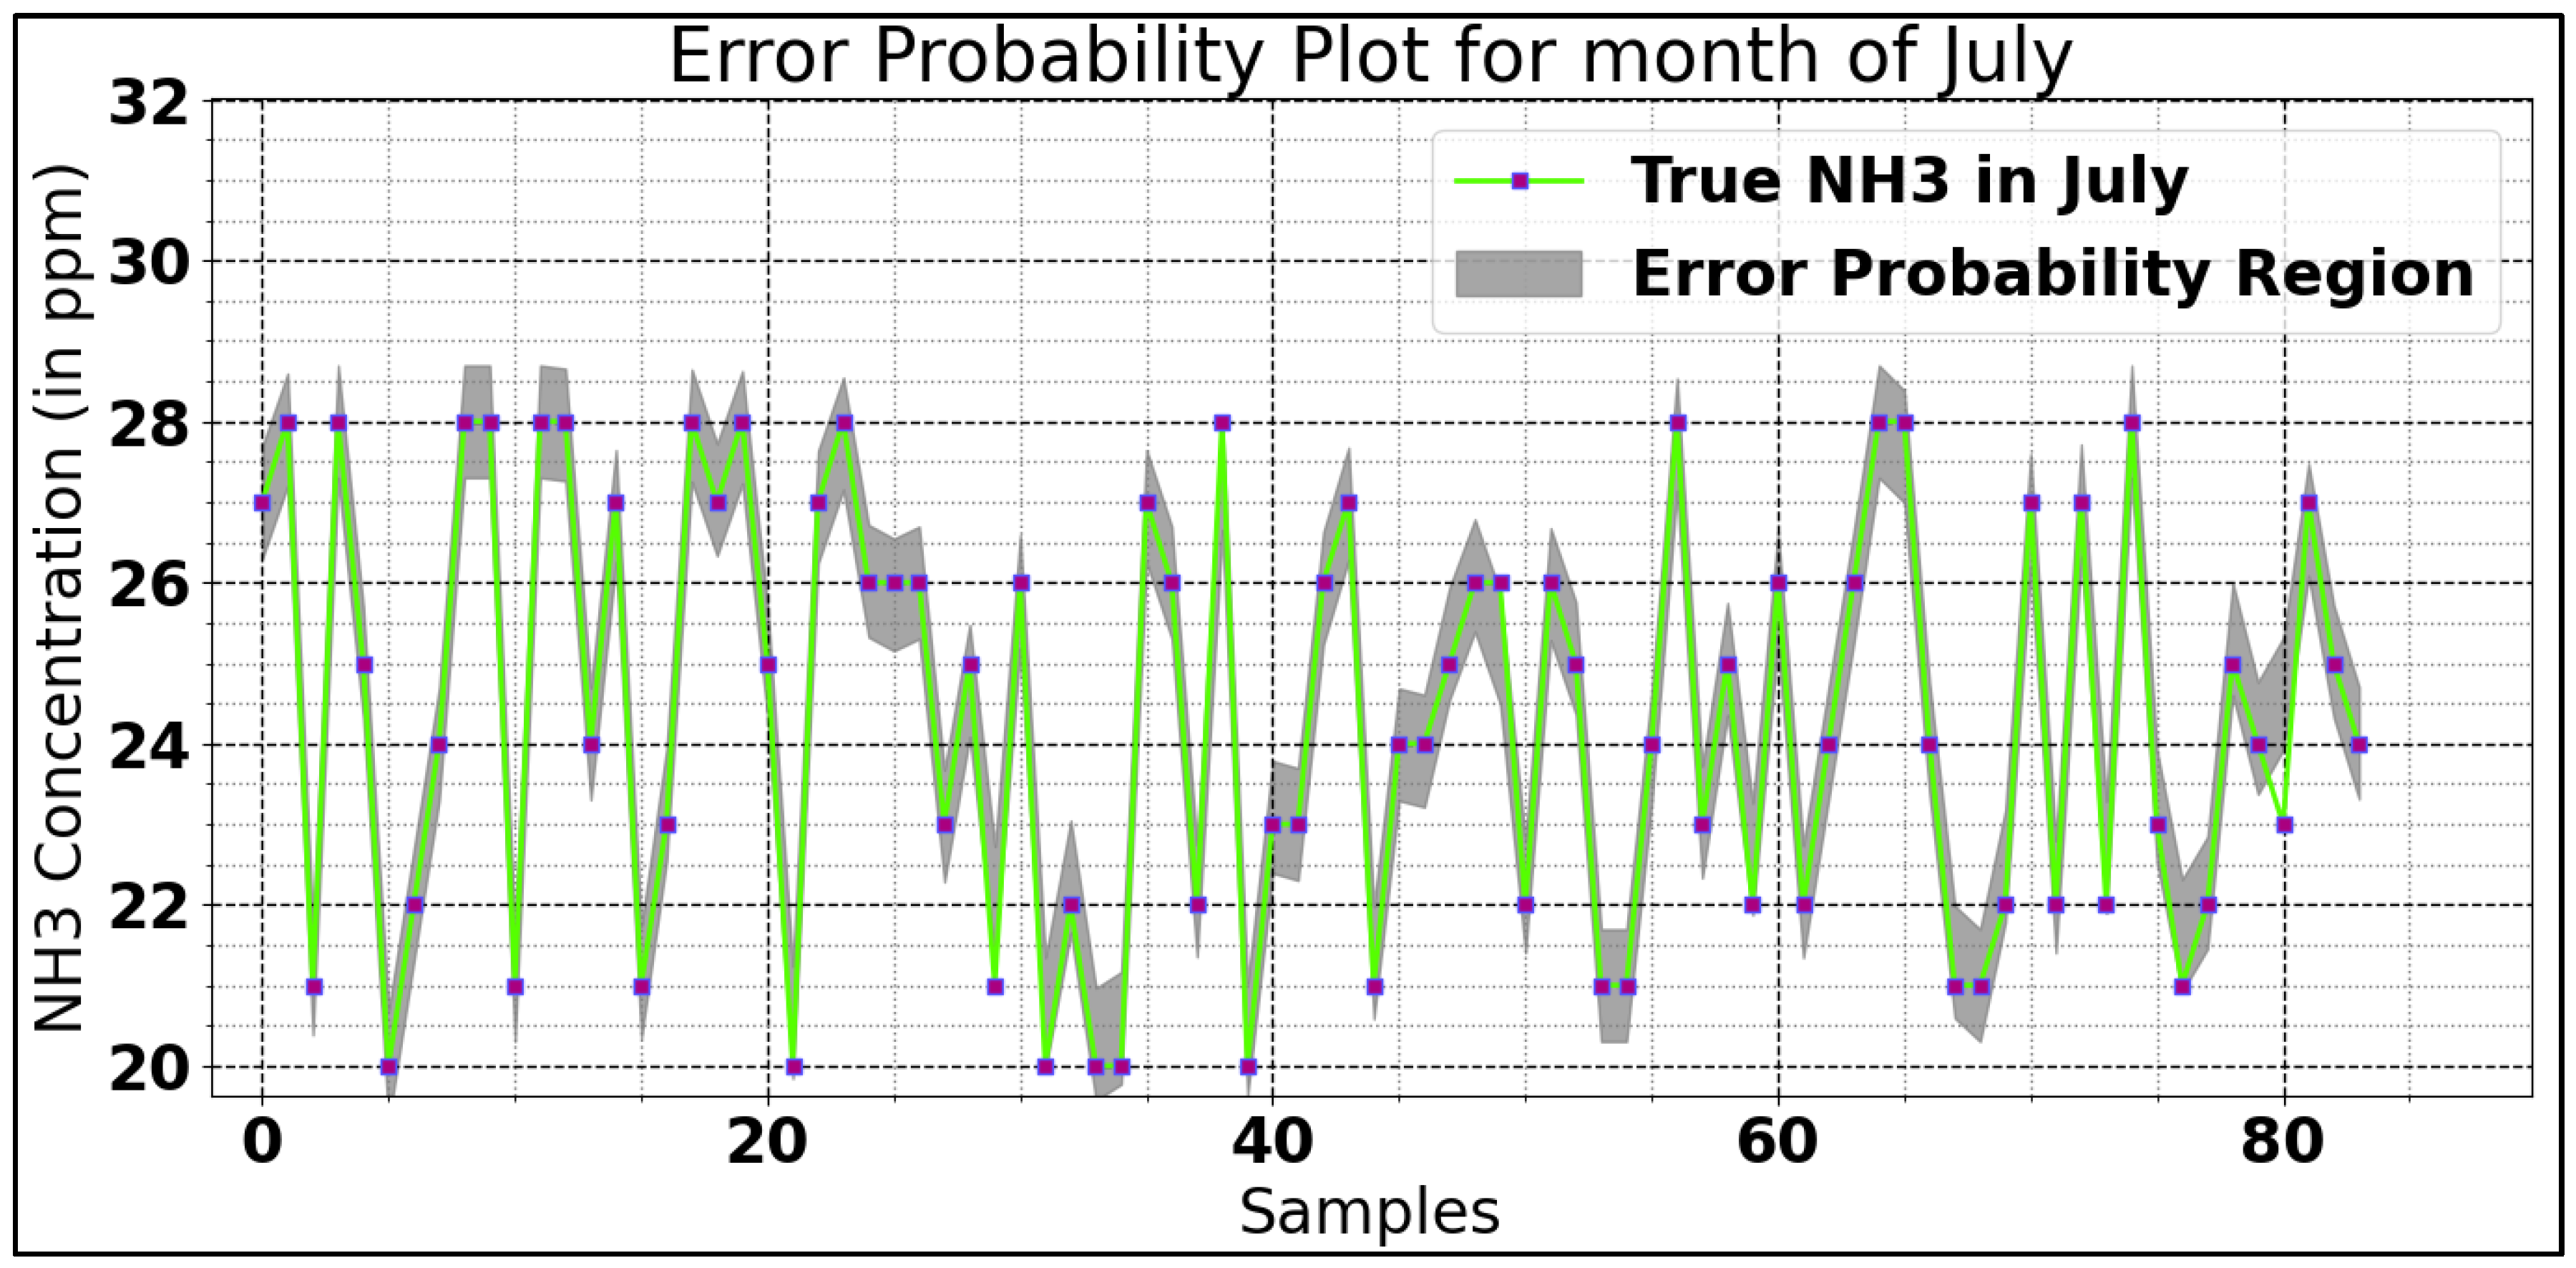
The graph for July demonstrates the strong mapping between true ammonia and predicted and predicted ammonia, with negligible error. The error plot for the month of July shown in Figure 4.2 indicates that the maximum predictions exists within a small narrow error margin, explaining the accuracy of trained model for the month of July. The probability of error occurs during ammonia prediction is depicted in Figure 4.3.
Figure 4.3.
Error Probability Region for July.
For August month, the random forest machine learning model has shown high accuracy in predicting ammonia concentrations. As shown in Figure 4.4, the results of prediction for ammonia are almost same to its true values. The model has minimum error margin for ammonia prediction, with mean square error (MSE) of 0.0355 and mean absolute error (MAE) of 0.1082. The error plot for the month of August is demonstrate by Figure 4.5.
Figure 4.4.
Ammonia Concentration Comparison Curve for August - True Concentration vs. Predicted Concentration.
Figure 4.4.
Ammonia Concentration Comparison Curve for August - True Concentration vs. Predicted Concentration.
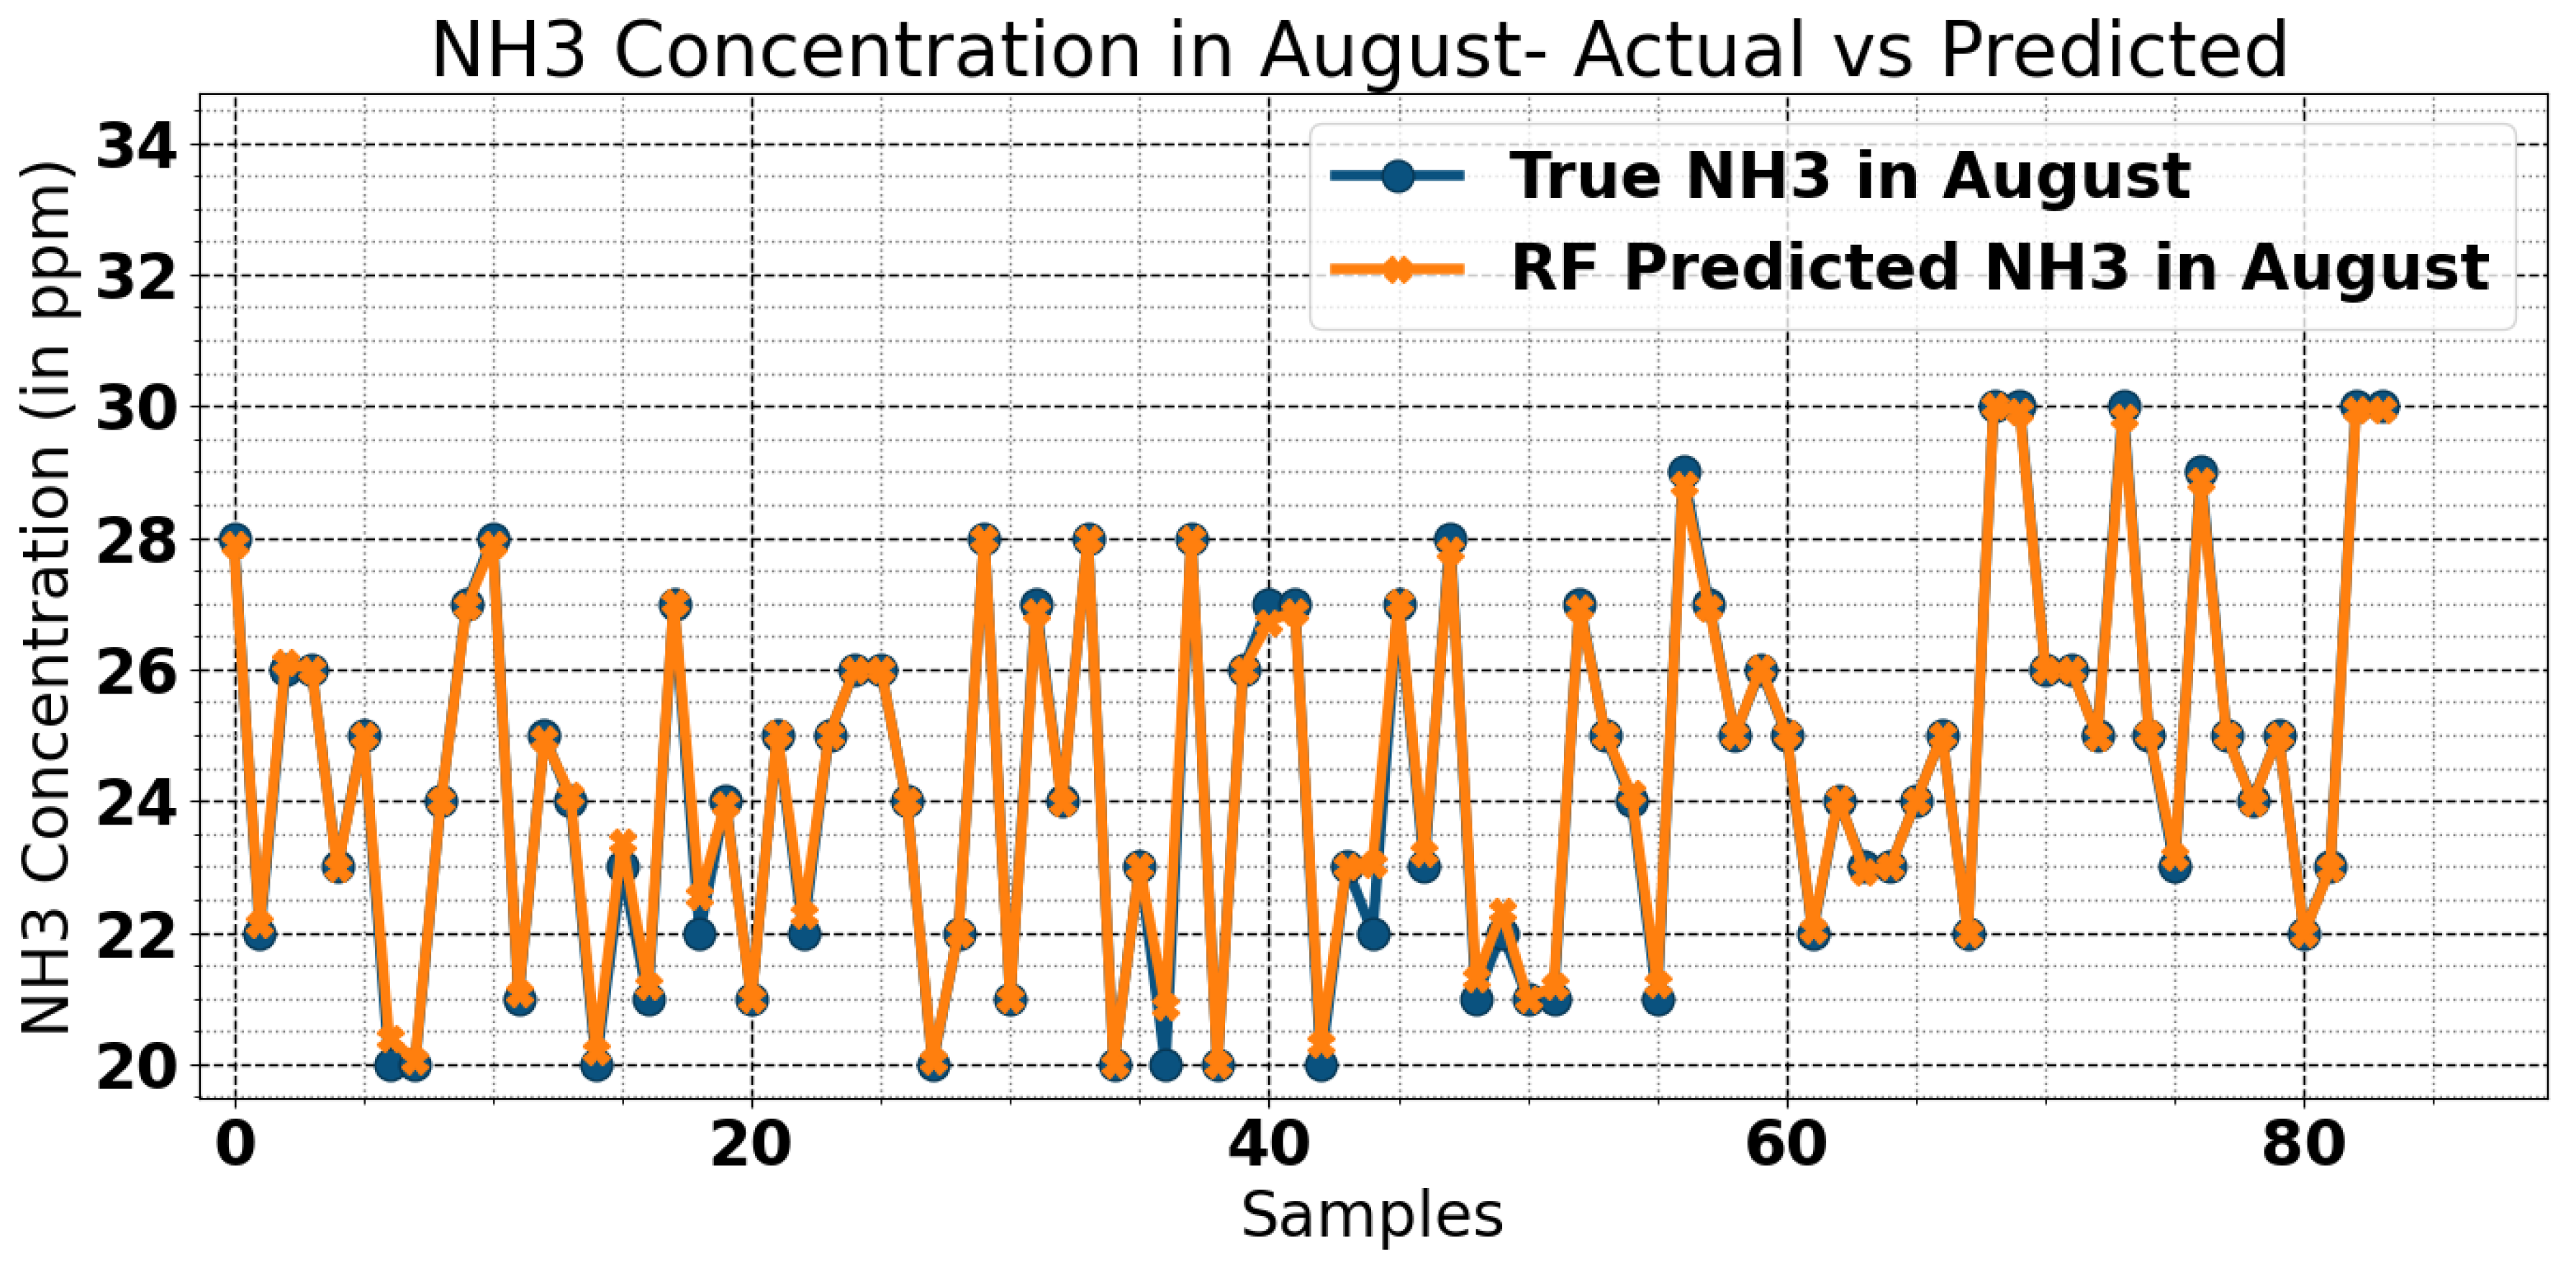
Figure 4.4.
Error Plot for August.
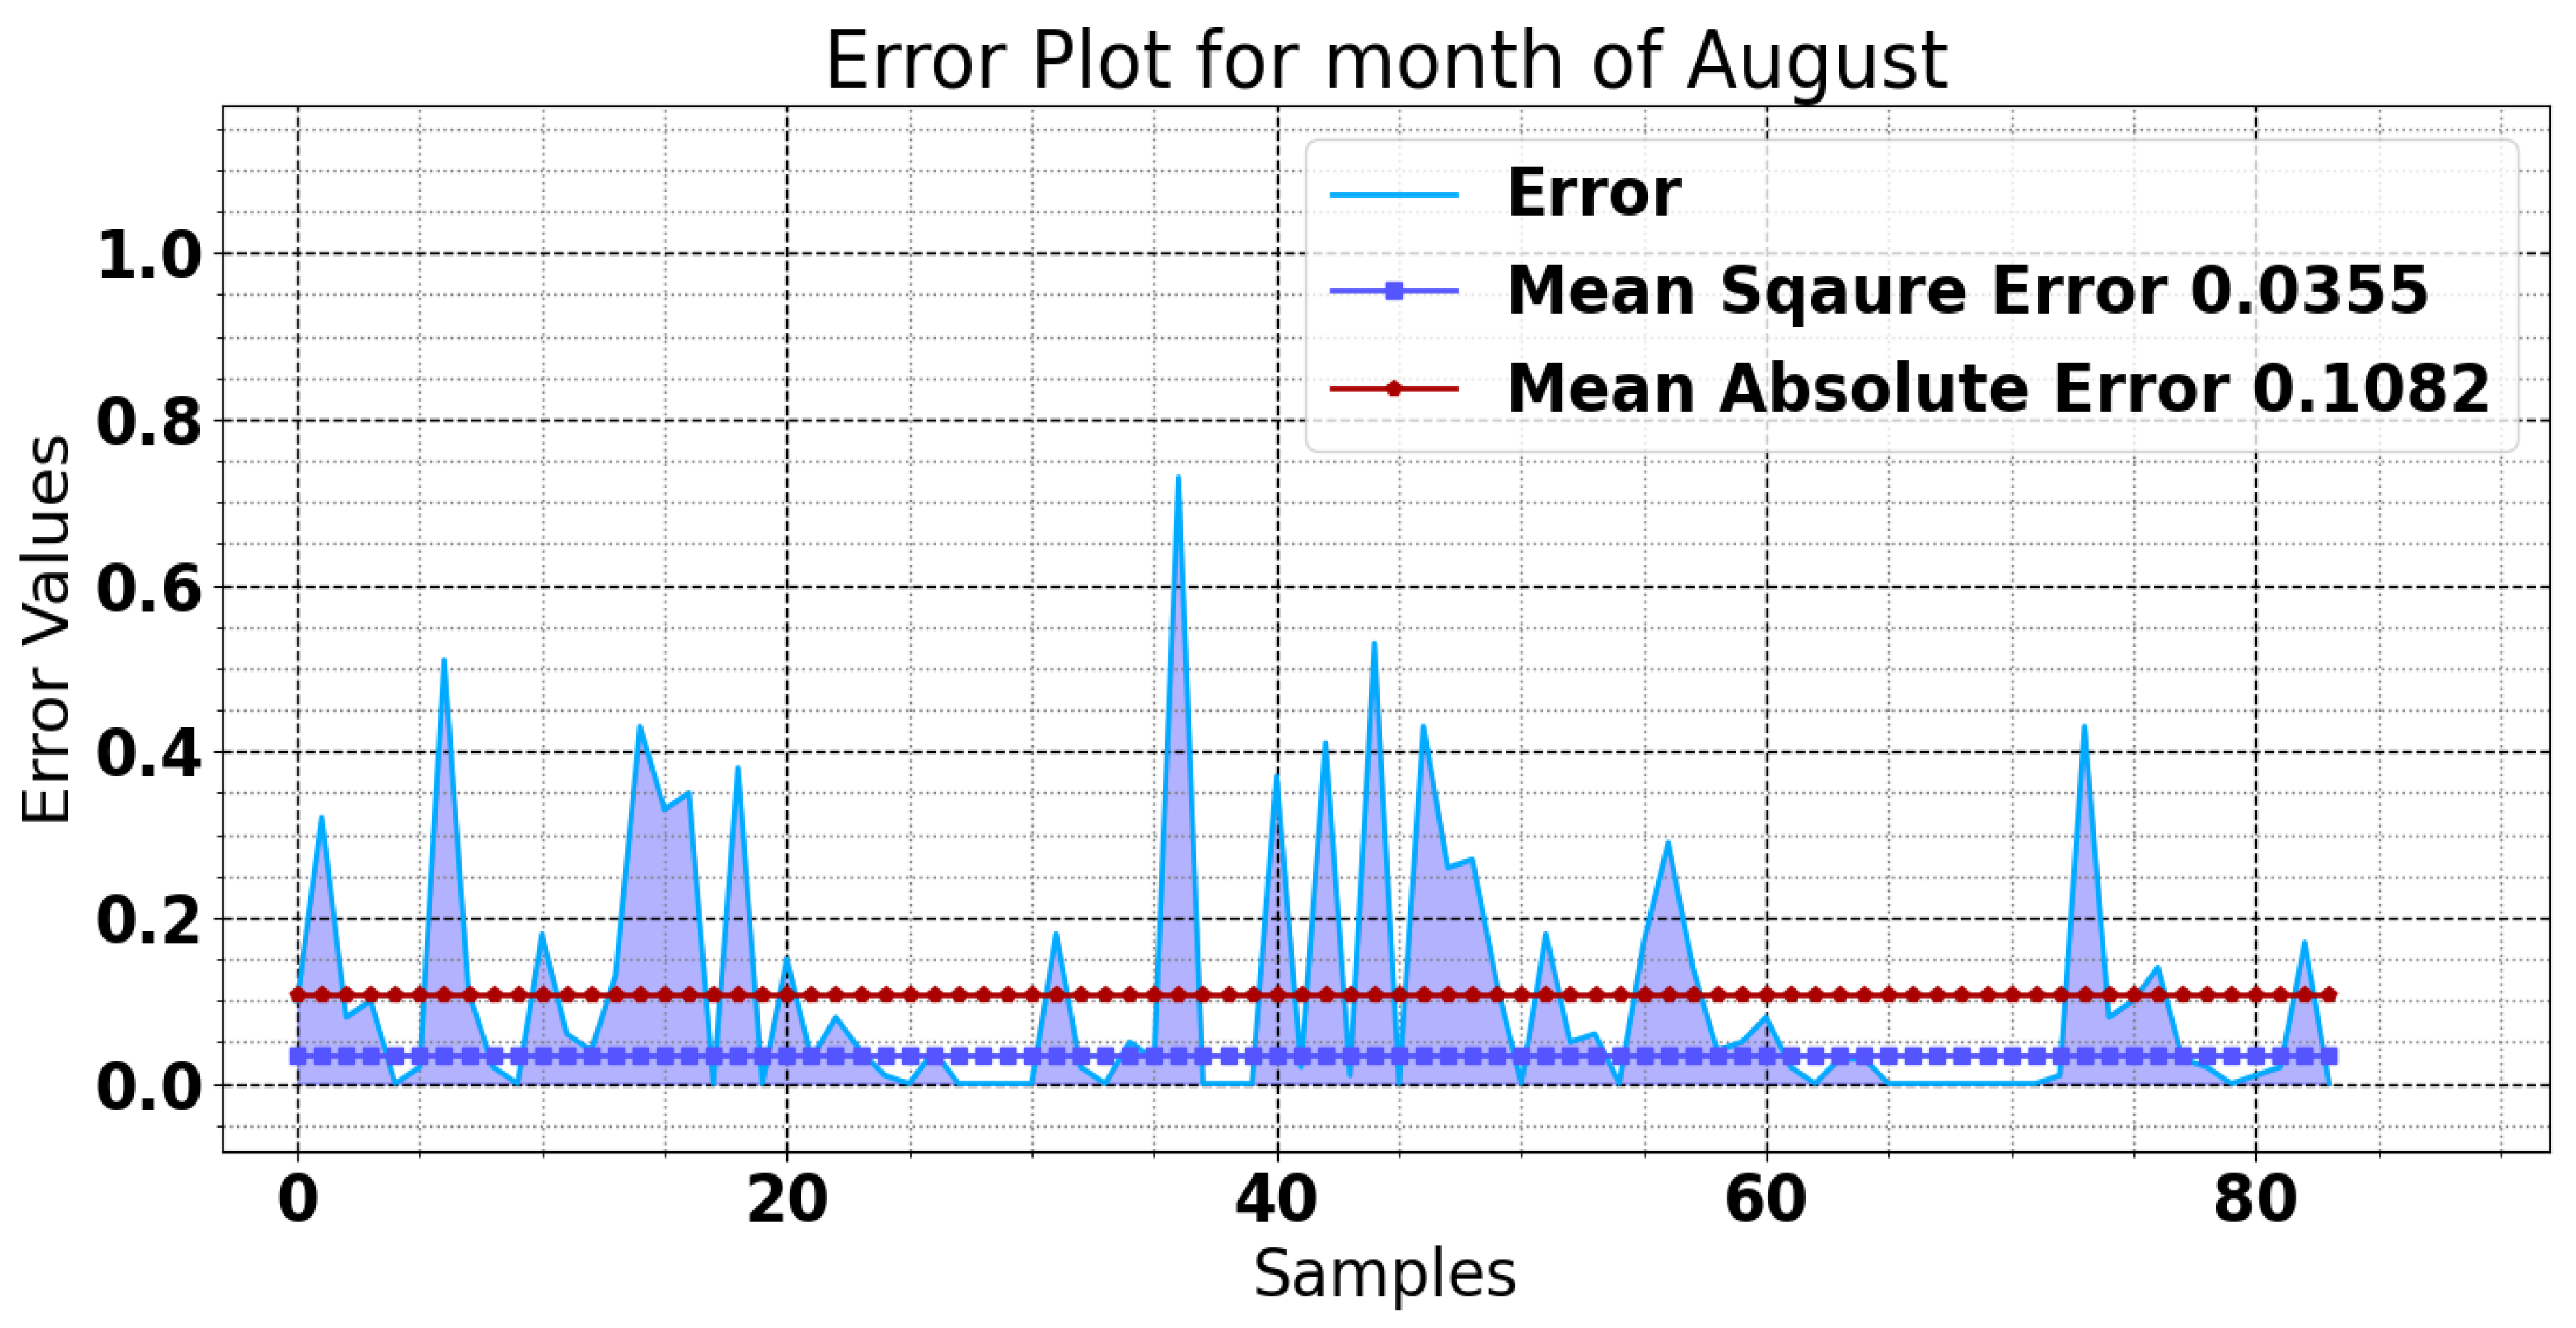
Figure 4.5.
Error Probability Region for August.
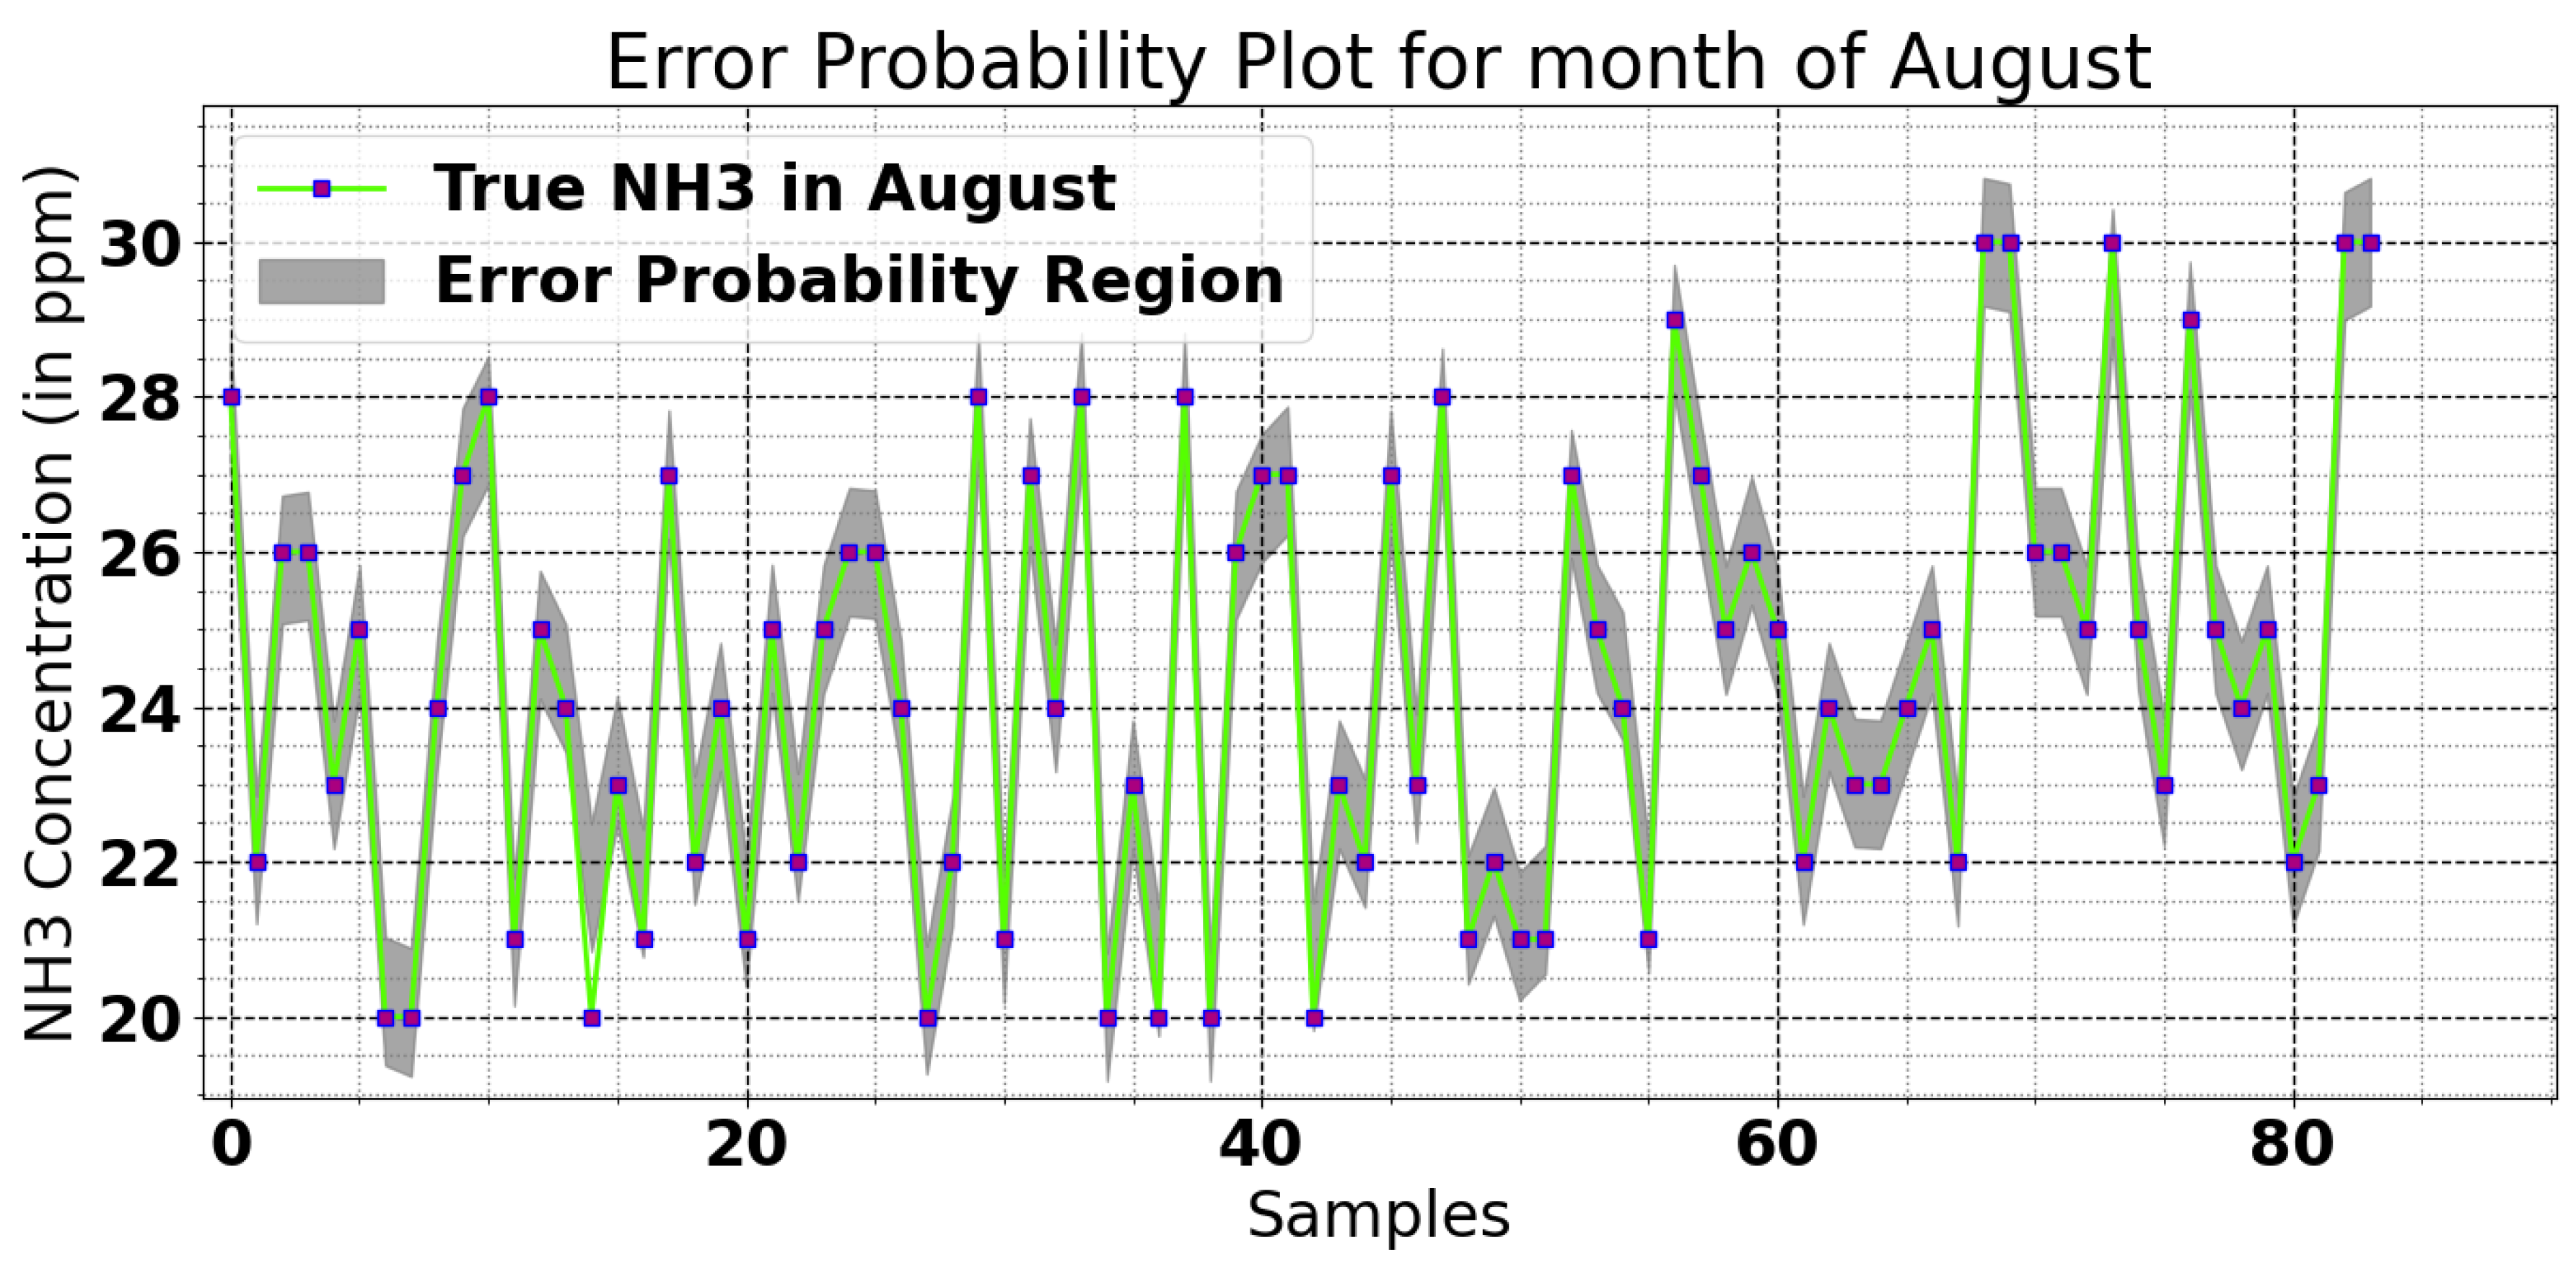
The error plot for August also, indicating the models' consistency of predicted values distributed closely across samples. If we notice the error graph above departing little from zero, then this proves that a model is pretty accurate. The region of error probability, which can be seen in Figure 4.5, illustrates the probability of prediction errors in a minimal range.
The predictions for ammonia provided by random forest model for the month of September also have a high degree of accuracy, with negligible amount of error. The Figure 4.6 demonstrates the predicted ammonia levels match very closely with true ammonia levels. It has small margin of error with mean square error (MSE) of 0.0715 and mean absolute error (MAE) of 0.1193, shown in Figure 4.7.
Figure 4.7.
Ammonia Concentration Comparison Curve for September - True Concentration vs. Predicted Concentration.
Figure 4.7.
Ammonia Concentration Comparison Curve for September - True Concentration vs. Predicted Concentration.
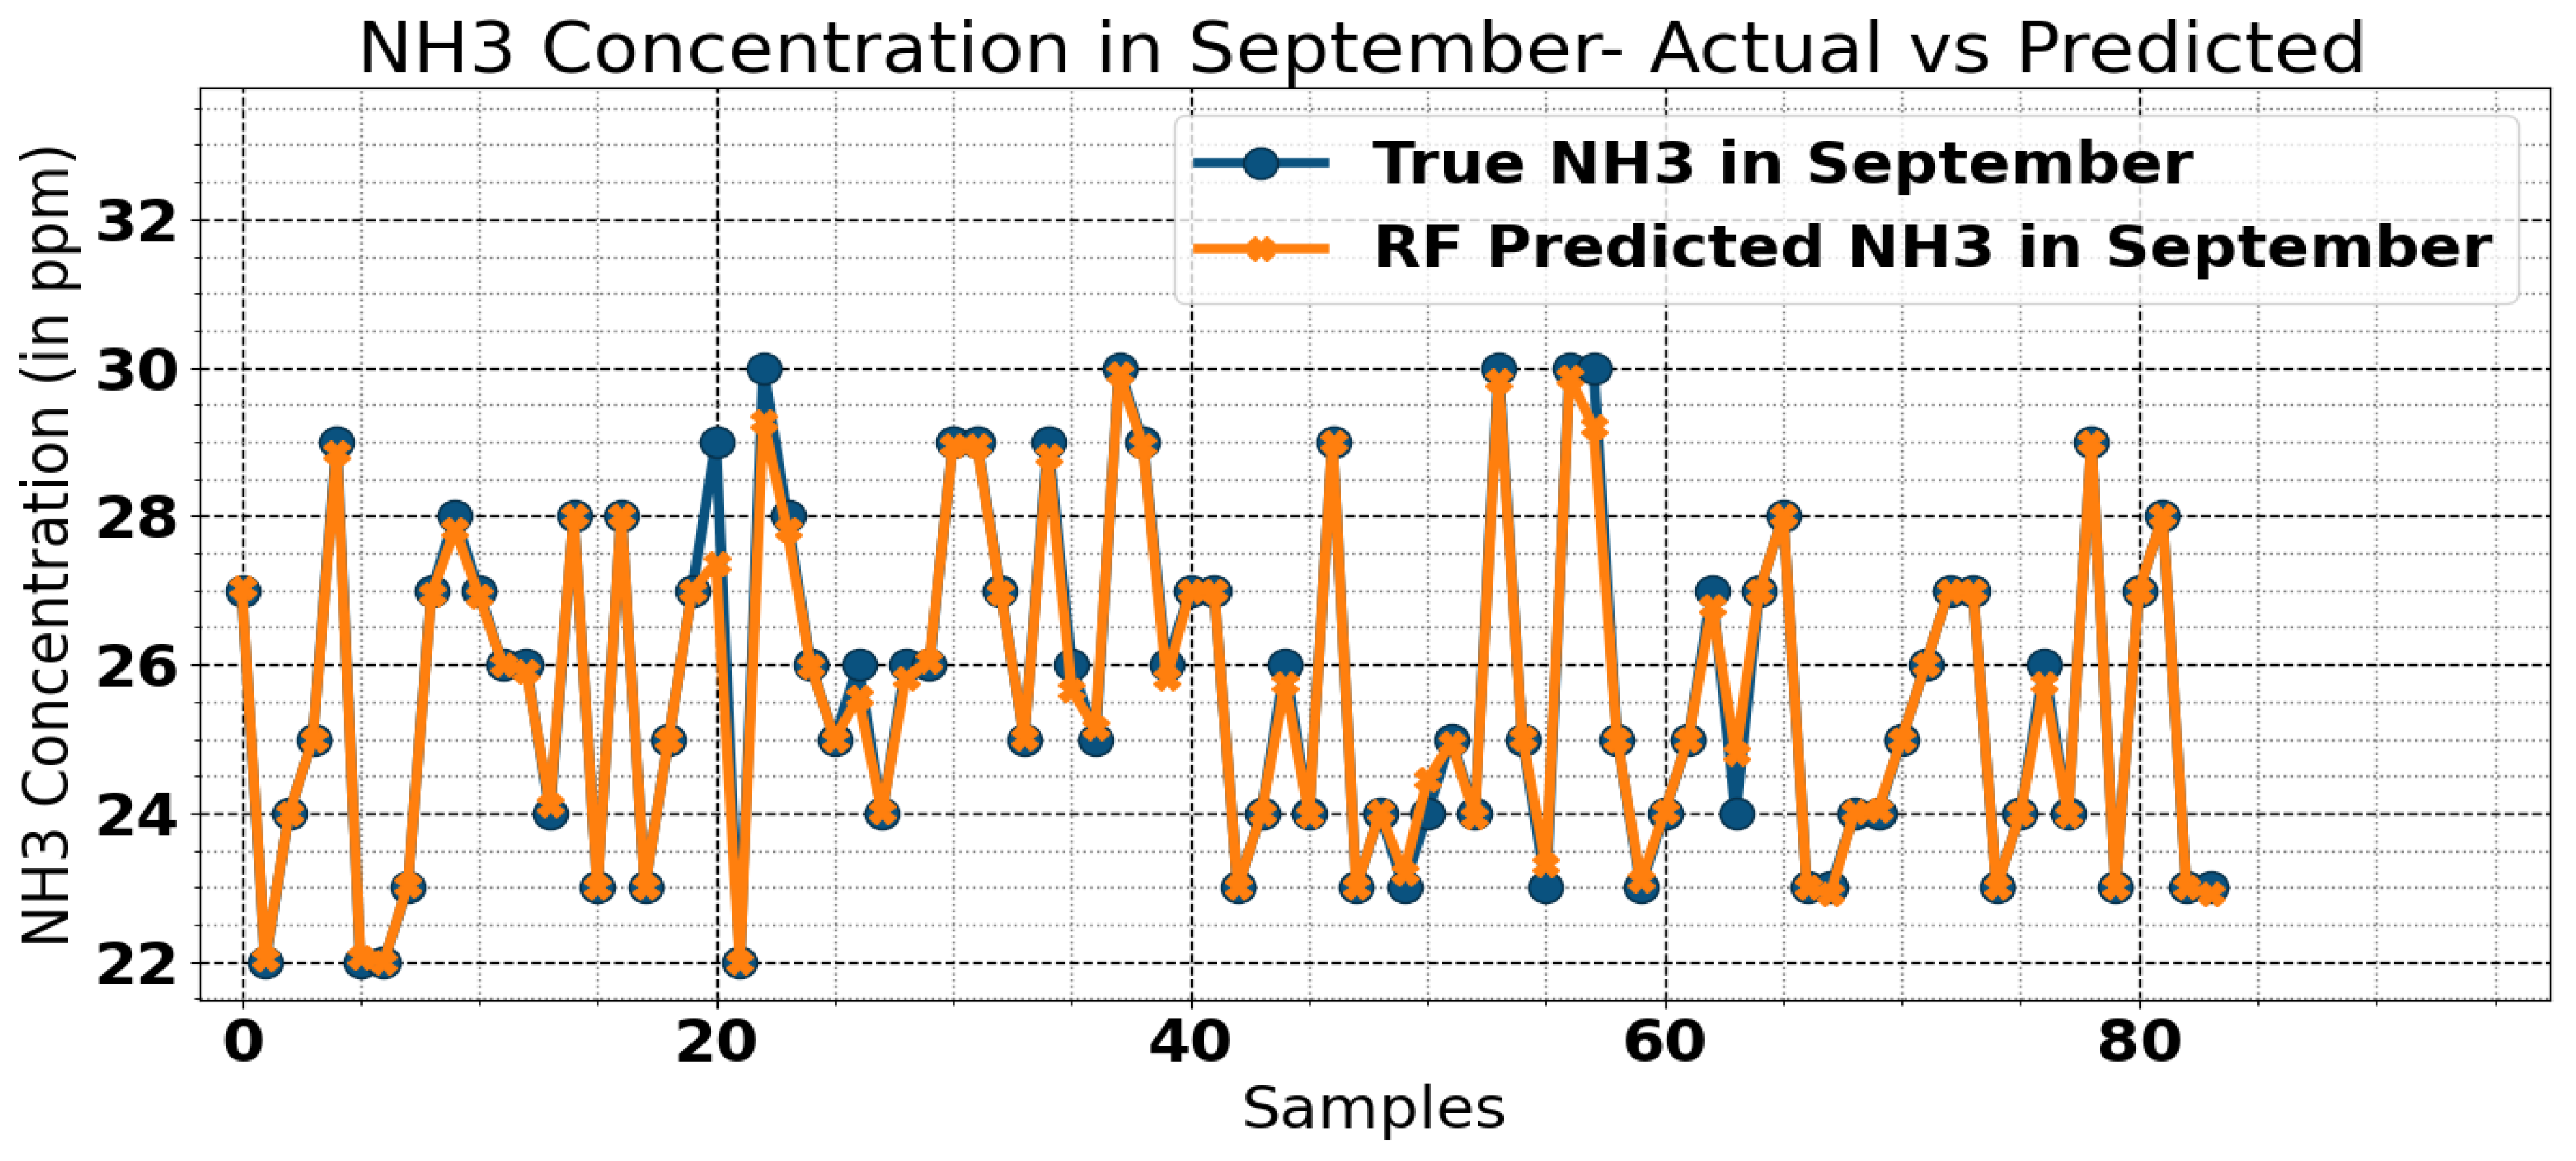
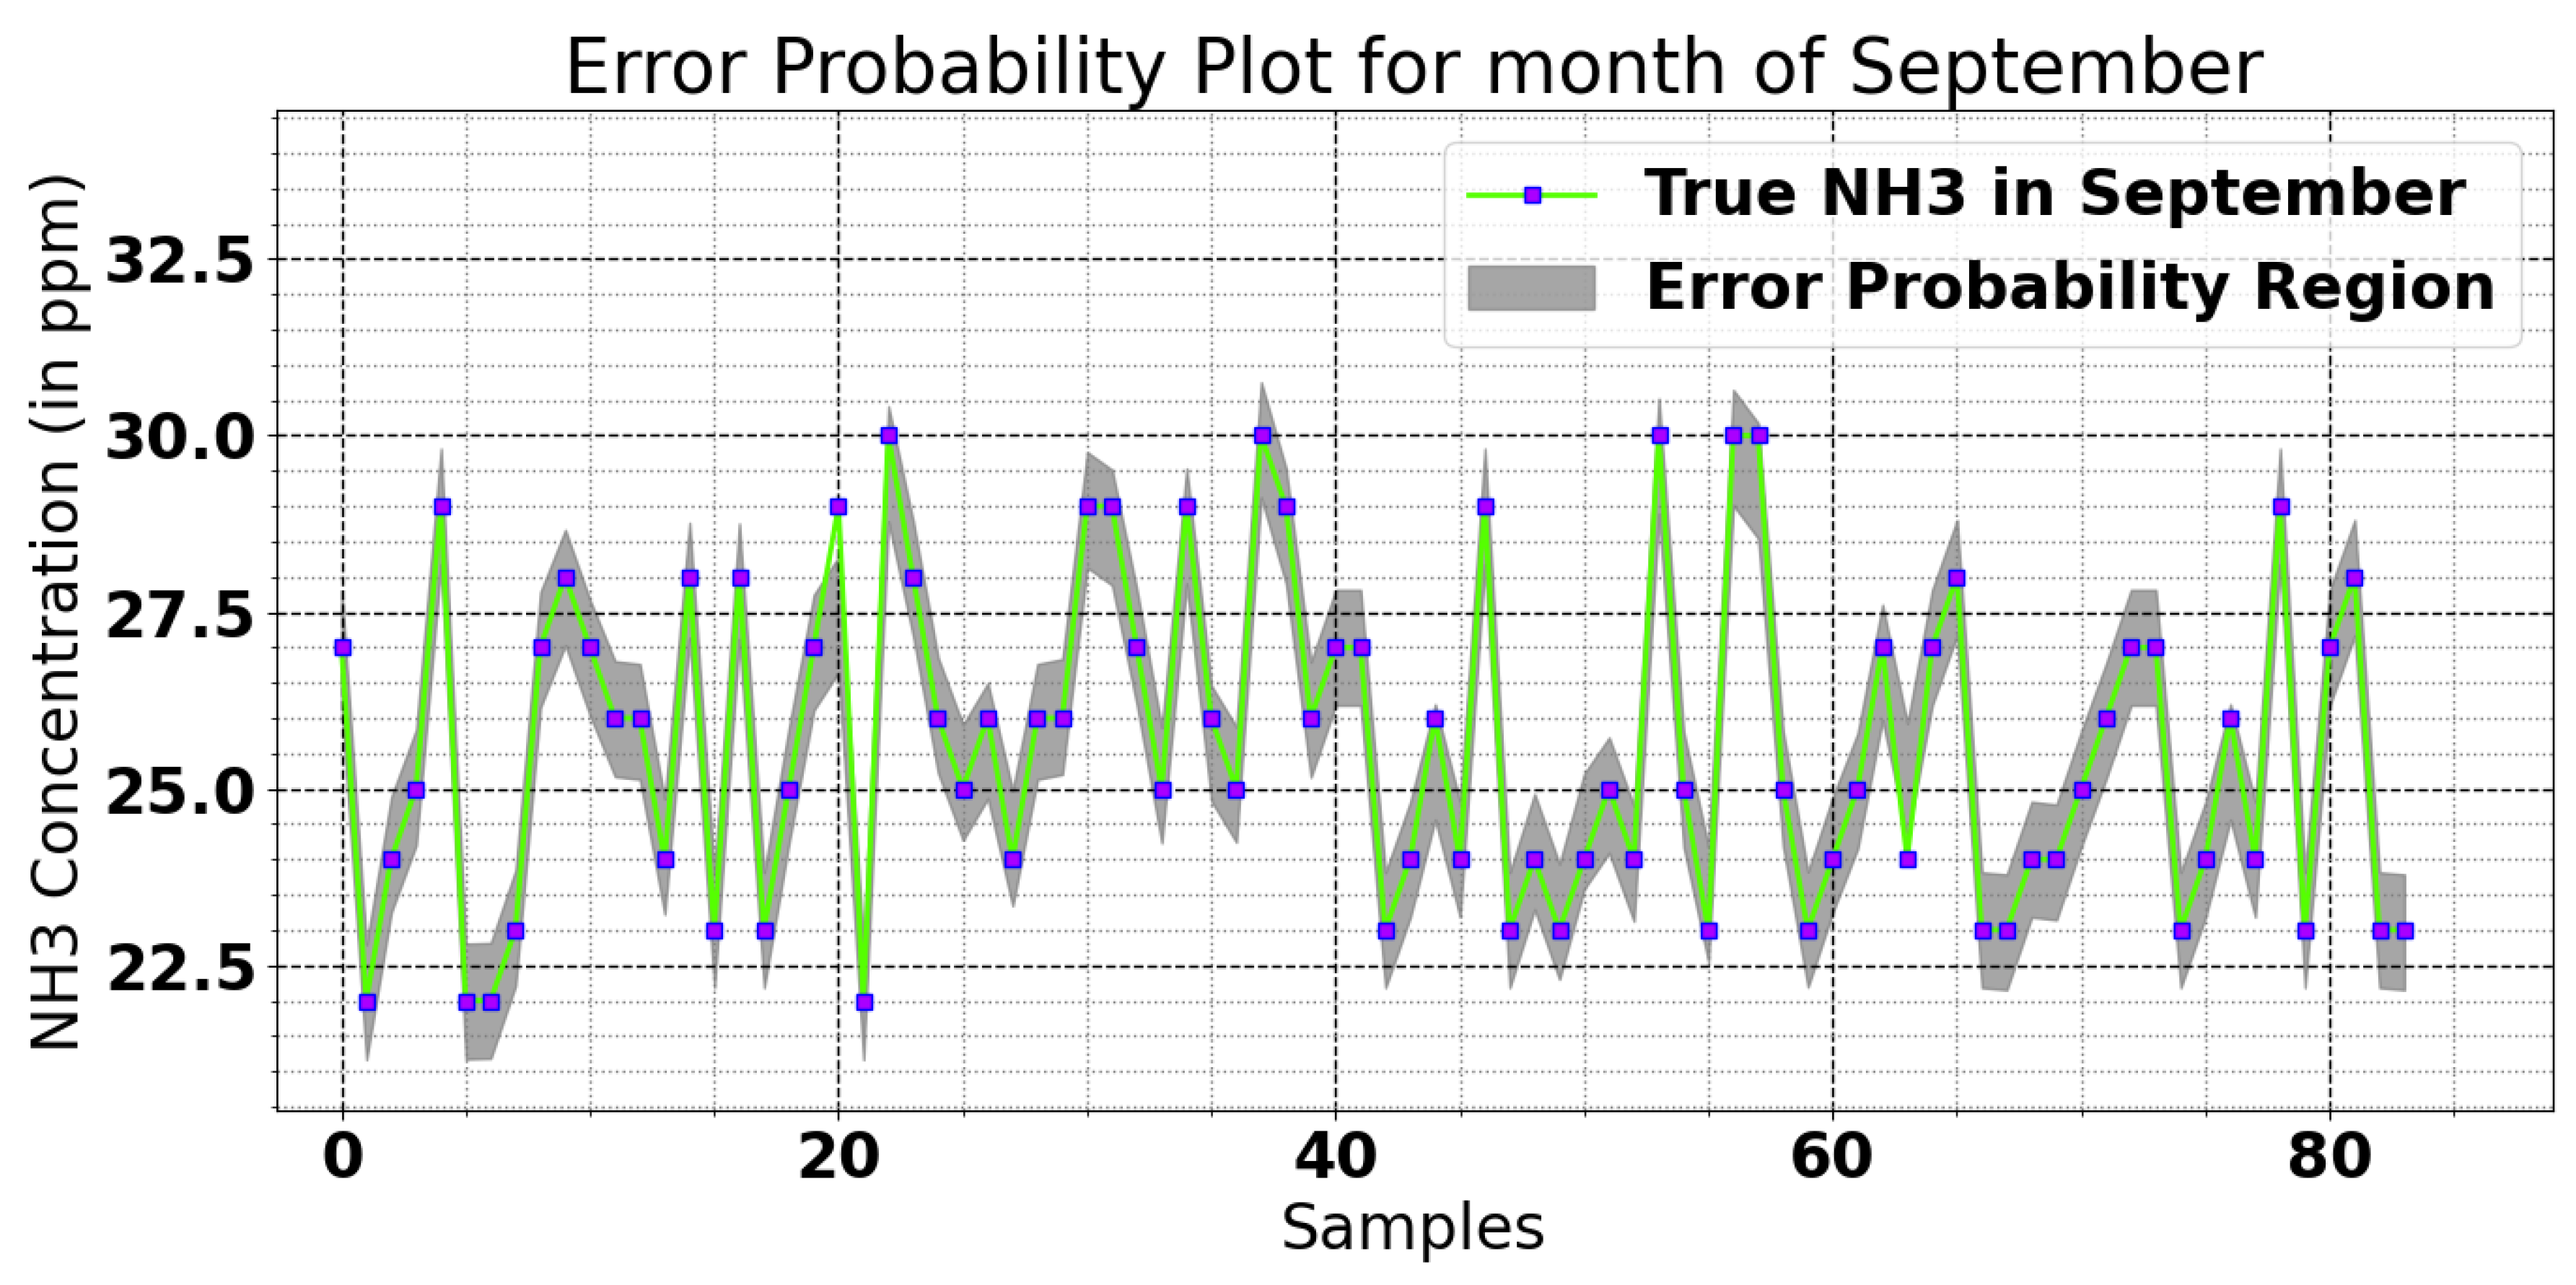
The graph for September demonstrates the strong correlation between true ammonia and predicted, with negligible error. The error plot for the month of September shown in Figure 4.8 indicates that the maximum predictions exists within a small narrow error margin, explaining the accuracy of trained model for the month of September. The probability of error occurs during ammonia prediction is depicted in Figure 4.9.
Figure 4.8.
Error Plot for September.
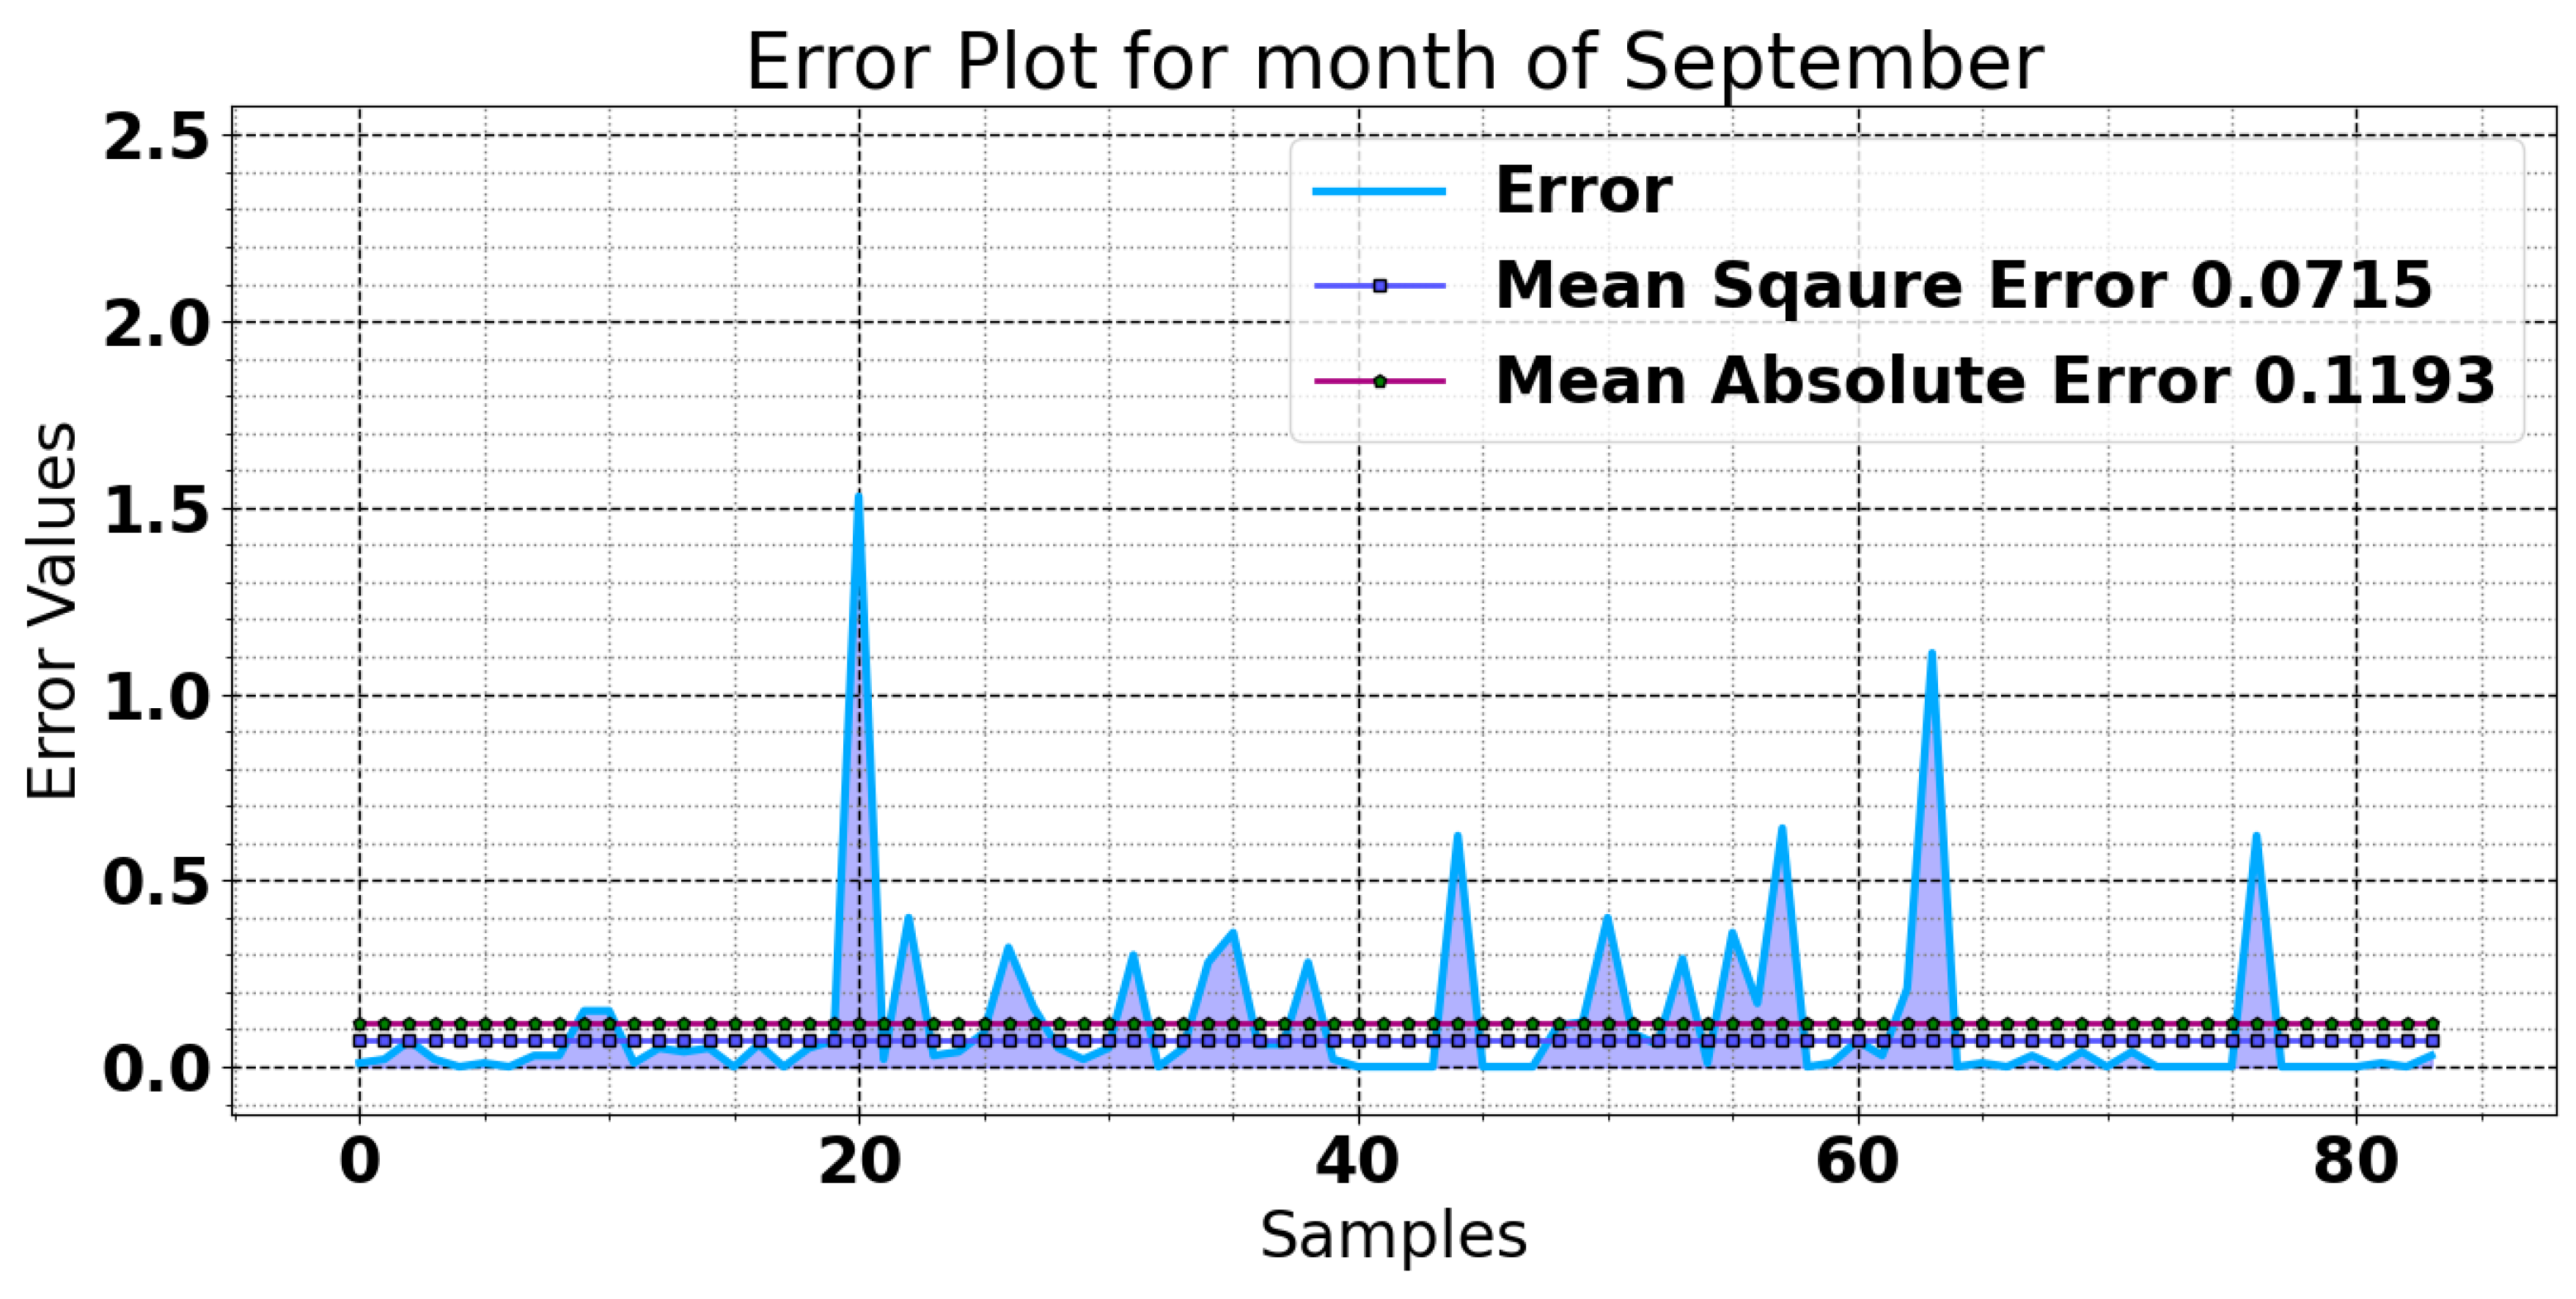
Figure 4.9.
Error Probability Region for September.
The random forest machine learning model is also showing an extraordinary performance and precise prediction of ammonia gas for the month of October, with very small (almost negligible) amount of error. As shown in Figure 4.10, the predicted ammonia concentration is very closely aligned with its original value. Figure 4.11 demonstrates the error during ammonia prediction, the mean square error (MSE) is 0.0 and the mean absolute error (MAE) is 0.1704
Figure 4.10.
Ammonia Concentration Comparison Curve for October - True Concentration vs. Predicted Concentration.
Figure 4.10.
Ammonia Concentration Comparison Curve for October - True Concentration vs. Predicted Concentration.
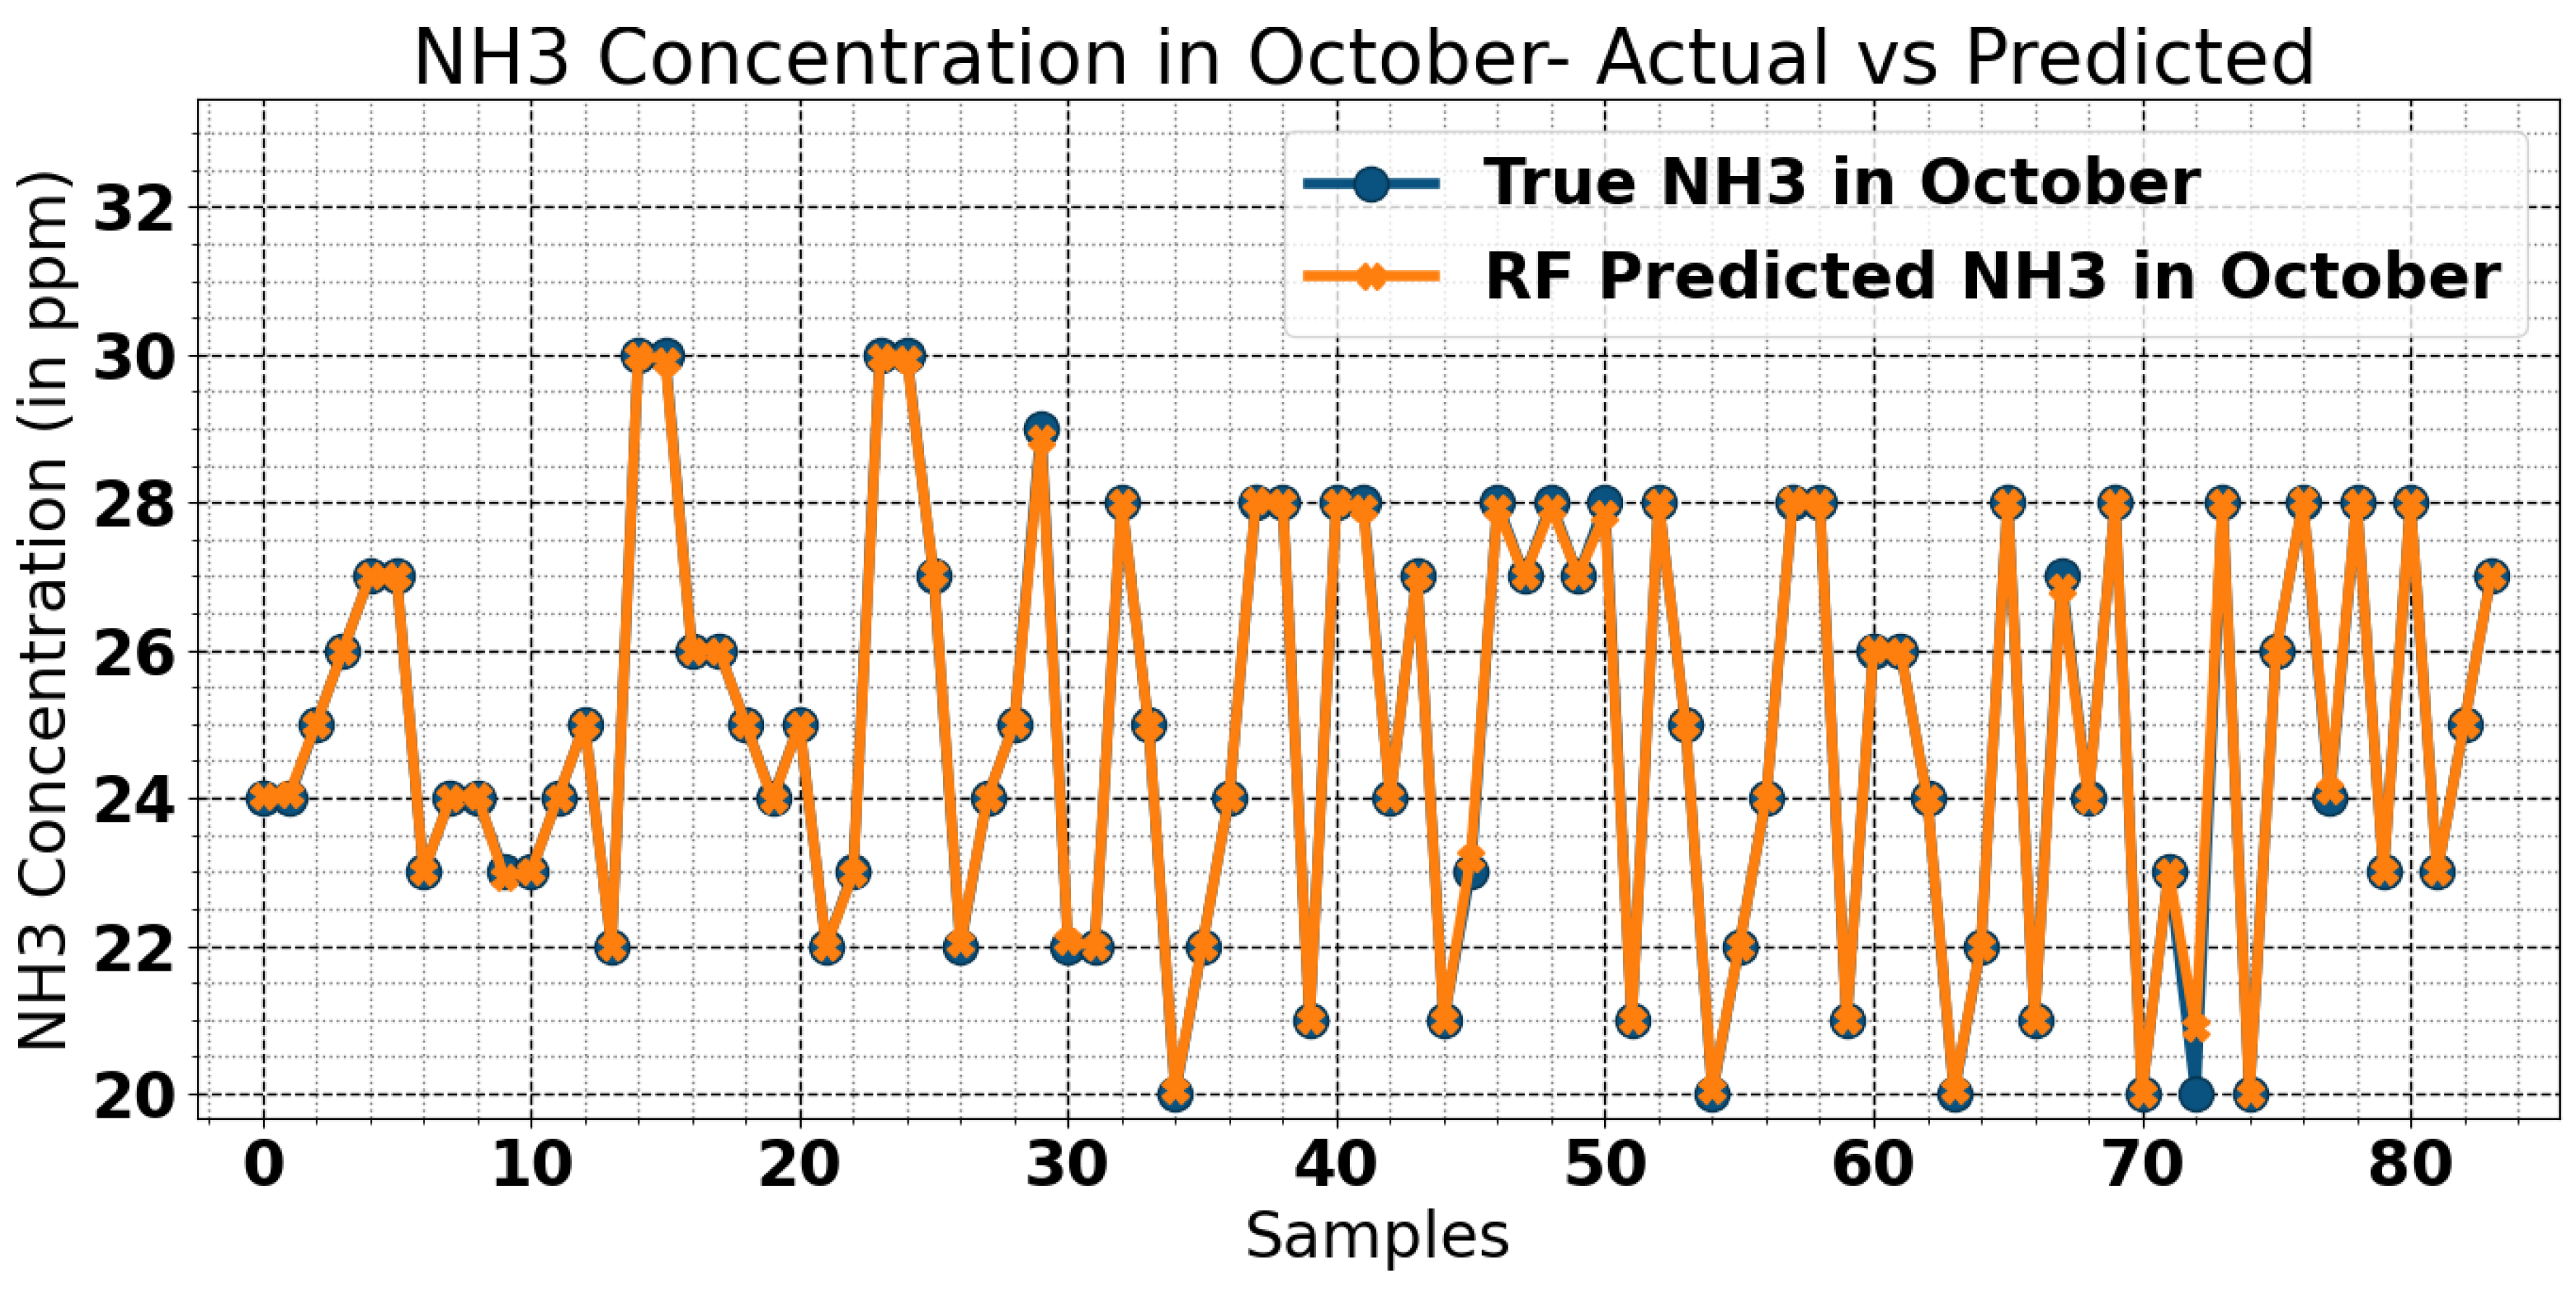
Figure 4.11.
Error Plot for October.
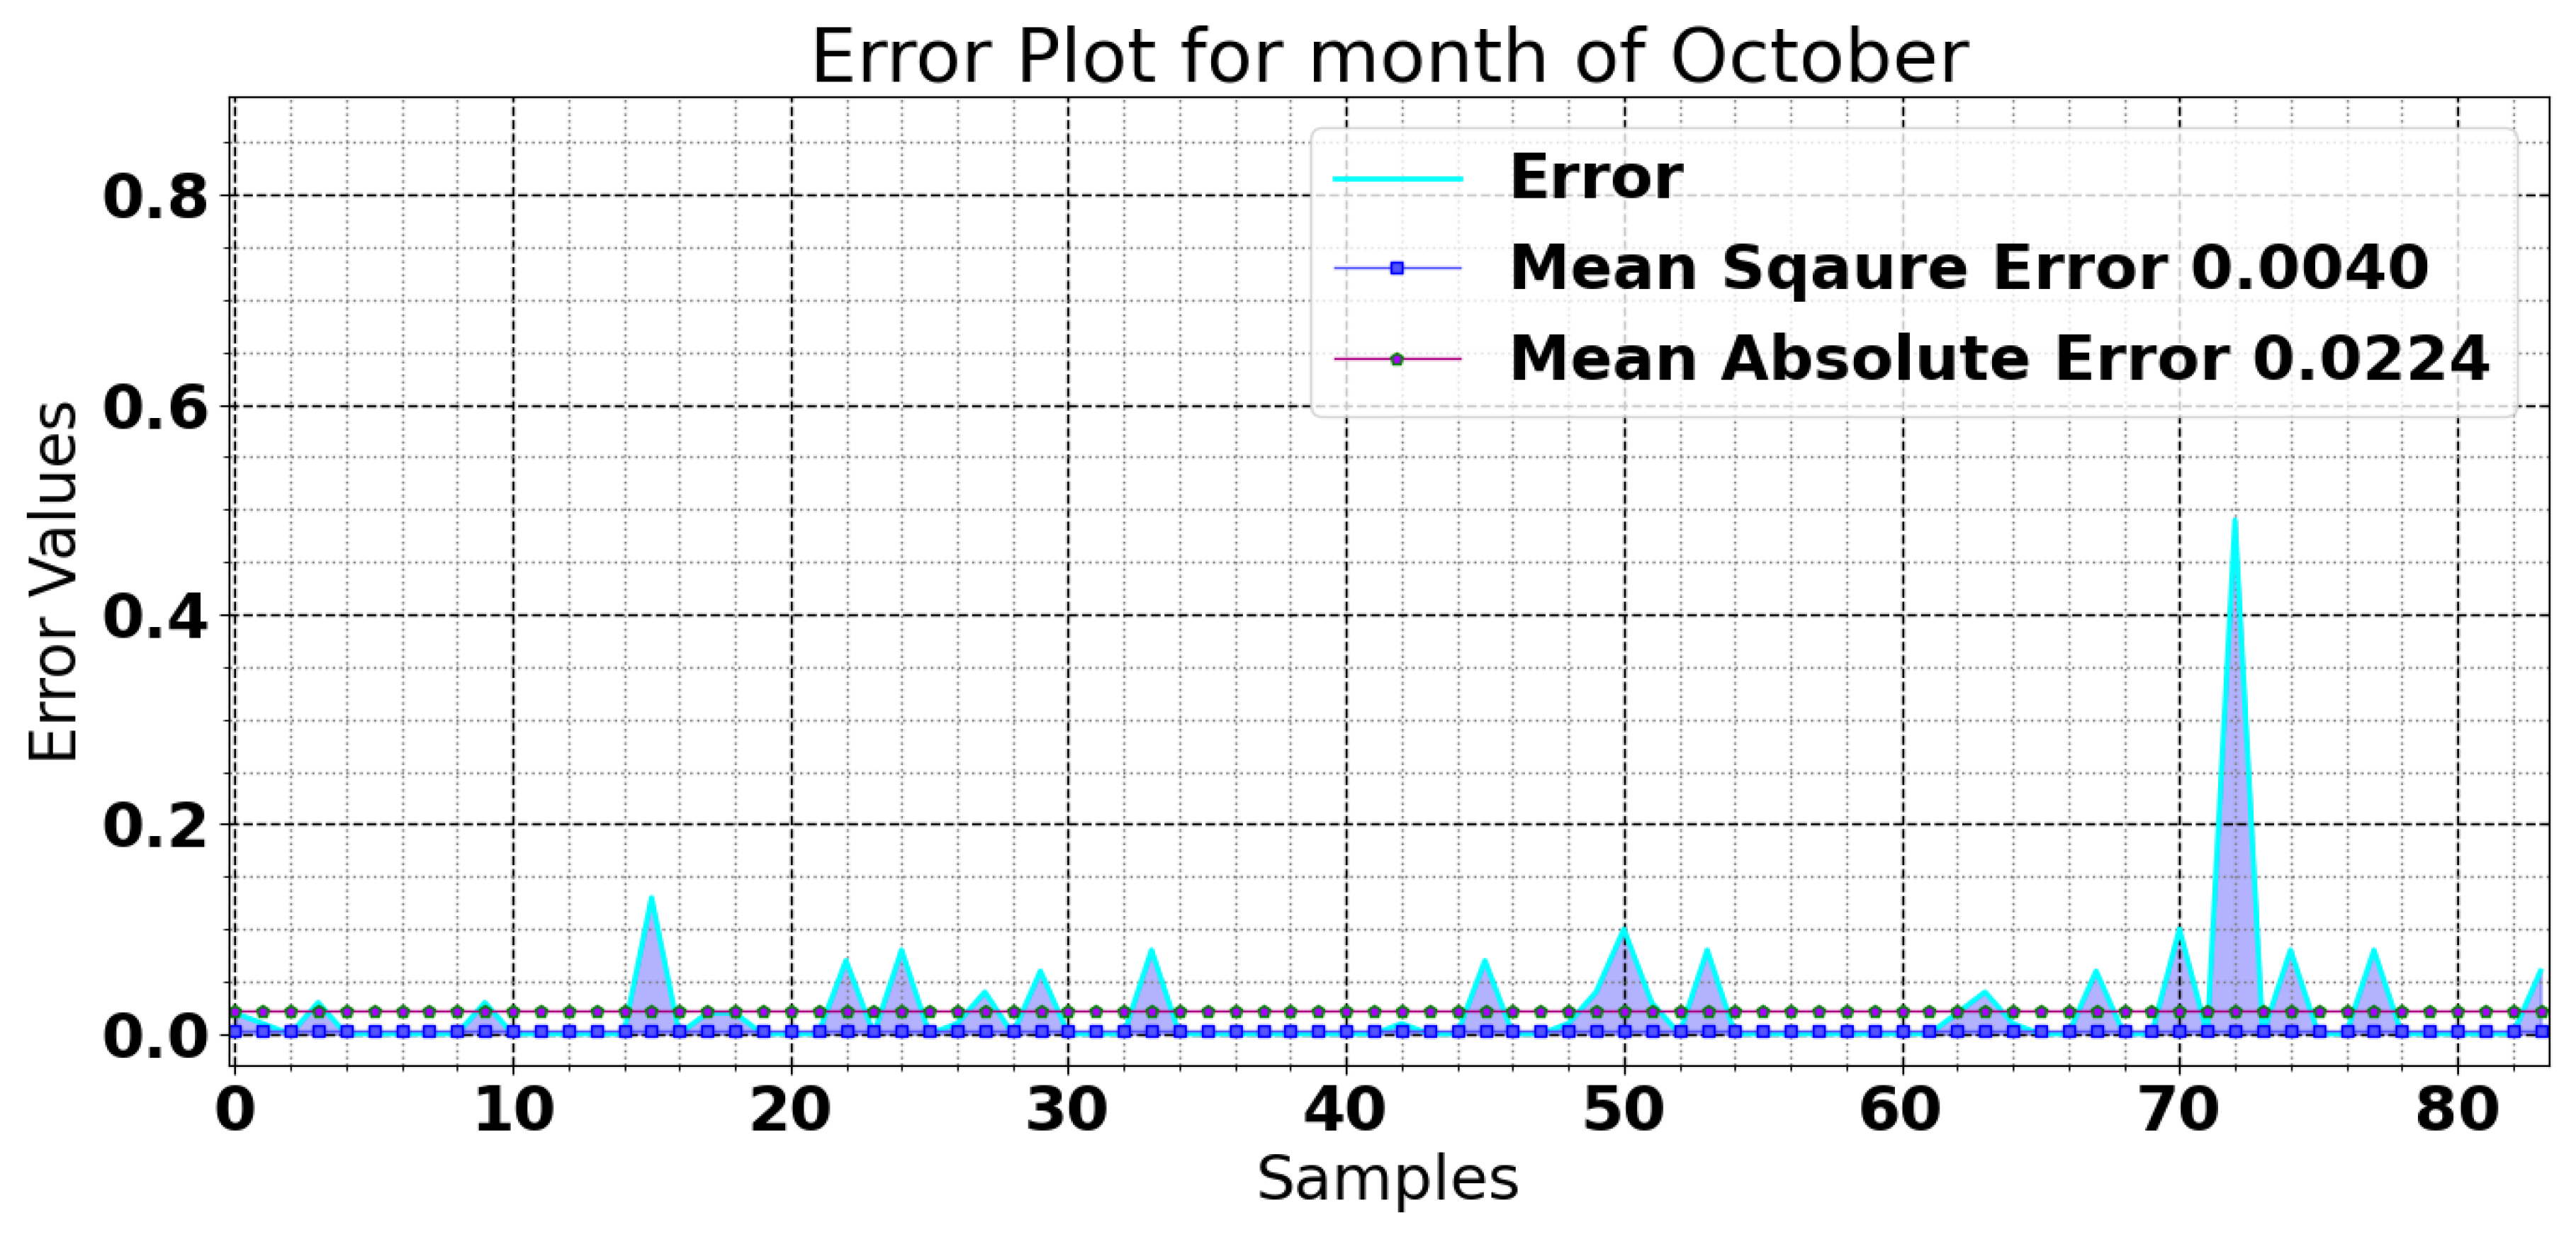
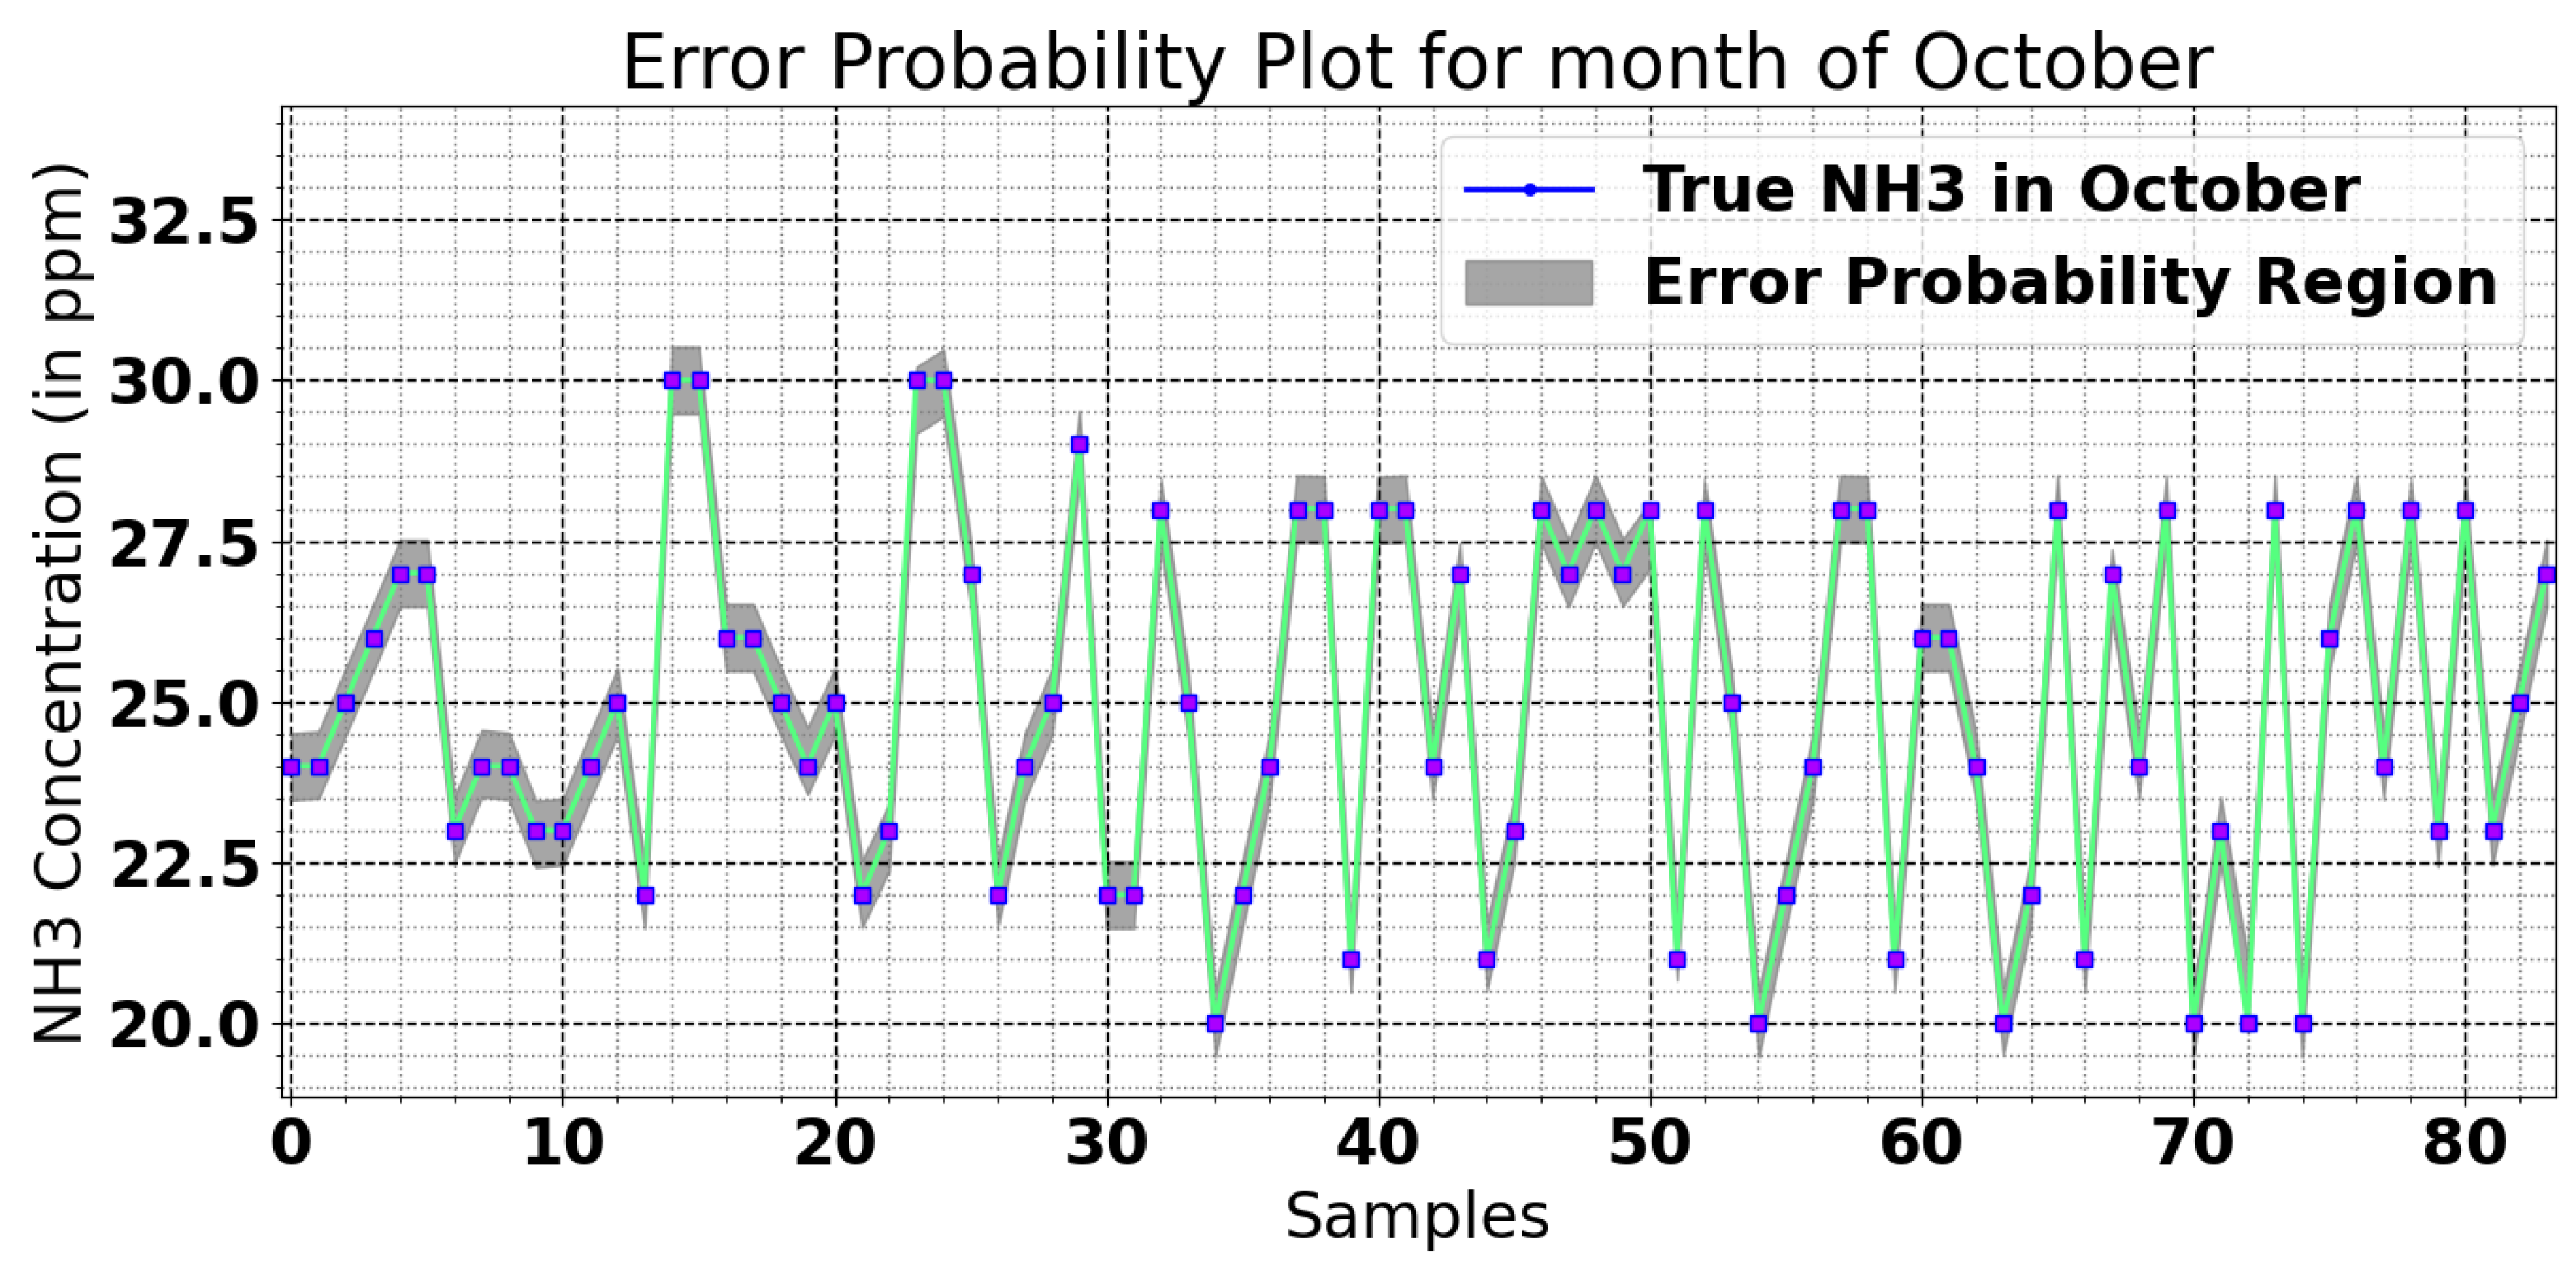
The error plot for October demonstrates the strong correlation between true ammonia and predicted and predicted ammonia, with negligible error. The error plot shown in Figure 4.11 indicates that the maximum predictions exists within a small narrow error margin, explaining the accuracy of trained model for the month of October. The probability of error occurs during ammonia prediction is depicted in Figure 4.12.
Figure 4.12.
Error Probability Region for October.
The Random Forest model expressed the extraordinary precision in predicting ammonia concentration levels for the July, August, September, and October months. It shows the high correlation between predicted ammonia and true ammonia values, along with minimal error, defines the effectiveness and reliability of random forest machine learning model. The random forest machine leaning predictive approach helps the poultry farmers to take proactive measures to optimize environmental conditions, resulting improvements in animal welfare and operational efficiency. By predicting upcoming ammonia (NH3) concentrations, the random forest model can warn the farm operators to apply the ammonia depression methods before levels become dangerous.
5. Conclusions
The LoRa-WAN-based network for centralizing data at the main control room allows us to monitor multiple poultry houses simultaneously. By applying our machine learning algorithm, we can provide specific responses to workers at specific poultry houses, enabling them to take prior decisions for reducing ammonia levels. The earlier prediction of ammonia levels by environmental parameters is done using the Random Forest Machine Learning Algorithm. We update the centralized data on our website, providing poultry owners with live information about their particular poultry house.
Our Random Forest model shows extreme precision in forecasting ammonia concentration levels for the months of July, August, September, and October. The high correlation between predicted and true values, along with low error rates, underscores the model's effectiveness and reliability. This predictive capability enables poultry farmers to take proactive measures to optimize environmental conditions, thereby improving animal welfare[2] and operational efficiency.
The integration of IoT and LoRa-WAN monitoring systems and advanced machine learning models such as Random Forest provides a powerful tool for advancing precision agriculture in poultry farming. The proposed solution not only offers a cost-effective and reliable means of monitoring essential environmental parameters but also enhances decision-making processes through accurate predictions, ultimately contributing to the sustainability and profitability of poultry farming operations.
Author Contributions
I (Harveer Singh) am the principal author of the research paper titled "Optimizing Ammonia Concentration in Poultry Houses through Random Forest Prediction and LoRa-WAN Monitoring & Controlling System". I have been actively involved in all phases of this research project. My specific contributions include: Conceptualization and Design: Developed the initial research idea and designed the study framework, integrating machine learning techniques with IoT-based monitoring systems. Software Development: Designed and implemented the software algorithms for ammonia concentration prediction using Random Forest models. Hardware Integration: Led the development and integration of the hardware components, including sensors and communication devices, necessary for real-time data acquisition and control via LoRa-WAN. Testing and Validation: Conducted extensive testing and validation of the proposed system to ensure its reliability and accuracy in real-world poultry house environments. Data Analysis: Analysed the collected data to evaluate the performance of the system and its impact on ammonia optimization and poultry health. Manuscript Preparation: Wrote the manuscript, including drafting all sections of the paper and coordinating revisions based on peer feedback. My research guide, Dr. Ashok Kumar Kajla, provided invaluable supervision and guidance throughout the project.
Funding
This research was conducted without any external funding or financial support. The study was carried out using the resources available at the affiliated institution. No funding from commercial, public, or non-profit organizations was received for this research.
Data Availability Statement
The dataset used in this research is publicly available and can be accessed from the IEEE Data-Port. The "Poultry Farm Environmental Sensor Dataset," which was utilized for the analysis, is available at: https://ieee-dataport.org/documents/poultry-farm-environmental-sensor-dataset This dataset includes environmental sensor data collected from poultry farms, which was used to train and validate the models presented in this study. Any additional data generated or analyzed during this study that is not publicly available will be provided by the authors upon reasonable request.
Acknowledgments
I (Harveer Singh) am the principal author of the research paper titled "Optimizing Ammonia Concentration in Poultry Houses through Random Forest Prediction and LoRa-WAN Monitoring & Controlling System," going to submitted in the Elsevier Journal Smart Agricultural Technology. I have been actively involved in all phases of this research project. My specific contributions include: Conceptualization and Design: Developed the initial research idea and designed the study framework, integrating machine learning techniques with IoT-based monitoring systems. Software Development: Designed and implemented the software algorithms for ammonia concentration prediction using Random Forest models. Hardware Integration: Led the development and integration of the hardware components, including sensors and communication devices, necessary for real-time data acquisition and control via LoRa-WAN. Testing and Validation: Conducted extensive testing and validation of the proposed system to ensure its reliability and accuracy in real-world poultry house environments. Data Analysis: Analysed the collected data to evaluate the performance of the system and its impact on ammonia optimization and poultry health. Manuscript Preparation: Wrote the manuscript, including drafting all sections of the paper and coordinating revisions based on peer feedback. My research guide, Dr. Ashok Kumar Kajla, provided invaluable supervision and guidance throughout the project.
Conflicts of Interest
The authors declare that they have no known competing financial interests or personal relationships that could have appeared to influence the work reported in this paper. The authors declare the following financial interests/personal relationships which may be considered as potential competing interests:
Declaration of Generative AI Content
The author declares that the content of this manuscript, including all writing and research results, was independently developed without the use of generative AI tools. ChatGPT-4 was solely used for grammar and language editing purposes to enhance the readability of the text. No AI tools were used in the generation of original content or in the interpretation of research data.
References
- Pereira, W.F.; Fonseca, L.d.S.; Putti, F.F.; Góes, B.C.; Naves, L.d.P. Environmental monitoring in a poultry farm using an instrument developed with the internet of things concept. Comput. Electron. Agric. 2020, 170, 105257. [CrossRef]
- Lashari, M.H.; Karim, S.; Alhussein, M.; Hoshu, A.A.; Aurangzeb, K.; Anwar, M.S. Internet of Things-based sustainable environment management for large indoor facilities. PeerJ Comput. Sci. 2023, 9, e1623. [CrossRef]
- Al-Falahy, N.; Alani, O.Y. Technologies for 5G Networks: Challenges and Opportunities. It Prof. 2017, 19, 12–20. [CrossRef]
- Asnawi, M.F.; Syukriasari, F. A prototype for IoT based Rice Field Irrigation System. sinkron 2019, 3, 260–265. [CrossRef]
- Vanelli, B.; da Silva, M.P.; Manerichi, G.; Pinto, A.S.R.; Dantas, M.A.R.; Ferrandin, M.; Boava, A. Internet of Things Data Storage Infrastructure in the Cloud Using NoSQL Databases. IEEE Lat. Am. Trans. 2017, 15, 737–743. [CrossRef]
- Ben Sassi, Neila, Xavier Averós, and Inma Estevez. "Technology and poultry welfare." Animals 6, no. 10 (2016): 62.
- Oro, Camila, and Erica Cristina Bueno do Prado Guirro. "Influência da amônia proveniente da cama aviária sobre o bem-estar de frangos de corte." Revista Veterinária em Foco 12, no. 1 (2014).
- Castell, N.; Dauge, F.R.; Schneider, P.; Vogt, M.; Lerner, U.; Fishbain, B.; Broday, D.; Bartonova, A. Can commercial low-cost sensor platforms contribute to air quality monitoring and exposure estimates? Environ. Int. 2017, 99, 293–302. [CrossRef]
- Costa, A. Ammonia Concentrations and Emissions from Finishing Pigs Reared in Different Growing Rooms. J. Environ. Qual. 2017, 46, 255–260. [CrossRef]
- Gomes, D.A.; Bianchini, D. Interconnecting Wireless Sensor Networks with the Internet Using Web Services. IEEE Lat. Am. Trans. 2016, 14, 1937–1942. [CrossRef]
- David, B.; Moe, R.O.; Michel, V.; Lund, V.; Mejdell, C. Air Quality in Alternative Housing Systems May Have an Impact on Laying Hen Welfare. Part I—Dust. Animals 2015, 5, 495–511. [CrossRef]
- Damasceno, F.A.; Junior, T.Y.; de Lima, R.R.; Gomes, R.C.C.; de Moraes, S.R.P. Avaliação do bem-estar de frangos de corte em dois galpões comerciais climatizados. Cienc. E Agrotecnologia 2010, 34, 1031–1038. [CrossRef]
- Pessôa, Gabriel Borges Sandt, Fernando de Castro Tavernari, Rodolfo Alves Vieira, and Luiz Fernando Texeira Albino. "New concepts in poultry nutrition." Revista Brasileira de Saúde e Produção Animal 13 (2012): 755-774.
- Eyob Gebregeziabhear, Eyob Gebregeziabhear. "The effect of stress on productivity of animals: a review." (2015): 14-21.
- Hlaing, Win, Somchai Thepphaeng, Varunyou Nontaboot, Natthanan Tangsunantham, Tanayoot Sangsuwan, and Chaiyod Pira. "Implementation of WiFi-based single phase smart meter for Internet of Things (IoT)." In 2017 International Electrical Engineering Congress (iEECON), pp. 1-4. IEEE, 2017.
- Jácome, I.; Rossi, L.; Borille, R. Influence of artificial lighting on the performance and egg quality of commercial layers: a review. Braz. J. Poult. Sci. 2014, 16, 337–344. [CrossRef]
- Janczak, A.M.; Riber, A.B. Review of rearing-related factors affecting the welfare of laying hens. Poult. Sci. 2015, 94, 1454–1469. [CrossRef]
- Kaushik, A.; Kumar, R.; Arya, S.K.; Nair, M.; Malhotra, B.D.; Bhansali, S. Organic–Inorganic Hybrid Nanocomposite-Based Gas Sensors for Environmental Monitoring. Chem. Rev. 2015, 115, 4571–4606. [CrossRef]
- Le, Anh, Janus Varmarken, Simon Langhoff, Anastasia Shuba, Minas Gjoka, and Athina Markopoulou. "AntMonitor: A system for monitoring from mobile devices." In Proceedings of the 2015 ACM SIGCOMM Workshop on Crowdsourcing and Crowdsharing of Big (Internet) Data, pp. 15-20. 2015.
- Mahdavinejad, M.S.; Rezvan, M.; Barekatain, M.; Adibi, P.; Barnaghi, P.; Sheth, A.P. Machine learning for internet of things data analysis: a survey. Digit. Commun. Netw. 2018, 4, 161–175. [CrossRef]
- Najafi, Pardis, Idrus Zulkifli, Nurfarahin Amat Jajuli, Abdoreza Soleimani Farjam, Suriya Kumari Ramiah, Anna Aryani Amir, Emily O’Reily, and David Eckersall. "Environmental temperature and stocking density effects on acute phase proteins, heat shock protein 70, circulating corticosterone and performance in broiler chickens." International journal of biometeorology 59 (2015): 1577-1583.
- Nkoa, R. Agricultural benefits and environmental risks of soil fertilization with anaerobic digestates: a review. Agron. Sustain. Dev. 2013, 34, 473–492. [CrossRef]
- K.Othman, J.; Mahmood, J.R.; Emarah, G.Y.A.A. Design and Implementation of Smart Relay based Remote Monitoring and Controlling of Ammonia in Poultry Houses. Int. J. Comput. Appl. 2014, 103, 13–18. [CrossRef]
- Pan, J.; Yang, Y.; Yang, B.; Yu, Y. Artificial Polychromatic Light Affects Growth and Physiology in Chicks. PLOS ONE 2014, 9, e113595. [CrossRef]
- Pereira, S.G.M.; Pereira, F.A.d.S.M.; Goncalves, R.F.; dos Santos, D.S. Software project for remote monitoring of body temperature. IEEE Lat. Am. Trans. 2017, 15, 2238–2243. [CrossRef]
- Mahale, Rupali B., and S. S. Sonavane. "Smart Poultry Farm Monitoring Using IOT and Wireless Sensor Networks." International Journal of Advanced Research in Computer Science 7, no. 3 (2016).
- Rapson, D. Durable goods and long-run electricity demand: Evidence from air conditioner purchase behavior. J. Environ. Econ. Manag. 2014, 68, 141–160. [CrossRef]
- Santoro, G.; Vrontis, D.; Thrassou, A.; Dezi, L. The Internet of Things: Building a knowledge management system for open innovation and knowledge management capacity. Technol. Forecast. Soc. Chang. 2018, 136, 347–354. [CrossRef]
- Schreiber, Fábio Victor, Roberto Alexandre Dias, and Victoria Zanetti Marçal Gallo. "Remote water consumption metering using MQTT over sub-gigahertz RF environment." International Journal of Computer Applications 180, no. 51 (2018): 10-17.
- Soliman, E.S.; Moawed, S.A.; Hassan, R.A. Influence of microclimatic ammonia levels on productive performance of different broilers' breeds estimated with univariate and multivariate approaches. Veter- World 2017, 10, 880–887. [CrossRef]
- Sousa, F. C., I. F. F. Tinôco, M. O. Paula, A. L. Silva, C. F. Souza, F. J. F. Batista, and Matteo Barbari. "Medidas para minimizar a emissão de amônia na produção de frangos de corte: revisão." Revista Brasileira de Engenharia de Biossistemas 10, no. 1 (2016): 51-61.
- Souza, A.P.O.; Molento, C.F.M. The Contribution of Broiler Chicken Welfare Certification at Farm Level to Enhancing Overall Animal Welfare: The Case of Brazil. J. Agric. Environ. Ethic- 2015, 28, 1033–1051. [CrossRef]
- Uckelmann, Dieter, Mark Harrison, and Florian Michahelles, eds. Architecting the internet of things. Springer Science & Business Media, 2011.
- van Weeghel, H.E.; Bos, A.(.; Spoelstra, S.F.; Koerkamp, P.W.G. Involving the animal as a contributor in design to overcome animal welfare related trade-offs: The dust bath unit as an example. Biosyst. Eng. 2016, 145, 76–92. [CrossRef]
- Winkel, A.; Mosquera, J.; Aarnink, A.J.; Koerkamp, P.W.G.; Ogink, N.W. Evaluation of a dry filter and an electrostatic precipitator for exhaust air cleaning at commercial non-cage laying hen houses. Biosyst. Eng. 2015, 129, 212–225. [CrossRef]
- Zambon, I.; Cecchini, M.; Egidi, G.; Saporito, M.G.; Colantoni, A. Revolution 4.0: Industry vs. Agriculture in a Future Development for SMEs. Processes 2019, 7, 36. [CrossRef]
Disclaimer/Publisher’s Note: The statements, opinions and data contained in all publications are solely those of the individual author(s) and contributor(s) and not of MDPI and/or the editor(s). MDPI and/or the editor(s) disclaim responsibility for any injury to people or property resulting from any ideas, methods, instructions or products referred to in the content. |
© 2024 by the authors. Licensee MDPI, Basel, Switzerland. This article is an open access article distributed under the terms and conditions of the Creative Commons Attribution (CC BY) license (http://creativecommons.org/licenses/by/4.0/).
Copyright: This open access article is published under a Creative Commons CC BY 4.0 license, which permit the free download, distribution, and reuse, provided that the author and preprint are cited in any reuse.


