
Submitted:
27 August 2024
Posted:
29 August 2024
You are already at the latest version
Abstract
A series of conditions can mimic musculoskeletal infections on imaging, complicating their diagnosis and affecting the treatment. Depending on the anatomical location, different conditions can manifest with clinical and imaging findings that mimic infections. Herein we present a wide spectrum of the musculoskeletal disorders of the axial skeleton, long bones, peripheral joints and soft-tissue which may manifest as an infectious process, besides focusing on the potential mimics of osteomyelitis, septic arthritis and infectious spondylodiscitis that are common in clinical practice. We present the typical imaging characteristics of each musculoskeletal infection, followed by mimicking conditions.
Keywords:
musculoskeletal
; infection
; mimicker
; differential
; septic
; osteomyelitis
; septic arthritis
; spondylodisciitis
Introduction
The clinical and imaging manifestation of musculoskeletal infections is variable, depending on the underlying pathogen as well as on host indigenous factors (patient’s immune status, site of the involvement, duration of the infection). Furthermore, a variety of non-infectious diseases such as tumors, trauma, and autoimmune or degenerative conditions may mimic septic disorders, making the diagnosis challenging [1]. Multidisciplinary approach and the recruitment of different diagnostic imaging techniques is often required [2]. Imaging plays a fundamental role in the diagnosis of infection, evaluating the extent of the disease and the associated complications, planning biopsy sites, and monitoring treatment response. A variety of imaging modalities including plain radiography, ultrasound, computed tomography (CT), magnetic resonance (MR) imaging, and functional studies such as nuclear scintigraphy, white cell scan, and positron emission tomography (PET), are available today [3]. The purpose of this paper is to familiarize clinicians with the lesions that may mimic musculoskeletal infections and to explore imaging techniques that are employed in the process of differential diagnosis. Herein we present a wide spectrum of the musculoskeletal disorders of the axial skeleton, long bones, peripheral joints and soft-tissue which may manifest as an infectious process, besides focusing on the potential mimics of osteomyelitis, septic arthritis and infectious spondylodiscitis that are common in clinical practice. We present the typical imaging characteristics of each musculoskeletal infection, followed by mimicking conditions.
1. Spine and Sacroiliac Joints
1. a. Non Infectious Discitis and Spondylodiscitis
The distinction between inflammatory versus infectious involvement of the disc is of major clinical importance. The accurate diagnosis of infectious spondylodiscitis, requires the typical imaging findings and the isolation of the microorganism, either in the blood or in aspirated specimens. MR imaging is considered the imaging method with the highest diagnostic accuracy. Τhe characteristic MR imaging findings in early infectious spondylodiscitis, include hypo- or isointense T1-weighted (w) and hyperintense signal intensity on fat suppressed images, in the subchondral end plates and the intervening disc (Figure 1). The signal alterations usually initiate in the anterior aspect of the vertebral body, affecting one or more spinal segments, they can be unilateral at the early stage and cortical disruption of the endplates is an important and specific finding. The contrast enhancement of the vertebral endplate may show different patterns, such as diffuse, patchy, or linear parallel to the endplates [4] .
Various non-inflammatory disorders may involve the disc and the epiphyseal plates and simulate infections at the early phase. The most commonly encountered are discogenic degenerative changes (MODIC type) and less commonly aseptic discitis, also known as “Andersson’s lesion” in the context of axial spondyloarthropathy (axSpA), synovitis-acne-pustulosis-hyperostosis-osteitis (SAPHO) syndrome, crystal deposition disease and destructive spondyloarthropathy in patients undergoing long-term haemodialysis. Postoperative changes and recent trauma, may rarely mimic infection.
1. a.i. Modic I Changes
It is more than three decades since Modic et. al. described the MR imaging findings of MODIC I-III changes which have been attributed to traumatic injuries to the vertebral endplates [5] , localized inflammation [6] and even low grade bacterial infection [7]. MODIC I endplate changes show low T1-w, and high T2-w/STIR signal within the bone marrow adjacent to the endplates. MODIC I changes are linked to nonspecific low back pain and may increase in size, progress to MODIC II changes or even regress over time [8] (Figure 2 and Figure 3). Enhancement of the bone marrow can occur in both infectious spondylodiscitis and MODIC I changes (Figure 3). Thus, the signal of the disc is the cornerstone contributing to accurate diagnosis. Low T2-w/STIR disc signal is typically seen in MODIC I changes. In the absence of typical degeneration of the disc accompanied with disc height reduction, the discrimination with infection may be demanding and short-interval follow-up MR imaging may be required (Figure 4). An irregular, yet intact endplate contour shows high diagnostic accuracy for the differentiation between MODIC I changes and early infectious spondylodiscitis [9]. Recently, the value of diffusion-w MR Imaging has been addressed, by showing in all patients with infectious spondylodiscitis hyperintensity and in those with MODIC I change hypointensity [10].
1. a.ii. Aseptic Spondylodiscitis
Aseptic spondylodiscitis, also known as “Andersson’s lesion”, is an uncommon manifestation of axSpA, first described by Andersson in 1937 [11]. It represents inflammatory enthesopathy at the interface between the disc and the endplates and thus it involves the disc and adjacent vertebral bone marrow in the absence of infection, degeneration or trauma [12]. The incidence of Andersson's lesions is low on plain radiographs but high on MR imaging [13]. They are observed in 33% of patients with axSpA with spinal involvement on MR imaging, and its presence has a specificity of 59% [14].
Andersson’s lesions are usually located in the thoracolumbar spine [15,16] . Typical findings on plain radiographs include disc space narrowing, erosions of the vertebral end plate, and sclerosis of the adjacent cancellous bone [13]. MR imaging shows high signal intensity in the disc and endplates on STIR and fat-suppressed contrast-enhanced T1-w images [17,18]. The bone marrow edema (BME) has a characteristic hemispheric configuration (Figure 4 and Figure 5). Erosions and surrounding sclerosis are better shown on CT (Figure 5c). One or more levels may be involved.
1. a.iii. SAPHO Syndrome
SAPHO syndrome belongs to a group of skin and bone disorders characterized by synovitis, acne, postulosis, hyperostosis and osteitis, and thoracolumbar spine is the second most frequent location [19]. Lesions within this syndrome, include endplate erosions, mostly anteriorly, subchondral sclerosis and osseous fusion. In the active phase, MR imaging shows bone marrow edema often with soft tissue inflammation (Figure 6). The intervertebral disc as a rule is spared. Other typical locations such as the sternum and CT findings of hyperostosis and osteosclerosis, help to make the correct diagnosis (Figure 6).
1. a.iv. Destructive Spondyloarthropathy
The term “destructive spondyloarthropahty” (DS) was introduced by Kuntz et al, in patients undergoing chronic hemodialysis [20]. It is primarily the result of extensive deposition of beta-2 microglobulin (amyloid-like tissue) within the intervertebral discs and is seen in chronic renal failure patients on long duration of hemodialysis. This disorder is characterized by rapidly progressive imaging findings such as loss of the intervertebral disc space, erosions in the endplates and sclerosis, simulating infectious spondylodiscitis [21]. Plain radiographs and CT show non-specific findings such as erosions and cyst formation adjacent to the end plates in single or multiple levels (Figure 7). Amyloid deposits return a low signal on all pulse sequences. The disc signal on T2-w/STIR images, may occasionally be high, yet not as high as in infectious spondylodiscitis. Vertebral body collapse and disc space narrowing may be also seen. Since chronic renal failure patients undergoing hemodialysis are at increased risk for infection, imaging is important for the differential diagnosis.
1. a.v. Crystal Deposition
Hydroxyapatite Crystal Deposition Disease (HADD) or “Calcium Apatite Deposition Disease” or “Basic Calcium Phosphate Deposition” (BCPD) is a disease of uncertain etiology characterized by periarticular and intra-articular calcium deposits. Acute attack of the longus colli muscle is rare and affects patients who are between 30 and 60 years, without gender predilection [22]. The most frequent presentation is severe neck pain with rapid onset, neck stiffness, dysphagia, and headache. Fever with increased inflammatory markers may mimic clinically infectious spondylitis, retropharyngeal abscess, or meningitis. MR imaging shows prevertebral soft tissue changes and often reactive bone marrow edema, usually in the upper cervical spine (Figure 8). CT is more sensitive for the detection of calcification and thus a correct diagnosis can be better made by combining CT and MR imaging [23].
Calcium pyrophosphate deposition disease (CPPD), previously known as “pseudogout”, is an inflammatory arthropathy characterized by the presence of calcium pyrophosphate crystals in articular or periarticular tissues [24]. Spinal CPPD is uncommon, and may mimic more common spine disorders, including infection [25]. CPPD occurs in practically all vertebral structures and can give rise to acute attacks. Massive CPPD may cause myelopathy, radicular pain, or cauda equina syndrome.
The “crowned dens” syndrome (CDs) is a clinico-radiological entity, representing an inflammatory process resulting from crystal deposition in the ligaments surrounding the dens, with an appearance of a radiopaque "crown" surrounding the top of the dens [26]. The calcifications are mostly due to CPPD and less frequently to HADD. It typically presents with severe and acute febrile neck pain, stiffness of the cervical spine and increased inflammatory markers. Clinically, it may mimic infectious spondylitis but also polymyalgia rheumatica, meningitis, metastatic bone disease, and primary spinal neoplasia. Clinical presentations may be asymptomatic or alarming, with acute febrile neck pain and cervical stiffness. CDs, like acute tendinitis of the longus colli, can be misdiagnosed as meningitis, infectious spondylitis, temporal arteritis, polymyalgia rheumatica, metastatic bone disease, and spinal tumor. CT shows calcifications in the ligamentous structures surrounding the top and sides of the odontoid process in a crownlike or horseshoe-like deposition (Figure 9). MR imaging may show a misleading BME pattern.
A rare disorder in children, is the “intervertebral disc calcification with ossification of the posterior longitudinal ligament”. The etiology is unclear and only 8 cases have been reported in the literature. Increased erythrocyte sedimentation rate (ESR) is the most valuable marker and complete relief of symptoms occurs within a few weeks with NSAIDs, analgesics and collar. Complete resolution of imaging findings occurs within 2 years in the majority of cases. MR imaging shows the low signal intensity of the ossified ligament but may be misleading due to the presence of BME. CT is the method of choice in depicting the disc calcification and the ligamentous ossification (Figure 10) [27].
1. a.vi. Postop Aseptic Discitis
Interpretation of MR images of the lumbar spine must be undertaken with caution within the 6-8 postsurgical weeks. Normal postoperative changes occur within the bones, the soft tissues, and the discs, and vary depending upon the type of surgery and the time since the operation [28].
On unenhanced MR images immediately after surgery, post discectomy changes can mimic the preoperative appearance of disc herniation because of disruption of the annulus fibrosus and inflammatory and granulation tissue in the epidural space (Figure 11). It has been reported that in 24% of asymptomatic patients, a residual or recurrent disc herniation is seen at the operated level within 6 weeks of surgery [28]. BME and enhancement at the vertebral endplates is an expected finding between 6 and 18 months after surgery in 19% of patients [29].
The intradiscal altered signal and enhancement combined with the presence of BME, may mimic infectious spondylodiscitis, which is a complication occurring in up to 3% of patients who underwent non-instrumentation surgery [30].
1. a.vii. Trauma
Acute spinal fractures, particularly in the absence of major trauma, may be a challenging clinical diagnosis. MR imaging shows BME on both sides of the disc space, rarely with abnormal trauma-related signal within the disc (Figure 12). The absence of enhancement in the disc, is a helpful sign favoring the correct diagnosis.
Schmorl’s nodes represent migration of the nucleus pulposus of a disc through an insufficient or fractured endplate. The intraosseous disc protrusion is surrounded on fat suppressed MR imaging with BME which enhances in the acute setting in keeping with the intense clinical symptoms (Figure 13). The sclerotic ring around the migrated material, allows distinction from infectious spondylodiscitis [31].
1. a.viii. Rheumatoid Arthritis
Rheumatoid arthritis (RA) of the cervical spine can mimic an infection because they share presentation with pain, swelling, fever, elevated inflammatory markers and neurological symptoms.
MR imaging is the most sensitive and specific imaging modality for detecting cervical spine involvement and should be performed on all patients with suspected or obvious plain radiographic anomalies or clinical evidence of myelopathy or radiculopathy [33]. MR imaging shows BME and dens erosions, which may mimic infection, as well as soft tissue changes including pannus formation (Figure 15). The latter corresponds to granulation tissue and hyperplastic synovium, which forms as a consequence of persistent synovial inflammation. The pannus subsequently invades the subchondral bone, resulting in the characteristic radiographic findings of erosions.
1. b. Non Infectious Sacroiliitis
Infectious sacroiliitis is a relatively rare joint infection, representing under 2% of septic arthritis. MR imaging is the most accurate imaging modality to detect subchondral BME, erosions, effusion in the synovial part of the joints, interosseous ligament inflammation, capsulitis, and periarticular edema (Figure 16a,b) [34]. The main differential diagnosis is axSpA in which, apart from the subchondral bBME, capsulitis and interosseous ligament and synovitis may occur (Figure 16c) [35]. Rarely, reactive arthritis from a previous respiratory or other infection, may mimic infectious sacroiliitis (Figure 16d).
The involvement of the sacroiliac joints by crystal deposition disease and RA is rare.
2. Long Bones
Long bone osteomyelitis can share similar imaging features with a variety of conditions, spanning from stress injuries, benign and malignant neoplasms and iatrogenic/radiation osseous alterations. Assessment of long bone disease should be accompanied by the evaluation of surrounding soft tissues which can indicate the extent of the disease. A combination of accurate history, laboratory examination and imaging findings can be useful to reach a final diagnosis. This section pertains to the mimickers of long bone osteomyelitis discussing an image-based approach to the diagnosis of these conditions.
2. a. Stress Injuries
History of overuse is the key in diagnosing stress injuries. Nonetheless, when clinical information has not been provided or is obscure, the differentiation between osteomyelitis and long bone stress injuries can be difficult. Stress injuries include a spectrum of conditions starting from stress reactions (no fracture line) to complete fractures. Evaluation should always start with a plain film where, at early stages of stress injuries, lucency of the cortex (“grey cortex” sign [36]) could be misdiagnosed as osteolysis related to infection [37]. As the injury progresses, the presence of a fracture line could indicate a stress fracture [38]. Later at the continuum of a stress injury, a solid periosteal reaction can be identified representing callus formation which can mimic the imaging appearance of chronic osteomyelitis. Plain films have a low sensitivity for the detection of stress injuries, lower than 35% for early stress injuries and up to 70% for the detection of a stress fracture. MR imaging is the modality of choice for the identification of a long bone stress injury. BME in early stress reactions can be depicted with a high signal intensity on fluid sensitive and low signal intensity on T1-w sequences. At the stage of stress reaction, distinguishing between infections and stress injuries can be done based on the history of overuse and other clinical/laboratory characteristics. The presence of surrounding soft tissue edema which can also exist in the context of stress injuries, can further complicate the diagnosis. The identification of a low signal intensity fracture line within the area of edema is the key in recognising a stress fracture (Figure 17a). The location of the lesion could also provide additional clues, since stress injuries happen in heavily mechanically-loaded bones (e.g. metatarsals, tibia, femur) and is typically located at the mid-diaphysis whereas hematogenous osteomyelitis usually has an epicenter at the area of bone vascular supply at the metaphysis [39]. Triple-phase bone scintigraphy is not useful for the differentiation between trauma and osteomyelitis. Nonetheless, radiolabelled white blood cells can be useful and specific for the identification of underlying infection.
2. b. Neoplasms
2. b.i. Ewing’s Sarcoma
Ewing’s sarcoma has an incidence of 2.9/106 individuals in the US, ranking as the second most prevalent malignant bone tumor in children and young adults. Signs, symptoms and laboratory findings include local swelling, pain and increased ESR [40]. Ewing’s sarcoma shares similar imaging characteristics to osteomyelitis rendering the differentiation between the two entities extremely difficult (Figure 17b). A series of clinical, laboratory and imaging factors have been found to be helpful in distinguishing between the two conditions. In terms of demographics and history, African Americans and patients with sickle cell disease are more likely to have osteomyelitis rather than Ewing’s sarcoma [41]. In terms of imaging findings the presence of a soft tissue mass has been shown to be more likely associated with a sarcoma. The same study showed a trend for Ewing’s to have more frequent permeative cortical disruption, even though the finding was not statistically significant potentially due to the low sample size of the study [41].
2. b.ii. Lymphoma
Typical Hodgkin’s lymphoma is located in lymph nodes. Nonetheless, extranodal localization can be identified in one in five cases of the disease, involving organs such as the spleen, the bone marrow and the liver [42]. Imaging features of extranodal lymphoma can mimic osteomyelitis when affecting the bone marrow of long bones [43]. Similarly primary bone lymphoma, which is a non-Hodgkin lymphoma, also shares similar imaging characteristics as long bone infection [44]. The majority of primary bone lymphoma lesions show an osteolytic (70%) or mixed lytic-blastic pattern (28%), located mostly at the meta-diaphysis or mid-shaft of the femur and tibia. An accompanying soft tissue mass can be identified by almost half of the patients which is nicely seen on MR imaging, can be recognised in 80% of CT scans and are only visible on approximately 40% of plain films [45]. It should be pointed out that in the presence of extensive marrow lesions, associated soft tissue masses are usually accompanied by cortical disruption in infectious conditions, but the cortex can be spared in cases of round cell tumors such as lymphomas and Ewing’s sarcomas [45]. In fact at early stages plain films can appear almost normal, increasing the difficulty of early diagnosis. Therefore, even with negative radiographs, in the presence of symptoms, MR imaging should be performed [46]. At a base of lytic lesions, sclerotic patterns can appear post-radiotherapy or post-chemotherapy [46]. Finally in 1/10 cases of bone lymphoma, a sequestrum can be found which mimics chronic osteomyelitis and other tumors such as fibrosarcomas and eosinophilic granulomas [47].
2. c. Radiation Osteiitis - Iatrogenic
Tissue damage following radiation therapy can lead to bone lysis followed by disorganized osteoblastic activity leading to a patchy bone appearance. On MR imaging, bone marrow edema is present with a variable degree of surrounding soft tissue edema [46]. Such radiation induced changes are characteristic of osteonecrosis of the jaw [48]. The presence of an abscess and expansion of the bone are more indicative of infection rather than radiation induced changes [48].
3. Peripheral Joints
Septic arthritis is a medical emergency secondary to an infectious agent, usually bacterial, but also due to fungal, mycobacterial, viral or other pathogens. A delayed diagnosis and treatment may lead to rapidly progressive and irreversible joint damage, increased morbidity and mortality. Along with the heterogeneity and limited sensitivity of clinical findings, imaging appearances of septic arthritis are also nonspecific, overlapping substantially with various noninfectious entities [39,49]; besides, several conditions may be superimposed on a septic joint, producing atypical clinical and imaging appearances. Especially MR imaging, despite its 100% sensitivity to show infectious changes even at 24 hours after symptoms onset, lacks specificity sharing similar features with noninfectious etiologies [50]. Importantly, this may lead to diagnostic challenges during the workup of a clinically suspected septic joint or during interpretation of imaging studies performed for other indications. Knowledge of the disorders which could resemble septic arthritis is essential for accurate diagnosis. The imaging characteristics of infectious arthritis and its potential mimics are described below with emphasis on specific imaging features aiding in distinguishing an infective from a noninfectious etiology.
3. a. Imaging Features of Septic Arthritis
Plain radiographs should be used for the initial evaluation of septic arthritis as they provide an overview of the anatomic area of interest and can aid in differential diagnosis by excluding radiographically evident conditions which may clinically resemble infection [51]. Plain radiographs, although insensitive to the early changes, may reveal widened joint spaces due to joint effusion, soft-tissue bulging and periarticular osteopenia. Advanced disease presents with nonspecific erosions and uniform joint space narrowing. Radiographs cannot reliably identify joint effusions in the hips, shoulders, wrists or small joints, where further evaluation with cross-sectional imaging is justified [52]. The presence of a joint effusion should prompt an arthrocentesis, preferably under image guidance. Ultrasound is highly sensitive for identifying joint effusion while it can assess fluid collections in the periarticular soft-tissues and guide aspiration [53]. A septic from a sterile effusion cannot be reliably differentiated based on the echogenicity of the effusion and color Doppler characteristics on ultrasound [54]. MR imaging is not indicated as a first-line modality for the assessment of infectious arthritis due to its limited specificity [51,52]. However, the method is indicated in the context of ineffective aspiration of joint fluid or in atypical cases with contradicting imaging and clinical features. MR imaging findings suggestive of infection include synovial enhancement, perisynovial edema, joint effusion, articular cartilage destruction, bone marrow edema-like changes and erosions of the bare areas as well as soft-tissue involvement with potential abscess formation (Figure 18a)[55]. Tuberculous arthritis is a specific form of septic arthritis due to Mycobacterium tuberculosis. MR imaging is an important diagnostic tool showing effusion and synovial thickening which may assume hypointensity on T2-w images due to presence of granuloma. Similar to pyogenic arthritis, bone erosions are present, however, typically without associated bone marrow signal abnormalities in early disease. Periarticular abscess formation is another important feature, characterized by thin, smooth wall and sharply defined outer borders, contrary to the thick, irregular and nodular wall surface seen in pyogenic abscesses [56].
3. b. Imaging Features of Septic Arthritis Mimickers
3. b.i. Inflammatory Arthritis
Among the whole spectrum of inflammatory arthritis, the main differential diagnosis for a septic joint is RA and seronegative spondyloarthropathy. From a clinical viewpoint, the onset of symptoms of inflammatory arthritis is usually subacute in contrast to the acute manifestation of septic arthritis. Notably, enthesitis, the hallmark of seronegative arthropathies, is often underdiagnosed clinically, due to low sensitivity and specificity of clinical tests. Different to the monoarticular pattern of septic arthritis, RA typically shows a polyarticular distribution involving the small joints of the upper and lower extremities, whereas seronegative spondyloarthropathy has a typical axial predominance besides showing a predilection mainly for lower extremity peripheral joints. Elevation of inflammatory markers including ESR and C-reactive protein are frequently seen in both inflammatory and infectious entities. Specific serological workup should be pursued when autoimmune inflammatory arthritis is in the differential.
Radiographs are able to detect structural joint damage in established disease, but are insensitive for depicting early soft-tissue or bone changes [57]. MR imaging and ultrasonography are the methods of choice for evaluating RA. Early findings include synovitis showing a thick enhancement pattern following contrast administration, joint effusion and marginal, bare-area erosions (Figure 18b) [58]. Hypertrophic synovial villi may detach into the joint space forming fibrinous nodules termed as “rice bodies” [58]. BME is commonly seen in subchondral locations or surrounding erosions, however, less extended compared to infectious arthritis [59]. Ultrasound typically shows synovitis as thickened and hypoechoic intraarticular tissue, usually together with variable amounts of anechoic joint effusion. Bone erosions are seen as intraarticular bone surface discontinuities in two perpendicular planes. High Doppler signal suggests the presence of hypervascularized pannus tissue in an active erosion [60]. Combination of bone erosions with extensive marrow changes, presence of perisynovial edema and soft-tissue abscesses favor the diagnosis of joint infection over RA [58].
Enthesitis, defined as inflammation at tendinous, ligamentous and capsular attachments, together with bony proliferation are the hallmarks of seronegative arthropathies serving as discriminating features between seronegative and other inflammatory arthritis [61]. Both US and MR imaging are highly specific in detecting acute and chronic enthesis-centered abnormalities [61]. Ultrasound features include decreased echogenicity, thickening, calcification and increased Doppler vascularity of the affected structure. Erosions or enthesophytes are indicated by osseous surface abnormalities, while increased Doppler synovial vascularity suggests synovitis. BME at an entheses, but not only confined to it, and perientheseal soft-tissue changes represent the hallmark of active enthesitis on MR imaging. Chronic enthesitis is characterized by erosions or enthesophytes best seen on T1-w sequences. Additionally, screening of the axial skeleton for typical disease manifestations in equivocal cases may be of value.
3. b.ii. Neuropathic Arthropathy
Neuropathic (or Charcot) arthropathy refers to a progressive, destructive joint disorder occurring in patients with abnormal pain sensation and proprioception, most commonly due to underlying diabetes mellitus but also rarely due to other sensorimotor and autonomic neuropathies of various etiologies. The foot joints are by far the most commonly affected, although the knee, wrist and spine may rarely be involved. Joint swelling, warmth and erythema, regularly preceding the radiographic changes, may resemble infectious or inflammatory arthritis in early disease stages [62]. More importantly, infection is often superimposed on neuropathic disease, posing challenges on the distinction between the two abnormalities [62]. Radiographs have a fundamental role in diagnosis and disease monitoring, while MR imaging is essential for diagnosing early stages, detecting complications, including superimposed infection, and assessing disease extent [63]. Based on radiographic and clinical features, neuropathic arthropathy is divided into 3 stages: (i) development, characterized by osteopenia, periarticular debris/fragmentation and joint subluxation/dislocation; (ii) coalescence, showing absorption of periarticular debris, early sclerosis and fusion of the large bony fragments and (iii) reconstruction, characterized by new bone formation and joint arthrosis/ankylosis [64]. MR imaging features of neuropathic joint, including diffuse soft-tissue edema, joint effusion, periarticular fluid collections and bone marrow abnormalities gradually proceeding to joint derangement, may be misinterpreted as an infectious process, which is further complicated by the inflammatory clinical profile typical for early disease stages. Useful discriminating features pointing towards infectious over neuropathic arthritis include diffuse or thick peripheral instead of thin rim synovial enhancement, less prominent osseous debris, relative absence of subchondral cystic lesions being almost exclusively seen in noninfected joints, loss of subcutaneous fat signal intensity adjacent to the joint on T1-w sequences, although soft-tissue edema is seen with similar frequencies around both infected and neuropathic joints and presence of a sinus tract in the periarticular soft-tissue. Additionally, especially for the foot, diffuse BME, involving the entire bone, is significantly more common in the setting of osteomyelitis instead of neuropathic-related changes [64].
3. b.iii Crystal-Induced Arthropathies
Crystal-Induced arthropathies, especially in the context of CPPD and HADD are common conditions characterized by synovial and periarticular crystal deposition which may lead to variable clinical manifestations, ranging from asymptomatic to acute arthritis and chronic arthritis or destructive arthropathy [65]. In the acute phase of CPPD, symptoms of joint edema, erythema, tenderness and low-grade fever in up to 50% of patients may simulate inflammatory or infectious processes [66]. The knee joint is most commonly affected, followed by the shoulder, wrist, metacarpophalangeal and hip joints. A subset of patients with CPPD may also experience waxing and waning episodes of non-synchronous inflammatory arthritis affecting multiple non-weight bearing joints such as wrists and metacarpophalangeal joints [67]. In the diagnostic assessment of CPPD, conventional radiography and ultrasound, or CT if axial involvement is suspected, are recommended imaging modalities [68]. Plain radiographs typically show chondrocalcinosis, as the hallmark of the disease, appearing as punctate and linear densities in the hyaline cartilage/fibrocartilage. The triangular cartilage of the wrist, the fibrocartilage of the pubic symphysis and the menisci are the most common locations. Synovium and tendinous calcifications may coexist depicted as thin linear densities along the synovial membrane or tendons’ length. Other radiographic findings, which are in value especially in the absence of chondrocalcinosis, include features of osteoarthritis primarily demonstrating joint space narrowing, geodes and relative absence of osteophytes. Ultrasound is able to detect chondrocalcinosis, mainly following 3 distinct patterns: (i) thin hyperechoic bands parallelling the articular cartilage surface; (ii) punctate hyperechoic bands in regions of fibrocartilage and (iii) homogeneous, hyperechoic intraarticular nodular or oval deposits likely representing free crystal aggregates [69]. CT shows chondrocalcinosis to better advantage and is of value in equivocal cases or in axial involvement [70]. MR imaging is of limited value, although, particularly with the use of gradient-echo sequences for the evaluation of crystal deposition they may aid diagnostically (Figure 19) [70].
HADD is associated with two important musculoskeletal syndromes. Deposition of crystals along periarticular soft-tissues causing calcific periarthritis, whereas intra-articular deposition contributes to a highly destructive shoulder-predominant arthritis known as “Milwaukee” syndrome. Periarticular deposition can be easily diagnosed with radiographs and ultrasound and does not cause diagnostic dilemmas [68]. Imaging features of “Milwaukee” syndrome overlap with advanced osteoarthritis, neuropathic or septic arthropathy. Contrary to infectious arthritis, clinical symptoms are usually mild compared to the radiological progression usually including a large glenohumeral joint effusion, crepitation and joint instability. Characteristic radiographic features include marked glenohumeral joint degeneration with intra-articular loose bodies, soft tissue calcifications and extensive rotator cuff damage manifesting as a "high-riding" humeral head. MR imaging and ultrasound can reveal large joint effusion with internal debris and synovial proliferation, joint narrowing with subchondral bone and cartilage destruction together with advanced rotator cuff tear (Figure 20).
3. b.iv. Rapidly Destructive Osteoarthritis of the Hip
Being almost specific for the hip joint, rapidly destructive osteoarthritis of the hip (RDOH) is characterized by clinical history of hip pain lasting 1-6 months and radiographic features of rapidly progressive bone destruction involving the femoral head and acetabulum within months of the onset of symptoms, in the absence of clinical or laboratory evidence of infectious, neurologic, metabolic or inflammatory background. The disease was firstly described as chondrolysis of >2 mm in 1 year or 50% joint-space narrowing in 1 year [71]. Typically, radiographs show joint space narrowing usually located superolaterally, minimal subchondral sclerosis and relative absence of osteophytes [72]. Key early MR imaging features of RDOH include significant loss of articular cartilage as compared to the contralateral side, rarely widening, synovitis/joint effusion, bone marrow edema in the femoral head/neck and/or acetabulum being most prominent at the weight-bearing areas, cyst-like subchondral defects and subchondral insufficiency fractures of the femoral head (Figure 21). The latter appears as a curvilinear low signal intensity band on all sequences which parallels the overlying subchondral bone. Focal signal abnormalities in the adjacent soft tissues are present in 1/3 of cases potentially causing diagnostic confusion with septic arthritis [73,74]. In the late stage, radiographs are diagnostic, showing femoral head flattening and superior-lateral joint space narrowing often mimicking neuropathic arthropathy, without necessitating further imaging evaluation. Useful discriminatory features from septic arthritis are subchondral geodes, femoral head deformity usually being disproportionately advanced compared to the acetabular derangement and relatively uncommon presence of soft-tissue involvement without abscess formation.
3. b.v. Neoplasms
Osteoid osteoma represents a specific neoplasm which could be confused with infection. Although predominantly affecting the diaphyses of long bones, osteoid osteoma can also assume an intraarticular location, most commonly around the hip joint. Intra-articular prostaglandins’ secretion promotes lymphoproliferative synovitis, leading to atypical clinical symptoms of pain, stiffness and high local temperature potentially mimicking inflammatory or infectious arthritis [75]. Additionally, the lack of the typical nocturnal worsening and poor improvement with NSAIDs further complicate the clinical assessment of intra-articular lesions. Plain radiographs have low sensitivity in diagnosing intra-articular osteoid osteomas because of the minimal periosteal new bone formation in these forms, in contrast to the florid periosteal reaction typically seen in their extra-articular counterparts [76]. This is due to the limited periosteal apposition within the joint related to the absence of the internal layer of the periosteum. Intra-articular lesions have distinct features at MR imaging including synovitis, joint effusion and surrounding BME, which may be misinterpreted as an infectious or inflammatory process. The clue to correct diagnosis is the detection of a nidus appearing usually as a T1 hypointense and T2 hyperintense focus surrounded by BME, however it may be invisible on MR imaging [77]. CT remains the standard for identifying the nidus, as a focally well-defined lucent area potentially containing a central sclerotic dot. CT may be though inadequate in visualizing the nidus in some cases, requiring further evaluation with bone scintigraphy or fluorine 18–labeled sodium fluoride PET/CT for definitive diagnosis [77]. Finally, especially applying to long bones, Brodie’s abscess is the main differential diagnosis for osteoid osteoma, presenting with both clinical and radiological similarities. Radiographically, Brodie’s abscess appears as a radiolucent, well-demarcated eccentric lesion with marginal sclerosis and variable periosteal thickening, while a sinus tract can be visualized especially on CT (Figure 22) [78]. A useful discriminating feature on MR imaging, being specific for Brodie’s abscess, is the “penumbra sign” referring to a discrete zone of transition of relative hyperintensity between the intermediate to low signal abscess cavity and the adjacent bone marrow on unenhanced T1-w images [78].
4. Muscles and Soft Tissues
Soft tissue and muscle infections encompass a wide range of different pathological situations which can resemble many other conditions of different origin, such as inflammatory, neoplastic and traumatic. Thereafter awareness of helpful imaging and clinical considerations may lead to promptly and correct differential diagnosis in such conflict, which is of crucial role due to different morbidity and mortality rates and special therapeutic management as well [79]. Herein, a useful radiological approach in establishing an image-based diagnosis of soft tissue infection mimickers in combination of appropriate history and laboratory examination is provided.
4. a. Non - Infectious Subcutaneous Edema
A great mimicker of cellulitis is subcutaneous edema due to non-infectious causes such as congestive heart failure, diabetic vascular insufficiency, lymphatic obstruction, and acute and subacute venous thrombosis. In addition to the absence of an infective agent, one supporting imaging feature of this type of edema is the more diffuse insultation, without contrast enhancement after intravenous administration due to non hyperemic soft tissue in such conditions [80].
4. b. Non - Infectious Fsciitis
This group of diseases include separate pathological entities like paraneoplastic fasciitis, eosinophilic fasciitis, and nodular and proliferative fasciitis, which require distinct clinicopathologic correlation for reaching correct diagnosis.
4. b.i. Eosinophilic Fasciitis
Peripheral eosinophilia, hypergammaglobunimia, increased ESR, and scleroderma-like skin changes favor a diagnosis of eosinophilic fasciitis. However useful MR imaging findings include fascial thickening at T1-w imaging with corresponding hyperintense signal with fluid-sensitive sequences and a variable degree of enhancement on postcontrast images, without relatively muscle belly involvement (Figure 23a) [81].
4. b.ii. Paraneoplastic Fasciitis
In coexistence of a known malignancy, paraneoplastic fasciitis may occur as a rare manifestation of acute febrile neutrophilic dermatosis (“Sweet” syndrome). Non specific findings at MR imaging include dermal thickening, soft-tissue edema in multiple sites, fascial thickening and concomitant muscle edema in keeping with certain clinical manifestation (painful red or purple-red papules or nodules in the skin, elevated ESR, and neutrophil-predominant peripheral leukocytosis) [82].
4. b.iii. Nodular Fasciitis
Infiltrative fasciitis, pseudosarcomatous fasciitis and pseudosarcomatous fibromatosis are other names of this unknown cause disease, which typically affect patients younger than 50 years of age and is manifested with rapidly growing nodule or nodules, usually less than 2 cm, in subcutaneous, intrafascial, intramuscular location [83]. Many different T1-w and T2-w imaging characteristics can be seen at MR imaging due to different content of these nodules (fibrous, cellular, or myxoid), but most of the time they show homogeneous enhancement (Figure 23b) [84].
4. b. Inflammatory Myopathies
Autoimmune myositis is a rare group of auto - immune- associated muscle disorders, also known as idiopathic inflammatory myopathies (IIM), which recenlty are classified into four major subgroups: dermatomyositis, inclusion body myositis, immune-mediated necrotizing myopathy and antisynthetase syndrome [85,86]. Their clinical manifestation has a similar pattern involving the musculature of thighs and pelvis or other proximal symmetrical musculature, not limited to specific compartmental or neural anatomy.
All of them share common MR imaging findings consisting of high signal intensity in fluid-sensitive sequences of muscles or perimuscular soft tissue, with varying degrees of postcontrast enhancement (Figure 23c). In later stages of the disease muscle fatty atrophy is established, best shown with T1-w sequences [87].
4. c. Muscle Denervation
Muscle denervation can be observed in almost any voluntary muscle in the body and results from partial or complete loss of innervation due to several causes, like outer nerve compression (i.e. ganglion cyst, vascular aneurysm), trauma, neuropathies, neoplasia, vasculitis, and thrombosis or compression of the draining veins. Clinical examination in combination with MR imaging and electromyography are the hallmarks of correct and verified diagnosis [88]. MR imaging changes depend on the phase of the denervation. In the acute phase MR imaging can be normal, but may show intramuscular edema within 24 hours. After 2-4 weeks of the insult (subacute phase), affected muscle shows uniform edema and paradoxical enlargement due to either pseudohypertrophy or true hypertrophy of the muscles, shown with diffuse T2 hyperintense signal and normal T1 intensity signal of the muscles, while subcutaneous tissue looks normal (Figure 23d). At the subacute phase mixed muscle edema and atrophy occur, followed by muscle atrophy in the chronic form over months [89].
4. d. Traumatic Soft Tissue Injury
Under the term of muscle injury many different conditions can be included such as laceration, contusion, strain, muscle hemorrhage/hematoma, compartment syndrome, myositis ossificans, or exercise related, which may resemble muscular infection. Clinical history plays a crucial role in differentiating infection from trauma-related muscular injury at MR imaging.
4. d.i. Muscle Contusion
A muscle contusion is characterized by damage and/or rupture of muscle fibers due to direct impact and may cause interstitial hemorrhage and edema at the site of injury and in the underlying muscle. The MR signal intensity of the hematoma depends on the age of the blood products (Figure 24a). Subacute blood shows high T1 signal intensity due to methemoglobin magnetic properties and chronic blood breakdown and hemosiderin deposition shows low-signal-intensity rim with all pulse sequences [90]. In the absence of trauma possible anticoagulation therapy or underlying neoplasm should be inspected.
4. d.ii. Muscle Strain
A muscle strain is usually confined to the myotendinous or myofascial units and frequently occurs in muscles that cross two joints, such as the hamstring, gastrocnemius and biceps brachii muscles. The MRI revealed edema is centered at the myotendinous junction and in the early stage is shown with T2 high signal with a feathery appearance (usually centered on the myotendinous junction) representing edema (Figure 24b). In latter stages additional features include partial or complete fiber disruption characterized by high T2 signal and local distortion [90].
4. d.iii. Delayed Onset Muscle Soreness
Delayed onset muscle soreness refers to a specific overuse muscle injury where the symptoms are delayed by hours to days, which is in contrast to a muscle contusion or strain, where pain occurs immediately. In this reversible microstructural muscle injury the affected muscles are high signal on fluid sensitive MR sequences and this may persist for months following resolution of symptoms (Figure 24c).
4. d.iv. Rhabdomyolysis
Another cause of diffuse muscle edema is rhabdomyolysis, which can be classified into traumatic (eg, crush injury, excessive exercise) and nontraumatic (eg, extreme body temperature change, arterial occlusion, metabolic disturbances, toxins, inflammation, infection) causes. Rhabdomyolysis describes the rapid breakdown of muscle fibers with release of intracellular contents into the systemic circulation. MR images show edema in the involved muscles, depicted as homogeneously or heterogeneously hyperintensity on T2-w imaging, without involving the adjacent fasciae. Depending on the severity of the disease, contrast enhancement varies between homogeneous in viable muscle and rim-enhanced in myonecrosis [91].
4. d.v. Myositis Ossificans
Myositis ossificans is extraosseous bone formation usually as a result of trauma; however, it can occur spontaneously or in other conditions such as paralysis, burns, and intramuscular hematomas. MR imaging appearances vary with the age of the lesion. At an early stage the involved muscle demonstrates heterogeneous edema, and over a period of 6–8 weeks, a characteristic peripheral calcification develops with corresponding low signal intensity with all MR sequences [90].
4. e. Neoplasm and Post Therapy Soft-Tissue Changes
4. e.i. Neoplasms
A challenging differential diagnosis of muscular infection is soft tissue and muscle edema caused by adjacent neoplasms, which is shown at MR imaging with high signal intensity on fluid sensitive sequences, due to tumor invasion, edema, or both. Although it is necessary to determine between them for surgical planning and radiation therapy, most of the time there are no reliable MR imaging findings to distinguish between edema and tumor invasion. A favorable sign of tumor invasion is the indistinct border between the muscle and the tumor [92].
4. e.ii. Post Therapy Soft-Tissue Changes
Post radiation changes of soft-tissues are mostly faced after adjuvant or neoadjuvant therapy of high grade sarcomas. Typical MR findings include diffuse muscle edema with sharp and straight margins delineating the radiation field, subcutaneous lattice-like edema with overlying skin thickening and moderate muscle enhancement after contrast media administration (Figure 24d) [90,93].
Conclusions
Musculoskeletal infections are challenging to diagnose accurately due to their ability to mimic a wide range of other conditions on imaging. These infections can present with imaging features that overlap with various non-infectious pathologies, such as tumors, inflammatory conditions, and trauma-related changes. As a result, radiologists must maintain a high index of suspicion and consider a broad differential diagnosis when interpreting imaging findings in cases of suspected musculoskeletal infection.
Advanced imaging techniques, such as MRI, play a crucial role in detecting and characterizing these infections, offering detailed insights into soft tissue involvement, bone marrow changes, and the presence of abscesses or sinus tracts. However, the interpretation of these images requires a thorough understanding of the disease’s clinical context and an awareness of its potential to mimic other conditions.
Ultimately, the accurate diagnosis of musculoskeletal infections relies on a combination of imaging findings, clinical presentation, and, when necessary, laboratory and microbiological data. Early and precise identification of these infections is vital to initiating appropriate treatment, preventing complications, and improving patient outcomes. Radiologists must therefore be vigilant and adopt a systematic approach to differentiating musculoskeletal infections from other mimicking conditions on imaging.
Figures
References
- Shih YC, Thacker MM. Infection Mimics: Differential Diagnoses of Musculoskeletal Infections. In Pediatric Musculoskeletal Infections: Principles & Practice; Belthur, M.V., Ranade, A.S., Herman, M.J., Eds.; Springer International Publishing: Cham, Switzerland, 2022. [Google Scholar]
- Kang HJ, Choi HY, Park JS, Park SY, Jin W, Ryu KN Lesions that mimic musculoskeletal infection: A pictorial essay. Korean J Radiol 2018, 78, 200. [CrossRef]
- Lim W, Barras CD, Zadow S. Radiologic Mimics of Osteomyelitis and Septic Arthritis: A Pictorial Essay. Radiol Res Pract 2021, 2021, 9912257. [Google Scholar]
- Crombé A, Fadli D, Clinca R, Reverchon G, Cevolani L, Girolami M, Hauger O, Matcuk GR, Spinnato P. Imaging of Spondylodiscitis: A Comprehensive Updated Review-Multimodality Imaging Findings, Differential Diagnosis, and Specific Microorganisms Detection. Microorganisms 2024. [CrossRef]
- Modic MT, Steinberg PM, Ross JS, Masaryk TJ, Carter JR Degenerative disk disease: assessment of changes in vertebral body marrow with MR imaging. Radiology 1988, 166, 193–199. [CrossRef]
- Burke JG, Watson RWG, McCormack D, Dowling FE, Walsh MG, Fitzpatrick JM Intervertebral discs which cause low back pain secrete high levels of proinflammatory mediators. J Bone Joint Surg Br 2002, 84, 196–201. [CrossRef]
- Albert HB, Lambert P, Rollason J, et al Does nuclear tissue infected with bacteria following disc herniations lead to Modic changes in the adjacent vertebrae? Eur Spine J 2013, 22, 690–696. [CrossRef]
- Teichtahl AJ, Urquhart DM, Wang Y et al. Modic changes in the lumbar spine and their association with body composition, fat distribution and intervertebral disc height – a 3.0 T-MRI study. BMC Musculoskelet Disord 2016, 17, 92–98. [Google Scholar] [CrossRef] [PubMed]
- Schwarz-Nemec U, Friedrich KM, Stihsen C, Schwarz FK, Trattnig S, Weber M, Grohs JG, Nemec SF. Vertebral Bone Marrow and Endplate Assessment on MR Imaging for the Differentiation of Modic Type 1 Endplate Changes and Infectious Spondylodiscitis. J Clin Med Res. 2020. [CrossRef]
- Oztekin O, Calli C, Kitis O, Adibelli ZH, Eren CS, Apaydin M, Zileli M, Yurtseven T Reliability of diffusion weighted MR imaging in differentiating degenerative and infectious end plate changes. Radiol Oncol 2010, 44, 97–102.
- Andersson O. Rontgenbilden vid spondylarthritis ankylopoetica. 1937.
- Hunter T The spinal complications of ankylosing spondylitis. Semin Arthritis Rheum 1989, 19, 172–182. [CrossRef] [PubMed]
- Kim S-K, Shin K, Song Y, Lee S, Kim T-H Andersson lesions of whole spine magnetic resonance imaging compared with plain radiography in ankylosing spondylitis. Rheumatol Int 2016, 36, 1663–1670. [CrossRef]
- Bennett AN, Rehman A, Hensor EMA, Marzo-Ortega H, Emery P, McGonagle D Evaluation of the diagnostic utility of spinal magnetic resonance imaging in axial spondylarthritis. Arthritis Rheum 2009, 60, 1331–1341. [CrossRef] [PubMed]
- Kabasakal Y, Garrett SL, Calin A The epidemiology of spondylodiscitis in ankylosing spondylitis--a controlled study. Br J Rheumatol 1996, 35, 660–663. [CrossRef] [PubMed]
- Madsen KB, Jurik AG MRI grading method for active and chronic spinal changes in spondyloarthritis. Clin Radiol 2010, 65, 6–14. [CrossRef]
- Park Y-S, Kim J-H, Ryu J-A, Kim T-H The Andersson lesion in ankylosing spondylitis: distinguishing between the inflammatory and traumatic subtypes. J Bone Joint Surg Br 2011, 93, 961–966.
- Assessment of SpondyloArthritis International Society. The Assessment of SpondyloArthritis International Society (ASAS) Handbook: A Guide to Assess Spondyloarthritis. BMJ Publ. Group 2009.
- Benhamou CL, Chamot AM, Kahn MF Synovitis-acne-pustulosis hyperostosis-osteomyelitis syndrome (SAPHO). A new syndrome among the spondyloarthropathies? Clin Exp Rheumatol 1988, 6, 109–112. [Google Scholar]
- Kuntz D, Naveau B, Bardin T, Drueke T, Treves R, Dryll A Destructive spondylarthropathy in hemodialyzed patients. A new syndrome. Arthritis Rheum 1984, 27, 369–375. [Google Scholar]
- Theodorou DJ, Theodorou SJ, Resnick D Imaging in dialysis spondyloarthropathy. Semin Dial 2002, 15, 290–296.
- Ring D, Vaccaro AR, Scuderi G, Pathria MN, Garfin SR Acute calcific retropharyngeal tendinitis. Clinical presentation and pathological characterization. J Bone Joint Surg Am 1994, 76, 1636–1642. [Google Scholar] [CrossRef] [PubMed]
- Offiah CE, Hall E Acute calcific tendinitis of the longus colli muscle: spectrum of CT appearances and anatomical correlation. Br J Radiol 2009, 82, e117–e121. [CrossRef]
- Rosenthal AK, Ryan LM Calcium Pyrophosphate Deposition Disease. N Engl J Med 2016, 374, 2575–2584. [CrossRef]
- Bartlett CS 3rd, Casden AM, Abdelwahab IF Calcium pyrophosphate deposition disease mimicking infection in the lumbar spine. Orthopedics 1999, 22, 79–81. [CrossRef]
- Bouvet JP, le Parc JM, Michalski B, Benlahrache C, Auquier L Acute neck pain due to calcifications surrounding the odontoid process: the crowned dens syndrome. Arthritis Rheum 1985, 28, 1417–1420. [CrossRef] [PubMed]
- Ye C, Shi M, Xie D, Wu H, Chen Q, Yang L A rare case of intervertebral disc calcification combined with ossification of the posterior longitudinal ligament in a child: a case report and literature review. BMC Musculoskelet Disord 2024, 25, 118.
- Van Goethem JW, Van de Kelft E, Biltjes IG, van Hasselt BA, van den Hauwe L, Parizel PM, De Schepper AM. MRI after successful lumbar discectomy. Neuroradiology 1996, 38 (Suppl. 1), S90–S96. [Google Scholar] [CrossRef]
- Shafaie FF, Bundschuh C, Jinkins JR. The posttherapeutic lumbosacral spine. Posttherapeutic neurodiagnostic imaging Lippincott-Raven, Philadelphia. 1997.
- Pawar AY, Biswas SK Postoperative spine infections. Asian Spine J 2016, 10, 176–183. [CrossRef]
- Kumar Y, Gupta N, Chhabra A, Fukuda T, Soni N, Hayashi D Magnetic resonance imaging of bacterial and tuberculous spondylodiscitis with associated complications and non-infectious spinal pathology mimicking infections: a pictorial review. BMC Musculoskelet Disord 2017, 18, 244.
- Kumaran SP, Thippeswamy PB, Reddy BN, Neelakantan S, Viswamitra S An Institutional review of tuberculosis spine mimics on MR imaging: Cases of Mistaken Identity. Neurol India 2019, 67, 1408–1418. [CrossRef]
- Joaquim AF, Appenzeller S Cervical spine involvement in rheumatoid arthritis — A systematic review. Autoimmun Rev 2014, 13, 1195–1202. [CrossRef]
- Interligator S, Le Bozec A, Cluzel G, et al. Infectious sacroiliitis: MRI- and CT-based assessment of disease extent, complications, and anatomic correlation. Skeletal Radiol. 2023. [CrossRef]
- Kang Y, Hong SH, Kim JY, Yoo HJ, Choi J-Y, Yi M, Kang HS Unilateral sacroiliitis: Differential diagnosis between infectious sacroiliitis and spondyloarthritis based on MRI findings. AJR Am J Roentgenol 2015, 205, 1048–1055. [CrossRef]
- Mulligan ME The “gray cortex”: an early sign of stress fracture. Skeletal Radiol 1995, 24, 201–203.
- Berger FH, de Jonge MC, Maas M Stress fractures in the lower extremity. The importance of increasing awareness amongst radiologists. Eur J Radiol 2007, 62, 16–26. [Google Scholar]
- Wright AA, Hegedus EJ, Lenchik L, Kuhn KJ, Santiago L, Smoliga JM Diagnostic Accuracy of Various Imaging Modalities for Suspected Lower Extremity Stress Fractures: A Systematic Review With Evidence-Based Recommendations for Clinical Practice. Am J Sports Med 2016, 44, 255–263. [CrossRef] [PubMed]
- Lee YJ, Sadigh S, Mankad K, Kapse N, Rajeswaran G The imaging of osteomyelitis. Quant Imaging Med Surg 2016, 6, 184–198.
- Henninger B, Glodny B, Rudisch A, Trieb T, Loizides A, Putzer D, Judmaier W, Schocke MF Ewing sarcoma versus osteomyelitis: differential diagnosis with magnetic resonance imaging. Skeletal Radiol 2013, 42, 1097–1104. [CrossRef]
- McCarville MB, Chen JY, Coleman JL, Li Y, Li X, Adderson EE, Neel MD, Gold RE, Kaufman RA Distinguishing Osteomyelitis From Ewing Sarcoma on Radiography and MRI. AJR Am J Roentgenol 2015, 205, 640–650.
- Guermazi A, Brice P, de Kerviler E E, Fermé C, Hennequin C, Meignin V, Frija J Extranodal Hodgkin disease: spectrum of disease. Radiographics 2001, 21, 161–179.
- Majeed A, Chan O, Okolo O, Shponka V, Georgescu A, Persky D Hodgkin Lymphoma Mimicking Osteomyelitis. Case Rep Oncol 2017, 10, 542–547.
- Mika J, Schleicher I, Gerlach U, Adler C-P, Uhl M, Knoeller SM Primary bone lymphomas thought to be osteomyelitis urgently demand a rapid diagnosis in bone pathology. Anticancer Res 2012, 32, 4905–4912.
- Mulligan ME, McRae GA, Murphey MD Imaging features of primary lymphoma of bone. AJR Am J Roentgenol 1999, 173, 1691–1697. [CrossRef]
- Krishnan A, Shirkhoda A, Tehranzadeh J, Armin AR, Irwin R, Les K Primary bone lymphoma: radiographic-MR imaging correlation. Radiographics 2003, 23, 1371–1383. [CrossRef]
- Mulligan ME, Kransdorf MJ Sequestra in primary lymphoma of bone: prevalence and radiologic features. AJR Am J Roentgenol 1993, 160, 1245–1248. [CrossRef] [PubMed]
- Phal PM, Myall RWT, Assael LA, Weissman JL Imaging findings of bisphosphonate-associated osteonecrosis of the jaws. AJNR Am J Neuroradiol 2007, 28, 1139–1145. [CrossRef]
- Ross JJ Septic arthritis of native joints. Infect Dis Clin North Am 2017, 31, 203–218. [CrossRef] [PubMed]
- Graif M, Schweitzer ME, Deely D, Matteucci T The septic versus nonseptic inflamed joint: MRI characteristics. Skeletal Radiol 1999, 28, 616–620. [CrossRef]
- Pierce JL, Perry MT, Wessell DE, et al ACR Appropriateness Criteria® Suspected Osteomyelitis, Septic Arthritis, or Soft Tissue Infection (Excluding Spine and Diabetic Foot): 2022 Update. J Am Coll Radiol 2022, 19, S473–S487. [CrossRef]
- Simpfendorfer CS Radiologic approach to musculoskeletal infections. Infect Dis Clin North Am 2017, 31, 299–324. [CrossRef]
- Hansford BG, Stacy GS Musculoskeletal aspiration procedures. Semin Intervent Radiol 2012, 29, 270–285. [CrossRef] [PubMed]
- Montgomery NI, Rosenfeld S Pediatric osteoarticular infection update. J Pediatr Orthop 2015, 35, 74–81. [CrossRef] [PubMed]
- Karchevsky M, Schweitzer ME, Morrison WB, Parellada JA MRI findings of septic arthritis and associated osteomyelitis in adults. AJR Am J Roentgenol 2004, 182, 119–122. [CrossRef] [PubMed]
- Hong SH, Kim SM, Ahn JM, Chung HW, Shin MJ, Kang HS Tuberculous versus pyogenic arthritis: MR imaging evaluation. Radiology 2001, 218, 848–853. [CrossRef] [PubMed]
- Colebatch AN, Edwards CJ, Østergaard M, et al EULAR recommendations for the use of imaging of the joints in the clinical management of rheumatoid arthritis. Ann Rheum Dis 2013, 72, 804–814. [CrossRef]
- Weishaupt D, Schweitzer ME MR imaging of septic arthritis and rheumatoid arthritis of the shoulder. Magn Reson Imaging Clin N Am 2004, 12, 111–124. [CrossRef]
- McQueen FM, Gao A, Ostergaard M, King A, Shalley G, Robinson E, Doyle A, Clark B, Dalbeth N High-grade MRI bone oedema is common within the surgical field in rheumatoid arthritis patients undergoing joint replacement and is associated with osteitis in subchondral bone. Ann Rheum Dis 2007, 66, 1581–1587.
- Boutry N, Morel M, Flipo R-M, Demondion X, Cotten A Early rheumatoid arthritis: a review of MRI and sonographic findings. AJR Am J Roentgenol 2007, 189, 1502–1509. [CrossRef]
- Amrami KK Imaging of the seronegative spondyloarthopathies. Radiol Clin North Am 2012, 50, 841–854. [CrossRef]
- Jones EA, Manaster BJ, May DA, Disler DG () Neuropathic osteoarthropathy: diagnostic dilemmas and differential diagnosis. Radiographics 2000, 20, S279–S293. [CrossRef] [PubMed]
- Ahmadi ME, Morrison WB, Carrino JA, Schweitzer ME, Raikin SM, Ledermann HP Neuropathic arthropathy of the foot with and without superimposed osteomyelitis: MR Imaging Characteristics. Radiology 2006, 238, 622–631. [CrossRef]
- Rosenbaum AJ, DiPreta JA Classifications in brief: Eichenholtz classification of Charcot arthropathy. Clin Orthop Relat Res 2015, 473, 1168–1171. [CrossRef]
- Schumacher HR Crystal-induced arthritis: an overview. Am J Med 1996, 100, 46S–52S. [CrossRef] [PubMed]
- Abhishek A Calcium pyrophosphate deposition disease: a review of epidemiologic findings. Curr Opin Rheumatol 2016, 28, 133–139. [CrossRef] [PubMed]
- Rosales-Alexander JL, Balsalobre Aznar J, Magro-Checa C Calcium pyrophosphate crystal deposition disease: diagnosis and treatment. Open Access Rheumatol 2014, 6, 39–47.
- Mandl P, D’Agostino MA, Navarro-Compán V, et al 2023 EULAR recommendations on imaging in diagnosis and management of crystal-induced arthropathies in clinical practice. Ann Rheum Dis 2024, 83, 752–759. [CrossRef]
- Frediani B, Filippou G, Falsetti P, Lorenzini S, Baldi F, Acciai C, Siagkri C, Marotto D, Galeazzi M, Marcolongo R Diagnosis of calcium pyrophosphate dihydrate crystal deposition disease: ultrasonographic criteria proposed. Ann Rheum Dis 2005, 64, 638–640. [CrossRef]
- Buckens CF, Terra MP, Maas M Computed Tomography and MR Imaging in crystalline-induced arthropathies. Radiol Clin North Am 2017, 55, 1023–1034. [CrossRef]
- Gersing AS, Schwaiger BJ, Heilmeier U, et al Evaluation of Chondrocalcinosis and Associated Knee Joint Degeneration Using MR Imaging: Data from the Osteoarthritis Initiative. Eur Radiol 2017, 27, 2497–2506. [CrossRef]
- Lequesne M Rapid destructive coxarthritis. Rhumatologie 1970, 22, 51–63.
- Flemming DJ, Gustas-French CN Rapidly progressive osteoarthritis: a Review of the clinical and radiologic presentation. Curr Rheumatol Rep 2017, 19, 42. [CrossRef] [PubMed]
- Boutry N, Paul C, Leroy X, Fredoux D, Migaud H, Cotten A Rapidly destructive osteoarthritis of the hip: MR imaging findings. AJR Am J Roentgenol 2002, 179, 657–663. [CrossRef] [PubMed]
- Zazgyva A, Gurzu S, Gergely I, Jung I, Roman CO, Pop TS Clinico-radiological diagnosis and grading of rapidly progressive osteoarthritis of the hip. Medicine 2017, 96, e6395. [CrossRef]
- Chai JW, Hong SH, Choi J-Y, Koh YH, Lee JW, Choi J-A, Kang HS Radiologic diagnosis of osteoid osteoma: from simple to challenging findings. Radiographics 2010, 30, 737–749. [CrossRef]
- Bedoya MA, Iwasaka-Neder J, Tsai A, Bixby SD Intra-articular osteoid osteomas: Imaging manifestations and mimics. Radiographics 2024, 44, e230208. [CrossRef]
- Bohndorf, K. Infection of the appendicular skeleton. Eur Radiol 2004, 14 (Suppl. 3), E53–E63. [Google Scholar] [CrossRef] [PubMed]
- Davies AM, Grimer R The penumbra sign in subacute osteomyelitis. Eur Radiol 2005, 15, 1268–1270. [CrossRef]
- Hayeri MR, Pouya Ziai, Shehata ML, Teytelboym OM, Huang BK Soft-Tissue infections and their imaging mimics: From cellulitis to necrotizing fasciitis. RadioGraphics 2016, 36, 1888–1910. [CrossRef] [PubMed]
- Yu JS, Habib P. MR imaging of urgent inflammatory and infectious conditions affecting the soft tissues of the musculoskeletal system. Emerg Radiol 2009, 16, 267–276. [Google Scholar] [CrossRef]
- Baumann F, Brühlmann P, Andreisek G, Michel BA, Marincek B, Weishaupt D. MRI for diagnosis and monitoring of patients with eosinophilic fasciitis. AJR Am J Roentgenol 2005, 184, 169–174. [Google Scholar] [CrossRef]
- Gaeta M, Mileto A, Musumeci O. MRI findings of neutrophilic fasciitis in a patient with acute febrile neutrophilic dermatosis (Sweet’s syndrome). Skeletal Radiol 2011, 40, 779–782. [Google Scholar] [CrossRef] [PubMed]
- Leung LY, Shu SJ, Chan AC, Chan MK, Chan CH. Nodular fasciitis: MRI appearance and literature review. Skeletal Radiol 2002, 31, 9–13. [Google Scholar] [CrossRef] [PubMed]
- Wang XL, De Schepper AM, Vanhoenacker F, et al. Nodular fasciitis: correlation of MRI findings and histopathology. Skeletal Radiol 2002, 31, 155–161. [Google Scholar] [CrossRef] [PubMed]
- Tanboon J, Uruha A, Stenzel W, Nishino I. Where are we moving in the classification of idiopathic inflammatory myopathies? Curr Opin Neurol. 2020, 33, 590–603. [Google Scholar] [CrossRef]
- Bottai M, Tjärnlund A, Santoni G et al. EULAR/ACR Classification criteria for adult and juvenile idiopathic inflammatory myopathies and their major subgroups: A methodology report. RMD Open. 2017, 3, e000507. [Google Scholar] [CrossRef]
- O’Connell MJ, Powell T, Brennan D, Lynch T, McCarthy CJ, Eustace SJ. Whole-body MR imaging in the diagnosis of polymyositis. AJR Am J Roentgenol 2002, 179, 967–971. [Google Scholar] [CrossRef]
- S. Kamath, N. Venkatanarasimha, M. A. Walsh & P. M. Hughes. MRI appearance of muscle denervation. Skeletal Radiol 2008, 37, 397–404. [Google Scholar]
- Petersilge CA, Pathria MN, Gentili A, Recht MP, Resnick D. Denervation hypertrophy of muscle: MR features. J Comput Assist Tomogr 1995, 19, 596–600. [Google Scholar] [CrossRef]
- Guermazi A, Roemer F, Robinson P, Tol J, Regatte R, Crema M. Imaging of muscle injuries in sports medicine: Sports imaging series. Radiology. 2017, 282, 646–663. [Google Scholar] [CrossRef]
- Lu CH, Tsang YM, Yu CW, Wu MZ, Hsu CY, Shih TT. Rhabdomyolysis: magnetic resonance imaging and computed tomography findings. J Comput Assist Tomogr 2007, 31, 368–374. [Google Scholar] [CrossRef] [PubMed]
- Beltran J, Simon DC, Katz W, Weis LD. Increased MR signal intensity in skeletal muscle adjacent to malignant tumors: pathologic correlation and clinical relevance. Radiology 1987, 162 Pt 1, 251–255. [Google Scholar] [CrossRef] [PubMed]
Figure 1.
A 73-year-old male patient with Staphylococcus aureus infectious spondylodiscitis. Sagittal T1-w (A) and T2-w (B), coronal T2-w (C) and sagittal STIR (D) MR images showing the bone marrow edema at L4 and L5 (open arrows), the end plate cortical disruption (small arrows) and the abnormally high signal within the disc on T2-w and STIR images. A small intraosseous abscess formation is also seen (long arrow).
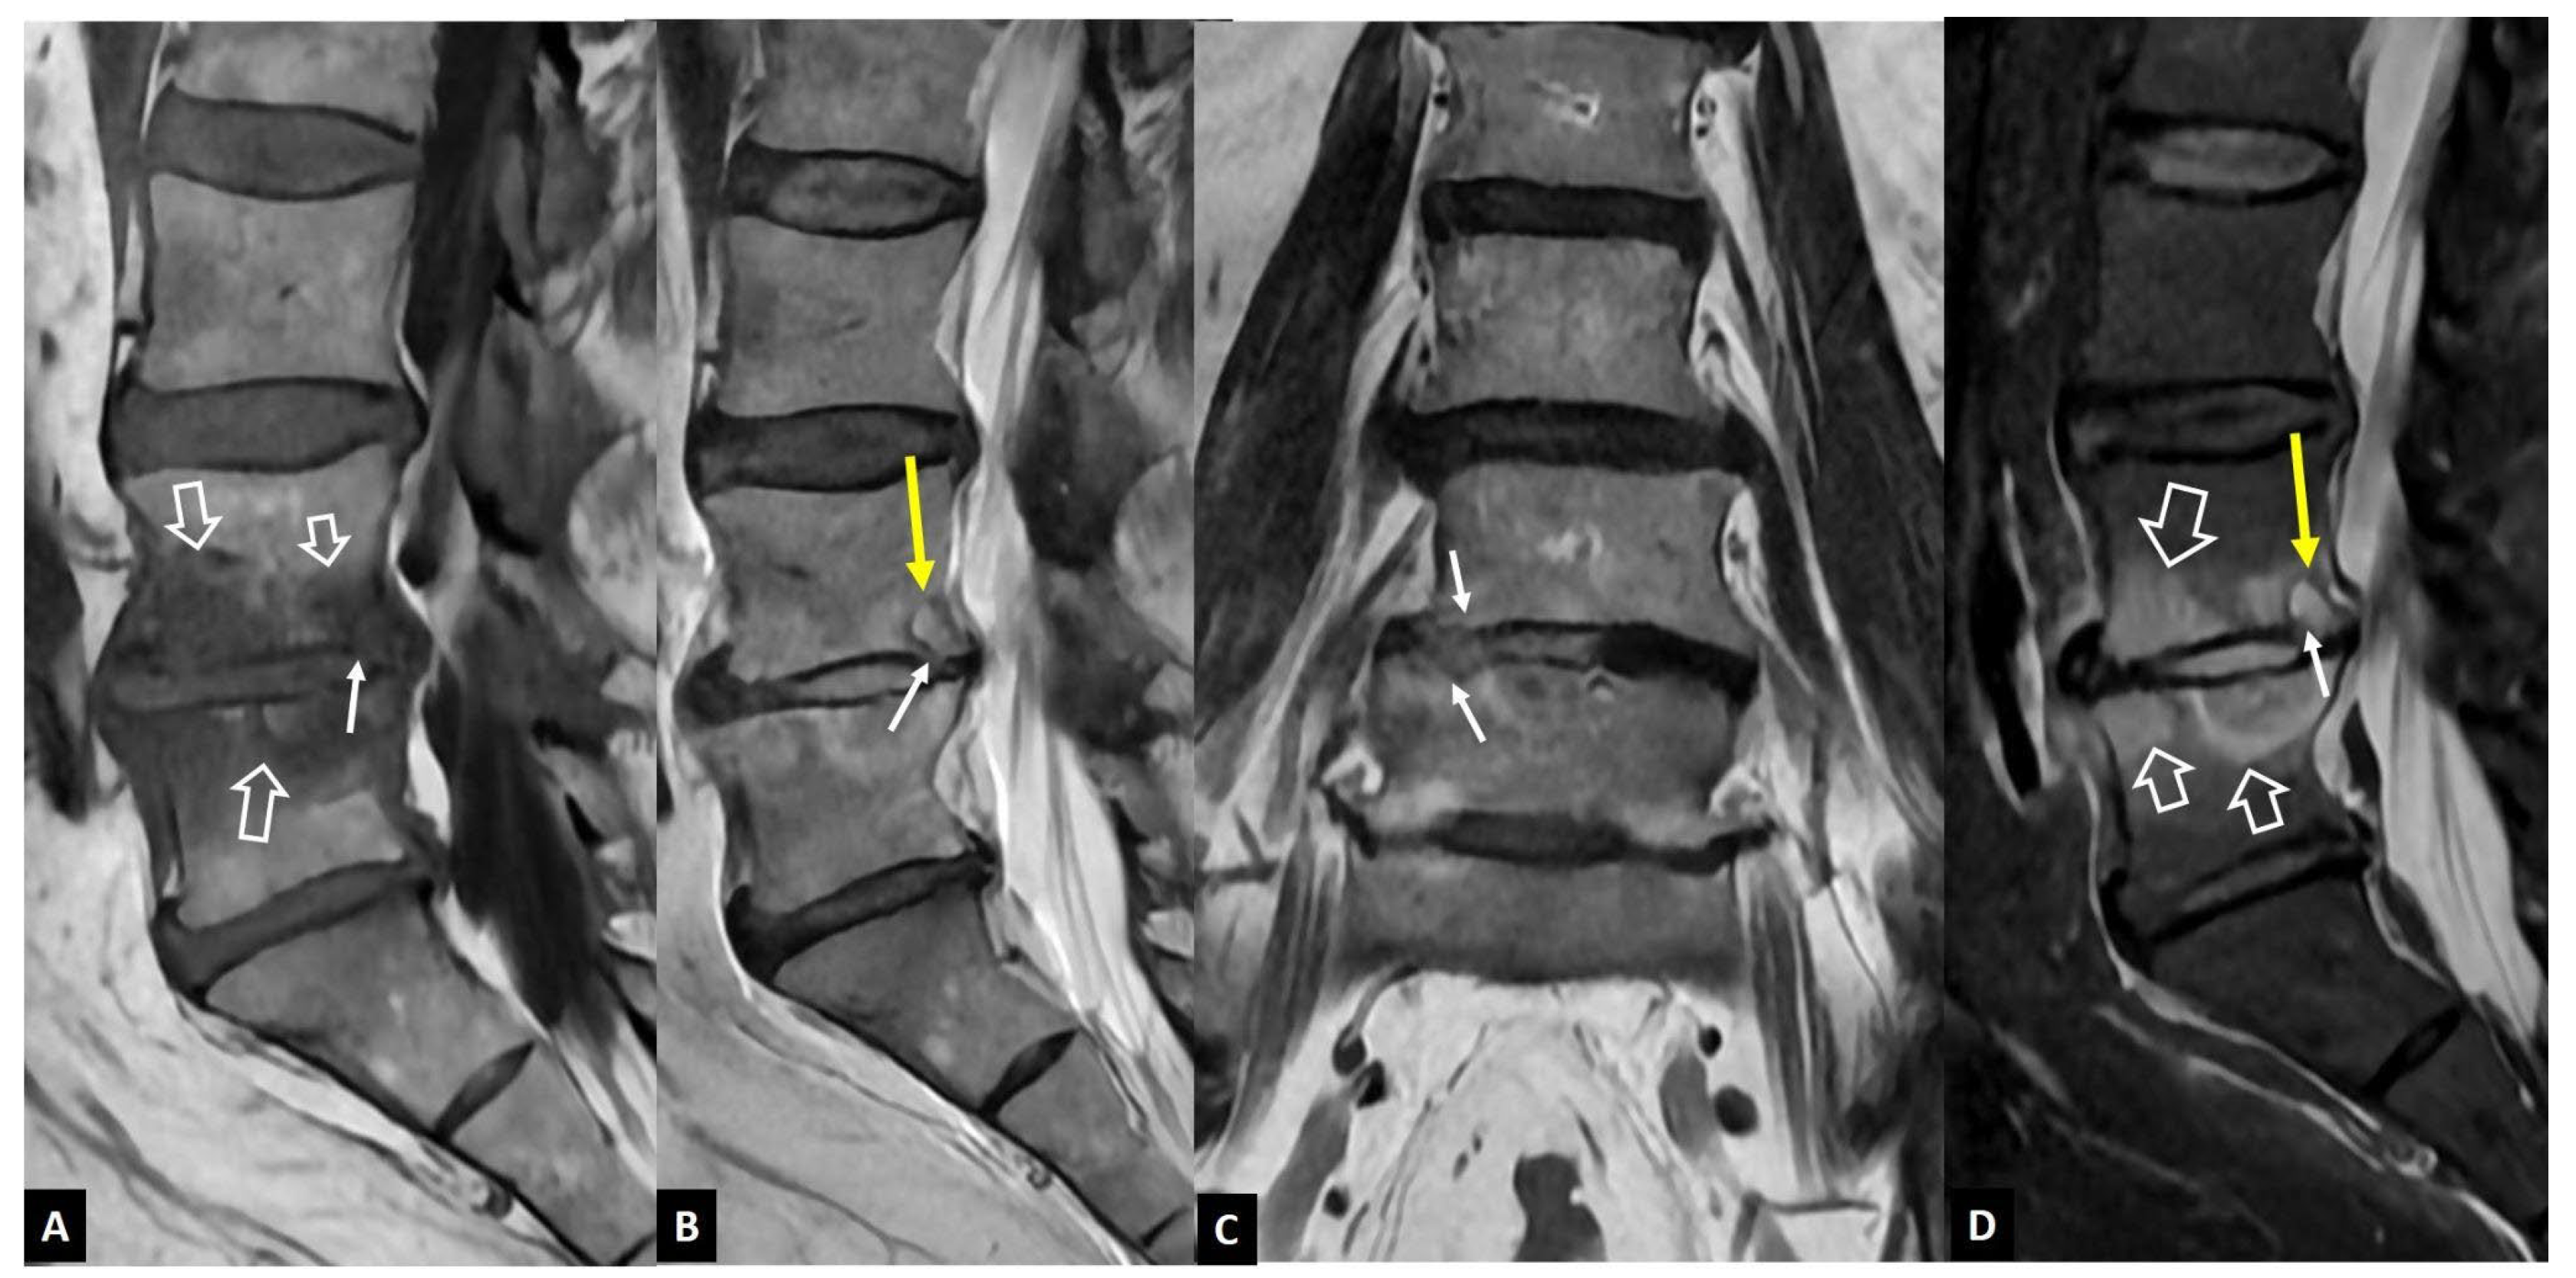
Figure 2.
A 66-year-old male patient with a long history of scoliosis and non-specific low back pain. Sagittal T1-w (A), T2-w (B) and STIR (C) MR images show a dehydrated L1-L2 disc, with severe height reduction (thin arrows) and associated bone marrow edema (open arrows).
Figure 2.
A 66-year-old male patient with a long history of scoliosis and non-specific low back pain. Sagittal T1-w (A), T2-w (B) and STIR (C) MR images show a dehydrated L1-L2 disc, with severe height reduction (thin arrows) and associated bone marrow edema (open arrows).
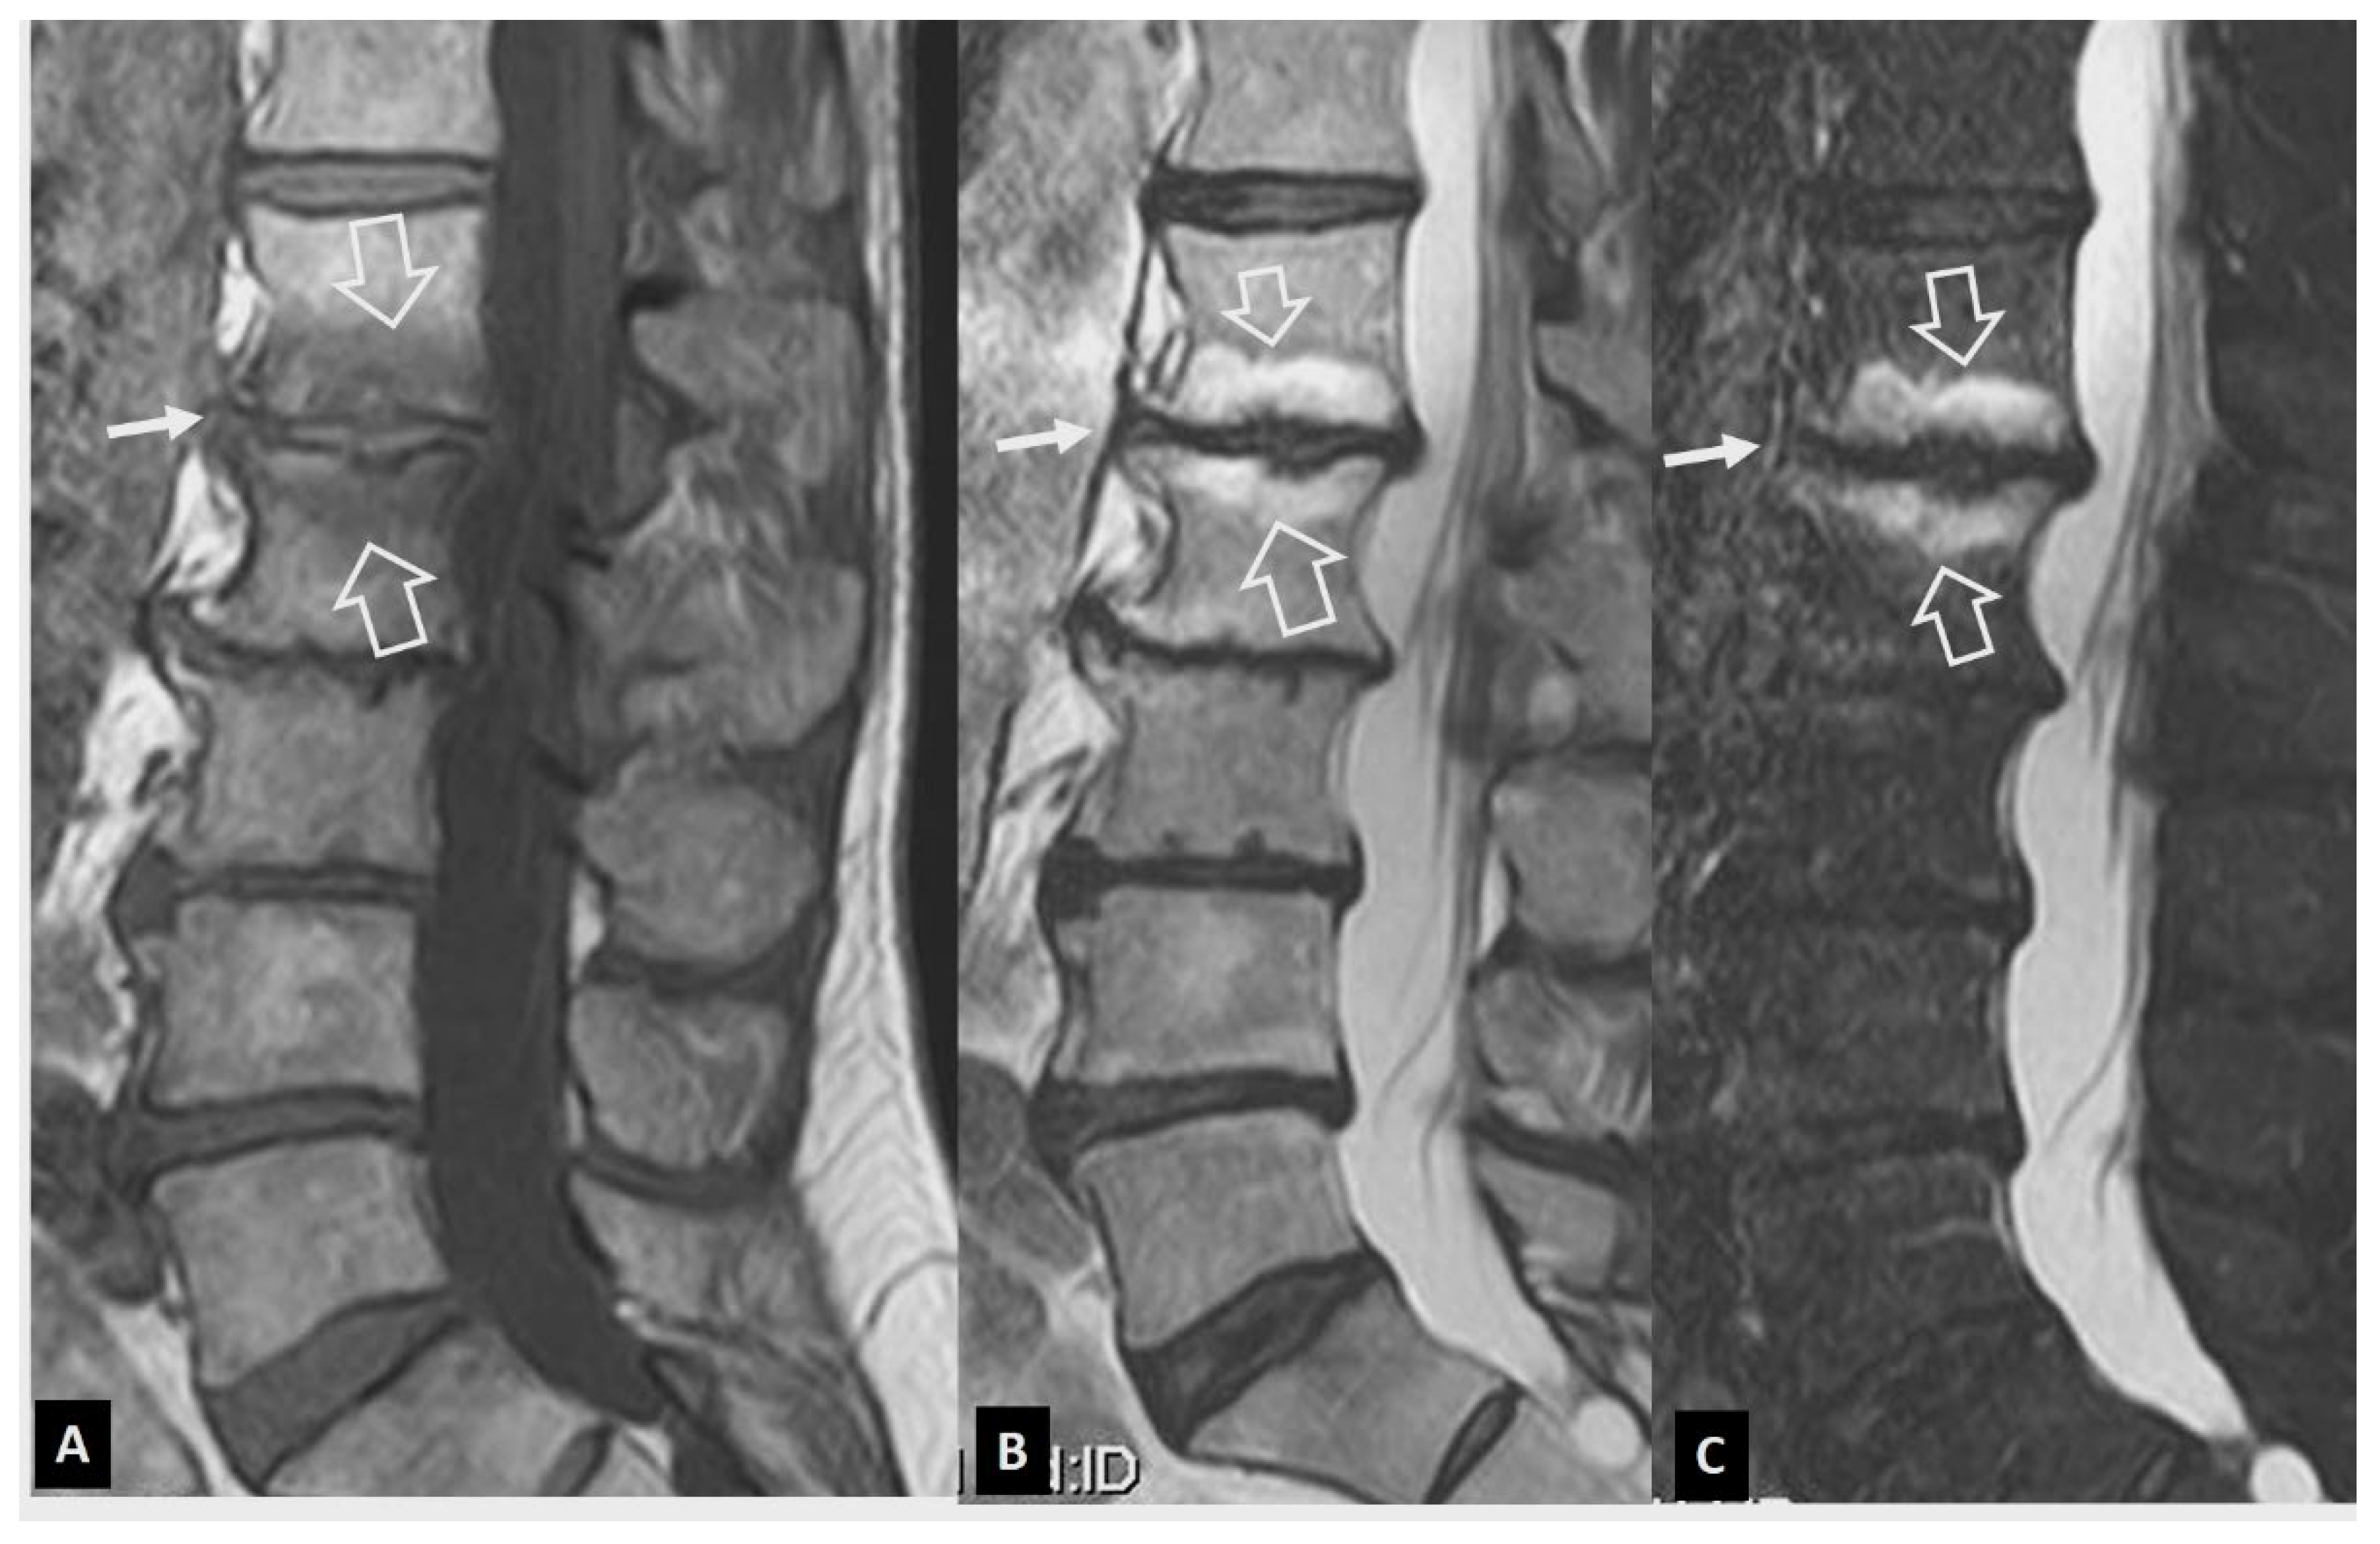
Figure 3.
Evolution of Modic I changes in a 31-year-old female patient with non-specific low back pain. A. MR imaging examination of October 2015. Sagittal T1-w (left), STIR (center) and fat suppressed contrast-enhanced T1-w MR images (right), showing the Modic I changes at the L5-S1 intervertebral endplates, returning low T1 signal, high on STIR and enhancement on contrast enhanced images (open arrows). Thin linear enhancement is also shown at the L4-L5 intervertebral disc space (thin arrows). Of note, the L5-S1 disc is not totally degenerated (long open arrow on STIR). B. MR imaging examination of May 2016. Sagittal T1-w (left), STIR (center) and fat suppressed contrast-enhanced T1-w MR images (right), showing that the Modic I changes at the L5-S1 intervertebral endplates have decreased (open arrows) and progressed to Modic II with fatty replacement (thin arrows on the left image). The Modic I changes at the L4-L5 endplates have increased (thick arrows). C. MR imaging examination of March 2021. A) Sagittal T1-w (left), STIR (center) and fat suppressed contrast-enhanced T1-w (right) MR images, showing the transformation of Modic I to Modic II changes at the L4-L5 and L5-S1 intervertebral endplates, returning high T1 signal, low on STIR and lack of enhancement on contrast enhanced images (open arrows). New Modic I changes are located at the L3-L4 endplates (arrows).
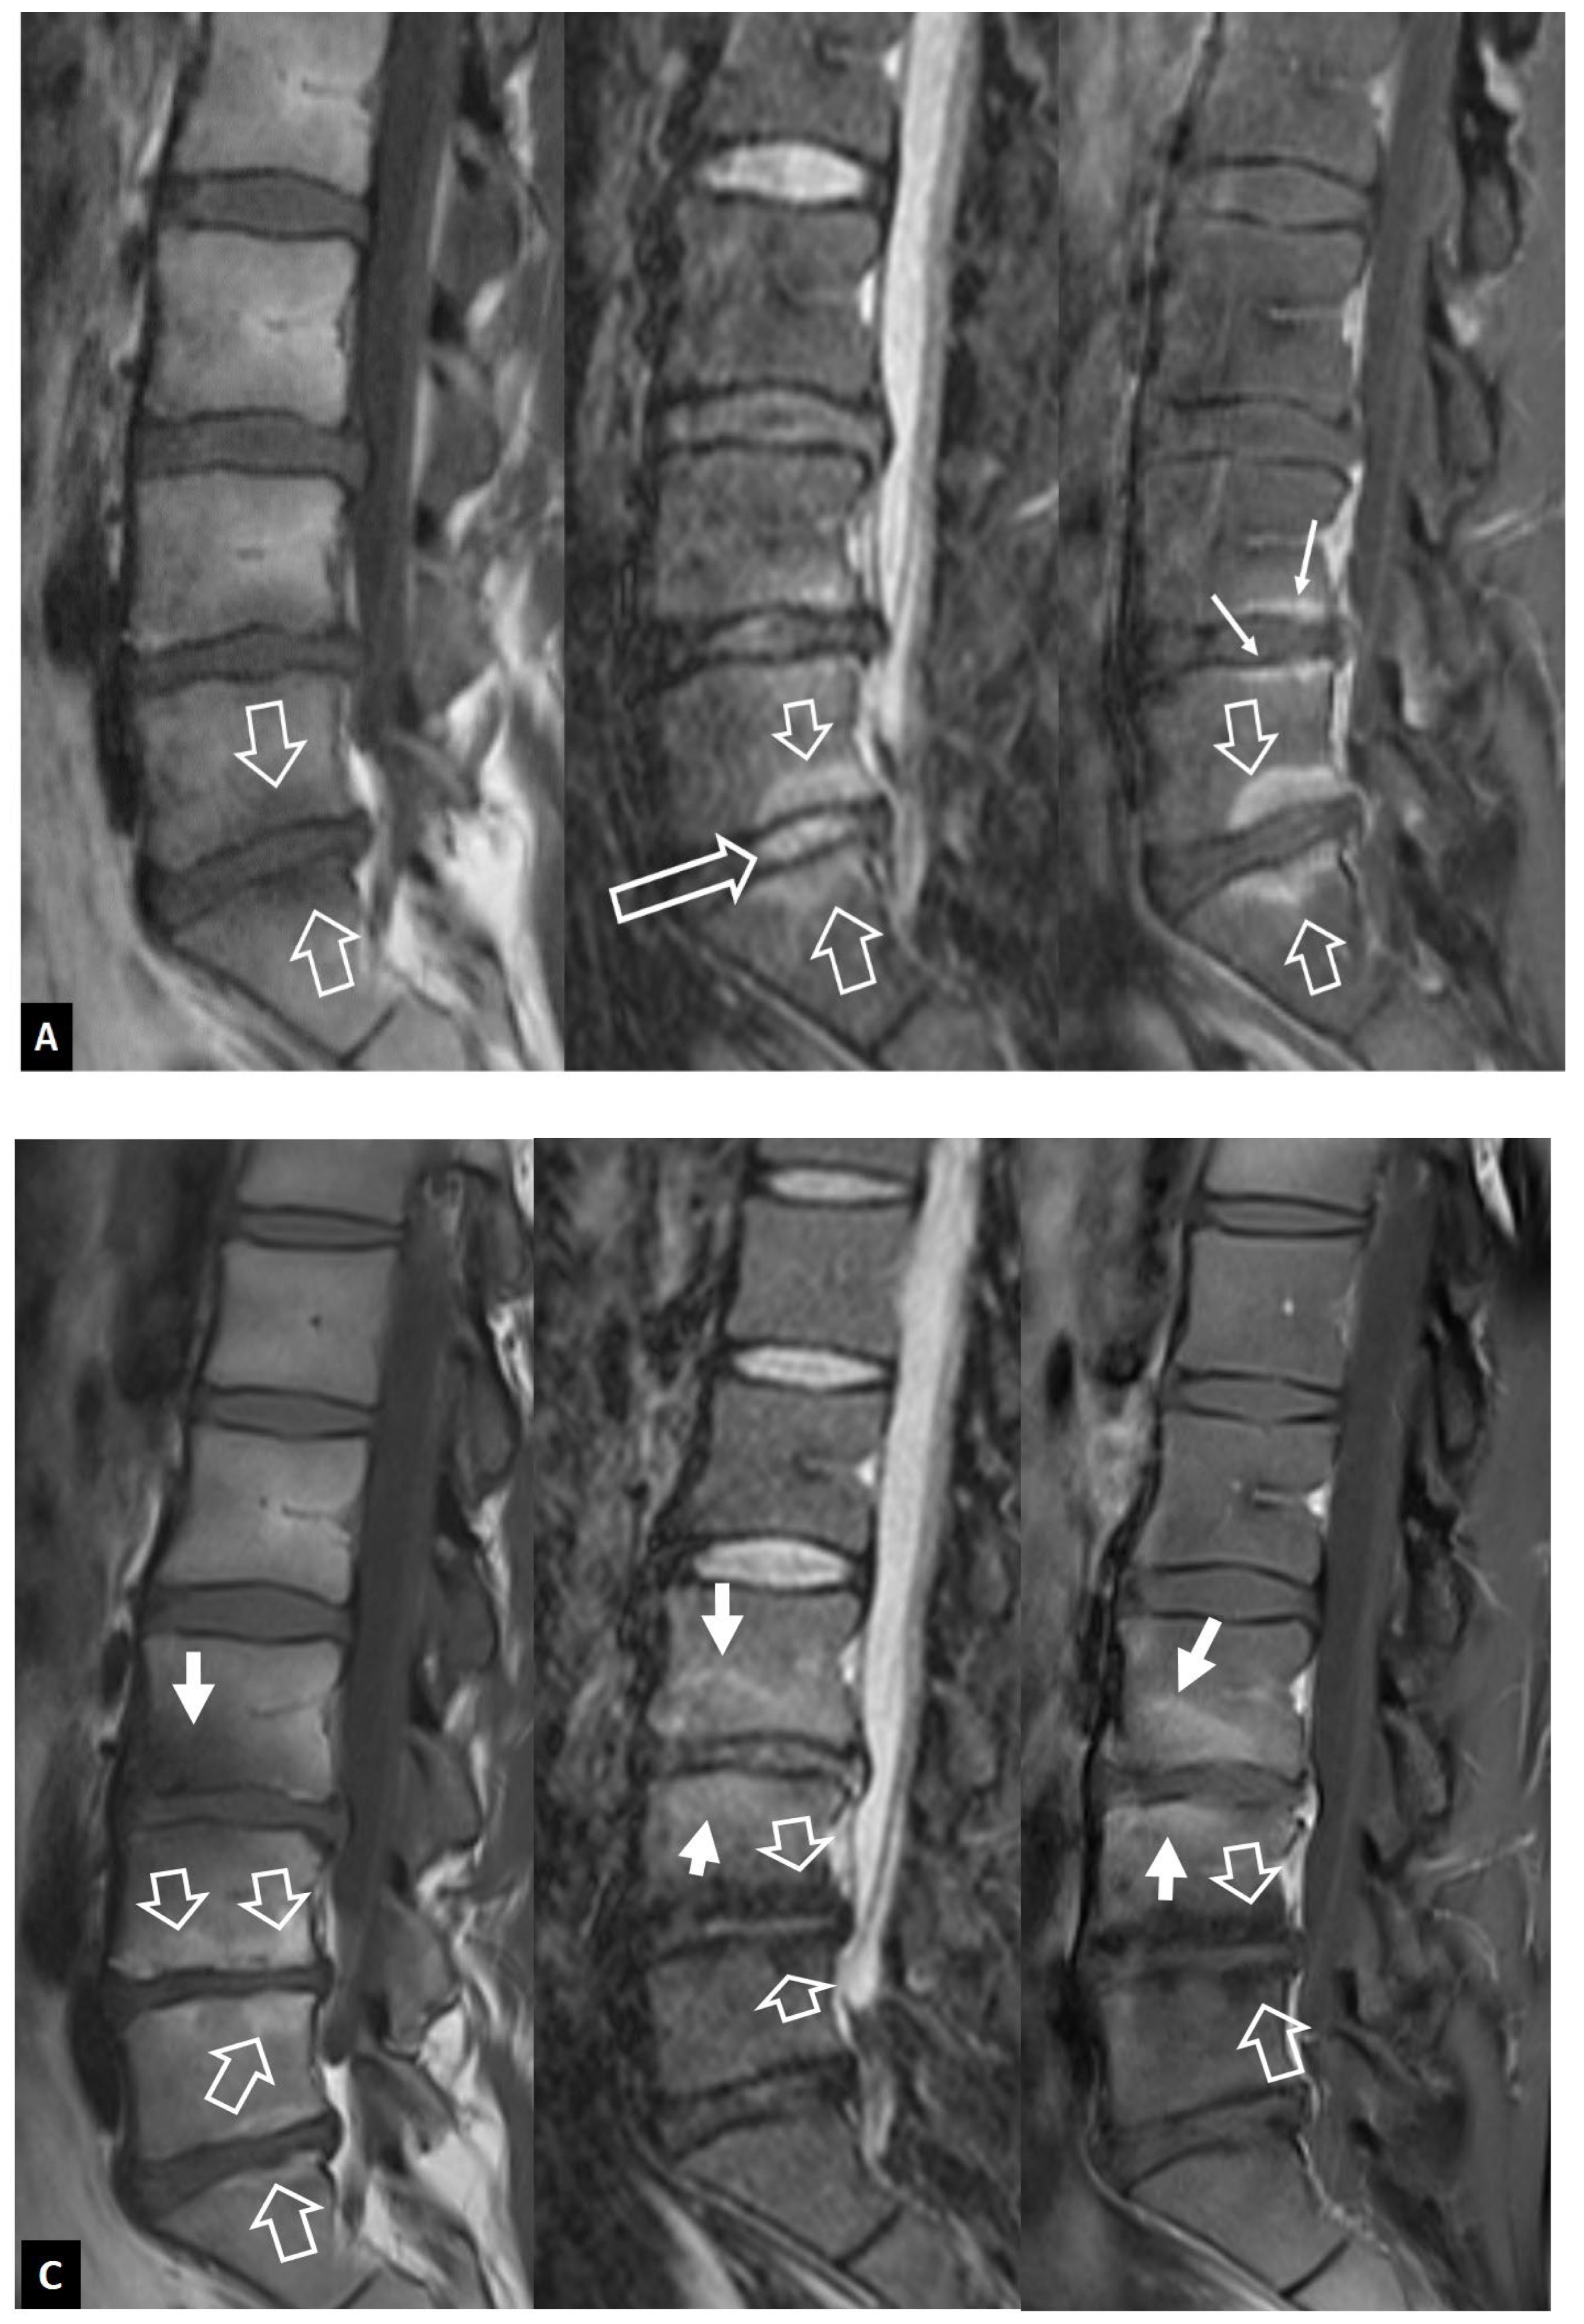
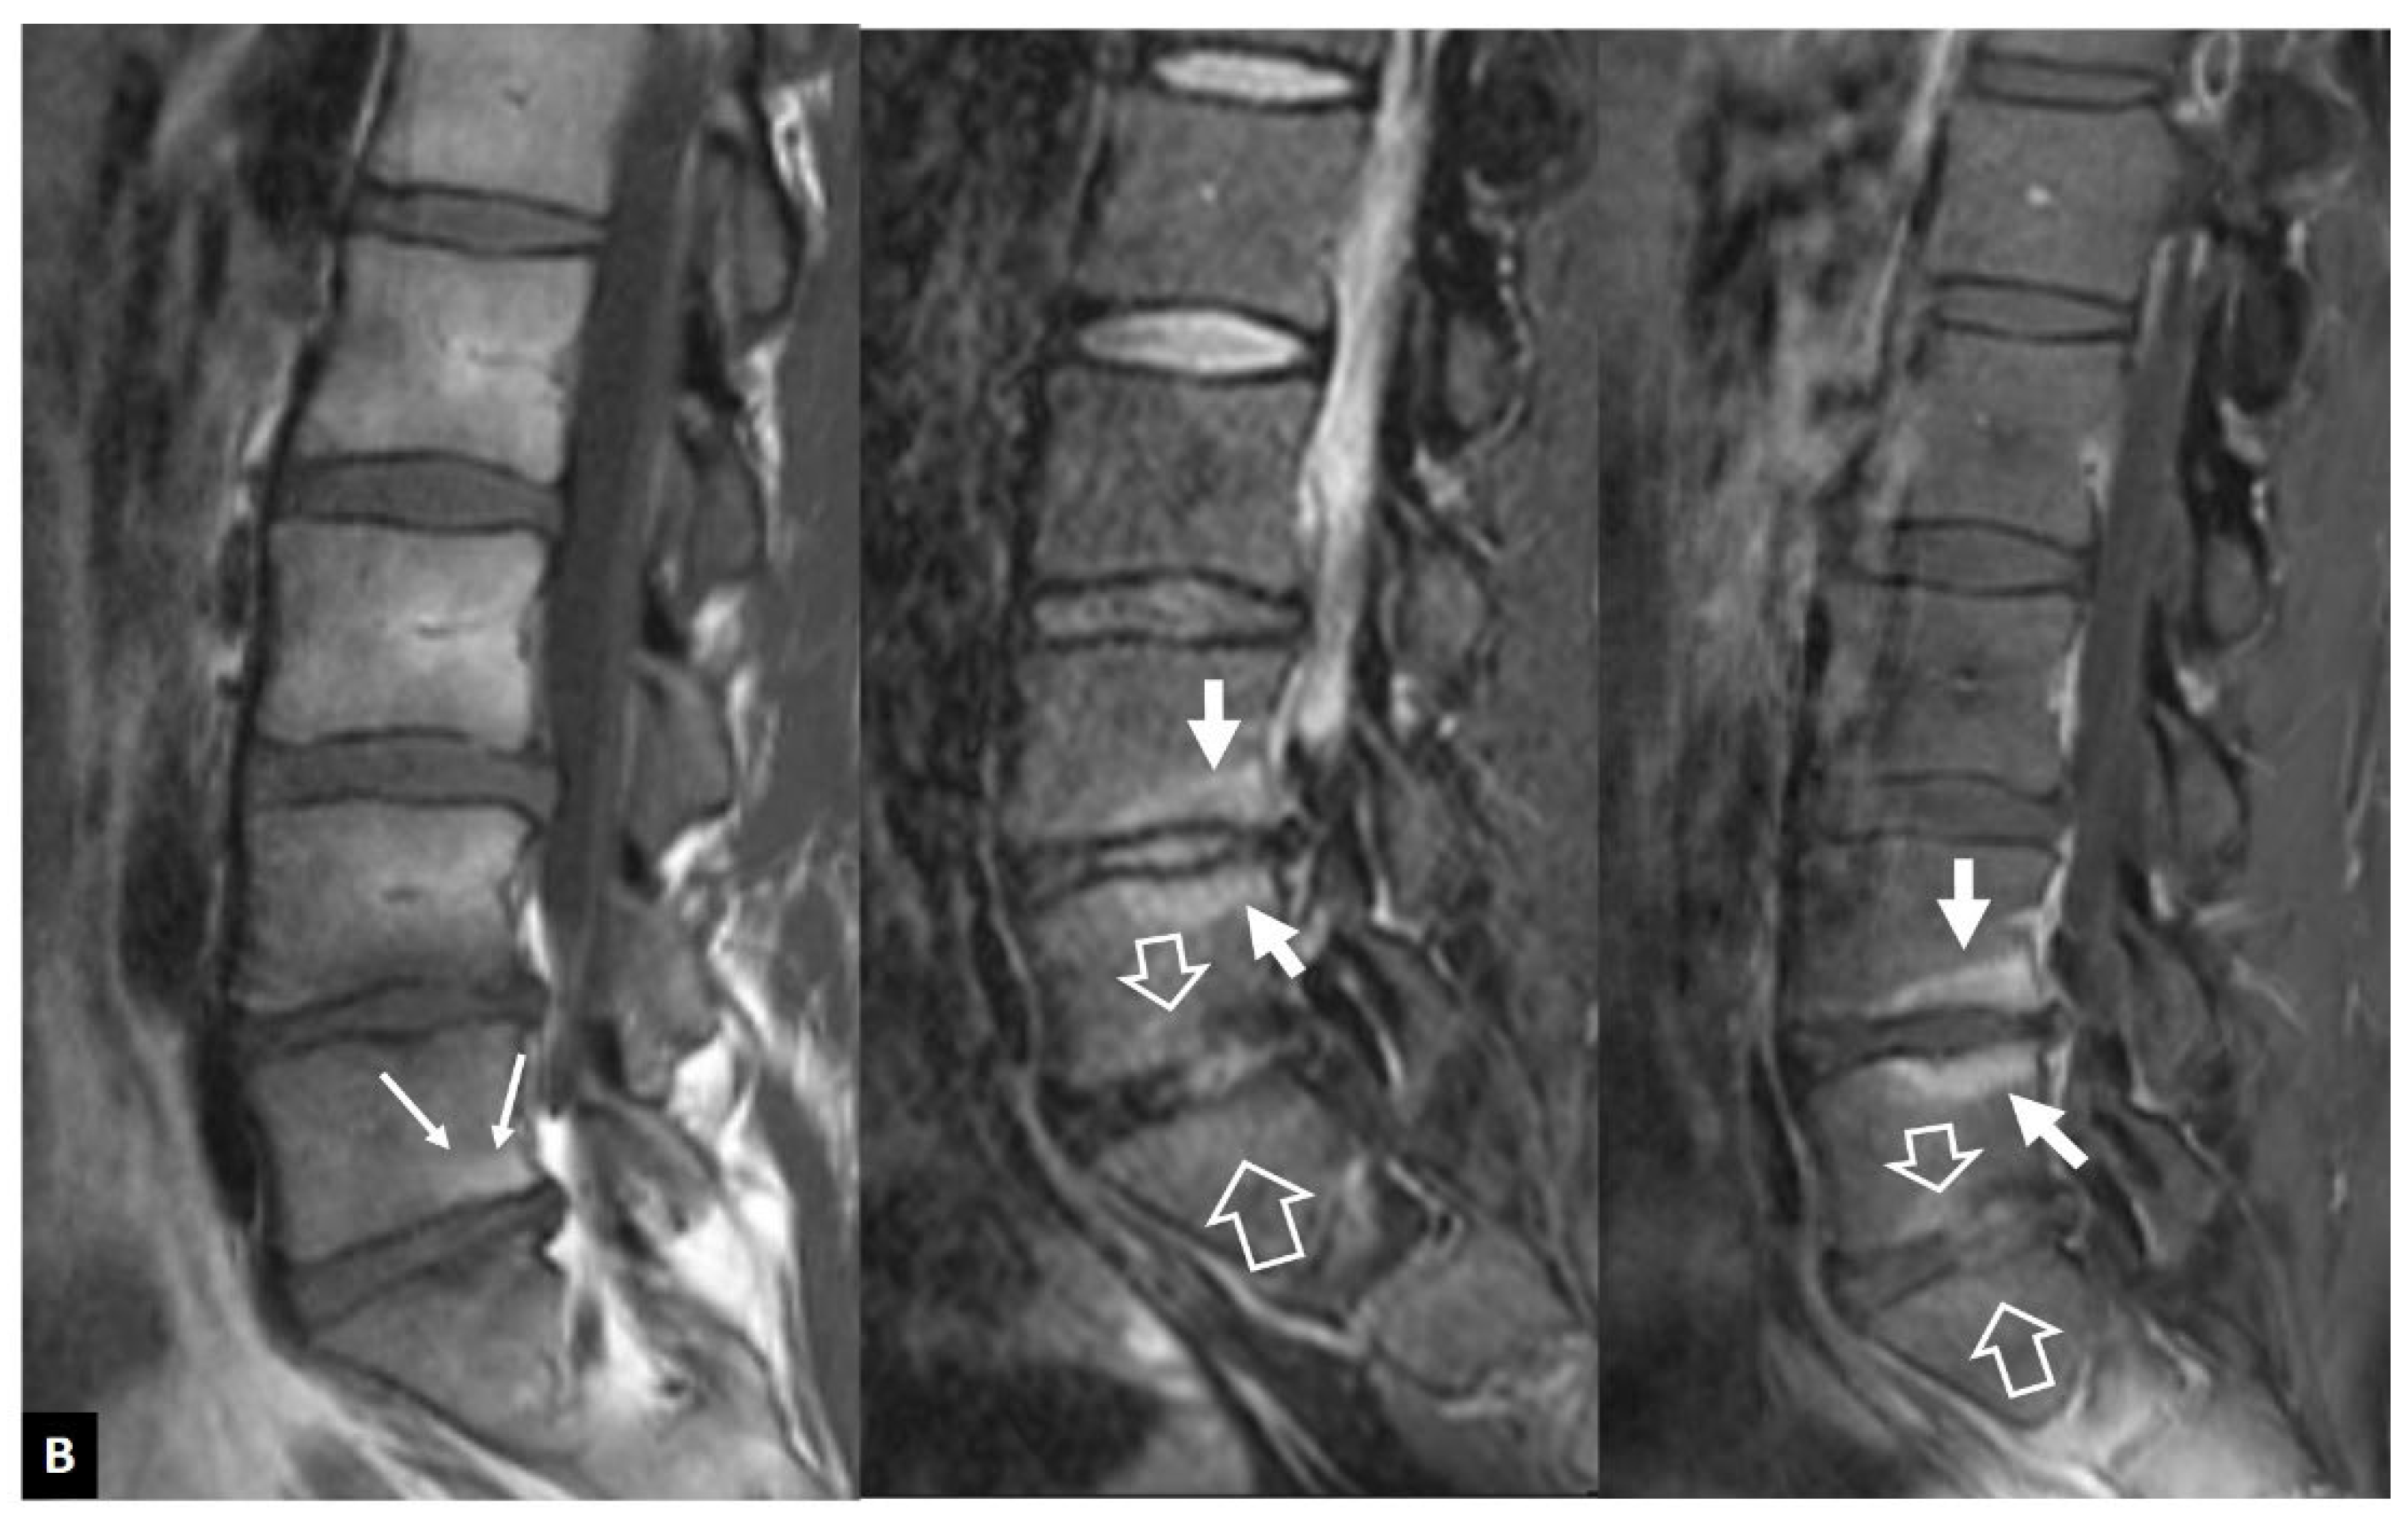
Figure 4.
Aseptic spondylodiscitis (Andersson’ s lesion) in a 38-year-old male patient with a history of 7-year low back pain. A. Sagittal T1-w MR image showing low signal intensity at the endplates of the L4-L5 disc space (arrows). B. Sagittal STIR MR image showing the bone marrow edema with hemispheric configuration (arrows). C. Sagittal fat suppressed contrast-enhanced T1-w MR image showing enhancement of the bone marrow edema (arrows) but no enhancement in the disc.
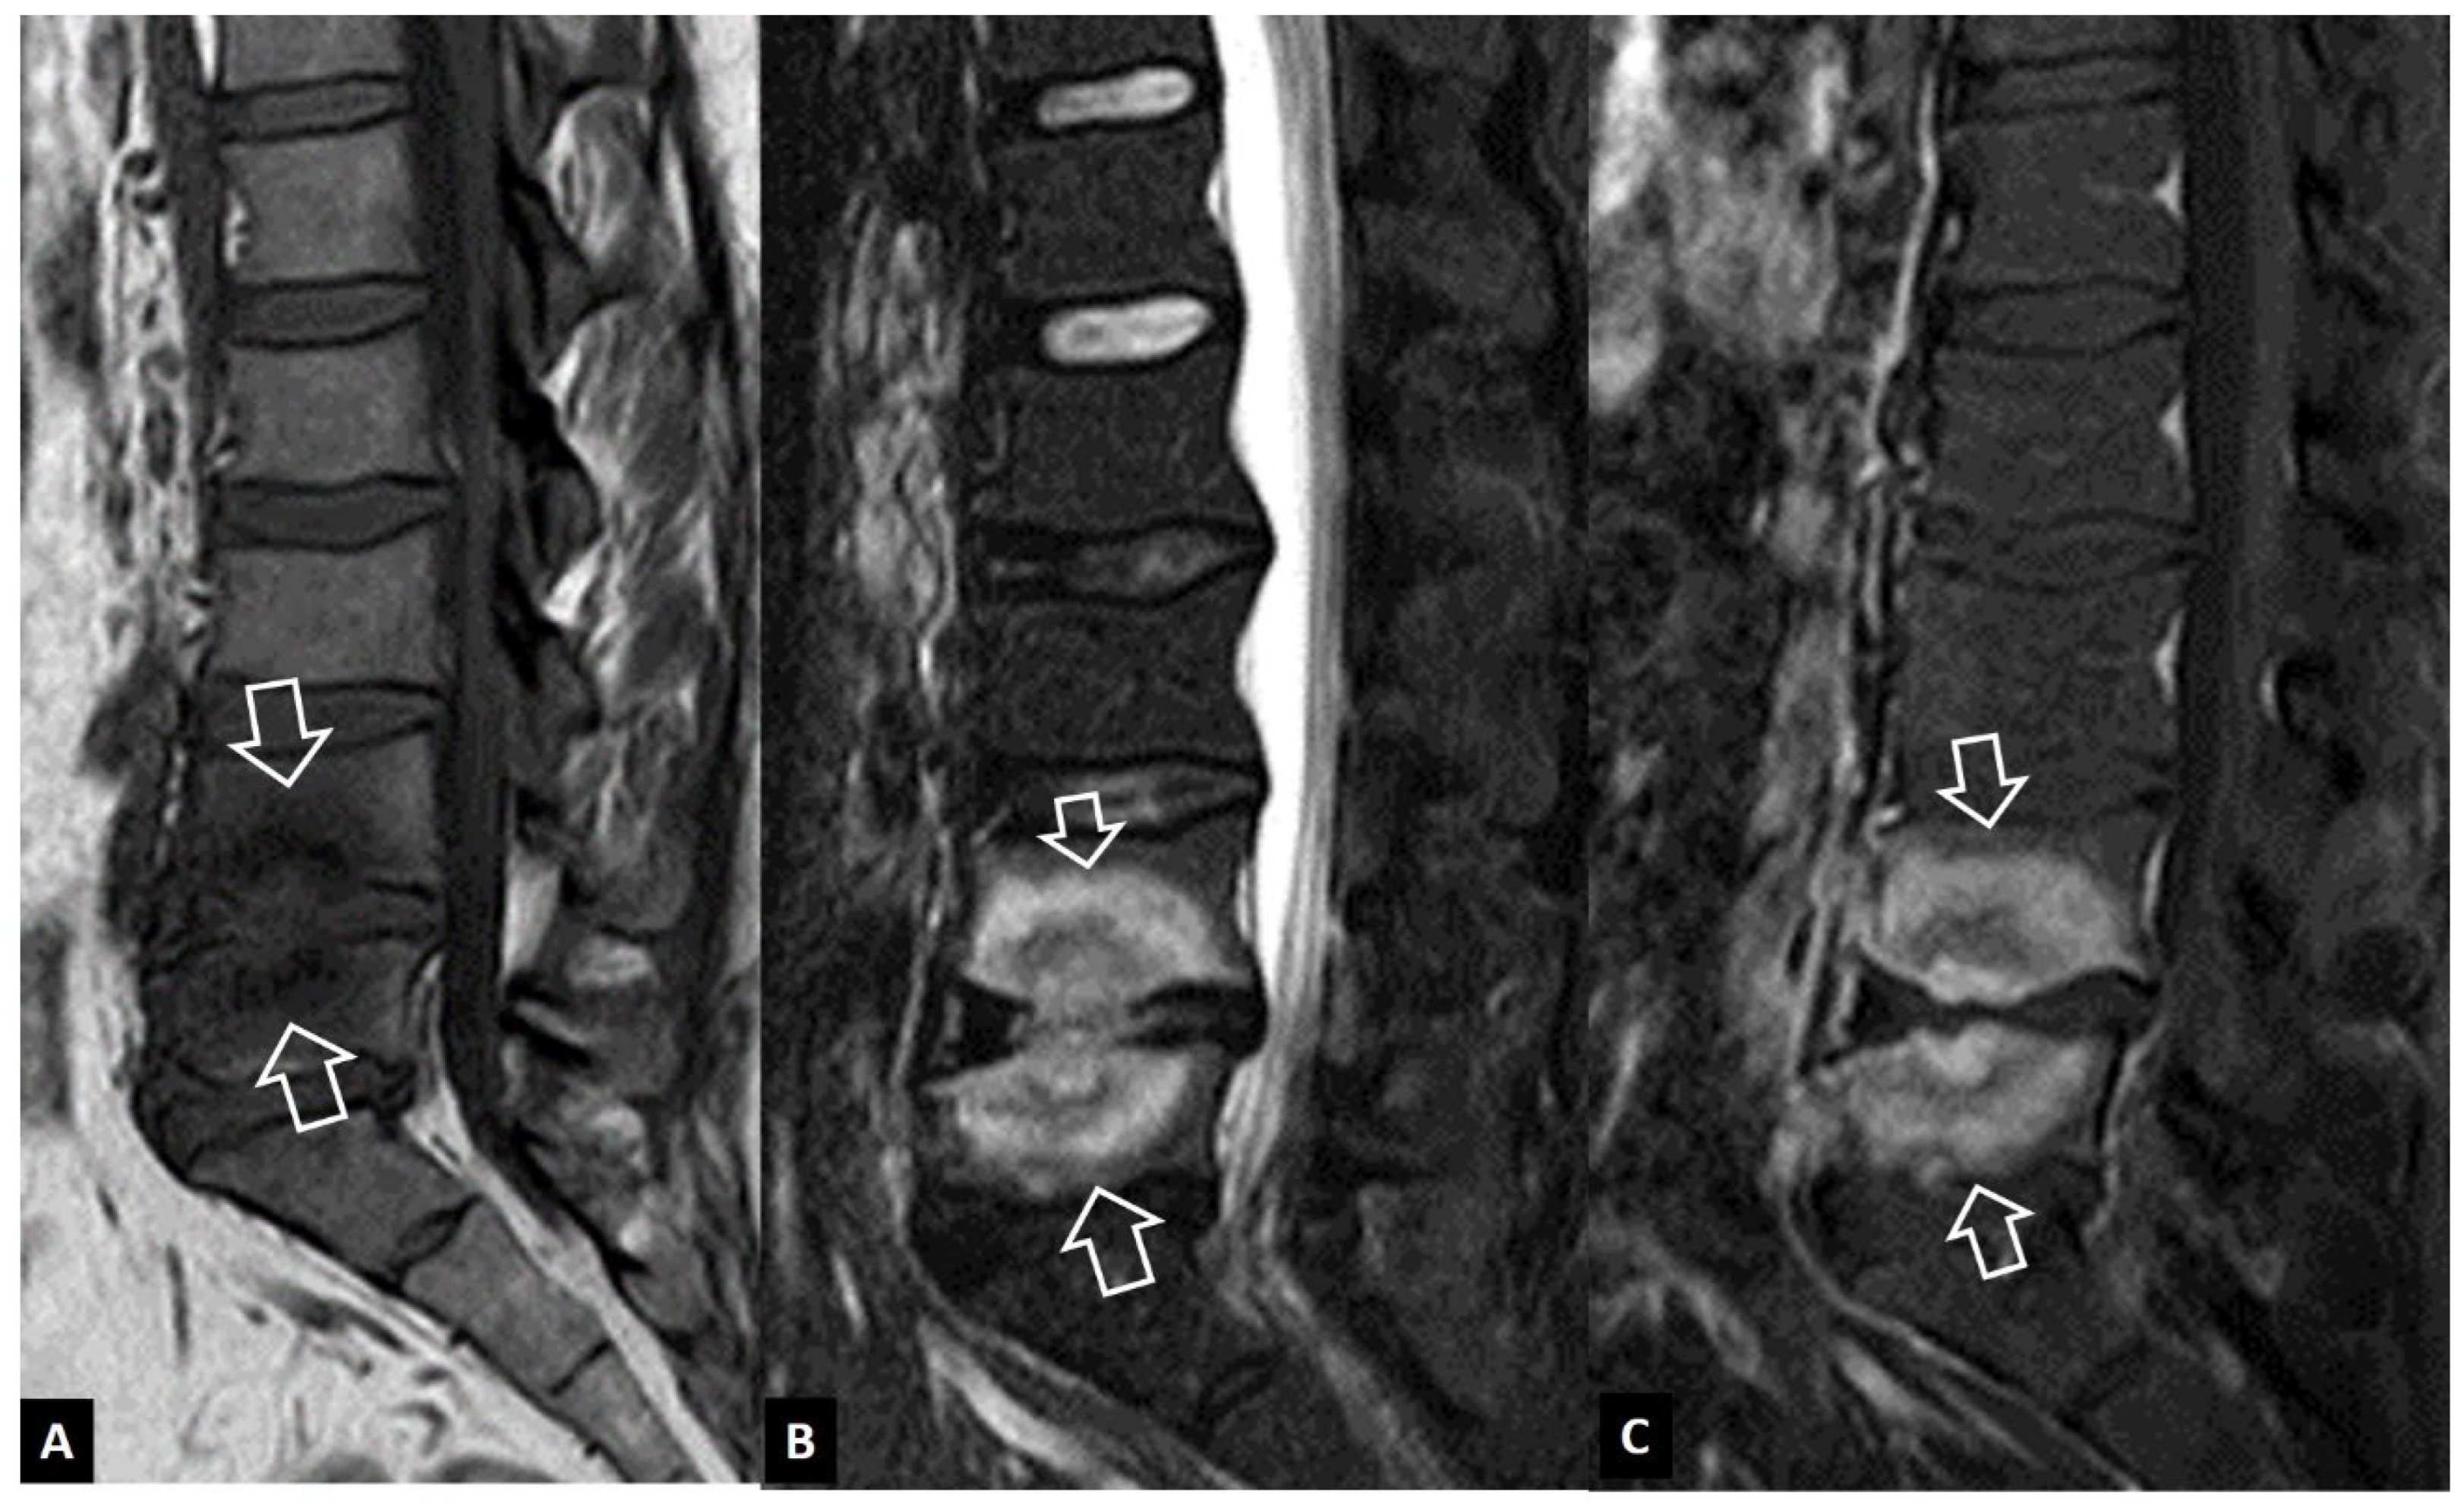
Figure 5.
Andersson’ s lesions. Sagittal STIR (A), coronal STIR (B) MR images and sagittal CT reconstruction (C) in a 35-year-old male with axSpA, showing the erosions of the endplates (arrows) and the bone marrow edema (open arrows). High signal is shown in the center of discs (thin long arrows), simulating infectious discitis. D. Sagittal T2-w MR image in a 43-year-old male with ax-SpA, showing Andersson’s lesion in multiple levels (arrows).
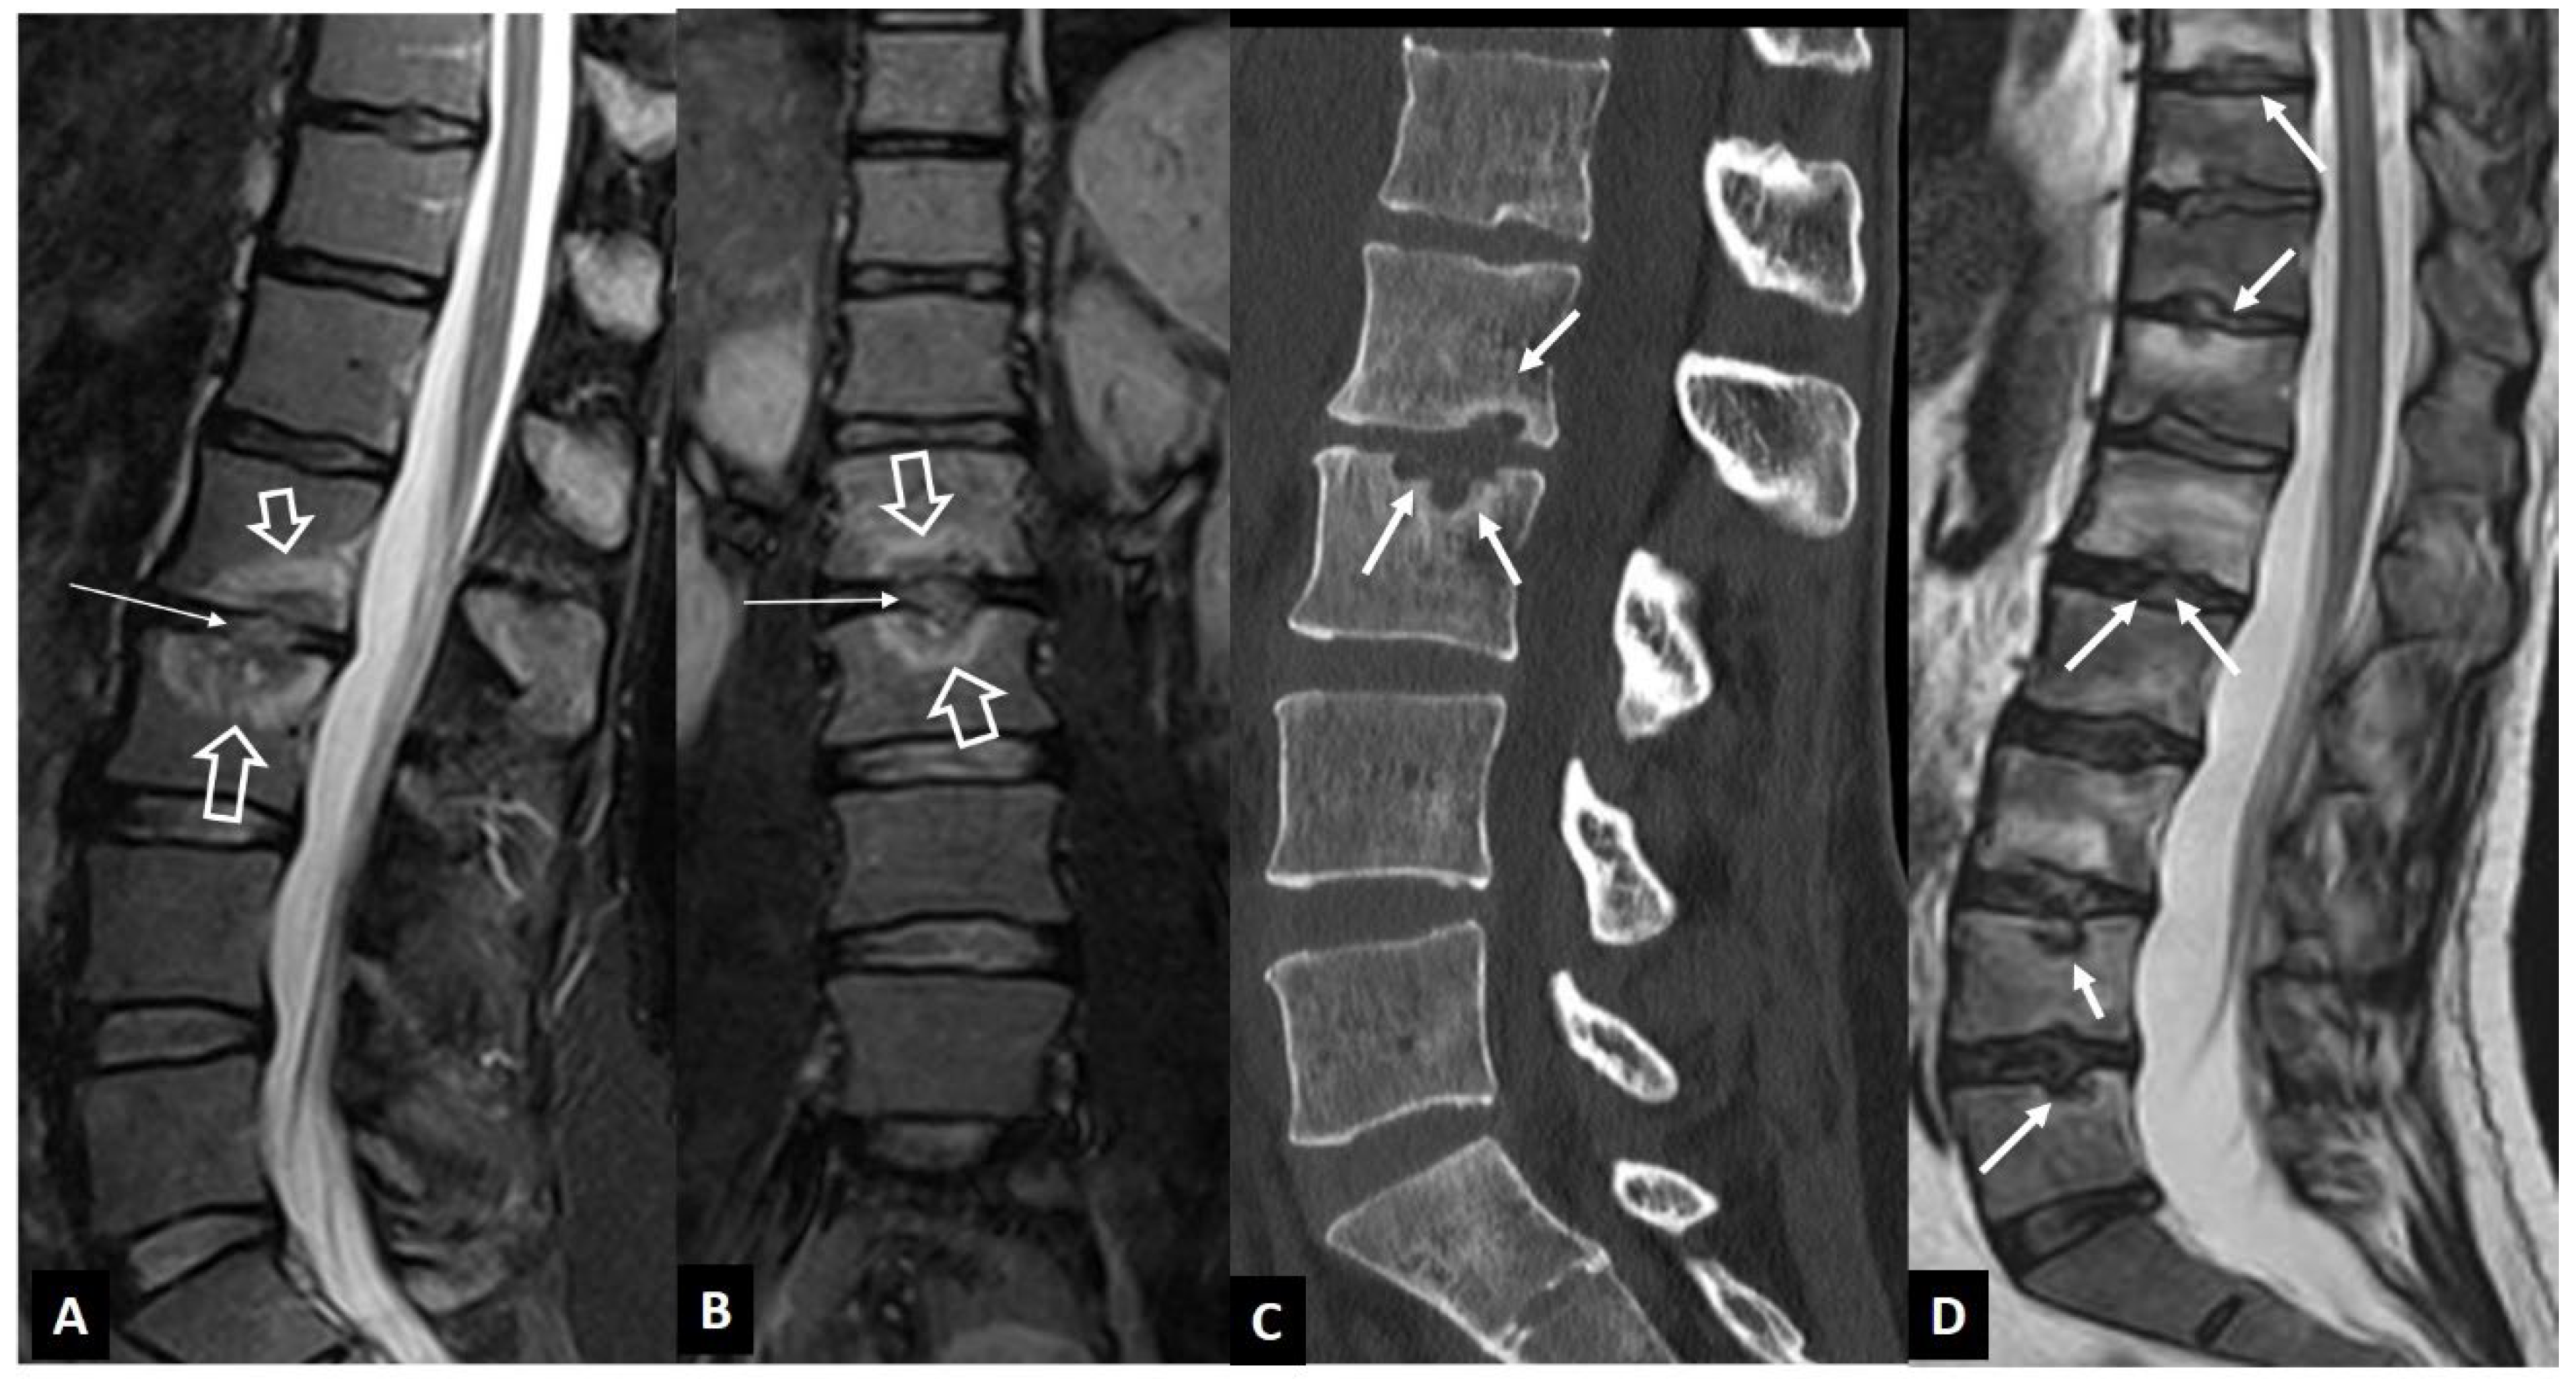
Figure 6.
SAPHO syndrome in a 39-year-old female patient with acne, postulosis and chronic sternal and back pain. Parasagittal fat suppressed contrast enhanced T1-w MR images (A, B) showing enhancing bone marrow edema in two different levels (yellow arrows) with early disc involvement (thin arrows) and soft tissue inflammatory changes anterior to the thoracic spine (open arrows). C. Sagittal STIR MR image showing the bone marrow edema in the manubrium of the sternum in keeping with osteitis (arrows). D. Axial CT showing hyperostosis of the right rib (yellow arrow), osteitis (open arrows) and an erosion (thin arrow).
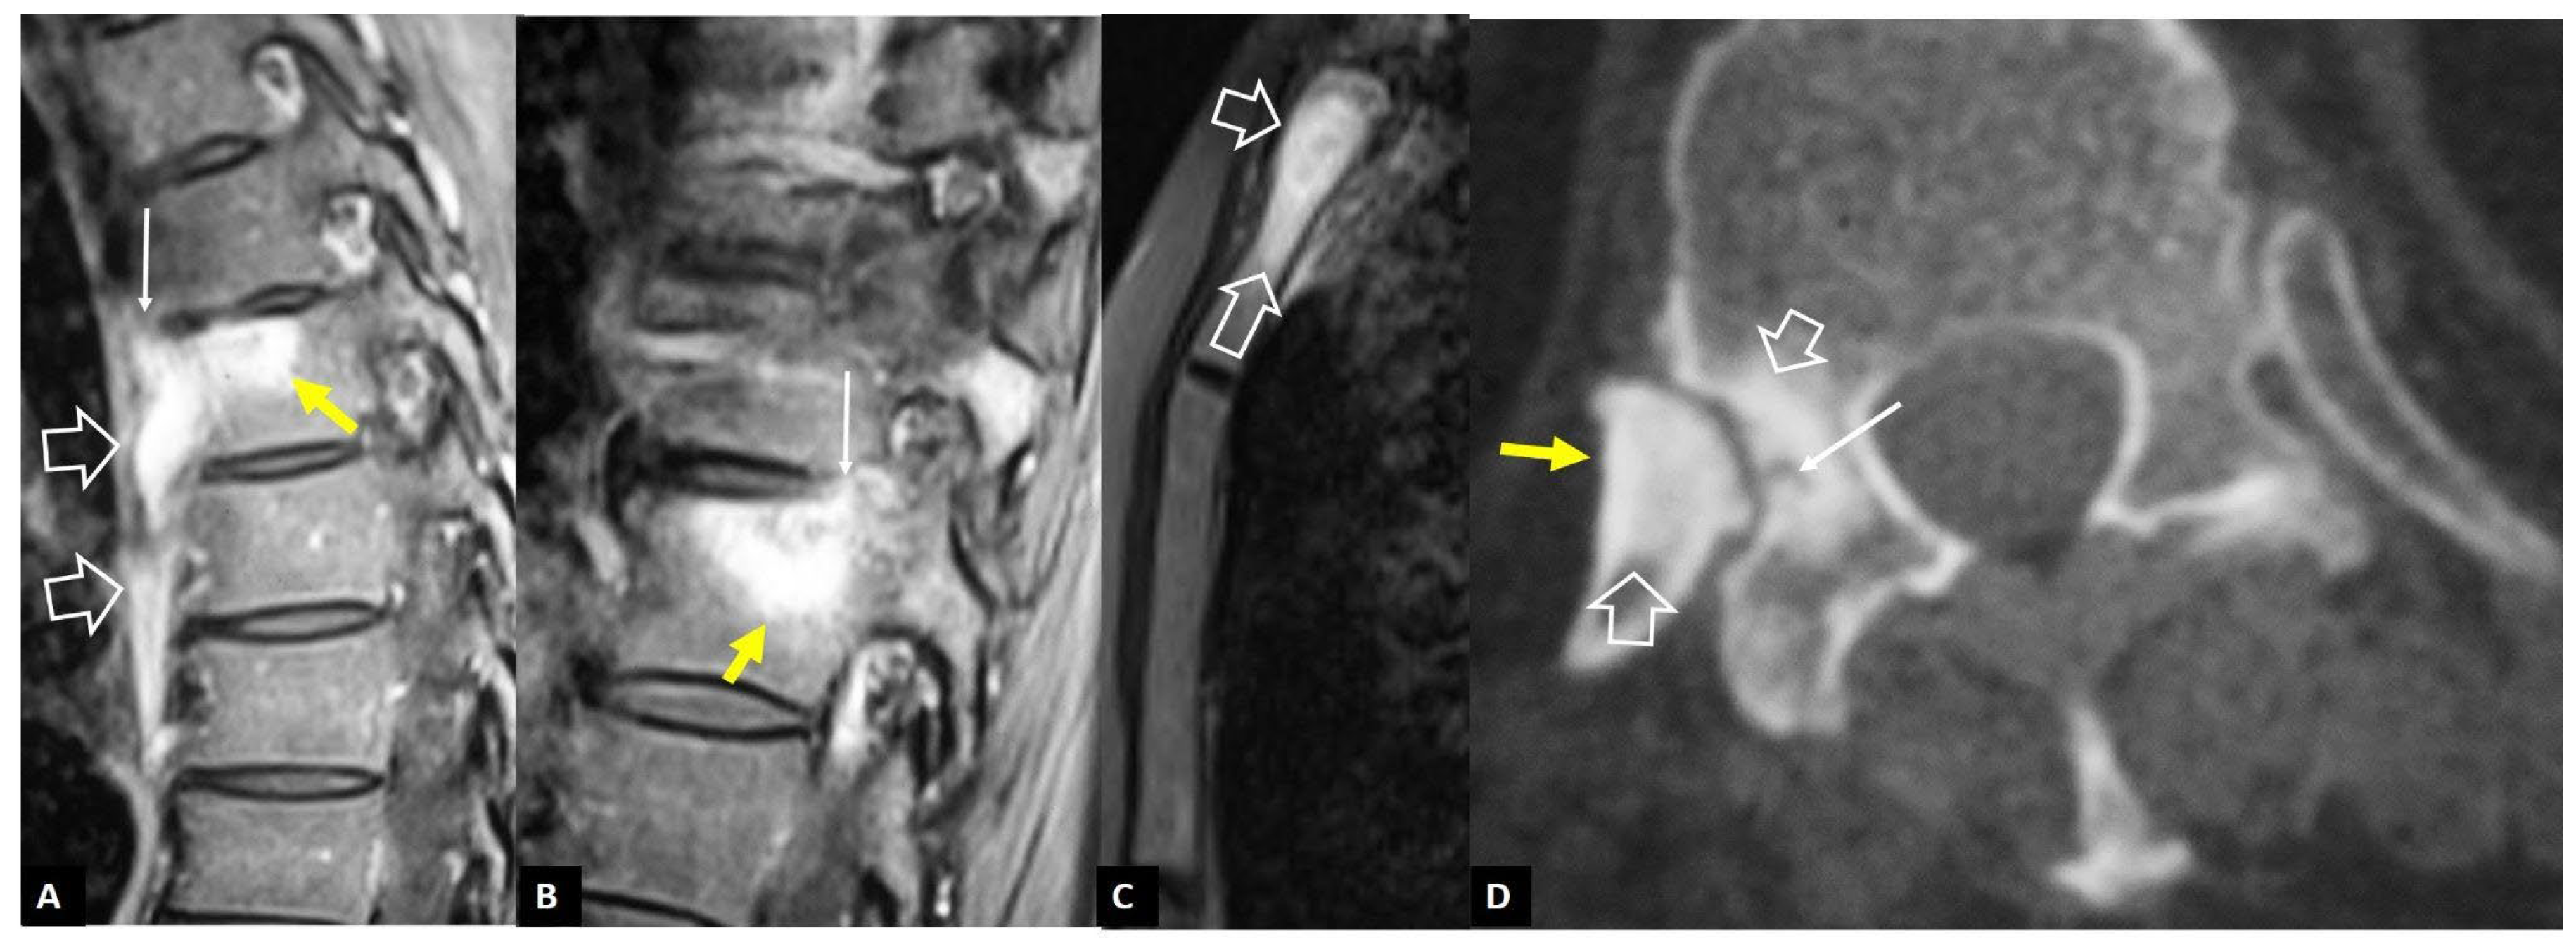
Figure 7.
A 65-year-old chronic renal failure female patient, undergoing hemodialysis for 12 years. She has been complaining of neck pain for 6 months. Axial CT showing osteolytic lesions (arrows) and osteosclerosis (open arrows) at C6 vertebra.
Figure 7.
A 65-year-old chronic renal failure female patient, undergoing hemodialysis for 12 years. She has been complaining of neck pain for 6 months. Axial CT showing osteolytic lesions (arrows) and osteosclerosis (open arrows) at C6 vertebra.
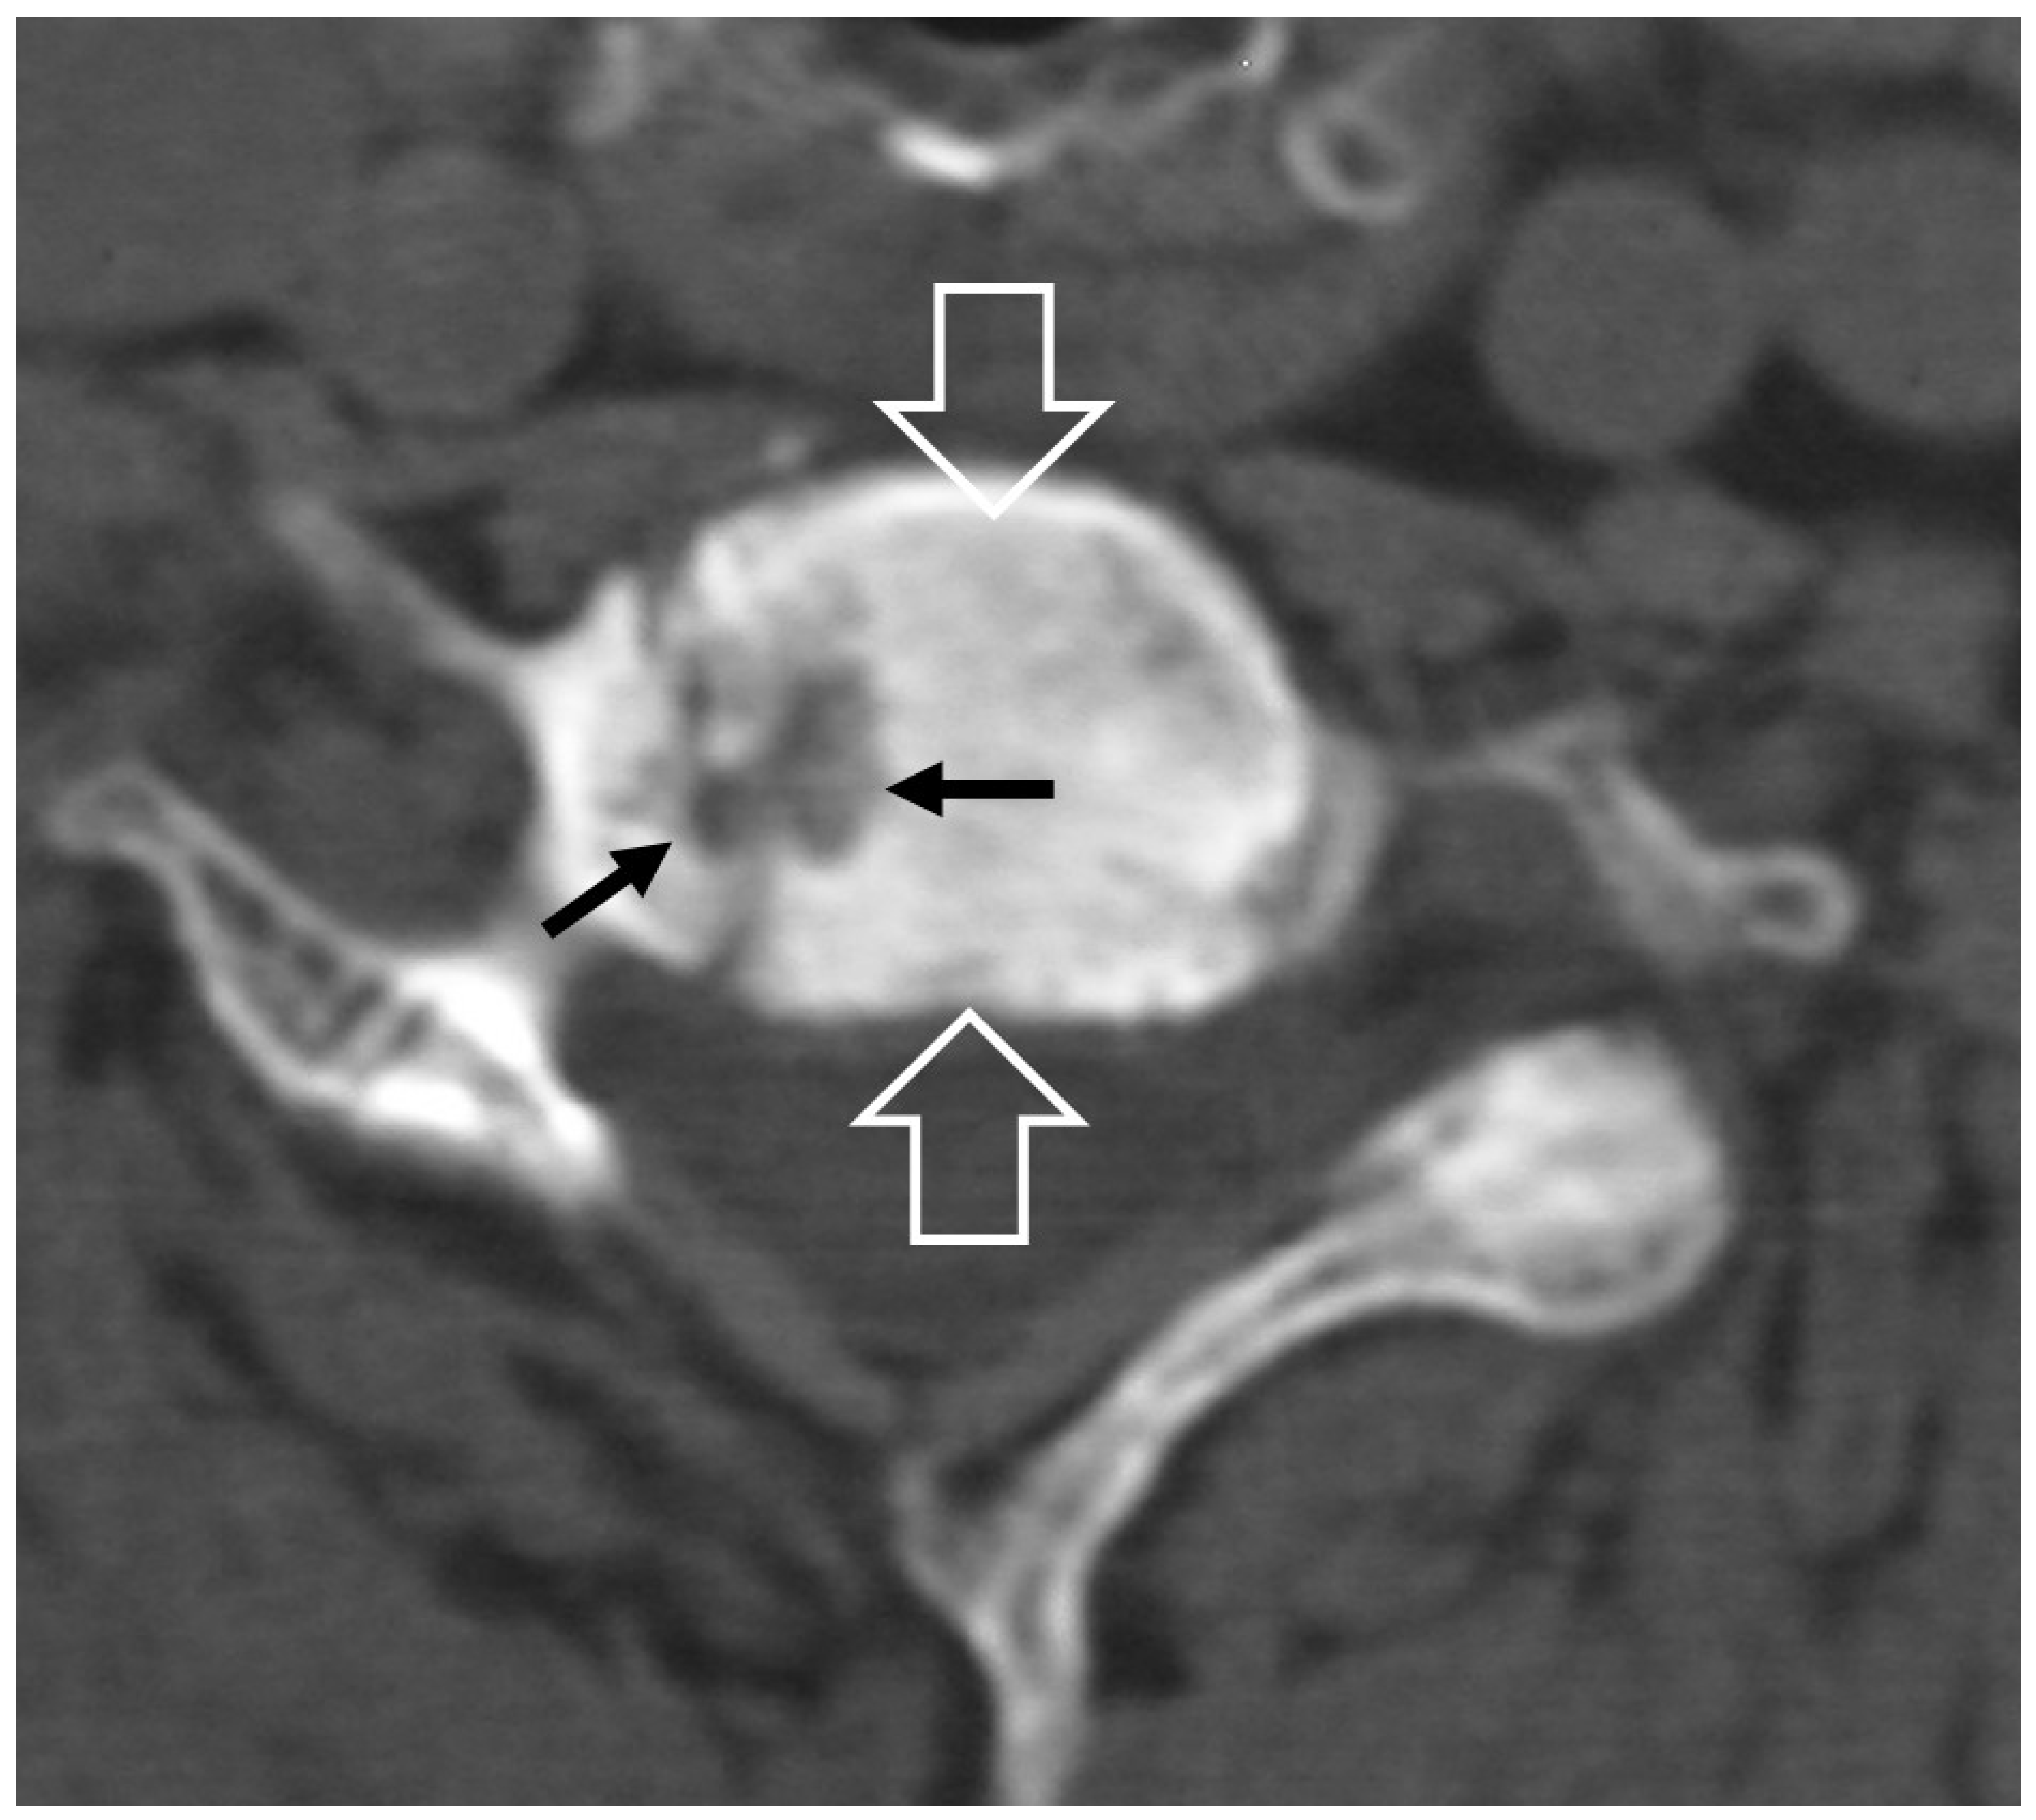
Figure 8.
Hydroxyapatite crystal deposition disease. Sagittal T1-w (A), STIR (B) and fat suppressed contrast enhanced T1-w (C) MR images showing bone marrow edema (arrows) in the C2 vertebra, abnormal paraspinal tissue, returning intermediate signal on T1-w and low on T2-w images (thin arrows) and enhancement of both the tissue and bone marrow edema (open arrows), in a 76-year-old female patient with intense neck pain. Sagittal (D) and axial (E,F) CT images in a 39-year-old female patient with intense neck pain, shows to better advantage the crystal deposition (arrows).
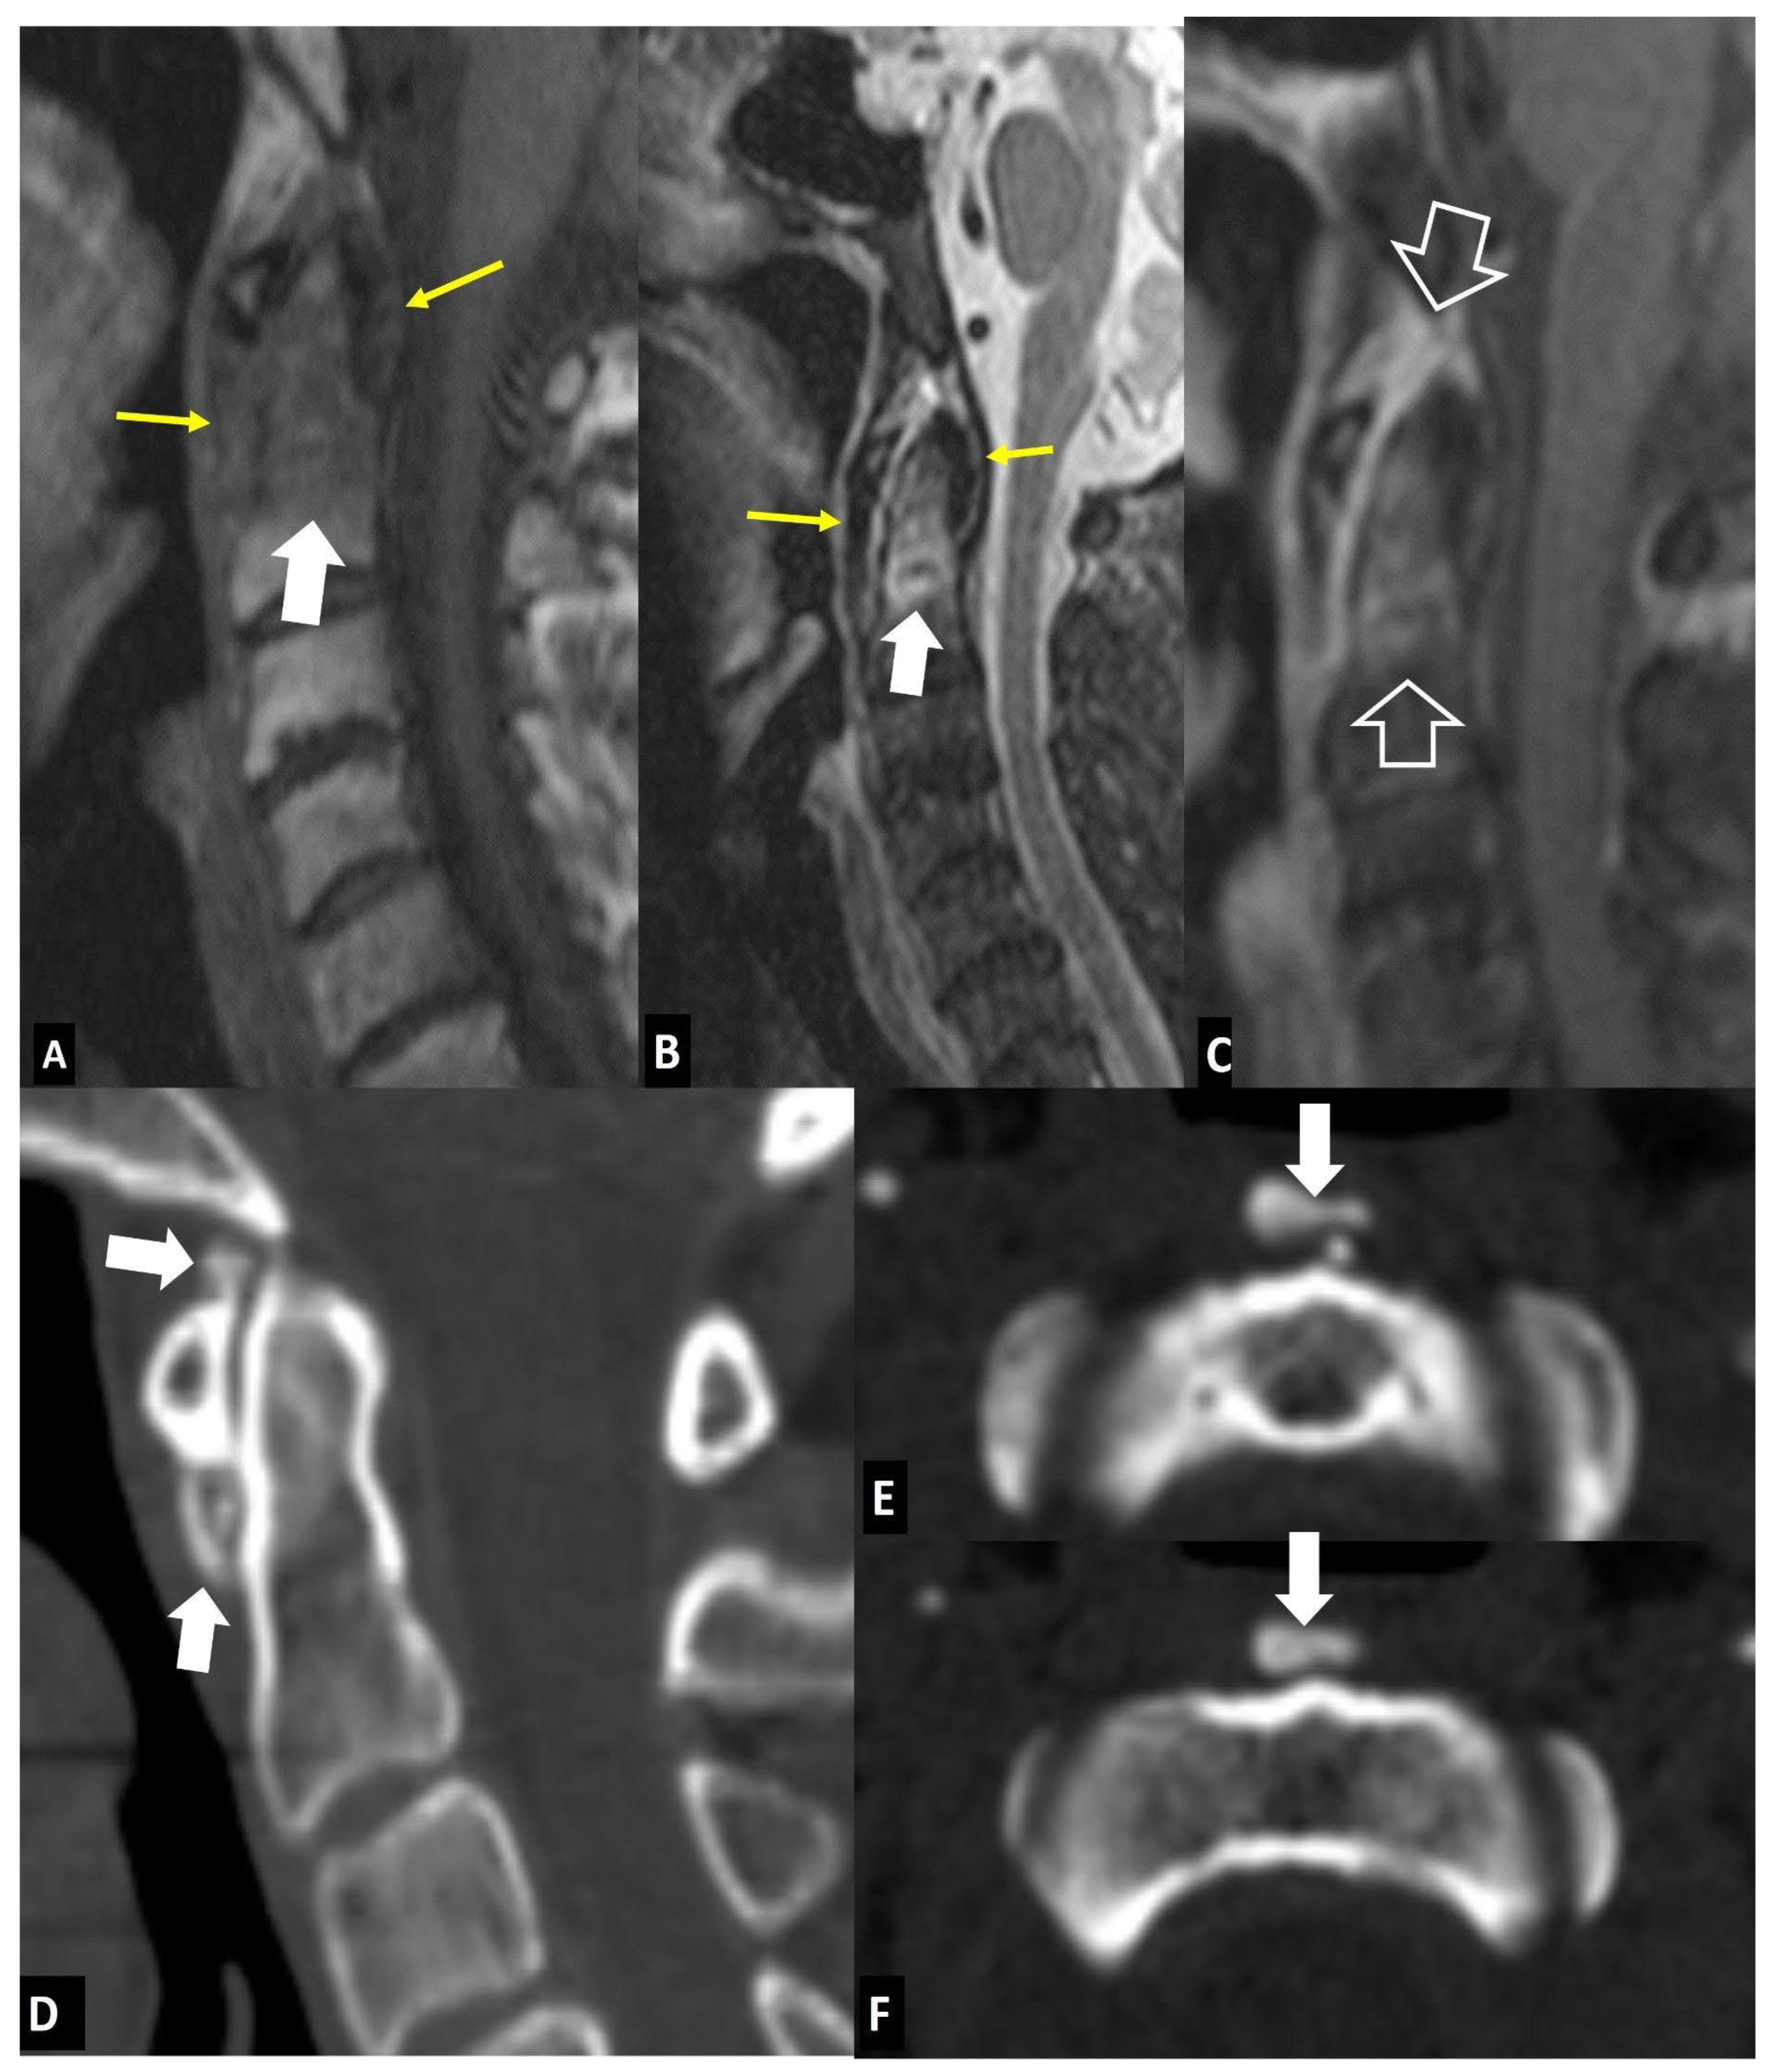
Figure 9.
“Crowned dens” syndrome in a 71-year-old female patient. Sagittal T1-w (A), STIR (B) and fat suppressed contrast enhanced T1-w (C) MR images showing bone marrow edema (arrows) in the C2 vertebra, abnormal paraspinal tissue, returning intermediate signal on T1-w and low on T2-w images (open arrows). Sagittal (D) and axial (E) CT images in a 85-year-old male patient with intense neck pain, shows to better advantage the crystal deposition (arrows).
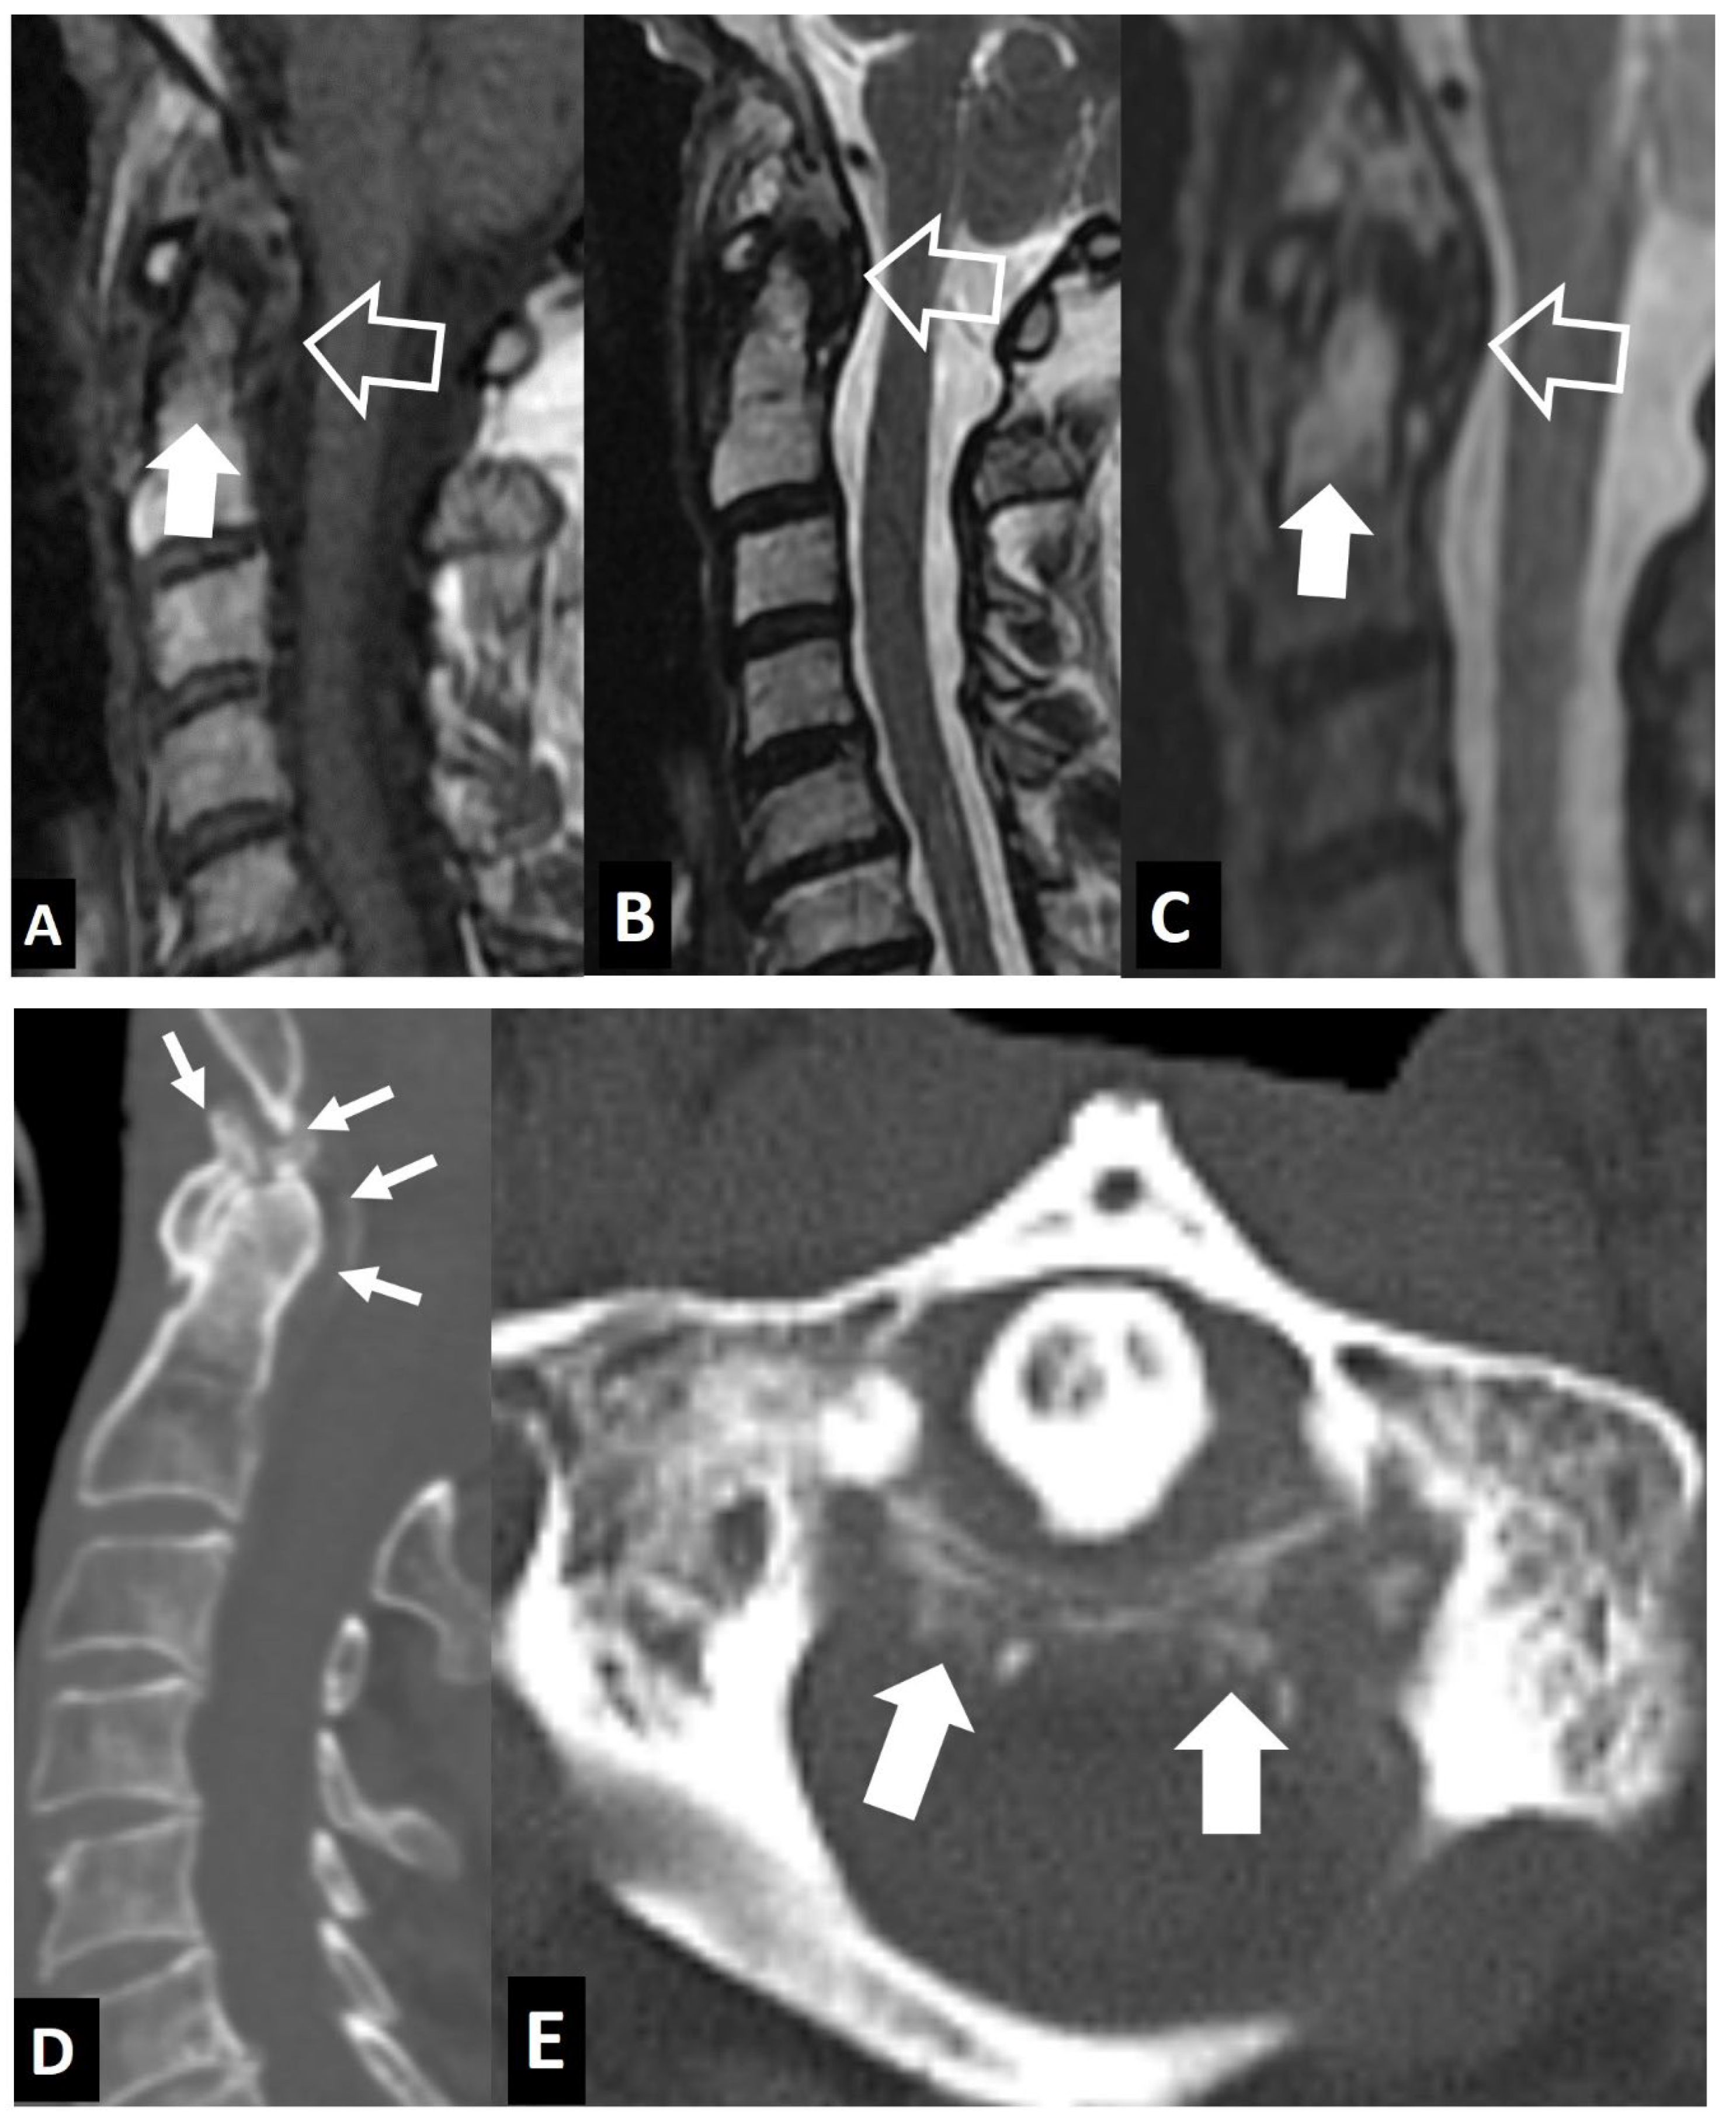
Figure 10.
Calcification of intervertebral disc and ossification of posterior longitudinal ligament in 7-year-old girl presenting with central and left sided neck pain since 2 weeks with moderate alleviation with analgesics. The biochemical work up showed ESR 65mm/h (normal up to 20), CRP 12 mg/L (normal <5) and normal WBC. A. Sagittal T1-w (left), T2-w (center) and STIR (right) MR images showing the low signal intensity within the disc T2-T3 (arrows), the low signal and thickening of the posterior longitudinal ligament (thin arrows) and the bone marrow edema within the T4 vertebral body (open arrows). B. CT reconstructions in the sagittal (left) and coronal (center, right) showing the intervertebral T2-T3 disc calcification (arrows) and the ossification of the posterior longitudinal ligament (open arrows) at the T4 vertebra and the T4-T5 intervertebral space.
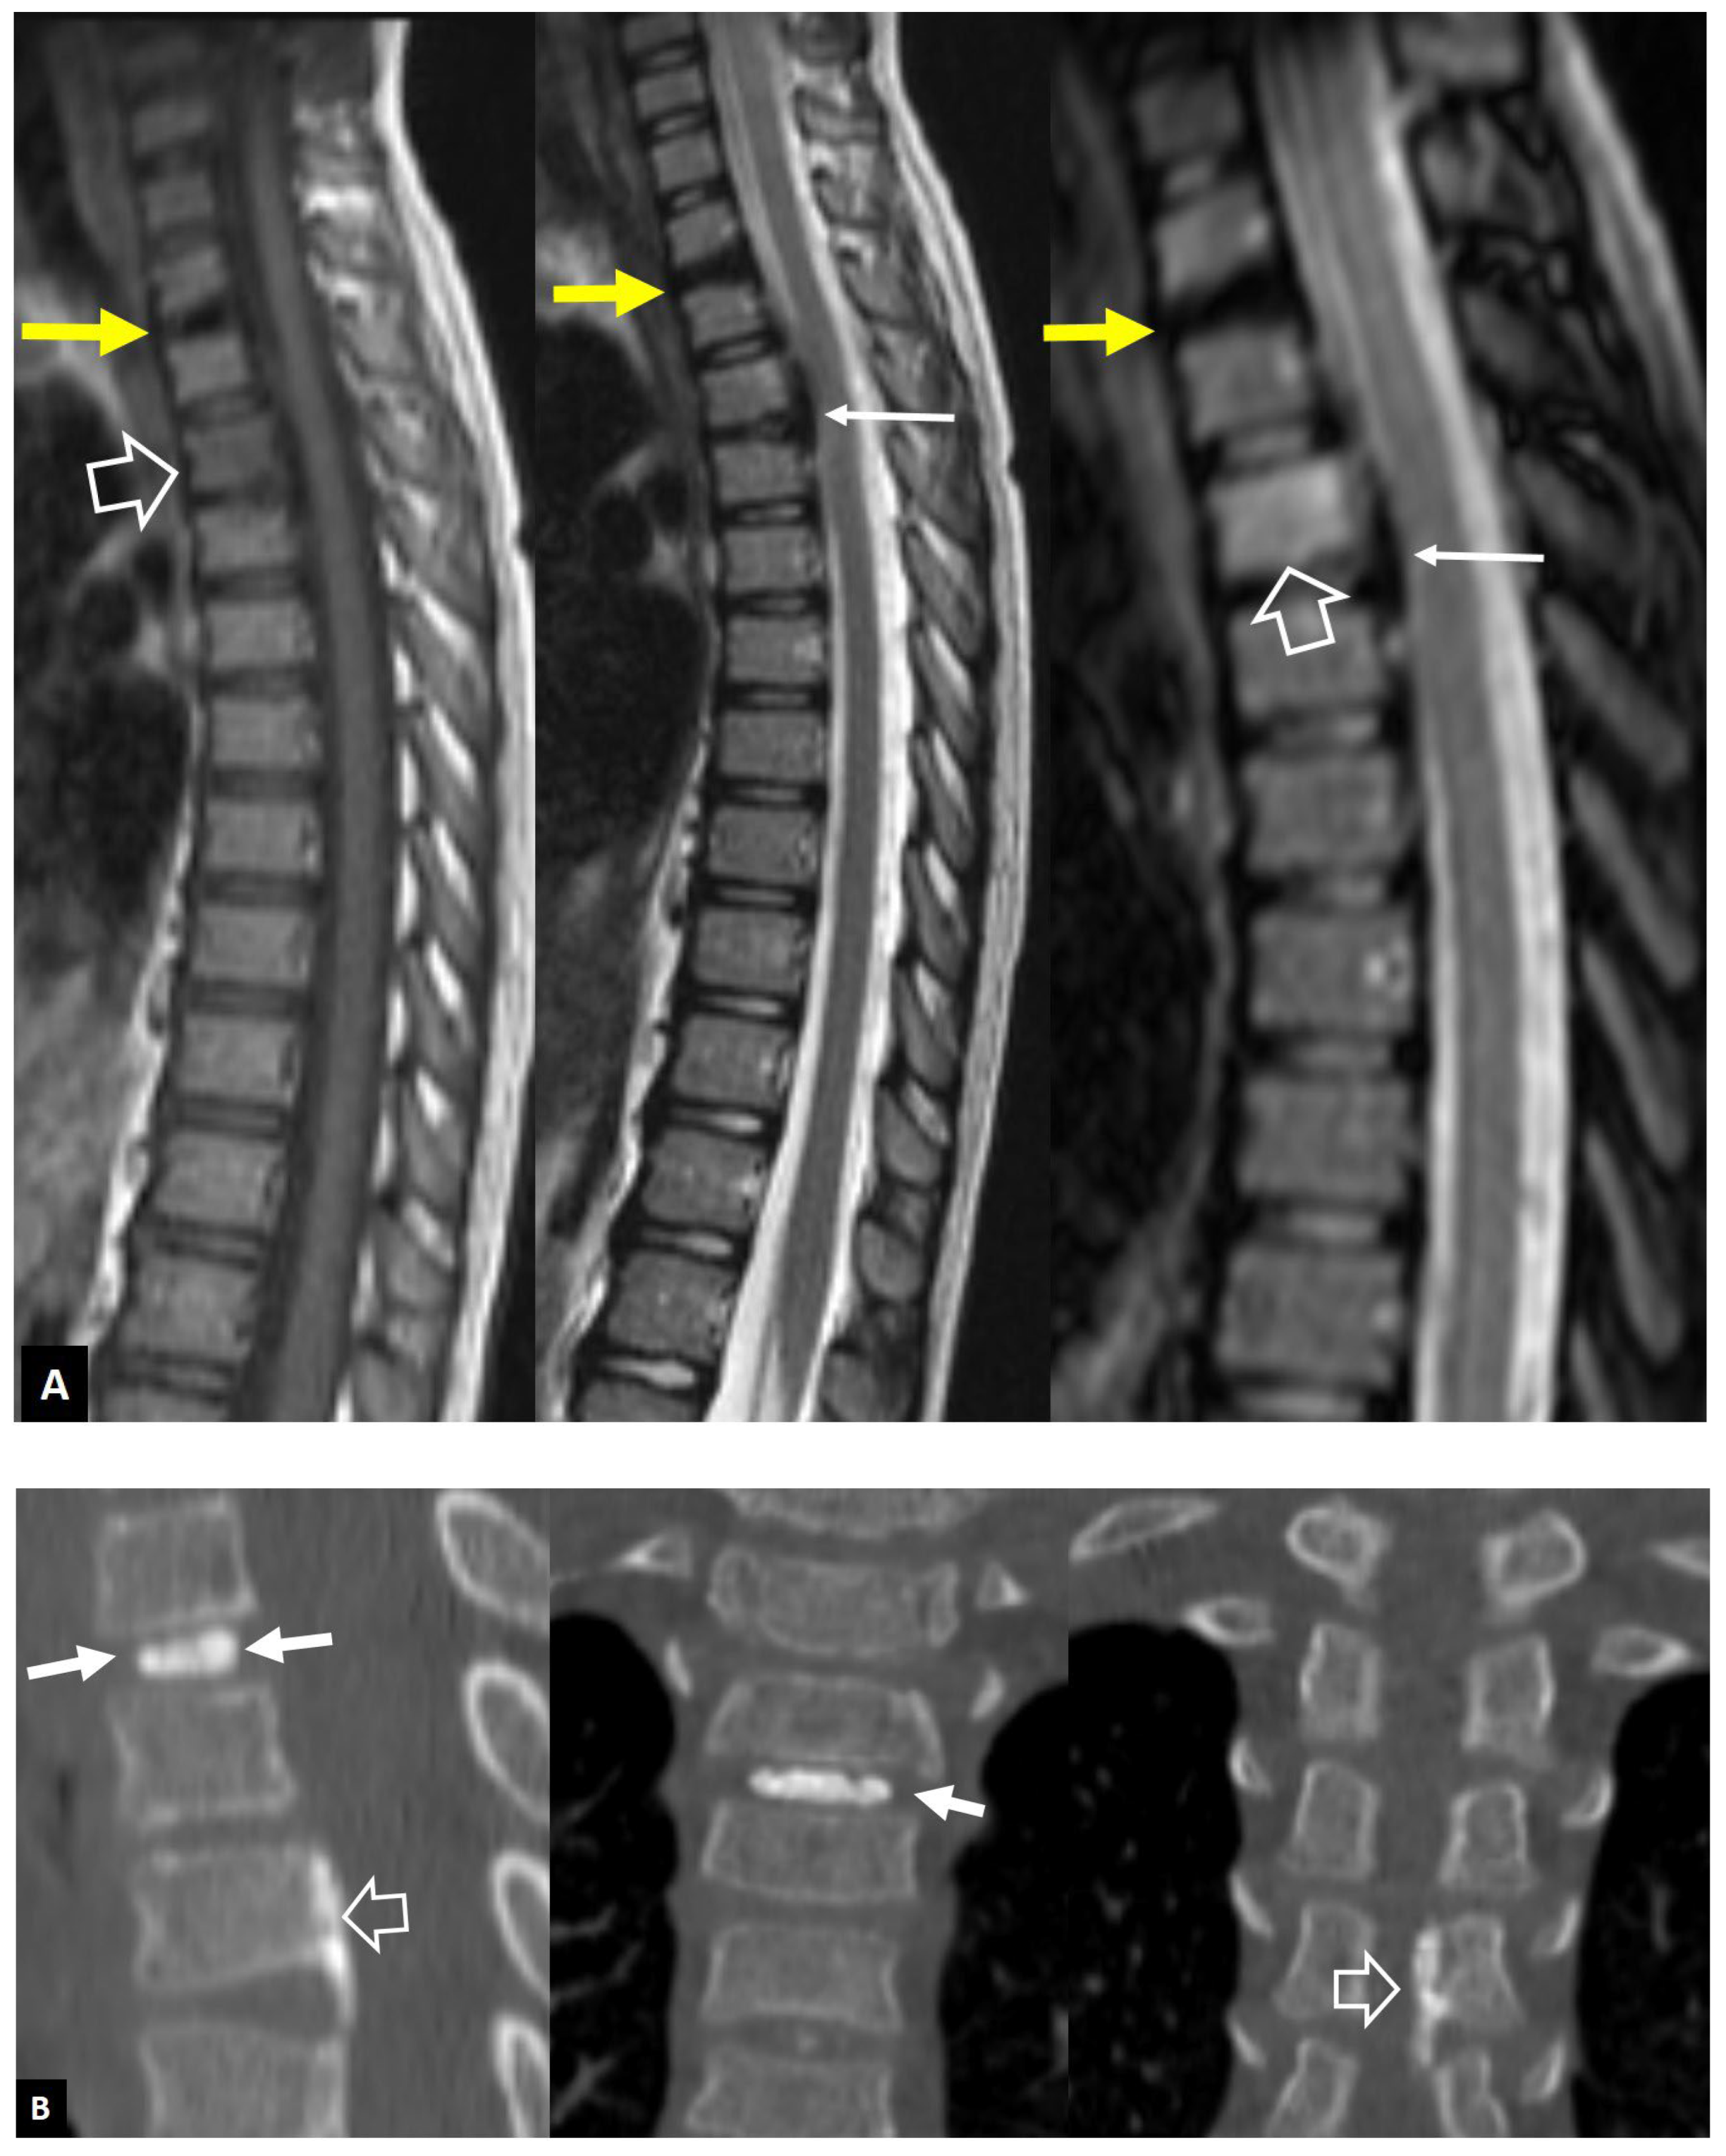
Figure 11.
A 45-year-old male with complete resolution of symptoms following a L5 laminotomy and L5-S1 discectomy operation 6 weeks prior to imaging. Sagittal T2-w (A), T1-w (B) and contrast-enhanced T1-w (C) MR images showing bone marrow edema (white arrows) and L5-S1 disc abnormal signal and enhancement (red arrows), simulating disc herniation. A device for intervertebral assisted motion is also shown (open arrows) with a non-infectious as proved with CT-guided aspiration, postoperative effusion caudally (thin long arrows).
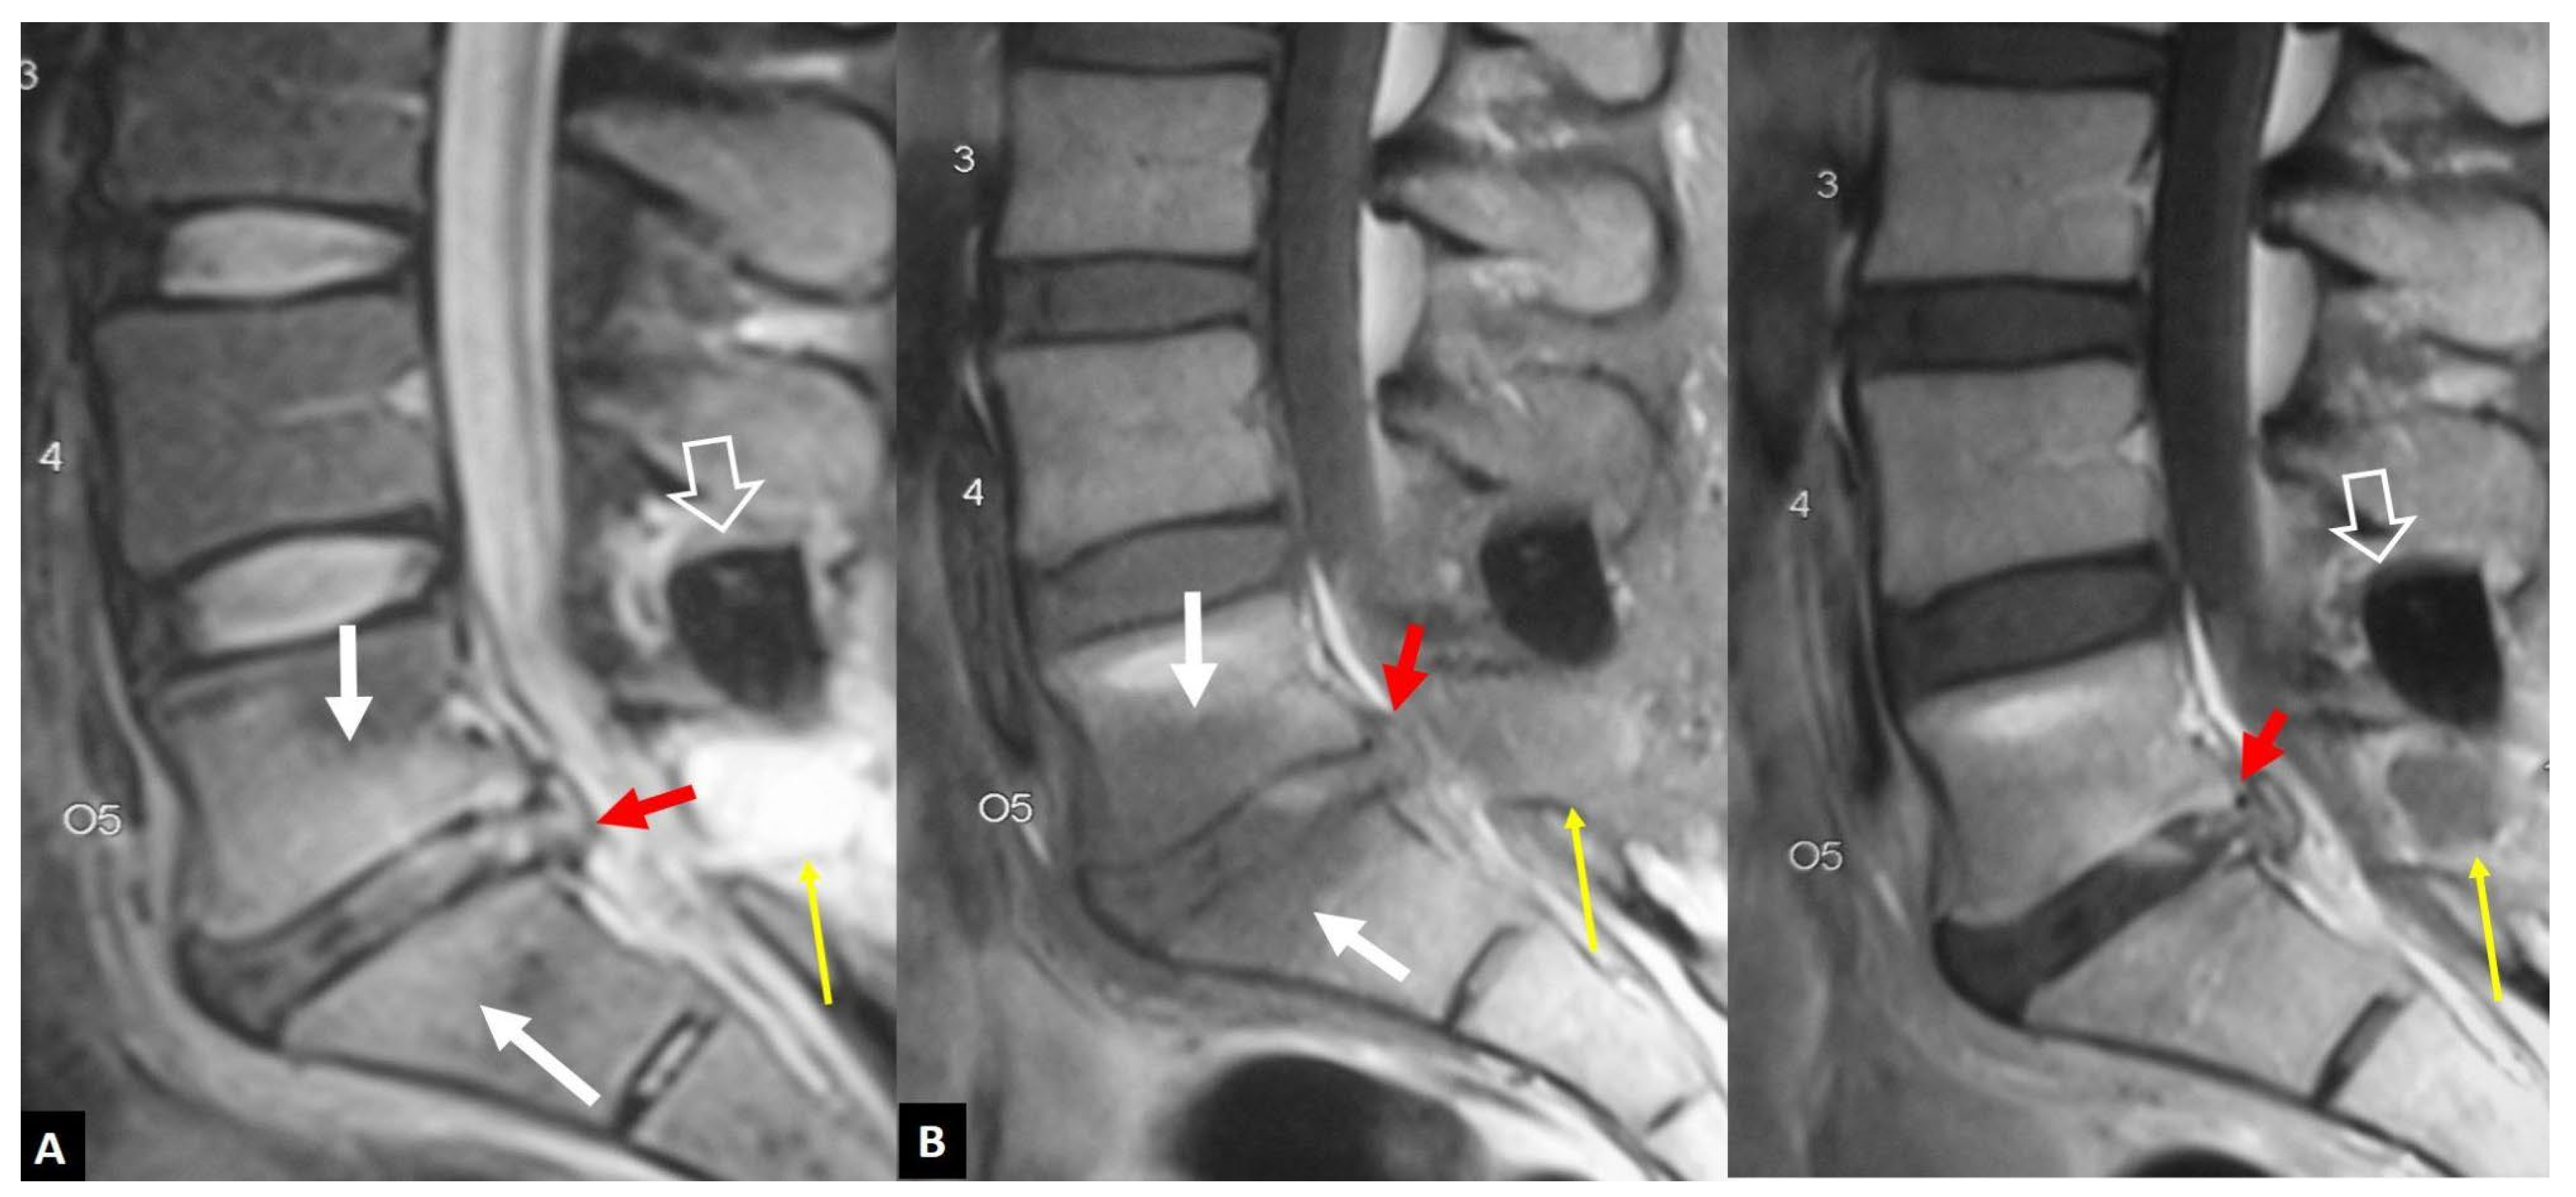
Figure 12.
A 67-year-old female with low back pain since 3 weeks, following a minor trauma. A recent DEXA showed osteoporosis. Sagittal (A) and left parasagittal (B) STIR MR images, and corresponding fat suppressed contrast-enhanced T1-w MR image (C,D), showing bone marrow edema on both sides of the L3-L4 disc space with enhancement (open arrows). A “fluid” sign (yellow arrow in A) and a linear delamination injury of the disc (arrows in a and b) do not show enhancement after contrast administration.
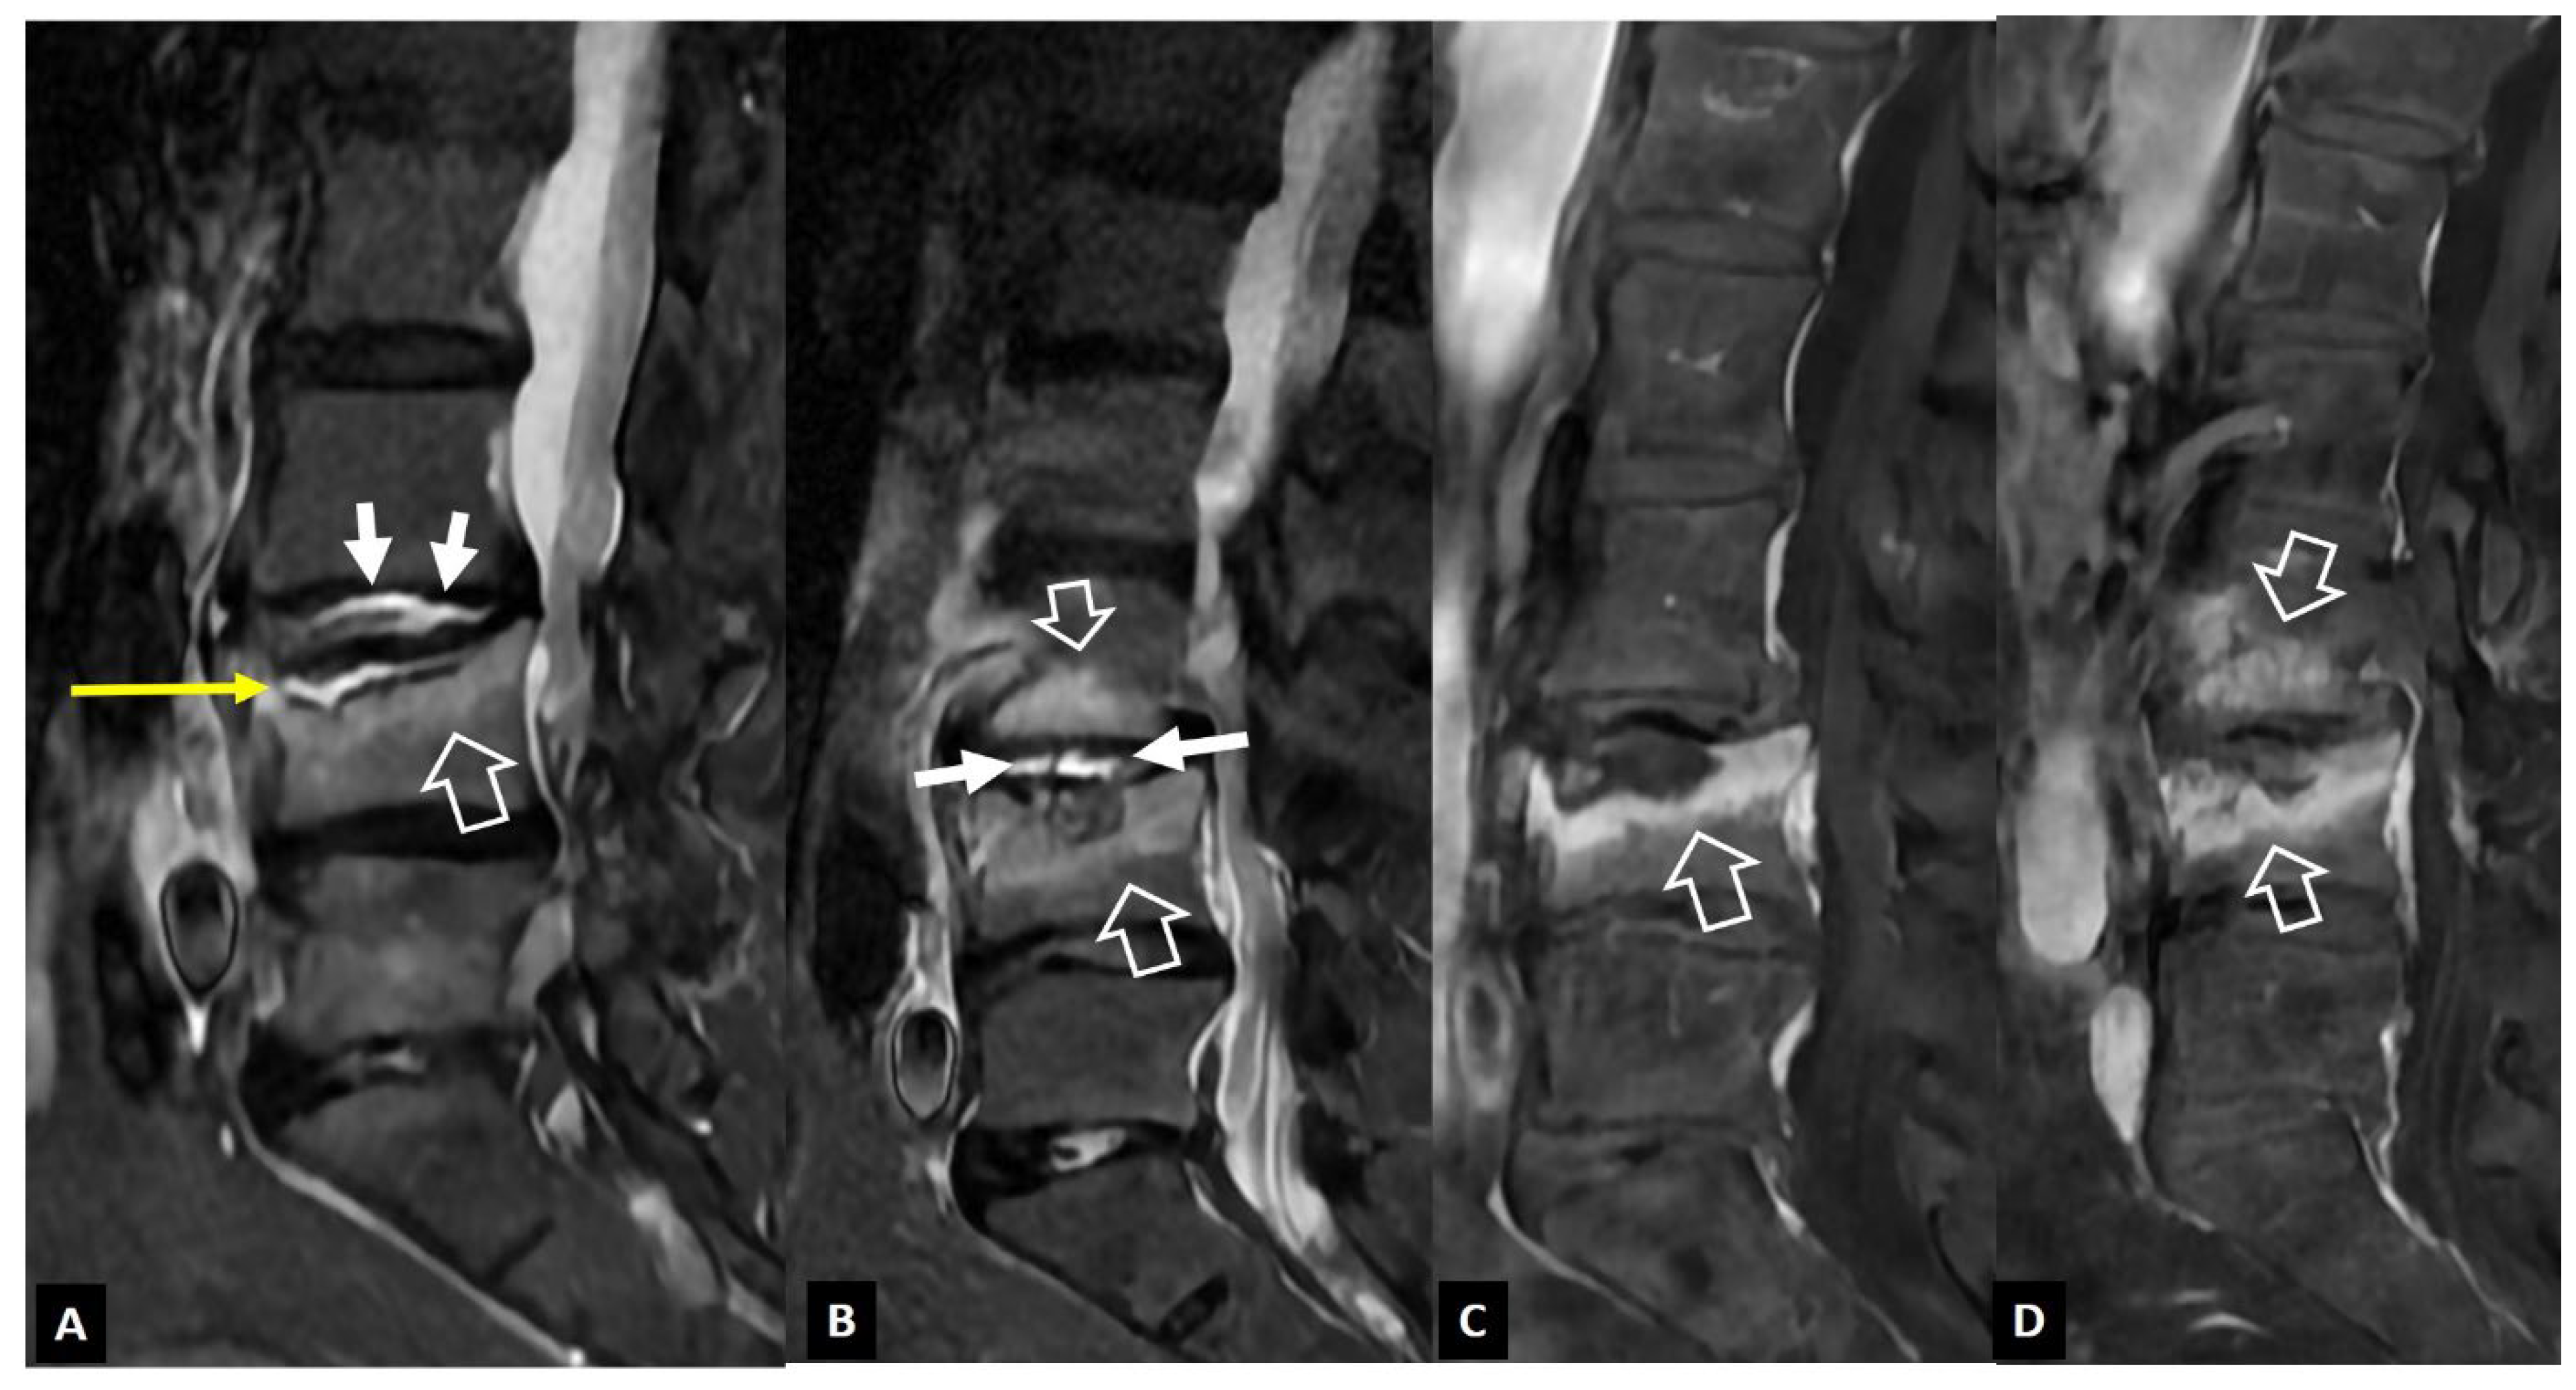
Figure 13.
A 48-year-old male elite biker with intense pain during training. Sagittal T1-w (A), and STIR (B) MR images, showing the Schmorl’s node within the C2 vertebra (thin arrows) and the surrounding bone marrow edema (open arrows). Clinical improvement was achieved with rest, painkillers and NSAIDs over 3 weeks.
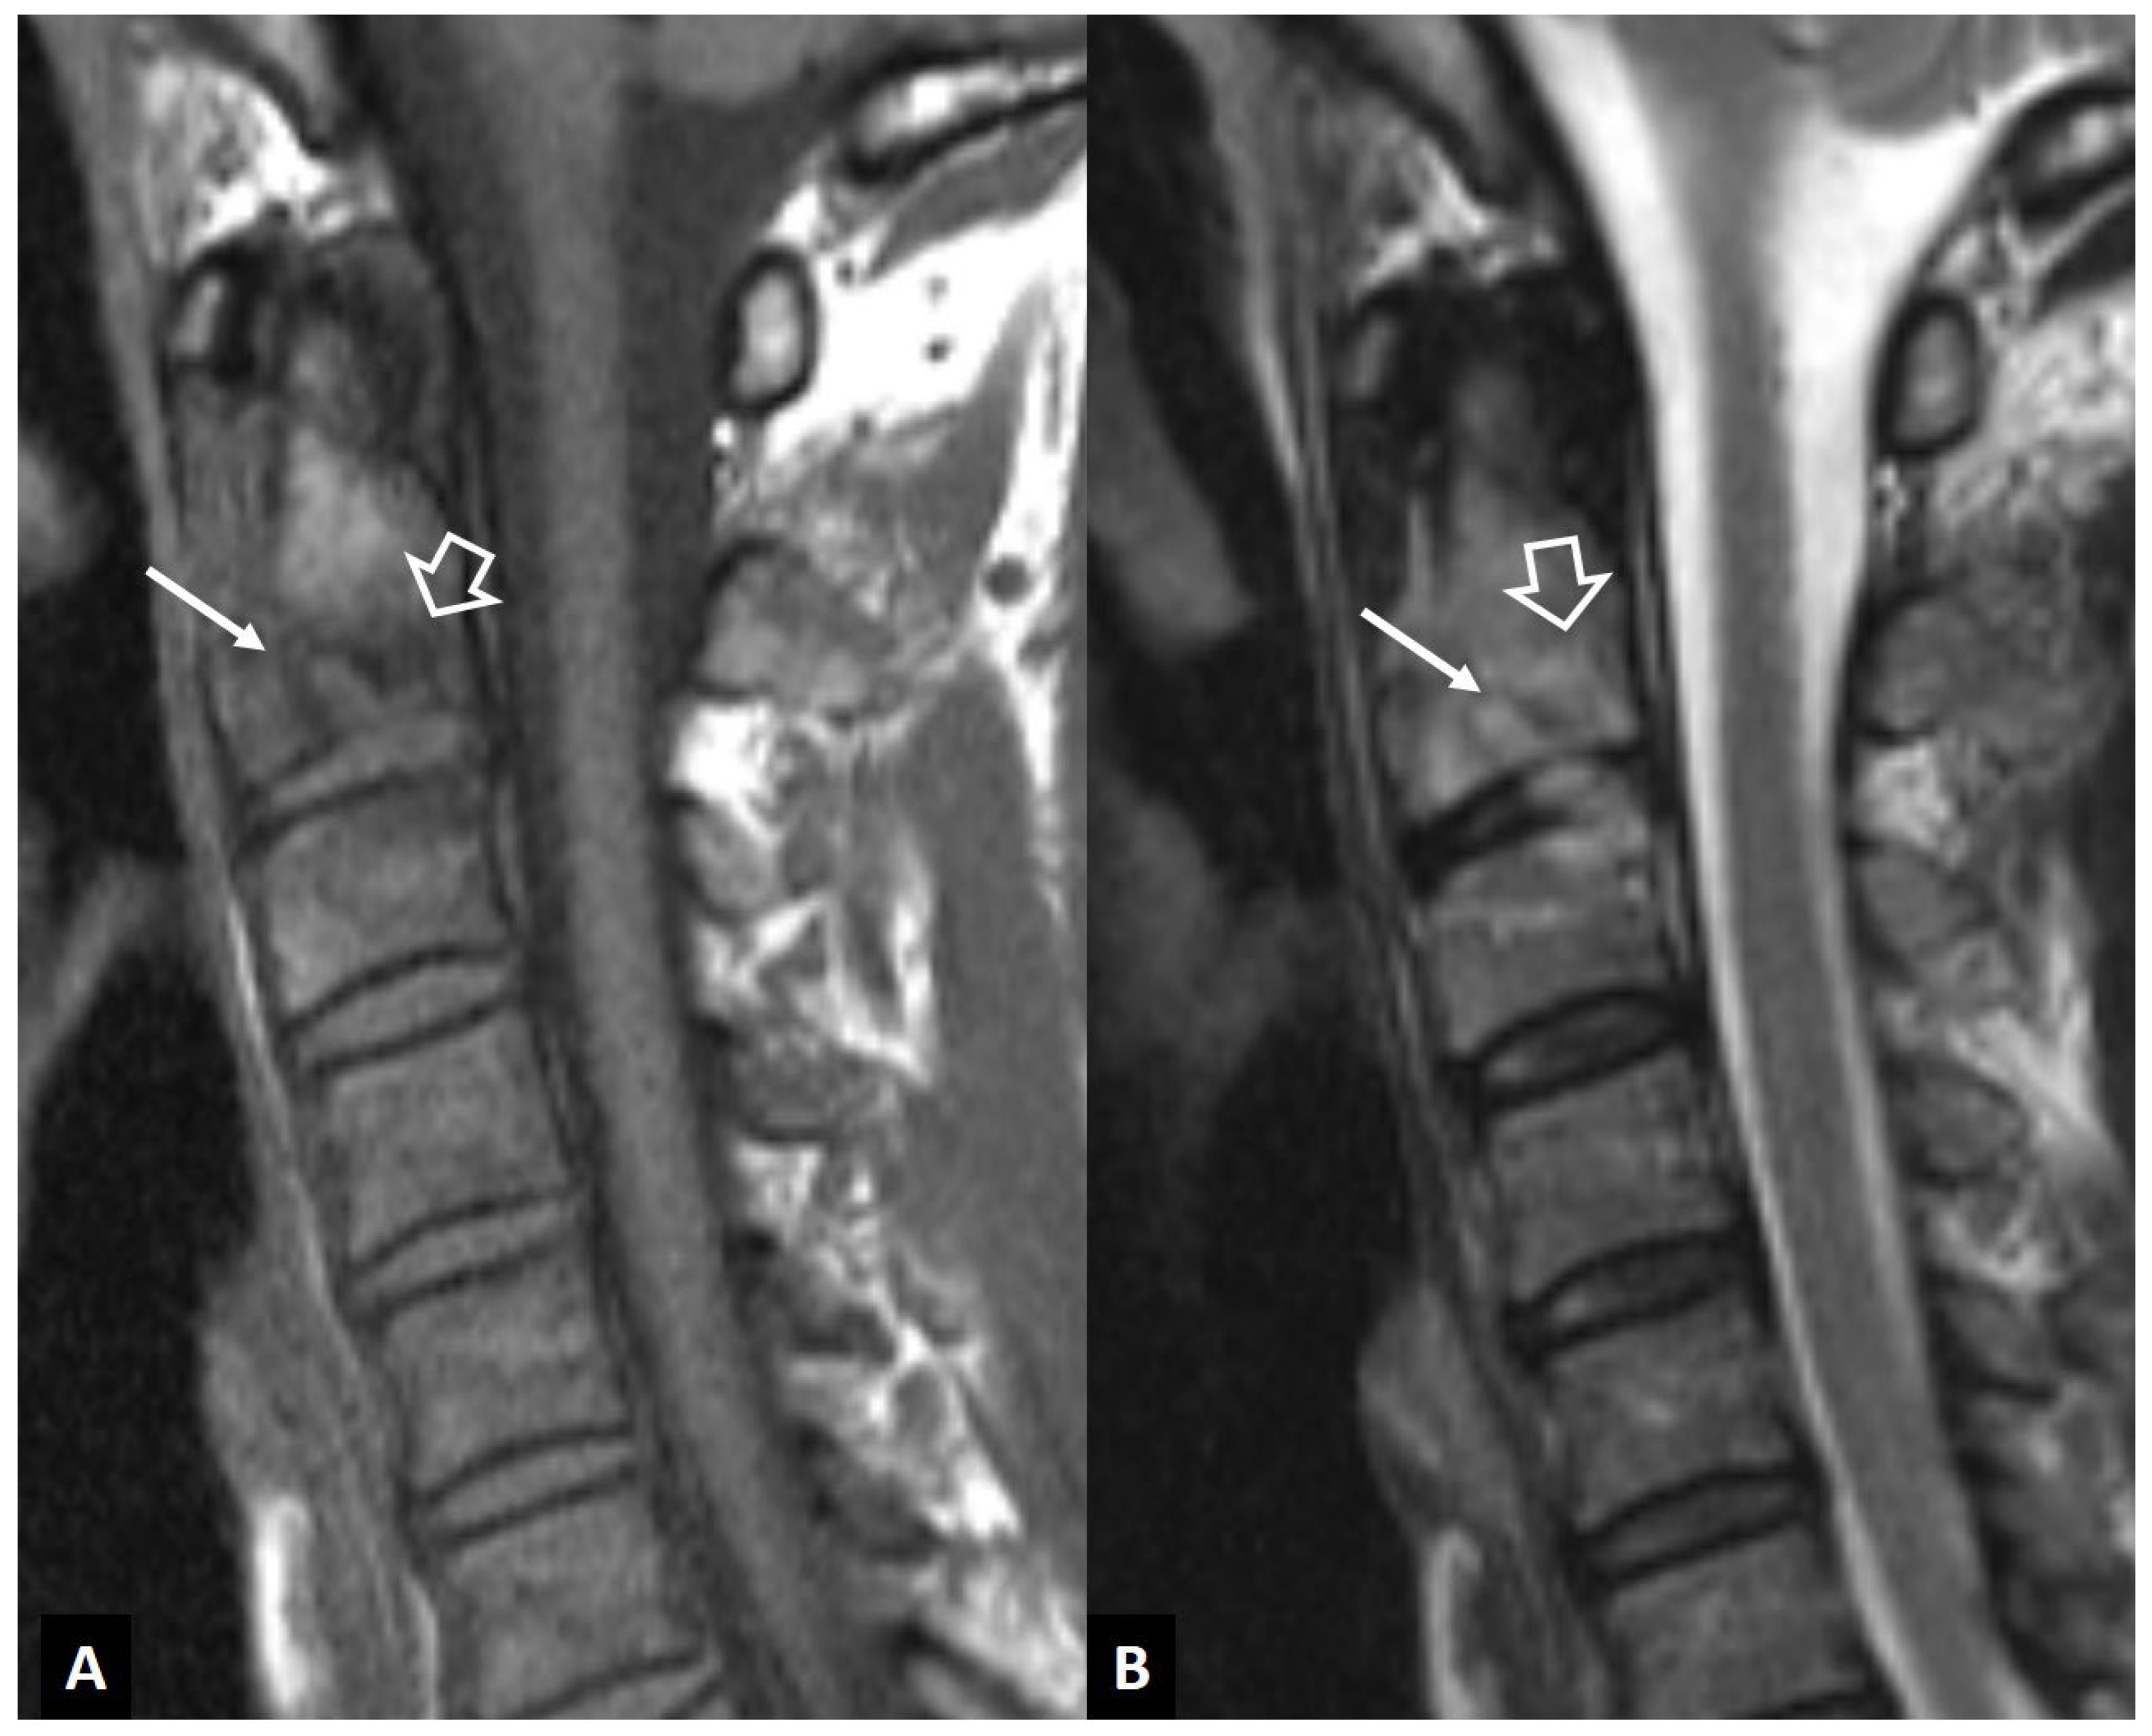
Figure 14.
A 71-year-old female patient with an old osteoporotic fracture of the L1 vertebral body. CT sagittal reconstruction showing fragmentation and osteosclerosis which may mimic tuberculous infection. The presence of gas within the osteonecrotic cavity under the endplate (arrow) suggests the correct diagnosis.
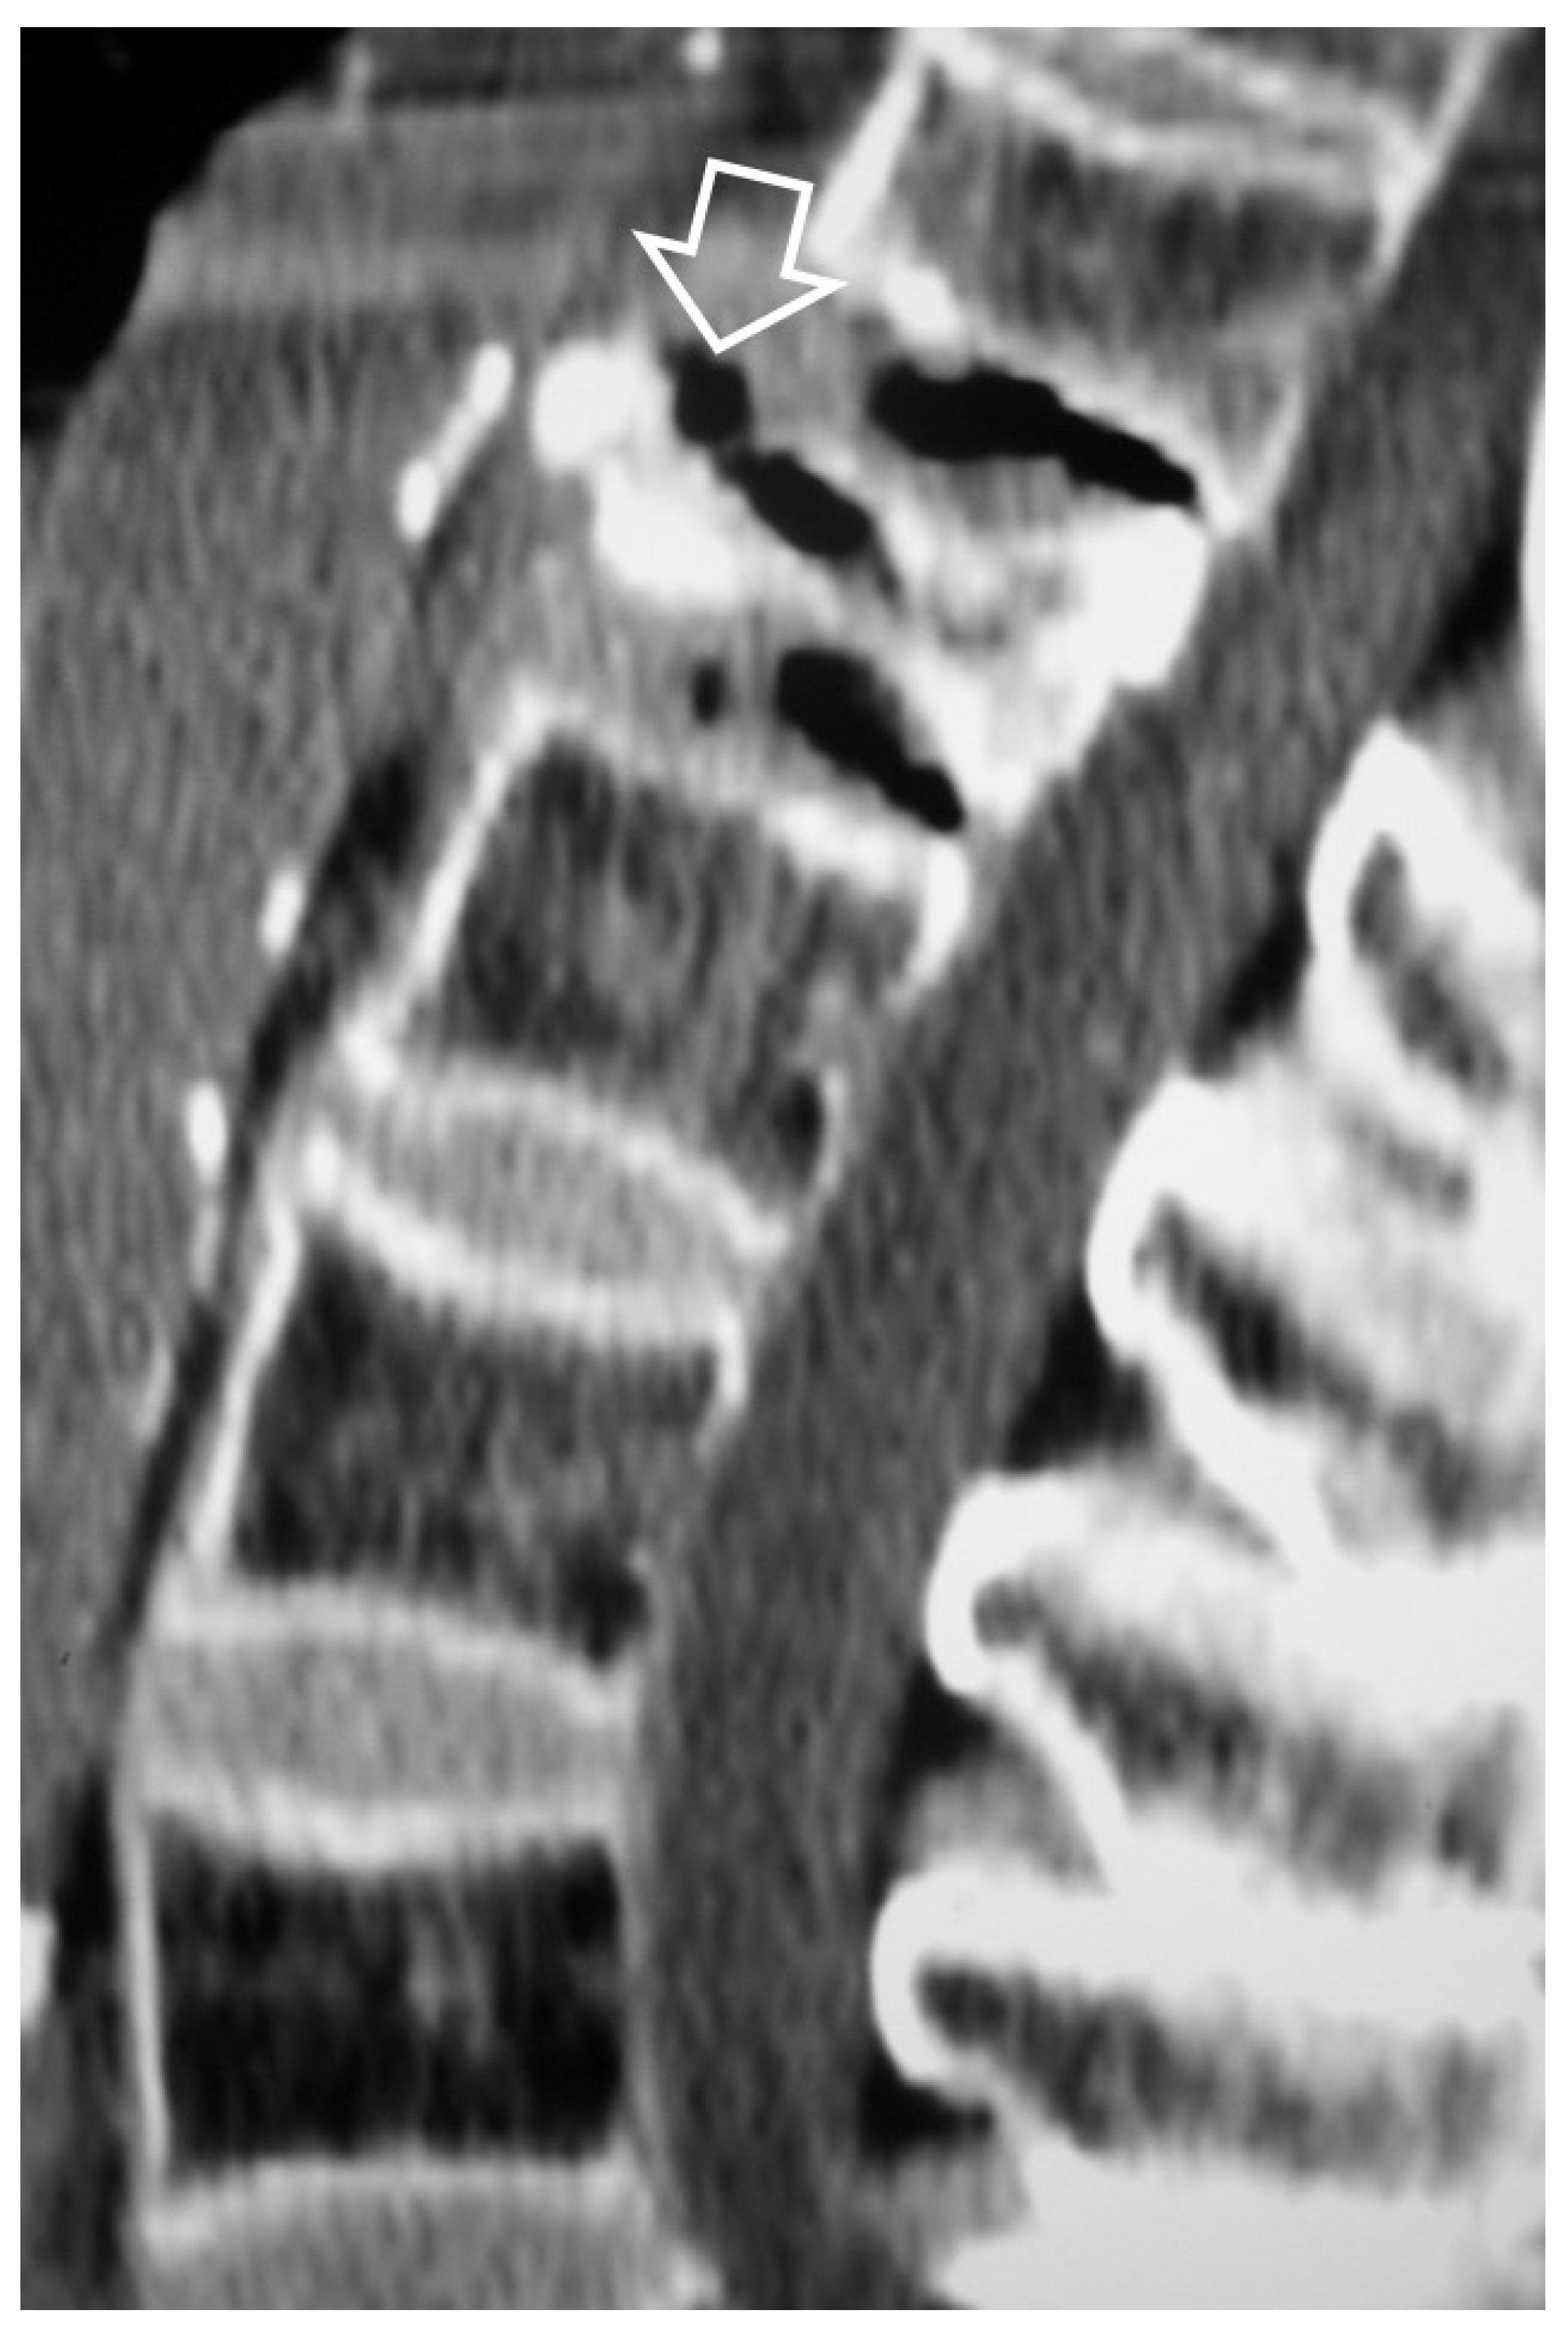
Figure 15.
A 64-year-old male patient with long lasting rheumatoid arthritis of the hands and wrists, and progressive onset of pain, increased reflexes and numbness in the arms and neck pain, 5 months prior to imaging. Sagittal MR images. A. T1-w image showing bone marrow edema in C2 vertebral body (open arrow), cortical disruption and soft tissue changes in the anterior odontoid process (thin arrow) and an intermediate signal intensity mass posterior to C2 (thick arrow), compressing the spinal cord. B. T2-w image showing to better advantage the bone marrow edema (open arrow), the low signal intensity mass posterior to C2 (arrow) suggesting pannus formation and a small area of edema within the spinal cord (long open arrow). C. The fat suppressed contrast enhanced T1-w image, showing enhancement of the bone marrow edema (open arrows) and the prevertebral changes (thin arrow). The pannus tissue is only peripherally enhancing (thick arrow).
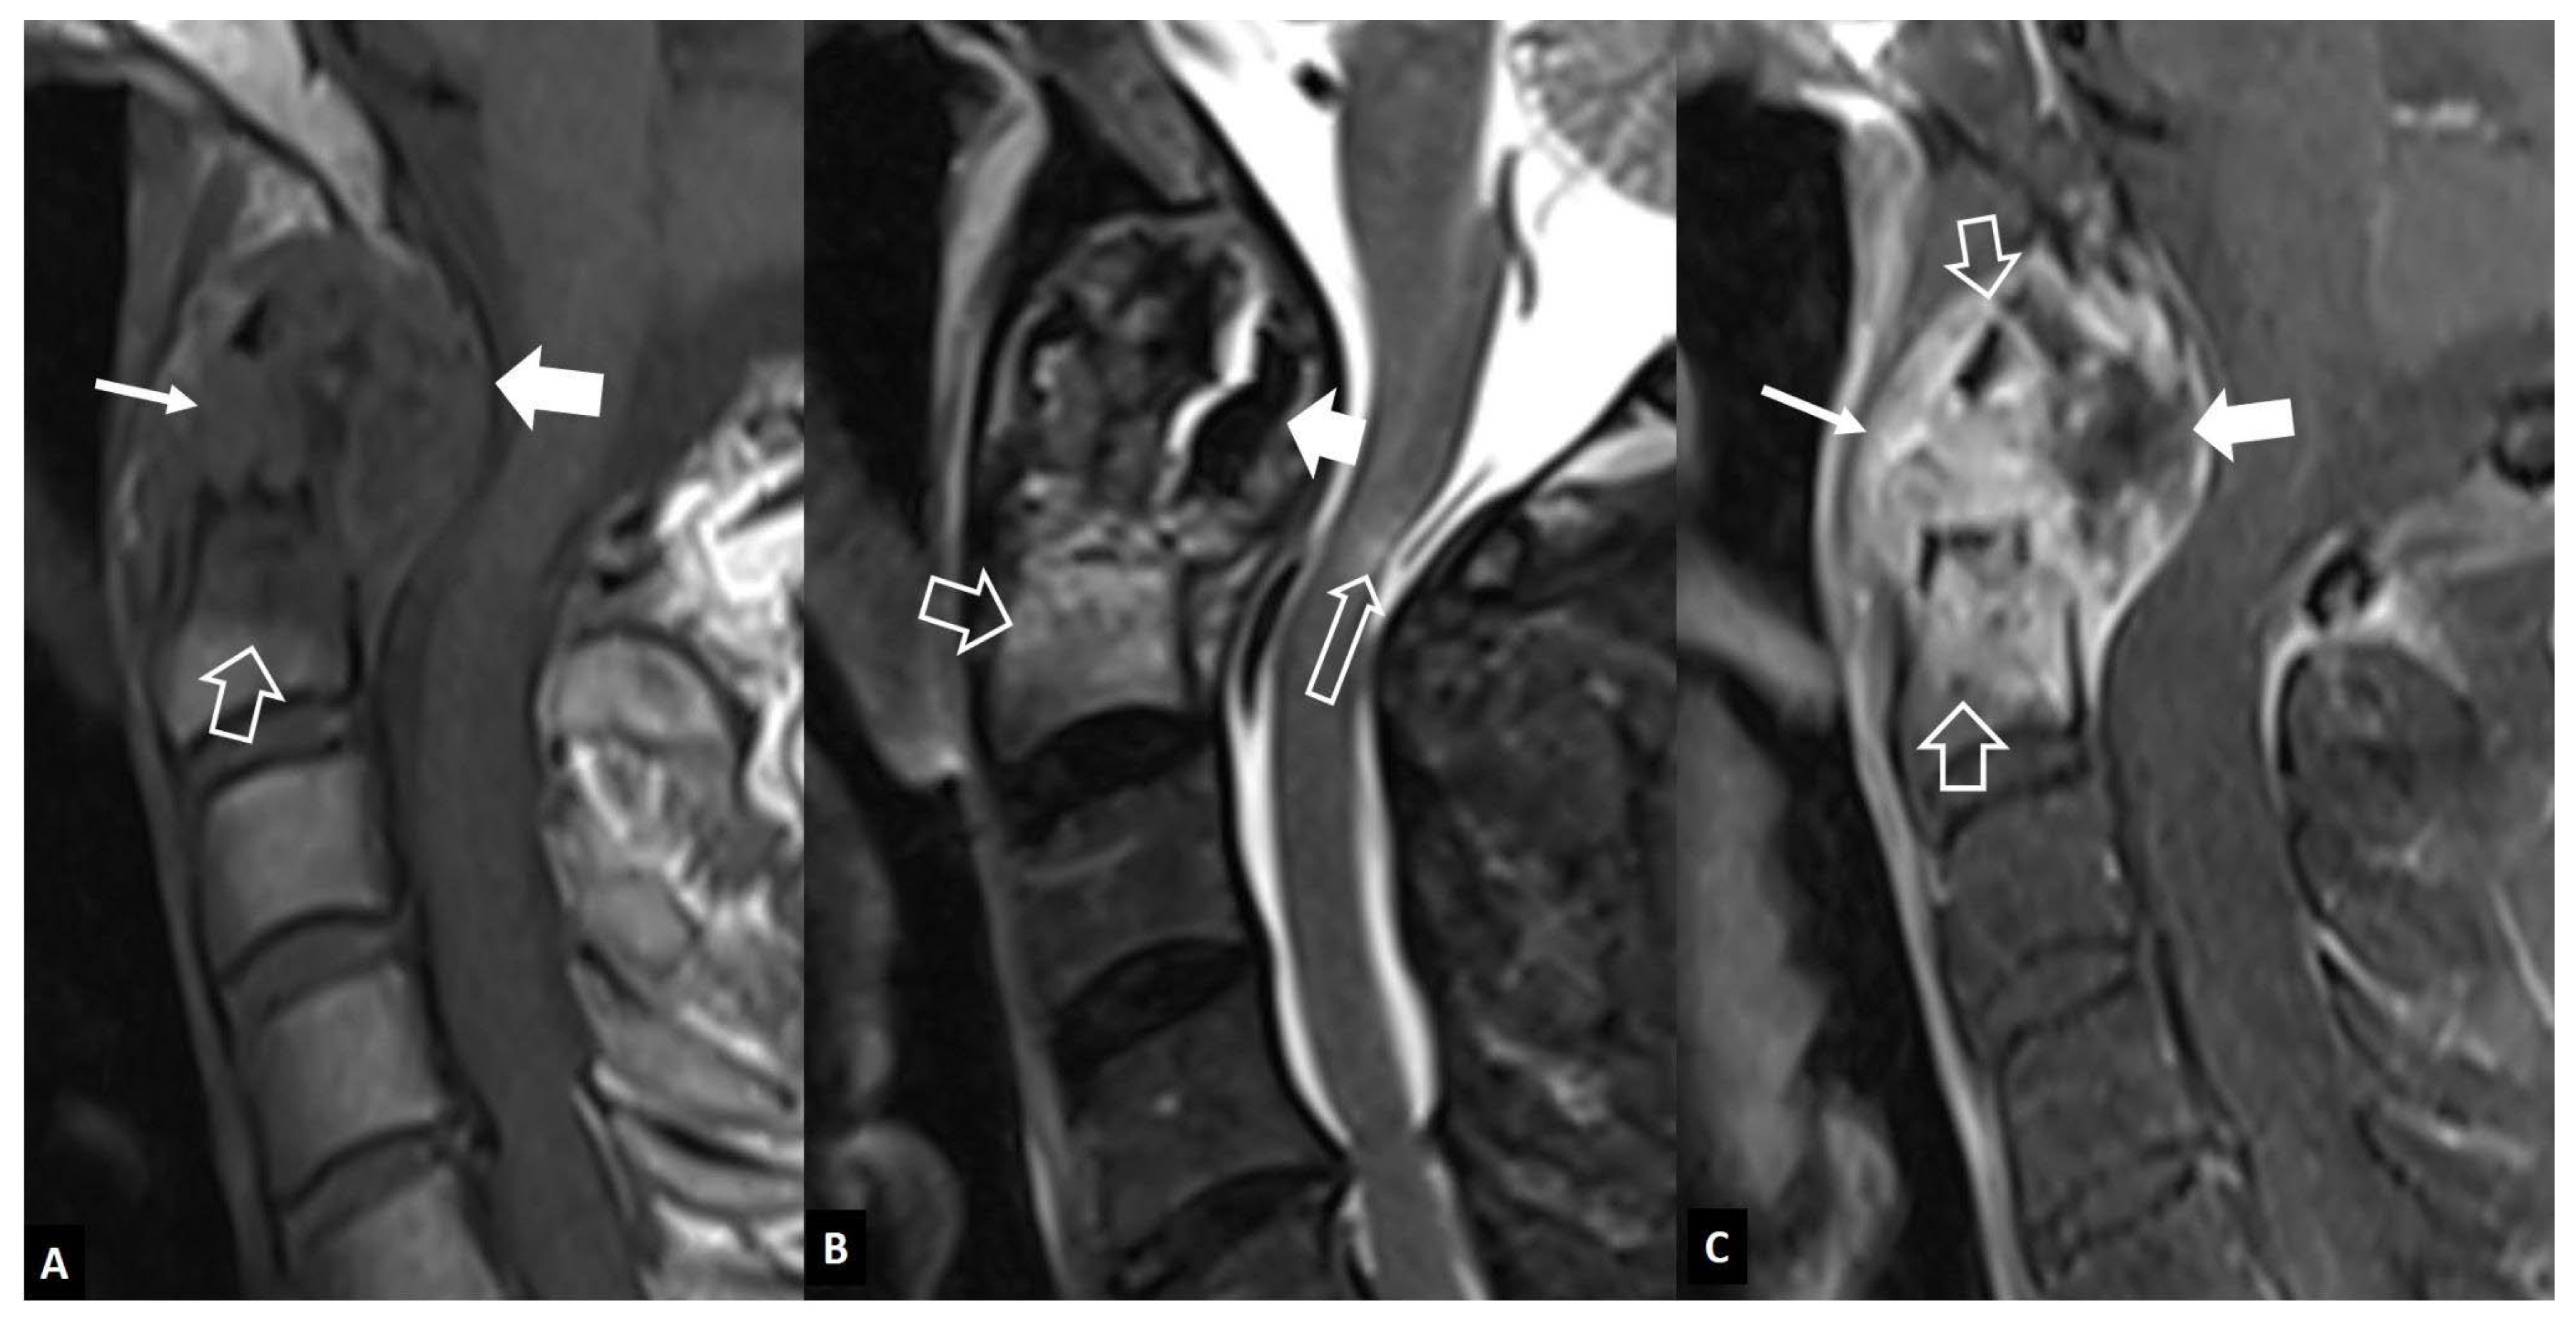
Figure 16.
Oblique coronal (A) and oblique axial (B) STIR MR mages in a 45-year-old male patient with infectious sacroiliitis, showing subarticular bone marrow edema (open arrows), high intra-articular signal intensity and soft tissue edema anterior to the joint (thin arrow). C. Oblique coronal fat suppressed contrast enhanced T1-w MR image in a 32-year-old female patient with psoriatic axial spondyloarthropathy, showing intra-articular enhancement (open arrows) and anterior capsulitis (arrow). D. Oblique axial STIR MR image in 24-year-old female patient with a history of Familial Mediterranean fever and recent respiratory tract infections, showing subarticular bone marrow edema (long open arrow) and high intra-articular signal intensity (short arrow), in keeping with reactive arthritis.
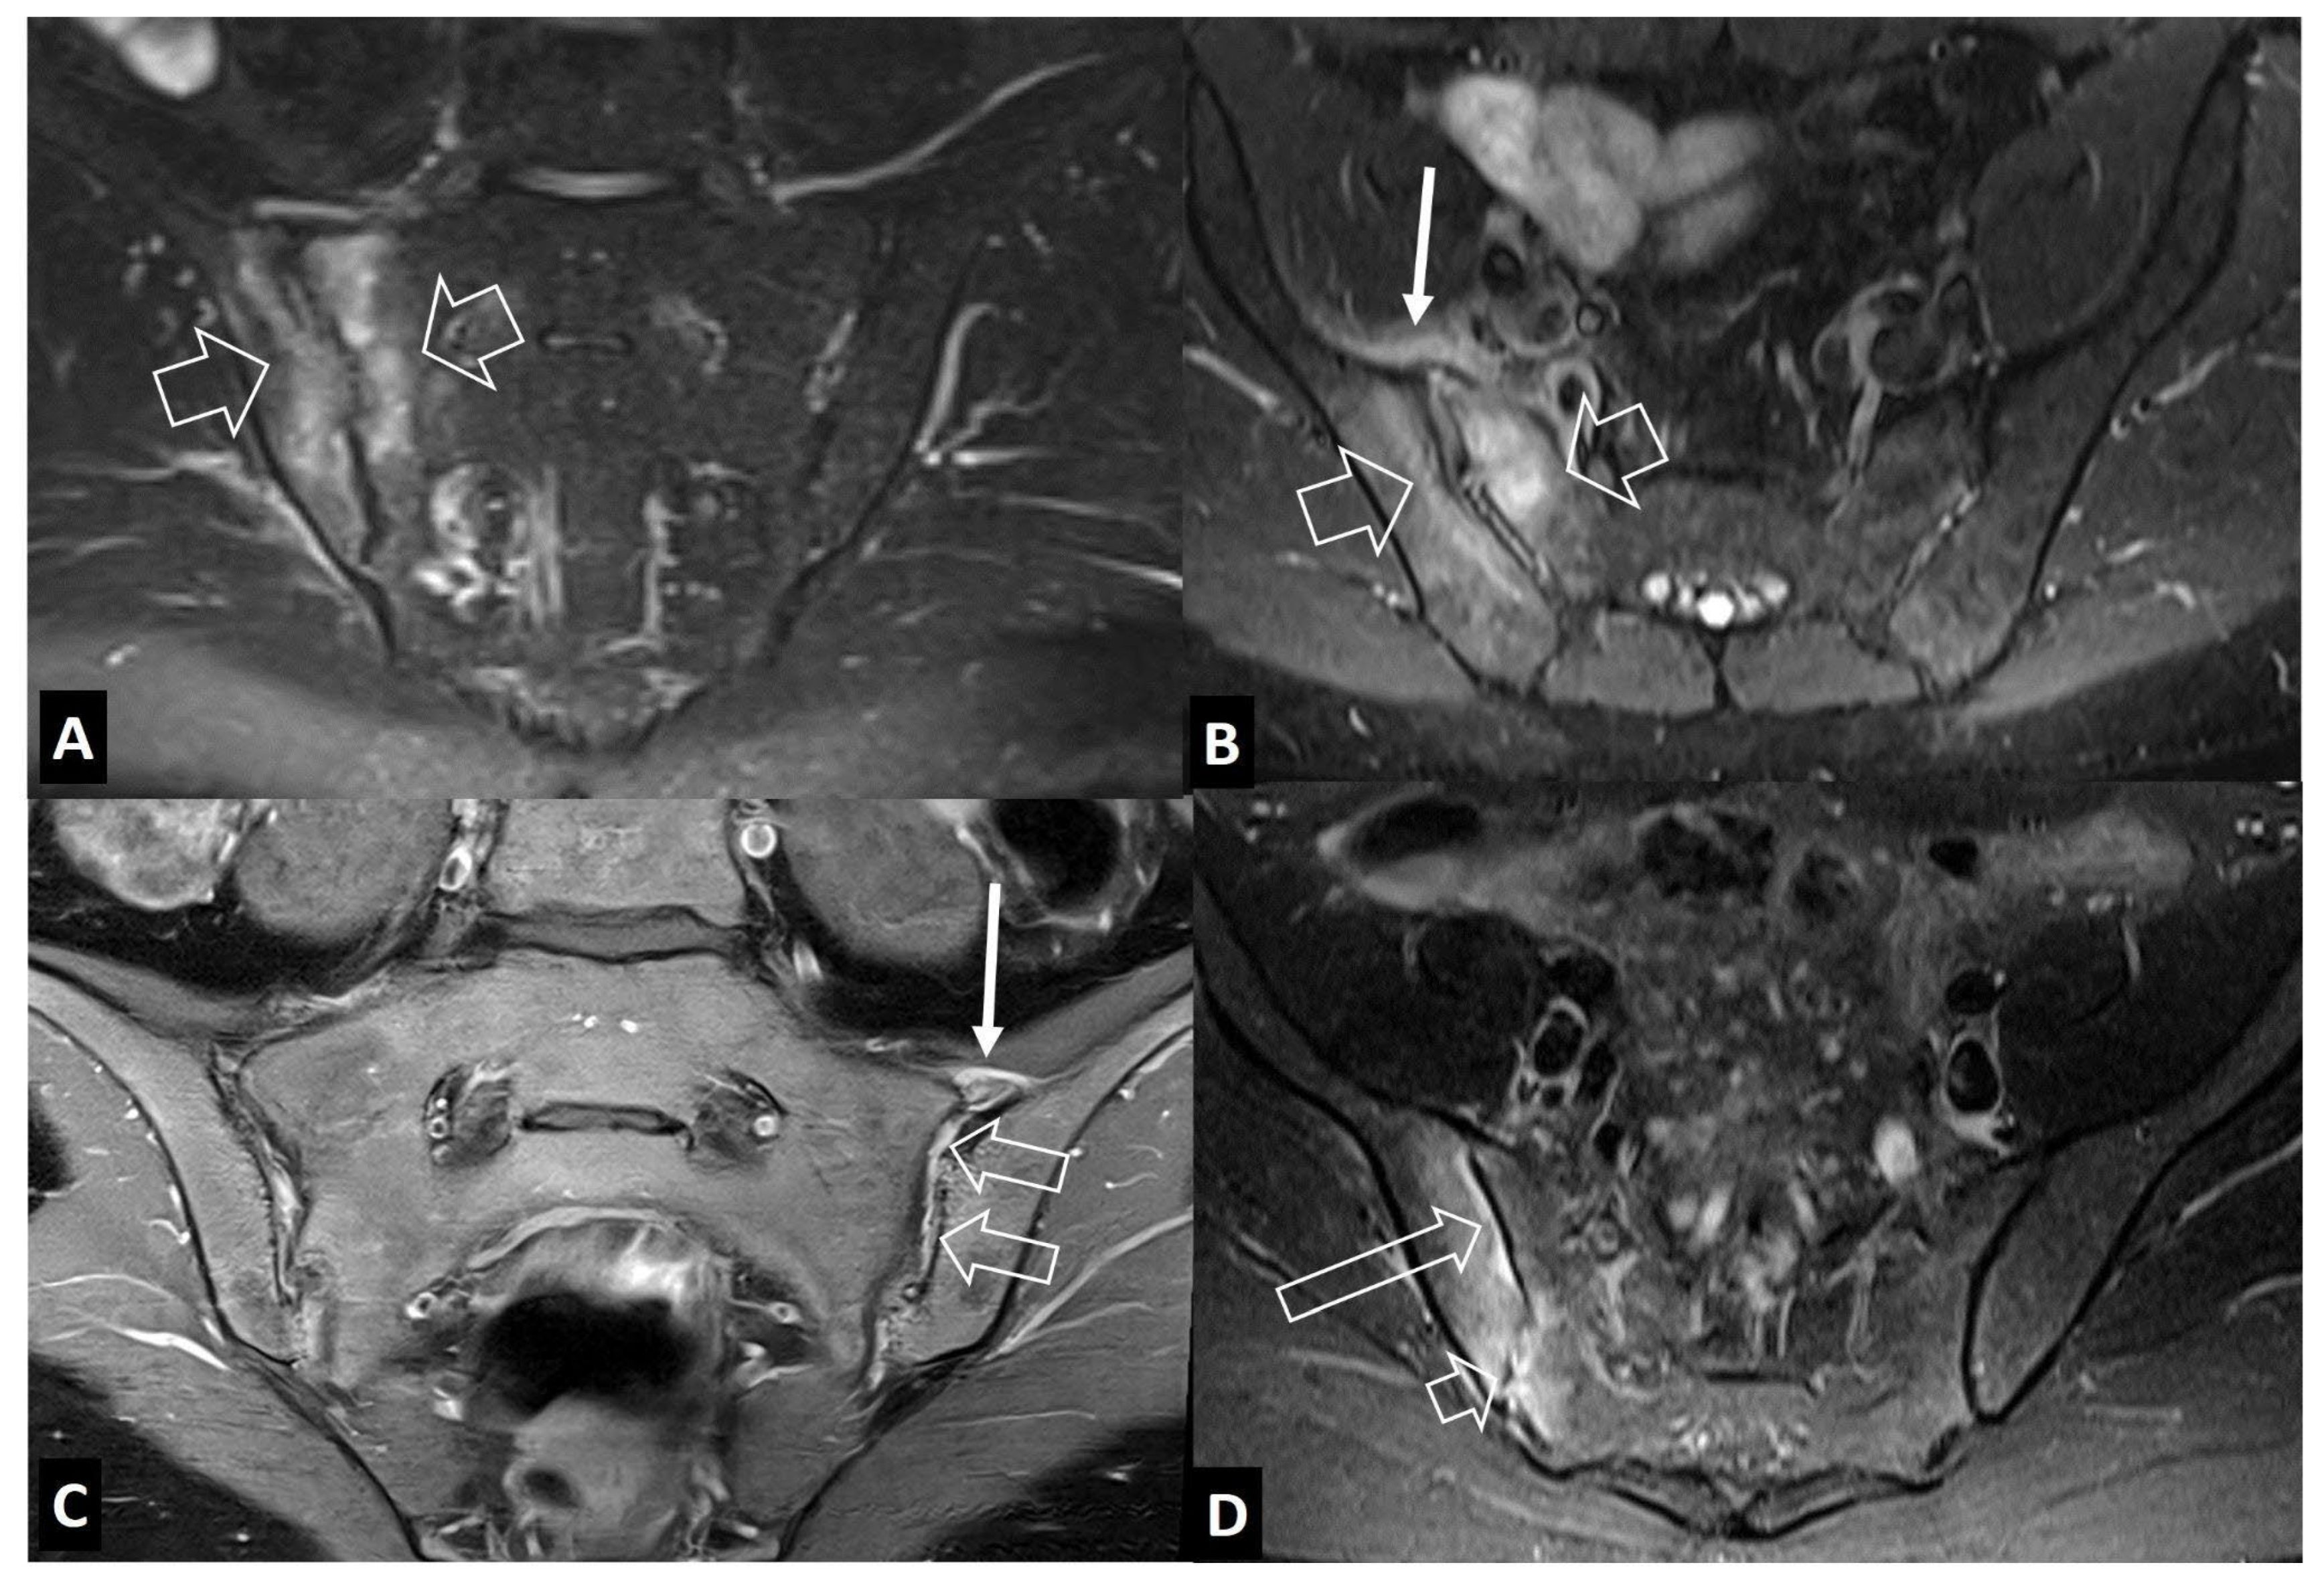
Figure 17.
A. Stress reaction in an 11-year-old boy with pain in the tibia exaggerated with football training. Axial fat suppressed contrast enhanced T1-w MR image, showing the bone marrow edema (long thin arrow), soft tissue edema (open arrow) and the periosteal reaction (short arrow). B. Ewing’s sarcoma in the right proximal femoral bone in a 17-year-old male patient. Axial fat suppressed T2-w (left) and fat suppressed contrast enhanced T1-w (right) MR images showing the bone marrow edema (long thin arrow), soft tissue edema (open arrow) and the multilayered periosteal reaction (short arrow).
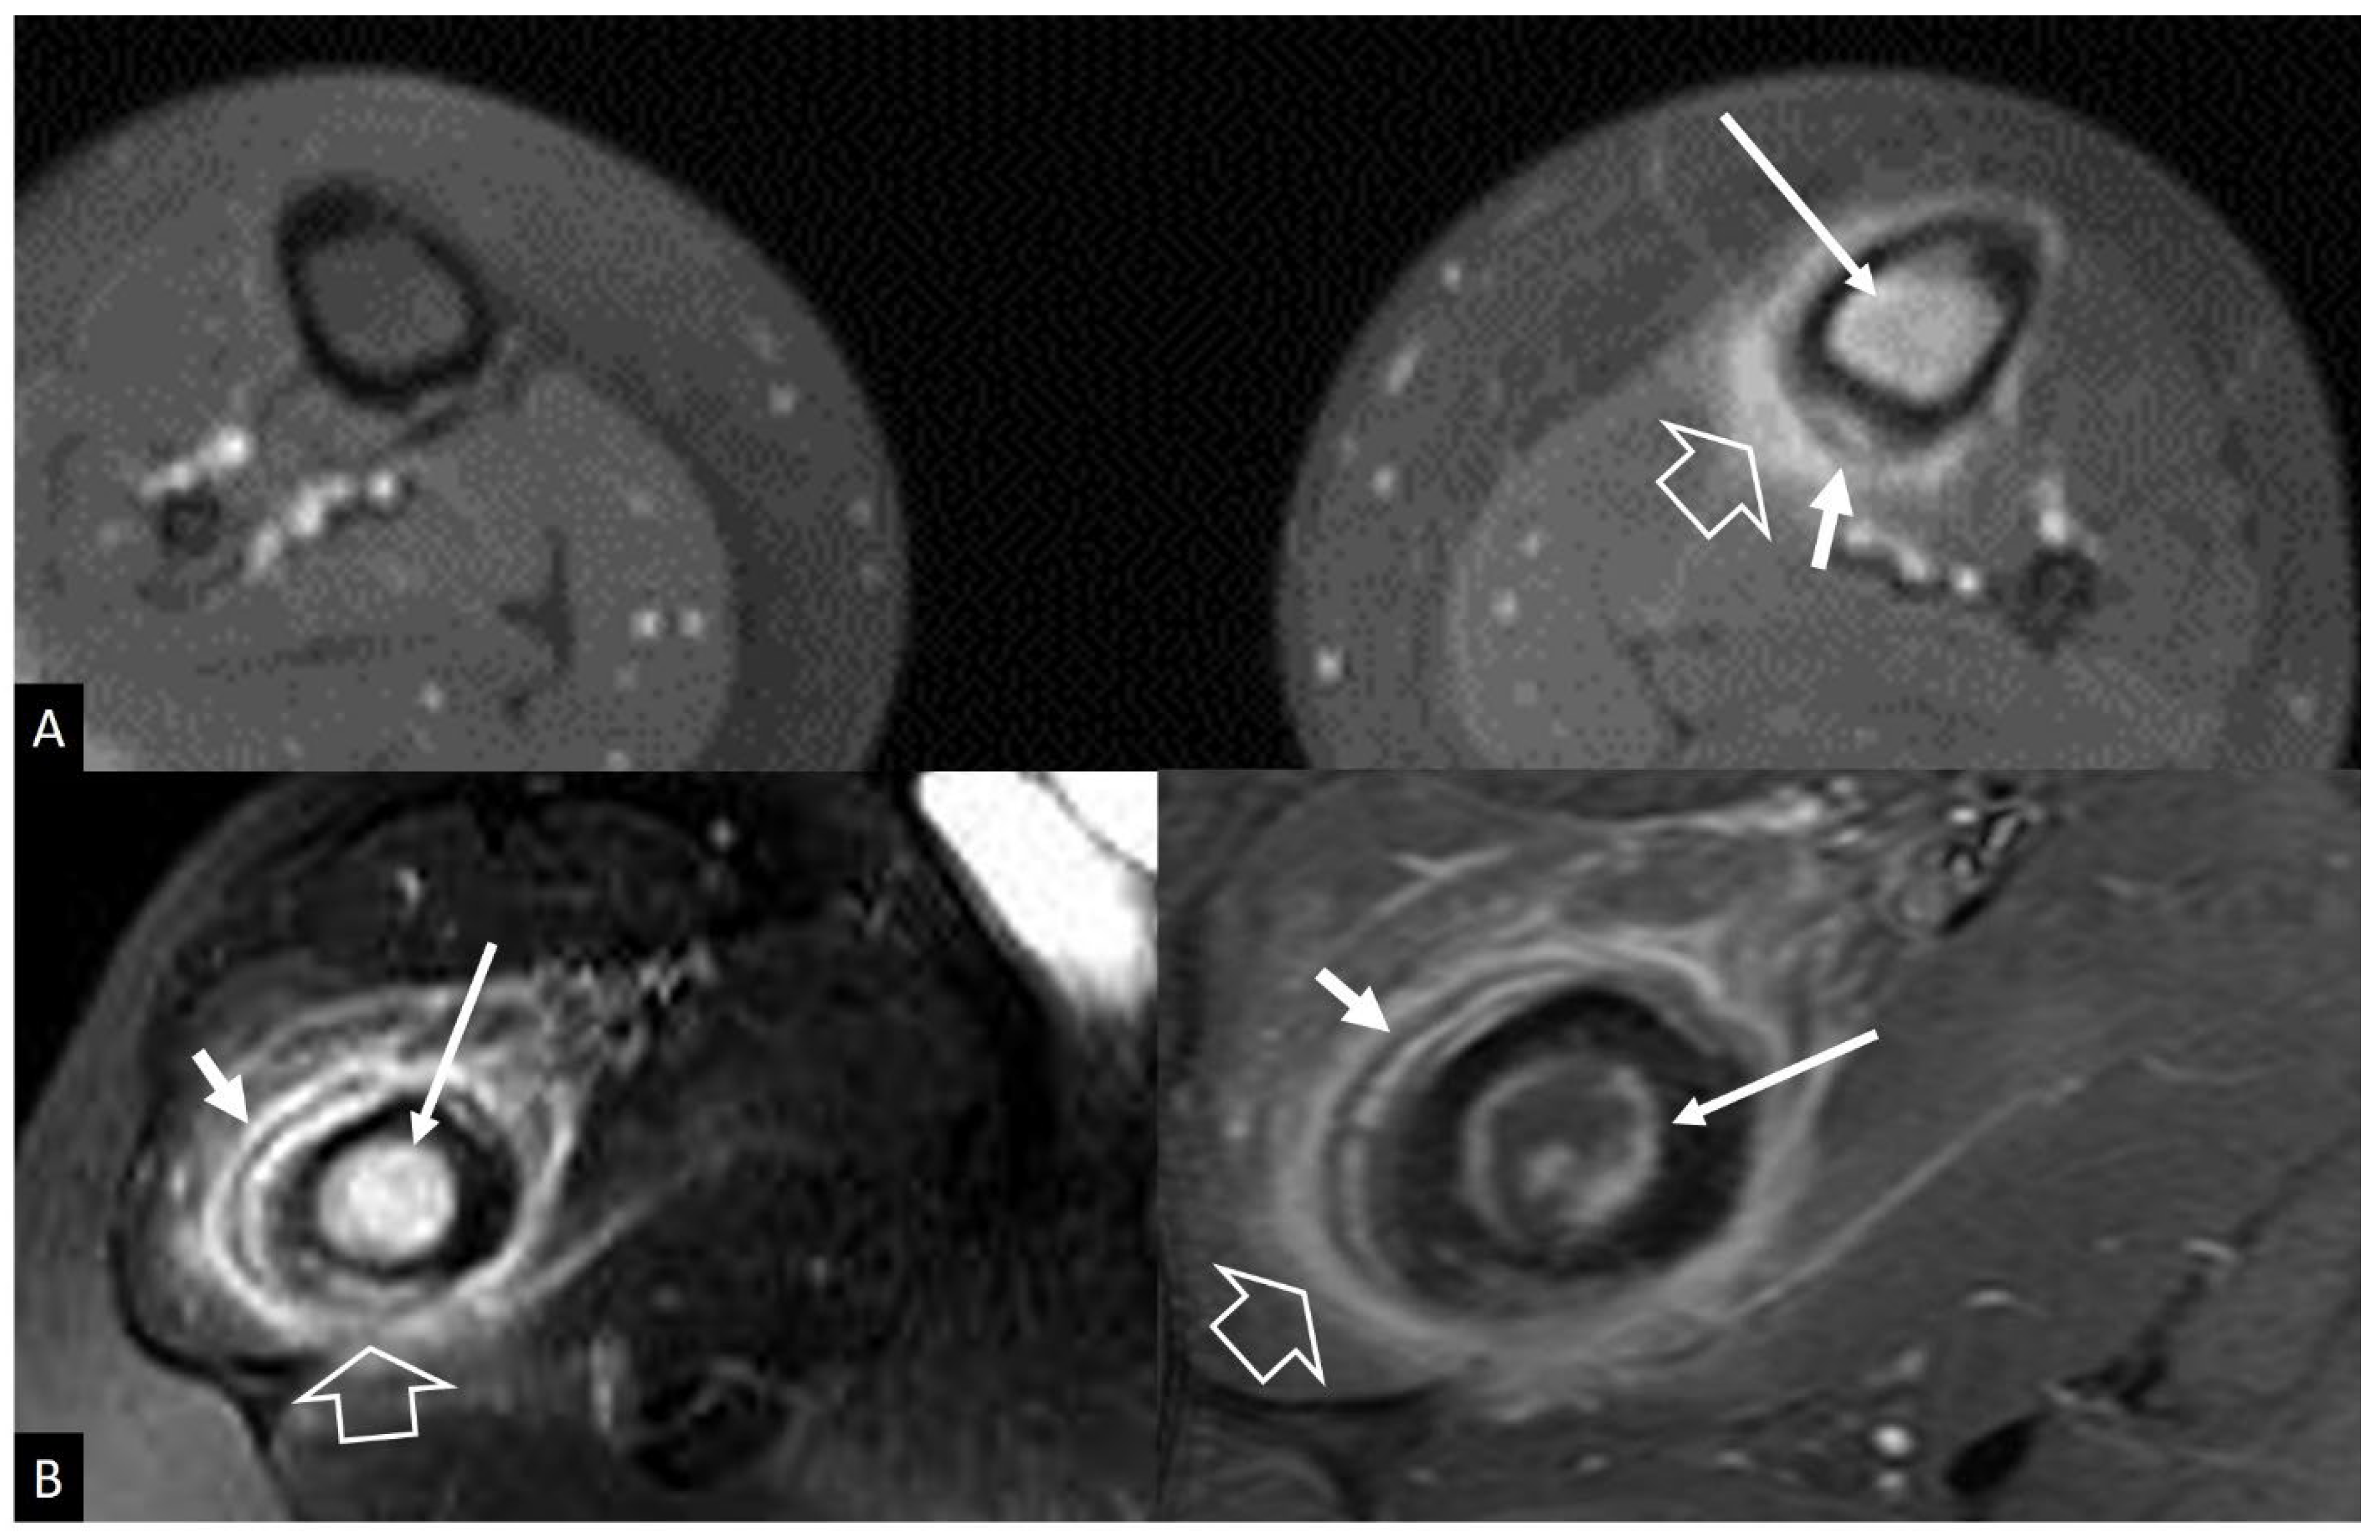
Figure 18.
A. Coronal fat suppressed contrast enhanced T1-w MR image in a 65-year-old male with staphylococcal septic arthritis, showing effusion (short arrow), synovitis (arrows) and soft-tissue edema (open arrow). B. Coronal fat suppressed contrast enhanced T1-w MR image in a 59-year-old male with rheumatoid arthritis with left hip joint involvement, showing effusion (short arrow), synovitis (arrows) and bone marrow edema (open arrow).
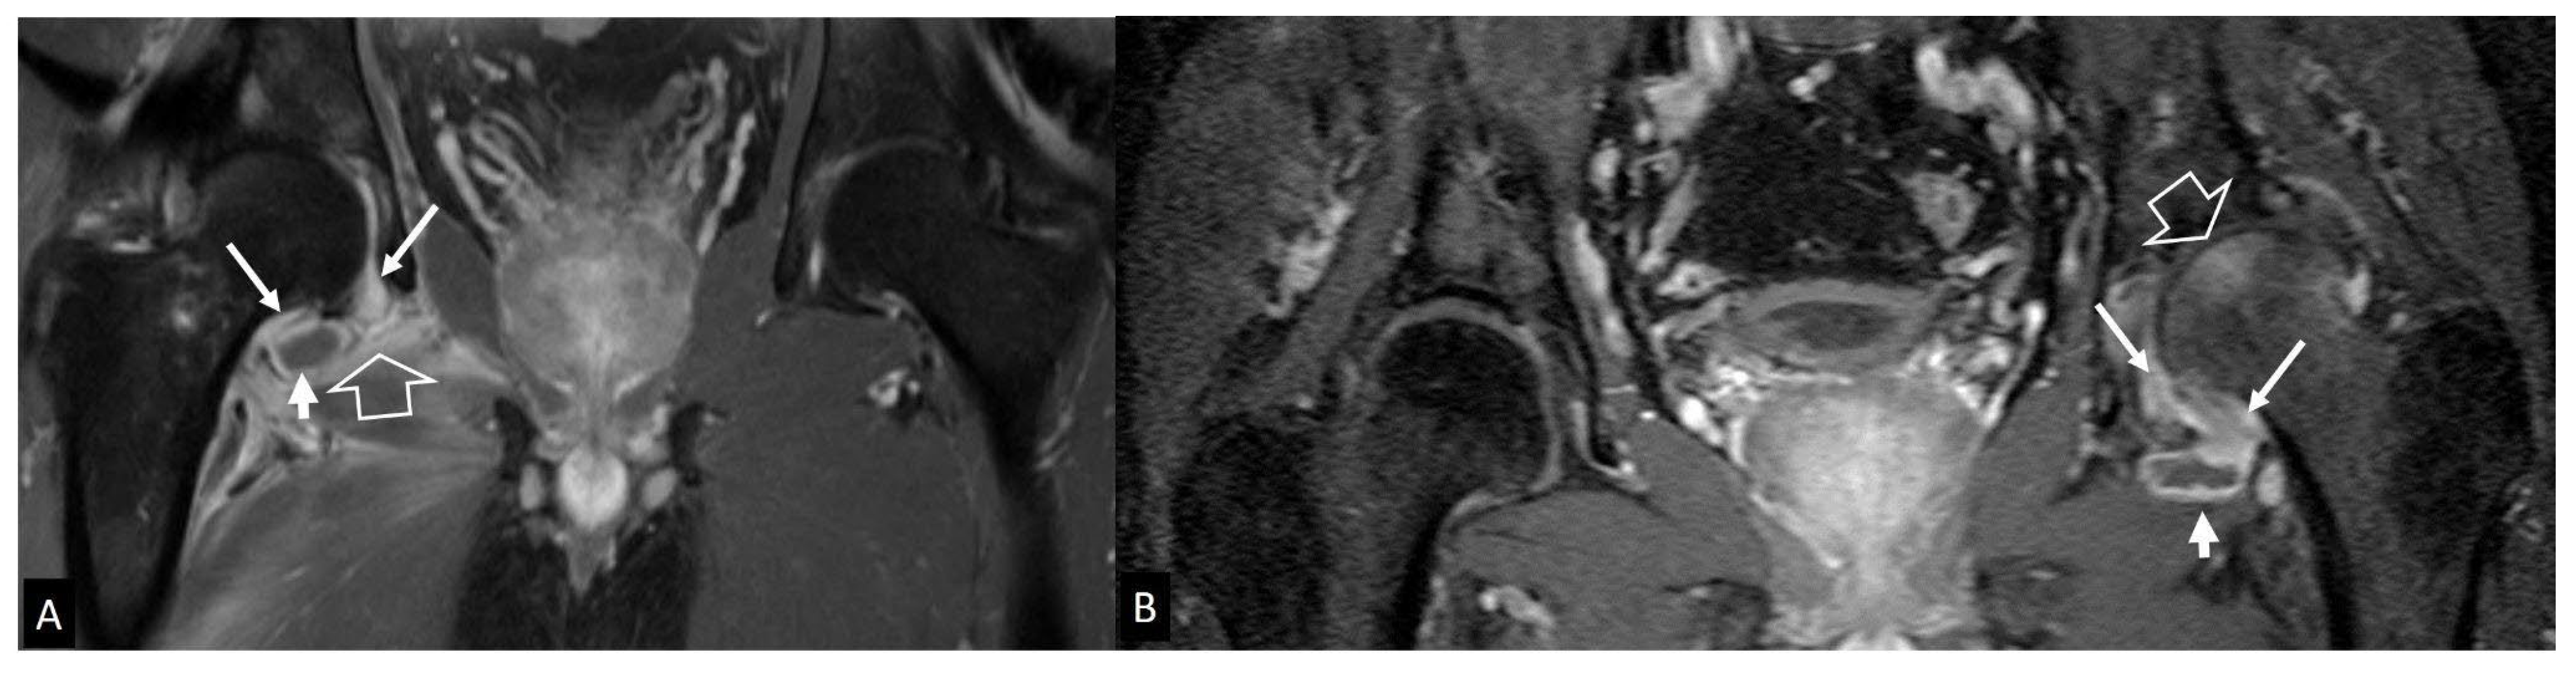
Figure 19.
A 62-year-old athletic male, with severe joint pain, warmth and swelling. Final diagnosis was CPPD arthritis. Coronal (A) and axial (B) fat suppressed PD-w MR images showing mild effusion (short arrow). Synovitis (open arrow) and chondrocalcinosis (thin arrows) suggest CPPD.
Figure 19.
A 62-year-old athletic male, with severe joint pain, warmth and swelling. Final diagnosis was CPPD arthritis. Coronal (A) and axial (B) fat suppressed PD-w MR images showing mild effusion (short arrow). Synovitis (open arrow) and chondrocalcinosis (thin arrows) suggest CPPD.
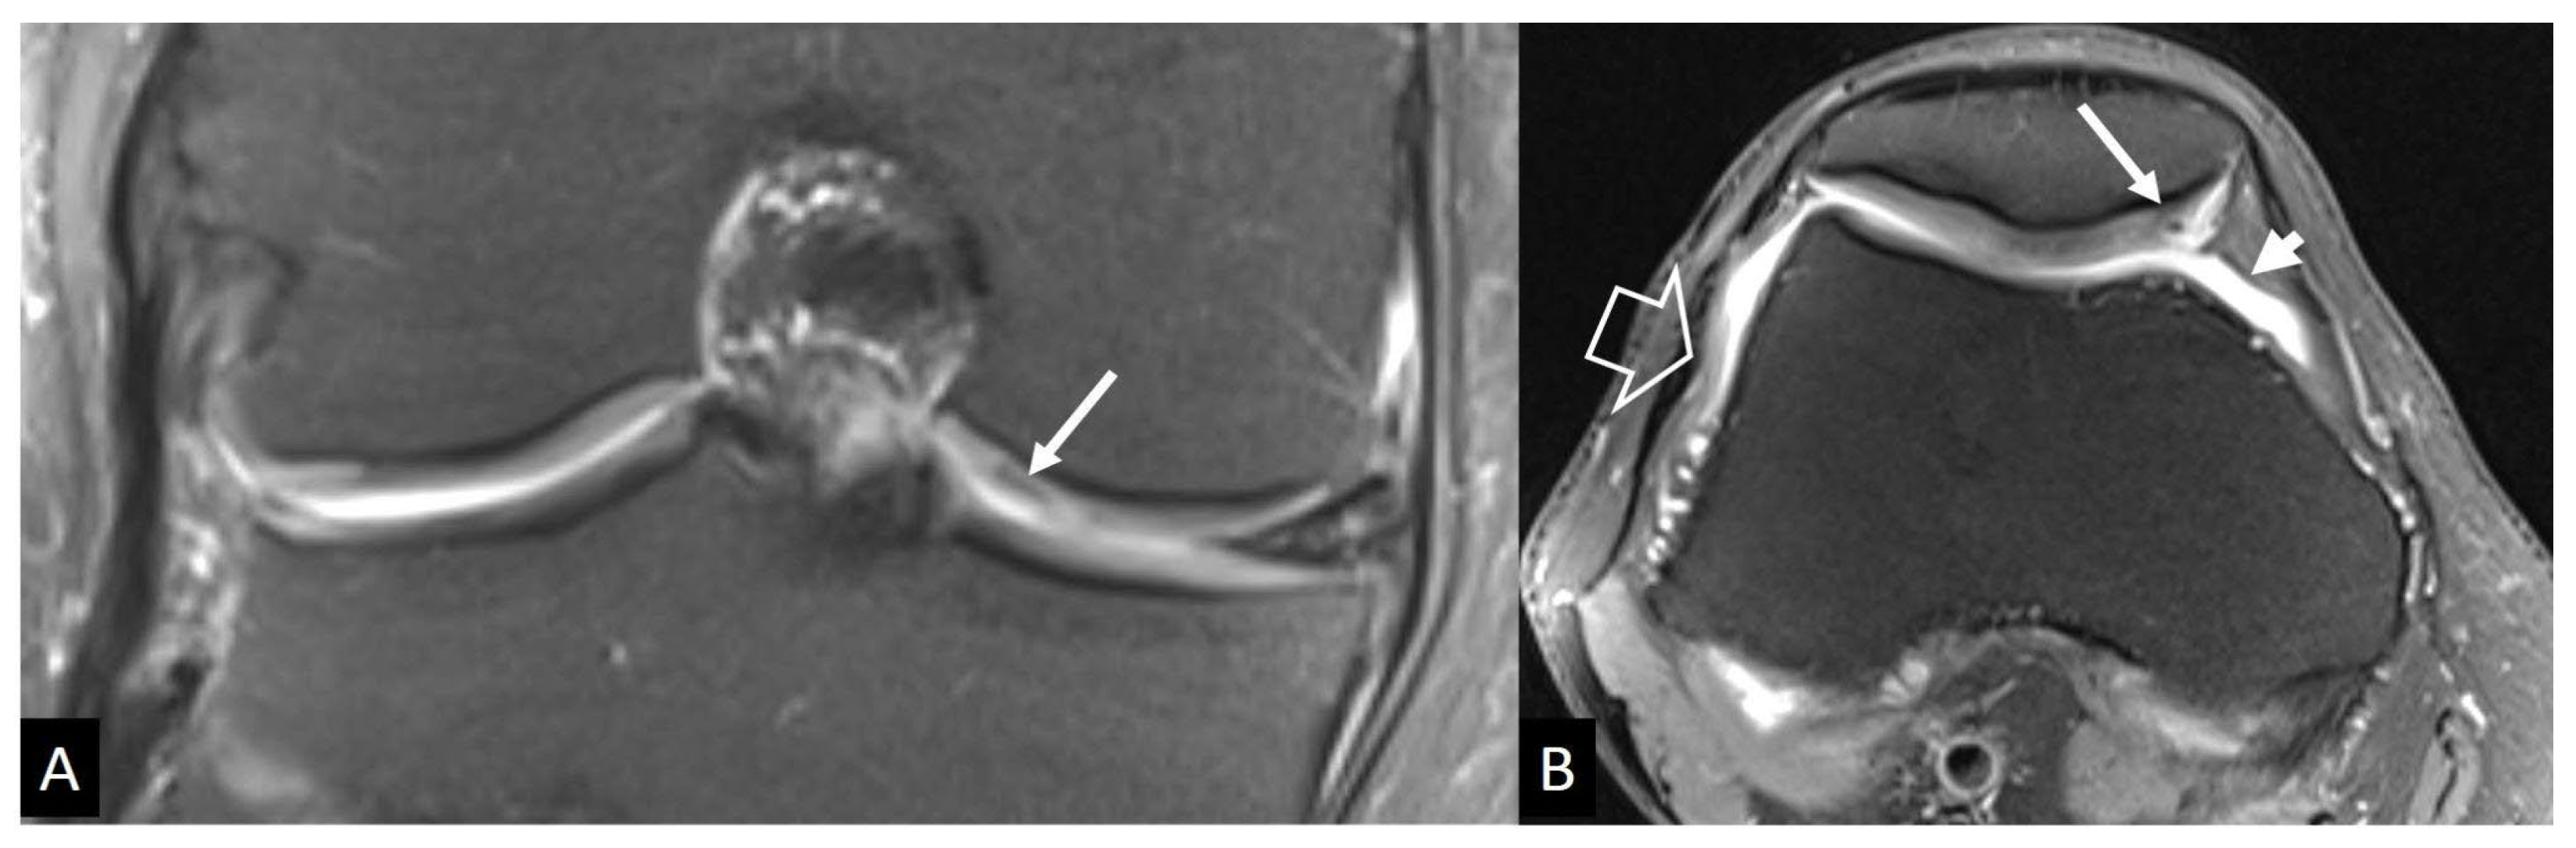
Figure 20.
A 77-year-old male patient with mild pain, reduced range of motion, crepitation and joint instability lasting 1 year prior to imaging. A. Characteristic radiographic features of ‘Milwaukee’ syndrome showing loss of the round configuration of the humeral head (arrows) and joint space narrowing at the inferior glenohumeral joint (open arrow). B. Coronal oblique, fat suppressed PD-w MR image showing massive rotator cuff tear, large joint effusion extending to bursae (long arrows), internal debris and synovial proliferation (short arrows) and subchondral bone and cartilage destruction (open arrows).
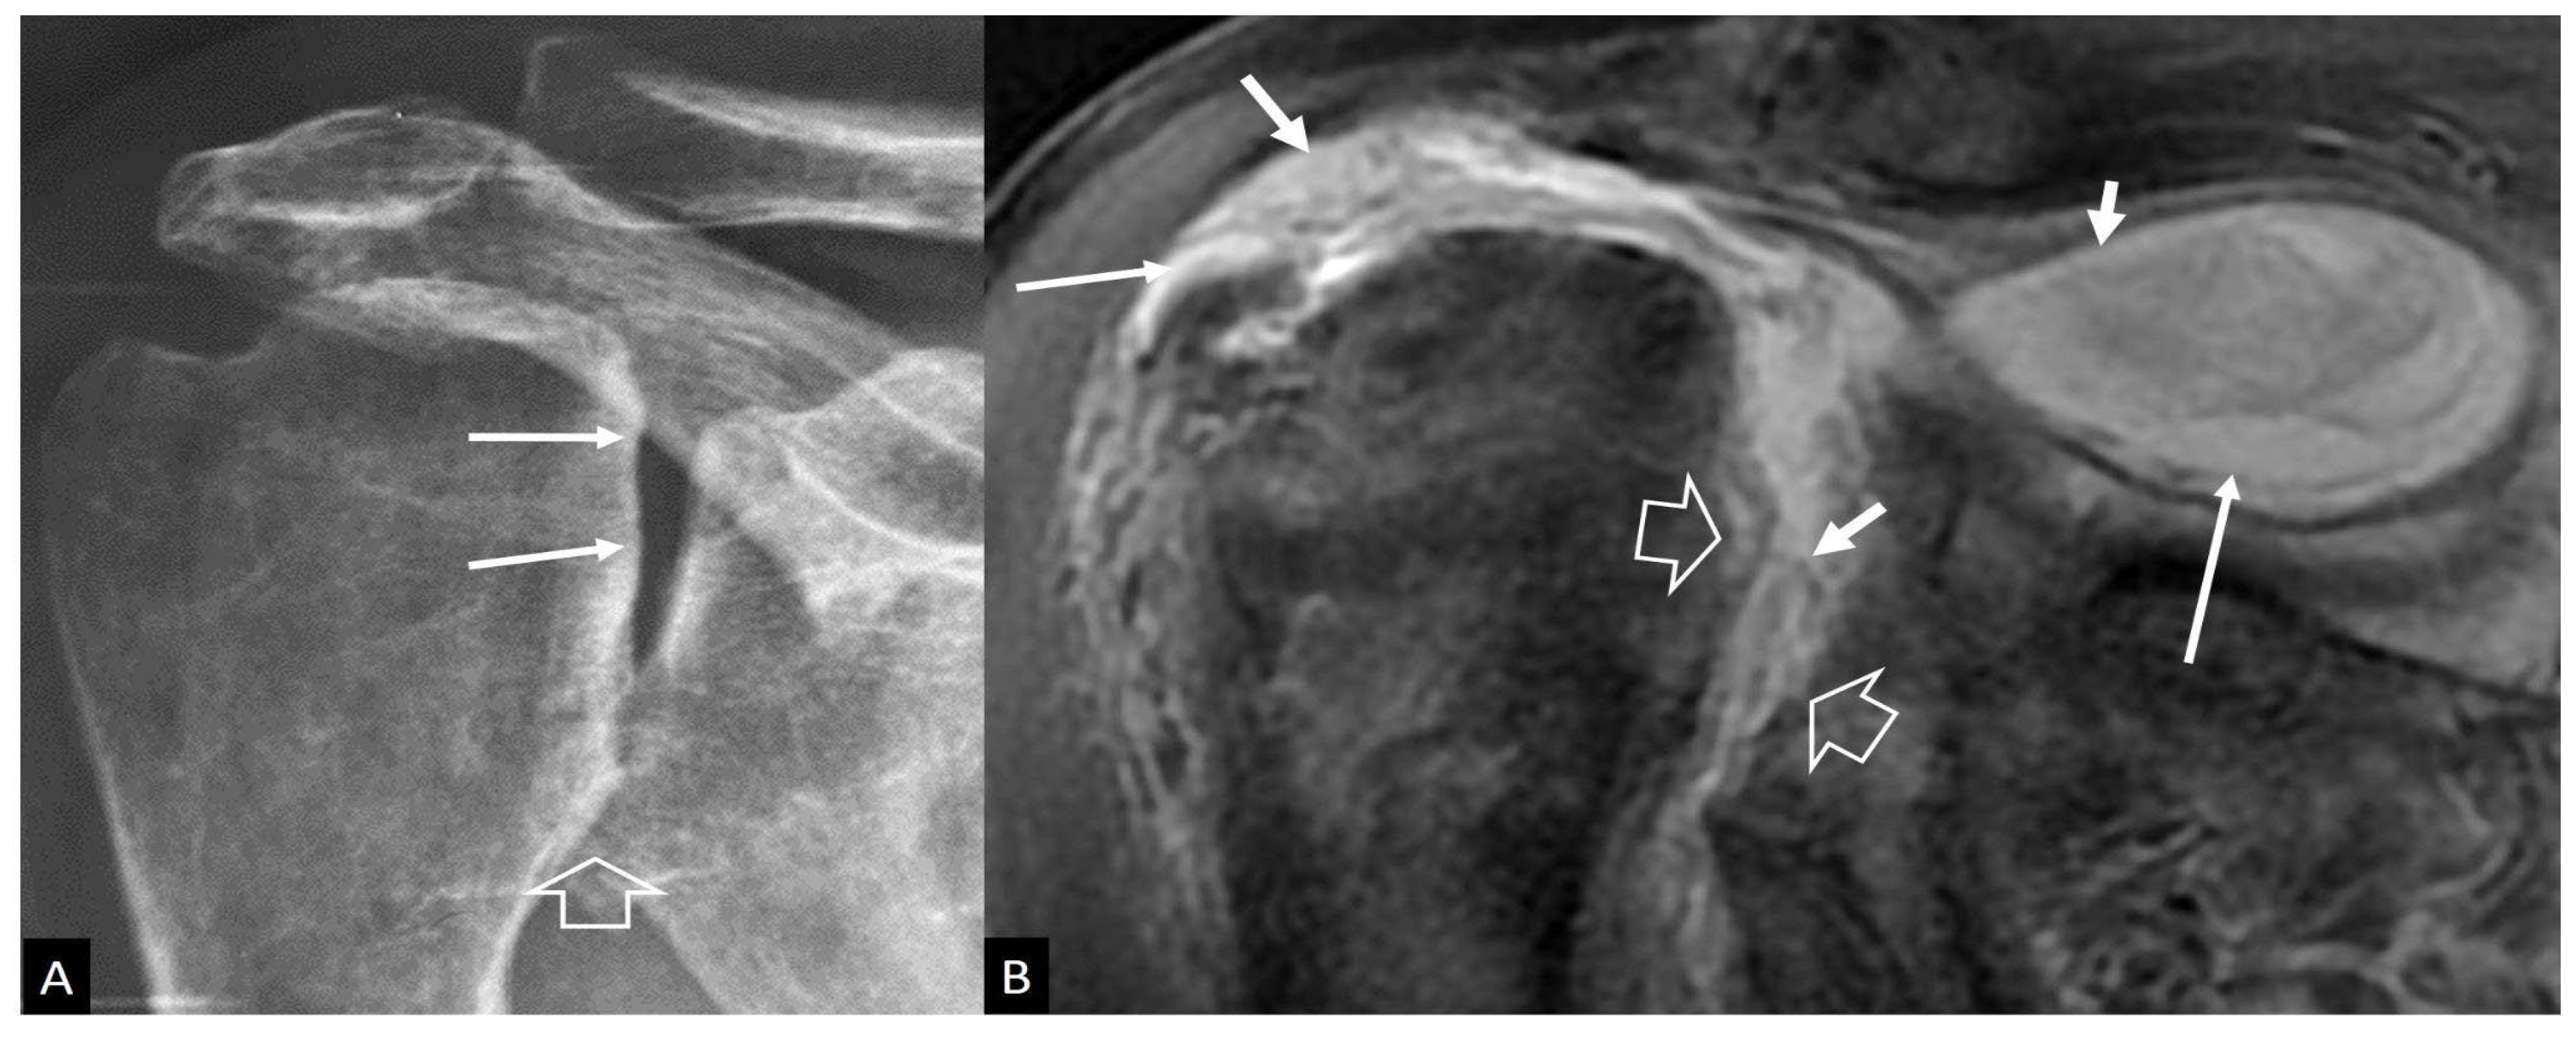
Figure 21.
Rapidly destructive osteoarthritis of the hip in a 72-year-old female patient with constant pain and limited range of motion. Plain radiograph (upper left) taken with onset of symptoms, shows a normal joint space (arrows). Two years later, plain radiograph shows widening of the joint space (arrows) and subarticular cyst formation (open arrows). Oblique axial gradient echo (lower left) and fat suppressed contrast enhanced T1-w (lower right) MR images showing subarticular cysts (open arrows), osteophyte formation (thin open arrow), synovitis (arrows) and bone marrow edema (thick arrow).
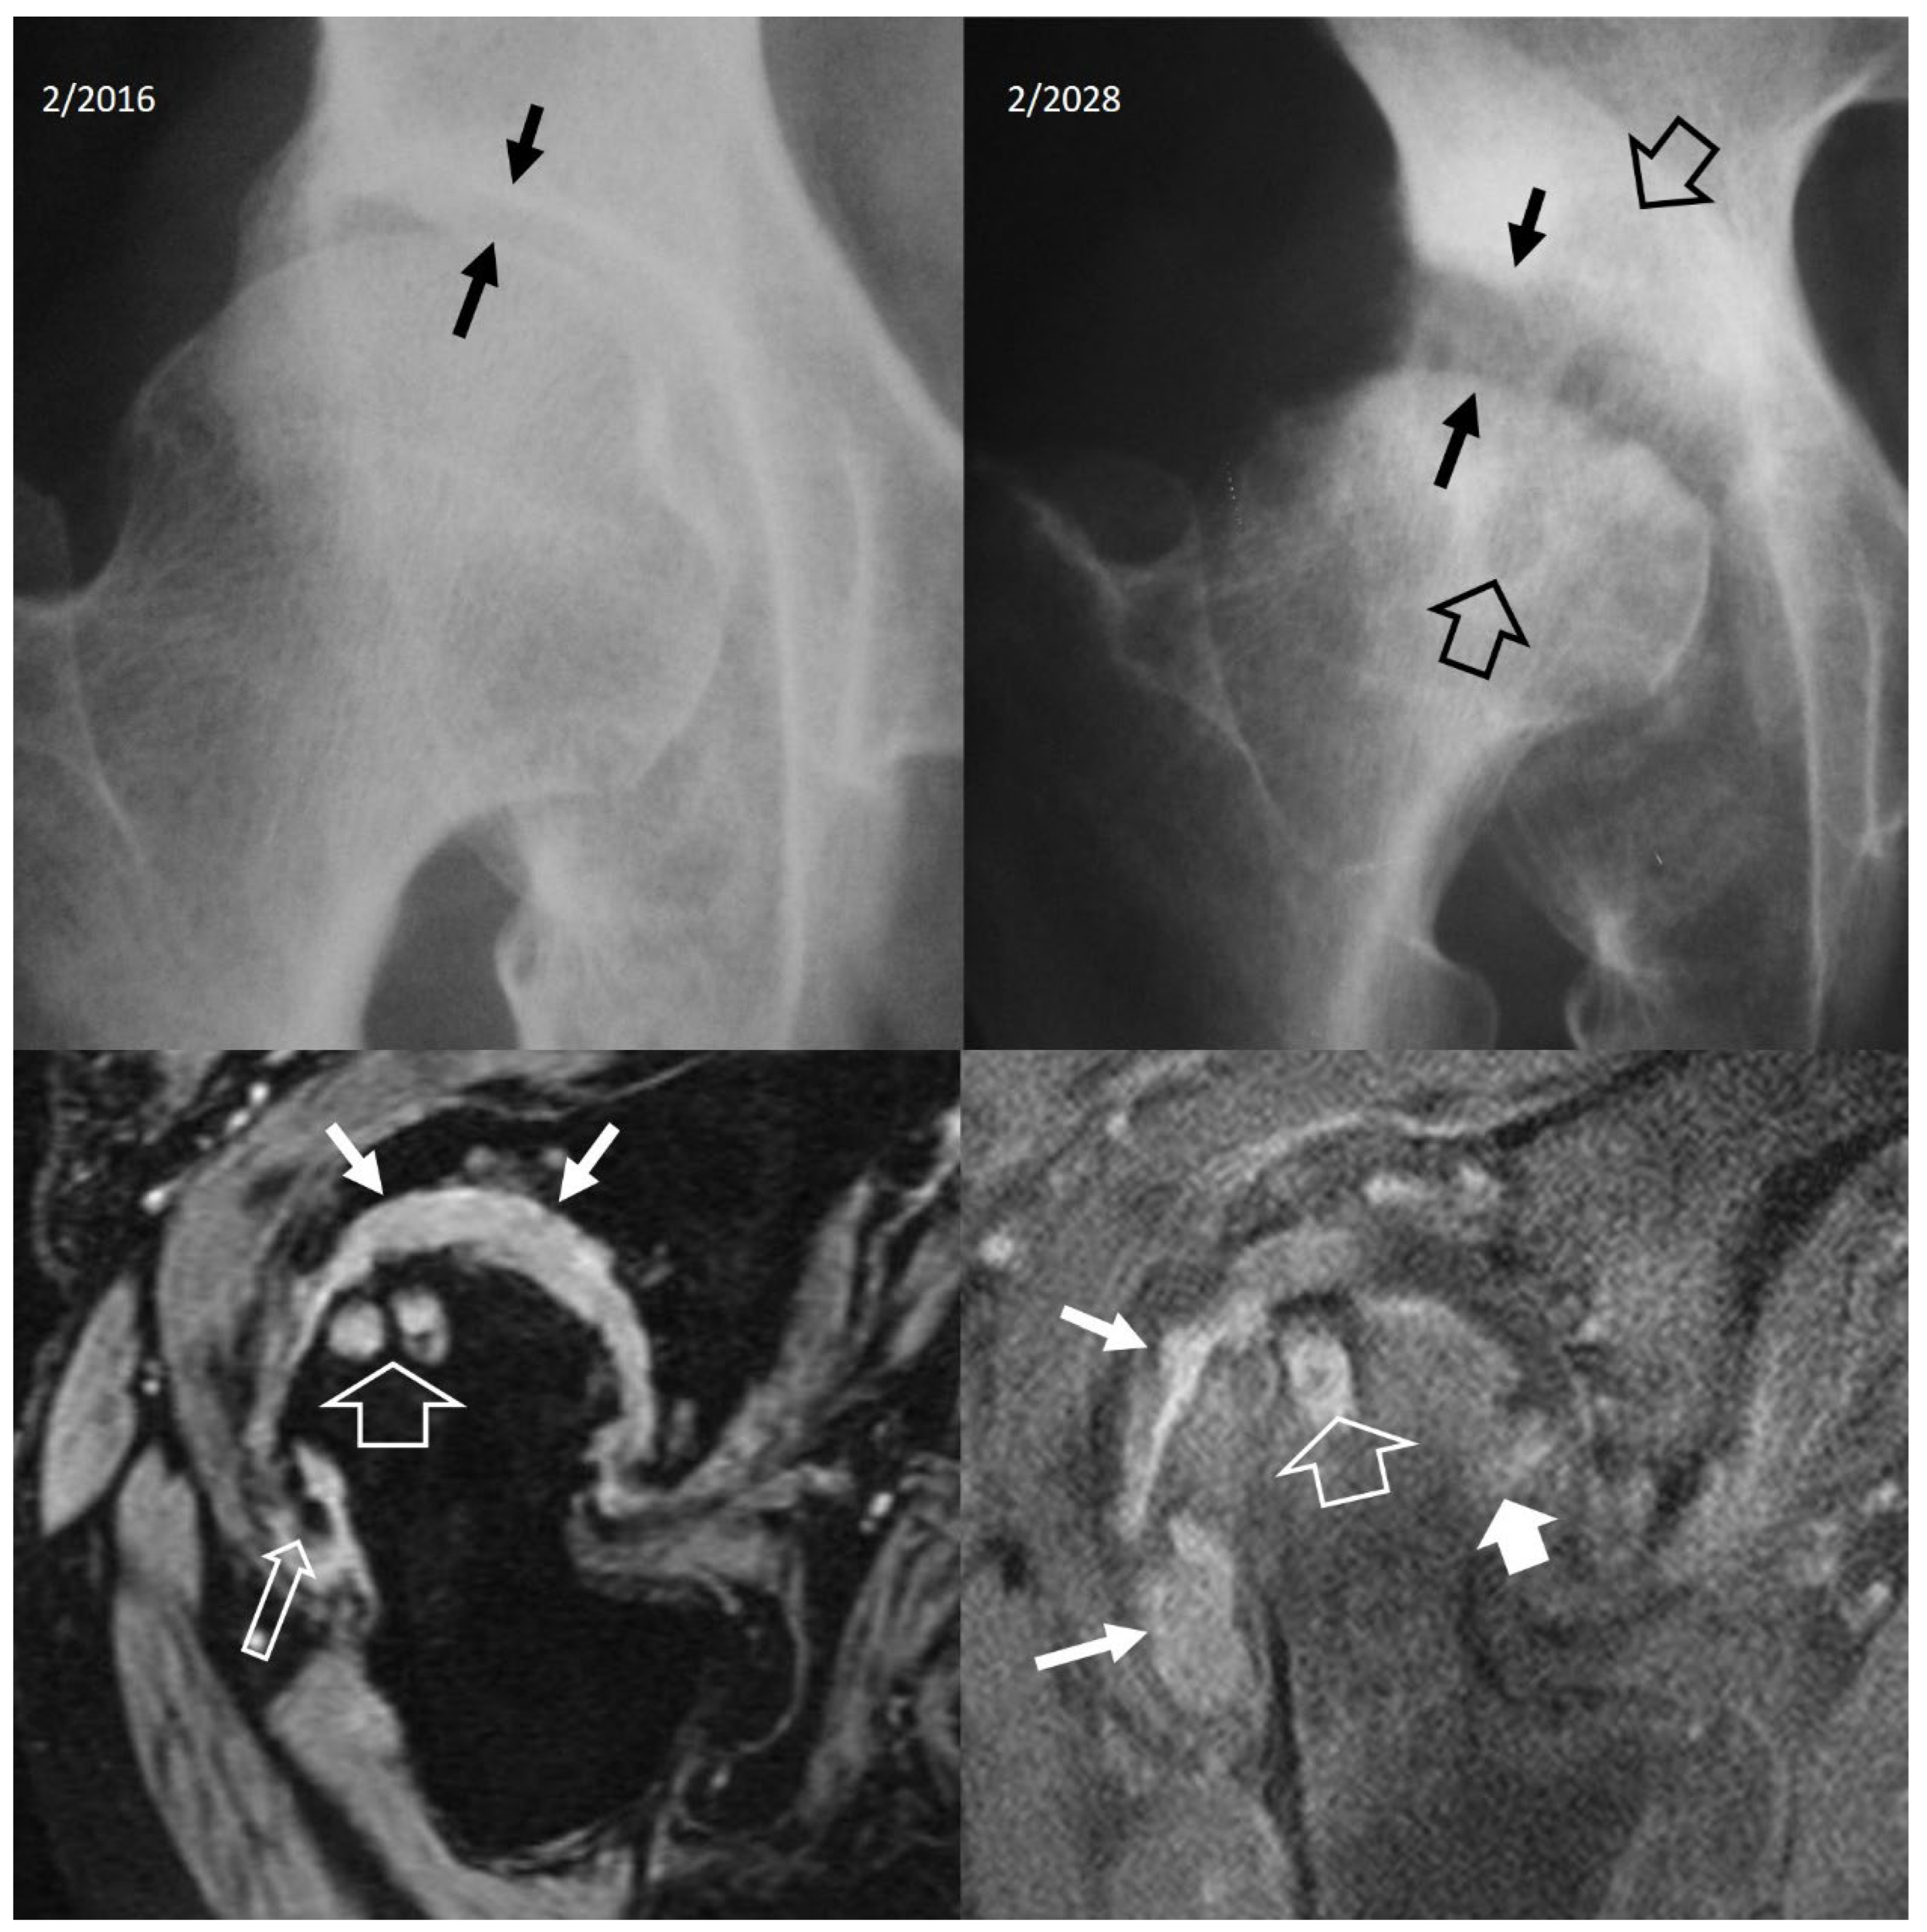
Figure 22.
An 11-year-old girl with a surgically proven Brodie’s abscess. A. Plain radiograph shows the lytic lesion (arrows) and the surrounding sclerosis (open arrow). B. Axial CT image showing the lytic lesion (arrow) and a central hyperdensity simulating a nidus of osteoid osteoma (thin arrow).
Figure 22.
An 11-year-old girl with a surgically proven Brodie’s abscess. A. Plain radiograph shows the lytic lesion (arrows) and the surrounding sclerosis (open arrow). B. Axial CT image showing the lytic lesion (arrow) and a central hyperdensity simulating a nidus of osteoid osteoma (thin arrow).
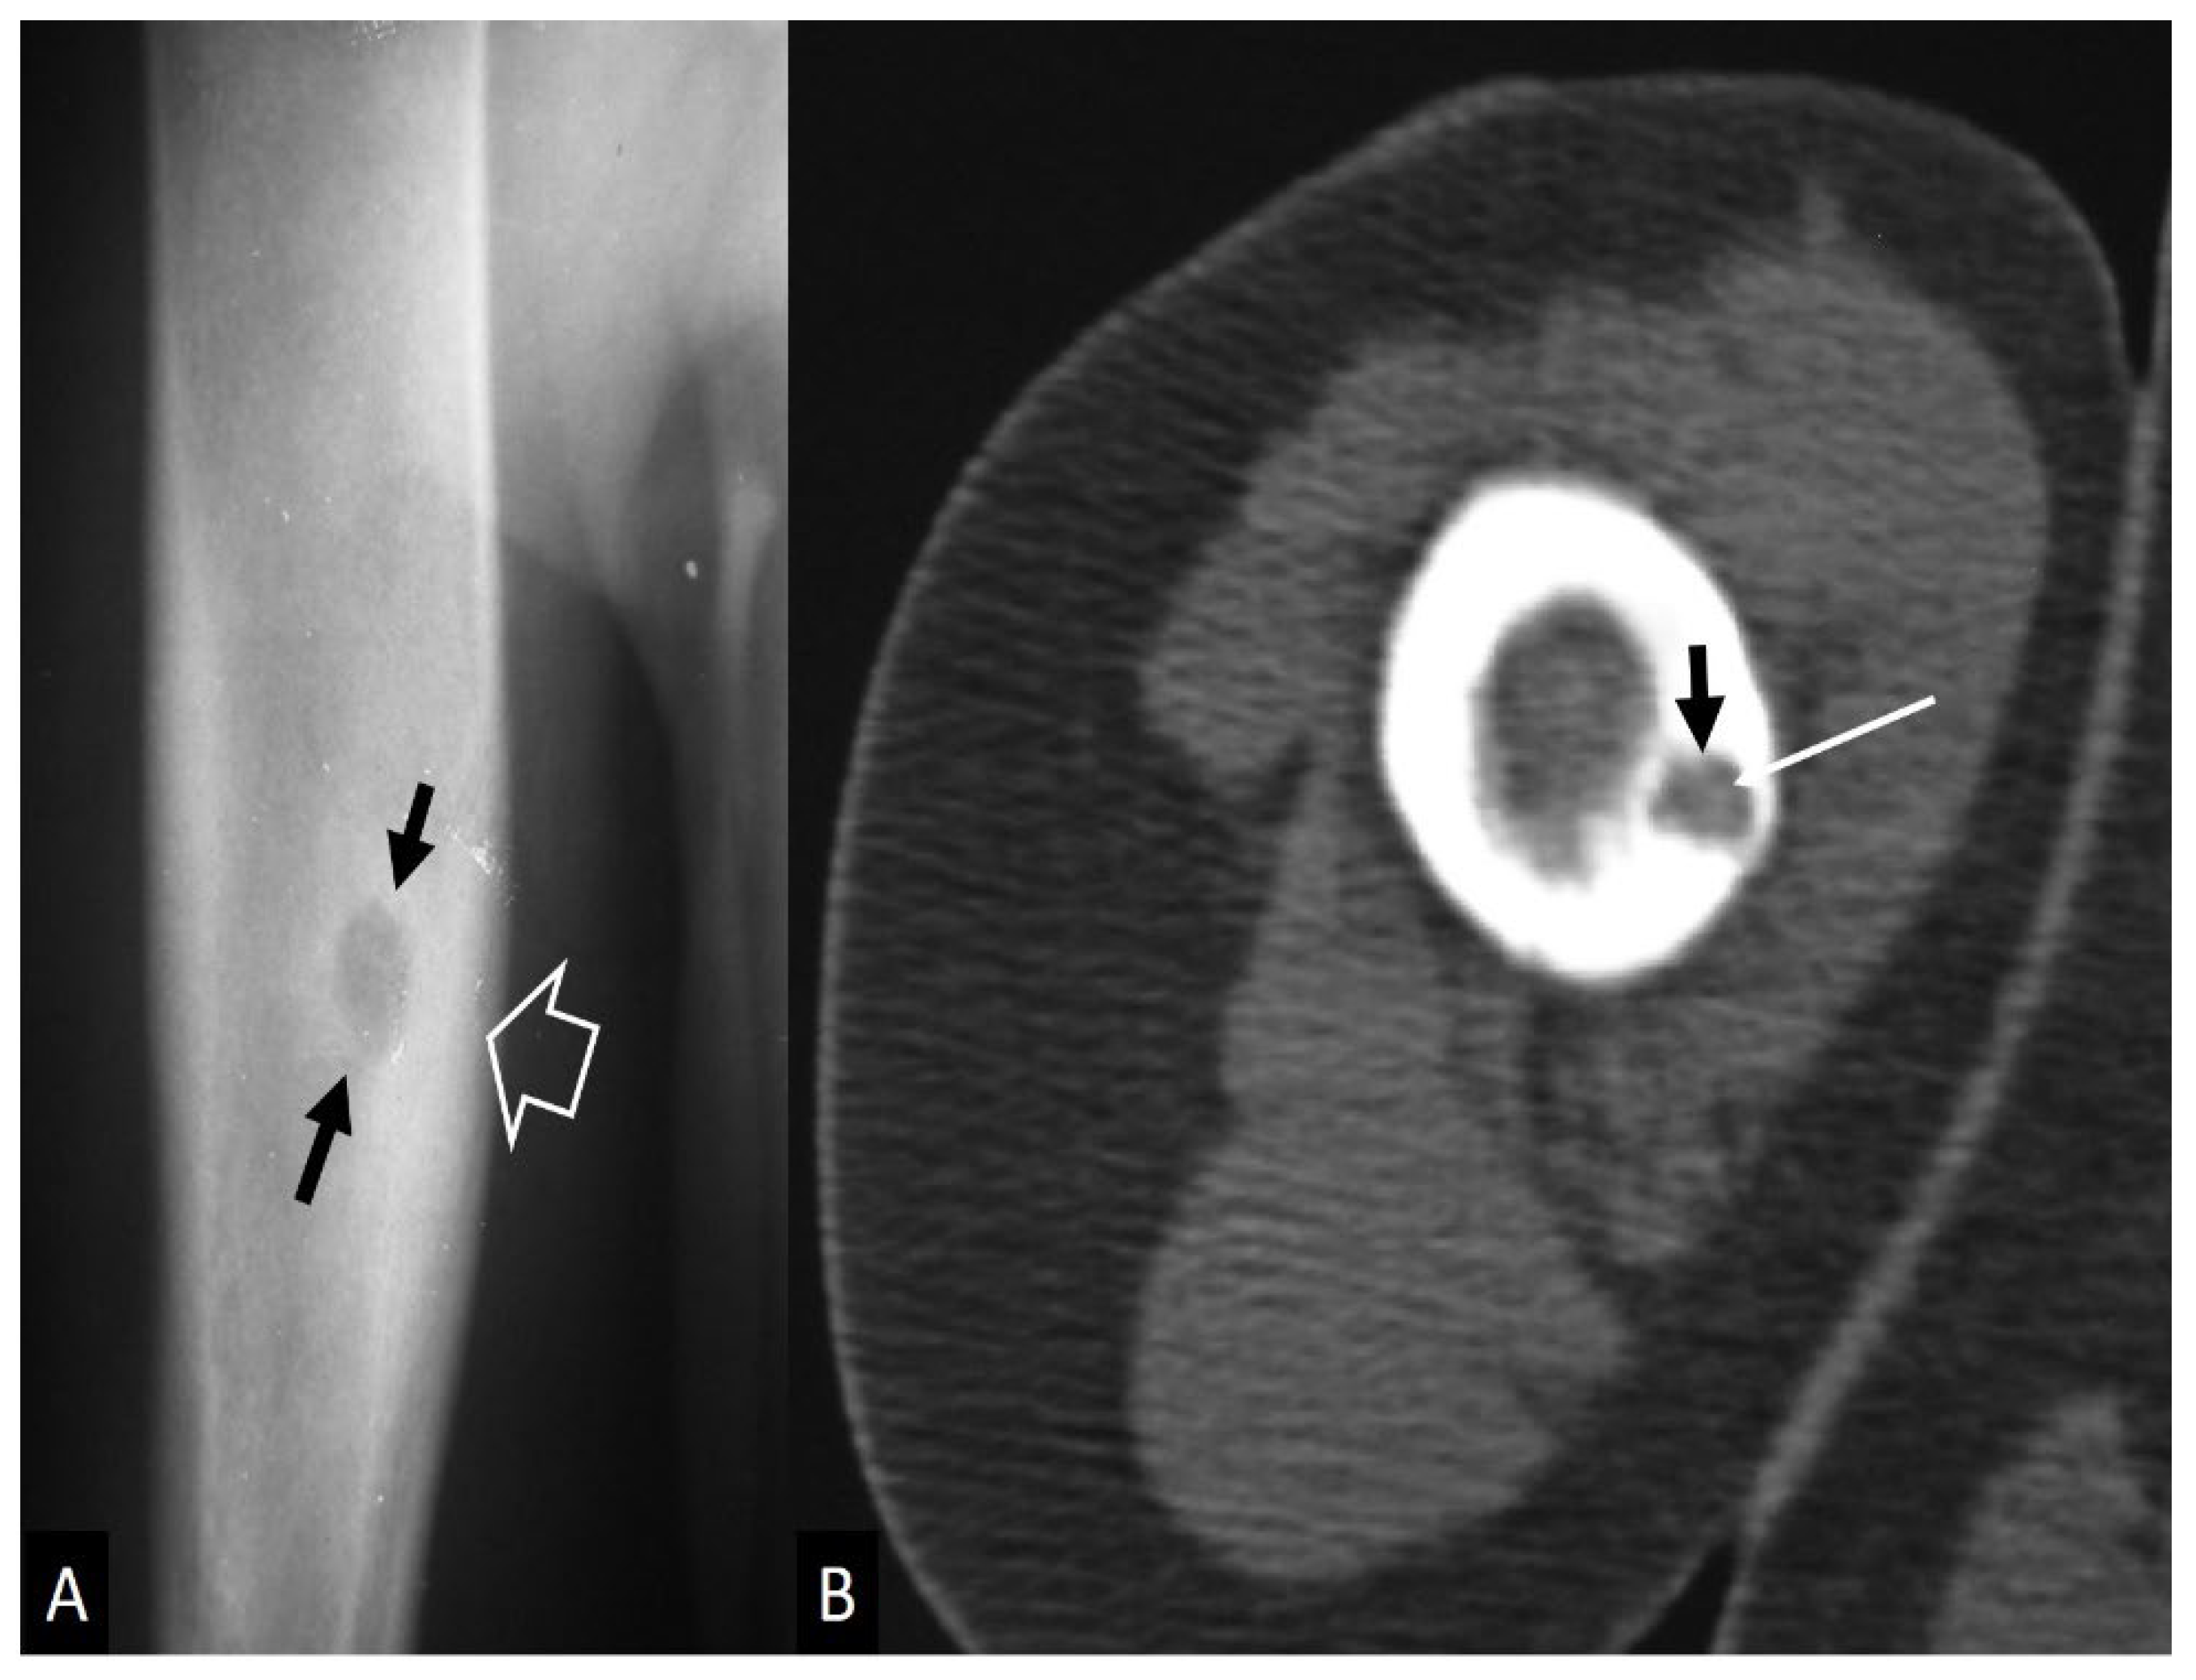
Figure 23.
A. Eosinophilic fasciitis in a 68-year-old female. Axial fat suppressed contrast-enhanced T1-w MR images show enhancement of the superficial fasciae (arrows), deep fasciae (open arrows), and a small lymph node (arrowhead). B. Nodular fasciitis in a 60-year-old female patient. Axial fat suppressed contrast enhanced T1-w MR image showing enhancement of the fascia (arrows). C. Coronal STIR MR image in a 20-year-old female patient with dermatomyositis, showing diffuse muscle edema (arrows). D. Muscle denervation in a 25-year-old male patient. Oblique sagittal PD-w MR image showing the ganglion cyst (thin arrows) and the edematous infraspinatus muscle (arrows). The rest of the rotator cuff muscles show normal signal.
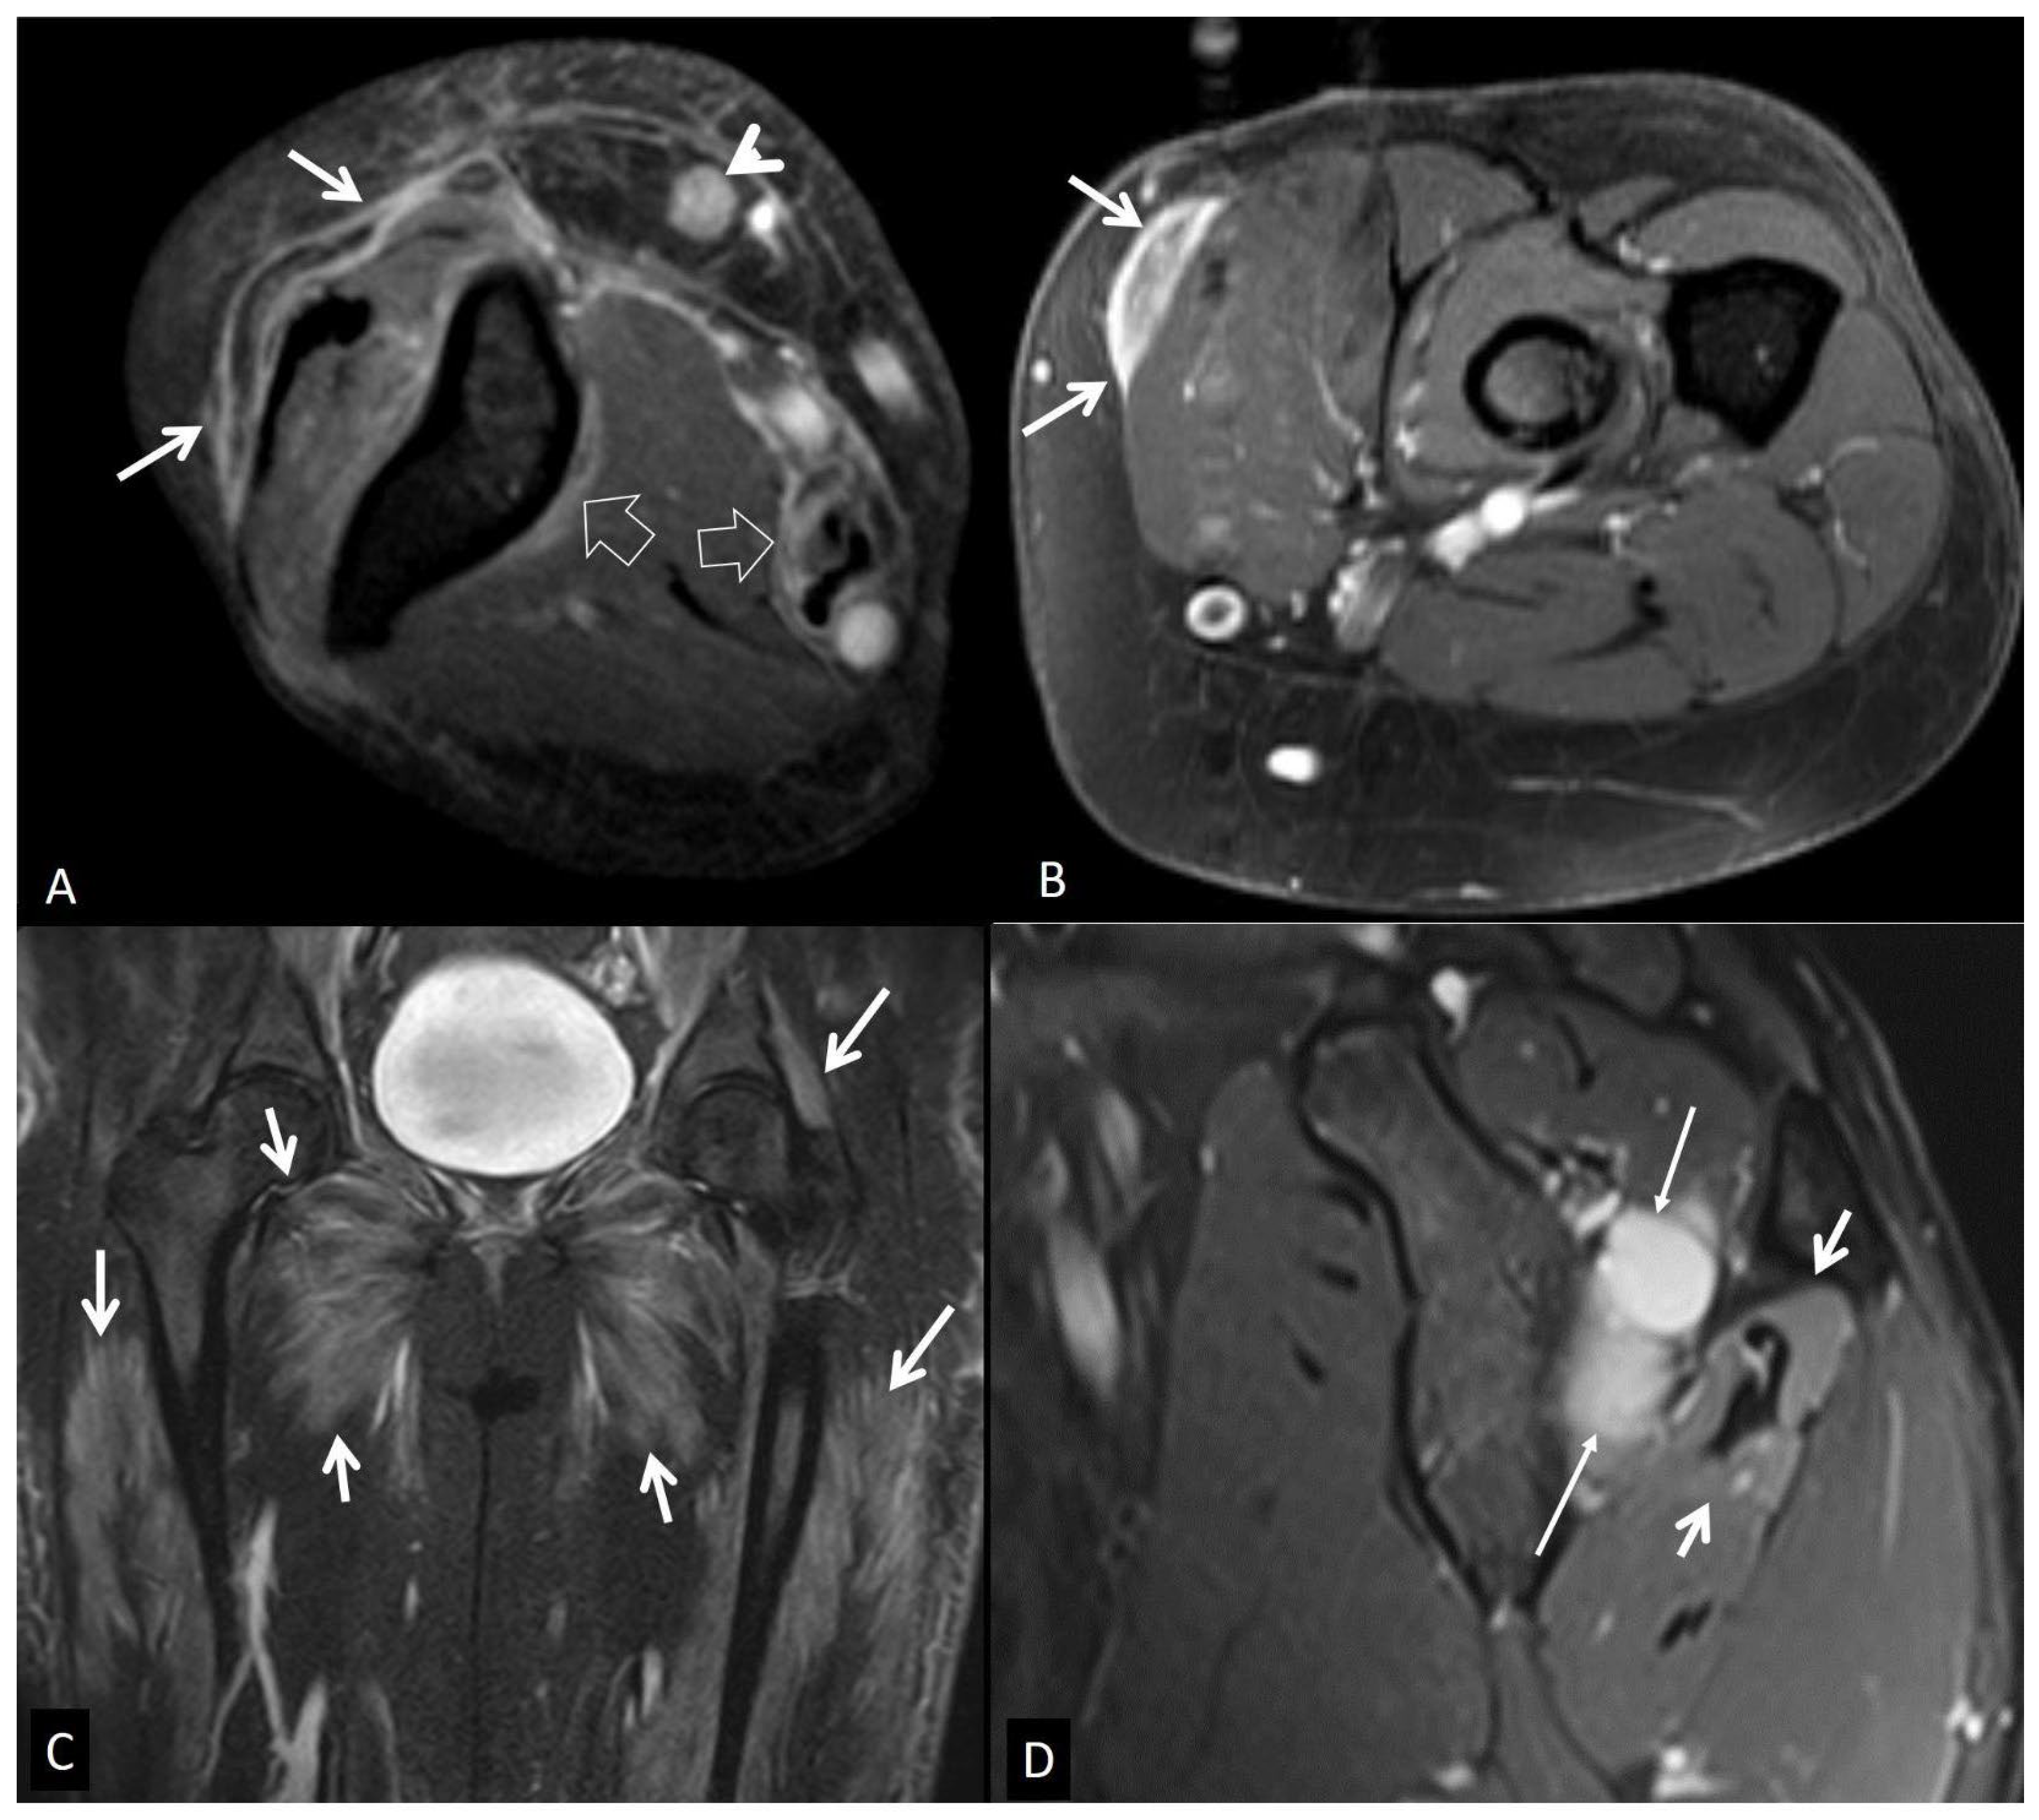
Figure 24.
A. Muscle contusion in a 65-year-old male following a fall from 2.5m. Axial fat suppressed T2-w MR image showing the intramuscular hematoma (arrows). B. Axial fat suppressed T2-w MR image showing the pectoralis major muscle strain (arrows). C. Coronal STIR MR image showing muscular edema (arrows) in a 43-year-old female marathon runner with delayed muscle soreness syndrome. D. Coronal STIR MR image in a 65-year-old male patient with bladder carcinoma, showing post-radiation changes in the iliac (thin arrows) and obturator (short arrows) muscles.
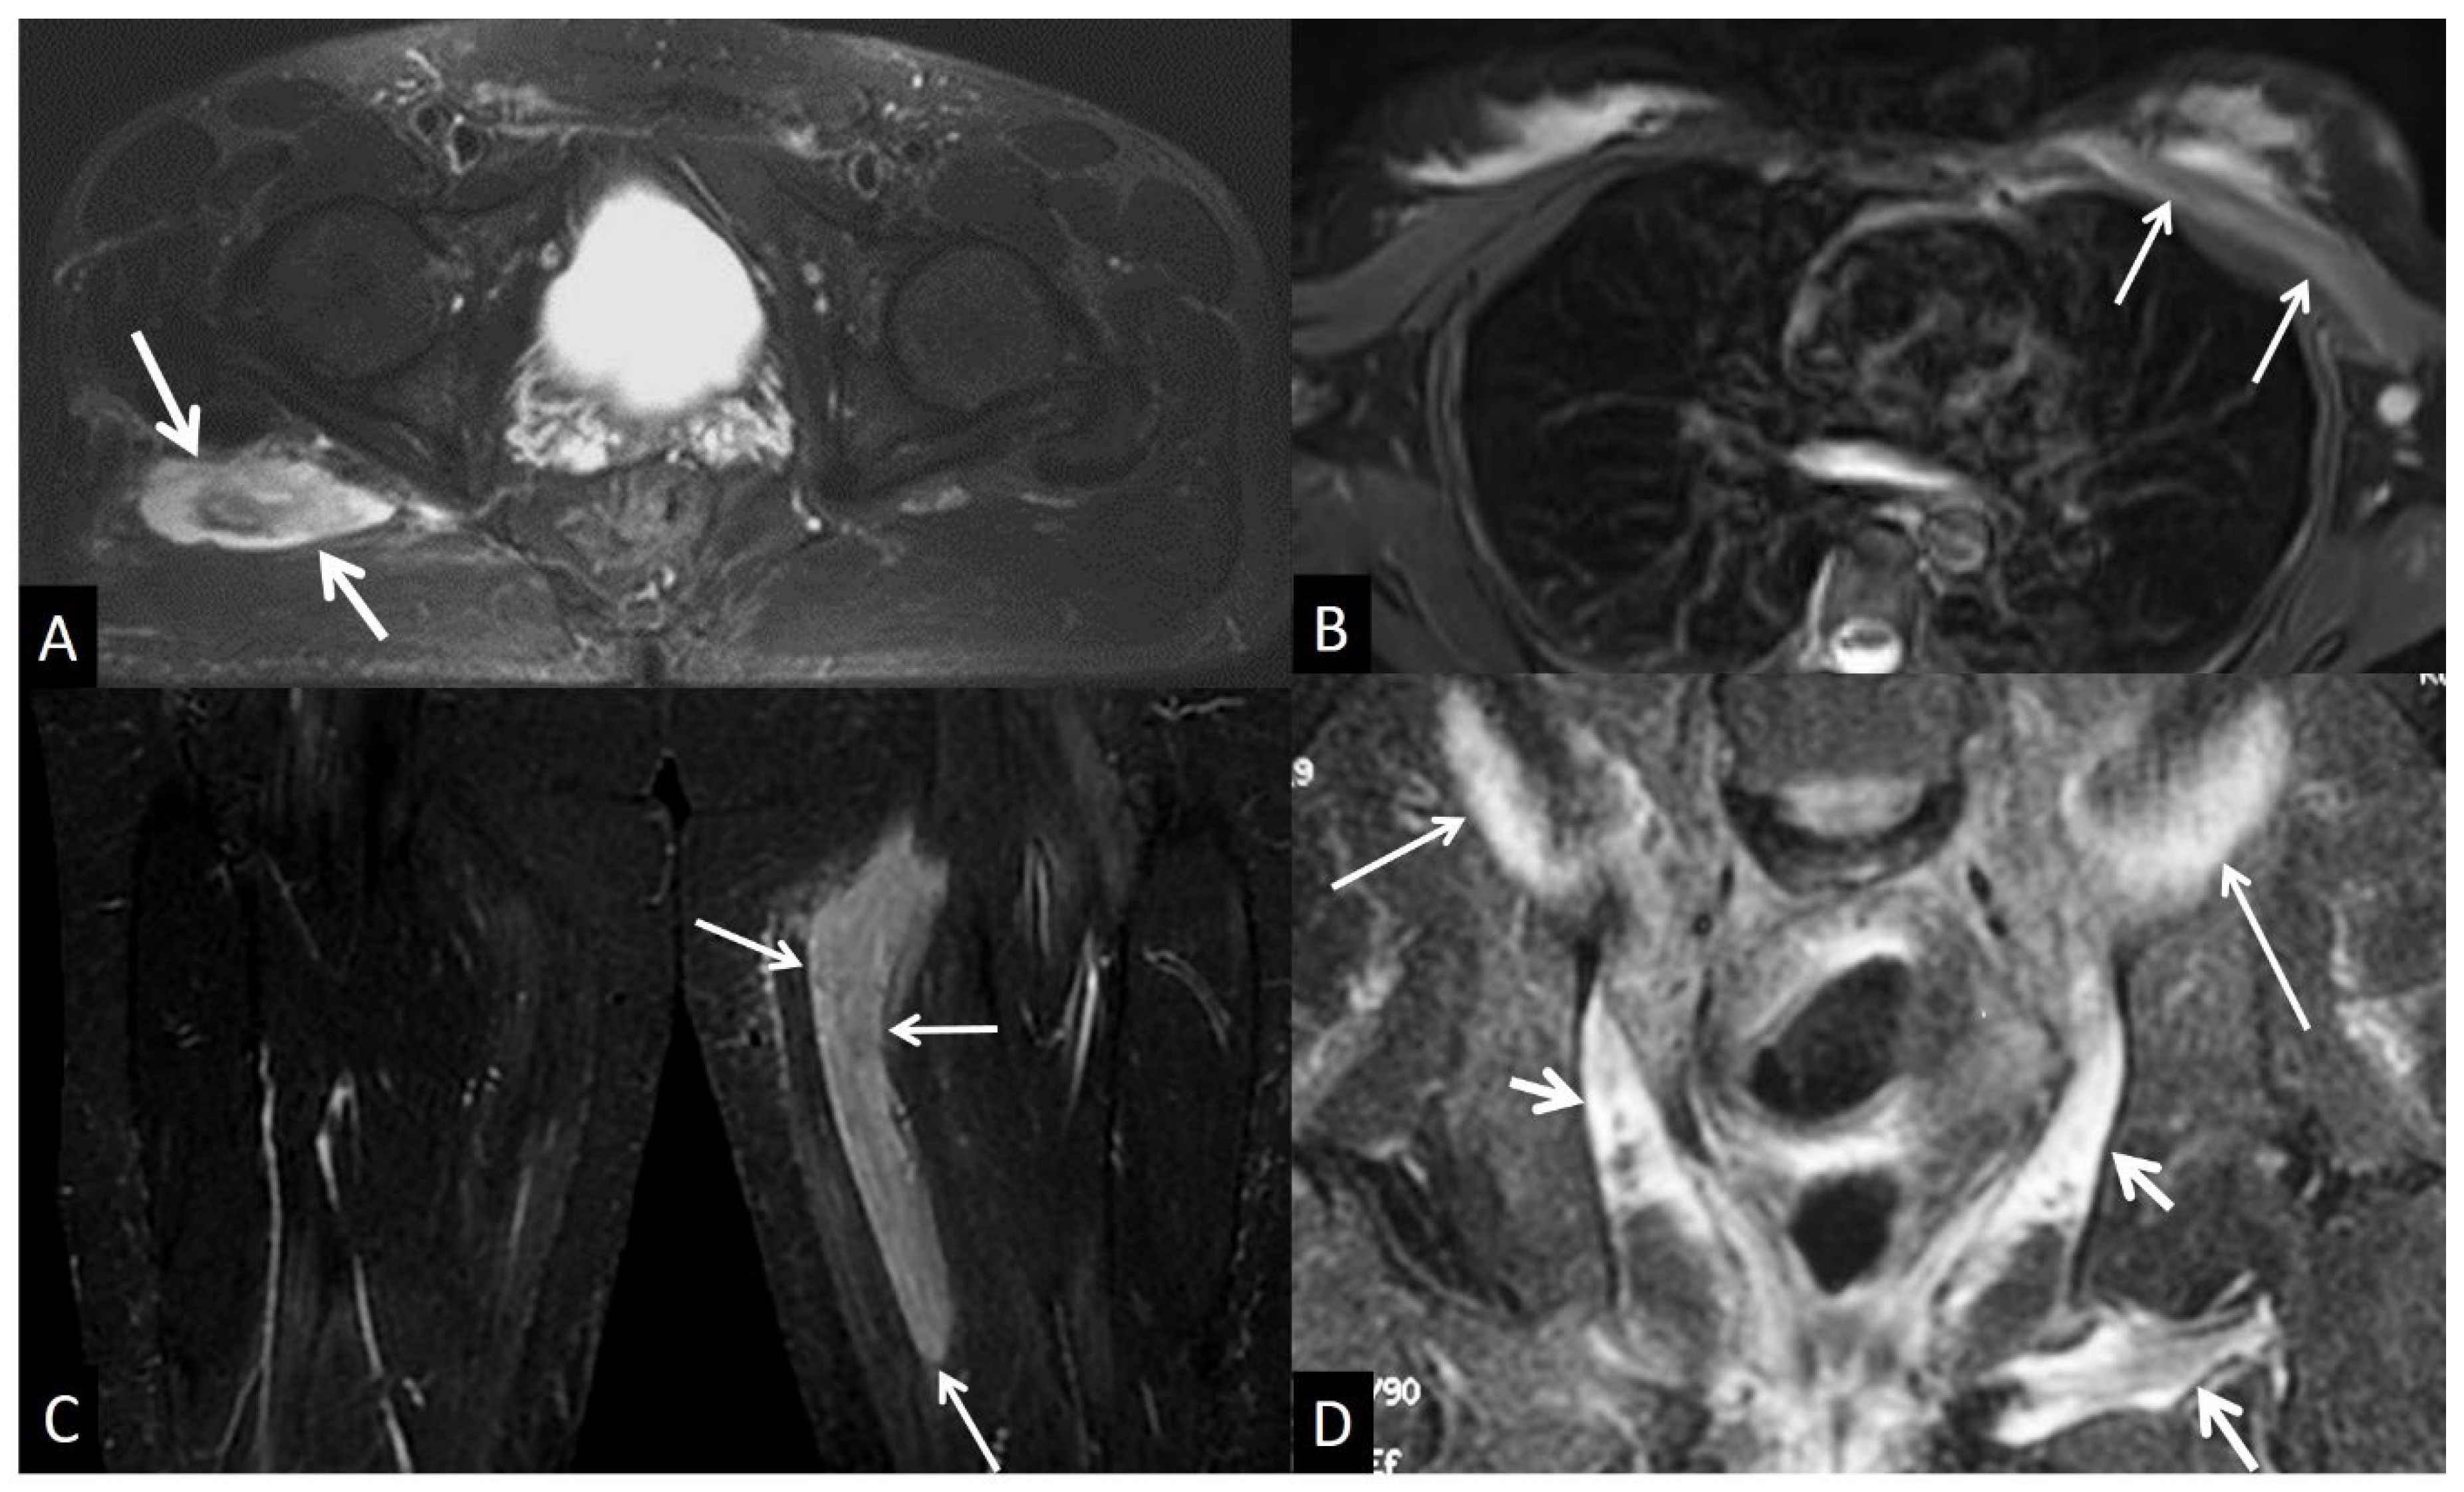
Disclaimer/Publisher’s Note: The statements, opinions and data contained in all publications are solely those of the individual author(s) and contributor(s) and not of MDPI and/or the editor(s). MDPI and/or the editor(s) disclaim responsibility for any injury to people or property resulting from any ideas, methods, instructions or products referred to in the content. |
© 2024 by the authors. Licensee MDPI, Basel, Switzerland. This article is an open access article distributed under the terms and conditions of the Creative Commons Attribution (CC BY) license (http://creativecommons.org/licenses/by/4.0/).
Copyright: This open access article is published under a Creative Commons CC BY 4.0 license, which permit the free download, distribution, and reuse, provided that the author and preprint are cited in any reuse.


