Submitted:
27 August 2024
Posted:
28 August 2024
You are already at the latest version
Abstract
Side-chain liquid crystal polymers have been mixed with ferromagnetic particles, and the for-mation of a monodomain in magnetic fields studied. At relatively low concentrations, the presence of ferroparticles substantially speeds up the rate of formation of a monodomain with the magnetic field and at a given concentration of ferrofluid that rate is independent of the magnetic field strength. In this way, rapid formation of a monodomain is possible at magnetic field strengths far lower than required for the liquid crystal polymer alone. This is anticipated to very helpful in the fabrication of devices based on monodomain liquid crystal elastomers. Wide angle x-ray scattering has been used to monitor the formation of the monodomain and small angle x-ray scattering can give some indication of the ferroparticle behaviour. A model is developed to explain the behaviour. The alignment properties of the ferroparticles is related to their ability to form chains under the influence of very low magnetic fields; these chains are of relatively low stability and may become disrupted after long times, high magnetic fields, or high concentrations. In general, the best results for alignment were at volume fractions below 1%, and under these con-ditions there is the potential for producing monodomain samples with improved properties; in particular shape changes with temperature are significantly larger as a result of improved backbone orientation. Experiments involving monodomain formation and director realignment suggest that the presence of ferroparticles results in a modification in the mechanism for alignment development driven by the organisation of the polymer backbone as a consequence of the con-straints offered by the morphology of the chains of ferroparticles.
Keywords:
liquid crystal elastomers
; shape changes
; ferronametic polymer
; ferro nanoparticles
; nano-composites
1. Introduction
Liquid crystal elastomers are complex materials which combine the long range orientational ordering properties of liquid crystals with network formation, providing materials with the potential of, for example, reversible deformation [1]. It has been shown by various authors that cross-linking liquid crystal polymers produces materials with a memory of the state at the time of cross-linking. This may result in stabilization of, for example, the nematic phase through a reduction in phase transition temperatures, or for aligned samples, a memory effect [2]. In the memory effect, samples cross-linked following alignment in for example, a nematic phase can be heated to the isotropic phase, whereupon all the alignment of the liquid crystal phase is lost; on cooling below the nematic isotropic transition temperature the original orientation is regained. This memory effect is entropically driven through the network elasticity, which naturally returns the polymer chain confirmation to the arrangement present at the time of cross-linking. Perhaps even more striking in the chiral memory retained by networks formed in a chiral nematic phase and that memory is still present when the chiral imbalance has been removed [3].
A consequence of the memory effect in liquid crystalline elastomers is that the materials can exhibit shape changes at a phase transition temperature. This shape change is consequent on the alignment of the polymer backbone relative to the mesogenic groups [4]. The basic couplings which can be exhibited in a nematic system are shown in Figure 1. Guo et al (1991) [5] demonstrated that these different couplings were possible using a single random copolymer system, in which the proportions of the two monomers with different coupling chains were systematically varied and a composition was identified for zero coupling, which they termed N0, where the competing effects cancelled out. They used a simple mean field model to show that the two components of the coupling, that due to the restriction of the conformation of the coupling chain and the influence of the nematic field had a differing impact on the behaviour in the ratio of 2/1.5 to 1. Quantitative evidence of the coupling has been obtain using neutron scattering of deuterium labelled polymer chains [6,7]. Distortions of the polymer backbone at a microscopic level are then transmitted to the macroscopic level through the polymer network and thus, for a side-chain liquid crystal polymer in the liquid crystal state, polymer chains are distorted through coupling to the mesogenic groups; Such behaviour has the potential for developing devices, for example performing as actuators [8]; however maximum functionality requires development of high levels of polymer chain orientation and this may be highly dependent on the way in which side chain alignment is produced.
There are a number of ways of inducing an alignment into a liquid crystalline polymer to form monodomain sample [2]. Generally these can be categorized as alignment via an external electromagnetic field, alignment via a mechanical stress, and alignment via surface effects. An early example of the use of an external magnetic field is the method designed initially by Legge et al [2] and involves the use of a magnetic field to induce a common alignment of the domain directors and crosslinking over a long timescale. Probably the most well-known example of mechanical alignment is that devised by Küpher et al [9] which relies on applying a uniaxial strain to a lightly cross-linked polymer (necessary to prevent free flow of the material) followed by further cross-linking under load. Of these two examples, magnetic alignment is particularly convenient (not requiring a pre-crosslinking stage or connection to the external force), but the latter method has shown the potential to form extremely well-ordered samples with consequent potential for larger functionality for example, shape changes.
The two examples above impart different properties by virtue of the mode of alignment. For the mechanically aligned sample the uniaxial strain imparts orientation on the polymer backbone, extending the chain; the mesogenic alignment arises by virtue of coupling between the side chains and the polymer backbone. Dependant on the nature of the coupling chain the mesogens will align either parallel or perpendicular to the draw direction. In contrast, with a magnetic field the side-groups align in response to the applied field; the polymer conformation will then reorganise to maintain the preferred relative orientation of the backbone and the sidechain. It is crucial to the properties of the final material is that significant cross-linking does not occur before alignment is complete.
In this work, we discuss the alignment of liquid crystalline polymers in the presence of ferro-nanoparticles [10]. We have recently shown that the introduction of surfactant coated iron oxide nanoparticles can result in materials which show temperature-induced anisotropic shape changes which are consistently larger than those observed in the absence of these particles [11]. Here we describe the alignment processes of the various components of this composite material and discuss how the design can be optimised to be develop new actuator materials.
2. Materials and Methods
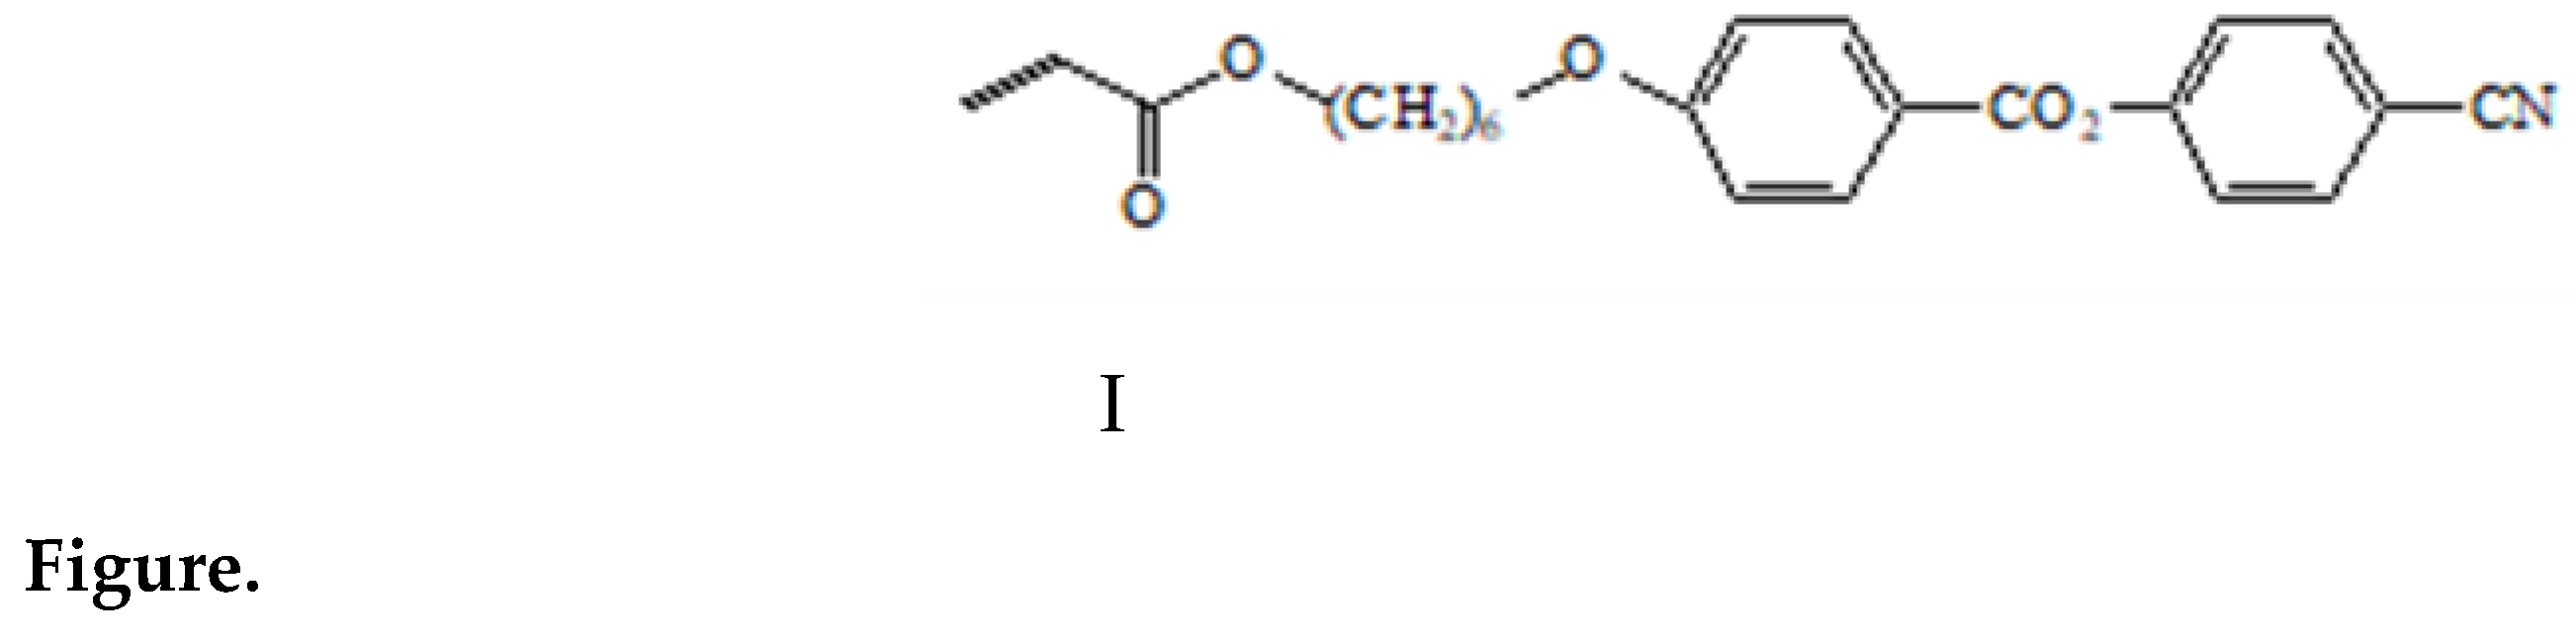
The liquid crystalline polymers prepared were copolymers of the aromatic ester I with hydroxyethyl acrylate synthesised following the basic procedures of Portugal et al [5] with modification developed by Dil Patel. Essentially Portugal et al synthesised the cyaunobenzoate material by forming an acid chloride from thionyl chloride and 4-(8-propenoxyloxyhexoxy) benzoic acid. This methodology produces a side-product that is difficult to remove. The patel modeification goes directly from an acid to the ester product eliminating the requirement for the acid chloride and so avoiding the side-product. The method employed here use dicyclohexylcarbodiimide and produces dicyclohexylurea as a side-product that can easily be removed by filtration.
Polymerisation is initiated using 1 mol % azo-bis-iso-butyronitrile in a 10 ml to 1g solution with degassed chlorobenzene. The reaction was performed under vacuum at 55° C and left for 24 hours. . The products were characterized using infra red spectroscopy, H1 and C13 nmr, and gel permeation chromatography as described previously [14,15].
The sample used for these studies had Mw 2.4 x 10⁶ Daltons and Mn 2.825 x 10⁴ Daltons with typically a Tg of 33 °C and a TNI of ca. 129 °C.
The dry ferrofluid was obtained from Ferrofluidics Ltd. This consists of spherical surfactant-coated magnetite particles with a 10 nm diameter. This was confirmed by examination of the dry ferrofluid using a transmission electron microscope (Philips CM20 ) with an accelerating voltage of 200kV. Figure 2 shows an electron micrograph confirming the diameter of the ferroparticles. A ferroparticle containing polymer film was prepared by mixing the ferroparticle dispersed in dichloromethane with the polymer at various concentrations. Solutions were cast on to an appropriate surface typically Kapton, or for microscopy, a glass slide.
The nematic phase exhibits long range orientational order with a domain director and an order parameter S. where S is defined as in Equation 1.
 Where α is the angle between the long axis of the molecular unit - in this case the mesogenic side-group and direction. In a typical sample prepared on an untreated surface, local surface effects will introduce variation in the orientation of the director as schematically shown in Figure 3. It is the spatial variation of the director which give rise to the characteristic optical textures which can be observed in an optical microscope.
Holding such a polydomain film in a magnetic field will lead to a common alignment of the domains and the elimination of defects leading to an optically transparent film and a monodomain sample. If the monodomain formation takes place sufficiently rapidly, then no significant cross-linking will have taken place. To achieve this crosslinking was performed in this case using 4,4- methylene bis (cyclohexyl isocyanate) in order to ensure the rate of alignment is substantially greater than the rate of cross-linking. In this material the 4-cyanophenyl 4-benzoate mesogen has a positive diamagnetic anisotropy and it will align with the longest axis parallel to the magnetic field. The time taken for a monodomain formation depends on both the diamagnetic anisotropy Δχ and the rotational viscosity λ1. Typically the orientation time τ, an applied magnetic field of H is given by Equation 2
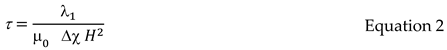 Where μ0 is the permeability of a vacuum. As the mesogens rotate, the polymer backbone also undergoes a reorientation. The simple model contain in Equation 2, may not be sufficient to completely account for the influence of the polymer chains on the alignment time, introducing the effect of chain length on viscosity, but it provides a model to develop.
The formation of monodomains was performed using a Newport Instrument 4 inch electromagnet with 1.5 inch conical pole pieces. The magnet was water cooled and the gap between the pole pieces was 10mm producing a maximum field of 2.1T. The magnetic field was calibrated using a Hall probe and was homogenous over the sample area. The sample was mounted in a hot stage developed in-house connected to a 3 term PID temperature controller. The layout is shown in Figure 4a In some situations we probed the state of the liguid crystal polyer/elastomer using optical techniques as shown schematically in Figure 4b.
Figure 5 show a plot of the measured light using the system with cross-polarisers as shown in Figure 4b. There is a clearly a significant temperature effect. We also used wide-angle x-ray scattering measurements performed using the 3circle Diffractometer. The plot of orientation parameter <P2> is shown in Figure 6 for the liquid crystal held at 90° C and using a magnetic field of 2.1 T. These data were obtained by periodically removing the sample from the hot stage where upon it cooled to below the glass transition which froze in the structure and any relaxation processes were inhibited.
Figure 5 shows a plot of the global orientation parameter against time in a magnetic field of 2.1T. We can identify a value of time at which the orientation value reaches 50% of the final value. Figure 6 shows a plot of those times measured for a series of similar measurements made with different magnetic field values. The dashed line shows that fit to the expected variation as shown in Equation 2. We can see the variation follows the expected pattern.
After formation of the monodomain, a small sample, approximately 1 mm by 1.5 mm was cut from a monodomain CBZ6 elastomer with the longest length along the director. The sample was cut above the Tg, at 40 °C, to prevent cracking occurring in the brittle glass phase. The rectangular piece of elastomer was suspended in non-interacting silicon oil in a cavity slide and a cover slip placed over the cavity. The shape changes were monitored using a video camera attached to the microscope hot stage system.
Optical microscopy was undertaken using a Carl Zeiss Jenalab polarising microscope and samples were heated using a Linkam TH600 microscope hot stage.
Wide angle X-ray scattering (WAXS) measurements was performed using a transmission geometry three circle diffraction system using the Cu Kα line at 1.54178 Å [6]. The geometry is shown in Figure 7.
The X-ray beam was collimated to produce a 1 mm2 beam and the X-rays were detected by a scintillator detector. Using this system the scattering can be measured over a |Q| range of 0. 2Å-1 to 6.5Å-1 and from α = 0° to 360° where |Q| = 4πsin(θ) / λ and 2θ is the scattering angle and λ is the wavelength of the incident X-ray beam.
Small Angle X ray scattering (SAXS) experiments were performed using the Synchrotron Facility at the Daresbury Laboratory, Warrington and in particular Beam Line 16.1. An X-ray wavelength of 1.41 Å and a RAPID 2-D detector were used. The sample to detector distance was 3.12 m providing a |Q| range of 0.01 Å-1 to 0.14 Å-1. The detector was calibrated using the collagen from a wet rat’s tail; the SAXS pattern is a series of sharp orders occurring at regular intervals for which the |Q| values are accurately known; this allows the pixels on the detector image to be converted to Q values.
3. Results
3.1. Phase Behaviour of Ferroparticles in a Liquid Crystal Polymer
Mixtures of the nematic polymers with different quantities of ferroparticles were prepared in the way described above and observed under a polarizing optical microscope. Selected images are shown in Figure 8; as the ferroparticle content was increased to around 1.42 % by volume, black objects were observed in the mixture (Figure 8 a). As the ferroparticle content was increased further, the quantity of these objects was increased and the birefringence decreased; at around 5.68 % by volume of ferroparticles added, a black network was observed in the liquid crystal texture (Figure 8c). These dark objects were also observed in the isotropic phase and were unchanged in the presence of a magnetic field although here the birefringence became directional if in the nematic phase.
At low concentrations of ferroparticles the liquid crystal texture appears unchanged; for example at 1 % there appears to be no phase separation. At higher concentrations phase separation occurs, the ferroparticles formed aggregates in the liquid crystal polymer matrix. At the highest concentrations examined, the ferroparticles formed a network structure within the liquid crystal polymer, which became denser with increasing concentration. This network formation was related to a decrease in the birefringence.
The influence of the ferroparticles on the phase behaviour was further monitored by measurement of the nematic isotropic transition temperature; the data is presented in Figure 9. All the samples were prepared by casting films from dichloromethane and so are directly comparable. Small quantities of ferroparticles to CBZ6 increased the TNI by up to 2° C. Addition of ferroparticles has also been reported to increase the smectic A to nematic transition temperature in another liquid crystal system [21]. The behaviour of this system is broadly in line with theoretical expectations [22] Once a plateau had been reached the TNI was reduced by the addition of further ferroparticles, thus a small quantity of ferroparticles stabilises the liquid crystal phase, but once a certain concentration is reached it acts as an impurity and starts to reduce the stability of the liquid crystal phase, and there is some phase separation.
3.2. Monodomain Formation
Figure 10 show a plot of the measured light using the system with cross-polarisers as shown in Figure 4b. There is a clearly a significant temperature effect.
We also used wide-angle x-ray scattering measurements performed using the 3circle Diffractometer.
Figure 11 shows a plot of the intensity recorded parallel and perpendicular to the monodomain director or the direction of the applied magnetic field. The intense broad peak at Q ~ 1.44Å-1 arises from the short range correlations between the mesogenic side chains and we use the azimuthal variation in this peak to evaluate the global orientation parameter <P2> which as indicated earlier is the product of the nematic order parameter S and the domain director orientation parameter <D2>. This process of quantitative evaluation is described in [23,24] and is a mathematically robust procedure which is summarized below. The scattering pattern I(|Q|, α) expressed as a series of amplitudes of spherical harmonics I2n(|Q|), where only the even harmonics are required due to the present of an inversion centre in the scattering pattern [23]. The amplitude of each harmonic is evaluated using equation 3 [23]

Where P2n(cos) are a series of Legendre polynomials. The Global orientation parameters <P2n(cos)> can be found at a |Q| value corresponding to the maximum intensity for the structural element of interest using Equation 4
 Where Pm2n are the values calculated for the scattering from a perfectly aligned structure. Reference [24] gives some values for common structures. In this study we are using the scattering arising from the correlations between the mesogenic side-groups which gives a peak in the scattering at |Q|~ 1.44Å-1 which intensifies on the equatorial section. Th advantage of using this feature is that it is the more intense feature in the scattering pattern and it is well separated from other structural features.
Figure 12 shows a plot of the I() at a fixed value of |Q|= 1. 44Å-1 used to evaluate the global orientation parameters <P2n>. The plot shows a symmetrical curve which Is inherent to the scattering data for a weakly-absorbing sample such as CBZ6. The intensification of the peak at 90° and 270° indicates directly that the long-axis of the mesogenic groups lie parallel to the magnetic field direction as is expected for mesogens which exhibit a positive diamagnetic anisotropy. A more complete structural analysis is given in references [19].
The plot of orientation parameter <P2> is shown in Figure 10 for the liquid crystal held at 90° C and using a magnetic field of 2.1T. These data were obtained by periodically removing the sample from the hotstage where upon it cooled to below the glass transition which froze in the structure and any relaxation processes were inhibited.
The plot of orientation parameter <P2> is shown in Figure 10 for the liquid crystal held at 90° C and using a magnetic field of 2.1T. These data were obtained by periodically removing the sample from the hotstage where upon it cooled to below the glass transition which froze in the structure and any relaxation processes were inhibited.
Figure 5 shows a plot of the global orientation parameter against time in a magnetic field of 2.1T. We can identify a value of time at which the orientation value reaches 50% of the final value. Figure 11 shows a plot of those times measured for a series of similar measurements made with different magnetic field values. The dashed line shows that fit to the expected variation as shown in Equation 2. We can see the variation follows the expected pattern.
Figure 10 shows the variation in these alignment times as a function of the applied magnetic field strength. The plot shows the strong effect that the magnetic field strength has on the alignment time. The magnetic fields we use in this work are at the limit due to the saturation of the magnetic field in the iron core pole pieces. Larger magnetic fields are available with air cored magnetics as in the case of superconducting magnets where fields up to 45T are possible. Clearly heating the sample in a cryogenically cooled bore is more challenging than the methodology presented here. It is interesting that the alignment times follow the 1/B2 model (equation 2) and We anticipated that the molecular weight would have a strong influence on the alignment times. Figure 14 shows the global orientation parameter <P2> plotted against time in a fixed magnetic field of 2.1T at 90° C against two samples of CBZ6 with differing molecular weights but otherwise chemically equivalent.
Figure 15.
A plot of the global orientation <P2> against time, for two sample of the liquid crystal polymer used in this work at 90° C and in a magnetic field of 2.1T. SIP198 has a Mw of 2,400,000 and a Mn of 28,250 SIP127 has a Mw of 27,600 and a MN of 13,200.
Figure 15.
A plot of the global orientation <P2> against time, for two sample of the liquid crystal polymer used in this work at 90° C and in a magnetic field of 2.1T. SIP198 has a Mw of 2,400,000 and a Mn of 28,250 SIP127 has a Mw of 27,600 and a MN of 13,200.
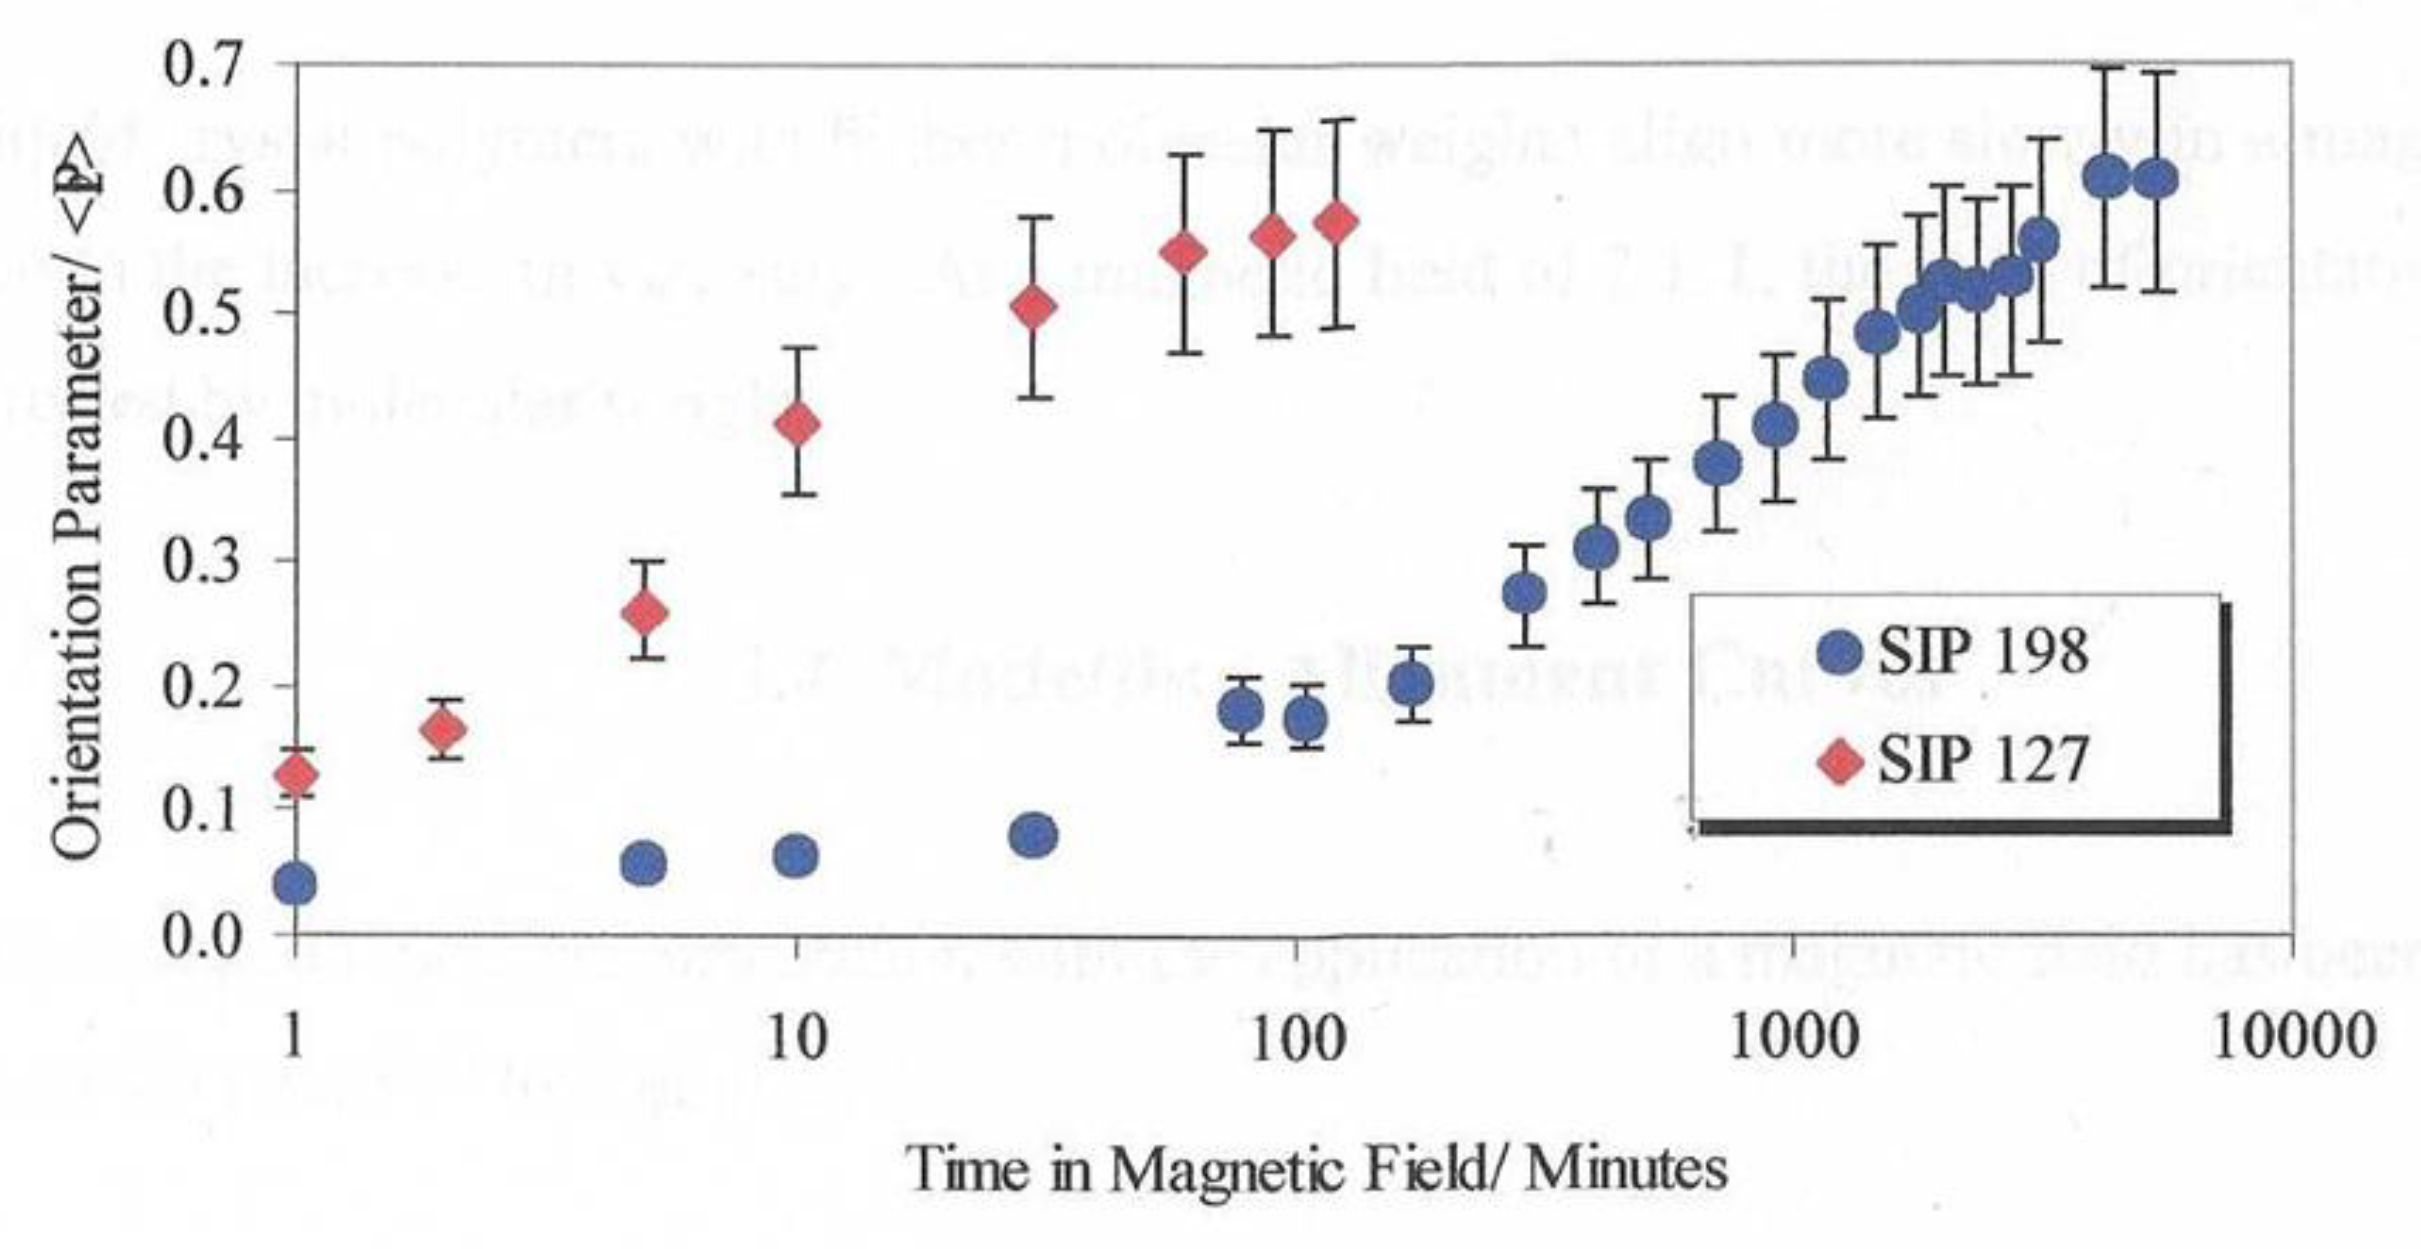
These differences can be attributed to the greater viscosity for the higher molecular weight polymer. The ratio of the alignment time is over a factor of 16. Now we turn attention to evaluating the behaviour of mixtures of the polymer with ferro nanoparticles. Wide angle X-ray scattering was used to probe the intermediate range structure (distances between neighbouring molecules). Figure 16 shows the equivalent scans of the polymer plus differences volume fractions of the nanoparticles.
These curves are essential the same as shown in Figure 8 for the polymer apart from the superposition of some small sharp bragg reflections arising from the magnetite in the nanoparticles. It is clear by comparison of the curves for the parallel and perpendicular sections that the magnetite scattering is isotropic. This was confirmed by azimuthual sections at the peak positions for the magnetite [25] (for example at |Q|=2.1Å-1(220), |Q|=2.48Å-1(311), |Q|=3.89Å-1(511), |Q|=4.26Å-1(440). The background in these sections is higher than the polymer alone due to the X-ray fluorescence from the iron. For these samples, the Kapton substrate used in their fabrication before measurement of the X-ray scattering has not been removed and so this also contributes to the background, and this is also shown in Figure 12. Figure 17 shows the development of the Global Orientation Parameter <P2> against time for samples of the polymer plus a small fraction of the nanoparticles.
A comparison of the two curves in Figure 17 shows a remarkable change in the alignment time with the addition of the ferro nanoparticles. The time to reach 90% of the maximum value of <P2> observed was reduced by a factor of 4 by the addition of 0.28% v/v of ferroparticles. In order to develop an understanding of the mechanism and the optimum fraction of ferro particles a range of polymer films with different composition ranging from 0.07% to 28.4%were prepared and the alignment time evaluated through repeated X-ray scattering measurements. Figure 18 shows the maximum value of <P2> for each composition were held in a magnetic field of 2.1T at a temperature of 110° C. There are two regions of this plot. At lower concentrations of the ferroparticles, the value of <P2> appears to exhibit a more or less constant value and the second region which shows a rapidly reducing value above a concentration of 0.52%. In the first region the ferroparticles appear to enhance or at least stabilize the maximum value of <P2> whereas above a volume fraction of 0.52%, orientational order appears inhibited.
Figure 19 shows a plot of the alignment times of the monodomains formed from the mixture of the polymer and a small fraction of the ferroparticles and remarkably the alignment time is independent on the applied magnetic field. Note that for the mixture with 0.28% ferroparticles, this invariance could be observed at a very low field ~ 0.15T, this was the lowest field which could be obtained using the electromagnet used in the preparation system due to the remanent magnetisation of the iron pole pieces. To emphasise this remarkable observation, the alignment time is invariant with magnetic field from .15T to 2.1T. This is in marked contrast to the alignment times for the monodomains prepared from the polymer which show a strong dependence on the strength of the applied magnetic field, see Figure 10.
The first proposal of mixing ferroparticles with liquid crystals was made by de Gennes and Brochard in a paper published in 1970 [26] They suggested that there was both a magnetic field effect on liquid crystal alignment due to the anisotropic magnetic field surrounding even a spherical particle and a mechanical effect due to the elongated particle that they used. The invariant nature of the alignment time with the magnetic field in the current work suggests that there is indeed another alignment mechanism in place which is sufficiently strong to mask the inherent magnetic field effect due to the diamagnetic anisotropy of the mesogenic units.
Ferrofluids, essentially a suspension of magnetic particles in a carrier fluid, were first developed in the 1960s and subsequently developed for a wide variety of applications [27,28] ranging from rocket fluid [28] through magnetic hyperthermia in medical physics [29] and for fluid seals [30]. Due to their size, nanoparticles are readily magnetized but usually have no magnetization when the applied magnetic field is removed. Consequently, they readily form dipolar chains of nanoparticles. Zubarev et al [22] have developed a theoretical model which predicts the mean number of particles n in a chain due magneto-dipole inter-particle interaction as
 Where φ is the solid fraction and λ is the dimensionless coupling coefficient which is a measure of the strength of the particle-particle interactions and determines the probability of aggregate formation due to magneto-dipole interactions. can be derived using Equation 6
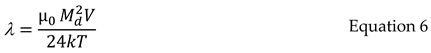 Where Md is the saturation moment of the bulk, V is the particle volume and 0 is the permeability of free space. To give an example, a 10nm magnetite particle at 298K with Md= 466kAm-1, n=1.36 so little chaining occurs, whereas for a 13nm particle n is infinite. In this situation λ~0.4 and it is the regime that long chains are formed A λ≥ 3 is required for spherical aggregates. At higher concentrations Dubois et al [32] observed cellular like structure.
We can expect that these chains form parallel to the magnetic field present a series of internal surfaces in a similar manner to polymer stabilized liquid crystals [33,34]. Just as the interactions with any surface will affect the alignment of the nematic domains, we propose a simple model to explain the results in Figure 14. In the absence of an external magnetic field, the ferroparticles are randomly arranged. Realistically it is difficult to place the sample in a zero magnetic field, due to the earth’s magnetic field of ~ 30T. Increasing the applied magnetic field to 0.15T is sufficient to align the chains of the nanoparticles, the response time will depend on a threshold magnetic field, the viscosity of the polymer and the number of internal surfaces. The latter gives rise to the composition dependence shown in Figure 15. Figure 14 shows the dependence of the maximum value of <P2> observed during the formation of the monodomain. Clearly all of the compositions in the first region of this plot are sufficient to drive the domain alignment towards a monodomain and we attribute this to the fact that these chains are organized in a parallel 2d manner. As the proportion of ferro particles increases, the morphology of the chains becomes more 3-D and starts to inhibit monodomain formation.
In order to explore if there is any additional evidence to support this chain model for the invariance of the monodomain formation time we used both laser and X-ray scattering to probe the appropriate samples. A dispersion of the ferroparticles in kerosene readily yields a highly anisotropic light scattering pattern between crossed polarizers lying normal to the applied magnetic field direction. The characteristics of the light scattering yielded objects 24 µm long and 5 µm. The external surface of a cross-linked sample of the polymer with 0.28% volume fraction of ferroparticles showed a rippled surface when examined in a scanning electron microscope which were µm wide. Although it is tempting to associate these with the chains of particles, the work of Zubarev et al [22] predicts such a rippled surface as the ferroparticles are generate a surface according to the field lines.
Figure 20 shows that the 2D small-angle scattering pattern for the monodomain shows strong scattering clustered around the zero-angle point. Although much of the scattering is obscured by the beam stop, we can see that it shows some highly anisotropic scattering in which the scattering is high constrained in the vertical direction indicating some highly extended objects and spread out in the horizontal direction indicating that the extended objects are quite narrow in the horizontal direction. We attribute such features as arising from individual chains. The strength of scattering increases with increasing volume fraction of the ferro particles and an increasing level of anisotropy with increasing time in the magnetic field.
Tentative analysis of these features by fitting a gaussian peak to the observable data yields a width of the anisotropic object of 10 µm with length evaluation probably limited by the resolution of the setup but in excess of 100 µm.
3.3. Monodomain Shape Changes
An aligned liquid crystal polymer crosslinked in a magnetic field produces a monodomain sample which will retain a memory of alignment; in addition the monodomain will change shape with temperature. In the case of the rectangular samples used here, and as alignment is unidirectional, and the sample had axial symmetry, then as viewed in the microscope (effectively in two dimensions) the sample was seen to become longer in one direction and shorter in the other. For the liquid crystal polymer containing 0.28 % it was found that the at 40° C the length of the sample parallel to the alignment direction increased by 20% compared to the sample in the isotropic state (the perpendicular direction reduced in size by half this amount). This was substantially higher than the elastomer with no ferroparticles; here the maximum elongation was 16 %. A full plot showing sample shape as a function of temperature is provided in Figure 21.
Video recording of the temperature induced shape changes showed that the change in dimension was complete within 100 s following a temperature jump to another temperature. The thermally induced shape change in a monodomain liquid crystalline elastomer reflects the orientation of the polymer backbone at the time of cross-linking. When the liquid crystal side groups align, the polymer backbone, locally, takes up a preferred orientation to the side chains (in this case parallel). This leads to a reorganization of the polymer backbone to reflect the preferred orientation. Subsequent cross-linking increases the stability of this orientation; the nematic phase is stabilized and distortion of the polymer chain from the conformation at the time of cross-linking requires additional energy to overcome the elasticity of the polymer network. For a lightly cross-linked sample, heating to the isotropic phase results in loss of any substantial orientational order (albeit with some persitent birefringence) and the polymer backbone takes up an isotropic arrangement. Since cross-linking in a monodomain avoids the masking effect of a polydomain morphology, the microscopic shape changes are observable on a macroscopic level; thus changes in backbone orientation are reflected in the overall shape of the polymer. We contrast this technique for measuring the shape of the polymer chain trajectory with the multiple steps of preparing a selectively deuterated polymer, and the subsequent small-angle neutron scattering as described in reference [7].
The observations described above show that the presence of ferrofluid imparts a greater level of backbone orientation to the monodomain elastomer, albeit with a similar level of alignment of the mesogenic side groups. There are a number of possible origins for this effect, these include; firstly an increase in local magnetic field strength, secondly the ferromagnetic particles alignment induce more rapid mesogen alignment; thirdly the formation of ferromagnetic chains induces alignment of the polymer backbone. The alignment time was found was to be independent of field strength, and occurred rapidly at low magnetic fields so a mechanism involving an the increase in local field mechanism is unlikely. The fact that the ferroparticles are spherical, and the low concentration required for alignment, suggests that a torque mechanism of the type described by Brochard and de Gennes is unlikely. We have seen that the ferroparticles form chains when a magnetic field is applied and it is these chains that are associated with the faster mesogenic unit alignment, and by implication the polymer backbone. It seems likely that the mesogenic unit and the ferroparticle chains interact, particularly as chains of ca. 50 µm have been observed when a magnetic field of 0.01T was applied to a ferronematic in the isotropic phase and then cooled into the liquid crystal phase. Crucial to this process is the rearrangement of the polymer backbone to optimize its preferential orientation relative to the mesogenic units, this process is likely to be substantially slowed by the need to break up local mesogenic order on a microscopic scale; distortion of the polymer backbone directly is likely to be a kinetically more favoured process. The substantially increased backbone orientation evident from these samples, does suggest that at least in part the chains formed by ferroparticles act directly on the polymer backbone.
3.4. Director Rotation
In order to further understand the role of ferroparticles in the orientation of the liquid crystal polymer we conducted experiments to reorientate the aligned polymer systems. A 2.1 T magnetic field was applied at 90° to the director of an aligned ferronematic polymer (0.28 % volume fraction) and the change in mesogenic side group orientation was monitored using X-ray scattering and the three-circle diffractometer. The angle of side-group orientation gradually changed with time to correspond to the new magnetic field direction in approximately 30 minutes. This time appears to be independent of magnetic field strength at the fields investigated (0.8T – 2.1 T). It was also found that this reorientation resulted in a decrease in the order parameter as the mesogens rotated; this decrease is independent of field strength both in depth and time. The orientation level is recovered at the same time as the new angle of orientation is reached. This behaviour can be compared with the reorientation of CBZ6 without ferroparticles. Figure 15 shows this system takes longer than the ferronematic polymer to reorganize (as with the initial monodomain formation}. The intermediate decrease in orientation is much larger and there is a discontinuity in the change in
The difference in behaviour can be seen more clearly by looking at the X-ray scattering azimuthal scans, showing intensity as a function of alpha, where alpha is the angle to the original director. For the non-ferronematic polymer Figure 21 (a) shows a gap in the plots where the maximum orientation angle discontinuity occurs. In contrast for the ferronematic polymer Figure 21 (b) shows a continuous array of plots where the orientation angle changes smoothly to the applied magnetic field direction.
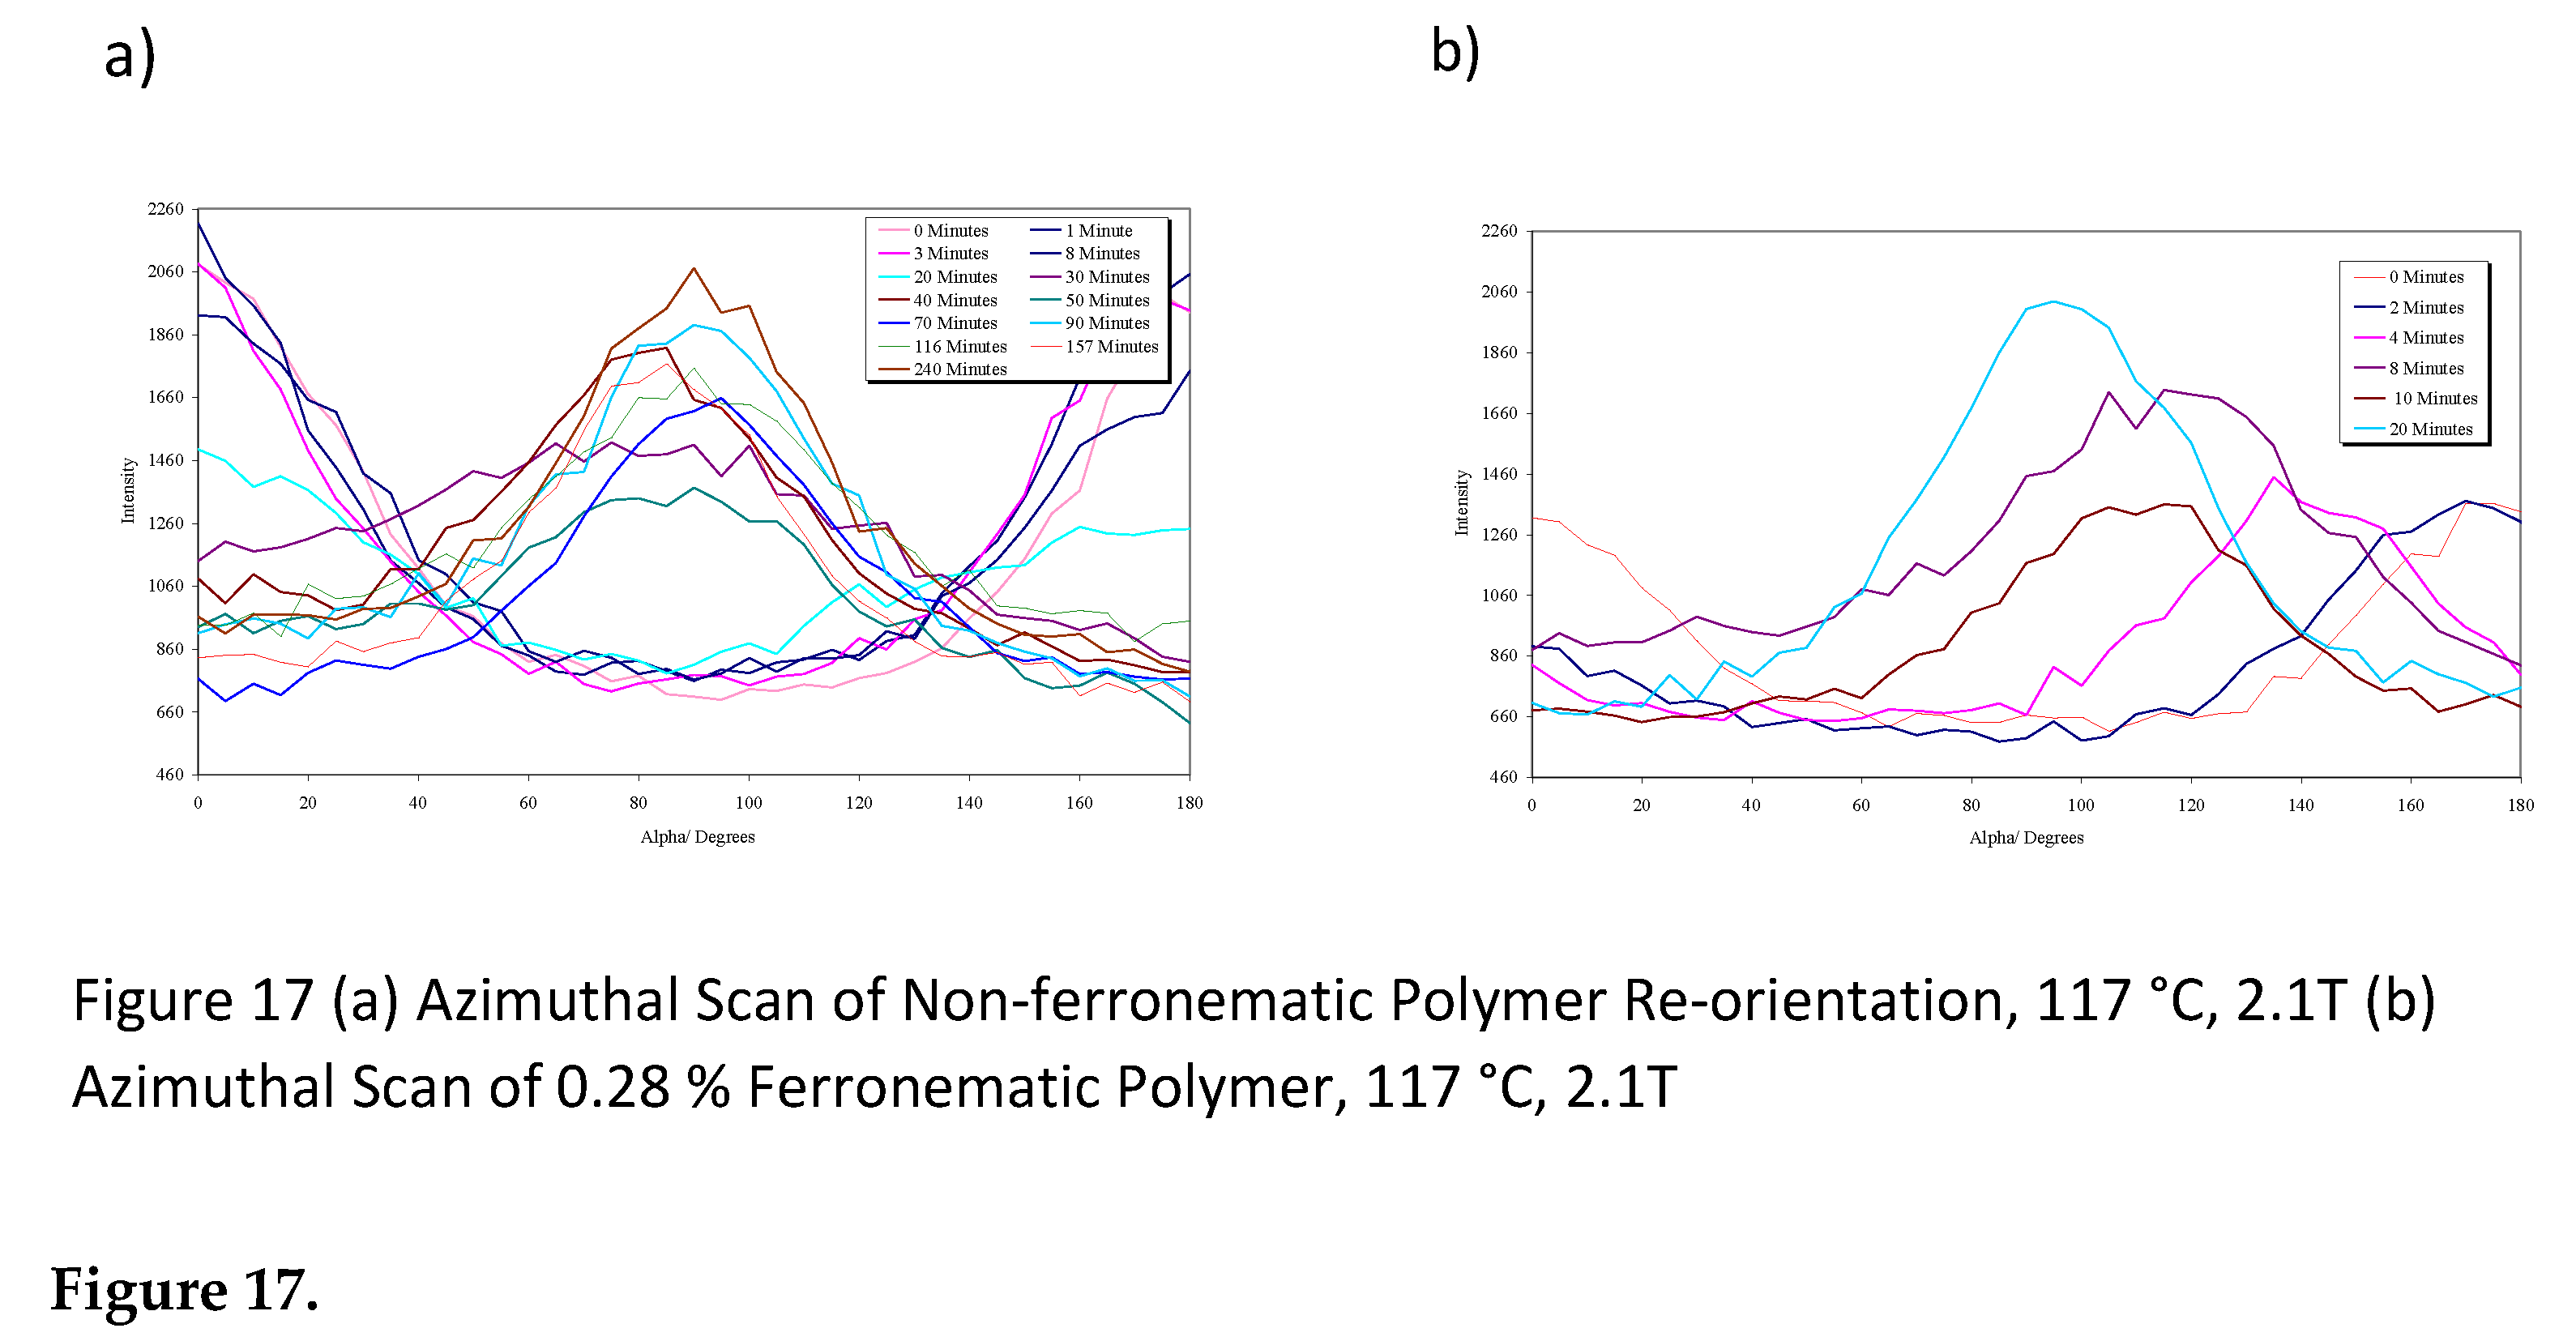
The behaviour of the ferronematic polymer reorientation is different to that for the non-ferronematic polymer. The non-ferronematic polymer exhibits a discontinuity in the maximum orientation angle and a decrease in the level of orientation as the director rotation occurs. This suggests that the mesogens are first unaligned and then realigned in the new direction, whereas the ferronematic polymer has a continuous change in maximum orientational angle and only a small decrease in the level of orientation indicating that the mesogens rotate together to the new direction, this appears to a be a collective behaviour. This strikingly different behaviour lends itself to two potential explanations; the firstly one is that it is more energetically favourable for the ferroparticle chains to rotate to the new magnetic field direction, rather than dissolve and re-assemble; since they influence the mesogens, the director follows the same behaviour. However, as we have seen above the ferroparticle chains are particularly unstable and lose their alignment relatively easily, even without the additional influence of a change in magnetic field direction. An alternative explanation is that for the materials aligned in the presence of the ferroparticles, it is a general realignment of the polymer backbone which is occurring, in this case loss of local mesogen alignment is energetically unfavourable, since it will require a greater distortion of the elastic network. This arises because the polymer backbone was originally better aligned with the ferroparticles and the backbone as a whole reorientates.
The difference in behaviour can be seen more clearly by looking at the X-ray scattering azimuthal scans, showing intensity as a function of alpha, where alpha is the angle to the original director. For the non-ferronematic polymer Figure 21 (a) shows a gap in the plots where the maximum orientation angle discontinuity occurs. In contrast for the ferronematic polymer Figure 21 (b) shows a continuous array of plots where the orientation angle changes smoothly to the applied magnetic field direction.
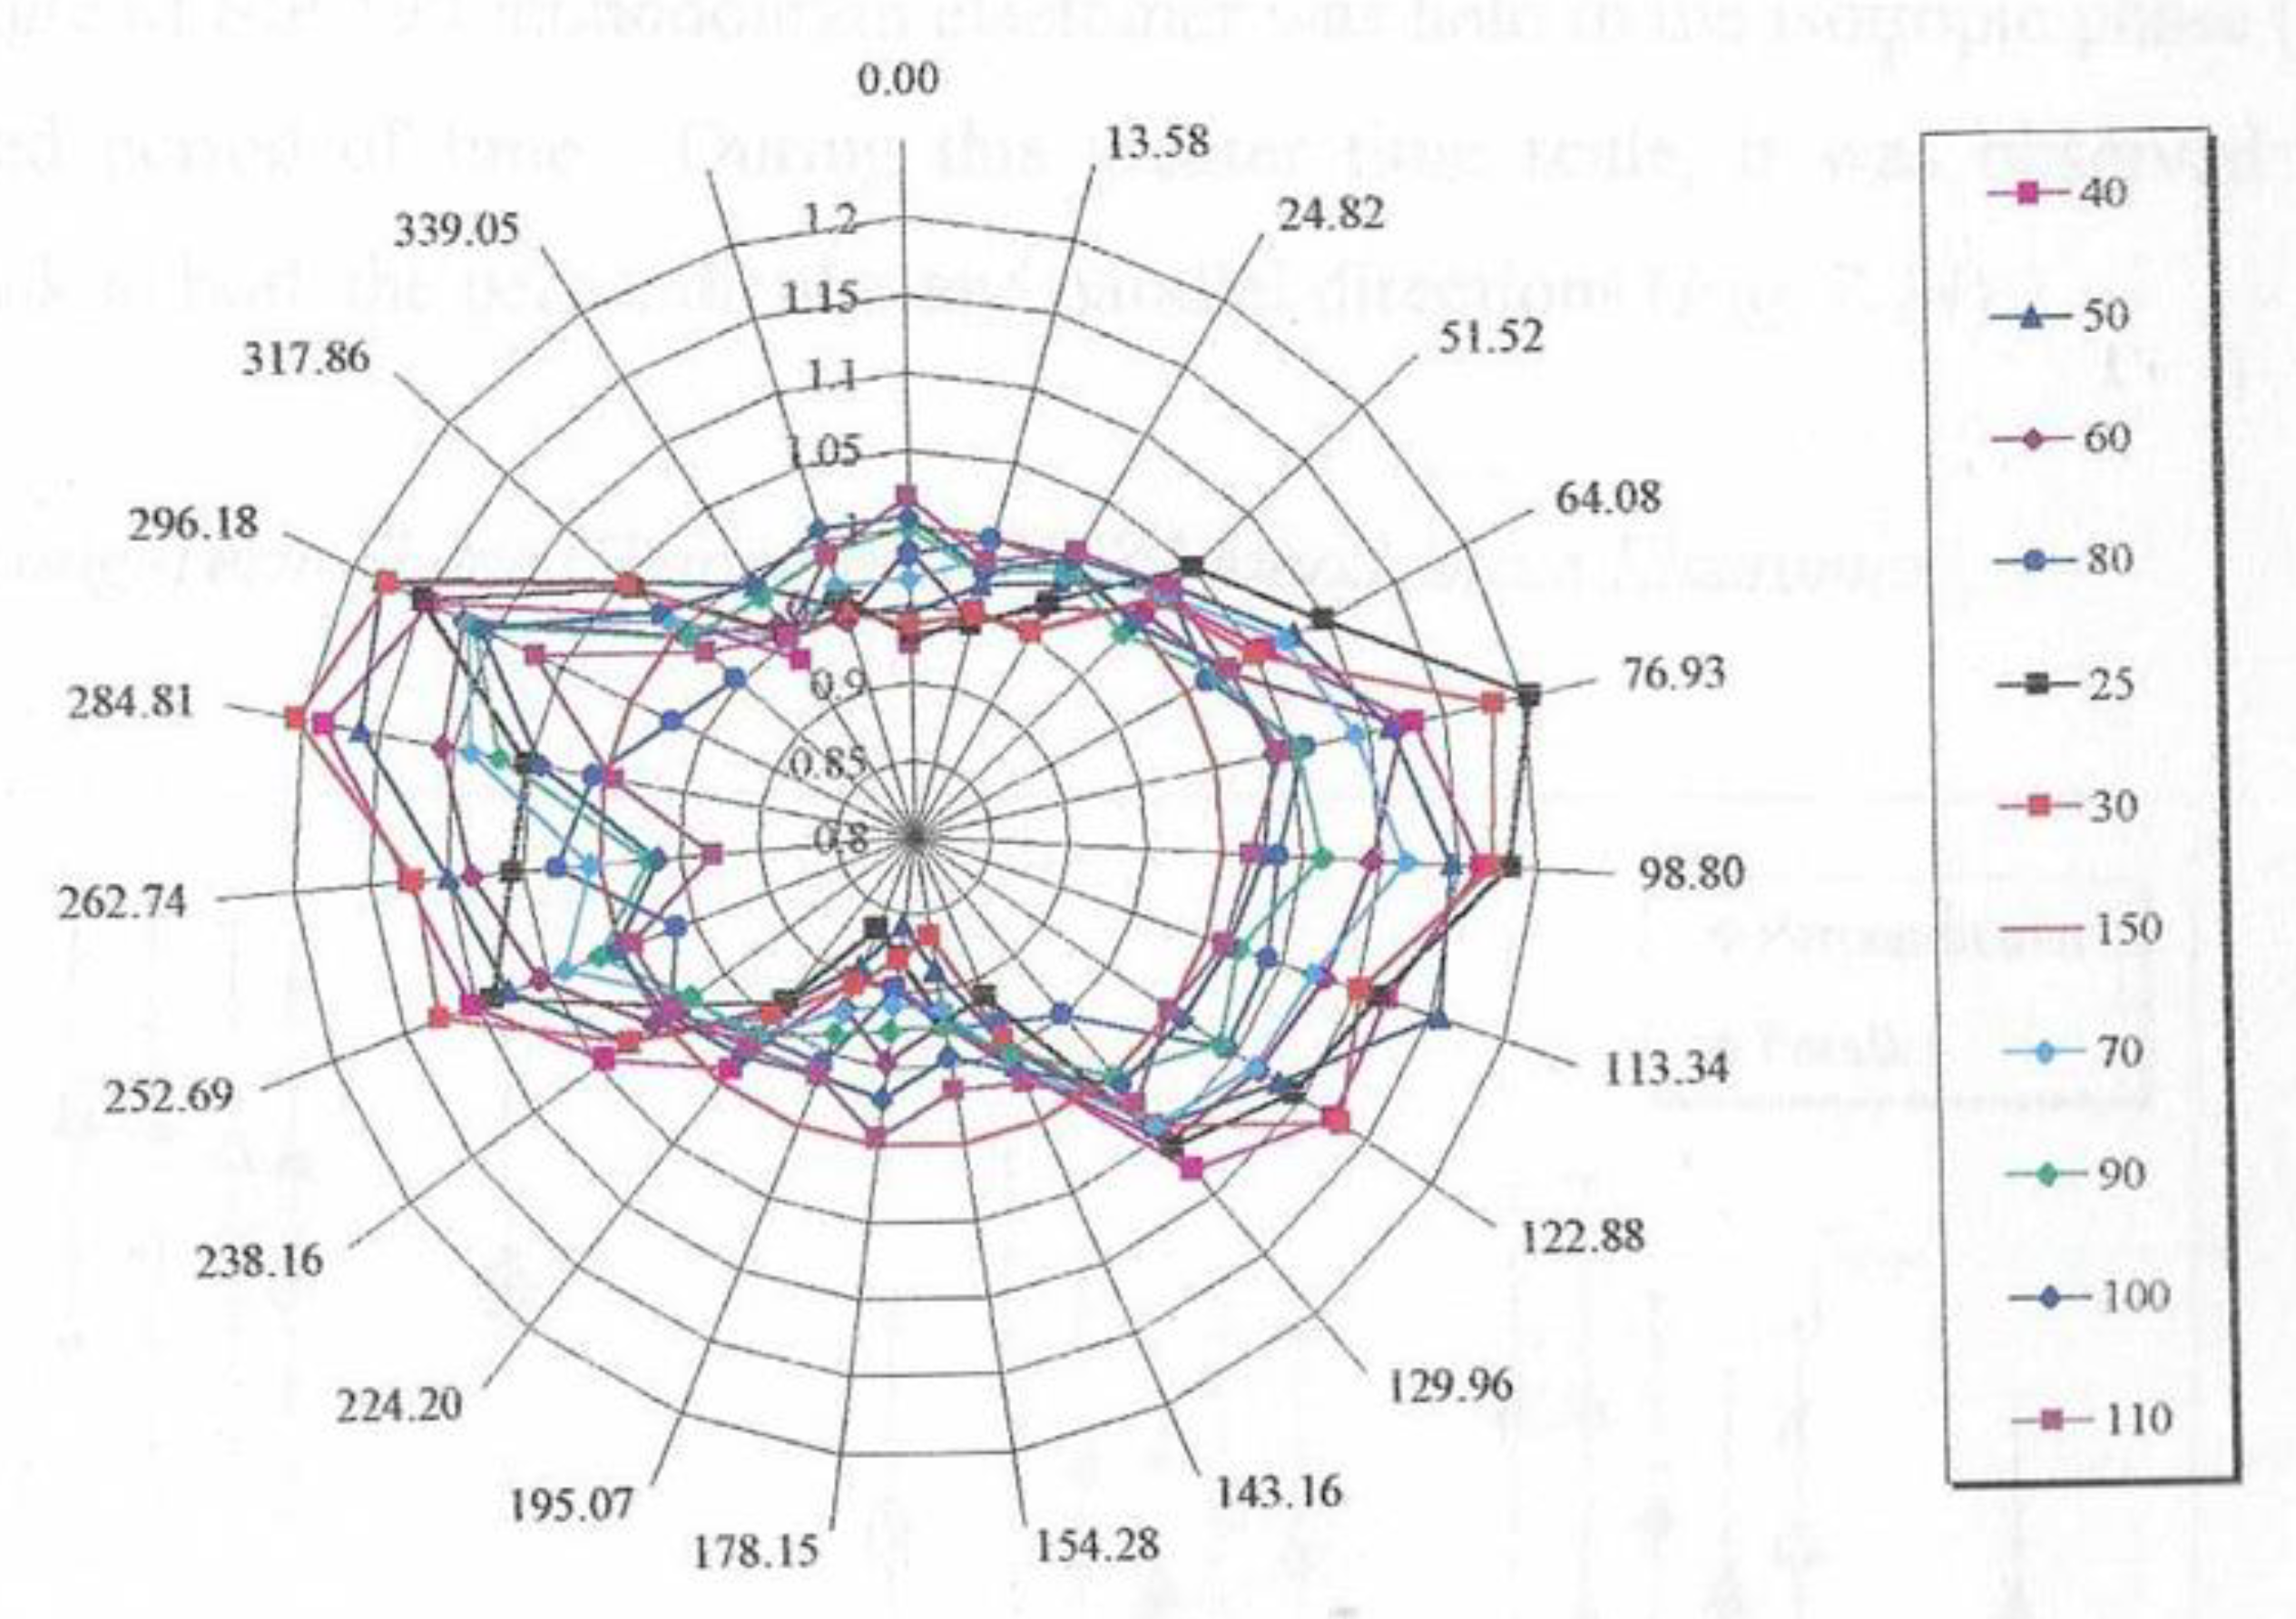
Figure 22 shows the shape change for an initially circular sample which was cut from a monodomain sample held in the isotropic phase. We have measured the dimensions of the sample at specific angular positions, a process easily achieved with digital imaging as the sample temperature was varied. This approach also compensates for any error in aligning the sample with respect to the original magnetic field direction. As Figure 22 shows the maximum changes is observed at an angle slightly titled from the horizontal. This measurement was performed with the chemically same polymer but with a lower molecular weight of Mw = 31,000 and Mn = 19,500.
4. Discussion
Authors should discuss the results and how they can be interpreted from the perspective of previous studies and of the working hypotheses. The findings and their implications should be discussed in the broadest context possible. Future research directions may also be highlighted.
5. Conclusions
- Nanoscale spherical ferroparticles can be added to a side-chain liquid crystal polymer to form materials with novel properties. Low concentrations of these magnetically active material significantly improve the alignment rtime for the formation of a monodomain sample
- For ferroparticle concentrations above 1% there is substantial phase separation of the inorganic component. The action of a magnetic field induces rapid formation of chain of the ferroparticles, such chains can be rather long on the molecular scale with micron length scales. However the chains are relatively unstable and become disrupted by time and high magnetic fields, and at higher concentrations are less likely to form or more likely to reorientate.
- It has been seen that the formation of these structures are associated with enhanced monodomain samples. The properties of monodomains from such materials are enhanced compared to liquid crystalline monodomains prepared in the absence of such ferrofluids; in particularly larger shape changes are observed as a function of temperature as the material is heated from the isotropic to the nematic phase. Experiments involving monodomain formation and director reorganisation suggest in the presence of the ferromagnetic nanoparticles the mechanism of monodomain formation is changed and driven by the polymer backbone.
Supplementary Materials
The following supporting information can be downloaded at the website of this paper posted on Preprints.org.
Author Contributions
Conceptualisation, G.R.M. and F.J.D.; methodology, S.J.R.; investigation, S.J.R.; material synthesis and characterisation SIP, resources, G.R.M.; writing original draft, F.J.D.; writing—review and editing, G.R.M and F.J.D.; Supervision, G.R.M. and F.J.D.; Project Administration, G.R.M.preparation, X.X.; writing—review and editing, X.X.; visualization, X.X.; supervision, X.X.; project administration, X.X.; funding acquisition, Y.Y. All authors have read and agreed to the published version of the manuscript.”.
Funding
This work was funded in Reading by the EPSRC through studentships to SJR and SIP and in Marinha Grande by the FCT through project reference UID/Multi/04044.
Institutional Review Board Statement
not applicable.
Informed Consent Statement
not applicable.
Data Availability Statement
Data is available on request to the corresponding author
Acknowledgments
We thank Dr Natalie Jordan for help with the SEM measurements.
Conflicts of Interest
The authors declare no conflicts of interest
References
- Z.-Z. Nie, M. Wang, H. Yang. Structure-induced Intelligence of Liquid Crystal Elastomers Chem. Eur. J. 2023, 29, e202301027. [Google Scholar] [CrossRef] [PubMed]
- Legge, C.H.; Davis, F.J.; Mitchell, G.R. Memory effects in liquid crystal elastomers. J. de Phys. II 1991, 1, 1253–1261. [Google Scholar] [CrossRef]
- Hasson, C.D.; Davis, F.J.; Mitchell, G.R. Imprinting chiral structures on liquid crystalline elastomers. Chem. Commun. 1998, 2515–2516. [Google Scholar] [CrossRef]
- Warner, M., Keller, A., Atkins, E. D. T., Thomas, E. L., Godovsky, Y. K., & Windle, A. H. (1994). Spontaneous Ordering in Polymeric Nematic Liquids and Solids [and Discussion]. Philosophical Transactions: Physical Sciences and Engineering, 348(1686), 59–72. http://www.jstor.org/stable/54302.
- Guo, W.; Davis, F.; Mitchell, G. Side-chain liquid-crystal copolymers and elastomers with a null coupling between the polymer backbone and the mesogenic groups. Polymer 1994, 35, 2952–2961. [Google Scholar] [CrossRef]
- Moussa, F.; Cotton, J.; Hardouin, F.; Keller, P.; Lambert, M.; Pépy, G.; Mauzac, M.; Richard, H. Conformational anisotropy of liquid crystalline side chain polymers : a small angle neutron scattering study. J. de Phys. 1987, 48, 1079–1083. [Google Scholar] [CrossRef]
- Mitchell, G.; Davis, F.; Guo, W.; Cywinski, R. Coupling between mesogenic units and polymer backbone in side-chain liquid crystal polymers and elastomers. Polymer 1991, 32, 1347–1353. [Google Scholar] [CrossRef]
- Min, J.; Wu, Z.; Zhang, W.; Liu, Y.; Luo, D. Intelligent Liquid Crystal Elastomer Actuators with High Mechanical Strength, Self-Sensing, and Automatic Control. Adv. Sens. Res. 2023, 3. [Google Scholar] [CrossRef]
- Küpfer, J.; Finkelmann, H. Nematic liquid single crystal elastomers. Die Makromol. Chemie, Rapid Commun. 1991, 12, 717–726. [Google Scholar] [CrossRef]
- V Cabuil.”Phase behavior of magnetic nanoparticles dispersions in bulk and confined geometries”, Current Opinion in Colloid & Interface Science,5, (2000), 44-48. [CrossRef]
- Reeves, S.J.; Davis, F.J.; Mitchell, G.R. Ferronematic Liquid Crystal Polymers and Elastomers. MATERIAIS. LOCATION OF CONFERENCE, COUNTRYDATE OF CONFERENCE; p. 135.
- Portugall, M.; Ringsdorf, H.; Zentel, R. Synthesis and phase behaviour of liquid crystalline polyacrylates. Die Makromol. Chem. 1982, 183, 2311–2321. [Google Scholar] [CrossRef]
- Sangdil Patel PhD Thesis University of Reading (2001) Memory Effects in Liquid Crystalline Elastomers.
- S.l Patel, F.J. Davis, P.M.S. Roberts, C.D. Hasson, D.Lacey, A. W. Hall, A. Greve and H. Finkelmann Liquid Crystalline Polymers, in Polymer Chemistry a Practical Approach ed F.J. Davis OUP Oxford 2004.
- Davis, F.J.; Gilbert, A.; Mann, J.; Mitchell, G.R. Liquid crystal elastomers: Synthesis and characterization. J. Polym. Sci. Part A: Polym. Chem. 1990, 28, 1455–1472. [Google Scholar] [CrossRef]
- de Gennes P.G. The Physics of Liquid Crystals Clarendon Oxford 1974.
- Abramowitz M. and Stegun I.A. “Handbook of Mathematical Functions” (1965) p452 Dover New York.
- Ballauff M. , Fischer E.W., Dries TH., Fuhrmann K. J Polymer Science Polymeer Physics (1992) 30 1199.
- Mitchell, G.; Davis, F.; Ashman, A. Structural studies of side-chain liquid crystal polymers and elastomers. Polymer 1987, 28, 639–647. [Google Scholar] [CrossRef]
- Hughes, D.J.; Mahendrasingam, A.; Heeley, E.L.; Oatway, W.B.; Martin, C.; Towns-Andrews, E.; Fuller, W. Time-Resolved Simultaneous SAXS/WAXS of the Drawing of Polyethylene at the Daresbury SRS. J. Synchrotron Radiat. 1996, 3, 84–90. [Google Scholar] [CrossRef] [PubMed]
- Chen, S.-H.; Amer, N.M. Observation of Macroscopic Collective Behavior and New Texture in Magnetically Doped Liquid Crystals. Phys. Rev. Lett. 1983, 51, 2298–2301. [Google Scholar] [CrossRef]
- Zubarev, A.; Iskakova, L. To the theory of structural phase transitions in ferronematics. Phys. A: Stat. Mech. its Appl. 1999, 264, 180–191. [Google Scholar] [CrossRef]
- Mitchell, G.R., Saengsuwan, S., Bualek-Limcharoen, S. (2005). Evaluation of preferred orientation in multi-component polymer systems using x-ray scattering procedures. In: Stribeck, N., Smarsly, B. (eds) Scattering Methods and the Properties of Polymer Materials. Progress in Colloid and Polymer Science, vol 130. Springer, Berlin, Heidelberg. [CrossRef]
- Lovell, R.; Mitchell, G.R. Molecular orientation distribution derived from an arbitrary reflection. Acta Crystallogr. Sect. A 1981, 37, 135–137. [Google Scholar] [CrossRef]
- Byrne, J.M.; Coker, V.S.; Cespedes, E.; Wincott, P.L.; Vaughan, D.J.; Pattrick, R.A.D.; van der Laan, G.; Arenholz, E.; Tuna, F.; Bencsik, M.; et al. Biosynthesis of Zinc Substituted Magnetite Nanoparticles with Enhanced Magnetic Properties. Adv. Funct. Mater. 2013, 24, 2518–2529. [Google Scholar] [CrossRef]
- Brochard, F.; de Gennes, P. Theory of magnetic suspensions in liquid crystals. J. de Phys. 1970, 31, 691–708. [Google Scholar] [CrossRef]
- Papell, S.S. Low Viscosity Magnetic Fluid Obtained by the Colloidal Suspension of Magnetic Particles. U.S. Patent 3215572, 1963.
- Rosensweig, R.E. (1997), “Ferrohydrodynamics”, Dover Books on Physics, Courier Corporation, ISBN 9780486678344.
- Nandhini G., Shobana M.K “Role of ferrite nanoparticles in hyperthermia applications”, Journal of Magnetism and Magnetic Materials}, 552 (2022) 169236, doi.org/10.1016/j.jmmm.2022.169236}.
- Karoen van der Wal, Ron A.J. van Ostayen, Stefan G.E. Lampaert “Ferrofluid rotary seal with replenishment system for sealing liquids”, Tribology International, 150 (2020), 106372. [CrossRef]
- Butter, K.; Bomans, P.; Frederik, P.; Vroege, G.; Philipse, A. Direct observation of dipolar chains in iron ferrofluids by cryogenic electron microscopy. Nat. Mater. 2003, 2, 88–91. [Google Scholar] [CrossRef]
- Dubois, E.; Cabuil, V.; Boué, F.; Perzynski, R. Structural analogy between aqueous and oily magnetic fluids. J. Chem. Phys. 1999, 111, 7147–7160. [Google Scholar] [CrossRef]
- Brittin, M.; Mitchell, G.R. Evolution of Network Structure in Polymer-Stabilised Liquid Crystals. Mol. Cryst. Liq. Cryst. 1999, 329, 145–152. [Google Scholar] [CrossRef]
- Ye, Y.; Guo, L.; Zhong, T. A Review of Developments in Polymer Stabilized Liquid Crystals. Polymers 2023, 15, 2962. [Google Scholar] [CrossRef] [PubMed]
Figure 1.
Molecular configurations of the side-chain relative to the polymer backbone in a liquid crystal side-chain polymer. NI and NII arise due to a perpendicular orientation between the two species forcing the backbone to describe an oblate spheroid. An NIII phase arises when the orientational is parallel, forcing the polymer coil to describe a prolate spheroid. .
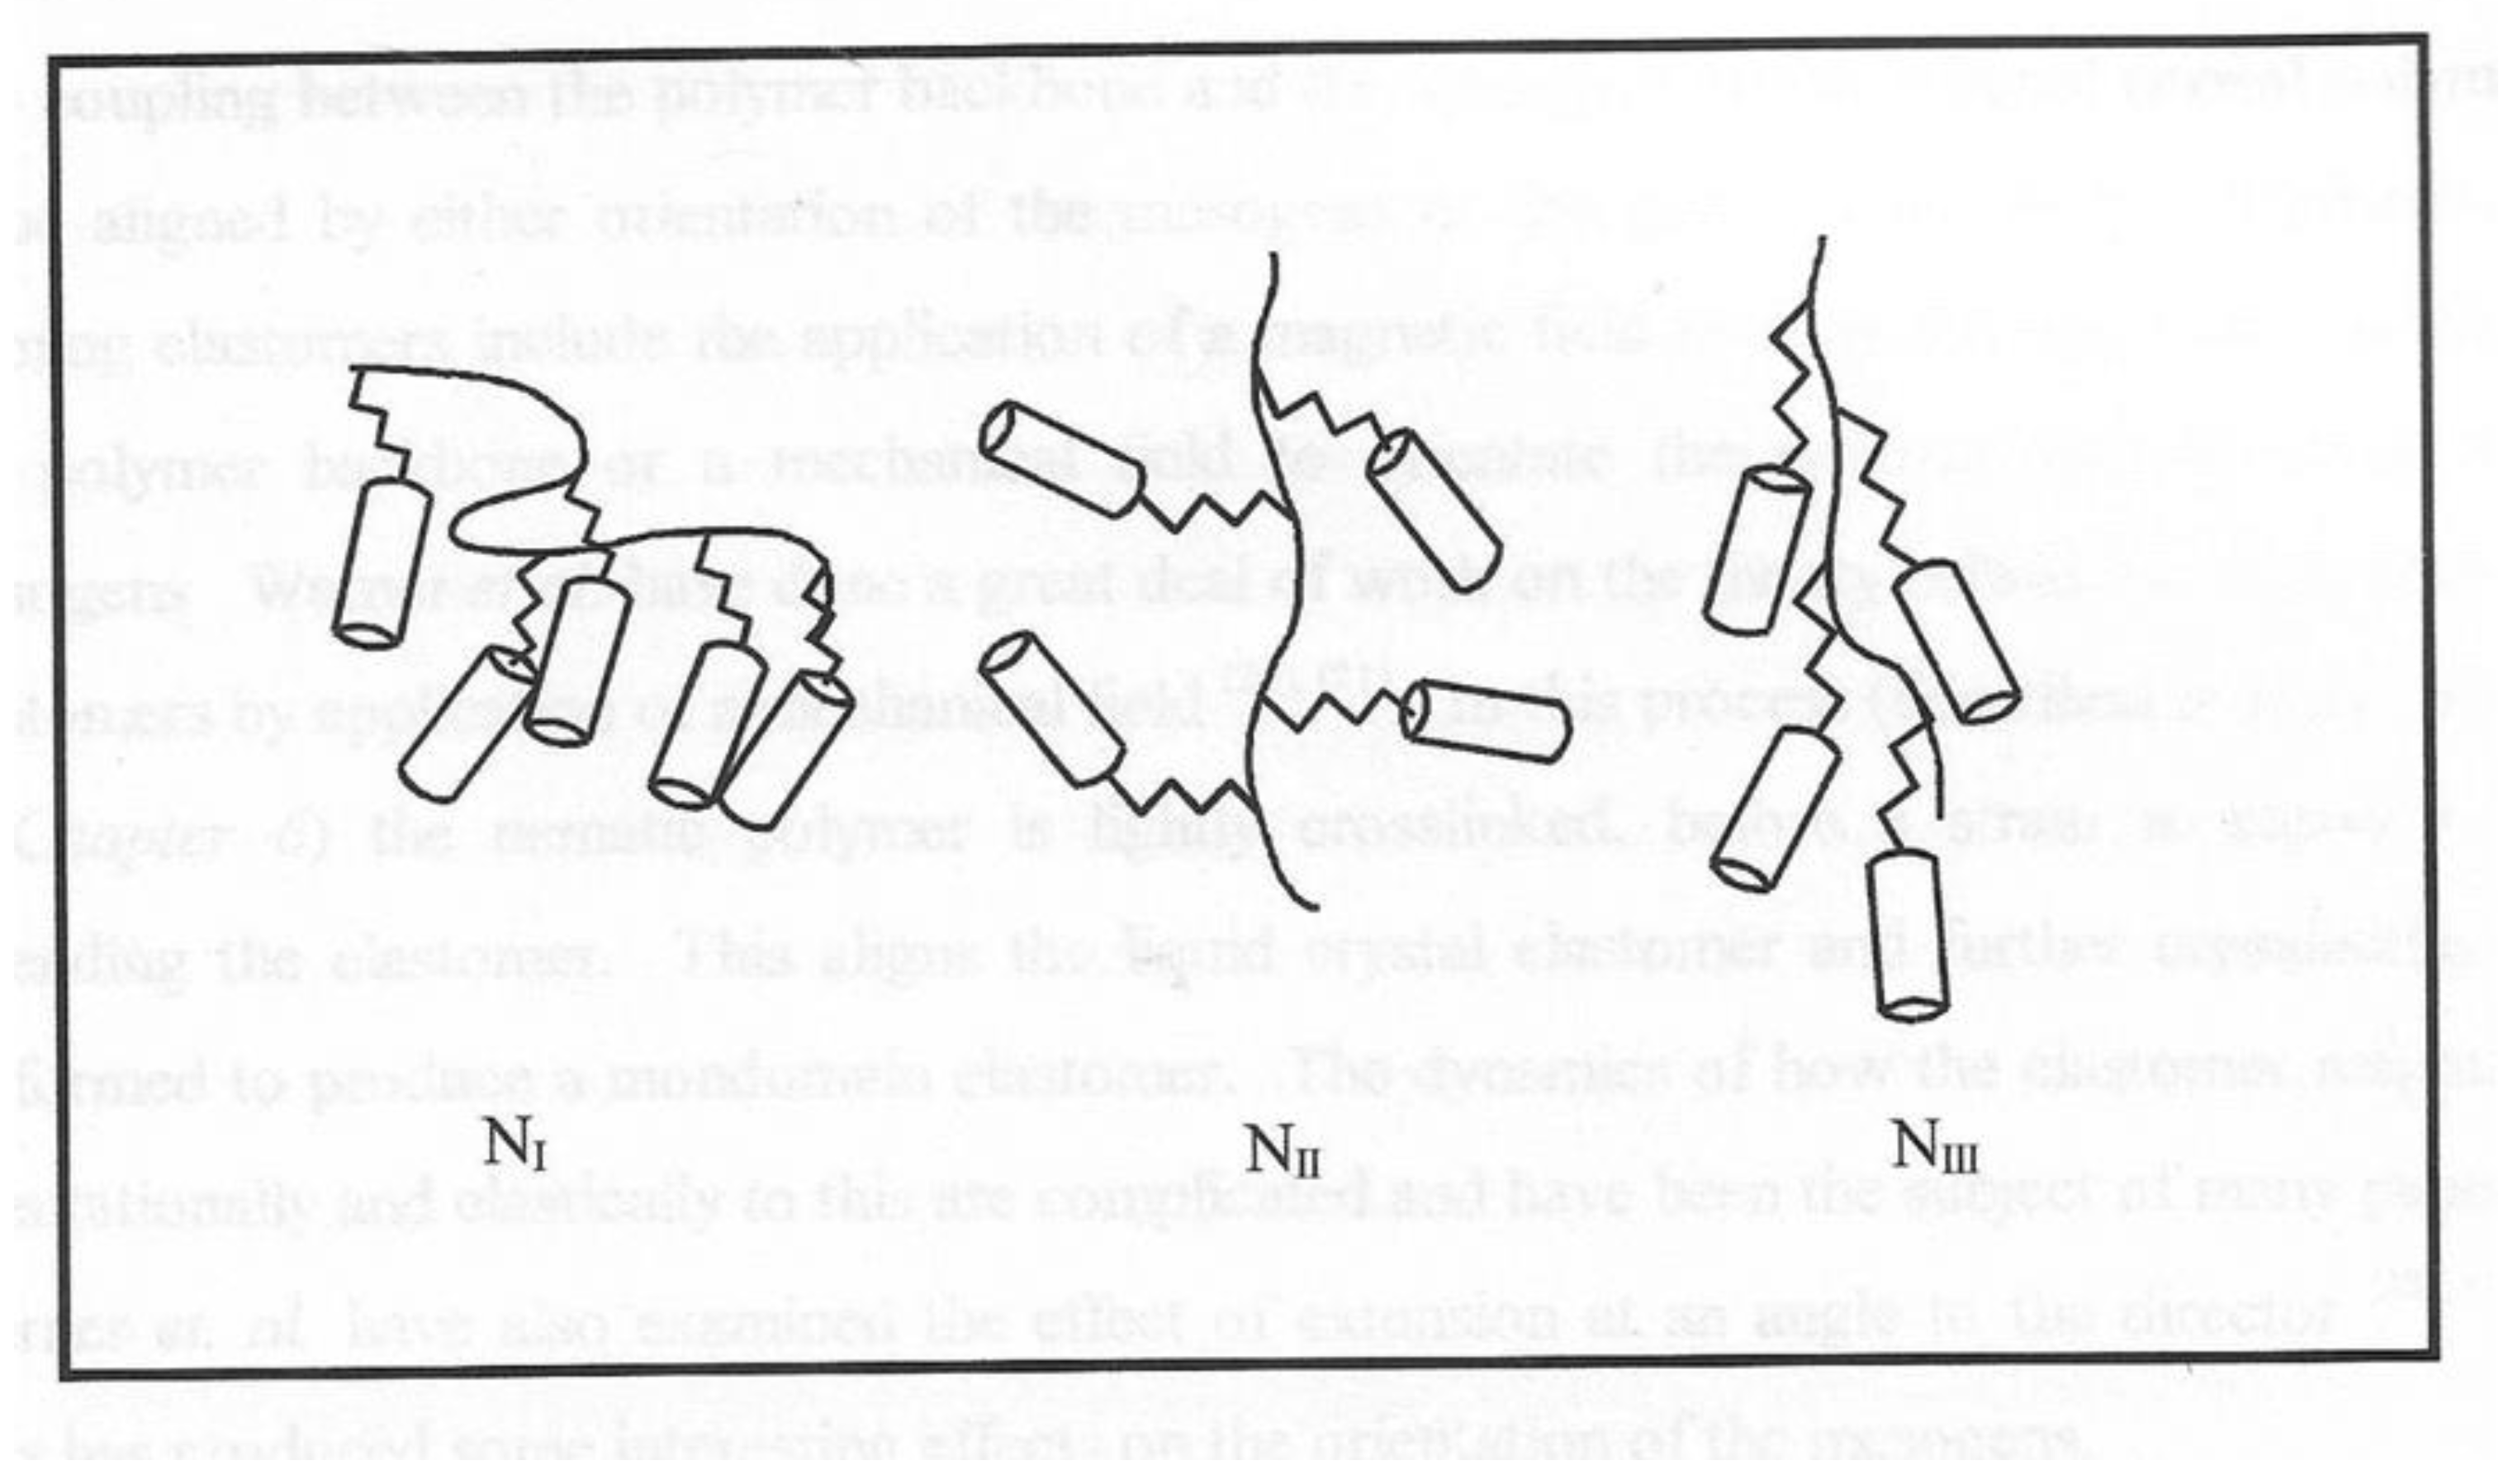
Figure 2.
An transmission electron microscope image of the dry ferrofluid.
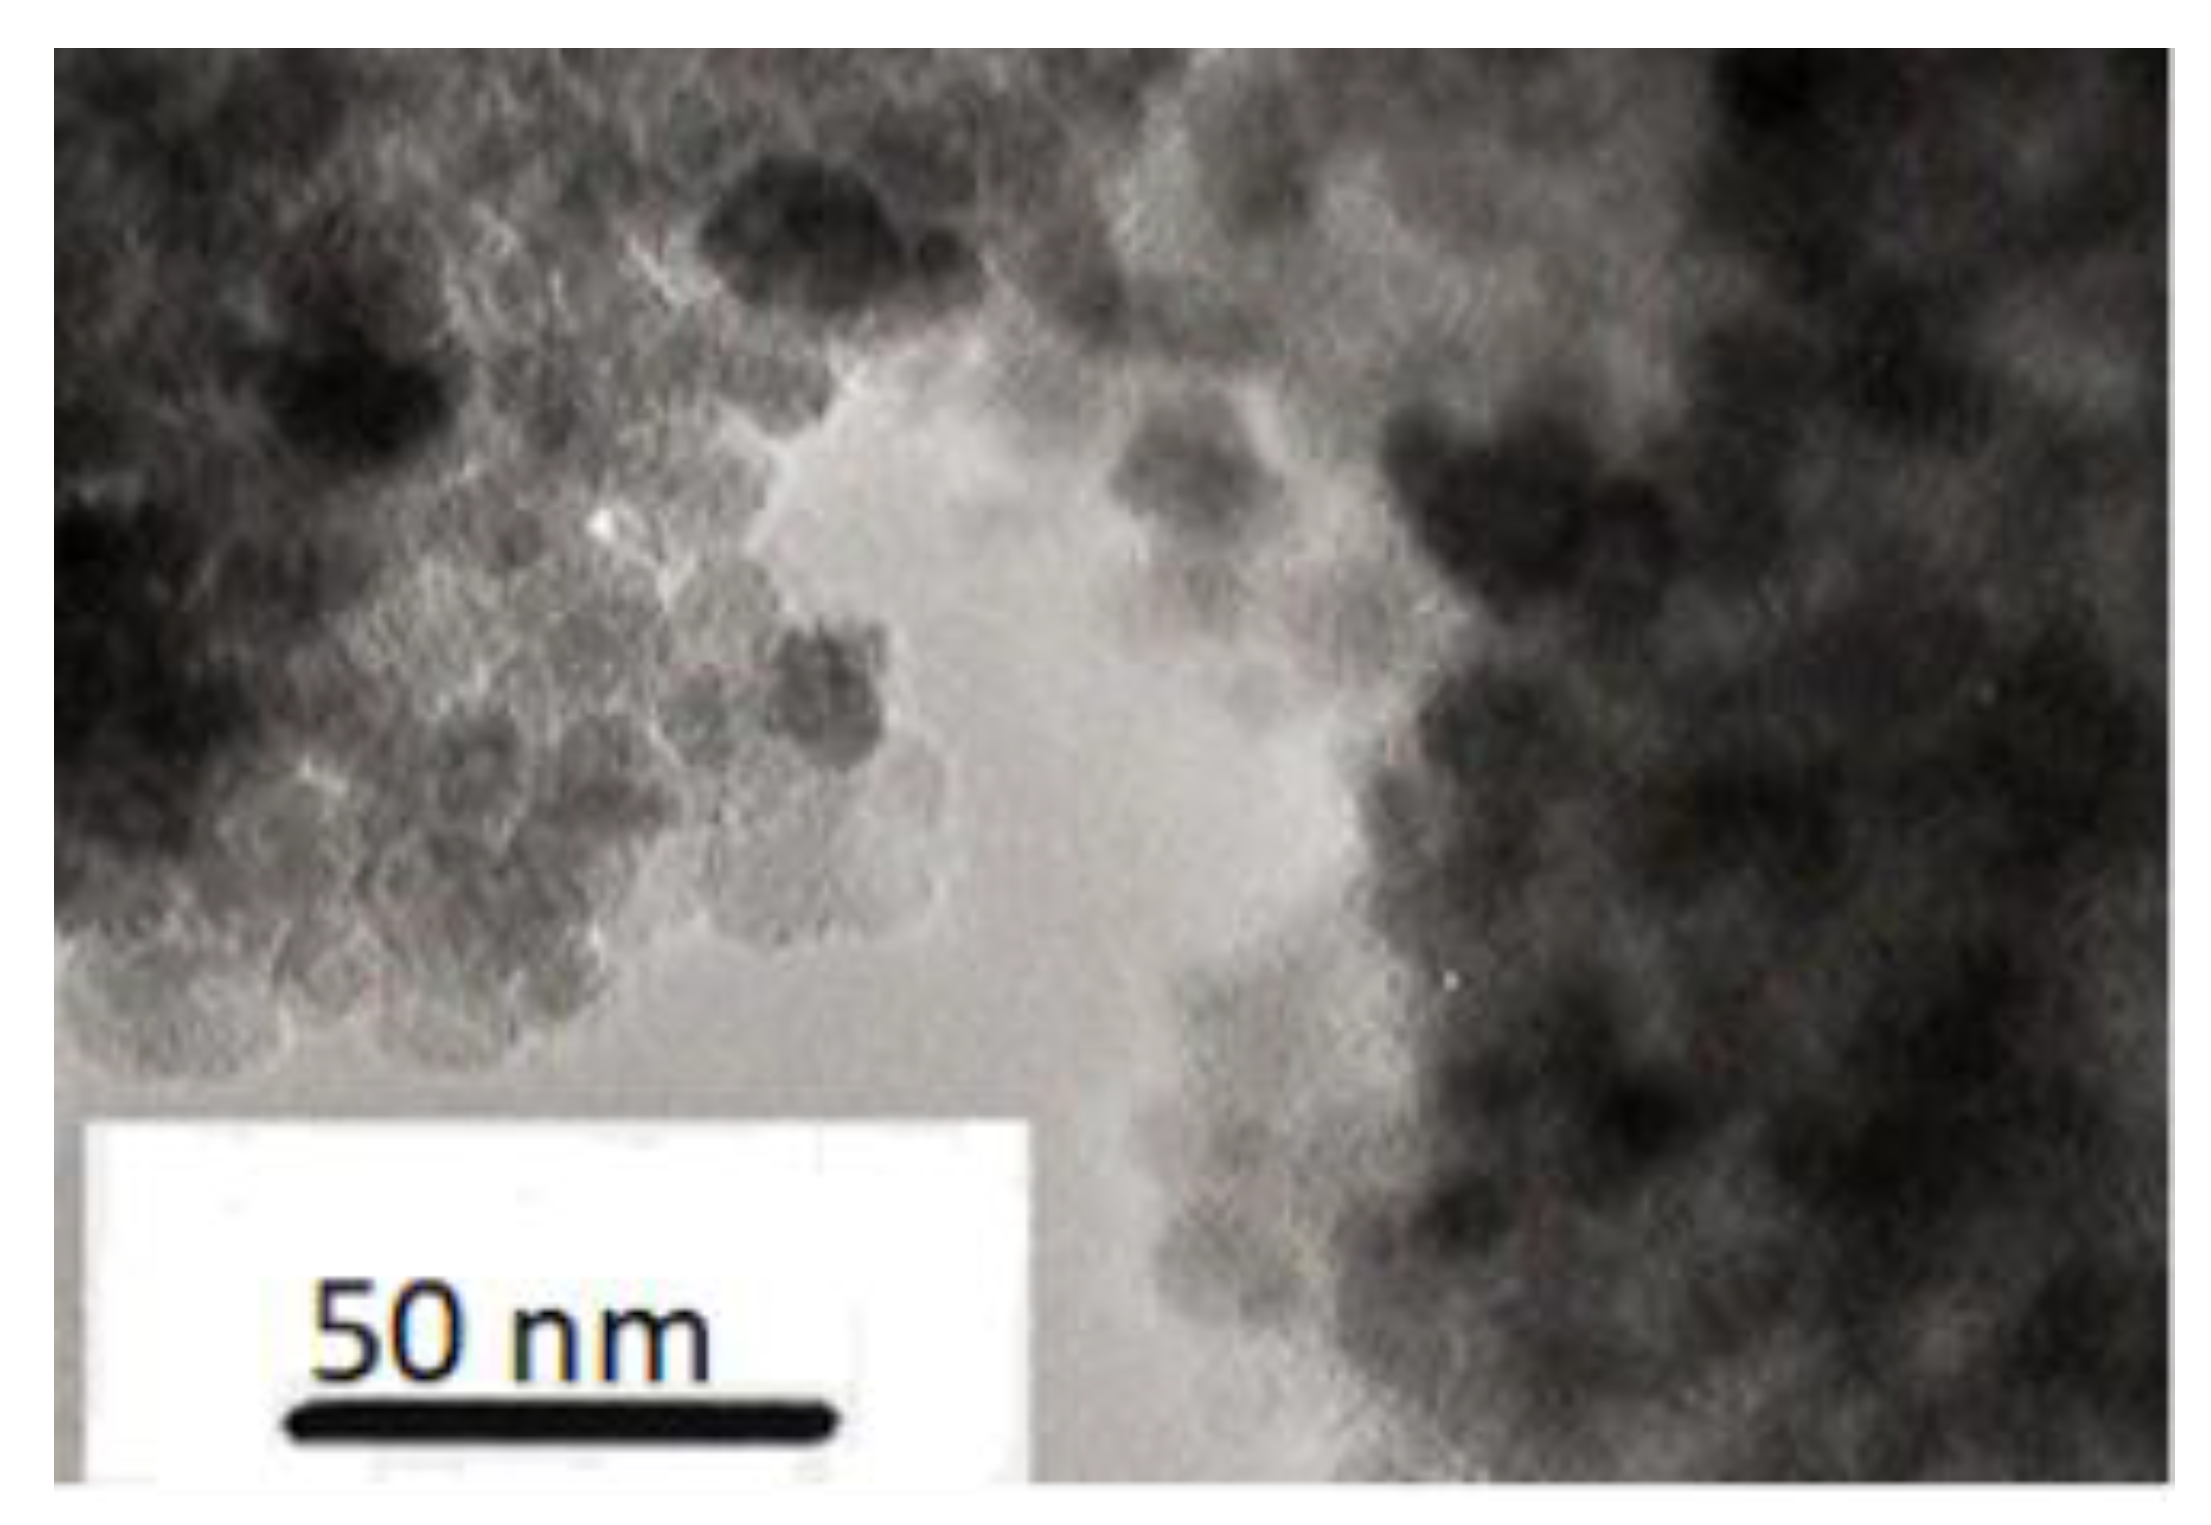
Figure 3.
Domain structure of a nematic liquid crystal.
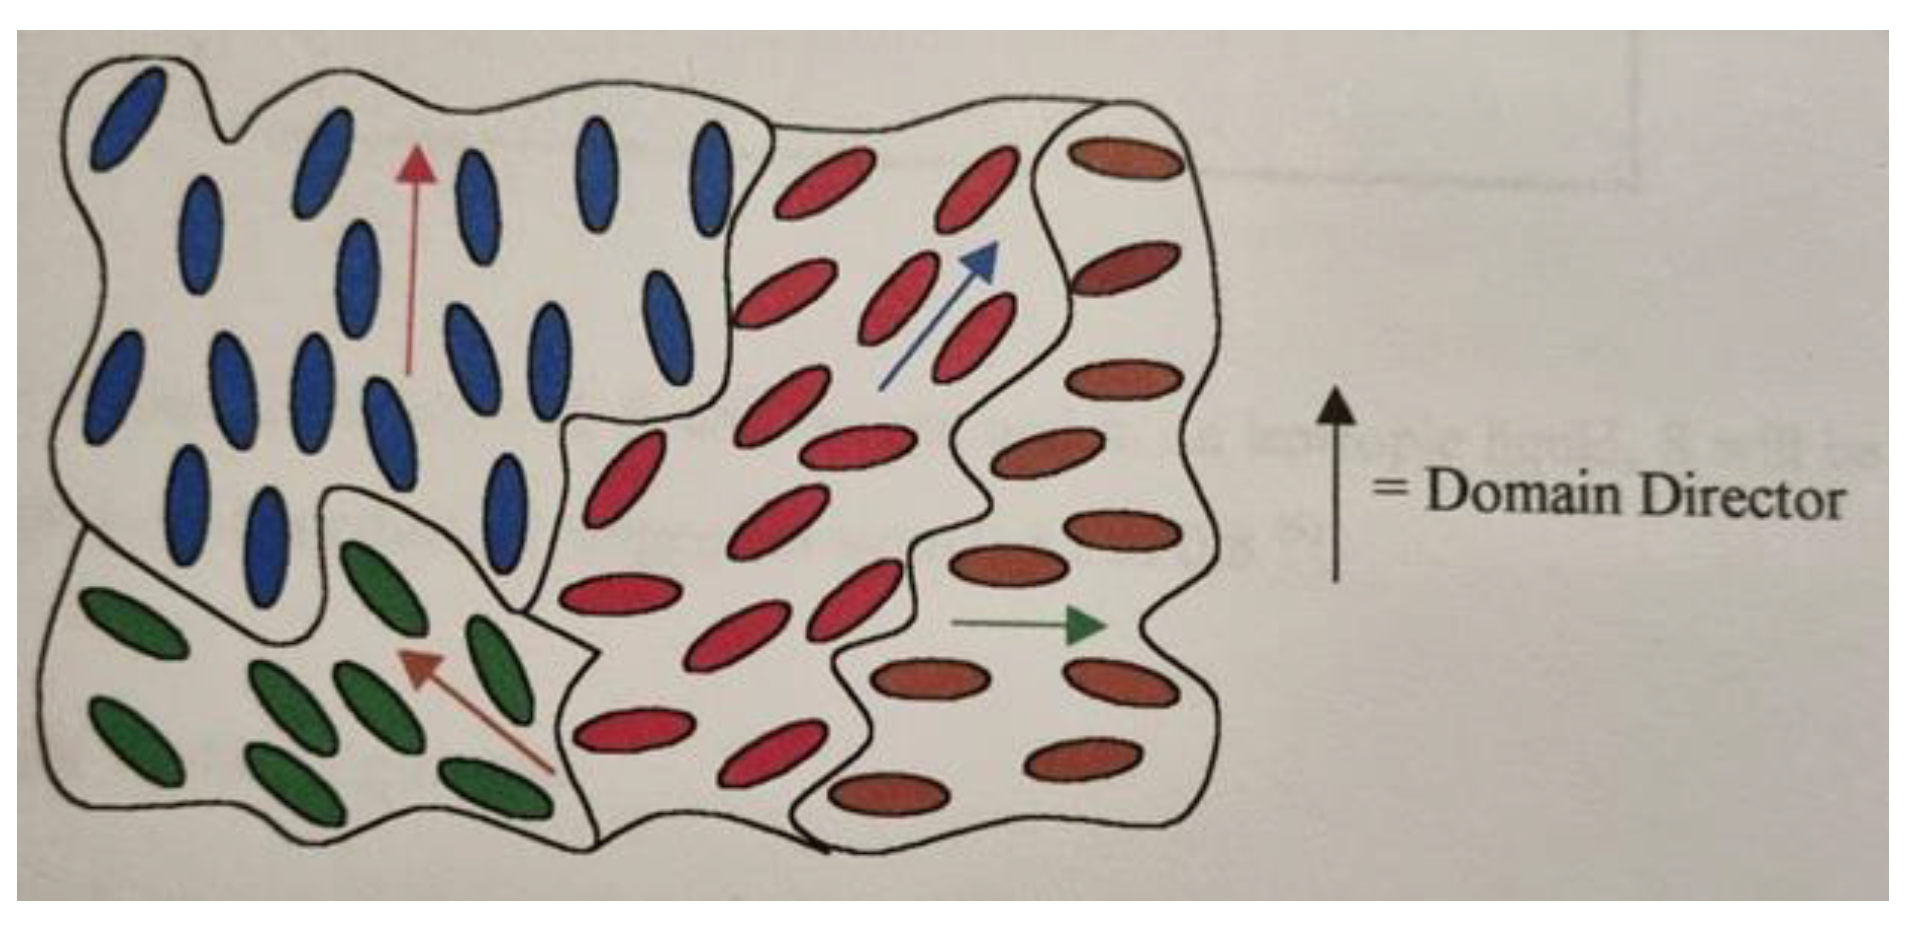
Figure 4.
(a) Left, Schematic diagram of monodomain formation apparatus viewed from above, (b) Schematic diagram of optical system used to monitor monodomain formation.
Figure 4.
(a) Left, Schematic diagram of monodomain formation apparatus viewed from above, (b) Schematic diagram of optical system used to monitor monodomain formation.
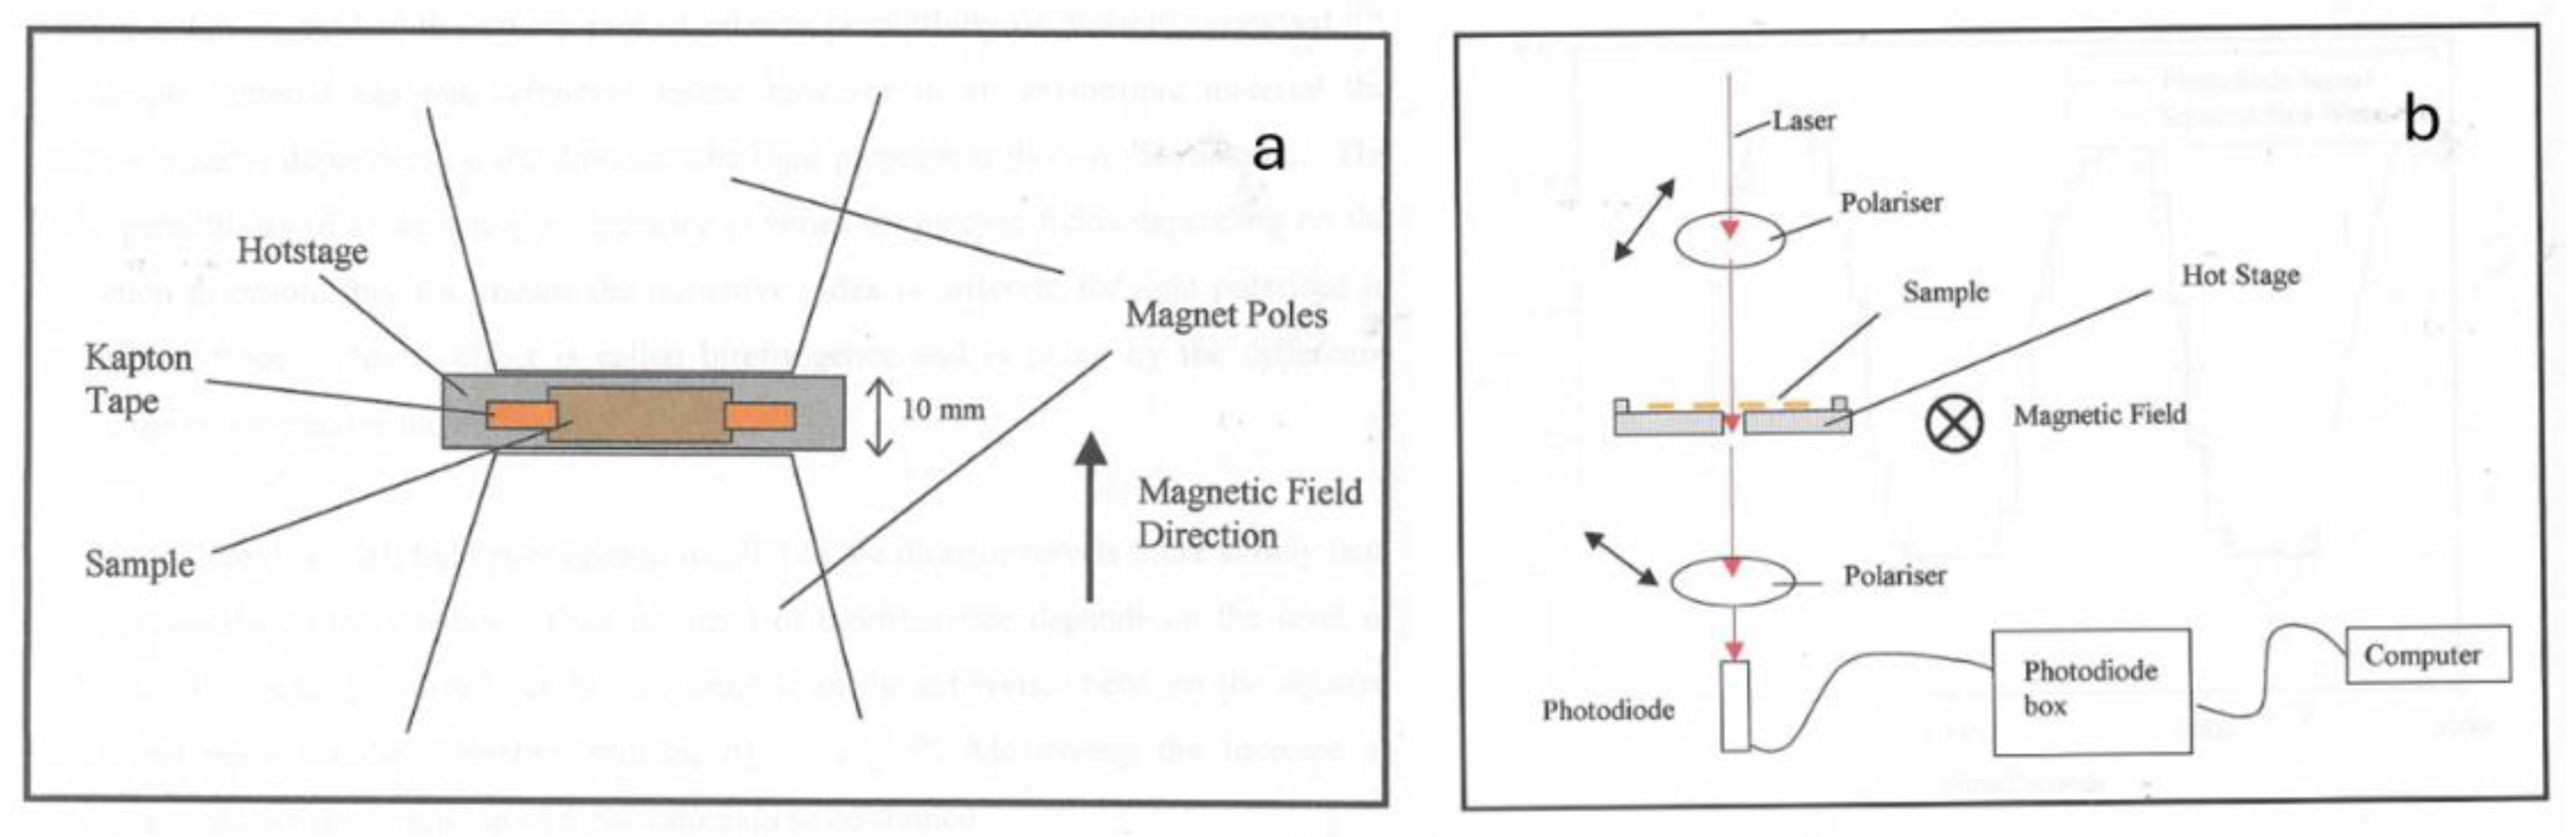
Figure 5.
A plot of the measured light using the system shown in Figure 4b at the temperatures indicated.
Figure 5.
A plot of the measured light using the system shown in Figure 4b at the temperatures indicated.
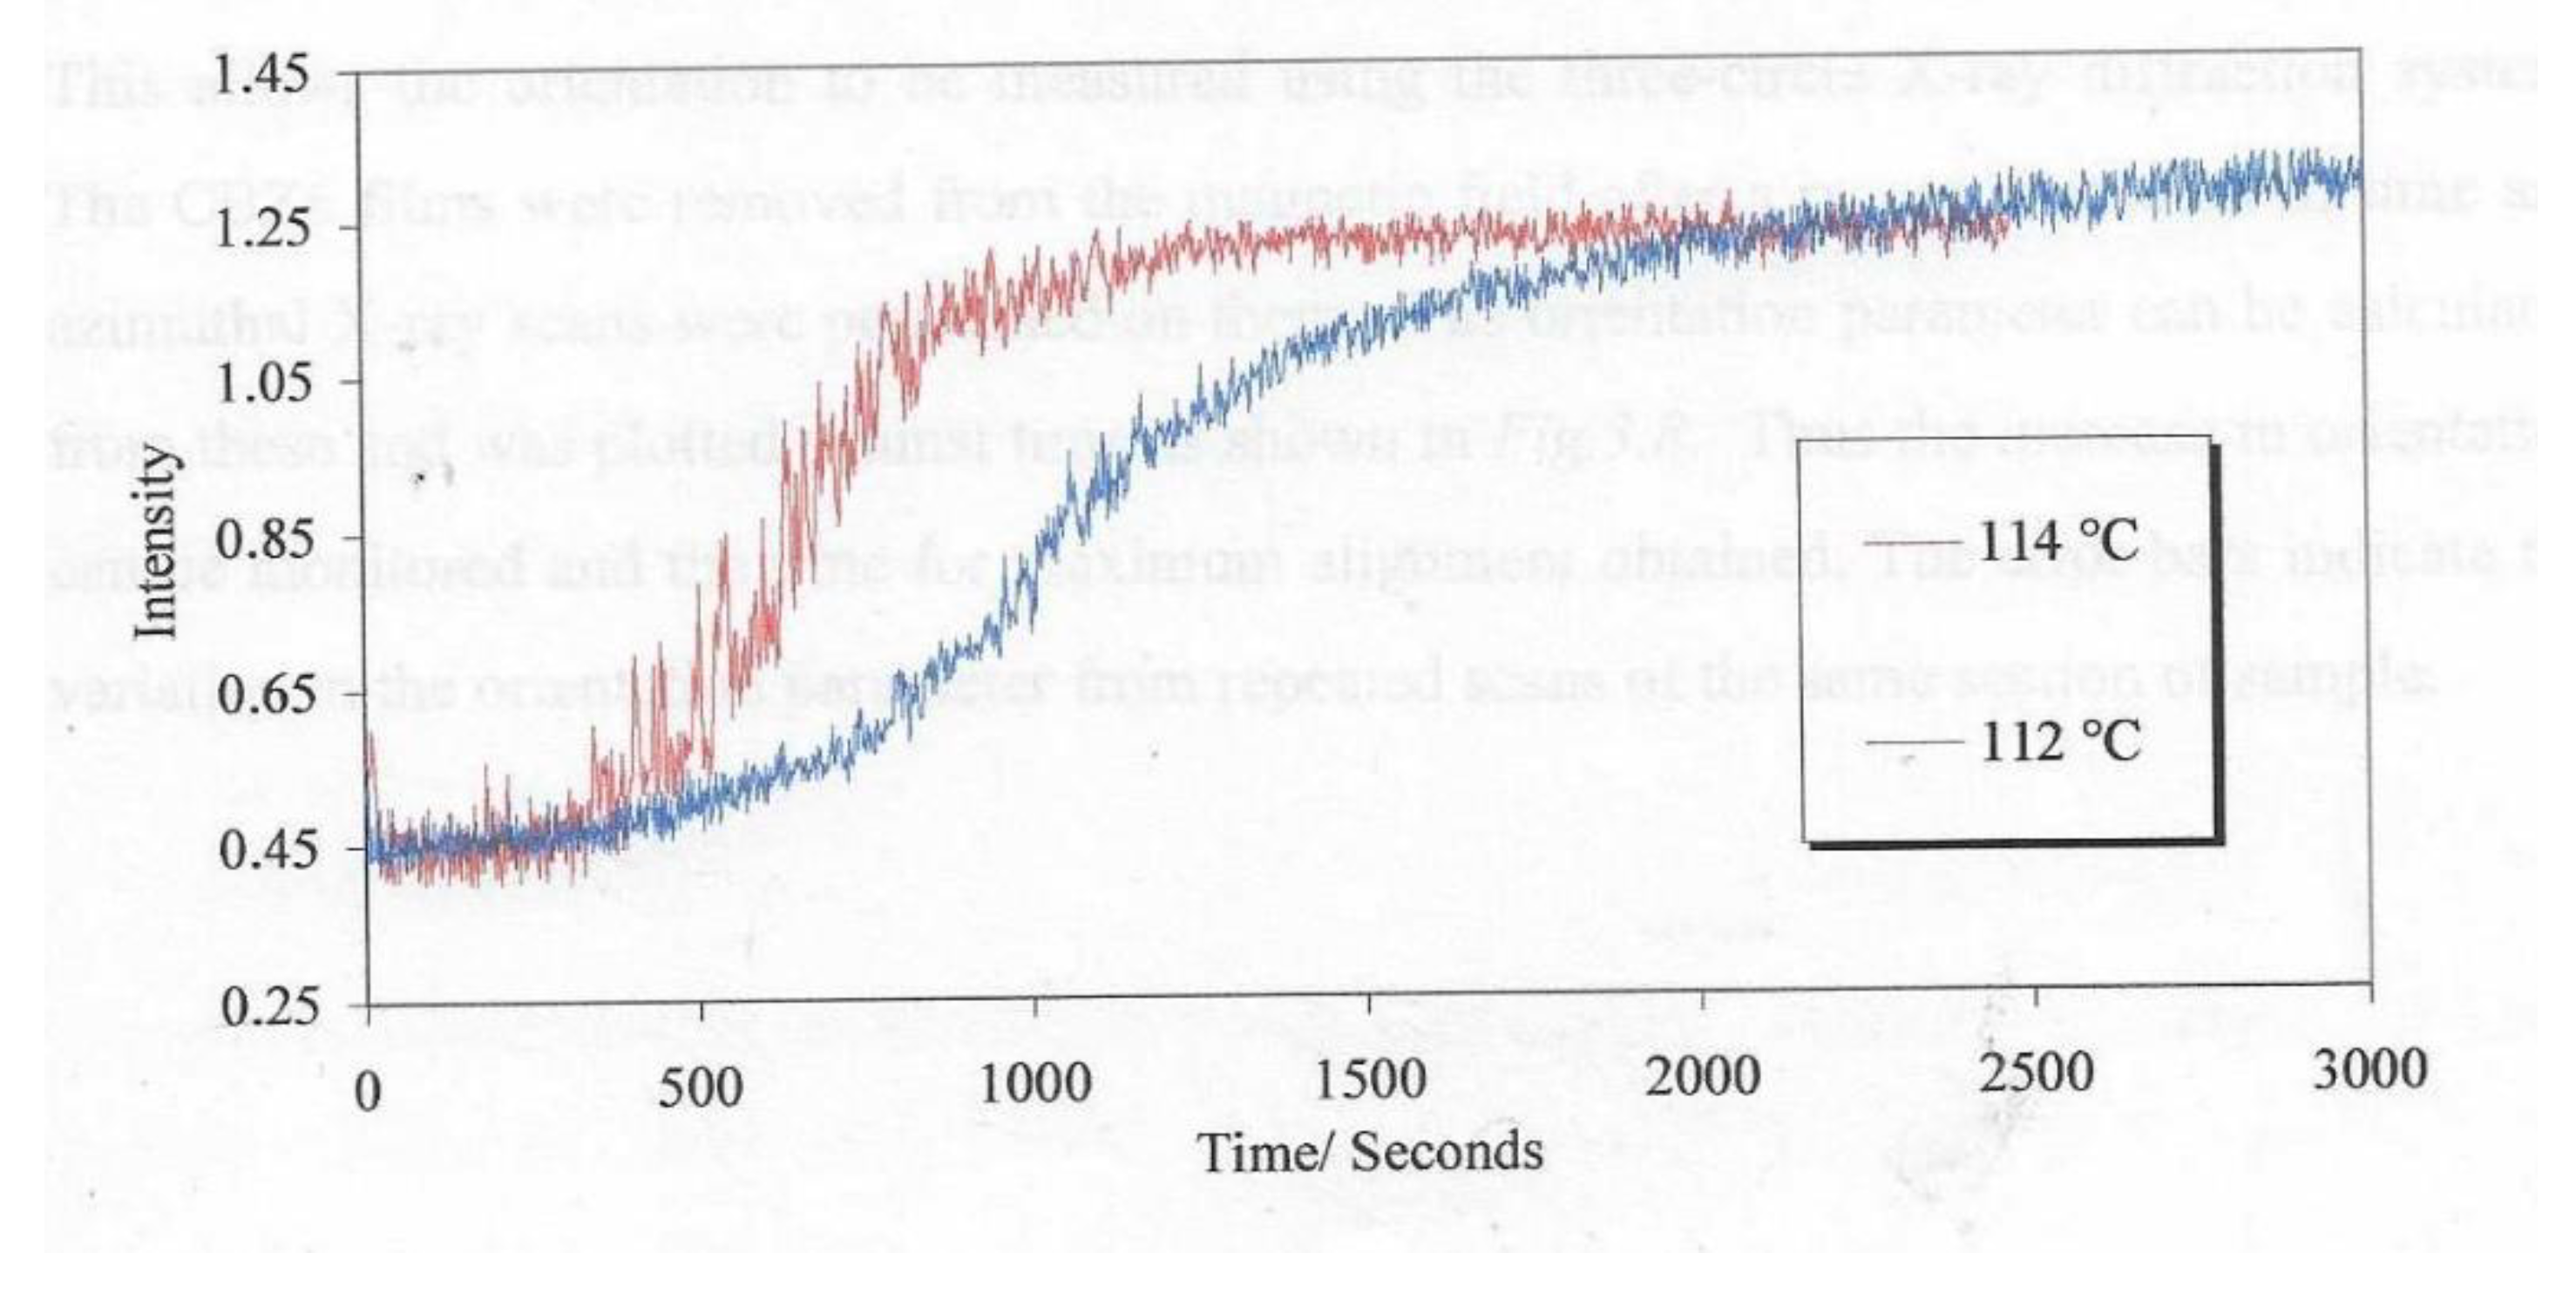
Figure 6.
A plot of the global orientation <P2> against time, for a sample of the liquid crystal polymer used in this work at 90° C and in a magnetic field of 2.1 T.
Figure 6.
A plot of the global orientation <P2> against time, for a sample of the liquid crystal polymer used in this work at 90° C and in a magnetic field of 2.1 T.
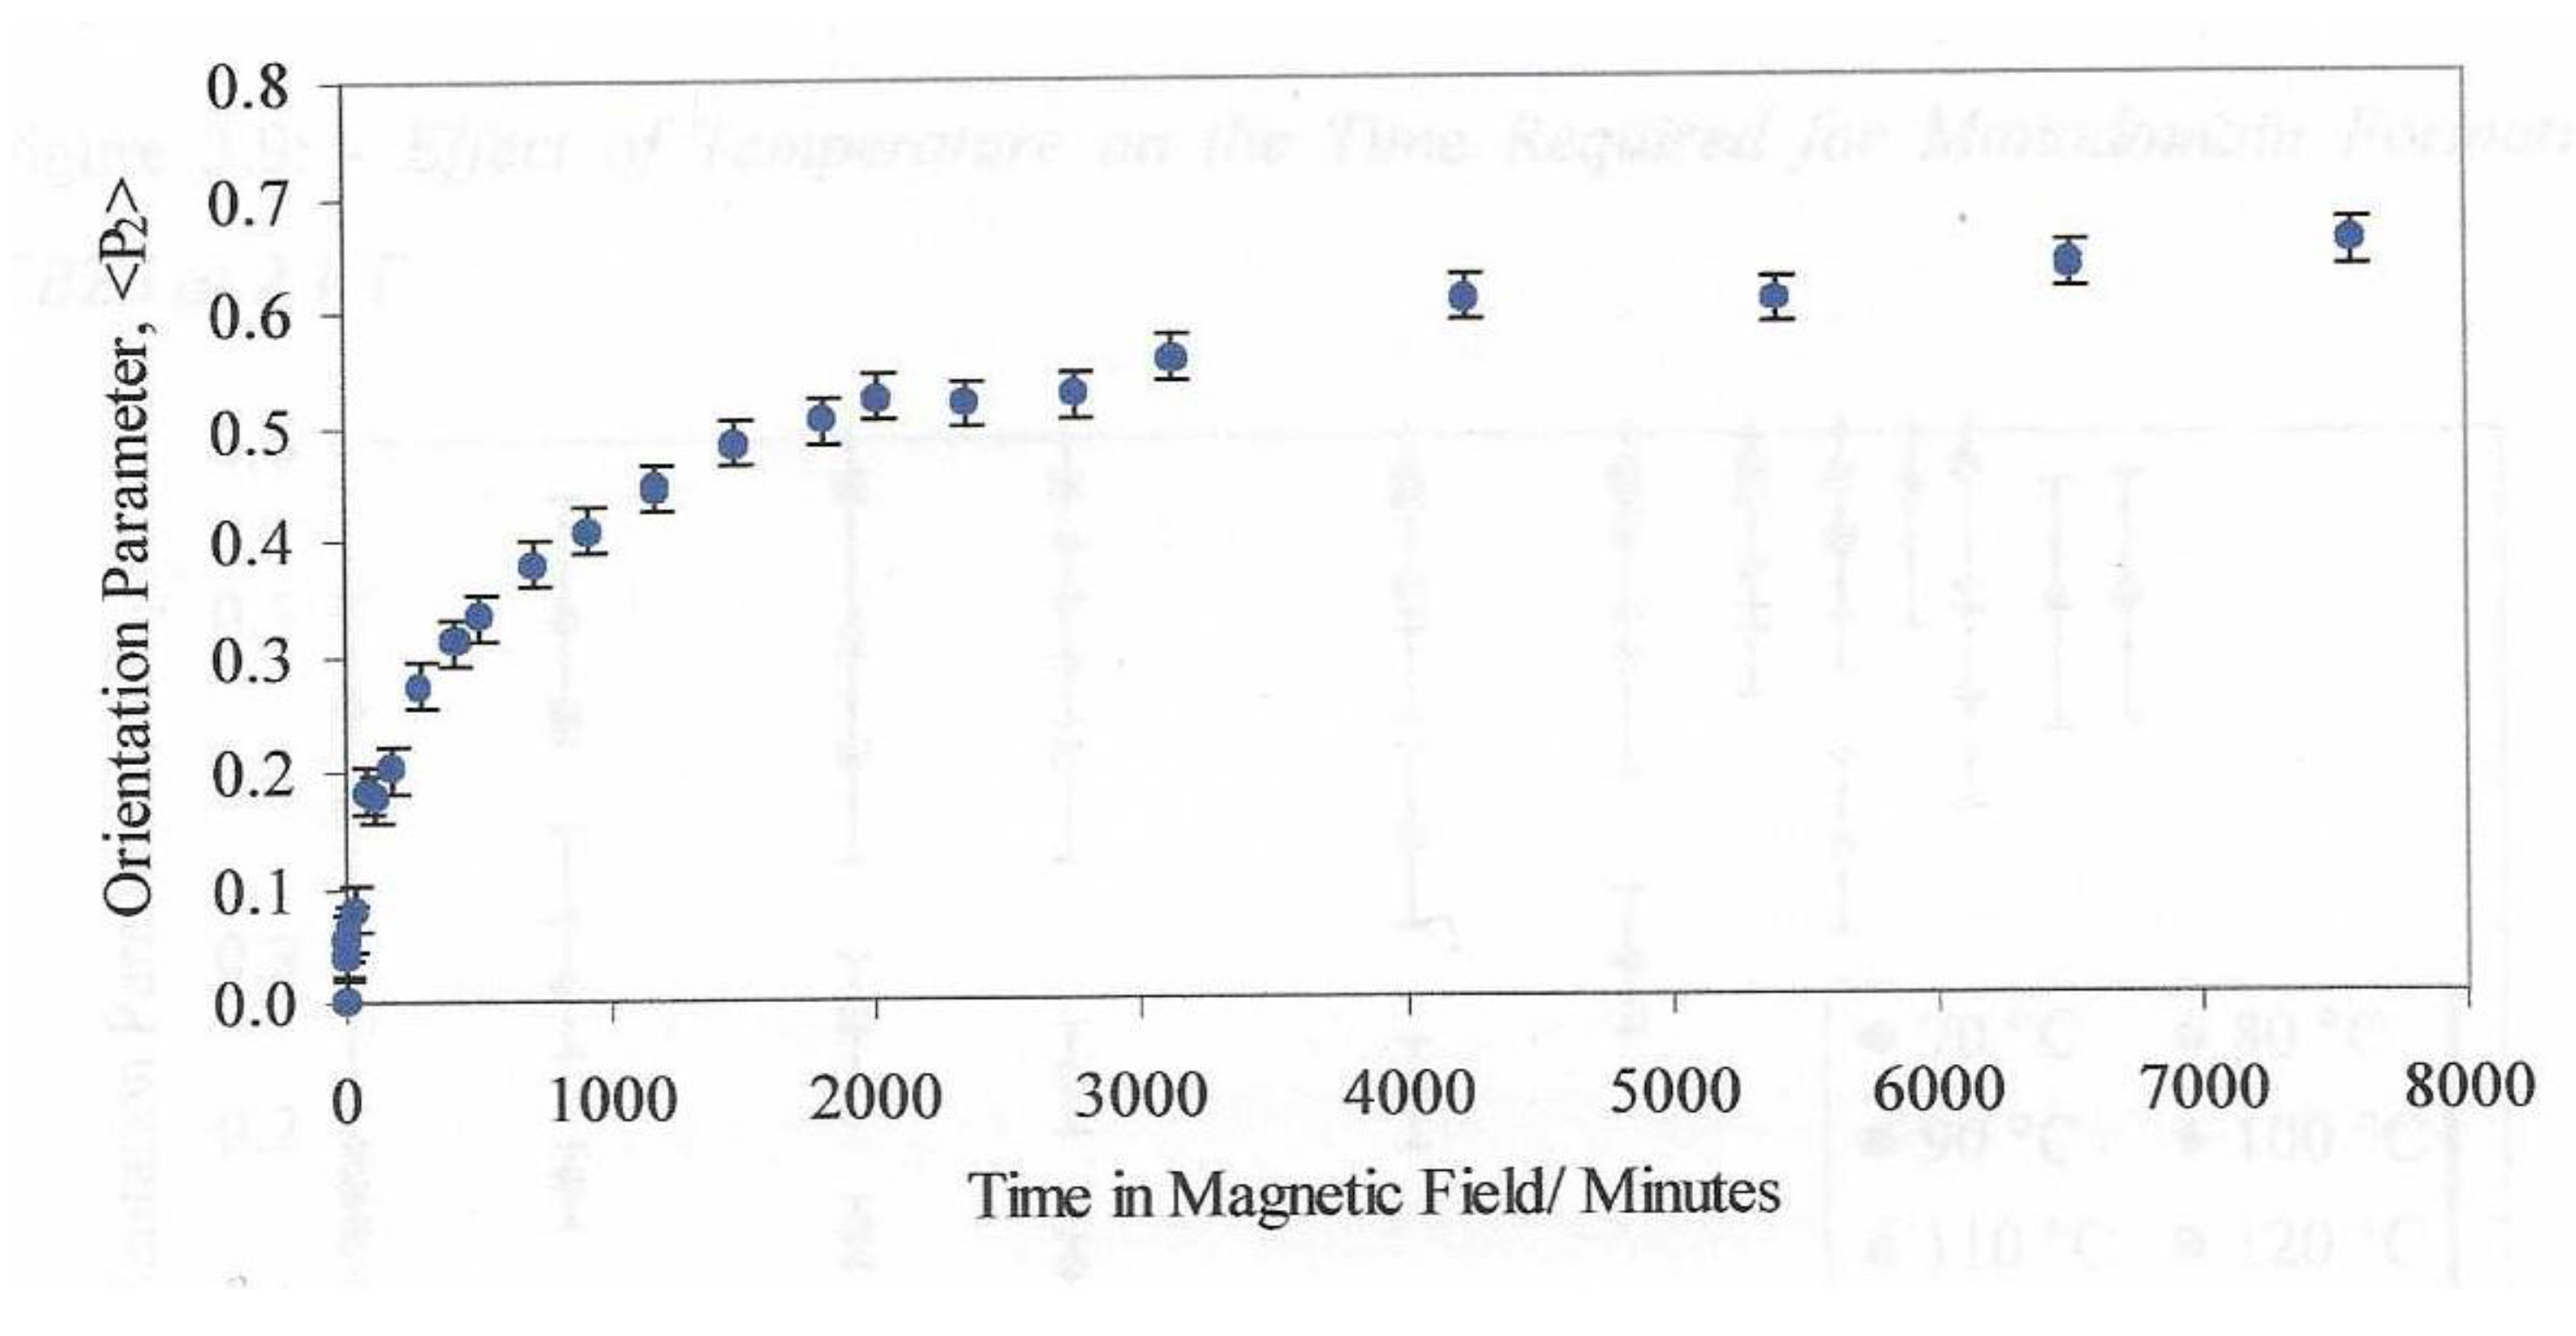
Figure 7.
The geometry of the 3 -Circle transmission diffractometer.
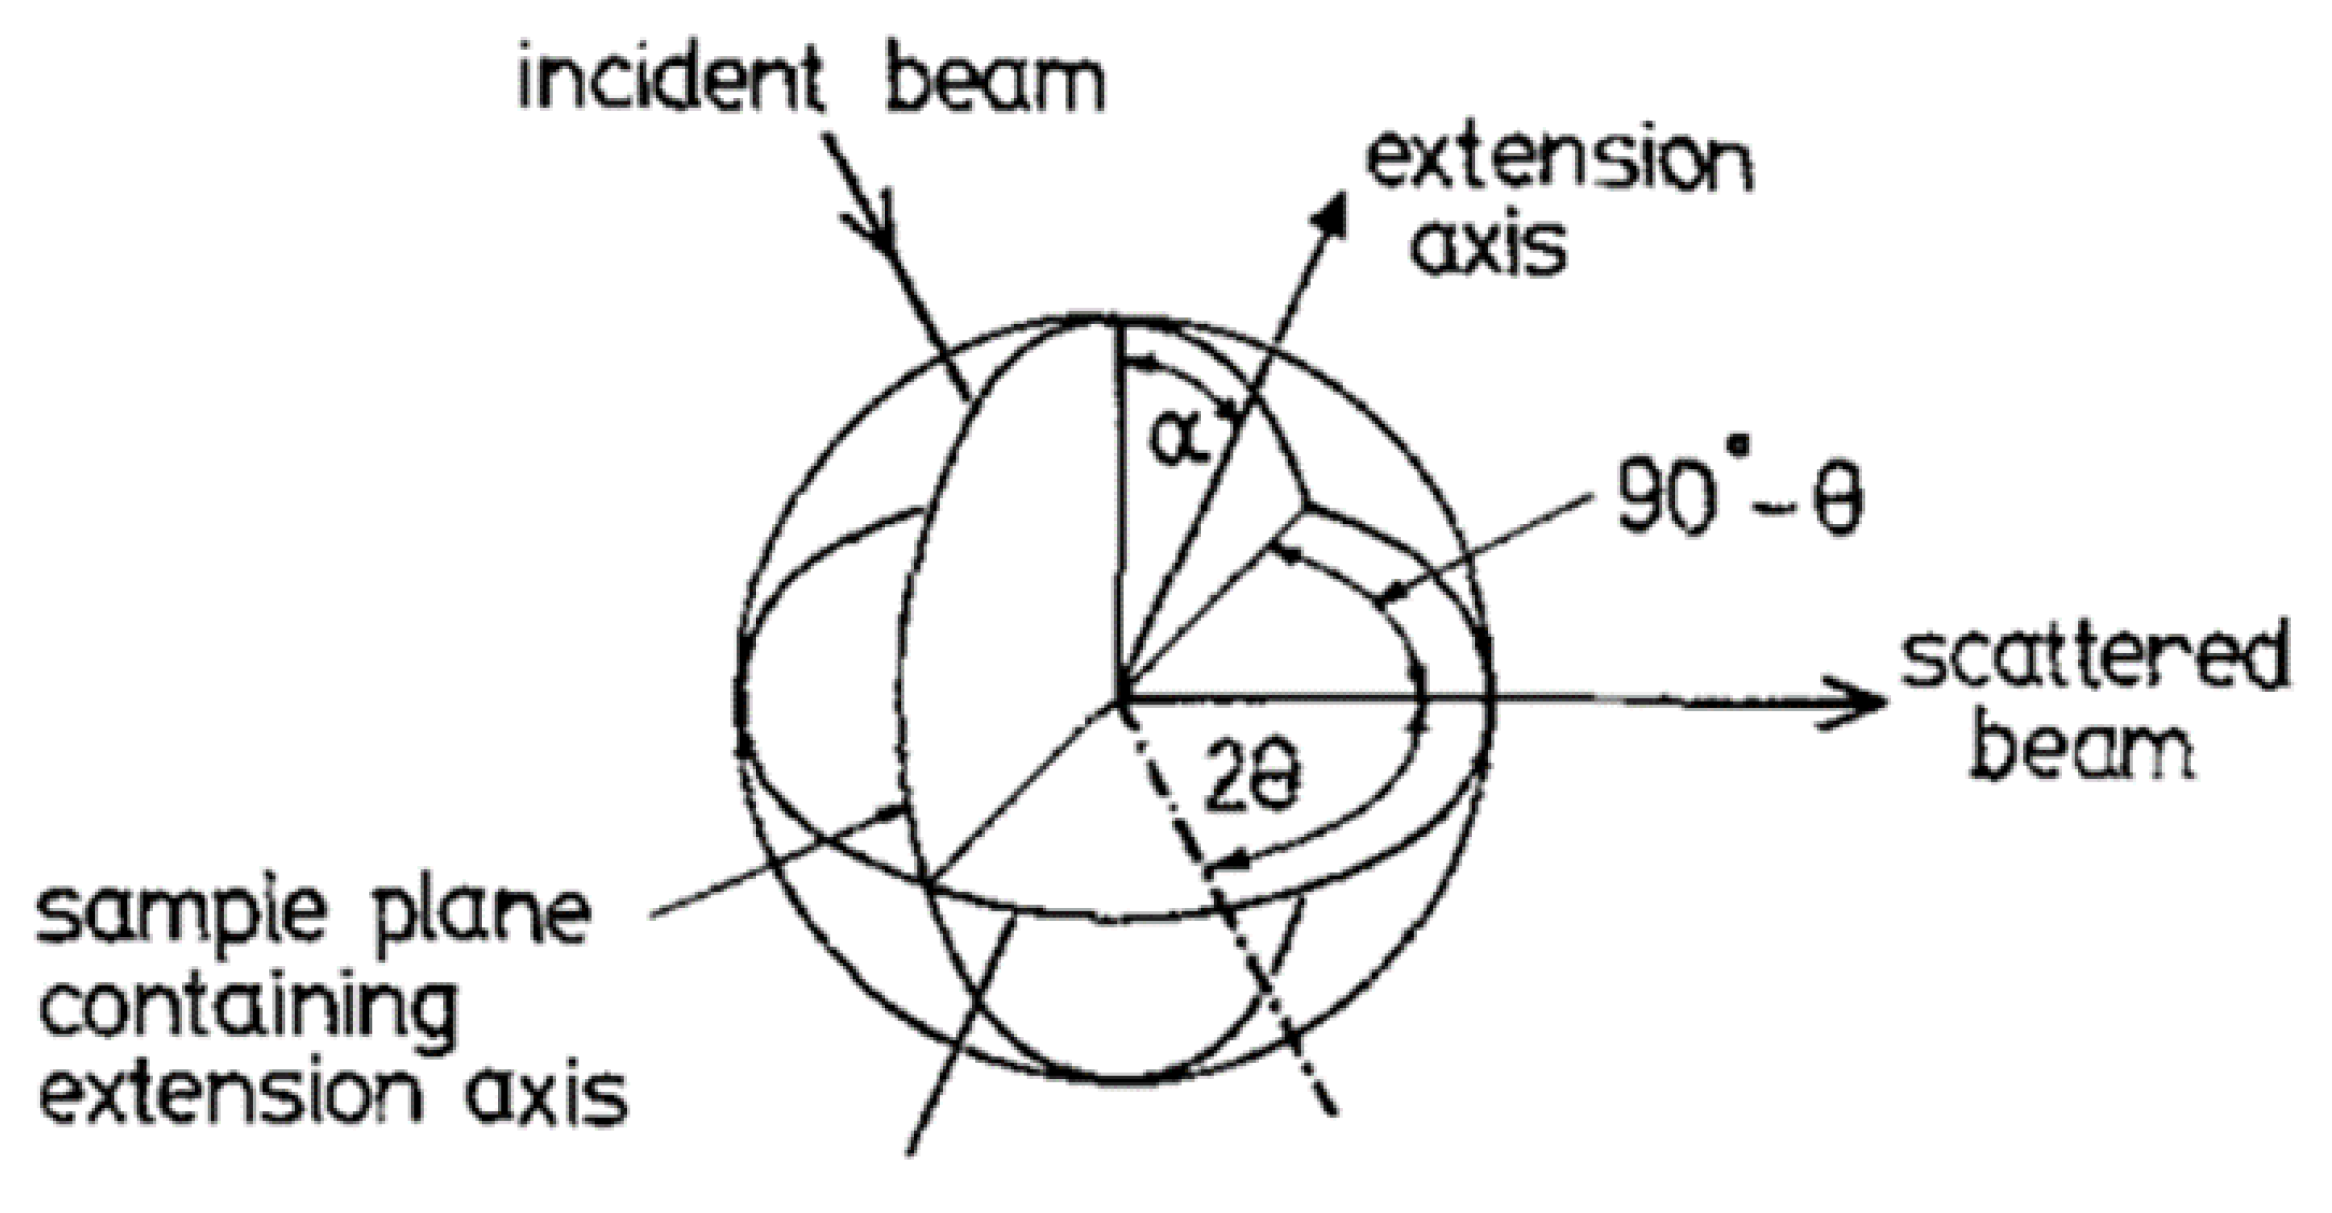
Figure 8.
Optical Microscope Images (with Crossed Polarisers) of Different Volume Fractions of Ferroparticles in CBZ6 (a) 1.42 % and (b) 2.84 % (c) 5.68 % and (d) 28.4 %.
Figure 8.
Optical Microscope Images (with Crossed Polarisers) of Different Volume Fractions of Ferroparticles in CBZ6 (a) 1.42 % and (b) 2.84 % (c) 5.68 % and (d) 28.4 %.
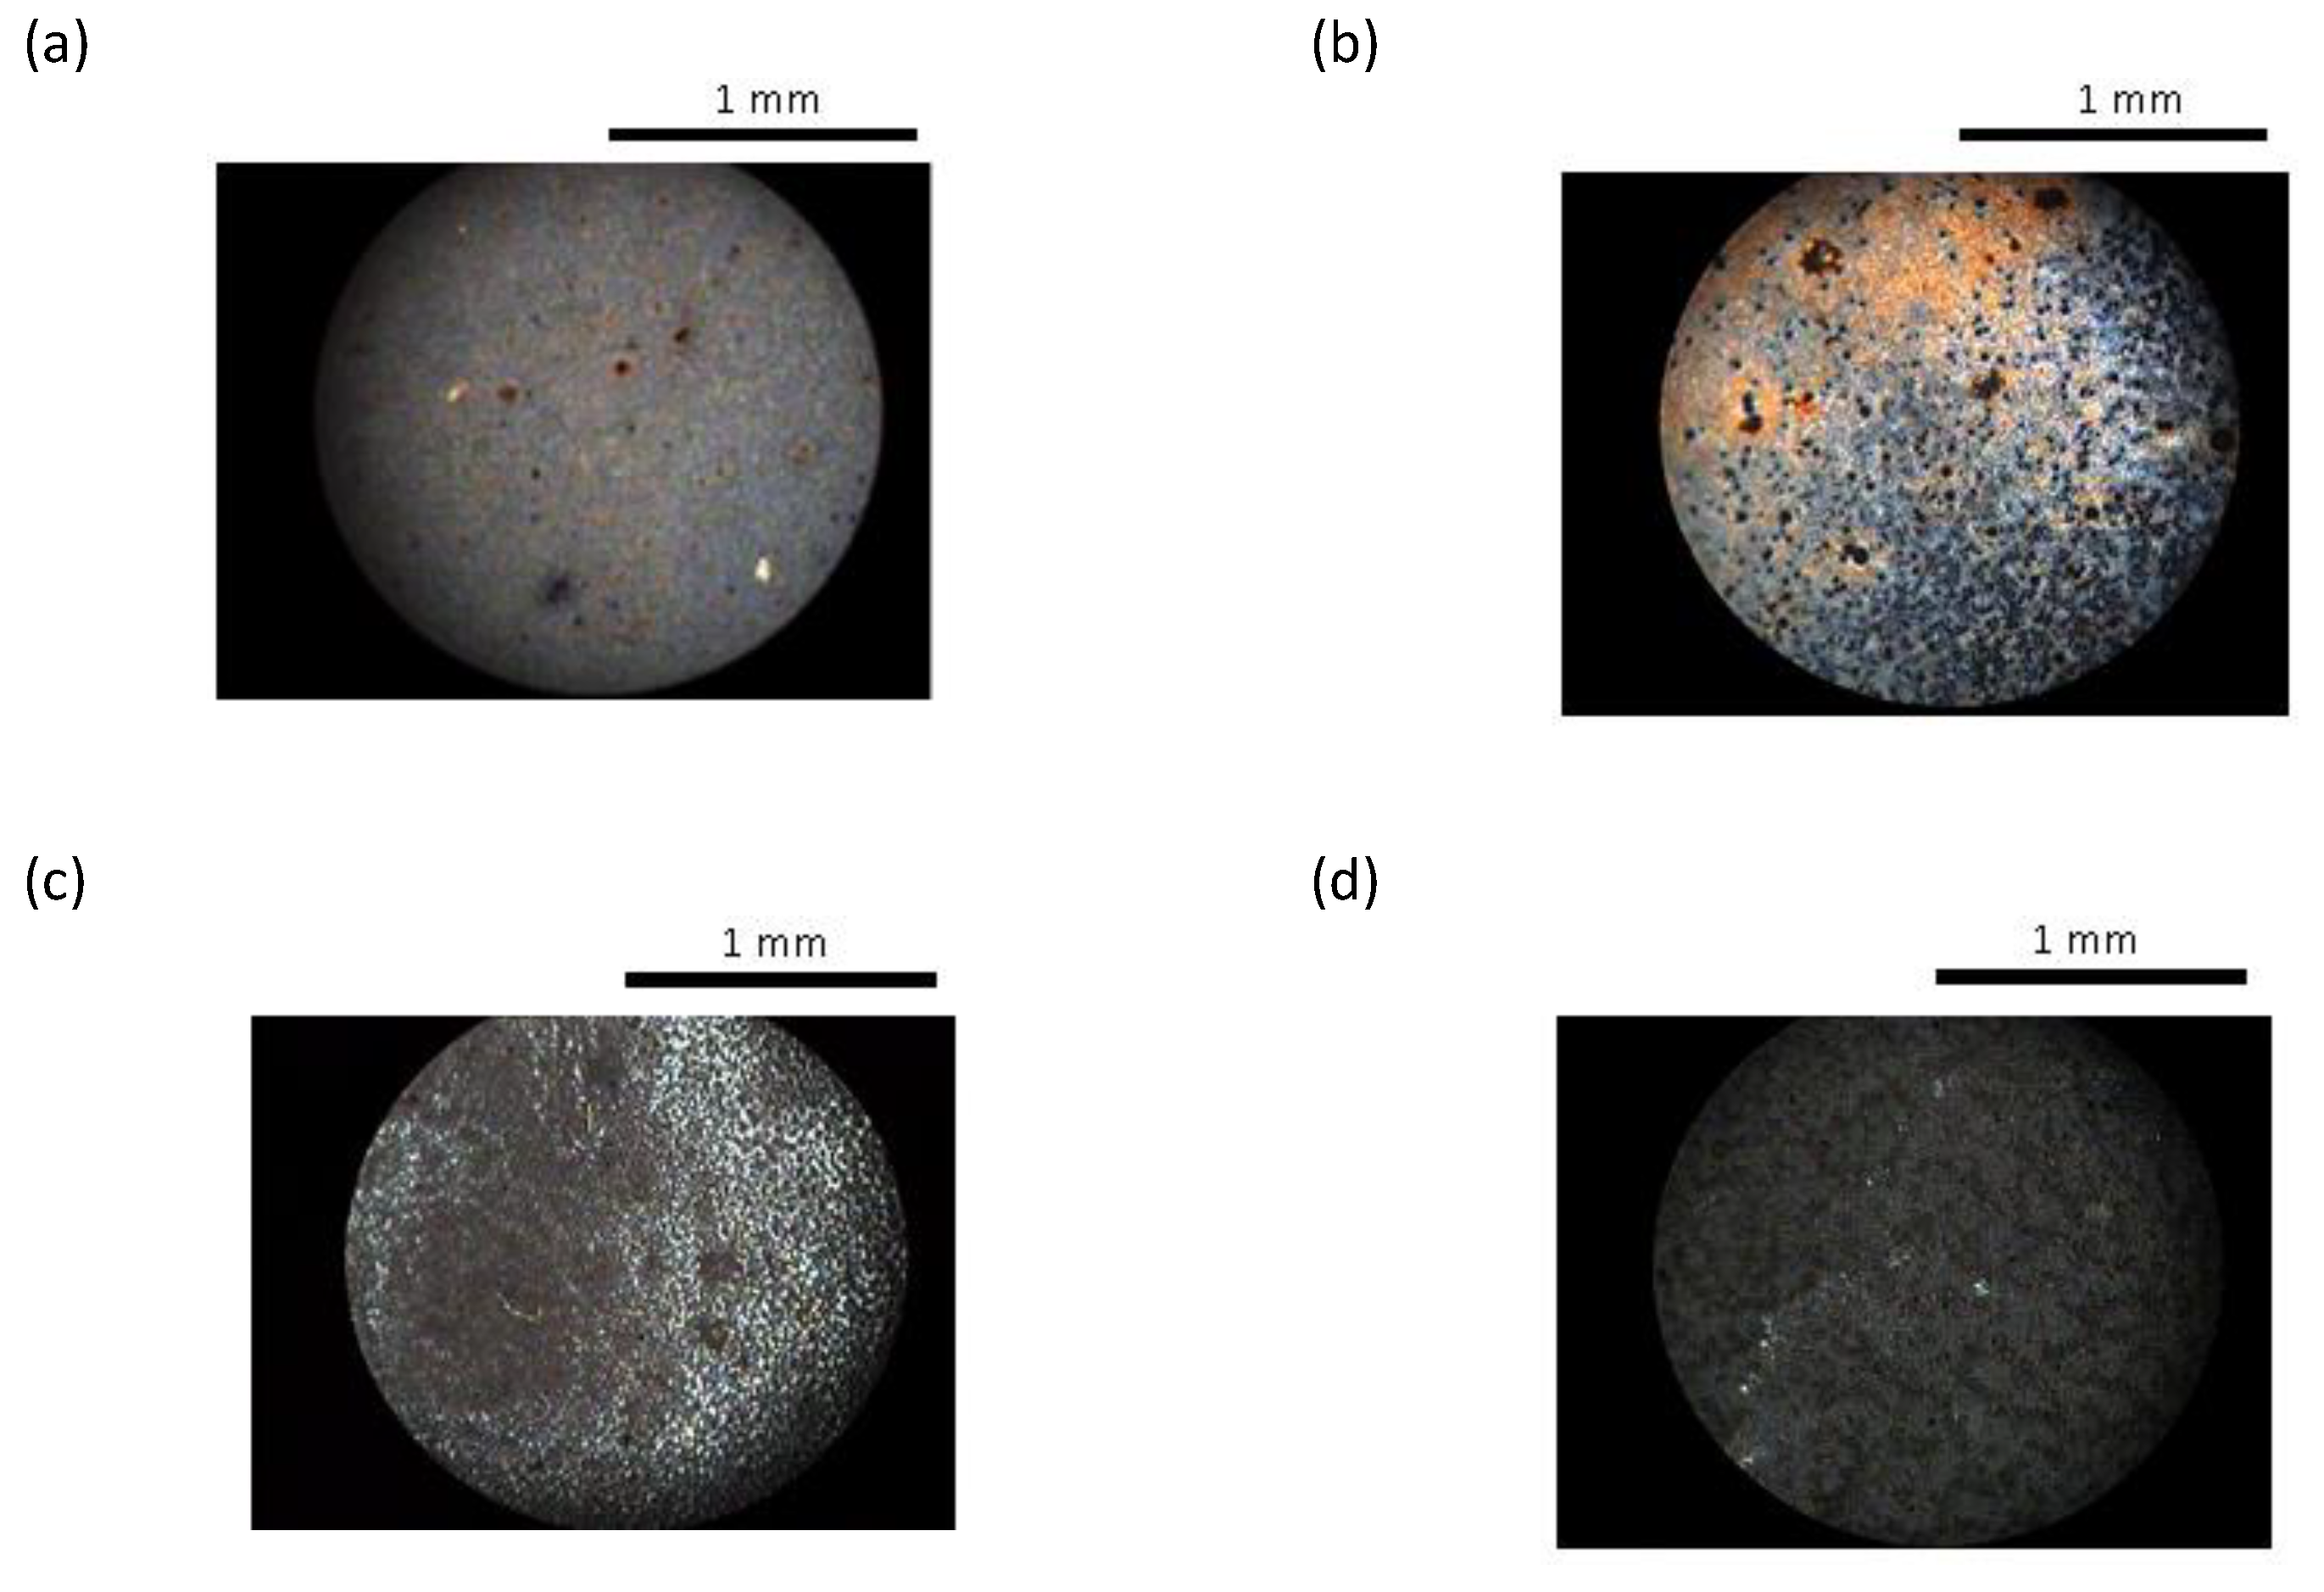
Figure 9.
Nematic isotropic transition temperature obtained from optical microscopy as a function of the volume fraction of ferroparticles.
Figure 9.
Nematic isotropic transition temperature obtained from optical microscopy as a function of the volume fraction of ferroparticles.
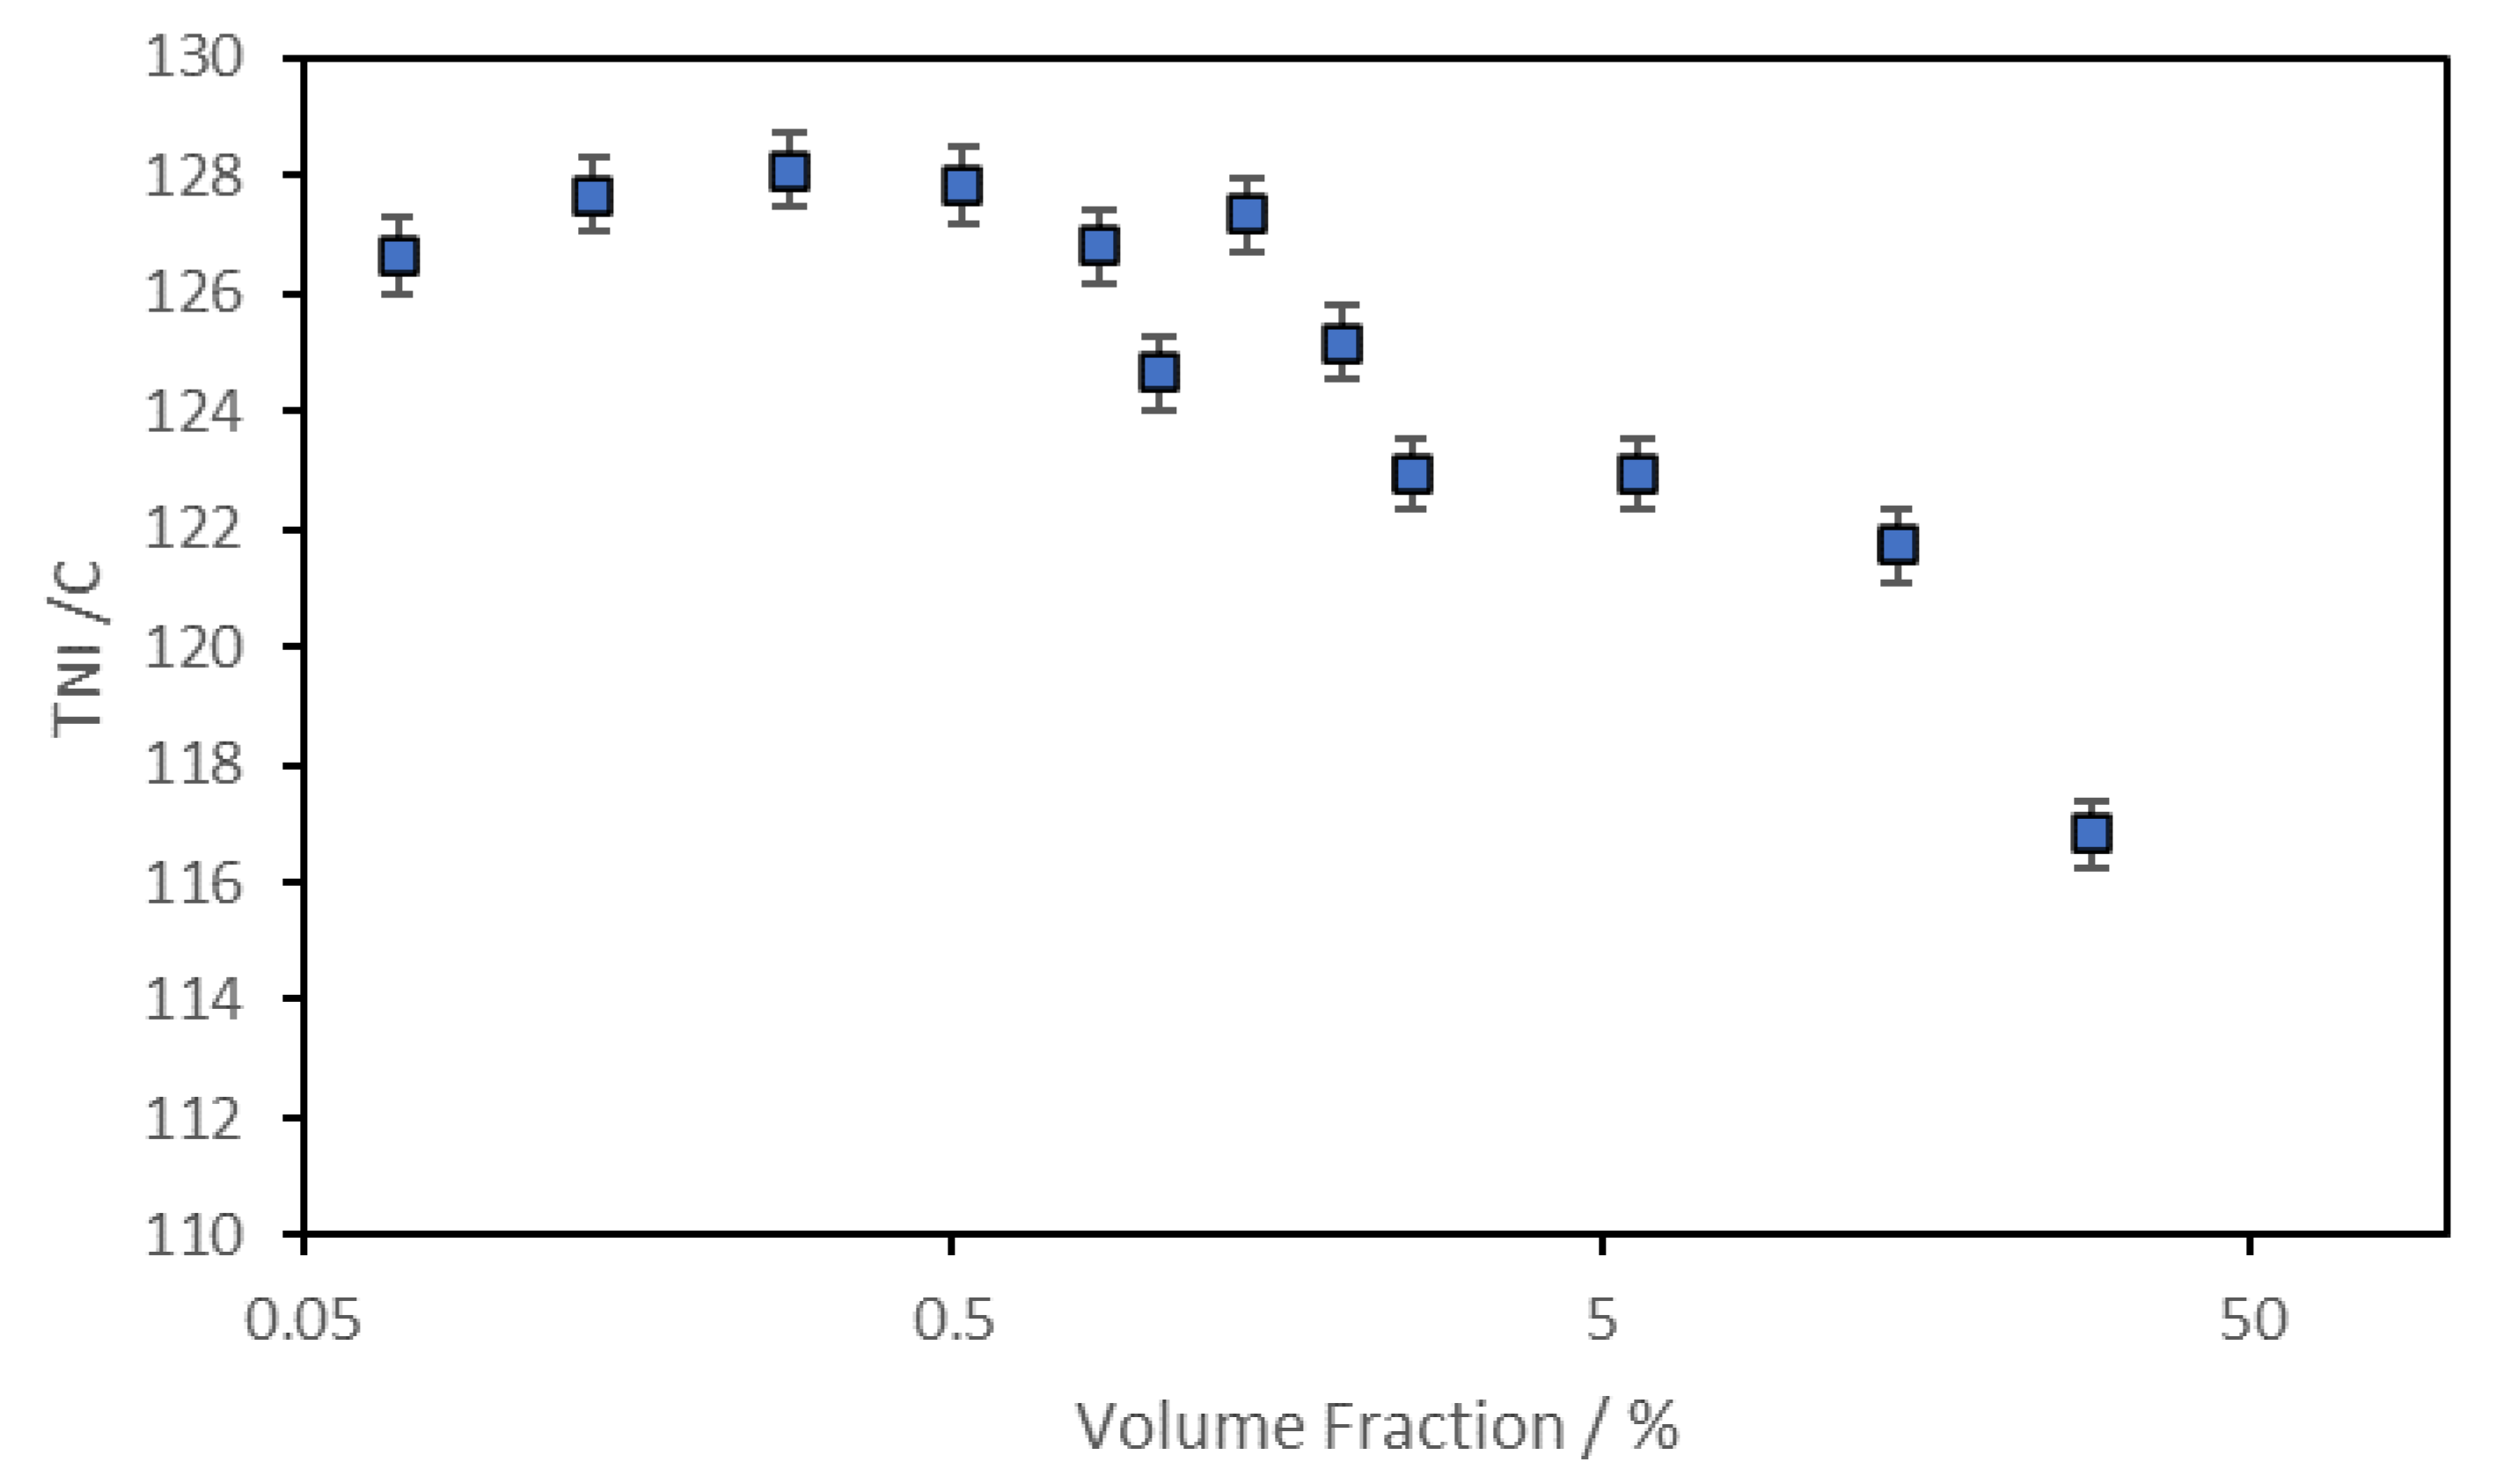
Figure 10.
A plot of the measured light using the system shown in Figure 3b at the temperatures indicated.
Figure 10.
A plot of the measured light using the system shown in Figure 3b at the temperatures indicated.
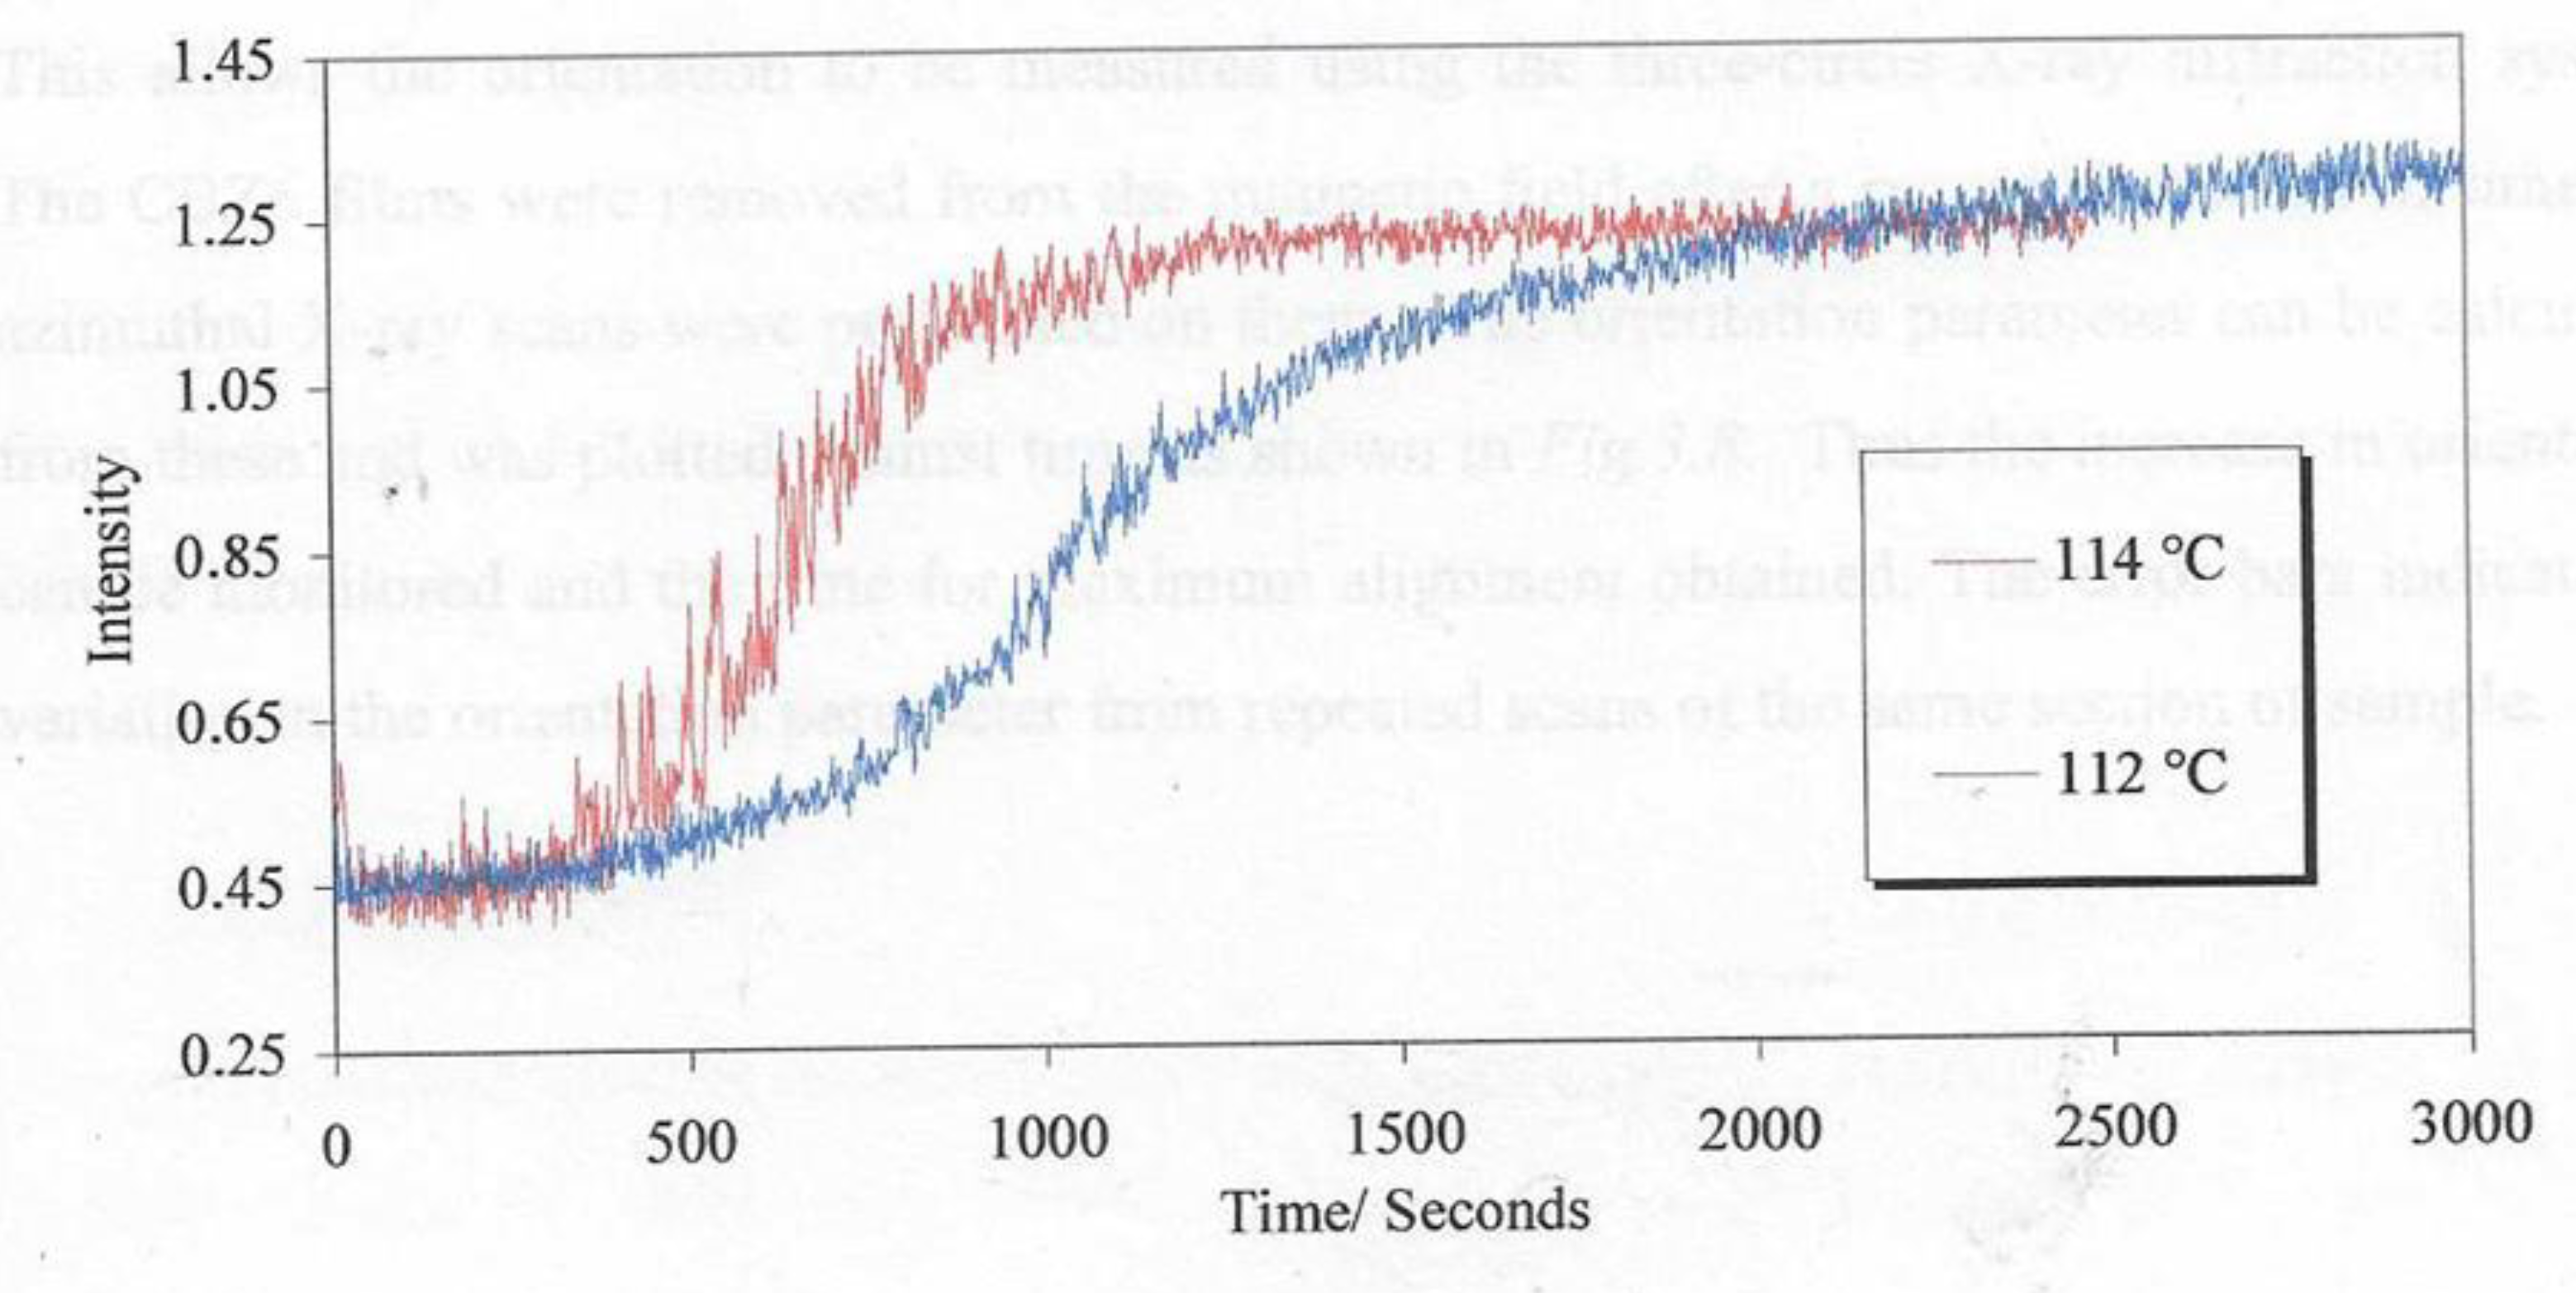
Figure 11.
A plot of sections of the scattering data I(Q,) plotted against the modulus of the scattering vector Q, for a monodomain sample of the liquid crystal polymer prepared at 90° C and in a magnetic field of 2.1T. The sample alignment is that the magnetic field direction is parallel to =0°.
Figure 11.
A plot of sections of the scattering data I(Q,) plotted against the modulus of the scattering vector Q, for a monodomain sample of the liquid crystal polymer prepared at 90° C and in a magnetic field of 2.1T. The sample alignment is that the magnetic field direction is parallel to =0°.
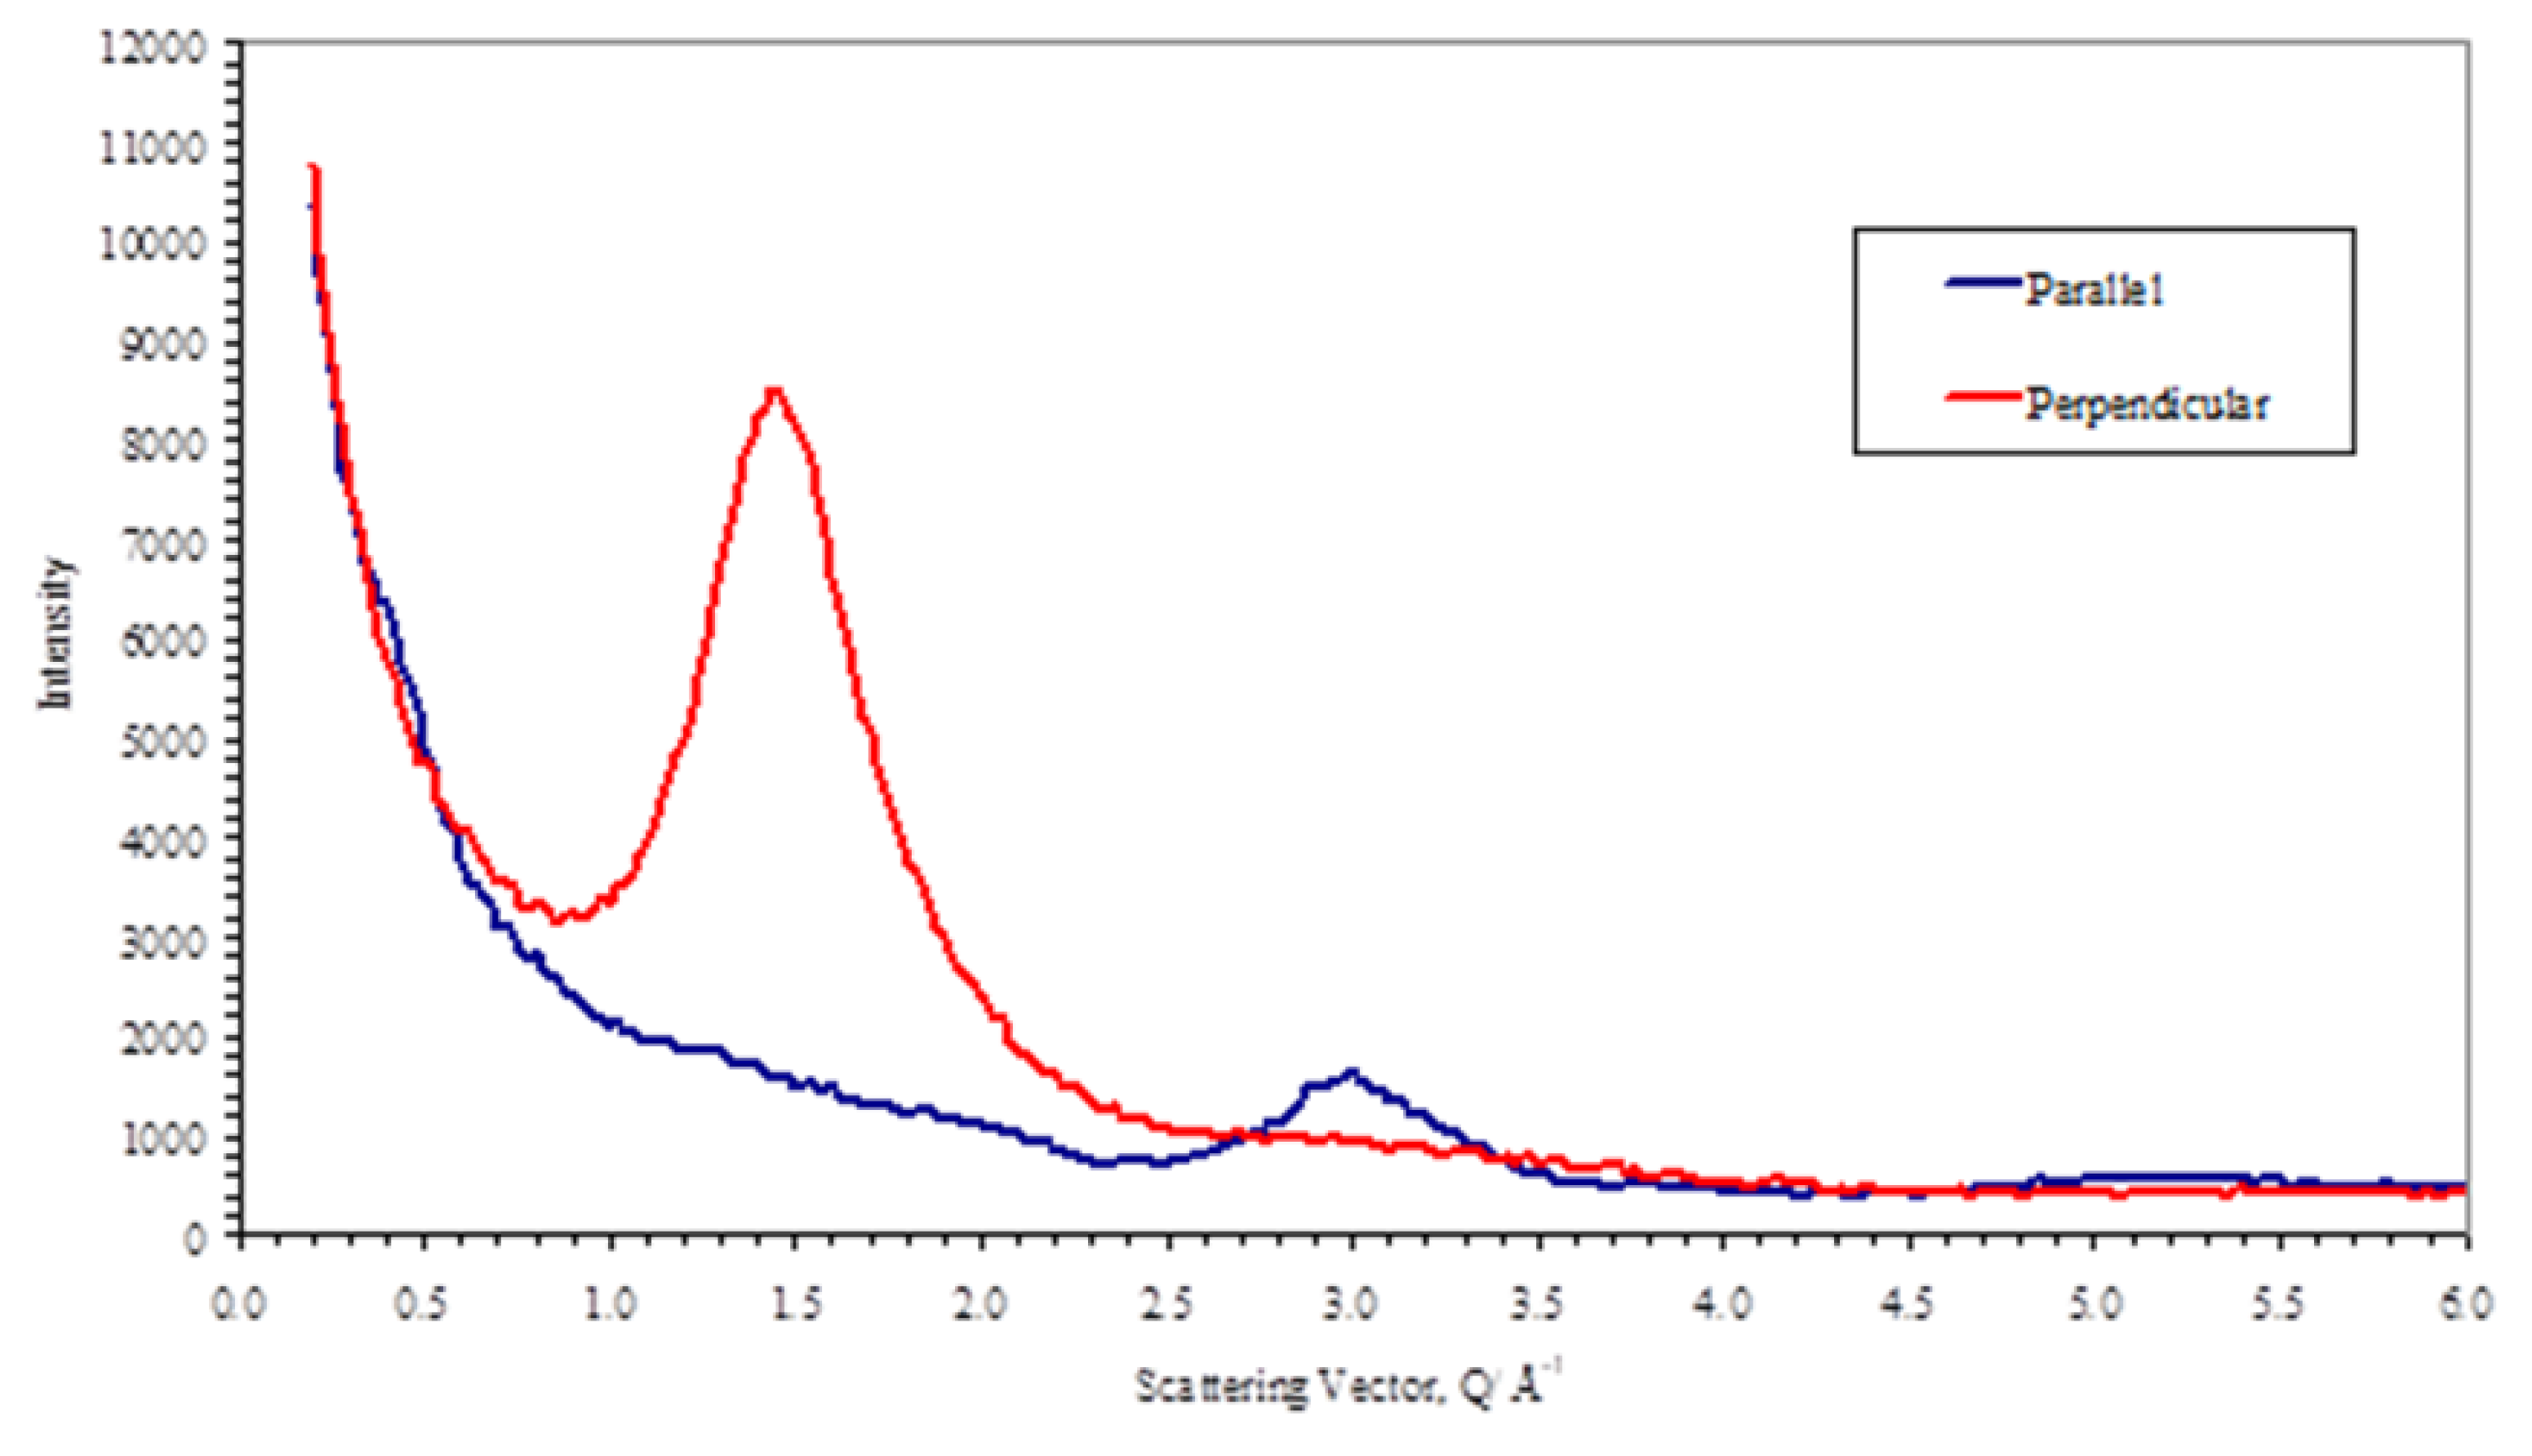
Figure 12.
A plot of the global orientation <P2> against time, for a sample of the liquid crystal polymer used in this work at 90° C and in a magnetic field of 2.1T.
Figure 12.
A plot of the global orientation <P2> against time, for a sample of the liquid crystal polymer used in this work at 90° C and in a magnetic field of 2.1T.
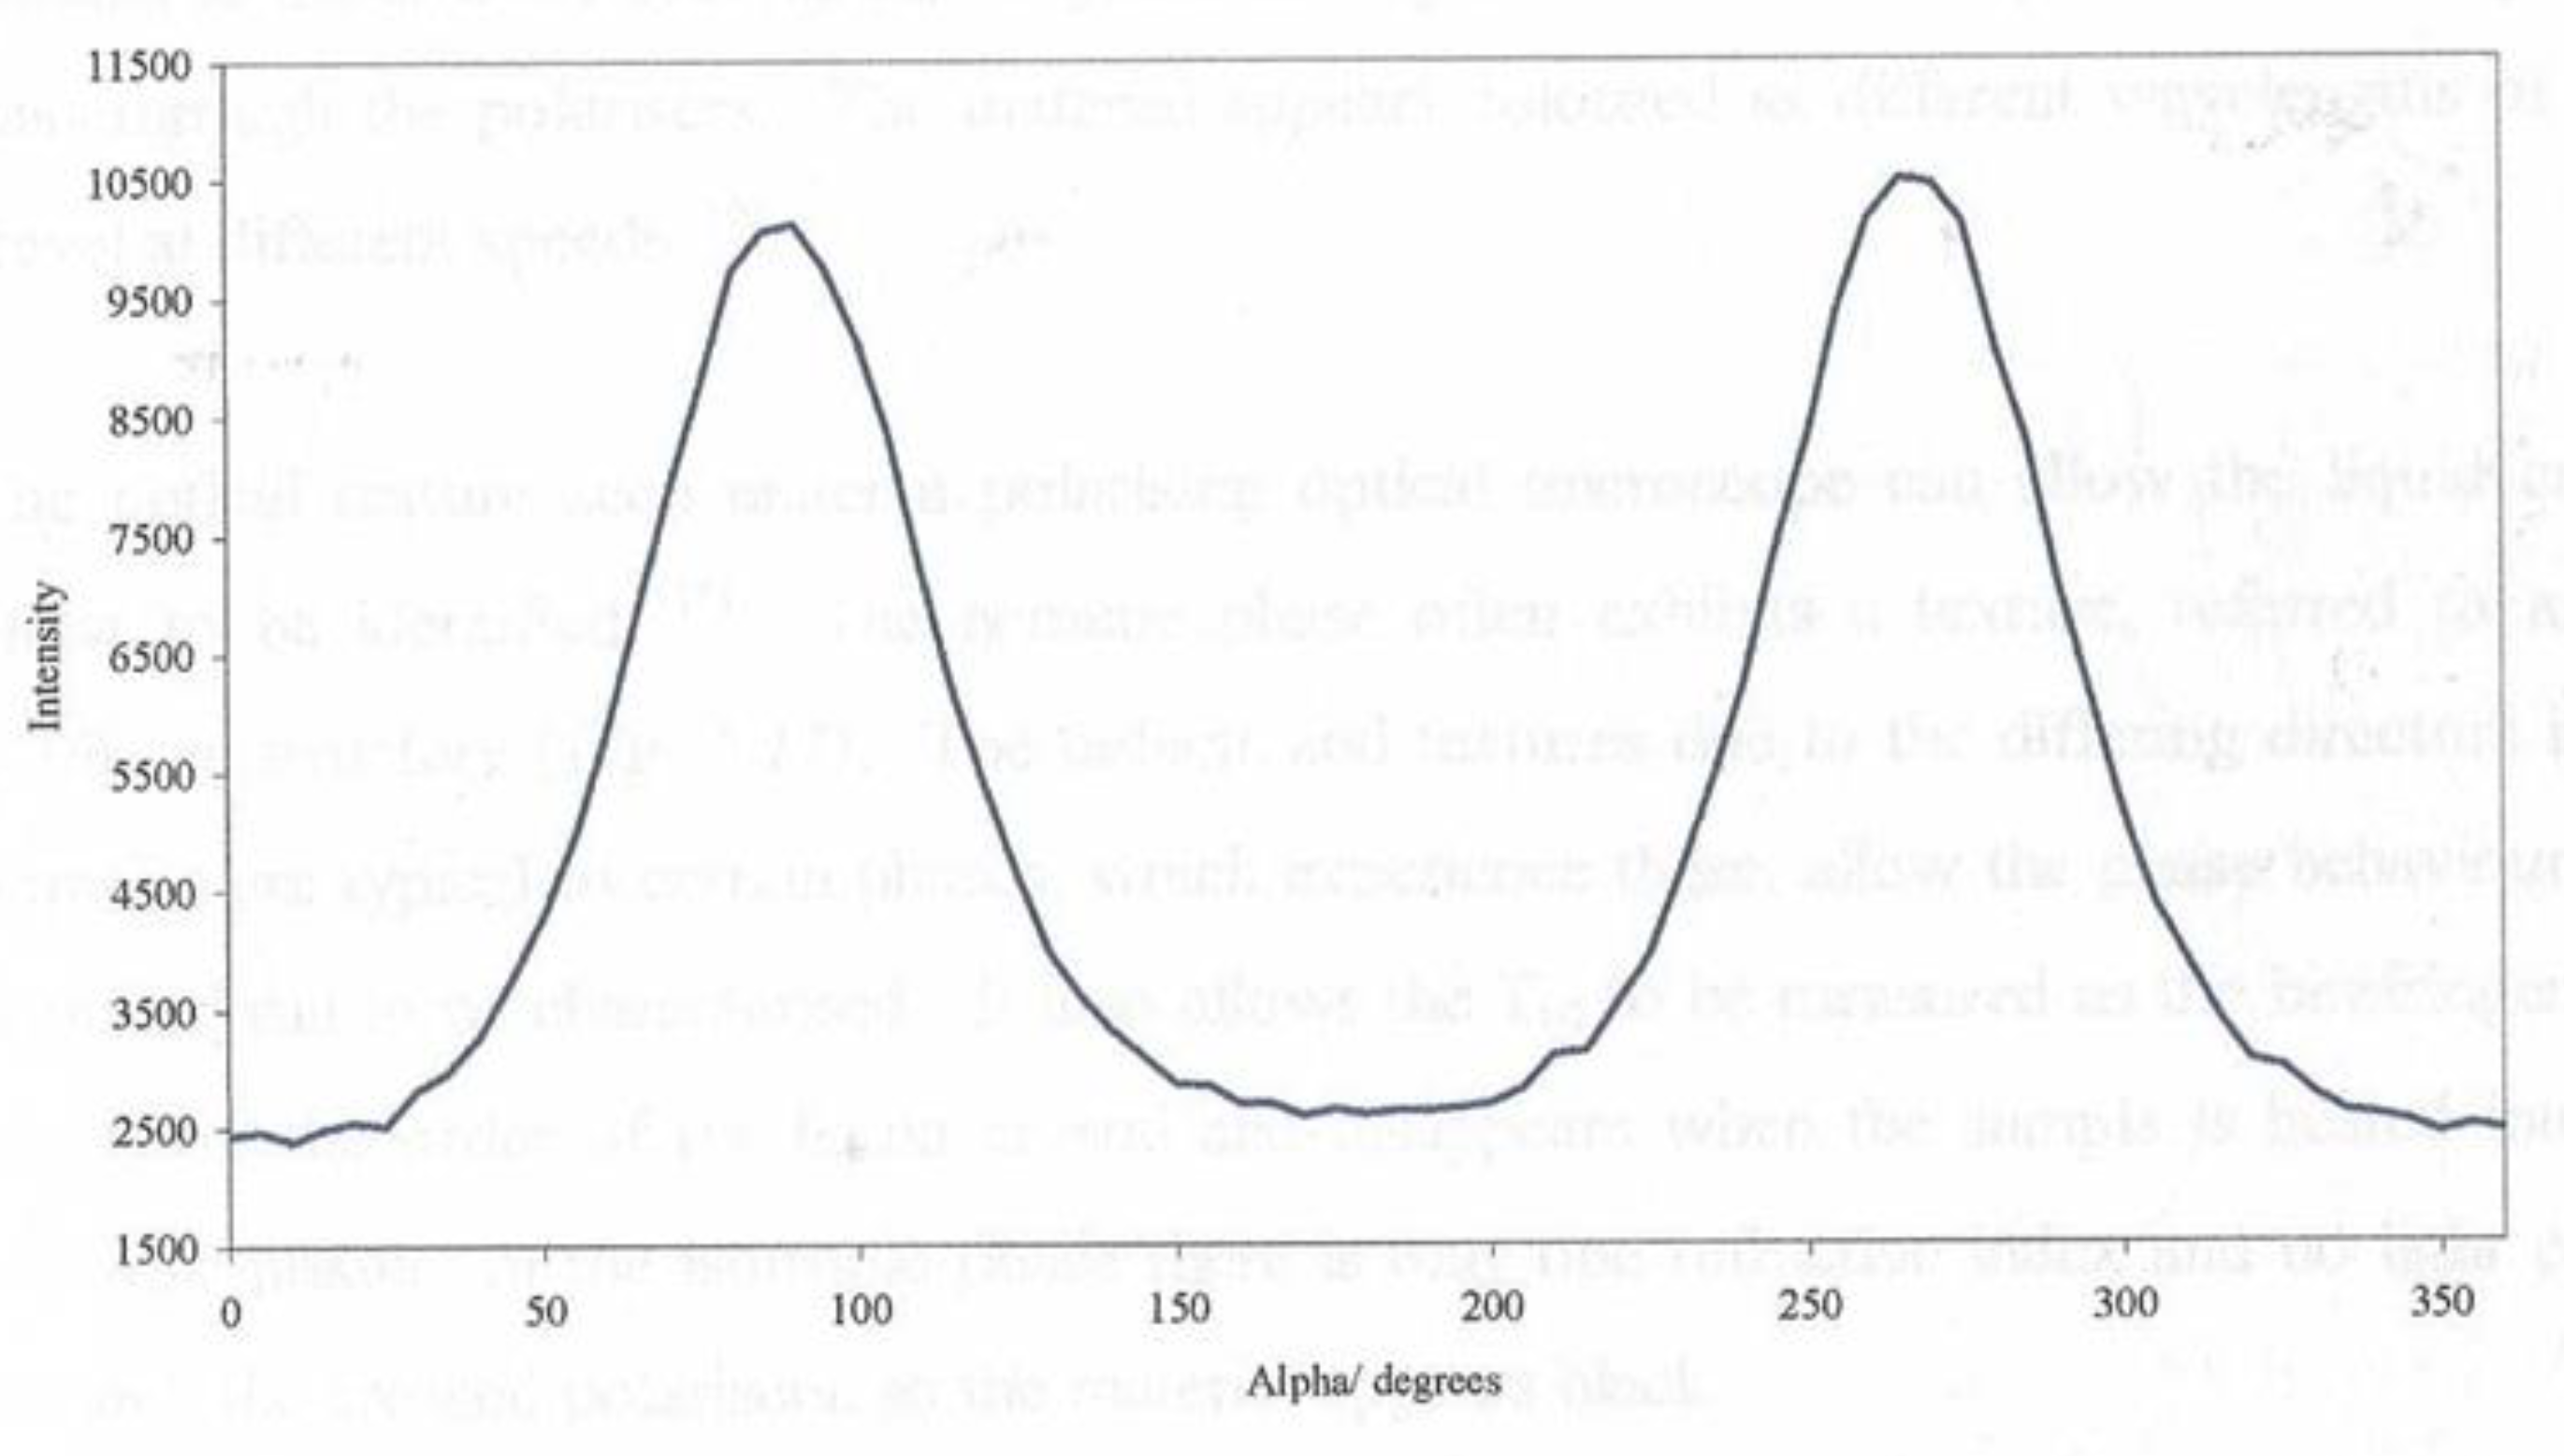
Figure 13.
A plot of the global orientation <P2> against time, for a sample of the liquid crystal polymer used in this work at 90° C and in a magnetic field of 2.1T.
Figure 13.
A plot of the global orientation <P2> against time, for a sample of the liquid crystal polymer used in this work at 90° C and in a magnetic field of 2.1T.

Figure 14.
A plot of the values of 0.5 against the applied magnetic field obtained for a sample of the liquid crystal polymer used in this work at 90° C and in a magnetic field of 2.1T. The dashed line corresponds to the best fit to a model of the alignment times described in the text.
Figure 14.
A plot of the values of 0.5 against the applied magnetic field obtained for a sample of the liquid crystal polymer used in this work at 90° C and in a magnetic field of 2.1T. The dashed line corresponds to the best fit to a model of the alignment times described in the text.

Figure 16.
Wide Angle X-ray Diffraction Scattering Scans (a) samples with varying concentrations of ferroparticles as indicated in the index insert parallel and (c) perpendicular to the aligning field compared to the polymer alone.
Figure 16.
Wide Angle X-ray Diffraction Scattering Scans (a) samples with varying concentrations of ferroparticles as indicated in the index insert parallel and (c) perpendicular to the aligning field compared to the polymer alone.
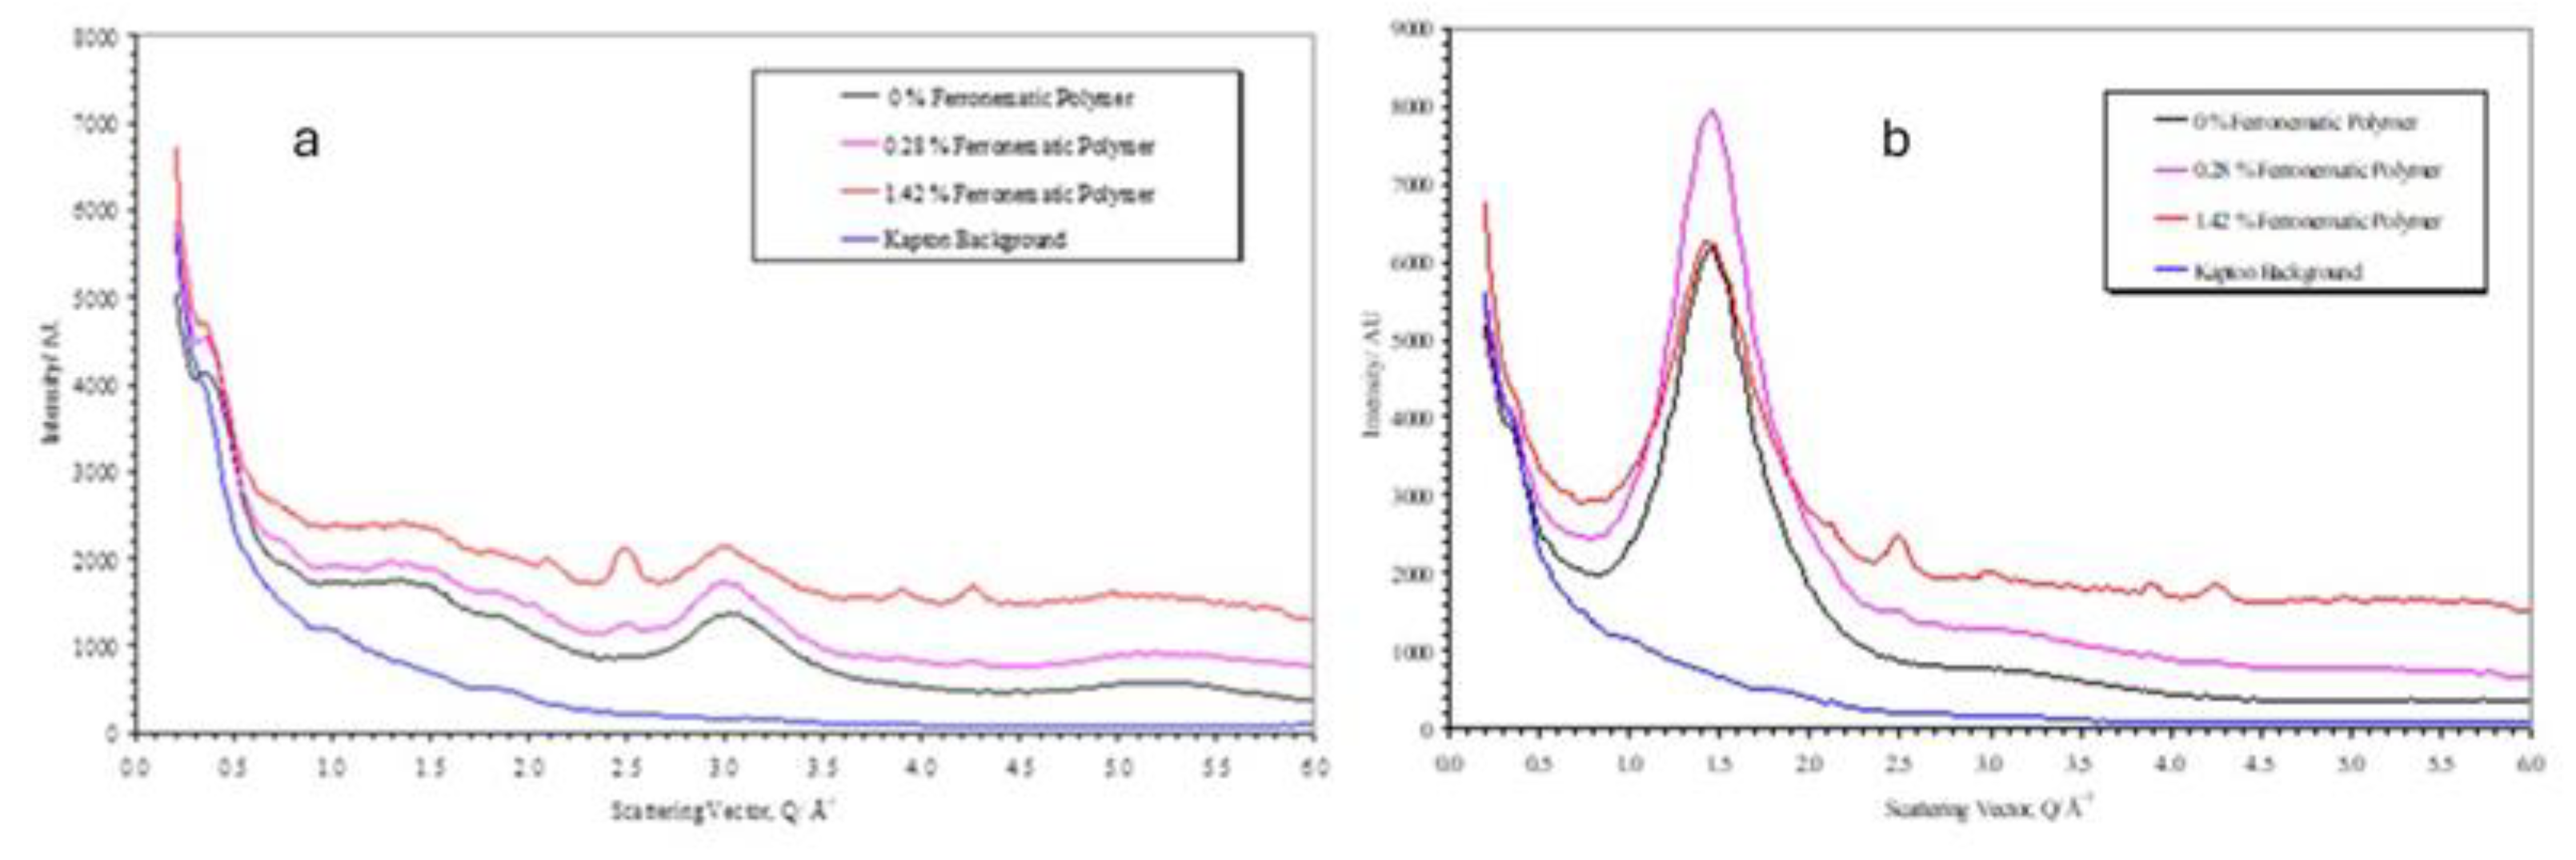
Figure 17.
A plot of the global orientation <P2> against time, for a sample of the liquid crystal polymer used in this work and for a polymer with 0.28% volume of nanoparticles at 90° C and in a magnetic field of 2.1T.
Figure 17.
A plot of the global orientation <P2> against time, for a sample of the liquid crystal polymer used in this work and for a polymer with 0.28% volume of nanoparticles at 90° C and in a magnetic field of 2.1T.
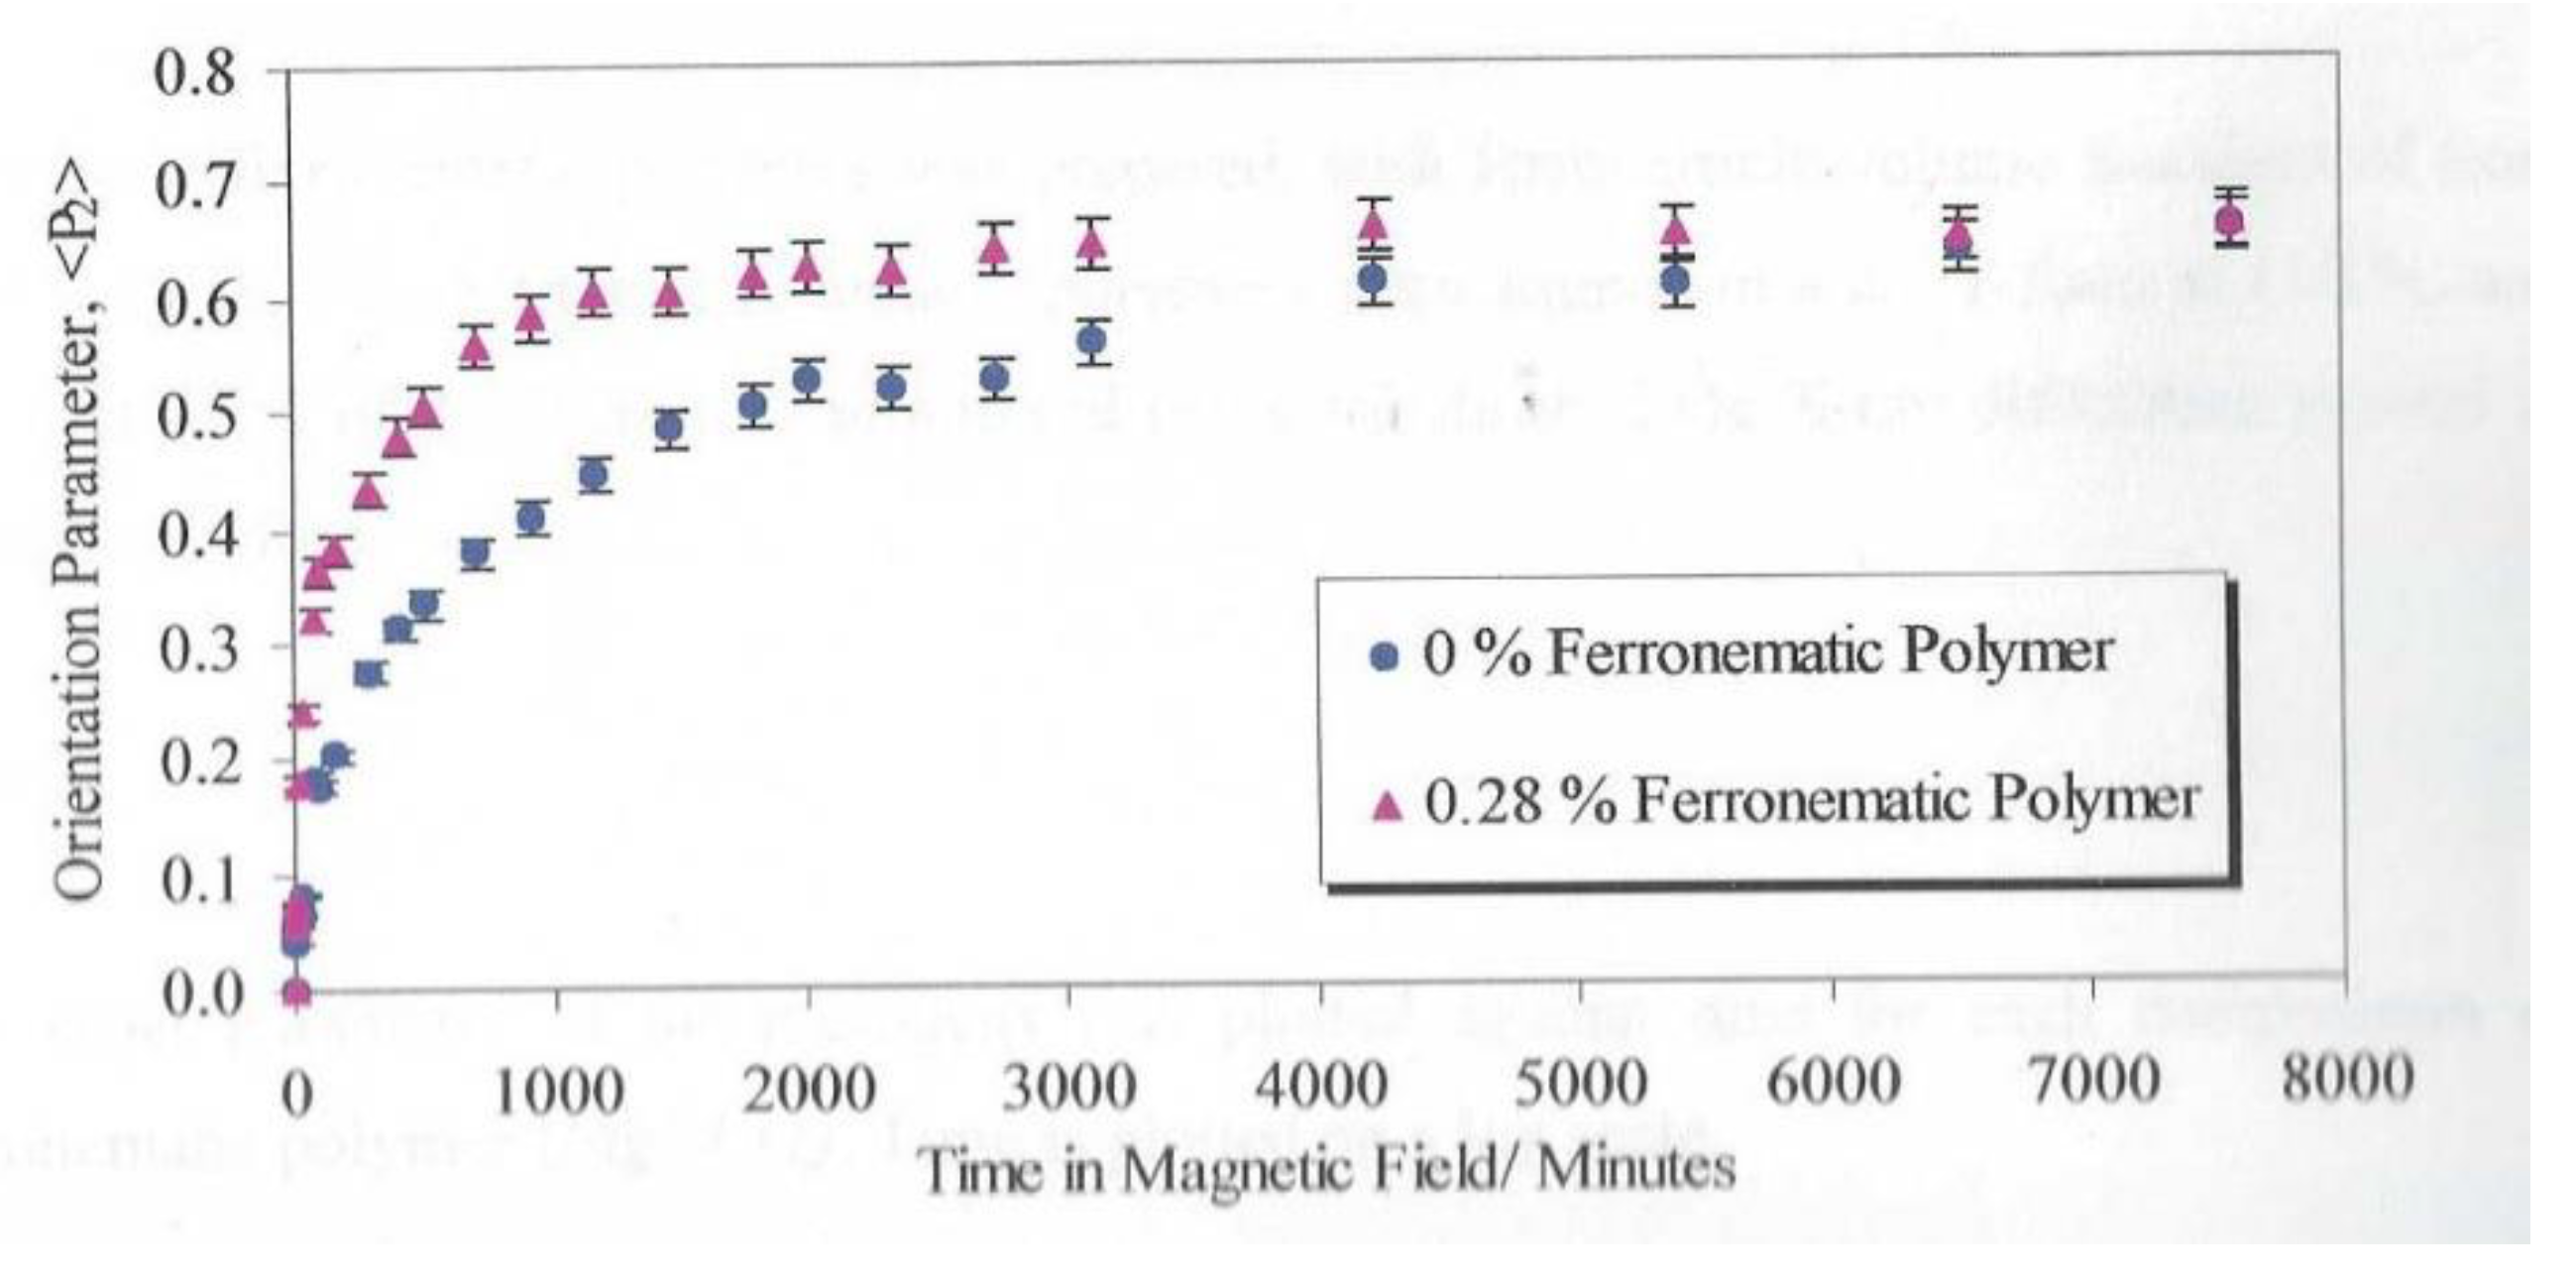
Figure 18.
A plot of the values of the maximum Global Orientational Parameter <P2> recorded for the side-chain liquid crystal polymers plus a varying fraction of ferro nanoparticles for samples held at 110° C and in a magnetic field of 2.1T for substantial periods of time.
Figure 18.
A plot of the values of the maximum Global Orientational Parameter <P2> recorded for the side-chain liquid crystal polymers plus a varying fraction of ferro nanoparticles for samples held at 110° C and in a magnetic field of 2.1T for substantial periods of time.
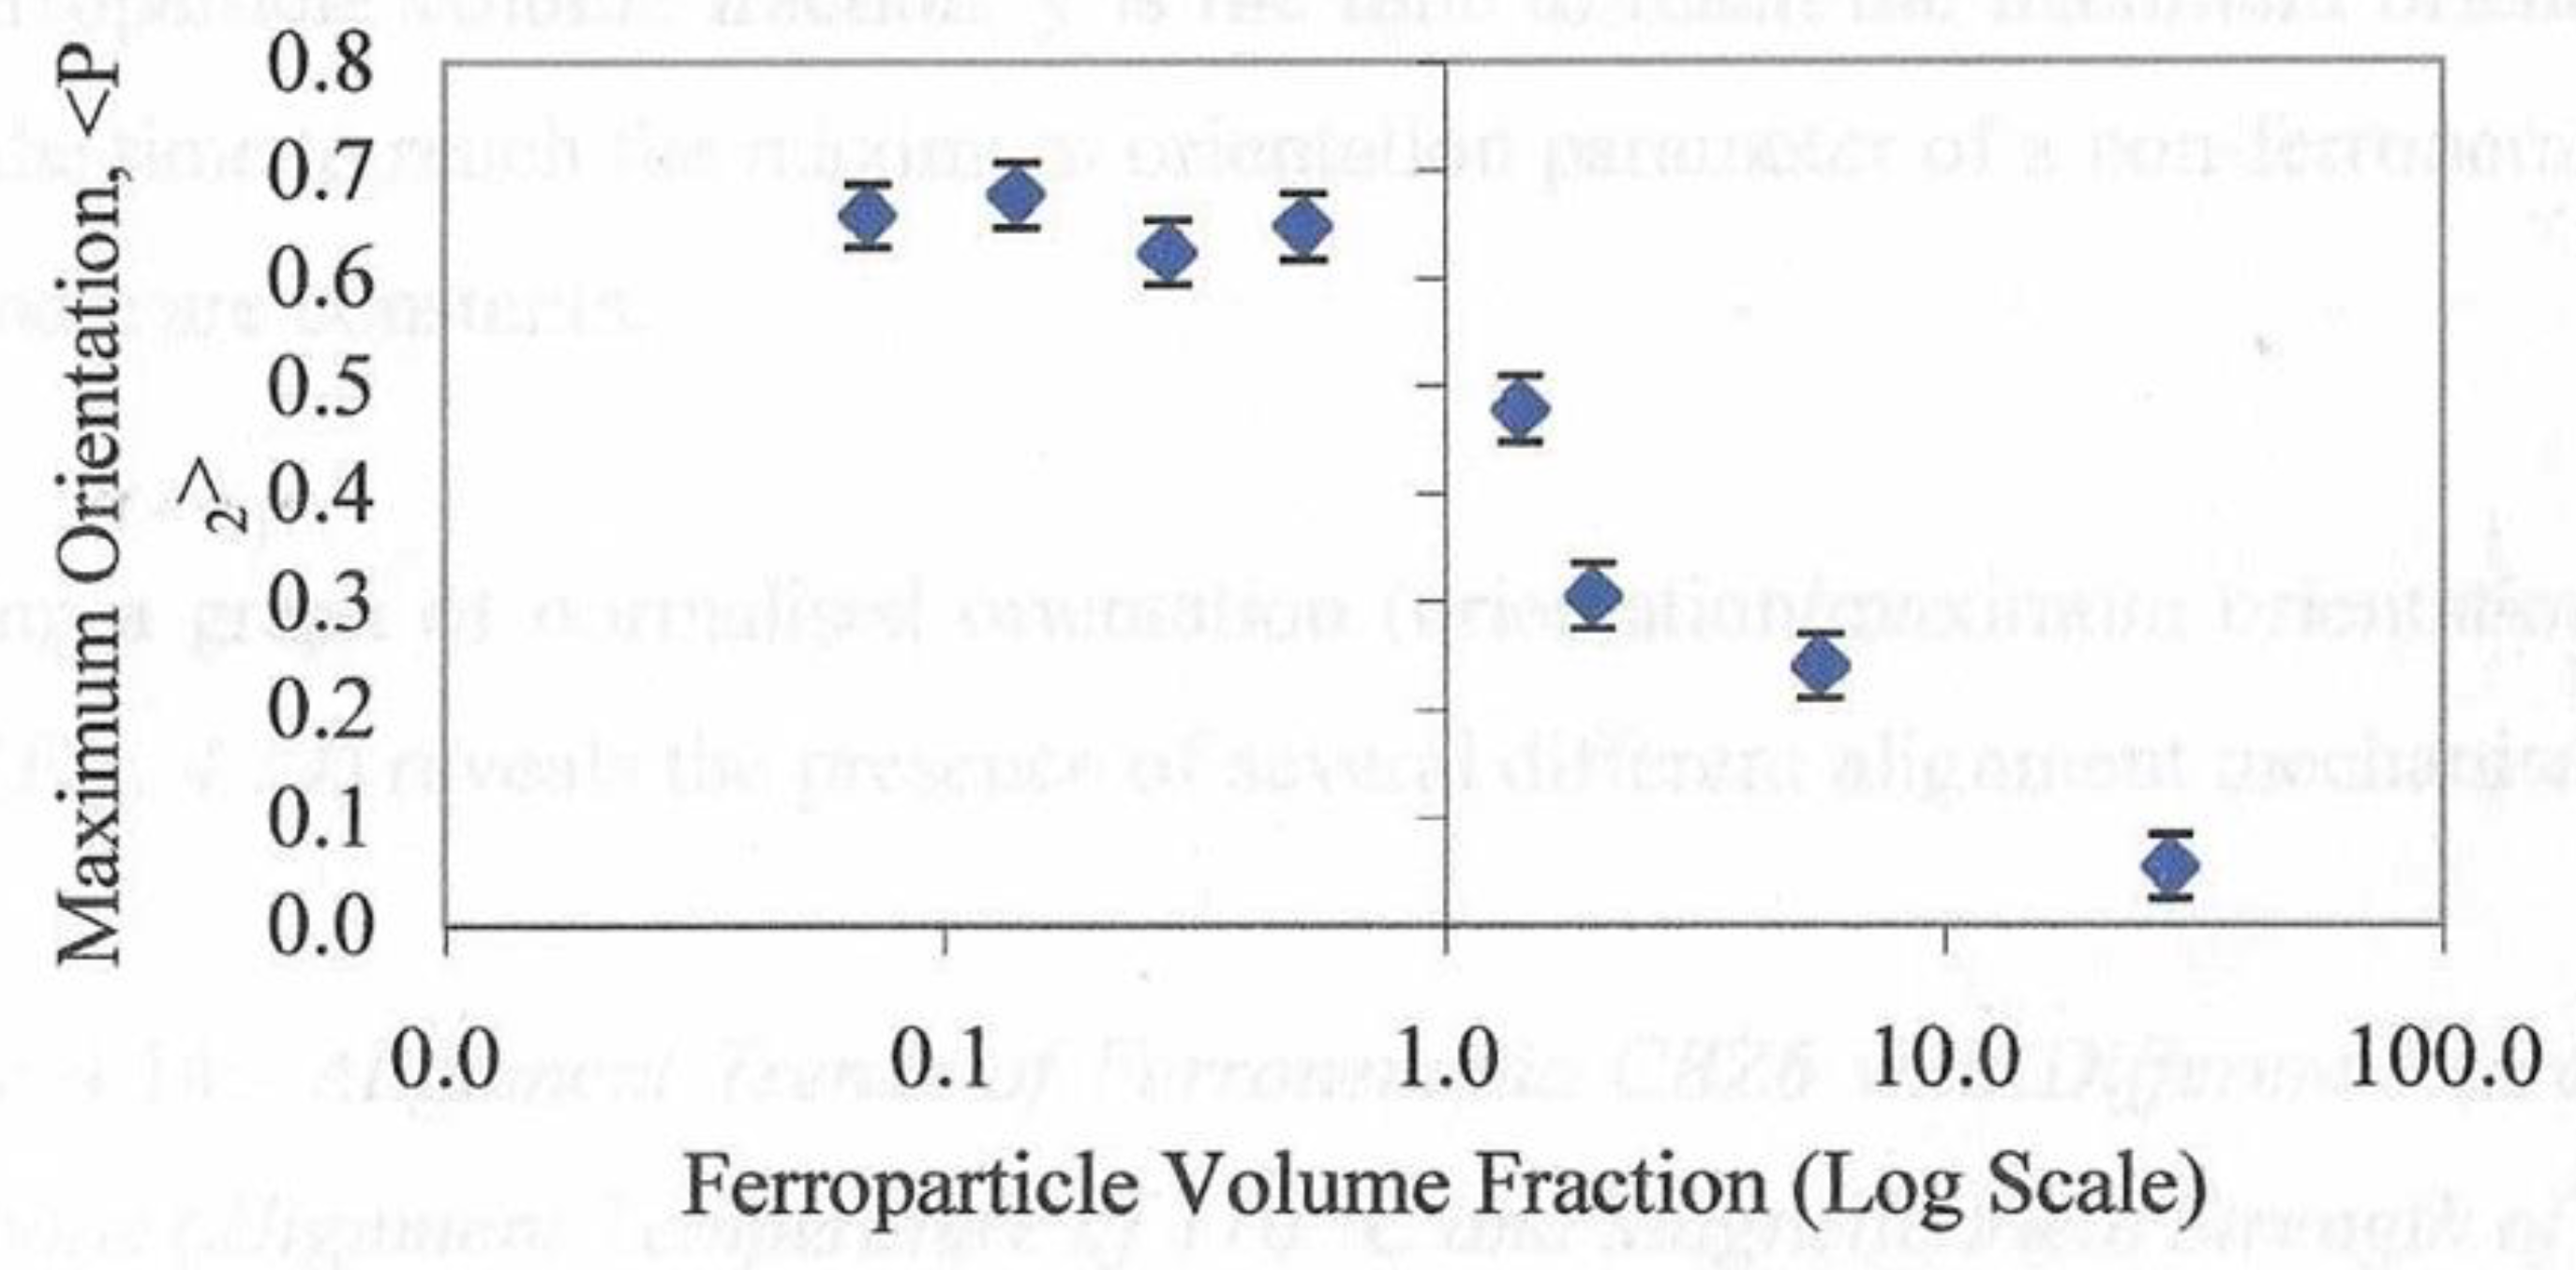
Figure 19.
A plot of the alignment time for the formation of a monodomain prepared from the polymer alone and from the polymer plus 0.28% or 1.99% as shown in the index insert held at 110° C.
Figure 19.
A plot of the alignment time for the formation of a monodomain prepared from the polymer alone and from the polymer plus 0.28% or 1.99% as shown in the index insert held at 110° C.
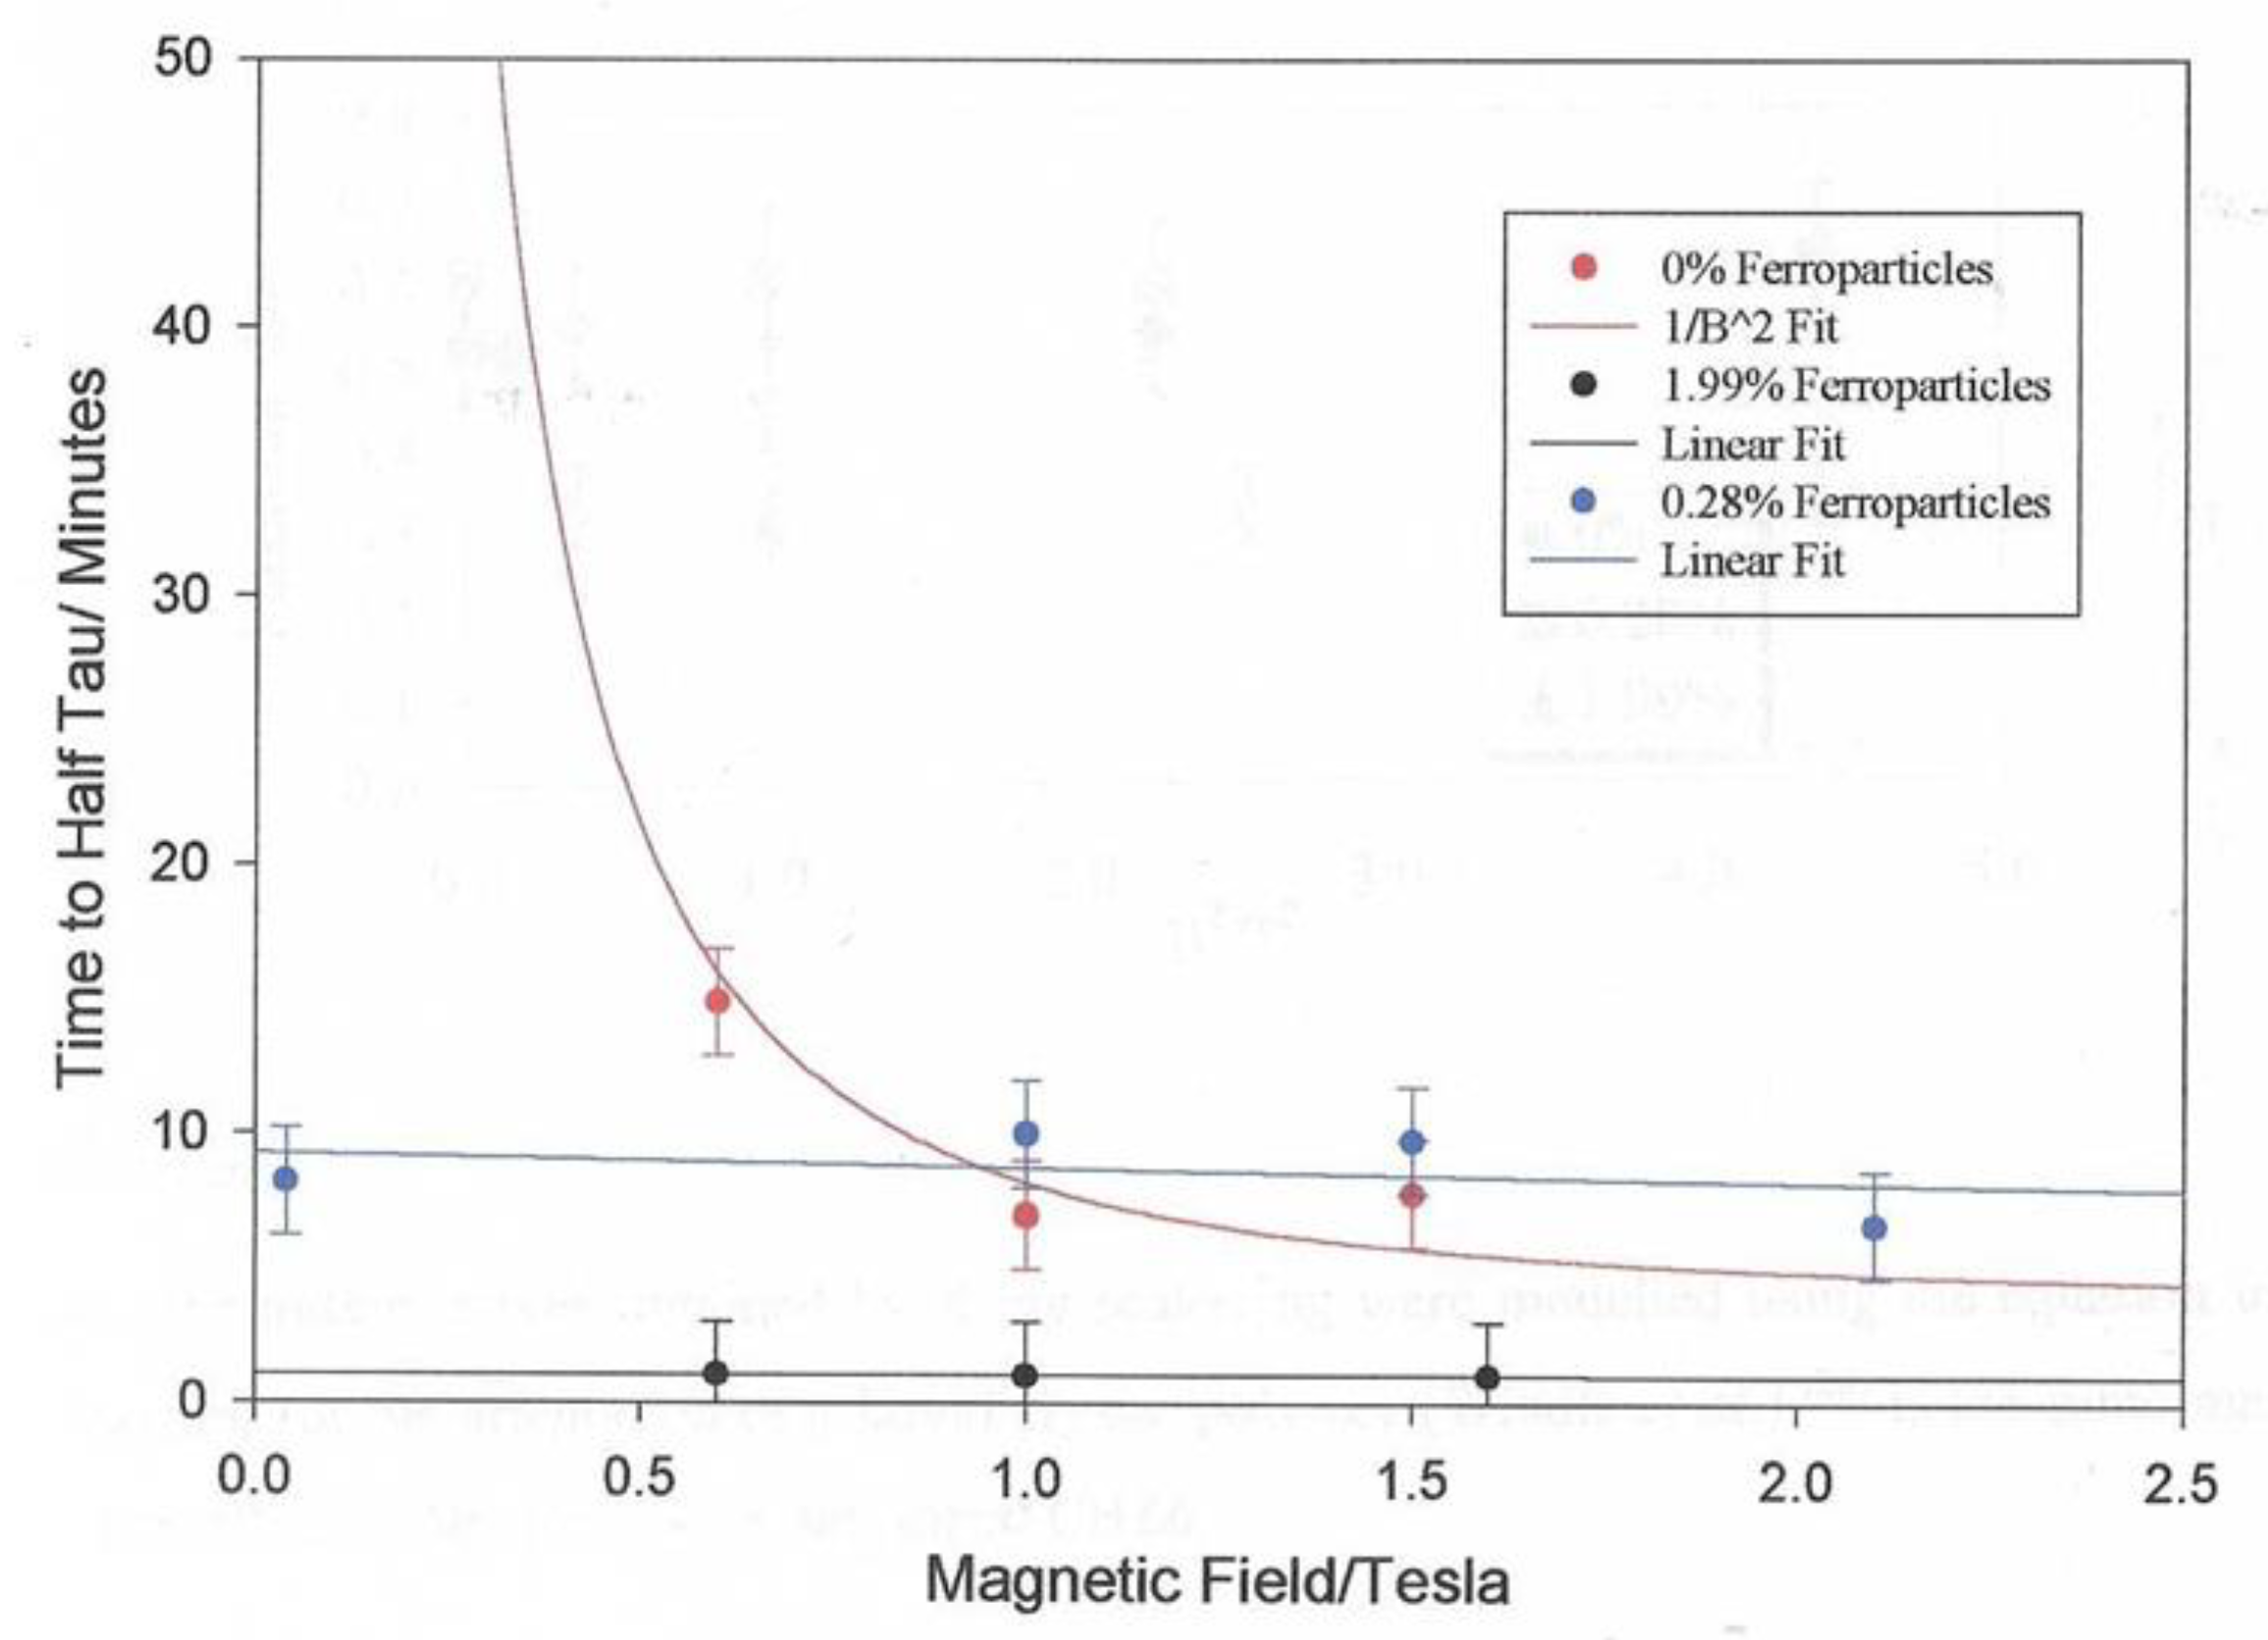
Figure 20.
(a) A horizontal section of the 2D small-angle X-ray pattern for the same monodomain (CBZ6 plus 0.28% ferroparticles) shown in Figure 12. (b) a contour plot of the 2D small-angle X-ray scattering pattern for the monodomain containing CBZ6 plus 0.28% ferroparticles.
Figure 20.
(a) A horizontal section of the 2D small-angle X-ray pattern for the same monodomain (CBZ6 plus 0.28% ferroparticles) shown in Figure 12. (b) a contour plot of the 2D small-angle X-ray scattering pattern for the monodomain containing CBZ6 plus 0.28% ferroparticles.
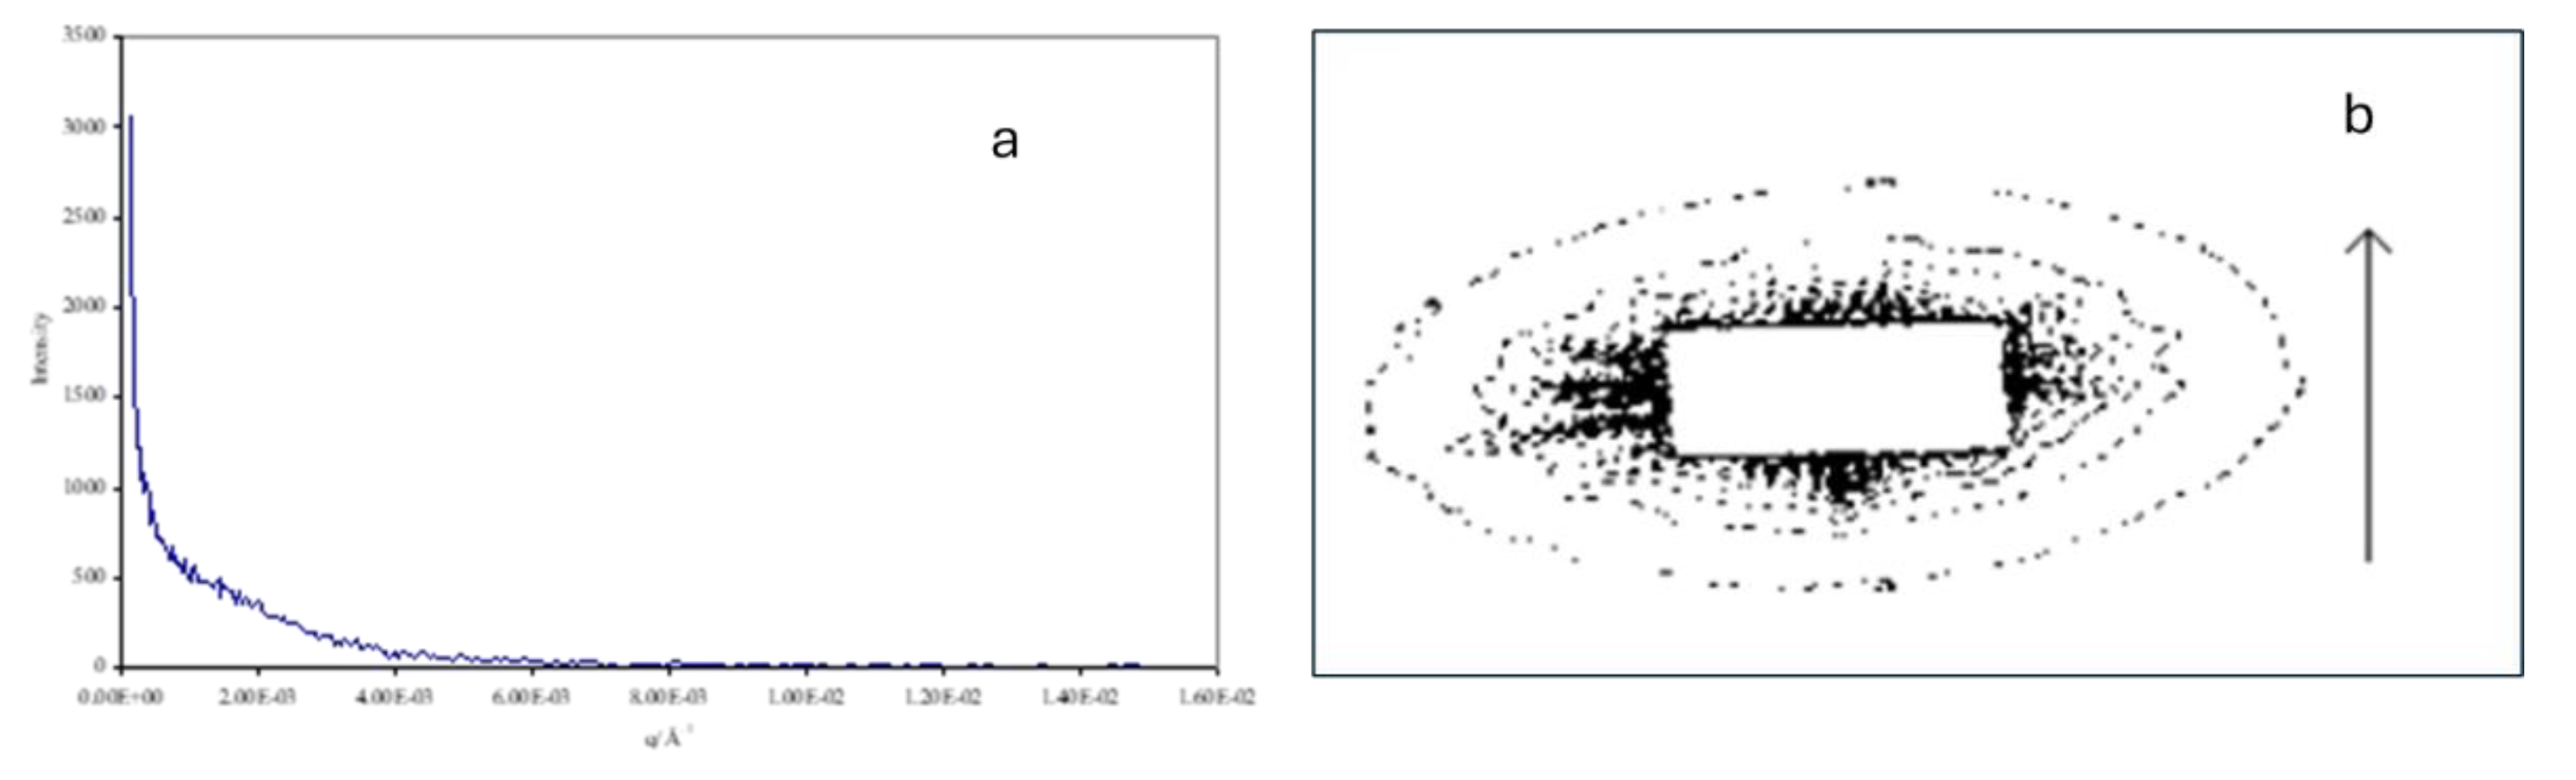
Figure 21.
Thermally induced shape variations for monodomain liquid crystal elastomers produced in the presence and without nanoscale ferroparticles.
Figure 21.
Thermally induced shape variations for monodomain liquid crystal elastomers produced in the presence and without nanoscale ferroparticles.
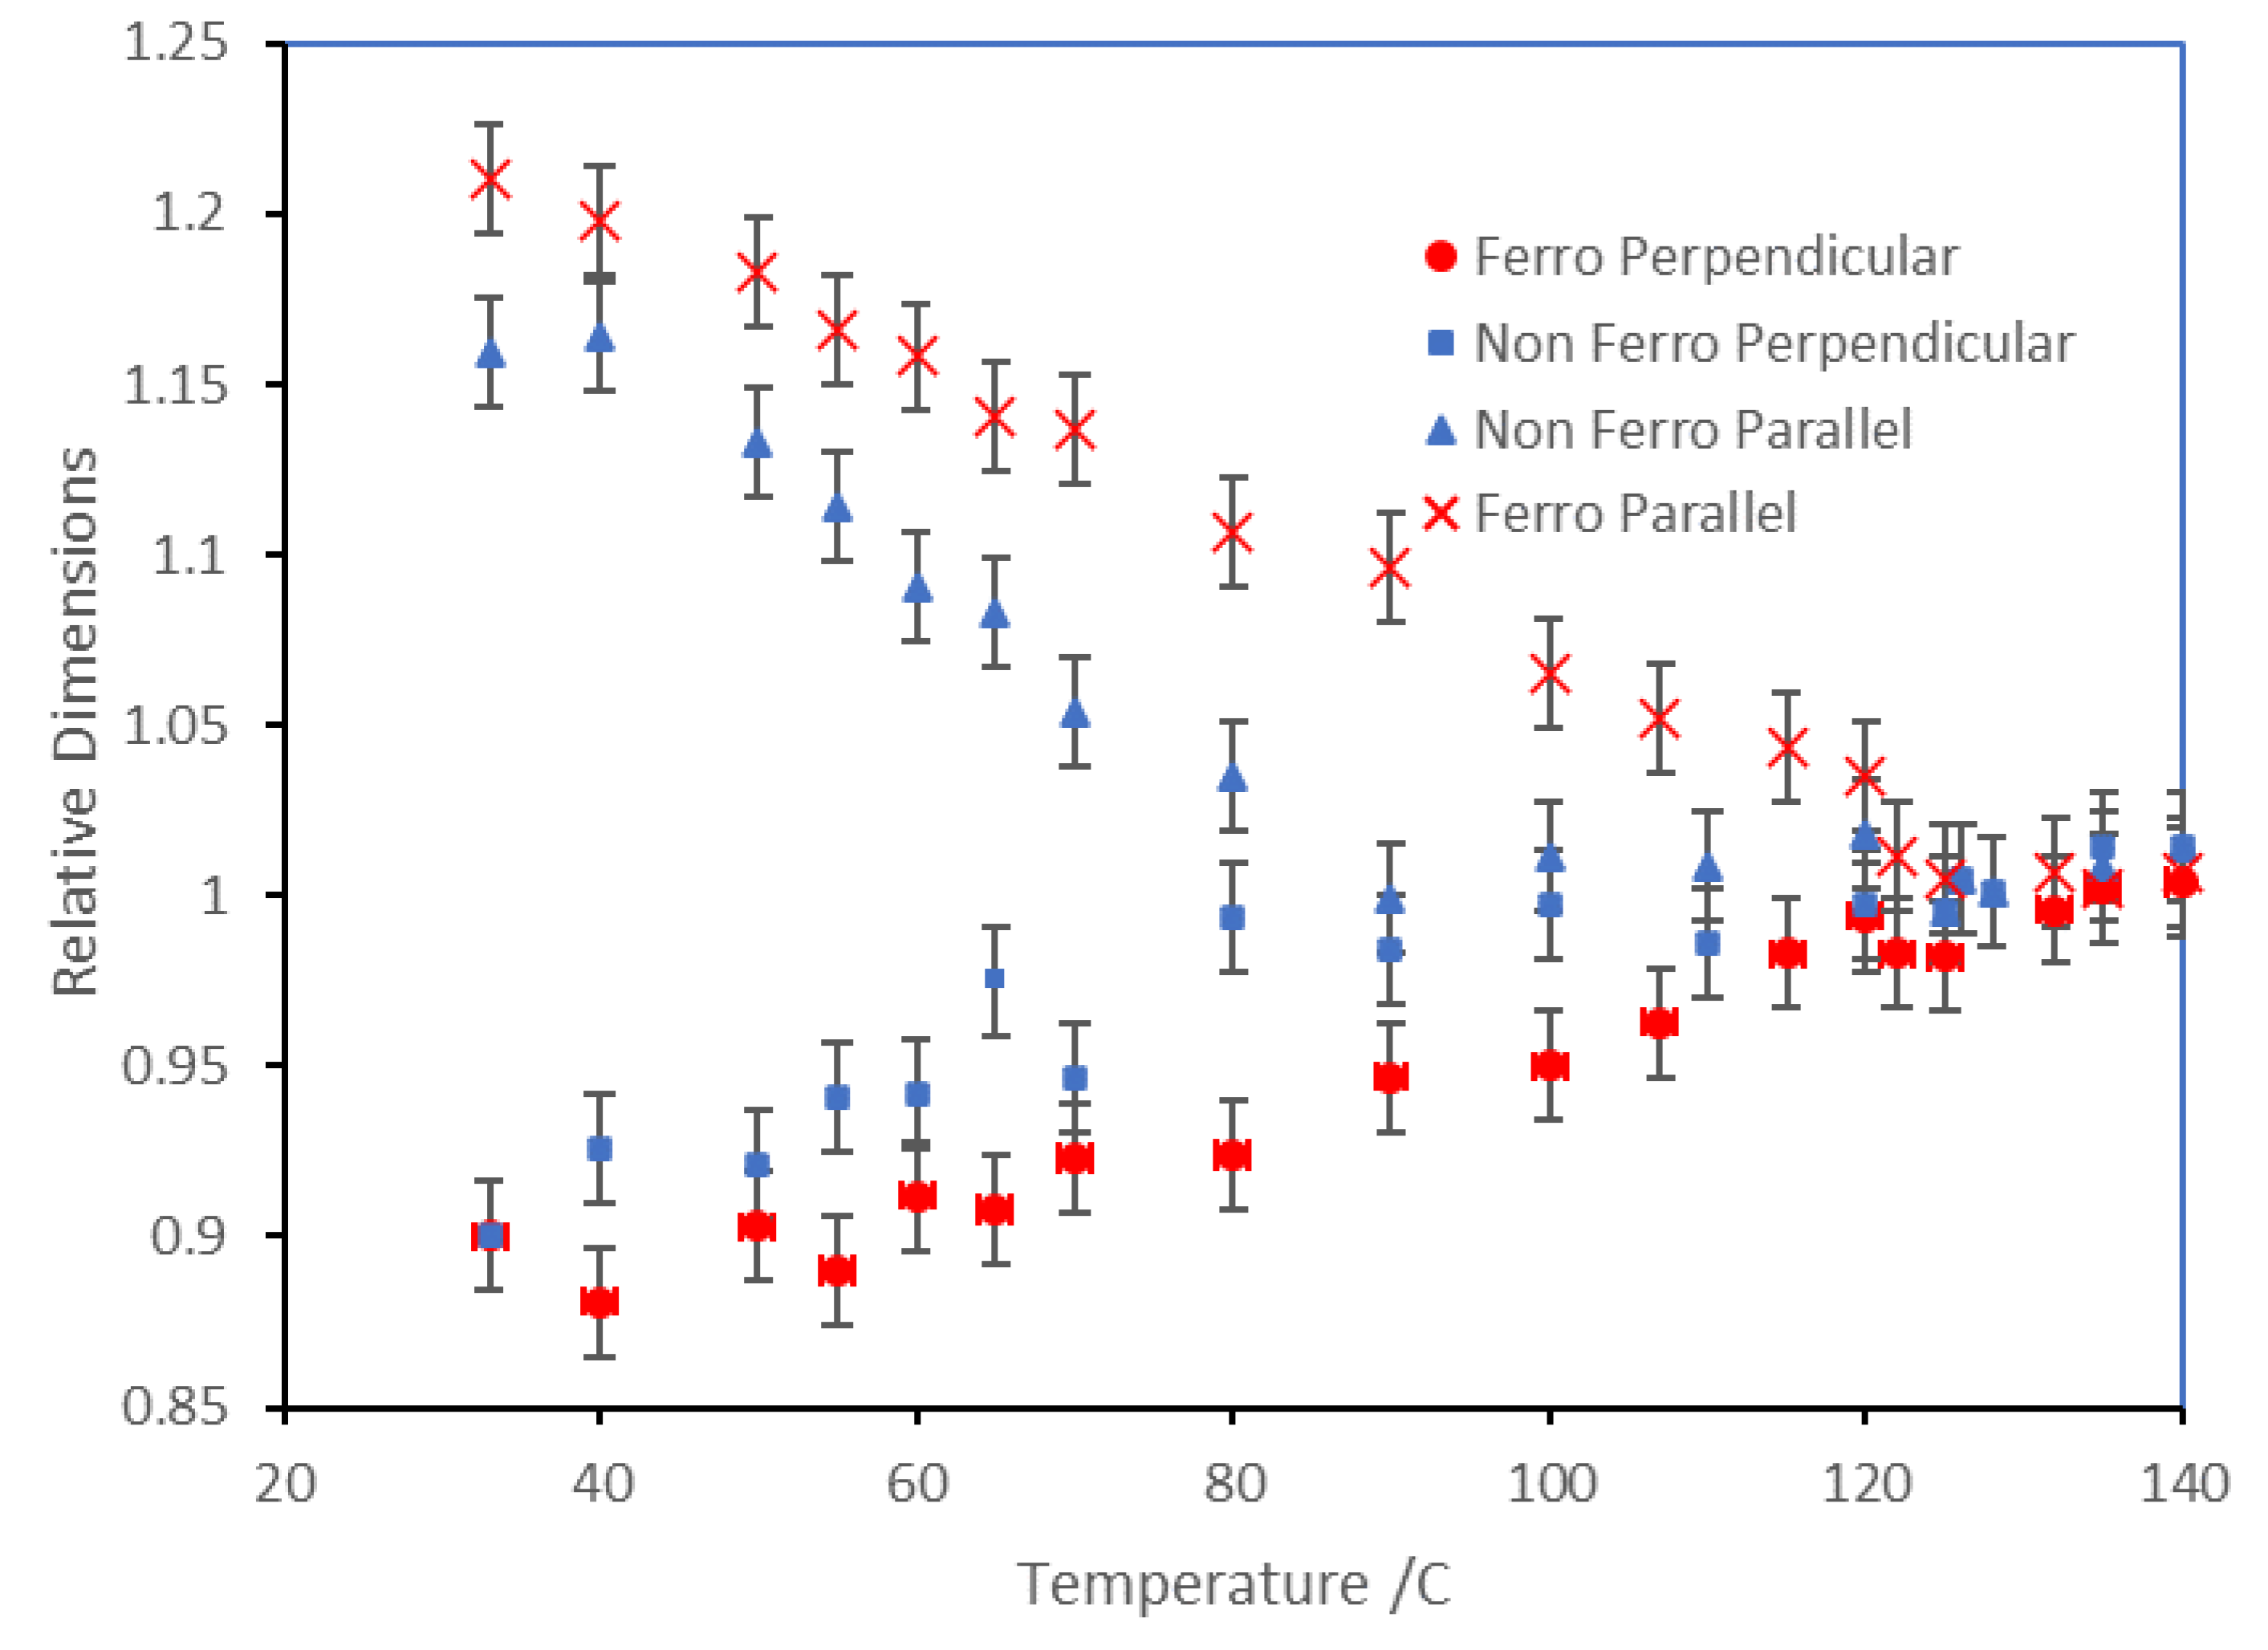
Figure 22.
a polar plot of the sample dimensions of a monodomain prepared from a lower molecular weight of CBZ6 prepared using a magnetic field of 2.1T and a temperature of 110° C.
Figure 22.
a polar plot of the sample dimensions of a monodomain prepared from a lower molecular weight of CBZ6 prepared using a magnetic field of 2.1T and a temperature of 110° C.
Disclaimer/Publisher’s Note: The statements, opinions and data contained in all publications are solely those of the individual author(s) and contributor(s) and not of MDPI and/or the editor(s). MDPI and/or the editor(s) disclaim responsibility for any injury to people or property resulting from any ideas, methods, instructions or products referred to in the content. |
© 2024 by the authors. Licensee MDPI, Basel, Switzerland. This article is an open access article distributed under the terms and conditions of the Creative Commons Attribution (CC BY) license (http://creativecommons.org/licenses/by/4.0/).
Copyright: This open access article is published under a Creative Commons CC BY 4.0 license, which permit the free download, distribution, and reuse, provided that the author and preprint are cited in any reuse.


