Submitted:
21 August 2024
Posted:
28 August 2024
You are already at the latest version
Abstract
This study was conducted to identify the actual degree of underdevelopment and spatial characteristics of rural areas in Korea, which are expected to face extinction due to population decline and aging. For this purpose, the spatial scope was set to Eup and Myeon areas classified as rural regions. To assess the degree of underdevelopment, previous studies were reviewed and analyzed to develop a comprehensive underdevelopment index, which was then applied to Eup and Myeon areas to classify them into growth regions, general regions, and depressed regions. Mapping the classified regions revealed that both growth and general regions were concentrated in the metropolitan area and southeastern regions, where Korea's population and resources are densely clustered. In contrast, depressed regions were found primarily in areas where agriculture is the main industry and in regions with unfavorable geographical conditions. This study is significant as it covers the entire nation of Korea, providing a method for identifying depressed regions and highlighting the regions that are developing. The findings can serve as fundamental data for the development of policies to address population decline in the future.
Keywords:
depressed region
; region sustainability
; depopulation
; spatial analysis
; population aging
1. Introduction
South Korea became the country it is today through rapid industrialization after the Korean War. While the country’s economy has grown overall, rural areas have experienced periods of relative stagnation and decline since the beginning of industrialization in the 1970s, following a rapid urban-oriented development policy [[1], Jang]. In fact, the rural population was 2,245,000 in 2019, down 84.4% from 14,422,000 in 1970 [[2], KS]. This rural depopulation has resulted in an increase in the proportion of the elderly population, not just a decrease in the number of people. This rural depopulation leads to an outflow of people due to the absence of jobs and income generating sources, which reduces the vitality of the region, which reduces income generating sources, which leads to an outflow of people, which leads to a vicious cycle of decline and stagnation [[3], KRI, 2005].
Rural communalization is not just a rural problem. Small and medium-sized cities with rural areas are also experiencing communalization, and this communalization is reducing the vitality of local cities. Korea is experiencing a simultaneous population decline in urban areas along with rural areas, and rural decline, which has become a hot topic in Korea, is no longer an illusion but a direct reality. In fact, the problem of depopulation in non-metropolitan areas outside of Korea’s capital region continues to worsen, with 50% of the country’s municipalities and districts classified as depopulation risk areas in 2022, according to the Korea Employment Information Service [[4], Lee,2022]. The local extinction index used to categorize communities is defined by Lee (2016) [[5], Lee, 2016] as the ratio of the number of women aged 20-39 to the number of people aged 65 and over, and if it falls below 0.5, it means that the community has entered a stage of demographic decline [4].
The declining population and aging of rural areas in contrast to cities is predicted to lead to the disappearance of rural areas, and the Korean central government has recognized the seriousness of the situation and proposed various policies. Representative policies include the designation of “New Vitality Projects,” “Growth Promotion Areas,” and “Declining Population Areas,” and the implementation of various projects to build living infrastructure in these areas. The New Vitality Project was launched in 2004 to provide financial support to city and county-level areas with poor living conditions and significantly low development levels to help them implement specialized projects [[6], Han, 2022]. The designation of growth-promoting regions began in 2009, and once designated as a growth-promoting region, the government provides differential support for the construction and expansion of infrastructure such as roads, water and sewerage, and grants benefits such as an increase in the grain subsidy rate [[7], Lee, 2011]. The designation of population decline areas is a project in which the Ministry of the Interior and Safety develops a population decline index for municipalities in 2021 and designates population decline areas accordingly, and then injects financial resources such as local depopulation response funds and government subsidies in the form of a package to the plans that localities freely establish for population growth.
These policies are characterized by the spatial scope of the financial injections, which are specified in terms of cities and counties. A city or county is an administrative division where rural and urban areas coexist, and its subdivisions are composed of Eup, Myeon, and Dong. The Korean legal system designates Dong as urban areas, while Eup and Myeon are classified as rural. Since the government’s financial investment is made at the city and county level, this spatial categorization is reasonable. However, it is important to understand the phenomenon at the sub-regional level in order to more accurately understand the status of regional depopulation. For this purpose, a spatial categorization based on scientific and objective indicators of depopulation at the subregional level is needed.
The aforementioned policies have not stopped the outflow of people from rural areas, which is the fundamental purpose of the policies, and the population continues to decline. As a result of this outflow, many rural areas have become communalized or have a tendency to do so [[8], Ju, 2019]. In this context, existing policies related to local extinction need to change to be more effective. In order to guide these policy changes and maximize their effectiveness, it is necessary to measure and present the risk of extinction at the subregional level. In addition, the risk of extinction should be prioritized in rural areas over urban areas, i.e., the spatial analysis should be lowered to the level of Eup and Myeon, which are rural areas. Of course, studies need to be conducted at the village level, which is the smallest level at which rural attrition can be prioritized, but the village level may be too fine for a national picture.
Therefore, this study was initiated with the aim of identifying the spatial status of Korea’s aging and declining population. We aim to identify subregions in Korea that are declining beyond just population and characterize them.
2. Selection of Research Target
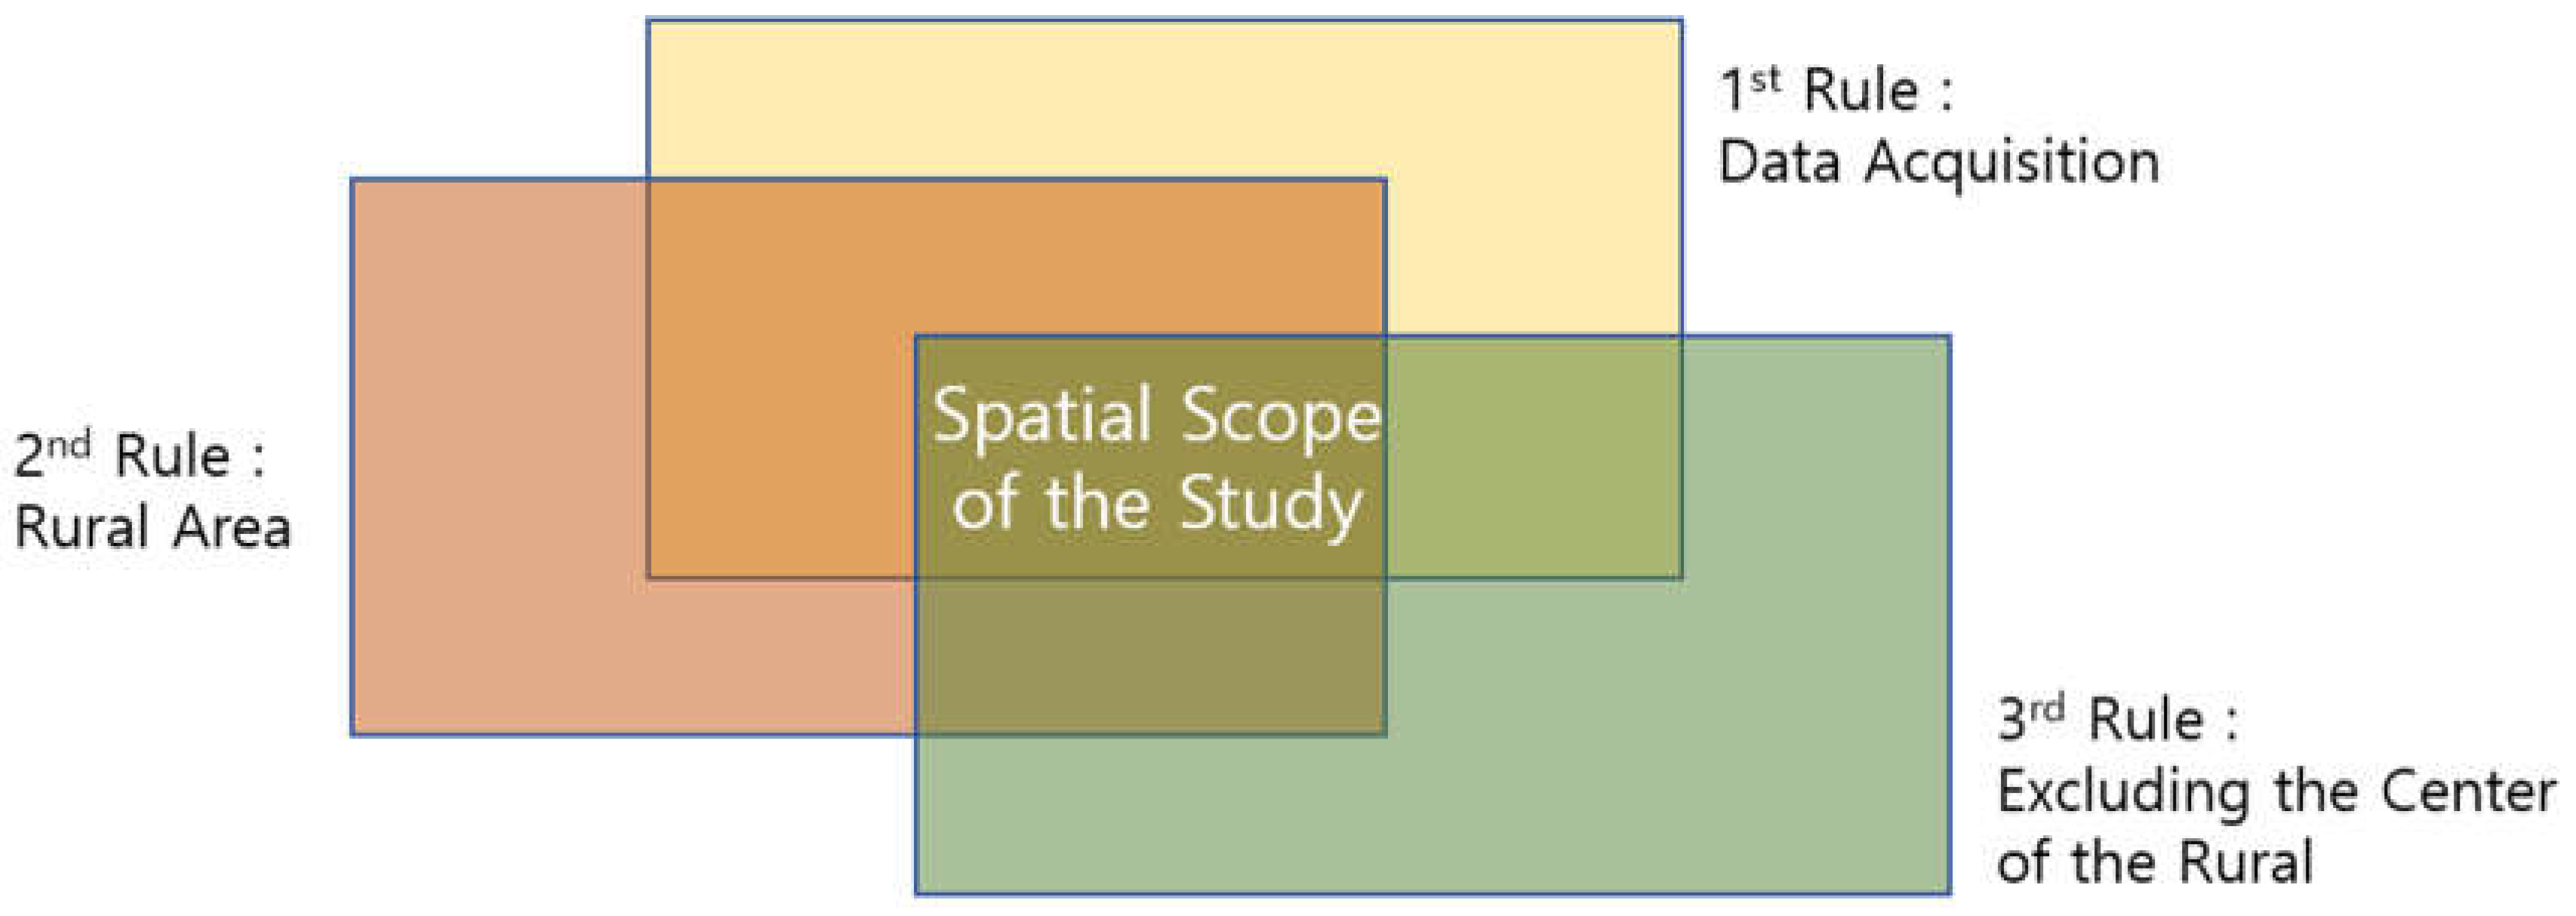
To fulfill our research objectives, we established principles for selecting study sites. First, it should be a region with measurable indicators. This is because it is possible to measure the decline of a region only if it has data on indicators derived from analyzing previous studies. Second, the study was limited to rural areas in Korea. Although there are urban areas with agriculture as the main industry, it is not possible to categorize them and obtain data. Therefore, we classified and selected Eup and Myeon as rural areas according to Korean law. Third, we excluded the center of rural areas. As this study aims to measure the decline of rural areas, it was necessary to exclude regional centers. The centers were selected as the areas where the city and county offices are located because the city and county offices in most regions have commercial facilities, including tourist offices, and concentrated populations.
The target area is the area of a Eup or Myeon classified as rural by law, excluding the center (known as Dong or Eup). The final selection was made after checking the indicators selected to measure the decline of the region.
Figure 1.
Principles for Site Selection.
South Korea has a total of 1,412 Eup and Myeon as of 2020. Of these, 230 are Eup and 1,182 are Myeon [[9], MI, 2020]. Most of Eup and Myeon can be said to meet the first and second principles. Some areas that should be excluded are towns and villages designated as islands for which transportation data are not available. Some areas are accessible by ferry, but objective data is not available when ferry service is not available or is intermittent. These areas should be excluded from this study because it is impossible to obtain consistent data on transporttation. Finally, some areas were excluded based on the third principle. Dong is a municipalized area that plays a natural central role in mid-sized cities, but there are also Eup that play this role. In Korea’s administrative system, areas called “Gun” fall under this category, and even if they are Eup, they are areas where the county office is located and where a large number of people and daily services are concentrated. Therefore, the area where the county government office is located can be said to serve as the center of the region. The total number of Eup and Myeon selected through this principle is 1,320, and they are evenly distributed across the country except for islands.
3. Literature Review and Theoretical Framework
3.1. Definition of Depressed Regions
The definition and categorization of depressed regions has traditionally been based on Klassen’s classification and Hanssen’s classification. Klassen categorizes regions into four types: fully developed regions, growing underdeveloped regions, potentially underdeveloped regions, and depressed regions by comparing the static level of regional income and the dynamic level of growth rate to the national average. Depressed regions are those whose income level and growth rate are both lower than the national average [[10], TA, 2013]. Hassen’s classification categorizes capital into three types: direct productive activities, inter-economic capital, and social indirect capital, and compares marginal social benefits and marginal social costs to classify regions into overcrowded, intermediate, and backward regions. A depressed region is classified as a backward region, which means a region that has few special features that can attract new economic activities [[11], Kim, 2003]. While they distinguish regions in an economic sense, they also distinguish them demographically. They define a deprived area as having a population density that is half that of a rural area near an urban center [[12], Dijkstra, 2008].
The concept of depressed includes the economic concept as mentioned above, as well as the relative and variable concepts. The relative concept compares the development gap between regions within a country, the variable concept implies that the level of development is subject to change because it is continuous, and the last economic concept refers to the economic gap between regions [[13], Lee, 2010]. The definition of depressed includes “dependence” on government organizations such as central and local governments, “inward orientation” due to the disappearance of self-reliance and human resource reproduction mechanisms, and “social capital” due to the breakdown of communities and the disappearance of social networks [[14], Park, 2009].
In South Korea, various laws define remote areas. First of all, the Island Development Promotion Act (1986) defines island areas as ‘all islands in the sea except the main island of Jeju Island’, and the Remote Area Development Promotion Act (1988) defines remote areas as ‘areas located at a considerable distance from urban areas, with inconvenient transportation and significantly lower income and living standards of residents’ [6]. The 2009 revised National Balanced Development Act defines growth-promoting areas as “areas that require special consideration by the state and local governments for the construction of community infrastructure such as roads, water supply, etc. that are necessary to promote economic and social growth in such areas due to poor living conditions and low development levels, taking into account income, population, and financial status [6].
Considering the above definitions and classifications of depressed regions, we can understand depressed regions as follows. Depressed regions are economically underdeveloped areas with low income and low living standards. In terms of living environment, depressed regions can be classified as areas with unfavorable transportation and accessibility and insufficient expansion of social infrastructure, and finally, in terms of administrative management, it can be said that it is an area that requires consideration from the state or local government rather than self-development. In other words, depressed regions can be defined as areas where residents need to live due to the continuous depopulation and aging of the population, economic stagnation, and uncomfortable living environment.
3.2. Methods and Metrics for Analyzing Depressed Regions
There are many studies that measure regional depression. There are many indicators used, but the most popular ones are population, economy, settlement environment, and finance.
Population is a key indicator that can explain regional shrinkage and development, and the OECD uses population to classify regions as deprived, using the proportion of people living in urban and rural areas [[15], Breszzi, 2011] to categorize regions as predominantly rural regions, significantly rural regions, and predominantly urbanized regions [[16], Dax, 1996]. In Europe, the average annual population change rate is used to define shrinking cities, which are categorized into growth, stable, and shrinking regions [[17], Wolff, 2013]. The average annual population change rate is also used as an indicator for selecting growth-promoting regions in Korea, and it was used in a study by Kim M-S and Lee J-H to analyze the decline of basic local governments in Gangwon Province [[18], Kim, 2019]. The average annual population change rate is also used as an indicator to identify trends in population change, and some studies have utilized the population change rate over a period of time. A study by Korea Research Institute for Local Administration, for example, used the overall population change rate to determine the degree of regional decline, while also using population density [[19], KRI, 2004]. In a study to determine the marginalization of villages limited to rural villages, the ratio of the total population of rural villages to the elderly population was used to determine that villages with 50 or fewer people and more than 50 percent of the elderly population are called marginal villages and require special management [[20], Cho, 2013]. Other studies have utilized various indicators such as in-migrants, birth rate, net migration rate, population ratio of elderly living alone, and basic needs recipients. Outside of Korea, Japan uses the population decline rate to identify distressed areas, France uses population density, the United Kingdom uses population size, and the United States uses population decline [[21], Kim, 2016].
Economic indicators are often used in conjunction with demographic indicators. Prior research on the meaning of deprivation itself emphasized economic factors, so it has been actively utilized in various studies. The study conducted to establish growth promotion zones in South Korea also utilized population and economic and financial sectors [[22], KRI, 2008]. Other studies have utilized various economic indicators as shown in the table. Among these, Nam S-H utilized the monetary value of land, the public land value [[23], Nam, 2016]. In Korea, the public land value is the value that can be traded in the market, and it is an indicator that reflects a combination of the results of existing development and expectations for development.
Finally, the most commonly utilized indicator is the settlement environment sector. However, this sector is not as actively utilized as the population and economy sectors. The most commonly used indicators include the number of building permits, park area, old housing rate, land slope, and road pavement rate, which are not easily obtained through statistical tables. It is believed that the settlement environment sector has been largely underutilized due to the difficulty in obtaining data. An unusual indicator in this category is regional accessibility, which is used to select growth zones. Regional accessibility is an indicator of accessibility that is calculated using the population and distance of a city from its neighboring metropolitan areas [[24], KRI, 2019].

Table 1.
Indicators of Depressed Regions from Prior Research.
| Researcher | Population | Economy | Settlement |
|---|---|---|---|
| Han S-J, Choi J-S [[25], Han Sj, 2001] | in-migration, birth rate, population density, percentage of population aged 65 and over | local tax burden, market distribution facilities, number of financial institutions, percentage of service industry companies, etc. | number of building permits, park area, number of parking lots, sports facilities, etc. |
| Lee J-S [[26], Lee, 2006] | population change rate, population density | income TaxResident Tax, Affordability Index | - |
| KRILA [[27], L sy, 2012] | average annual population growth rate, net migration rate, aging index, average years of education, etc. | income TaxResident Tax, Affordability Index | old housing rate, new housing rate, vacancy rate |
| Wolff&Wiechmann [17] | average annual population change | - | - |
| Nam S-H [23] | population growth rate, number of households | public land value | land slope, public streets, schools, healthcare facilities, road pavement, water and sewer |
| KRIHS [24] | average annual population change | income TaxResident Tax, Affordability Index | Regional accessibility |
| Japan, France, US [22] | depopulation rate, population density, depopulation status, etc. | unemployment rate, Financial Strength Index, GRDP per capita, Personal Income Equity | - |
Next, we examined how prior research has used metrics to distinguish regions. The OECD categorizes regions using the proportion of people living in urban and rural areas [15]. In addition, a population indicator of ±0.15% of the average annual population change rate is applied to the diagnostic criteria to categorize shrinking cities into growth, stable, and shrinking cities [17]. Lee J-S developed a composite index using population change rate and population density for the population sector, income tax resident tax for the economy, and municipal fiscal strength index for the financial sector [25]. The classification assigned weights to each sector, and the weights were derived by conducting an AHP survey among public officials. There are two main ways to categorize rural areas in Korea. The first is a center hierarchy analysis based on center theory. This method does not use population indicators but uses the density of commercial facilities to derive a hierarchy. The hierarchy is divided into 1-4 tiers, with tiers 1 and 2 being the regional centers and tiers 3 and 4 being sub-centers [[28,29,30], Lee~Kim, 2016~2014]. Han S-S, Cho Y-J, and Jeong H-W utilized the above method but changed the indicator to the density of rural livelihood service facilities to measure the degree of rural residents’ satisfaction with livelihood services by region [[31], Han ss, ---- ]. Next is the classification using population and households in rural villages. Sung J-I, Chae J-H applied 20 households as a criterion for classifying underdeveloped rural villages and named rural villages with less than 20 households as underdeveloped villages [[32], Sung ji, 2012]. In the aforementioned classification of rural marginalized villages, the ratio of the total population of the village to the elderly population was applied to classify marginalized villages [20]. Currently, the South Korean government categorizes regions in order to provide support for low-growth regions. The classification method utilizes the unit normality method, and the indicators used are in three categories: population, economy, and institutions [22]. The result is the region’s backwardness, which is designated by the government every five years.
Table 2.
Georegionalization methods for prior research.
| Researcher | Geo-referencing methods |
|---|---|
| OECD [16] | predominantly rural regions: areas where more than 50% of the local population has a population density of less than 150 people per square kilometer significantly rural regions: areas where 15 to 50 percent of the region’s population lives in areas with fewer than 150 people per square kilometer predominantly urbanized regions: less than 15% of the region’s population lives in areas with fewer than 150 people per square kilometer |
| Lee J-S [26] | using average annual population change rate, financial condition, and income level as indicators for selecting underserved areas implemented AHP to develop a composite index |
| KRILA [22] | standardize on different units for different metrics calculate a standardized value (z-score) using unit normality equal weighting of three parts: population, economy, and finance |
| KRILA [27] | weighting by sector apply a weighted linear combination |
| Wolff&Wiechmann [17] | growth: CAGR of 0.15% or more over 20 years stable: -0.15 to 0.15% CAGR over 20 years shrinking: Less than -0.15% CAGR over 20 years |
| KAPG [[33], KAPG, 2009] | composite Index (Z) = (population density + population change rate)/2×2 + income×2 + financial strength + accessibility to area |
4. Materials and Methods
4.1. Variable Settings
The data used in the study was organized into three categories identified in the literature review. Population, economy, and settlement environment were organized by the data available in Eup and Myeon, which is the scope of the study. The previous studies utilized finance, but data related to finance is not available at the town and village level in Korea, so the economic sector was finalized. The Population category represents the growth and decline of the region, the Economy category is the basic reason for settling in the region, and finally, the Settlement Environment category is the current state of the region you live in.
An AHP survey was conducted to finalize the indicators for the selected sectors and to derive weights for each sector and indicator. The AHP survey was conducted among experts, officials, and activists who are active in the field of rural development in Korea. The survey was conducted for three weeks from April to May 2021, and 33 copies were returned, with an average age of 41.3 years and average work experience of 9 years. Using the survey results, we conducted a pairwise matrix followed by a standard matrix. The content of the survey focused on identifying the key indicators for determining depressed regions and assessing the importance of each indicator.
Figure 2.
Setting Metrics Process.
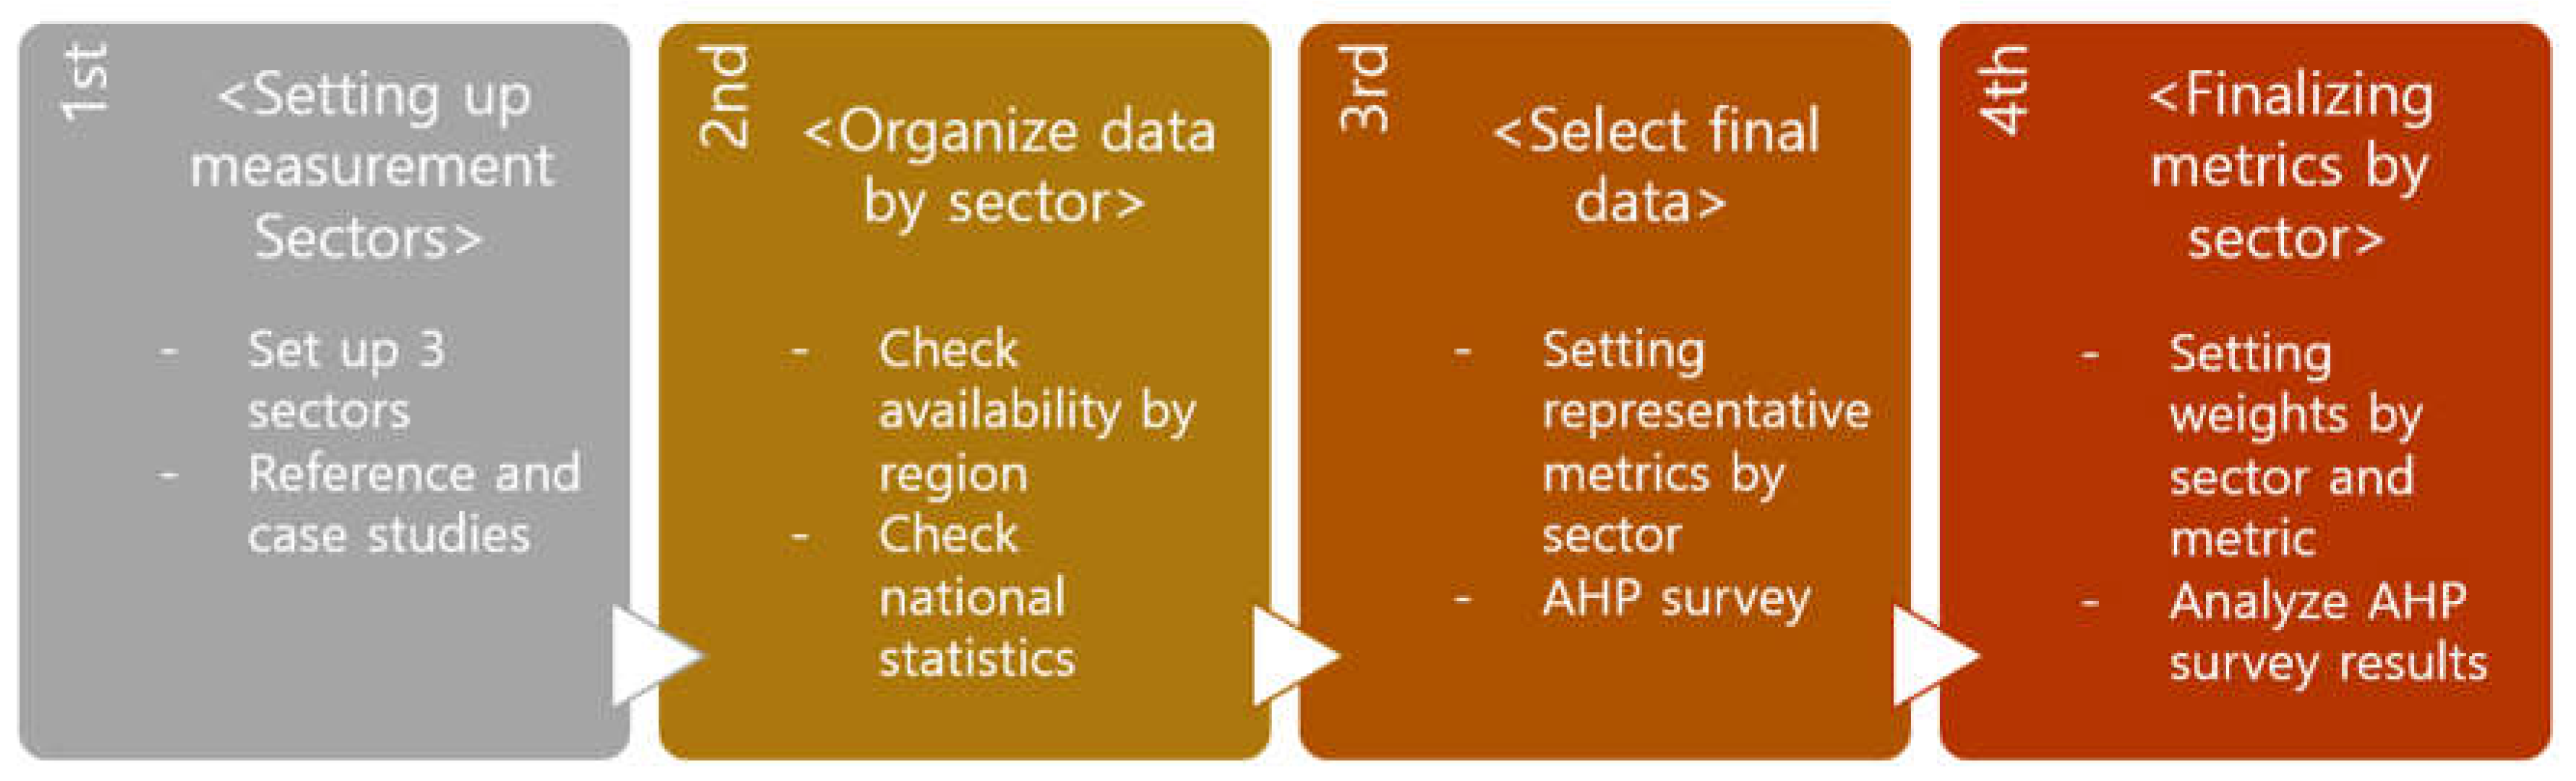
In the population category, the data available at the township level were total population, elderly population ratio, population density, and average annual population growth rate. The data was based on 2020, the latest year for which Korea conducted a population and housing census. Among the economic sector data available at the township level, the average land price and average income, the number of businesses and employees, and the density of commercial facilities were available. Finally, the data available in the settlement environment category were the average age of buildings, the density of living service facilities, and regional accessibility. Regional accessibility is an indicator used by the government to select growth-promoting areas, which is how the government derives the relationship between the area at the municipal level and the nearest large city, but in this study, it refers to the accessibility of Eup and Myeon to the center of their respective municipalities.
From the data presented above, the final indicators derived from the AHP survey were the percentage of elderly people in the population category, the average land price in the economic category, and the accessibility of the region in the settlement environment category. In the economic sector, the median income quintile was selected first, but it is an estimate rather than an exact figure, so the median land price was selected as the second choice for accurate research. The weights for each category were 0.3790 for population, 0.2453 for economy, and 0.3757 for settlement environment, indicating that population is the most appropriate indicator for identifying the degree of deprivation in a region. Settlement environment was similarly important to population, but economy was the least important. These results suggest that respondents to the AHP survey believe that the characteristics of the population and the quality of the settlement environment are the most important factors in determining the degree of deprivation of an area. The AHP survey analysis shows that the consistency ratios are all within the acceptable range of 0.1, indicating that the survey is not in error.
Table 3.
AHP survey analysis by deprivation index sector.
| Sector | 1st | 2nd | C.R. | Weights |
|---|---|---|---|---|
| Population | Percentage of elderly population | Average annual population growth rate | 0.0190 | 0.3790 |
| Economy | Median income quintile (estimated) | Average land price | 0.0000 | 0.2453 |
| Settlement Environment | Regional accessibility (municipal centers) | Regional accessibility (urban centers) | 0.0001 | 0.3757 |
| ||||
4.2. Analysis Methods and Procedures
The selected data were obtained at a set spatial scale of towns and villages. The percentage of the elderly population in the population sector was derived by utilizing data from the 2020 Population Census of Statistics Korea. The following average land prices were obtained from the Digital Twin Land website operated by the Ministry of Land, Infrastructure, and Transport of Korea. The data were analyzed using QGIS to derive average land prices based on the boundaries of towns and villages. Finally, the regional accessibility of the settlement environment was calculated using the formula for regional accessibility used in the growth promotion area. The regional accessibility was derived by using the total population of the village and the population of the municipal center, as well as the vehicle travel distance and time from the internet map service.
The obtained data were substituted into a formula to derive growth-promoting areas to derive backward areas for each town and village in Korea. To standardize the units of each data, the unit normality method was used. In addition, the index was calculated by negating the opposite indicators so that the higher the index, the higher the disadvantage. In other words, the higher the elderly population ratio, the higher the disadvantage, but the opposite is true for land price and accessibility, so the elderly population ratio is positive and land price and accessibility are negative.
Hierarchical cluster analysis is performed on the composite deprivation index derived by Eup and Myeon. After identifying the characteristics of the groups obtained through cluster analysis, we finally derived the deprived areas in Korea, and then identified and presented the geographical characteristics of the deprived areas such as location and population.
5. Analysis Results
5.1. Spatial Classifications and Features
Before identifying the depressed areas in Korea, we first looked at the indicators by Eup and Myeon. The percentage of elderly people living in the Eup and Myeon studied is 23.41%, which is significantly higher than the 16.4% elderly population in Korea. The average land price was 47,035 won and the regional accessibility was 179,398. The population residing in the areas ranged from a minimum of 102 to a maximum of 117,345, with an average of 6,321 residents.
To identify deprived areas by Eup and Myeon in Korea, the calculated deprivation index was subjected to hierarchical clustering analysis using SPSS program followed by K-means clustering analysis. In the case of K-means cluster analysis, the number of clusters is determined by the researcher, which makes it difficult to analyze objectively. Therefore, we derived nodule points through hierarchical cluster analysis and performed K-means cluster analysis using the number of nodule points.
In the hierarchical clustering analysis, a total of 5 nodal points were identified, and the number of clusters in the K-means clustering analysis was set to 5. The total of 1,322 clusters were divided into 373 clusters in cluster 1, 200 clusters in cluster 2, 5 clusters in cluster 3, 672 clusters in cluster 4, and 72 clusters in cluster 5. When averaging the Index for each cluster, we found that cluster 3 had the lowest index, while cluster 4 had the highest. The order of the index was as follows: 4, 1, 2, 5, and 3.
Each cluster is characterized by the following characteristics The four clusters with the highest overall deprivation index have a high proportion of elderly people (41.84%). However, the average land price is low at 15,290 won, and the accessibility of the area is also low at 5,737.9. Cluster 1 has a slightly lower percentage of elderly people (33.45%) than cluster 4, and both the average land price and regional accessibility are higher than cluster 4. However, compared to the other clusters, it is more similar to cluster 4, showing a backward population, economy, and settlement environment. The next two clusters have a senior citizen population ratio of 20.67%, which is similar to that of Korean towns and villages. The average land price was 93,943 won and the regional accessibility was 1,864,675. The next 5 clusters and 3 clusters all have a 12% elderly population ratio, and the average land price is much higher than 200,000 won. The regional accessibility of cluster 5 was lower than cluster 2, but cluster 3 was much higher than other regions. After examining the deprivation index and characteristics of each cluster, we determined that cluster 4 and cluster 1 are similar, cluster 2 is independent, and cluster 5 and cluster 3 are similar.
Considering the characteristics of the clusters, the names of the clusters were categorized as follows. Cluster 4 and Cluster 1 are the areas with the highest overall deprivation index and similar characteristics for each indicator, showing a high proportion of the elderly population, low land prices, and regional accessibility. Therefore, they are categorized as ‘depressed regions’. Cluster 2, which has the next independent characteristic, is categorized as ‘normal regions’, which is a region with moderate characteristics in all indicators. Finally, cluster 5 and cluster 3 were classified as ‘growth regions’ because they have a population ratio lower than the elderly population ratio in Korea and have high land prices and regional accessibility.
Table 4.
Findings of depressed regions in Korean Eup and Myeon.
| Cluster | Number of cases in each cluster | Deprivation index | Average of cluster | ||
|---|---|---|---|---|---|
| Percentage of elderly population | Average land price | Regional accessibility | |||
| 1 | 373 | -0.0288 | 33.45% | ₩39,121.8 | 56,340.7 |
| 2 | 200 | -0.6782 | 20.67% | ₩93,943.9 | 1,864,675.3 |
| 3 | 5 | -3.2974 | 12.65% | ₩527,151.7 | 20,054,144.1 |
| 4 | 672 | 0.4184 | 43.91% | ₩15,290.5 | 5,737.9 |
| 5 | 72 | -1.4593 | 12.38% | ₩220,971.9 | 1,144,929.5 |
Figure 3.
Geocategorization results and characteristics.
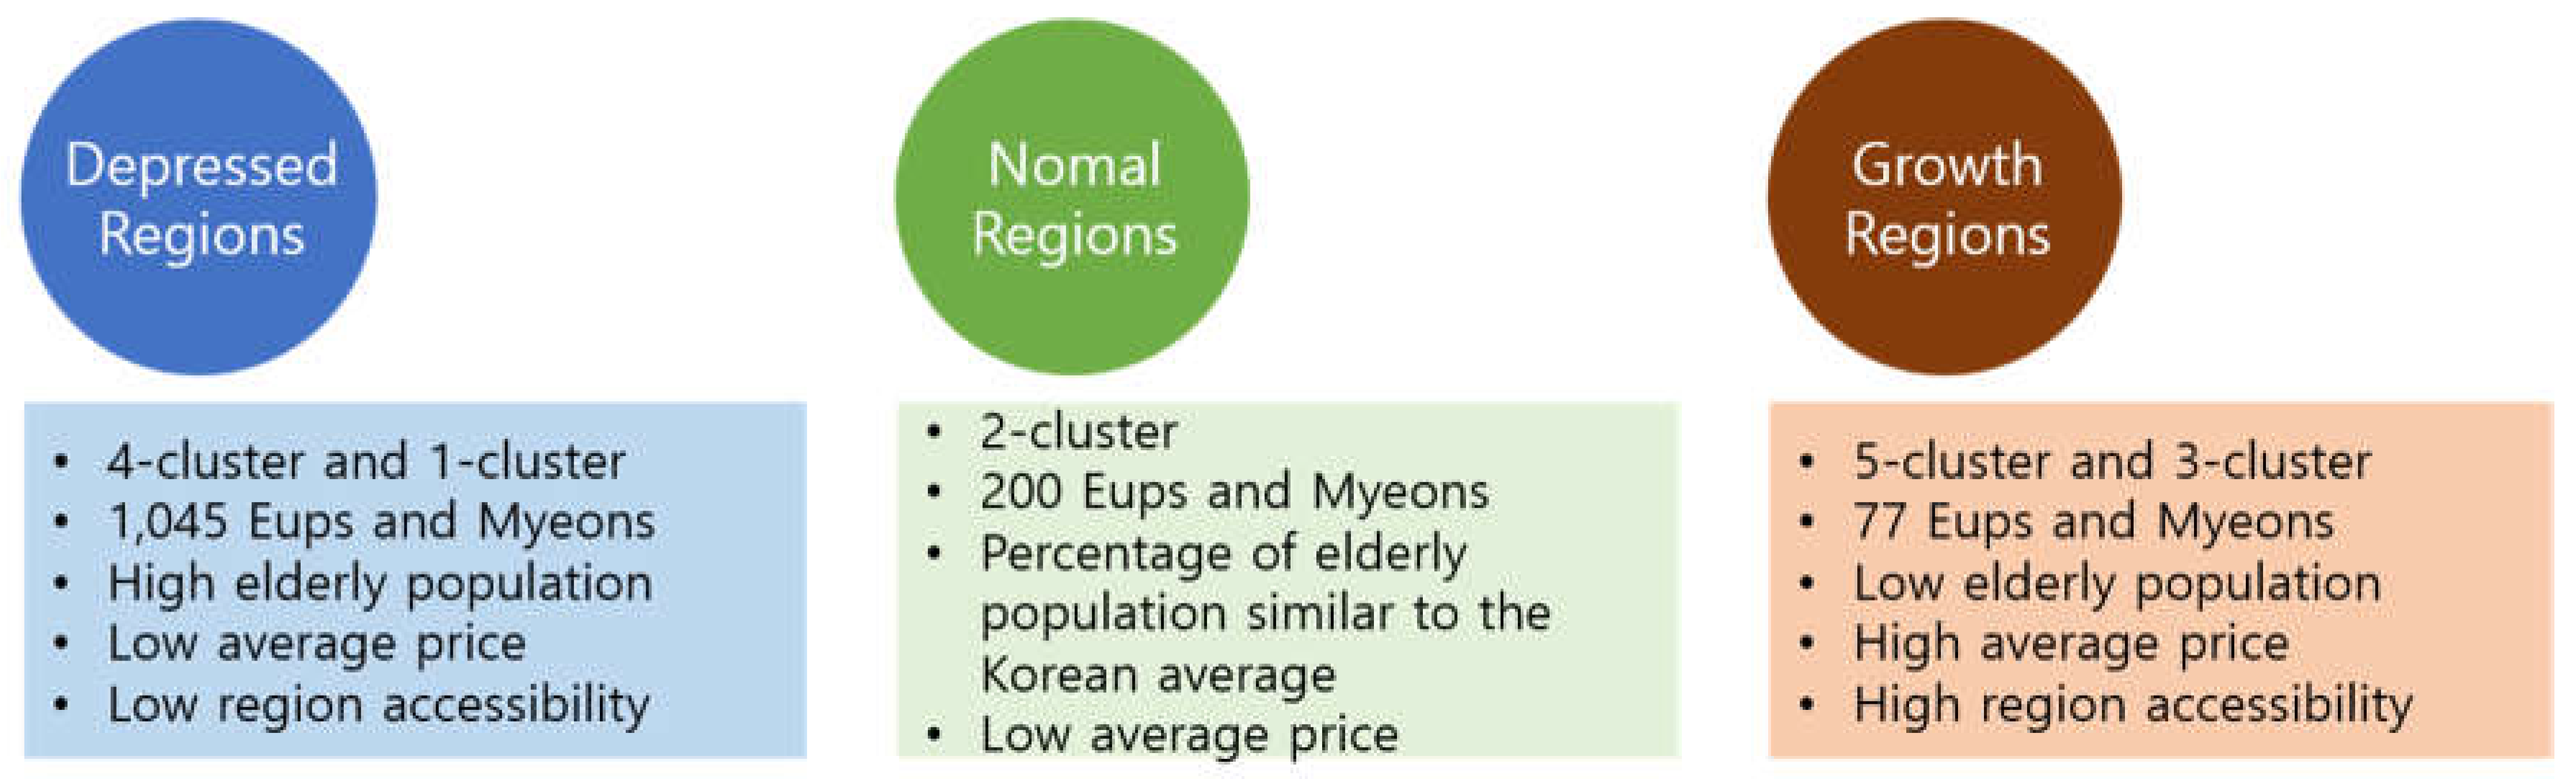
In conclusion, while the growth areas and general areas, which are non-depressed regions, account for 5.82% and 15.13% of the total regions analyzed, respectively, the depressed regions constitute 79.05%. This indicates that the majority of Eup and Myeon in Korea are classified as depressed regions. This result can be attributed to the phenomenon where various sectors, including the economy and culture, along with the population, are concentrated around specific regions.
5.2. Distribution Characteristics
To examine the growth outcomes of regions resulting from the concentration of goods and population in Korea, Eup and Myeon-level regions were classified into depressed regions, general regions, and growth regions. The analysis revealed that general regions and growth regions are primarily developed near the metropolitan area and major cities. On the other hand, depressed regions are distributed nationwide, excluding these areas.
Figure 4.
Result of Regional Classification in Korea.
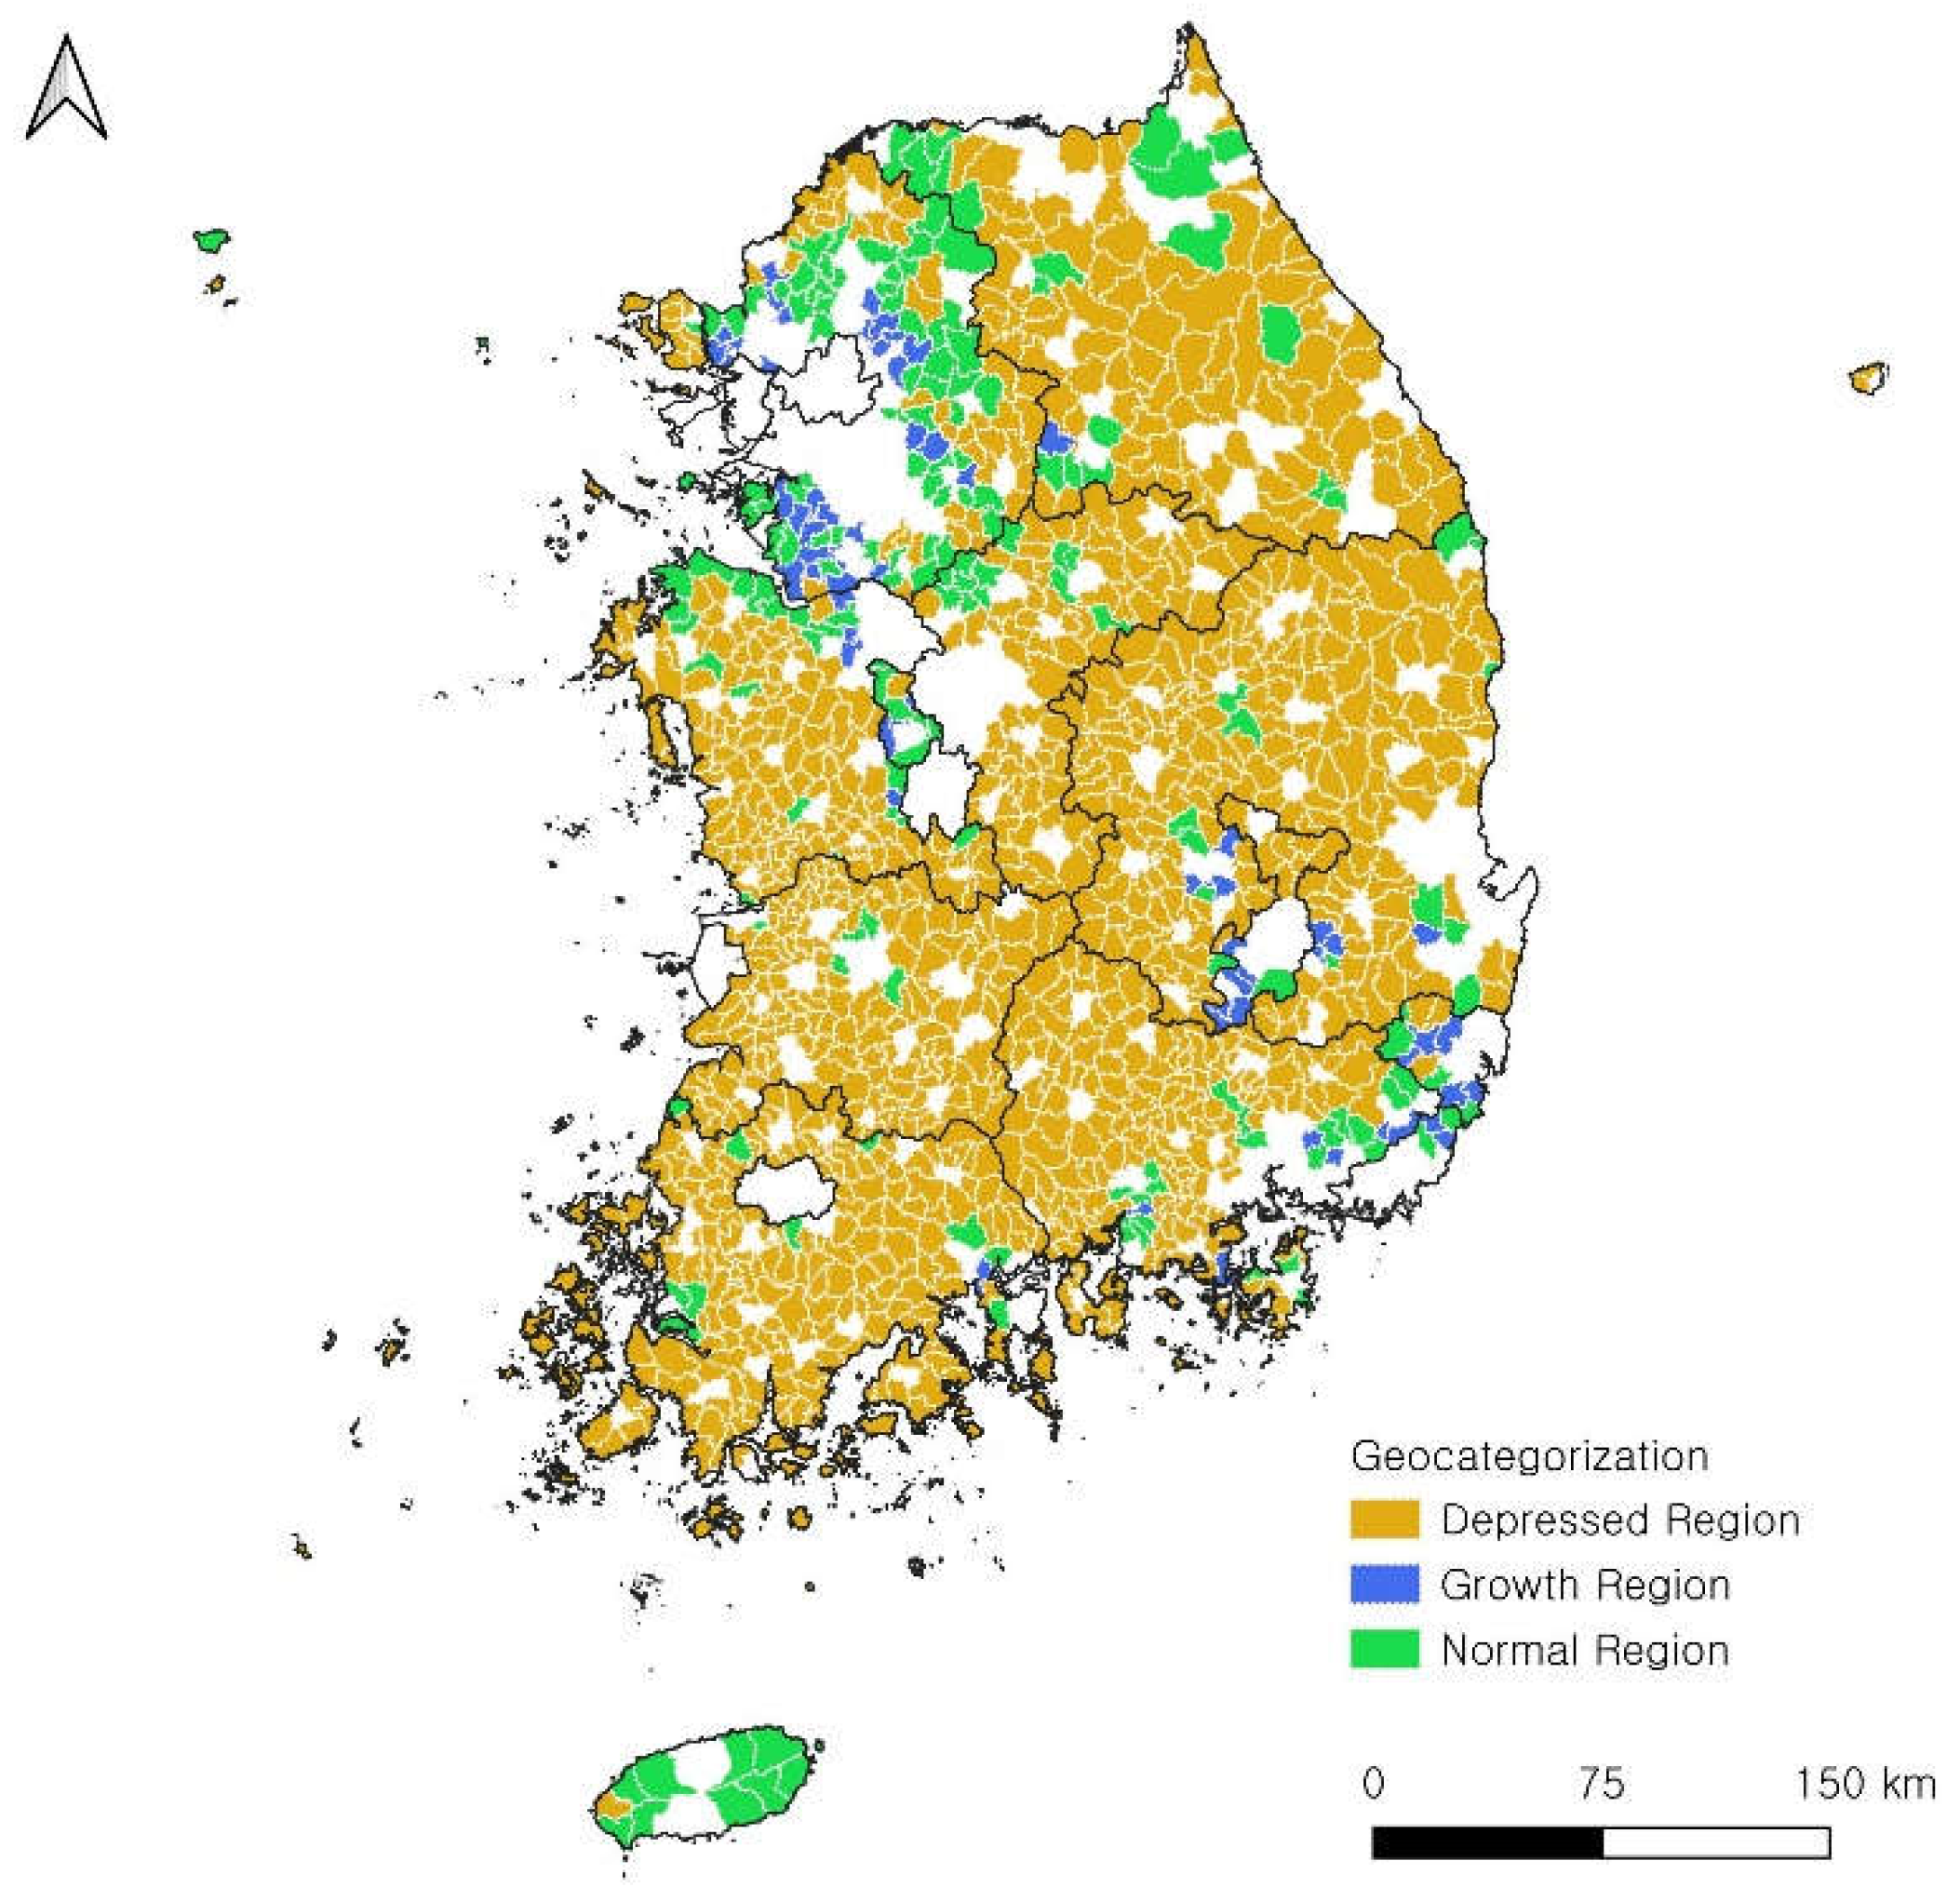
To examine the growth outcomes of regions resulting from the concentration of goods and population in Korea, Eup and Myeon-level regions were classified into depressed regions, general regions, and growth regions. The classification revealed the following spatial characteristics:
First, growth regions are developed in the metropolitan area and the southeastern part of the country. These regions are the most densely populated areas in Korea, representing the nation’s key urban areas. The economy in these regions is characterized by the dominance of secondary and tertiary industries, such as manufacturing and services, over agriculture. The high population concentration in these areas can be attributed to excellent accessibility for commuting and the presence of large-scale residential complexes. As a result, these regions have relatively high land prices and have developed into areas with a larger population of middle-aged and young people compared to elderly populations.
Second, general regions are found nationwide but are particularly developed in the Gyeonggi region and areas adjacent to it. These regions show less concentration of population and economic activities compared to growth regions, and are generally located near major cities or in areas where secondary and tertiary industries have moderately developed. Notable examples include the northern part of Chungcheongnam-do and Jeju Island. The northern region of Chungcheongnam-do is known for its developed manufacturing industry, while Jeju Island is a region where the tourism industry is particularly advanced.
Third, depressed regions are distributed across the country, with a concentration in the eastern part of Chungcheongbuk-do, Jeollabuk-do, Jeollanam-do, and the western regions of Gyeongsangbuk-do and Gyeongsangnam-do. These areas are primarily agricultural, with Jeollabuk-do and Jeollanam-do being home to the Honam Plain, one of Korea’s most fertile agricultural areas. The depressed regions in Chungcheongbuk-do, Gyeongsangbuk-do, and Gyeongsangnam-do are influenced by geographical characteristics, particularly the presence of the Taebaek Mountains and other mountainous areas, which result in lower land prices and reduced accessibility to central locations. Consequently, these regions have become areas with an aging population, characterized by a high proportion of elderly residents.
Figure 5.
Growth and Normal Regions.
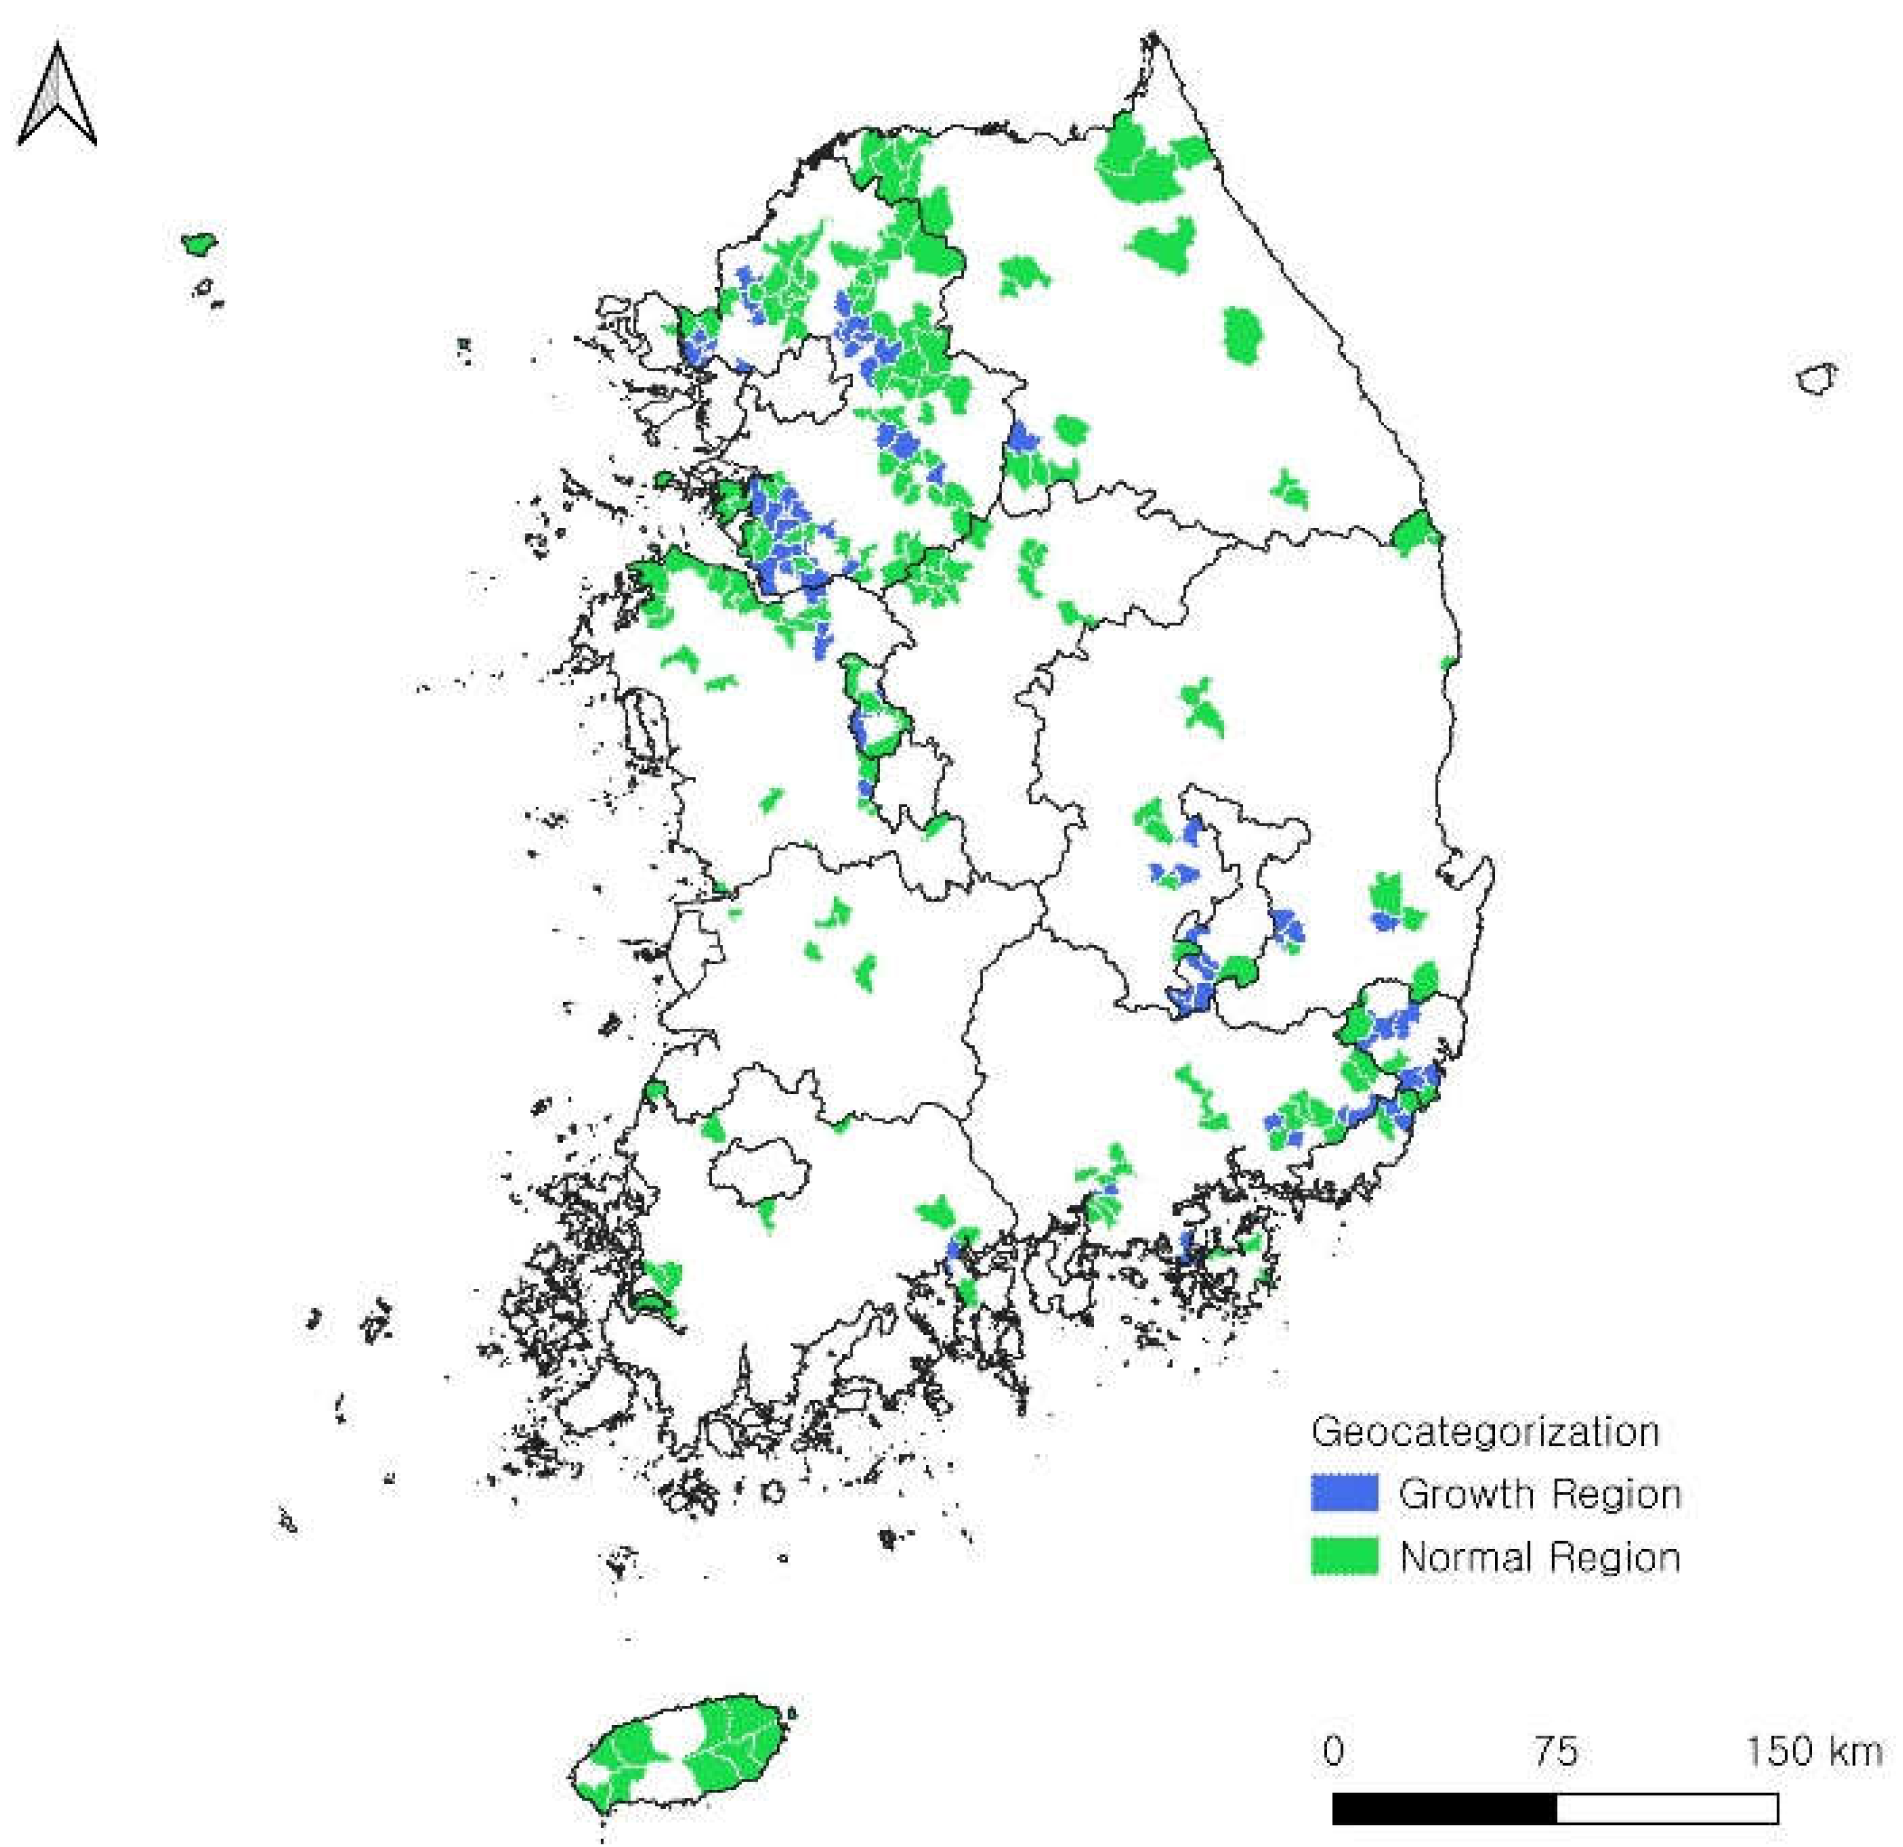
Figure 6.
Deressed Regions.
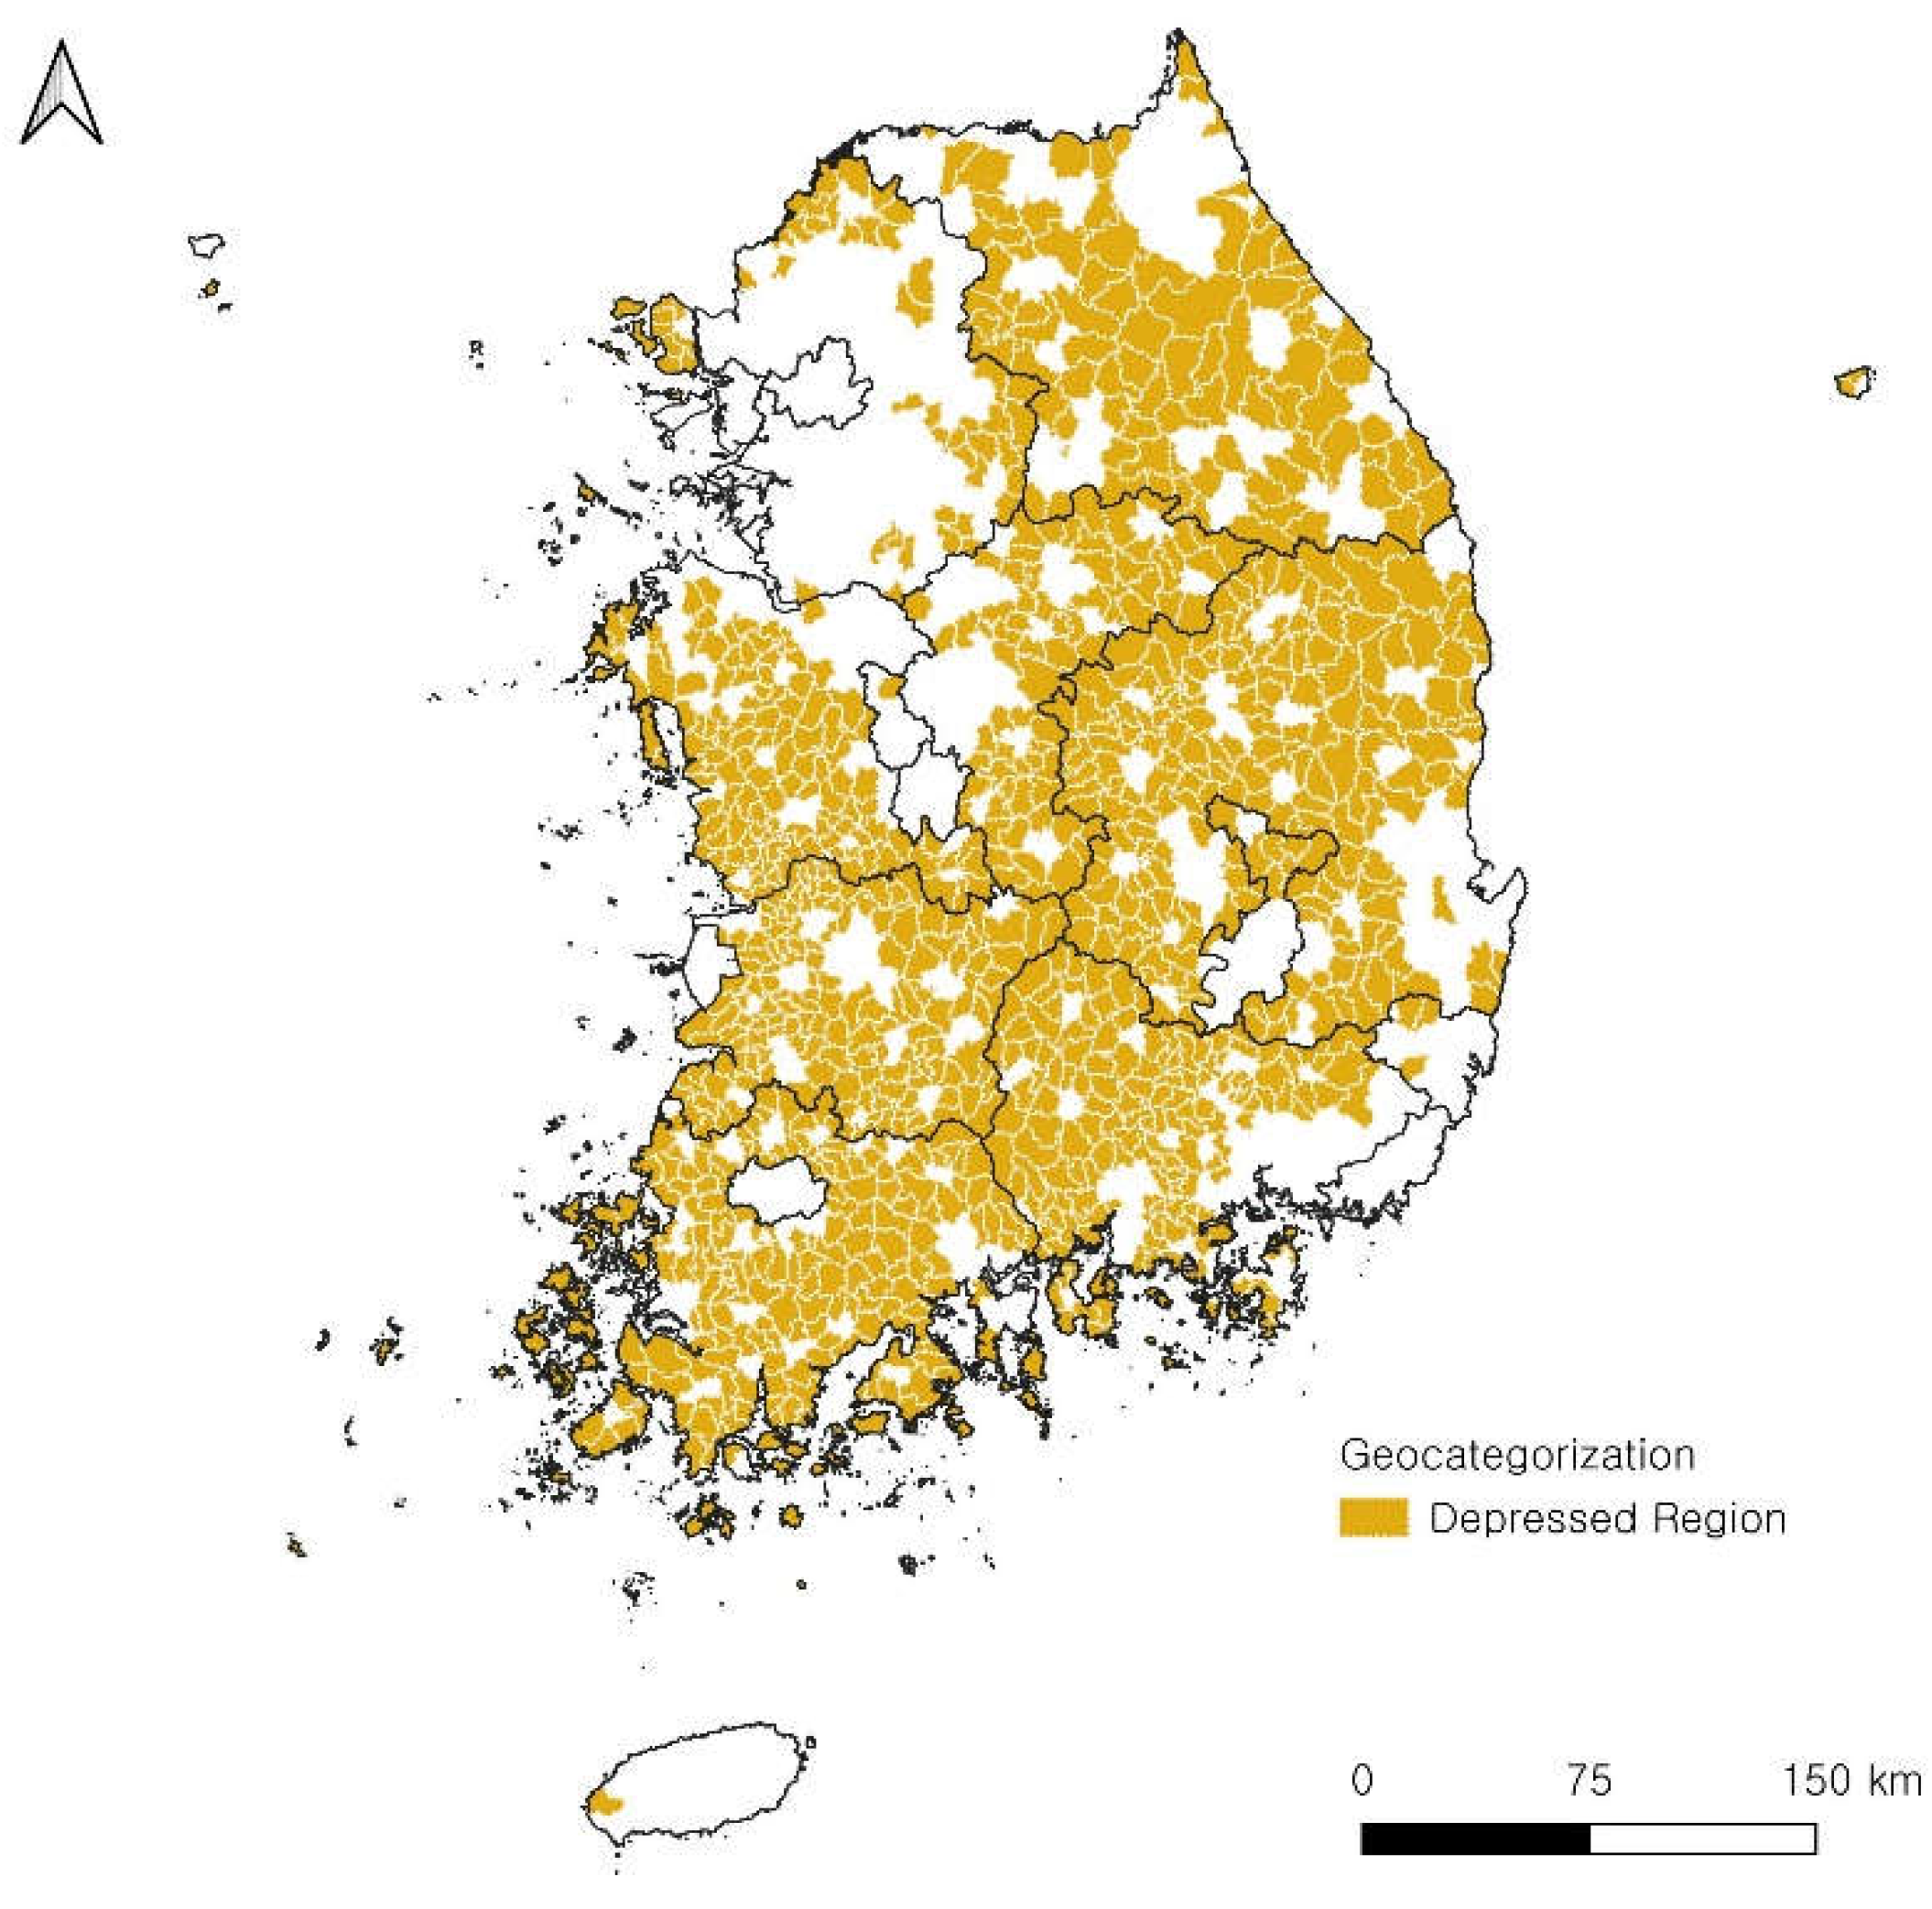
The most significant characteristic of Korea’s depressed regions is that they are predominantly rural regions. In other words, these depressed regions are not cities but rural areas where the primary industry is agriculture, rather than secondary or tertiary industries. In these regions, the aging population, decline in economic value across various sectors, and deterioration in residents’ living standards are evident. Currently, Korea faces not only the crisis of low birth rates and an aging population but also the diminishing vitality of rural areas due to population decline and aging. In this context, the urgent need for bold policies and focused attention on the depressed regions identified through this study is emphasized.
6. Conclusions
Korea has transitioned from being a country with a growing population to one facing population decline. This trend has recently led to the emergence of the issue of regional extinction, particularly in rural areas where the concept of extinction due to population decline is not new. Rural areas have experienced continuous population decrease, and agriculture remains a crucial economic activity in these regions. The study conducted to assess the level of depression in such areas has yielded the following results.
Firstly, a comprehensive depression index applicable to Eup and Myeon areas in Korea was developed. Various methods previously developed for regional classification were reviewed, and through an AHP (Analytic Hierarchy Process) survey conducted with experts, the final indicators and methods were determined. Using the developed depression index, the entire country was classified at the Eup and Myeon level. The classification results revealed that the Eup and Myeon regions in Korea could be categorized into growth regions, general regions, and depressed regions. After classification, the spatial distribution characteristics were identified and presented.
Growth regions exhibited an average land price of over 240,000 KRW and an elderly population ratio of 12.39%. These regions were primarily located in the metropolitan area, where a large population resides, and industries are well developed, particularly in the southeastern part of Korea. General regions had an average land price of 93,943 KRW and an elderly population ratio of 20.67%, and were distributed in industrially developed areas outside the metropolitan region. Finally, depressed regions had an average land price of only 23,731 KRW and an elderly population ratio of 40.21%. These regions were distributed nationwide, but particularly in areas where agriculture is developed or where mountainous terrains are prevalent.
In other words, the areas classified as depressed regions in Korea are those where population is not concentrated, and where secondary and tertiary industries have not developed. Additionally, these regions are often characterized by geographically challenging living conditions. If neglected without policy attention, these depressed regions will inevitably progress toward eventual extinction, which is predicted to lead to the extinction of Korea as well. Based on the findings of this study, the following policy responses are suggested.
First, there needs to be a shift in the perception of depressed regions. These areas should not be seen as rural regions that are inevitably lagging behind, but rather as spaces that should grow with distinctiveness alongside cities. The consciousness that these areas are bound to fall behind simply because they generate less wealth from economic activities must be replaced with the understanding that they must grow together, a mindset that should be embedded among the general public. Second, the government’s policy direction should shift from growth-oriented development to balanced development. Korea has been able to accumulate its current economic wealth based on rapid urban growth, and as a result, rural areas have transformed into depressed regions. In this situation, rather than promoting the development of Korea through the growth of select cities, a balanced development approach should be pursued to improve income, living standards, and population conditions in rural areas. Lastly, it is necessary to cultivate and systematize entities capable of achieving sustainable development. The sustainability of a region is ultimately created by people, and these human efforts must be realized within a system. It is essential to accurately analyze the current situation and foster individuals capable of building and operating systems that can transform this situation into a positive future.
Over the past half-century, Korea has achieved remarkable economic success, transforming from a developing country into an advanced nation. However, it is clear that alongside this success, there exists the shadow of depressed regions. While policies focused on economic growth centered around the metropolitan area and secondary and tertiary industries have propelled Korea into the ranks of advanced nations, they have also resulted in the majority of rural areas being classified as depressed regions. Therefore, the government must take more proactive measures to prevent further depression in rural areas, transforming these regions from those experiencing continuous population outflow into regions that attract residents and foster growth.
Author Contributions
Conceptualization, S-S. H.; Data Curation, S-S. H.; Formal analysis, S-S. H.; Investigation and Methodology, S-S. H. and J-H. C.; Project administration, S-S. H.; Resources, Software, and Supervision, J-H. C.; Validation and Visualization: S-S. H; Writing, S-S. H.
Funding
This research received no external funding.
Conflicts of Interest
The authors declare no conflict of interest.
References
- Jang, M.-H. An Exploratory Study on Regeneration Diagnostic Model in Rural Areas Responding to Local Extinction. Journal of The Korean Association of Regional Geographers 2022, 28, 11–23. [Google Scholar] [CrossRef]
- Korea Statistics. Agricultural Restructuring in Statistics. Korea Statistics 2020. [Google Scholar]
- Korea Research Institute for Local Administration, Adjustment Plan for Underdeveloped Area Development Project. 2005. Korea Research Institute for Local Administration.
- Lee S-H, Job Polarization and Rural Decline. Local Industry and Employment Policy. Korea Employment Information Service 2022, 8–21. [Google Scholar]
- Lee S-H, 7 Analyses of South Korea’s ‘Local Extinction’, Korea Employment Information Service 2016.
- Han, S.-S.; Jeong, H.-W. Methodology to Develop Indice of Deprivation for Rural Villages: Case Study on Rural Villages in Chungchenongnam-do. Journal of The Korean Association of Regional Geographers 2022, 28, 268–284. [Google Scholar] [CrossRef]
- Lee, W.-H.; Ahn, Y.-J. Regional Classification and Analysis for Promoting Area-specific Policy of Deprived Regions: A Case Study of the Growth Promotion Area Policy. Journal of The Korean Association of Regional Geographers 2011, 17, 96–108. [Google Scholar]
- Ju, S.-H.; Lee, S.-W.; Lee, M.-W. Characteristics of Rural Out-migration and Policy Implications. Korean Comparative Government Review 2019, 23, 235–256. [Google Scholar]
- TA Munandar, R Wardoyo, Fuzzy-Klassen Model for Development Disparities Analysis Based on Gross Regional Domestic Product Sector of a Region. International Journal of Computer Applications 2013, 123, 17–22.
- Kim Y-U, Cha M-S, Kang H-S. Regional Development Policy. Hanwul Inc.; Seoul, Korea. 2003.
- Dijkstra L, Poelman H, Remote Rural Region: How Proximity to a City Influence the Performance of Rural Regions. EU Directorate-General for Regional Policy 2008.
- Lee, J.-H.; Son, S.-L.; Lee, D.-S.; Kim, D.-J. Study on Strategic Development of Depressed Regions in Korea. Korea Research Institute for Human Settlements, 2010.
- Park, J.-S.; Seong, K.-R.; Jung, D.-I. A Theoretical Approach to the Structure of Local Backwardness and Its Transformation: Social Capital, Creative Capital, and Strategic Resource Mobilization. Korean Regional Sociology 2009, 10, 31–62. [Google Scholar]
- Korea Research Institute for Local Administration, Research on Criteria for Selecting and Utilizing Growth Zones. 2008. Korea Research Institute for Local Administration.
- Brezzi M, Dijkstra L, Ruiz V. OECD Extended Regional Typology: The Economic Performance of Remote Rural Regions., OECD, 2011/06.
- Dax, T. , Defining Rural Areas: International Comparisons and the OECD Indicators. Rural Society 1996, 6, 3–17. [Google Scholar] [CrossRef]
- Wolff, M.; Wiechmann, T. Urban Shrinkage in Spatial Perspective – Operationalization of Shrinking Cities in Europe 1990 ~ 2010. AESOP-ACSP Joint Congress, Dublin, 2013.
- Kim, M.-S.; Lee, J.-Y. Regional decline analysis of basic local governments in Gangwon-do. Gyeonggi Research Institute 2019, 21, 125–149. [Google Scholar]
- Korea Research Institute for Local Administration, Developing Metrics for Selecting Depressed Regions. 2004, Department of Administration.
- Cho, Y.-J.; Yoo, H.-Y.; Lee, G.-L.; Yoon, J.-M.; Park, G.-C.; Um, S.-J.; Kim, J.-H. Basic research for the introduction of ‘Marginal Village Policy’ in response to the depopulation and aging population. 2013. Chungnam Institute.
- Kim, H.-H.; Kim, S.-K. Analysis of the implementation status of new vitality projects and improvement measures. 2016. Korea Research Institute for Local Administration.
- Nam S-H. Index Selection and Type Classification for a Small and Underdeveloped Regions Development and Management in Okchengun. Master’s thesis, Chungbuk National University, 2016.
- Korea Research Institute for Human Settlements. Study to redesignate growth promotion zones and improve support systems for underdeveloped regions. Ministry of Land, Infrastructure and Transport of South Korea, 2019.
- Han, S.-J.; Choi, J.-S. A study on setting indicators for selecting underdeveloped areas in Korea. Korean Public Administration Review 2001, 35, 55–74. [Google Scholar]
- Lee, J.-S. Methodological Approaches of Making a Composite Indicator for Selecting Underdeveloped Regions by Utilizing a Regression Analysis. Journal of the Korean Regional Development Association, 2006, 18, 51–64. [Google Scholar]
- Lee, S.-Y.; Oh, E.-J.; Lee, H.-Y. A Study on the Regeneration Policy for Regions in Recession. 2012. Korea Research Institute for Local Administration.
- Lee, S.-J. Study on identifying the centrality of rural areas in Cheonan City and classifying centers. 2016. Chungnam Institute.
- Won, K.-H. How to Enhance the Functioning of Rural Centers in the Face of Declining Populations. 2014. Chungbuk Research Institute.
- Kim, J.-Y.; Lee, S.-J.; Jo, B.-W. Chungcheongnam-do Rural Center Revitalization Policy. 2014. Chungnam Institute.
- Han S-S, Cho Y-J, Jeong H-W.
- Sung, J.-I.; Chae, J.-H. Rural underserved villages and policy challenges. 2012. Korea Rural Economic Institute.
- The Korean Association of Professional Geographers. How to Improve Regional Planning to Spur Growth in Underserved Areas. 2009. Ministry of Land and Maritime Affairs of Korea.
- Ministry of the Interior and Safety. Local government administrative divisions and population in Korea. 2020. Ministry of the Interior and Safety.
Disclaimer/Publisher’s Note: The statements, opinions and data contained in all publications are solely those of the individual author(s) and contributor(s) and not of MDPI and/or the editor(s). MDPI and/or the editor(s) disclaim responsibility for any injury to people or property resulting from any ideas, methods, instructions or products referred to in the content. |
© 2024 by the authors. Licensee MDPI, Basel, Switzerland. This article is an open access article distributed under the terms and conditions of the Creative Commons Attribution (CC BY) license (http://creativecommons.org/licenses/by/4.0/).
Copyright: This open access article is published under a Creative Commons CC BY 4.0 license, which permit the free download, distribution, and reuse, provided that the author and preprint are cited in any reuse.


