Submitted:
26 August 2024
Posted:
27 August 2024
You are already at the latest version
Abstract
The new digital infrastructure has become an important basis for the green development of agriculture. This paper selects provincial sample data from 2006 to 2022, constructs an indicator system to measure new digital infrastructure and agricultural green total factor productivity, and explores how new digital infrastructure can promote agricultural green development. The results show that: (1) the new digital infrastructure has a significant role in promoting the green development of agriculture, and this conclusion is still valid after processing endogeneity and heteroscedasticity; (2) Technology and land factors play an intermediary role in the promotion of green agricultural development by the new digital infrastructure, that is, the new digital infrastructure helps to improve the quality and technical level of cultivated land and thus promote green agricultural development; (3) Labor force factors optimize the mediating role of technology factors, that is, the higher the quality of labor force, the stronger the role of the new digital infrastructure in promoting the green development of agriculture through the technological path; (4) The effect of new digital infrastructure on the green development of agriculture is obviously heterogeneous, and the effect is more obvious in northwest China and the regions with lower marketization level, higher environmental regulation level. This study is helpful to clarify the relationship between new digital infrastructure and agricultural green development in China, and provide corresponding policy suggestions for promoting regional agricultural green development.
Keywords:
new digital infrastructure
; Agricultural green development
; Policy environment
; market environment
1. Introduction
The 19th National Congress Report of the Communist Party of China proposed to adhere to the harmonious coexistence of humans and nature, to form a green development approach and lifestyle, and to firmly follow the path of civilized development that combines production development, affluent life, and a good ecology. The report of the 20th National Congress emphasized that “It is imperative to firmly establish and practice the concept that “Green mountains and clear waters are as good as mountains of gold and silver” and to plan for development from the perspective of harmonious coexistence between humans and nature.” Agriculture is a crucial field in the construction of ecological civilization in China. Achieving green agricultural development is of paramount importance, as it not only mitigates ecological pressures and alleviates resource scarcity, but also satisfies the growing demand for a better quality of life among the populace [1]. Furthermore, it contributes to the realization of the “dual carbon” goals, laying a crucial foundation for the sustainable advancement of agriculture [2]. In recent years, all provinces have actively responded to the national agricultural green development plan, injecting new momentum into the promotion of green agricultural development [3]. Despite some achievements, China’s agriculture still faces a development model characterized by high consumption, high emissions, and low output, as well as ecological and environmental issues. In the context of the rural revitalization strategy, China’s agricultural development is subject to dual constraints of resources and the environment, while the quality, safety, and international competitiveness of agricultural products are also facing formidable challenges [4]. New digital infrastructure, as the cornerstone of digital society, is a pioneer in the construction of digital rural areas and an important guarantee for achieving rural revitalization, playing a crucial role in the high-quality development of agriculture [5]. The Central Economic Work Conference in 2018 and the Central Political Bureau meeting in 2019 both emphasized the need to accelerate the construction of new digital infrastructure formed by the organic integration of the fifth-generation fixed network (F5G) and 5G, artificial intelligence, industrial internet, and the Internet of Things, among other new generation information technologies [6]. With the advancement of science and technology, China has gradually entered the era of the digital economy. As an important role in promoting rural economic development, can new digital infrastructure become a new direction for green agricultural development? If so, how does it affect green agricultural development? AgaASt the current backdrop where China has entered the stage of high-quality agricultural development and is vigorously promoting green agricultural development, answering the above questions has certain practical significance.
Most research on agricultural green development is conducted from the perspective of agricultural green total factor productivity. Factors such as disaster rate, agricultural machinery density, financial support, economic development level, and agricultural structure all have a certain impact on the green development of agriculture [7,8,9,10,11]. There is also a small body of literature that focuses on the impact of new digital infrastructure on agricultural development. For example, Shengyue et al [12]. has found that the impact of digitalization level on the green development of agriculture exhibits spatial spillover effects, where the digitalization of adjacent provinces initially promotes and subsequently inhibits the green development of agriculture in the local region.
In summary, existing research has conducted in-depth studies on agricultural green development both theoretically and practically, but there are still certain limitations. Firstly, although the application of new digital infrastructure in agricultural development is becoming more widespread, there is a lack of literature focusing on this field. Secondly, the role of new digital infrastructure needs to be played in conjunction with other production factors, but the specific mechanism of action lacks a clear revelation. Thirdly, there is little research attention to the differences in the impact of new digital infrastructure on agricultural green development under different geographical locations, market environments, and AStitutional environments. The contributions of this paper may be reflected in: firstly, in terms of research perspective, examining how agricultural green development can be achieved from the perspective of new digital infrastructure; secondly, in terms of the mechanism of action, revealing how new digital infrastructure affects agricultural green development from the perspective of new production factors such as technology, land, labor, data, and capital; thirdly, examining the differences in the impact of new digital infrastructure on agricultural green development under different geographical locations, market environments, and AStitutional environments.
2. Materials and Methods
1.1. Theoretical Analysis and Research Hypotheses
1.1.1. The Impact of New Digital Infrastructure on Green Agricultural Development
The core essence of green development in agriculture is to coordinate and coordinate the economic, social, environmental, and ecological benefits of agricultural development, that is, to achieve resource conservation, environmental friendliness, ecological conservation, and quality efficiency [1]. It emphasizes the importance of achieving greenization in the environment of agricultural production areas, production processes, and agricultural products. The improvement of digital infrastructure can promote the transformation and upgrading of traditional agriculture to modern agriculture, achieve precision and low-carbon agricultural development, and inject new impetus into green agricultural development. Through the informatization and intelligent means of new digital infrastructure, combined with tools such as sensors, remote sensing technology, and big data analysis, key elements such as soil moisture, nutrient status, pests and diseases, as well as the recycling and utilization of agricultural waste, can be monitored and precisely controlled in real time [13]. This technological approach not only helps to avoid excessive use of water resources, fertilizers, and drugs, but also enables the rational treatment of agricultural waste, achieving the goals of “one control, two reductions, and three basics”, and achieving a smooth transition from high energy consumption, high material consumption, high emissions, and high pollution low-carbon agriculture to low energy consumption, low material consumption, low emissions, and low pollution low-carbon agriculture [14]. In addition, new digital infrastructure can also provide decision support for agricultural production, optimize agricultural production processes, and improve the quality and yield of agricultural products [15].
1.1.2. New Digital Infrastructure and Green Agricultural Development: The Mediating Role of Land and Technological Factors
The new digital infrastructure helps to improve land quality and has an indirect impact on green agricultural development. New digital infrastructure can help avoid the risks of predatory land management and natural destruction [16], help agriculture achieve increased production and income by increasing resources such as fertilizers, pesticides, and water, and shift towards reducing the use of these resources [17]. With the application of sensors, remote sensing technology, and big data analysis tools, agricultural production can monitor and precisely regulate soil conditions in real time, avoid the mismatch of water resources, fertilizers, and drugs [13], thereby improving farmland quality and promoting sustainable agricultural development [18]. The innovative effects brought about by the new type of digital infrastructure have been supported by research [19]. The increase in environmental technology efficiency in agriculture can significantly improve green total factor productivity [20], and technological innovation can enhance the intrinsic capacity for green agricultural development [21].
1.1.3. New Digital Infrastructure and Green Agricultural Development: The Regulatory Role of Labor Factors
On the one hand, the quality of labor plays an important role in the green development of agriculture. Zhu Qingying et al. [22] and Wu Jing et al. [23] found that improving the cultural quality of farmers is the key to protecting farmland, and the protection of farmland is an inevitable choice to maintain national food security and achieve sustainable agricultural development; Guo Junhua et al. [24] pointed out based on the three-stage DEA model that an increase in average years of education is a favorable factor for improving agricultural production efficiency. Ma Guoqun and Tan Yanwen [25] pointed out from the perspective of environmental regulation that the cultural level of labor has a positive effect on the green total factor productivity of agriculture; Li Zhaoliang et al. [26] found that compared to the western region, the green total factor productivity of agriculture in the central and eastern regions is more easily affected by the quality of labor. On the other hand, the improvement of labor quality can strengthen the application of technology. Zhou Li et al. [27] confirmed the impact of rural labor quality on agricultural technology efficiency in China, using soil testing and formula fertilization technology as an example; Yang Lijun [28] combined the experience of modern agricultural development in Israel and pointed out the need to improve the quality of agricultural labor force, promote the application of agricultural technology, and achieve agricultural reform and development; Wu Xuelian et al. [29] pointed out based on the Probit ISM model that labor quality is a deep-seated root factor affecting the depth of farmers’ understanding of green agricultural technology. Li Houjian [30] and Liu Hongmei et al. [31] pointed out through micro research that improving the cultural quality of rural labor will help to enhance their application and adoption of technology in agricultural production; Zhai Jinliang [32] emphasized from a macro perspective that improving the quality of workers is the key to the transformation of agricultural scientific and technological achievements in China. In addition, Ke Bingsheng and Chen Huaning [33] emphasized that the production, operation, and management of modern agriculture require knowledge and skills in various fields such as agriculture, machinery, management, and information science. Chen Chao, Zhou Ning [34] , and Yang Wenzhi [35] pointed out that the education level of farmers directly determines their application of digital facilities such as computers and networks, as well as the operation and use of modern production tools.
In summary, this article proposes the following research hypotheses:
H1: New digital infrastructure has a positive promoting effect on green agricultural development.
H2: New digital infrastructure promotes green agricultural development through the path of land elements.
H3: New digital infrastructure promotes green agricultural development through the path of technological elements.
H4: The quality of labor can enhance the positive impact of new digital infrastructure on land quality.
H5: Labor quality can enhance the positive impact of technological level on agricultural green total factor productivity.
The research model in this article is shown in Figure 1.
1.2. Variable Description
1.2.1. Explained variable: Agricultural Green Total Factor Productivity (GTFP)
Based on the research of Ma Guoqun and Tan Yanwen [25] and Ge Pengfei et al. [36], this paper integrates “expected output” and “unexpected output” into an indicator system at the same time, uses the SBM super efficiency model and GML index to calculate the agricultural green total factor productivity of 30 provincial units (excluding Xizang) in Chinese Mainland from 2006 to 2022, and decomposes it into two indexes, namely, agricultural green technology efficiency (GEC) and agricultural green technology progress (GTC). Considering that the calculated GTFP is a month on month index, which represents the change in agricultural green total factor productivity in this year compared to the previous year, this article transforms agricultural green total factor productivity into a fixed base index to reflect the cumulative trend of agricultural green total factor productivity. Let the 2006 GTFP be equal to 1, and the actual value of the 2007 GTFP be the product of the current year’s GTFP and the 2006 GTFP, and so on. Perform the same treatment for GEC and GTC. The specific input and output indicators are shown in Table 1.
1.2.2. Core Explanatory Variable: Digital Infrastructure Development Level (DI)
This article starts from the perspective of the five major production factors, combined with the research of Zhao Xing [19], Fan Hejun, and Wu Ting [37], and adopts principal component analysis to measure the development level of new digital infrastructure from the perspectives of capital and data. At the capital level, it refers to the equipment support for the new digital infrastructure, while at the data level, it refers to the ability to generate or obtain data through the new digital infrastructure. Please refer to Table 2 for details.
1.2.3. Mediating and Moderating Variables
From the perspective of the five major production factors, the mediating variables in this article are land and technology factors, and the moderating variables are labor factors, represented by land quality (LQ), technology level (TL), and labor quality (WQ) in order: 1) land quality is measured by the ratio of total agricultural output value to crop sowing area; 2) The technical level is measured by the total number of patents published in each province and year; 3) The quality of labor force is measured by the average years of education, and the calculation method is: (primary school x 6+middle school x 9+high school x 12+college and above x 15)/population aged 6 and above.
1.2.4. Control Variables
1) Disaster Recovery Rate (DR), expressed as the ratio of disaster area to crop sowing area; 2) Agricultural machinery density (MD), expressed in per mu mechanical power; 3) Financial support (FS), expressed as local government expenditure on agriculture, forestry, and water affairs; 4) Rural Economic Development Level (ED), expressed as per capita disposable income in rural areas; 5) Agricultural Structure (AS), expressed as the proportion of grain crop sowing area to total crop sowing area.
1.3. Data Sources and Descriptive Statistics
This paper selects the panel data of 30 provinces in China (excluding Hong Kong, Macao, Taiwan and Xizang) from 2006 to 2022 for empirical analysis. The data mainly comes from China Statistical Yearbook, National Patent Database, China Education Statistical Yearbook, China Population and Employment Statistical Yearbook, provincial statistical yearbooks and national land survey. The descriptive statistical results of each variable are shown in Table 3. For the sake of data stability, logarithmic processing is performed on technical level, labor quality, and per capita disposable income in rural areas.
1.4. Model Settings
1.4.1. Benchmark Regression Model
To explore the impact of new digital infrastructure on agricultural green total factor productivity, this paper constructs a benchmark effect model between new digital infrastructure and agricultural green total factor productivity. The specific model is as follows:
1.4.2. Mediation and Moderation Models
To further verify the intrinsic mechanism of the promotion of green agricultural development by new digital infrastructure, and to reveal the linkage between capital, data, land, and labor factors, a three-layer mediation effect regression model and a moderation effect model are constructed:
1.4.3. moderated mediation effect model
To further verify the intrinsic mechanism of the promotion of green agricultural development by new digital infrastructure and reveal the linkage between capital, data, technology, and labor factors, this article draws on the testing method of moderated mediation effect proposed by Wen Zhonglin [38] to construct a moderated mediation effect model.
Among the above types, represents agricultural green development, namely the agricultural green total factor productivity index, agricultural green technology efficiency change index, and agricultural green technology progress change index, represents the development level of new digital infrastructure, represents various control variables, represents random disturbance term, represents land quality, represents labor quality, represents technical level, represents the interaction term between labor quality and new digital infrastructure, represents the interaction term between labor quality and technical level - represents the parameter to be estimated.
3. Results
2.1. New Digital Infrastructure and Agricultural Green Total Factor Productivity
To verify the relevant hypotheses, this article first conducts benchmark regression analysis. The Hausman test results showed that using a fixed effects model was more reasonable, so a fixed effects model for panel data was used for regression analysis. The results are shown in Table 4. Columns (1) to (3) show the regression results before adding control variables, and the results show that the new digital infrastructure has a significant positive impact on agricultural green total factor productivity and agricultural green technology progress. Due to the negative goodness of fit of the model in the regression of the efficiency of new digital infrastructure on agricultural green technology, it will not be considered. Columns (4) to (6) show the regression results after adding control variables. It can be seen that after adding control variables, the positive impact of new digital infrastructure on agricultural green total factor productivity and agricultural green technology progress is still significant, while the impact on agricultural green technology efficiency is not significant.
Second item;The premise for obtaining accurate estimates directly through fixed effects model regression is that the model does not have endogeneity, that is, the core explanatory variable of new digital infrastructure must be an exogenous variable. However, due to the impact of the construction and application of new digital infrastructure in the local area, it may also be affected by the green development of agriculture. For example, the green development of agriculture usually requires a large amount of information and data to support the precision of agricultural development, thereby increasing the demand for new digital infrastructure, which may lead to causal problems. In addition, although this article tries to consider the control variables that affect the explained variable as much as possible, there is still a possibility of missing variables, leading to biased regression results. Therefore, this article adopts the instrumental variable method to explain endogeneity issues. Table 5 reports the results of instrumental regression. Columns (1) to (3), (4) to (6), and (7) to (9) are two-stage least squares analyses conducted using lagged one and lagged two independent variables as instrumental variables, respectively. The results show that the impact of new digital infrastructure on agricultural green total factor productivity and agricultural green technology progress has passed the significance test, indicating that there is no endogeneity issue with the explanatory variables in this article.
To avoid potential bias in sample selection and indicator selection in the study, this paper tests the robustness of the model through tail reduction and variable replacement. Firstly, considering the significant endowment differences in macro data of the new digital infrastructure, which may lead to singular values in total factor productivity, the sample’s total factor productivity was subjected to 1% and 5% tail reduction, and then substituted into equation regression to test the robustness of the above results. Secondly, the CRITIC method is used to recalculate the value of the explanatory variable as a replacement for robustness testing. The robustness test results are shown in columns (1) to (9) of Table 6. The significance and coefficient direction of the new digital infrastructure have not changed significantly, and the model results are robust and reliable. Thus, assuming H1 holds.
2.2. The Mediating Effect of Land Factors and the Moderating Effect of Labor Factors
Land is an irreplaceable basic means of production for agricultural production. To further verify the intrinsic mechanism of the promotion of green agricultural development by new digital infrastructure, and to reveal the linkage between capital, data, and land factors, land quality was selected as a mediator variable for intrinsic mechanism testing. The previous text has verified the promoting effect of new digital infrastructure on agricultural green development, which serves as an external condition to promote agricultural green development. On this basis, this article believes that land factors are an important internal factor in promoting agricultural green development, and jointly promote agricultural green development under the dual effects of external conditions of new digital infrastructure and internal factors of land.
According to column (5) of Table 4, it can be seen that the impact of new digital infrastructure on the efficiency of agricultural green technology has not passed the significance test, so the analysis of the mediating effect of agricultural green technology efficiency is suspended. The columns (1) to (3) in Table 7 show the results of the mediation effect test. Column (1) shows that the new digital infrastructure has a significant positive impact on the quality of cultivated land. Columns (2) to (3) show that the regression coefficients between new digital infrastructure and farmland quality are significantly positive for agricultural green total factor productivity and agricultural green technological progress. Based on the benchmark regression of columns (4) and (6) in Table 4, it can be concluded that the quality of cultivated land plays a partial mediating role in the promotion of agricultural green total factor productivity and agricultural green technology progress by new digital infrastructure. Assuming H2 has been validated.
Column (4) in Table 7 shows the results of the moderation effect test. To ensure the reliability of the regulatory effect test results, DI and WQ were centralized, and the interaction terms between the two were obtained by multiplying them after centralized processing. The results show that the regression coefficients of the new digital infrastructure and interaction terms are significantly positive, indicating that labor quality can strengthen the positive impact of the new digital infrastructure on land quality. Assuming H4 holds.
2.3. Mediating Effect with Regulation - The Mediating Effect of Labor Factors Regulating Technological Factors
Science and technology are the primary productive forces, and workers are the most active factor in productive forces. To further verify the intrinsic mechanism of the promotion effect of new digital infrastructure on agricultural green development and reveal the linkage between capital, data, technology, and labor factors, this article draws on the moderated mediation effect test method proposed by Wen Zhonglin [40], selects technology level as the mediating variable, and labor quality as the moderating variable of technology level affecting agricultural green development, and conducts an intrinsic mechanism test. Table 8 shows the results of the moderated mediation effect test. In order to verify the reliability of the results, DI, TL, and WQ were all centralized, and the interaction term Inter2 was also obtained by multiplying the centralized TL and WQ. From columns (1) to (3), it can be seen that the new digital infrastructure has a significant positive impact on agricultural green total factor productivity and agricultural green technology progress. The impact of agricultural green technology efficiency has not passed the significance test, therefore it cannot be further tested. From columns (4) to (6), it can be seen that new digital infrastructure has a significant positive impact on technological level, and the impact of new digital infrastructure and technological level on agricultural green total factor productivity and agricultural green technological progress is significantly positive. At this point, the mediating effect of technological level has been verified. Assuming H3 holds.
Columns (7) to (8) are the results of adding the interaction term between technical level and labor quality to the regression. The results show that the coefficient between new digital infrastructure and technological level is still positive, and when testing the impact on agricultural green total factor productivity, the interaction coefficient is significantly positive. In the path of the impact of technological level on agricultural green total factor productivity, there exists a moderating effect on labor quality. Assuming H5 holds.
2.4. Further Heterogeneity Analysis
2.4.1. Geographical differences
Considering the agricultural characteristics of various regions in China and drawing on the research of Liang Jun [39], this article divides 30 provinces into three agricultural regions: the northern region (12 provinces and cities in Beijing, Tianjin, Hebei, Shanxi, Liaoning, Jilin, Heilongjiang, Jiangsu, Anhui, Shandong, Henan, and Shaanxi). The farmland in this region is mainly dry land, and agriculture is mainly based on planting, which is the main production area of dry grains such as wheat, corn, sorghum, millet, and potatoes; (2) In the southern region (13 provinces and cities in Shanghai, Zhejiang, Fujian, Jiangxi, Hubei, Hunan, Guangdong, Guangxi, Hainan, Chongqing, Sichuan, Guizhou, and Yunnan), the farmland in this area is mainly paddy fields, and agriculture is mainly based on planting, making it the main production area of rice. At the same time, dry grains such as corn and potatoes are also grown, and the southeast coast is also the main production area of China’s fishing industry; (3) Northwest China (Inner Mongolia, Xizang, Gansu, Qinghai, Ningxia and Xinjiang), where the land is mainly desert, gobi and grassland, and the agriculture is mainly animal husbandry. The results are shown in Table 9. The impact of new digital infrastructure on agricultural green total factor productivity and agricultural green technology progress is positively significant, and the impact coefficient decreases in order from northwest to north to south. In addition, the impact of new digital infrastructure on the efficiency of agricultural green technology in the southern region is significantly negative. It indicates that the impact of new digital infrastructure on green agricultural development varies in different agricultural environments.
2.4.2. Market Environment Differences
The market environment is an important driving factor for farmers to adopt green production technologies [40,41]. Under different levels of market openness or economic development, agricultural green development will present different trends [42]. Referring to the research of Jie Xuemei, Zhu Qiwei[43], and Yu Honghai et al. [44], the final weighted values are used to represent the level of marketization based on indicators such as the relationship between the government and the market, the development of non-state-owned economy, the development of product markets, the development of factor markets, the development of market intermediary organizations, and the legal system environment. Based on the median level of marketization, the top 15 provinces in the sample were selected as developed regions for marketization, and the last 15 provinces were selected as underdeveloped regions for empirical testing. The results are shown in Table 9. The results show that compared with developed regions, the impact of new digital infrastructure on agricultural green total factor productivity and agricultural green technology progress is deeper in underdeveloped regions. This means that regions with lower levels of marketization have greater potential for new digital infrastructure to promote green agricultural development.
2.4.3. policy Environment Differences
Existing research indicates that environmental regulations exert a significant dual-threshold effect on the green total factor productivity of agriculture [35], and have a notable U-shaped impact on the green development of agriculture in both local and neighboring regions[45]. Therefore, differences in the level of environmental regulations may lead to heterogeneity in the impact of new digital infrastructure on agricultural green development. To examine the impact of new digital infrastructure on agricultural green development in regions with different levels of environmental regulations, this article characterizes environmental regulations by the ratio of investment completed in industrial pollution control to industrial added value. According to the level of environmental regulations, the sample is evenly divided into three regions: developed, developed, and underdeveloped, and empirical tests are conducted separately. Table 9 shows that the impact of new digital infrastructure on agricultural green total factor productivity and agricultural green technology progress is significantly positive, and the coefficient of influence decreases from developed to underdeveloped regional environmental regulations. This means that improving the level of regional environmental regulations will help to leverage the promoting role of new digital infrastructure in promoting green agricultural development. It is worth noting that in areas with developed environmental regulations, the impact coefficient of new digital infrastructure on agricultural green technology efficiency is significantly negative, while in areas with more developed environmental regulations, the impact coefficient is significantly positive.
4. Discussion
The new digital infrastructure can effectively link production factors, laying a solid foundation for achieving green agricultural development and sustainable agricultural development in China. This article uses provincial-level panel data from 2006 to 2022 in China to focus for the first time on the direct effects, mechanisms, and heterogeneity of new digital infrastructure on agricultural green development. Empirical tests were conducted using the SBM-GML index method, fixed effects model, three-layer mediation effect model, and moderated mediation effect regression model. The conclusion in the article expands the research on green total factor productivity in agriculture, providing useful references for achieving green agricultural development and promoting sustainable agricultural development.
The results indicate that: 1) The new digital infrastructure has a significant positive impact on the overall green total factor productivity of agriculture, mainly through promoting the progress of agricultural green technology. The new digital infrastructure has many advantages in agricultural production, such as optimizing resource allocation, improving the level of agricultural intelligence, and promoting the development of digital agriculture. Through the application of digital technology, farmers can better monitor key data such as soil moisture, meteorological conditions, and crop growth, thereby accurately regulating agricultural production processes. Therefore, the government should strengthen the promotion and application of new digital infrastructure, strengthen the construction of rural digital infrastructure, and help farmers understand and use relevant technological tools. 2) Land and technological factors play a partial mediating role in the impact of new digital infrastructure on agricultural green total factor productivity. The new digital infrastructure prevents the mismatch of production materials such as water resources, pesticides, and fertilizers, providing more efficient and intelligent production tools and technical support for agriculture, optimizing land quality and technological level, thereby improving crop yield and quality, and reducing carbon emissions in the production process. Therefore, the government should pay attention to the protection of arable land and the application and transformation of technology in promoting green agricultural development, and expand the benefits of new digital infrastructure. 3) In the path of promoting green agricultural development through new infrastructure, the optimization of labor quality has improved the effect of new digital infrastructure on improving farmland quality, while also optimizing the effect of technological factors, making the effect of new digital infrastructure on promoting green agricultural development more obvious. High quality labor helps to effectively integrate new digital infrastructure with existing agricultural production environments, and the optimization of labor quality plays a key role in enabling farmers to master new technologies, effectively use digital equipment and data analysis tools. Therefore, the government should focus on improving the quality of agricultural labor, strengthening relevant training and skill inheritance, and providing high-quality agricultural education and training resources to meet the requirements of farmers for new digital infrastructure and new technology applications. 4) The results of heterogeneity analysis indicate that in the northwest region, areas with lower levels of marketization and higher levels of environmental regulation have a more significant role of new digital infrastructure in promoting green agricultural development. The existence of such regional differences is attributed to the adaptability and compatibility of new digital infrastructure and the differences in local geography, economy, and social environment. When promoting new digital infrastructure, the government should fully consider the characteristics and needs of different regions, and formulate policies and strategies tailored to local conditions.It should be pointed out that this article also has some limitations. 1) When calculating the green total factor productivity of agriculture, considering agricultural added value as the expected output will exclude the influence of “intermediate consumption” and better reflect the real output compared to the total agricultural output value [46]. However, considering the availability of data, this article takes the total agricultural output value as the expected output, which may affect the objectivity of the conclusion. 2) As a public good, new infrastructure often has spillover effects. This article only considers the relationship between new digital infrastructure in the region and agricultural green total factor productivity, but does not consider its spillover effects. In subsequent research, the spatial Durbin model needs to be used to further explore the impact of new digital infrastructure on agricultural green total factor productivity, and continuously enrich research in this field.
5. Conclusions
The new digital infrastructure has a promoting effect on the green development of agriculture, and this conclusion still holds after overcoming endogeneity bias and robustness testing. The new digital infrastructure will affect the green development of agriculture through two paths: land and technology, with land and technological factors playing a partial intermediary role.
In the path of promoting green agricultural development through new infrastructure, the optimization of labor quality has improved the effect of new digital infrastructure on improving farmland quality, while also optimizing the effect of technological factors, making the effect of new digital infrastructure on promoting green agricultural development more obvious. The impact of new digital infrastructure on agricultural green total factor productivity exhibits regional heterogeneity. Specifically, in the northwest region, where the level of marketization is low and the level of environmental regulation is high, the role of new digital infrastructure in promoting green agricultural development is more pronounced.
This article has profound policy implications. One is to fully leverage the promoting role of new digital infrastructure in promoting green agricultural development, and further strengthen the construction efforts of various provinces in the construction of new digital infrastructure. In the future, the government should pay high attention to the application of basic technologies represented by 5G technology, cloud computing, the Internet of Things and big data, promote the popularization of Internet and broadband, and further strengthen and improve the construction of new digital infrastructure in various regions. The second goal is to promote green agricultural development and further improve the quality and technological level of cultivated land in the region. The government should encourage farmers to adopt sustainable agricultural practices through policies and market incentives to ensure the sustainable use of land and water resources; We need to increase investment in technology and encourage the research and development, promotion, and transformation of technology. Thirdly, with the aim of promoting the improvement of labor quality, we will further improve the labor education and training system. High quality labor can optimize the promotion effect of land and technological factors on green agricultural development, and education and professional training are the fundamental ways to improve the quality of labor. The government should strengthen basic education and professional training, increase the average education years of the labor force, fully leverage the synergistic effect of factors, and inject strength into the green development of agriculture. The fourth is to focus on strengthening the construction of new digital infrastructure in the northwest region, fully tapping into the potential of the northwest region, and strengthening the green development of agriculture. In addition, the government should handle the relationship between marketization and green agricultural development, increase the implementation of environmental regulations, and optimize the external environment for green agricultural development.
Author Contributions
For research articles with several authors, a short paragraph specifying their individual contributions must be provided. The following statements should be used “Conceptualization, Y.Z., Y.Z.; methodology, Y.Z., Y.Z.; software, Y.Z.; validation, Y.Z.; formal analysis, Y.Z.; investigation, Y.Z.; resources, Y.Z., Y.Z.; data curation, Y.Z.; writing—original draft preparation, Y.Z.; writing—review and editing, Y.Z.; visualization, Y.Z.; supervision, Y.Z.; project administration, Y.Z.,Y.Z. All authors have read and agreed to the published version of the manuscript.
Funding
This research was funded by Research on the Linkage Mechanism and Implementation Path between Agricultural Environmental Protection and Export Quality of Advantageous Agricultural Products under Environmental Regulation, a General Project of the China Postdoctoral Science Foundation , grant number 2020M673498 and Special Think Tank Project of Shaanxi Philosophy and Social Sciences Research, grant number 2024ZD492.
Conflicts of Interest
No conflicts of interest
References
- Wei Qi, Zhang Bin, Jin Shuqin. Construction and Regional Comparison of China’s Agricultural Green Development Index [J]. Agricultural Economic Issues, 2018, No. 467 (11): 11-20.
- Gao Ming, Zhang Zhexi. Positioning and Policy Suggestions for Green Agricultural Development in China under the Goals of Carbon Peak and Carbon Neutrality [J]. Journal of Huazhong Agricultural University (Social Science Edition), 2022(01): 24-31.
- Jin Shuqin, Niu Kunyu, Han Dongmei. The path of green agricultural development and its “14th Five Year Plan” orientation [J]. Reform, 2020, No.312 (02): 30-39.
- Yu Fawen. Research on the Motivation, Core and Countermeasures of Green Agricultural Development in the New Era [J]. China Rural Economy, 2018 (05): 19-34.
- Zhu Zhiyong, Liu Changchang. The impact of new digital infrastructure on urban-rural income gap and its threshold effect [J]. Journal of South China Agricultural University (Social Sciences Edition), 2022, 21 (05): 126-140.
- Qian Xiaojing, Xue Zhixin, Sun Yiming. How New Digital Infrastructure Affects the Upgrading of Foreign Trade: Empirical Evidence from Chinese Cities at or above the Prefectural Level [J]. Economic Science, 2020, No.237 (03): 46-59.
- Yang Qian, Wang Jue, Li Chao, et al. Spatial differentiation and driving factors of green total factor productivity in China’s agriculture [J]. Quantitative Economic and Technological Research, 2019, 36 (10): 21-37.
- Zhao Huijie, Yu Fawen. Evaluation of Agricultural Green Development Level in Main Grain Production Areas Based on Entropy Method [J]. Reform, 2019 (11): 136-146.
- Tang Yifan, Wu Bo. Does Financial Support for Agriculture Promote Green Agricultural Development? — An Empirical Test Based on the PVAR Model [J]. Journal of Hunan Agricultural University (Social Science Edition), 2022, 23(06): 46-54.
- Li Minjie, Wang Jian The Quality of Foreign Direct Investment and the Growth of Green Total Factor Productivity in Chinese Agriculture [J] Soft Science, 2019, 33 (9): 13-20.
- Liu Yiwen, Ouyang Ying, Cai Hongyu. Measurement and spatiotemporal evolution characteristics of green total factor productivity in Chinese agriculture [J]. Quantitative Economic and Technological Research, 2021,38 (05): 39-56.
- Fan Shengyue, Li Yaolong, Ma Xiaojie, et al. An Empirical Study on the Impact of Digitalization Level on Green Agricultural Development — Based on Panel Data from 30 Provinces in China [J]. World Agriculture, 2021(12): 4-16.
- Shi Zhou, Liang Zongzheng, Yang Yuanyuan, et al. Current Status and Prospects of Agricultural Remote Sensing Research [J]. Journal of Agricultural Machinery, 2015,46 (02): 247-260.
- Xu Guangyue. Research on the Development of Low Carbon Agriculture in China [J]. Economist, 2010 (10): 72-78.
- Zhao Chunjiang, Li Jin, Feng Xian, etc Application Status and Development Trend of “Internet plus” Modern Agriculture at Home and Abroad [J]. China Engineering Science, 2018,20 (02):50-56.
- Tan Qiucheng. Green Agriculture as a Production Method [J]. China Population, Resources and Environment, 2015,25 (09): 44-51.
- Yang Jianli, Zheng Wenling, Xing Jiaoyang, Jin Wenwen. Empowering high-quality agricultural development with digital technology [J]. Shanghai Economic Research, 2021 (07): 81-90+104.
- Zhang Junling, Zhang Jiangzhou, Shen Jianbo, et al. Soil Health and Green Agricultural Development: Opportunities and Strategies [J]. Acta Pedologica Sinica, 2020, 57(04): 783-796.
- Zhao Xing. Research on the Technological Innovation Effect of New Digital Infrastructure [J]. Statistical Research, 2022, 39 (4): 13.
- Lv Na, Zhu Lizhi. Research on China’s Agricultural Environmental Technology Efficiency and Green Total Factor Productivity Growth [J]. Agricultural Technology and Economics, 2019 (04): 95-103.
- Li Zhou. Green Development of Agriculture in China: Innovation and Evolution [J]. Chinese Rural Economy, 2023(02): 2-16.
- Zhu Qingying, Chen Yinrong, Hu Weiyan, et al. Social capital, farmland value cognition, and farmers’ willingness to pay for farmland protection: an empirical study based on a moderated mediation effect model [J]. China Population, Resources and Environment, 2019,29 (11): 120-131.
- Wu Jing, Wang Tianyu, Wang Zhengbing. The Impact of Social Networks and Perceived Value on Farmers’ Choice of Farmland Quality Protection Behavior [J]. Journal of Northwest A&F University (Social Science Edition), 2021,21 (06): 138-147.
- Guo Junhua, Ni Ming, Li Bangyi. Research on Agricultural Production Efficiency Based on a Three Stage DEA Model [J]. Quantitative Economic and Technological Research, 2010,27 (12):27-38.
- Ma Guoqun, Tan Yanwen. Research on the Impact of Environmental Regulations on Agricultural Green Total Factor Productivity: Analysis Based on Panel Threshold Model [J]. Agricultural Technology and Economics, 2021 (05): 77-92.
- Li Zhaoliang, Luo Xiaofeng, Xue Longfei, Zhang Junbiao. Analysis of regional differences and influencing factors of green agricultural production efficiency in China [J]. Journal of China Agricultural University, 2017, 22 (10): 203-212.
- Zhou Li, Feng Jianming, Cao Guangqiao. Research on the adoption behavior of green agricultural technology by farmers: A case study of farmer surveys in Hunan, Jiangxi, and Jiangsu [J]. Rural Economy, 2020 (03): 93-101.
- Yang Lijun. Inspiration of Israel’s Modern Agricultural Development Experience on China’s Agricultural Supply Side Reform [J]. Economic Review, 2016 (06): 111-114.
- Wu Xuelian, Zhang Junbiao, Feng Junhui. Factors influencing farmers’ perception of green agricultural technology and their hierarchical structure decomposition: based on the Probit ISM model [J]. Journal of Huazhong Agricultural University (Social Science Edition), 2017 (05): 36-45+145.
- Li Houjian. Empirical analysis of the influencing factors of farmers’ willingness to adopt circular agriculture technology [J]. China Rural Observation, 2012 (02): 28-36+66.
- Liu Hongmei, Wang Keqiang, Huang Zhijun. Analysis of factors influencing the adoption of water-saving irrigation technology by Chinese farmers [J]. China Rural Economy, 2008 (04):44-54.
- Zhai Jinliang. Characteristics, problems and development strategies of transformation of agricultural scientific and technological achievements in China [J]. Journal of the Chinese Academy of Sciences, 2015,30 (03): 378-385.
- Ke Bingsheng, Chen Huaning. Reflections on Cultivating New Farmers [J]. China Party and Government Cadre Forum, 2006 (04): 36-38.
- Chen Chao, Zhou Ning. The impact of cultural differences among farmers on agricultural production and technology selection channels: an analysis based on a survey questionnaire of farmers in ten provinces across the country [J]. China Rural Economy, 2007 (09): 33-38.
- Yang Wenzhi. The Quality of Agricultural Workers in China Faces Challenges from Joining the WTO [J]. Agricultural Economic Issues, 2002 (01): 28-33.
- Ge Pengfei, Wang Songji, Huang Xiulu. Measurement of Green Total Factor Productivity in Chinese Agriculture [J]. China Population, Resources and Environment, 2018,28 (05): 66-74.
- Fan Hejun, Wu Ting. New Digital Infrastructure, Digital Capability, and Total Factor Productivity [J]. Economic and Management Research, 2022 (1): 3-22.
- Wen Zhonglin, Zhang Lei, Hou Jietai. Mediated moderating variables and moderated mediating variables [J]. Journal of Psychology, 2006 (03): 448-452.
- Liang Jun, Long Shaobo. Growth of Agricultural Green Total Factor Productivity and Its Influencing Factors [J]. Journal of South China Agricultural University (Social Sciences Edition), 2015,14 (03): 1-12.
- Lin Li, Li Jing, Xiao Bo. Will the willingness of farmers to adopt green production technologies be market driven or government driven? [J] Economic issues, 2021 (12): 67-74.
- Chen Zhuanqing. The Impact of Policy and Market Orientation on Farmers’ Green Production: An Empirical Analysis Based on 865 Farmers in Henan [J]. Journal of Management Sciences, 2021, 34(05): 109-125.
- Du Wencui, Zhang Pingdan, Zhu Song. Agricultural marketization, agricultural modernization, and environmental pollution [J]. Journal of Beijing Institute of Technology (Social Sciences Edition), 2016,18 (01): 1-9.
- Jie Xuemei, Zhu Qiwei. How can green innovation practices in enterprises solve the problem of “harmonious coexistence”? [J] Managing the World, 2021, 37 (1): 23.
- Yu Honghai, Xu Longbing, Chen Baizhu. Ultimate controlling shareholder control and excessive investment in free cash flow [J]. Economic Research, 2010 (8): 12.
- Guo Haihong, Li Shuchao. Environmental Regulation, Spatial Effects, and Green Agricultural Development [J]. Journal of Research and Development Management, 2022, 34(02): 54-67.
- Gao Fan. The Evolution Trends and Influencing Factors of Regional Agricultural Total Factor Productivity in China: An Empirical Analysis Based on Inter provincial Panel Data [J]. Quantitative Economic and Technological Research, 2015,32 (05): 3-19+53.
Figure 1.
Research model of new digital infrastructure, factor integration and agricultural green development.
Figure 1.
Research model of new digital infrastructure, factor integration and agricultural green development.
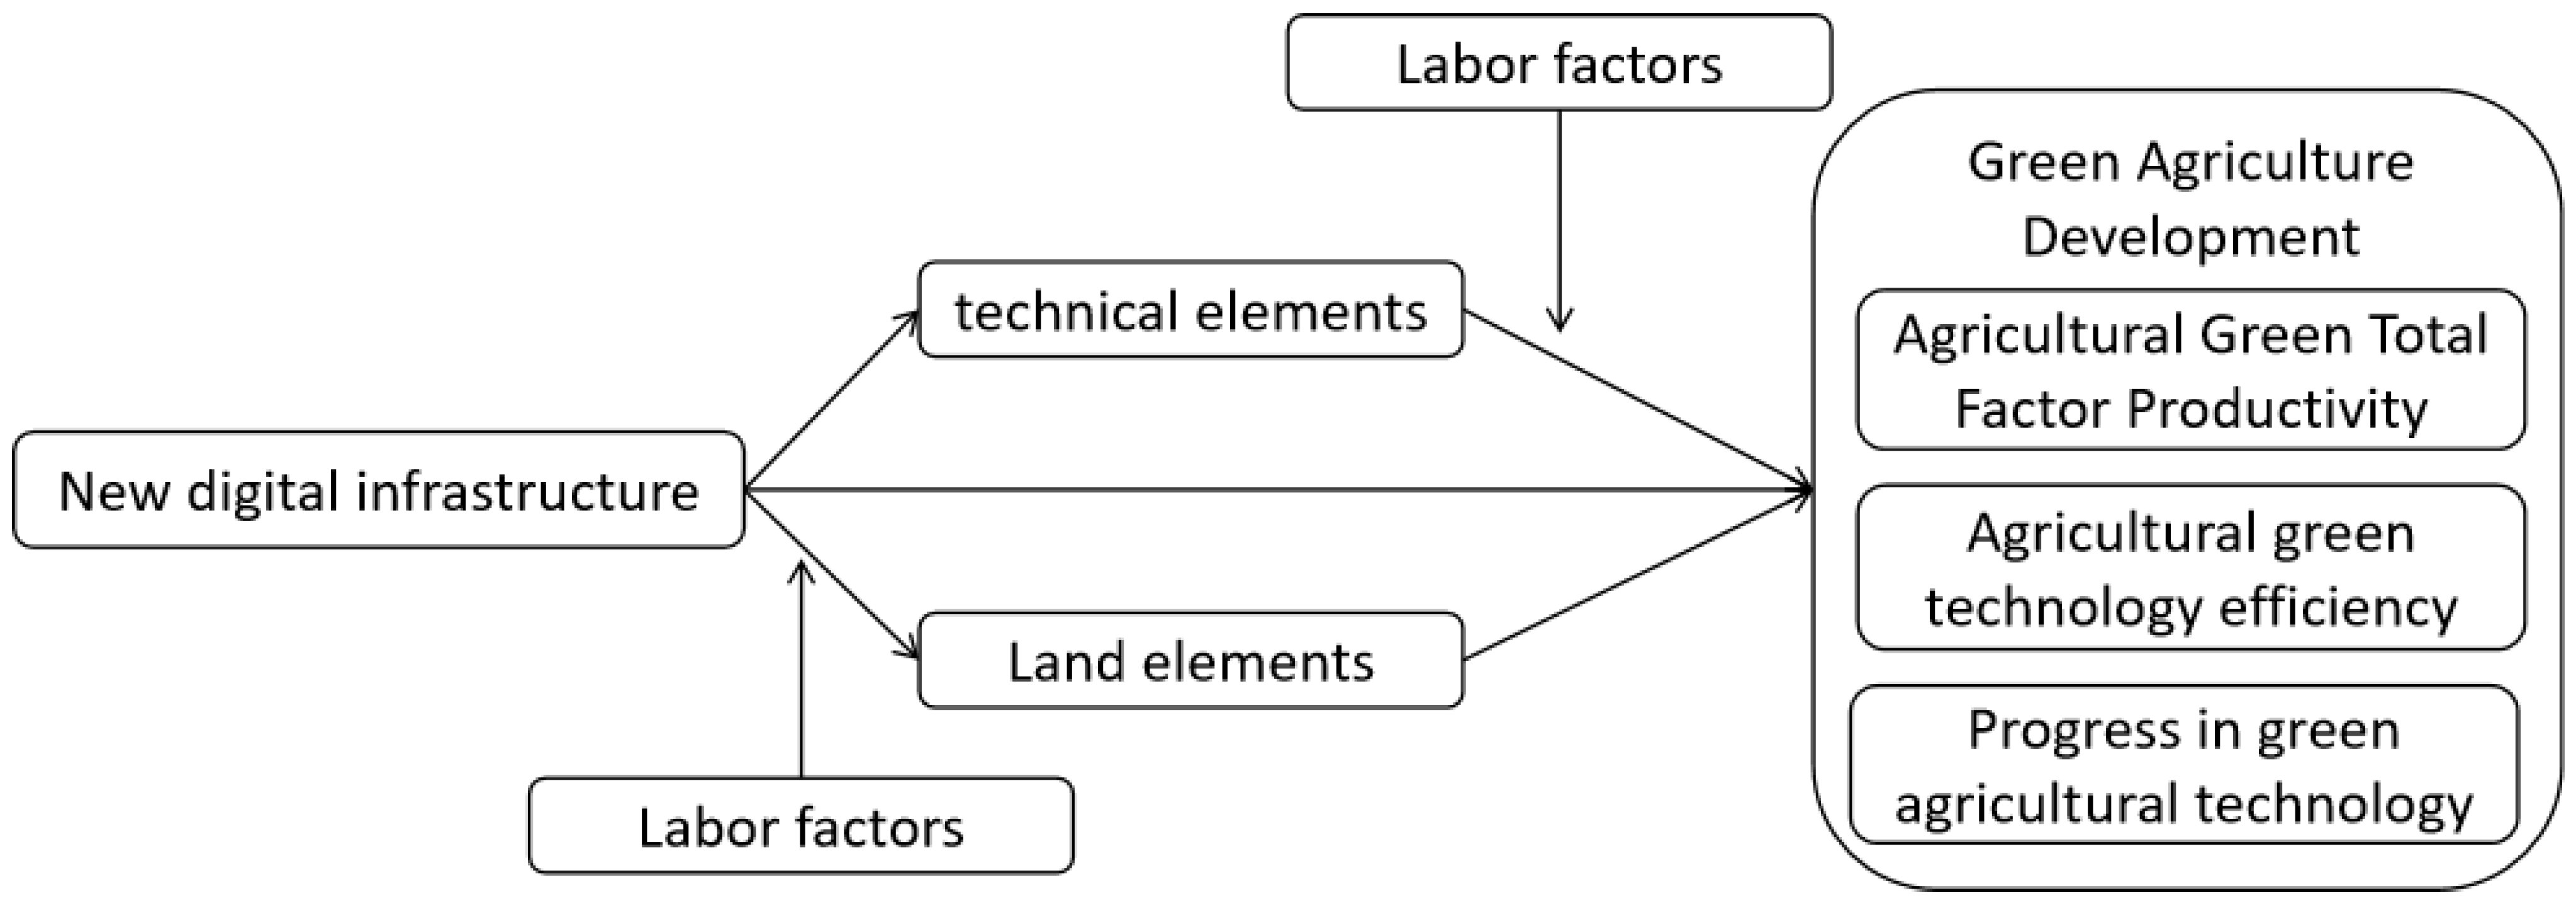

Table 1.
Input-output index of agricultural green total factor productivity.
| Indicator category | Factor | meaning | unit |
| Input metrics | Labor input | Number of people employed in agriculture | Ten thousand person |
| Land resource input | Crop sown area | Thousand hectares | |
| Agricultural machinery inputs | Total power of agricultural machinery | Ten thousand kW | |
| Fertilizer inputs | The amount of chemical fertilizer applied (converted to pure). | Ten thousand tons | |
| Agricultural film inputs | The amount of agricultural film used | Ten thousand tons | |
| Pesticide inputs | Pesticide application rate | Ten thousand tons | |
| Irrigation inputs | Agricultural water use | Billion cubic meters | |
| Output indicators | Expected output | Gross agricultural output | Billion yuan |
| Undesired outputs | Agricultural carbon emissions | Ten thousand tons |
Table 2.
Index system of new digital infrastructure.
| Primary index | Secondary index | Unit of measurement | Index type |
| Capital | Length of long distance optical cable line | Ten thousand kilometers | Positive |
| Mobile phone exchange capacity | Ten thousand households | Positive | |
| Number of broadband Internet access ports | Ten thousand | Positive | |
| Data | Number of Domains | Ten thousand | Positive |
| Number of pages | Ten thousand | Positive | |
| Internet penetration | % | Positive | |
| Mobile phone penetration | Per hundred people | Positive |
Table 3.
Descriptive statistics.
| Variable | Observed value | Mean value | Standard deviation | Minimum value | Maximum value |
| GTFP | 510 | 2.248 | 1.488 | 0.488 | 1.807 |
| GEC | 510 | 0.948 | 0.300 | 0.241 | 0.974 |
| GTC | 510 | 2.566 | 1.714 | 0.757 | 1.975 |
| LQ | 510 | 0.365 | 0.234 | 0.070 | 1.800 |
| TL | 510 | 9.779 | 1.660 | 4.575 | 13.679 |
| WQ | 510 | 2.191 | 0.111 | 1.886 | 2.548 |
| DI | 510 | -0.000 | 0.578 | -0.902 | -0.101 |
| DR | 510 | 0.182 | 0.145 | 0.000 | 0.147 |
| MD | 510 | 0.623 | 0.251 | 0.220 | 0.563 |
| FS | 510 | 0.659 | 0.141 | 0.355 | 0.667 |
| ED | 510 | 5.796 | 0.898 | 2.472 | 5.994 |
| AS | 510 | 0.747 | 2.261 | 0.008 | 0.083 |
Table 4.
Baseline regression estimation results of the impact of new digital infrastructure on agricultural green development.
Table 4.
Baseline regression estimation results of the impact of new digital infrastructure on agricultural green development.
| Variable | (1) | (2) | (3) | (4) | (5) | (6) |
| GTFP | GEC | GTC | GTFP | GEC | GTC | |
| DI | 2.4076*** | -0.0624*** | 2.8491*** | 2.9916*** | 0.0300 | 3.0464*** |
| (26.7768) | (-3.0966) | (27.2769) | (16.4030) | (0.7678) | (14.5148) | |
| DR | -0.7825** | 0.0417 | -1.2665*** | |||
| (-2.0499) | (0.5092) | (-2.8831) | ||||
| MD | -0.6546 | 0.1179 | -1.0191** | |||
| (-1.5483) | (1.2994) | (-2.0947) | ||||
| FS | -2.6961** | -0.9048*** | -0.2458 | |||
| (-2.1164) | (-3.3109) | (-0.1677) | ||||
| ED | -0.3958*** | -0.0943*** | -0.1013 | |||
| (-3.5328) | (-3.9222) | (-0.7855) | ||||
| AS | -0.1326*** | 0.0418*** | -0.2095*** | |||
| (-3.6575) | (5.3820) | (-5.0236) | ||||
| Constant term | 2.2485*** | 0.9478*** | 2.5655*** | 6.9704*** | 1.9786*** | 4.3375*** |
| (57.4113) | (108.0649) | (56.3907) | (6.5402) | (8.6536) | (3.5365) | |
| Sample size | 510 | 510 | 510 | 510 | 510 | 510 |
| R2 | 0.574 | -0.042 | 0.584 | 0.600 | 0.101 | 0.616 |
Note: *, * *, and * * * respectively indicate significant at the 10%, 5%, and 1% levels. Same as below.
Table 5.
Results of endogeneity test.
| Variable | (1) | (2) | (3) | (4) | (5) | (6) | (7) | (8) | (9) |
| GTFP | GEC | GTC | GTFP | GEC | GTC | GTFP | GEC | GTC | |
| DI | 3.4947*** | 0.0452 | 3.5633*** | 4.0780*** | 0.0298 | 4.2610*** | 3.7044*** | 0.0391 | 3.7477*** |
| (16.2837) | (1.0123) | (14.5043) | (15.7596) | (0.5868) | (14.3951) | (15.3970) | (0.8177) | (13.6591) | |
| DR | -0.8804** | -0.0500 | -1.1168** | -0.9583** | -0.0607 | -0.9670* | -0.9828** | -0.0601 | -1.0007** |
| (-2.1659) | (-0.5920) | (-2.4004) | (-2.1905) | (-0.7069) | (-1.9324) | (-2.2717) | (-0.6999) | (-2.0283) | |
| MD | -0.5853 | 0.1187 | -0.9662* | -0.4909 | 0.1105 | -0.8371 | -0.5345 | 0.1115 | -0.8970* |
| (-1.3388) | (1.3059) | (-1.9306) | (-1.0635) | (1.2185) | (-1.5855) | (-1.1713) | (1.2307) | (-1.7237) | |
| FS | -2.9524** | -1.0286*** | -0.2950 | -2.8480* | -1.1227*** | 0.0894 | -3.0034* | -1.1188*** | -0.1241 |
| (-2.0831) | (-3.4900) | (-0.1818) | (-1.8156) | (-3.6438) | (0.0498) | (-1.9366) | (-3.6321) | (-0.0702) | |
| ED | -0.6493*** | -0.1354*** | -0.2609 | -0.9765*** | -0.1414*** | -0.5515** | -0.7461*** | -0.1471*** | -0.2350 |
| (-4.4401) | (-4.4512) | (-1.5585) | (-5.1555) | (-3.8019) | (-2.5454) | (-4.1582) | (-4.1287) | (-1.1484) | |
| AS | -0.1444*** | 0.0420*** | -0.2232*** | -0.1570*** | 0.0413*** | -0.2401*** | -0.1475*** | 0.0410*** | -0.2271*** |
| (-3.7982) | (5.3136) | (-5.1289) | (-3.8890) | (5.2030) | (-5.2005) | (-3.7002) | (5.1810) | (-4.9958) | |
| Constant term | 8.5844*** | 2.3216*** | 5.2147*** | 10.3781*** | 2.4316*** | 6.5244*** | 9.1556*** | 2.4619*** | 4.8449*** |
| (6.7472) | (8.7757) | (3.5805) | (6.6860) | (7.9757) | (3.6745) | (6.0701) | (8.2177) | (2.8166) | |
| Sample size | 480 | 480 | 480 | 450 | 450 | 450 | 450 | 450 | 450 |
| R2 | 0.6232 | 0.1821 | 0.6405 | 0.6076 | 0.1812 | 0.6227 | 0.6163 | 0.1811 | 0.6333 |
Table 6.
Robustness test results.
| Variable | (1) | (2) | (3) | (4) | (5) | (6) | (7) | (8) | (9) |
| GTFP | GEC | GTC | GTFP | GEC | GTC | GTFP | GEC | GTC | |
| DI | 3.0832*** | 0.0275 | 3.0915*** | 2.7377*** | 0.0402 | 3.5585*** | 16.1740*** | -0.0864 | 17.5805*** |
| (16.7699) | (0.7220) | (14.5350) | (19.7133) | (0.9045) | (15.3674) | (19.3708) | (-0.4510) | (18.8248) | |
| DR | -0.7942** | 0.0555 | -1.2677*** | -1.0138*** | 0.0571 | -1.6307*** | -0.4854 | 0.0310 | -0.9031** |
| (-2.1048) | (0.7105) | (-2.9042) | (-3.5442) | (0.6249) | (-3.4190) | (-1.3543) | (0.3774) | (-2.2528) | |
| MD | -0.7285* | 0.0338 | -1.1055** | -0.7907** | 0.1168 | -1.1496** | -0.6057 | 0.1130 | -0.9456** |
| (-1.7432) | (0.3907) | (-2.2866) | (-2.4410) | (1.1283) | (-2.1283) | (-1.5315) | (1.2456) | (-2.1376) | |
| FS | -3.0363** | -0.7701*** | -0.6408 | -3.5076*** | -1.6720*** | 0.3190 | -2.7790** | -0.9242*** | -0.2475 |
| (-2.4393) | (-2.9900) | (-0.4450) | (-4.1450) | (-6.1810) | (0.2261) | (-2.3334) | (-3.3822) | (-0.1858) | |
| ED | -0.4357*** | -0.0871*** | -0.1108 | -0.4000*** | -0.0992*** | -0.3732*** | -0.9348*** | -0.0692** | -0.7863*** |
| (-3.8144) | (-3.6858) | (-0.8386) | (-4.7879) | (-3.7147) | (-2.6793) | (-7.7138) | (-2.4875) | (-5.8013) | |
| AS | -0.1520*** | 0.0286*** | -0.2373*** | 0.4806** | 0.1665*** | -0.1705 | -0.1040*** | 0.0434*** | -0.1860*** |
| (-3.8519) | (3.5059) | (-5.1968) | (2.5801) | (2.7972) | (-0.5489) | (-3.0977) | (5.6276) | (-4.9511) | |
| Constant term | 7.4910*** | 1.9046*** | 4.7261*** | 7.2713*** | 2.4588*** | 5.6667*** | 5.7050*** | 1.8727*** | 3.4644*** |
| (7.1401) | (8.7737) | (3.8939) | (9.7118) | (10.2735) | (4.5391) | (5.9564) | (8.5221) | (3.2339) | |
| Sample size | 510 | 510 | 510 | 510 | 510 | 510 | 510 | 510 | 510 |
| R2 | 0.613 | 0.065 | 0.625 | 0.720 | 0.073 | 0.625 | 0.650 | 0.100 | 0.683 |
Table 7.
Test of mediating effect and regulating effect.
| Variable | (1) | (2) | (3) | (4) |
| LQ | GTFP | GTC | LQ | |
| DI | 0.2083*** | 2.2817*** | 3.0464*** | 0.1685*** |
| (11.3422) | (11.8002) | (14.5148) | (8.3373) | |
| DR | -0.0708* | -0.5412 | -1.2665*** | -0.0659* |
| (-1.8421) | (-1.5024) | (-2.8831) | (-1.7305) | |
| MD | 0.1479*** | -1.1589*** | -1.0191** | 0.1565*** |
| (3.4757) | (-2.8788) | (-2.0947) | (3.7434) | |
| FS | -1.0569*** | 0.9065 | -0.2458 | -0.9919*** |
| (-8.2407) | (0.7078) | (-0.1677) | (-7.7730) | |
| ED | 0.0291** | -0.4950*** | -0.1013 | 0.0360*** |
| (2.5777) | (-4.6654) | (-0.7855) | (2.6114) | |
| AS | -0.0016 | -0.1270*** | -0.2095*** | -0.0080* |
| (-0.4468) | (-3.7260) | (-5.0236) | (-1.7404) | |
| LQ | 3.4086*** | |||
| (7.9461) | ||||
| Inter1 | 0.2675** | |||
| (2.0451) | ||||
| WQ | 0.3593** | |||
| (2.5443) | ||||
| Constant term | 0.8151*** | 4.1919*** | 4.3375*** | 0.7246*** |
| (7.5968) | (3.9495) | (3.5365) | (5.9726) | |
| Sample size | 510 | 510 | 510 | 510 |
| R2 | 0.701 | 0.646 | 0.616 | 0.712 |
Table 8.
Moderating effect test of labor force factors.
| Variable | (1) | (2) | (3) | (4) | (5) | (6) | (7) | (8) |
| GTFP | GEC | GTC | TL | GTFP | GTC | GTFP | GTC | |
| CDI | 2.8571*** | 0.0402 | 2.8448*** | 0.6877*** | 2.2389*** | 1.8591*** | 2.0213*** | 1.7317*** |
| (15.5140) | (1.0071) | (13.5487) | (9.2853) | (11.9793) | (9.4283) | (9.2696) | (7.5071) | |
| WQ | 3.2199*** | -0.2443 | 4.8268*** | 2.0727*** | 1.3567 | 1.8559** | 0.9969 | 1.6453* |
| (3.5405) | (-1.2380) | (4.6550) | (5.6671) | (1.5467) | (2.0054) | (1.1144) | (1.7387) | |
| DR | -0.6977* | 0.0353 | -1.1394*** | -0.7425*** | -0.0303 | -0.0752 | -0.0564 | -0.0905 |
| (-1.8462) | (0.4300) | (-2.6445) | (-4.8854) | (-0.0837) | (-0.1971) | (-0.1564) | (-0.2371) | |
| MD | -0.7774* | 0.1272 | -1.2032** | -0.6830*** | -0.1635 | -0.2243 | -0.1022 | -0.1884 |
| (-1.8547) | (1.3982) | (-2.5177) | (-4.0517) | (-0.4108) | (-0.5342) | (-0.2566) | (-0.4474) | |
| FS | -2.0016 | -0.9575*** | 0.7953 | -1.1666** | -0.9529 | 2.4674* | -1.6065 | 2.0849 |
| (-1.5712) | (-3.4639) | (0.5476) | (-2.2772) | (-0.7971) | (1.9563) | (-1.2960) | (1.5898) | |
| ED | -0.5431*** | -0.0831*** | -0.3220** | 0.7059*** | -1.1777*** | -1.3339*** | -1.0606*** | -1.2654*** |
| (-4.5922) | (-3.2383) | (-2.3883) | (14.8432) | (-8.8123) | (-9.4605) | (-7.2397) | (-8.1645) | |
| AS | -0.1052*** | 0.0398*** | -0.1686*** | -0.0130 | -0.0935*** | -0.1499*** | -0.1216*** | -0.1663*** |
| (-2.8730) | (5.0035) | (-4.0365) | (-0.8843) | (-2.7334) | (-4.1524) | (-3.2763) | (-4.2368) | |
| TL | 0.8989*** | 1.4333*** | 0.9423*** | 1.4587*** | ||||
| (8.4235) | (12.7308) | (8.6626) | (12.6760) | |||||
| Inter2 | 0.5927* | 0.3469 | ||||||
| (1.9226) | (1.0637) | |||||||
| Constant term | 7.4067*** | 1.9455*** | 4.9915*** | -2.7516*** | 9.8801*** | 8.9355*** | 9.5616*** | 8.7491*** |
| (6.9859) | (8.4559) | (4.1293) | (-6.4535) | (9.5717) | (8.2050) | (9.1714) | (7.9328) | |
| Sample size | 510 | 510 | 510 | 510 | 510 | 510 | 510 | 510 |
| R2 | 0.609 | 0.102 | 0.632 | 0.884 | 0.660 | 0.726 | 0.662 | 0.726 |
Table 9.
Results of heterogeneity regression estimation.
| Grouping variable | Dependent variable | Coefficient | Standard error | Control variable | Sample size | R2 | |
| Agricultural environment | north | GTFP | 3.5579*** | 11.5781 | Controlled | 204 | 0.635 |
| GEC | -0.0834 | -1.1833 | Controlled | 0.273 | |||
| GTC | 4.2025*** | 11.6154 | Controlled | 0.663 | |||
| south | GTFP | 2.3047*** | 8.9874 | Controlled | 255 | 0.66 | |
| GEC | -0.1184*** | -2.7029 | Controlled | 0.066 | |||
| GTC | 2.4099*** | 10.1046 | Controlled | 0.686 | |||
| northwest | GTFP | 5.8726*** | 7.1469 | Controlled | 255 | 0.581 | |
| GEC | -0.184 | -1.0645 | Controlled | 0.624 | |||
| GTC | 12.0077*** | 11.6154 | Controlled | 0.8 | |||
| Market environment | Developed | GTFP | 2.7588*** | 12.1526 | Controlled | 255 | 0.644 |
| GEC | -0.0158 | -0.3635 | Controlled | 0.176 | |||
| GTC | 2.9363*** | 10.7359 | Controlled | 0.59 | |||
| underdeveloped | GTFP | 5.1217*** | 13.7492 | Controlled | 255 | 0.642 | |
| GEC | -0.0396 | -0.4316 | Controlled | 0.163 | |||
| GTC | 5.7180*** | 14.4343 | Controlled | 0.734 | |||
| Policy environment | Developed | GTFP | 4.2320*** | 11.0244 | Controlled | 255 | 0.641 |
| GEC | -0.2524** | -2.0953 | Controlled | 0.162 | |||
| GTC | 6.3850*** | 11.9027 | Controlled | 0.708 | |||
| comparatively developed | GTFP | 3.0323*** | 8.2303 | Controlled | 255 | 0.626 | |
| GEC | 0.1318** | 2.0521 | Controlled | 0.358 | |||
| GTC | 2.7077*** | 6.9636 | Controlled | 0.56 | |||
| Underdeveloped | GTFP | 2.6195*** | 9.6881 | Controlled | 255 | 0.62 | |
| GEC | 0.0451 | 1.0867 | Controlled | 0.235 | |||
| GTC | 2.6181*** | 8.9141 | Controlled | 0.667 | |||
Disclaimer/Publisher’s Note: The statements, opinions and data contained in all publications are solely those of the individual author(s) and contributor(s) and not of MDPI and/or the editor(s). MDPI and/or the editor(s) disclaim responsibility for any injury to people or property resulting from any ideas, methods, instructions or products referred to in the content. |
© 2024 by the authors. Licensee MDPI, Basel, Switzerland. This article is an open access article distributed under the terms and conditions of the Creative Commons Attribution (CC BY) license (http://creativecommons.org/licenses/by/4.0/).
Copyright: This open access article is published under a Creative Commons CC BY 4.0 license, which permit the free download, distribution, and reuse, provided that the author and preprint are cited in any reuse.


