Submitted:
24 August 2024
Posted:
27 August 2024
You are already at the latest version
Abstract
The oral microbiome, studied by sampling the saliva or oral rinse, has been long thought to have diagnostic capacity for head and neck cancers (HNC). However, previous reports on the HNC oral microbiome provide inconsistent results. The aim of this study is to consolidate these datasets and determine the oral microbial composition between HNC patients to healthy and premalignant individuals. We analyzed 16 published head and neck cancer (HNC) short-read 16S rRNA sequencing datasets, specifically targeting the V3V4, V4 and V4V5 regions. These datasets included saliva and oral rinse samples from donors with HNC, as well as from healthy and premalignant donors. Differences in diversities and microbial abundance were determined. HNC saliva displayed lower alpha diversity than healthy donors. In contrast, the opposite trend was observed for oral rinse samples. Beta diversity were largely similar across different patient types. Similar oral phyla were detected for all samples, but proportions were largely dependent on sample type (i.e. saliva or oral rinse) and primer set utilised for 16S rRNA sequencing. Neisseria, Leptotrichia and Megasphaera were elevated in healthy saliva, while Mycoplasma was elevated in HNC saliva. Oral rinse and saliva displayed similar enrichment for Fusobacterium, while Veillonella, Alloprevotella, and Campylobacter had conflicting results. The sparse partial least squares discriminant analysis model performed effectively in discriminating HNC from healthy or premalignant patients using V3V4 saliva (AUC = 0.888), and V3V4 oral rinse (AUC = 0.928), while poor discriminative capacity was observed for V4 saliva (AUC = 0.688). In conclusion, our meta-analysis highlighted the limitations of 16S rRNA sequencing, particularly due to variations across study batches, primer sets (i.e. V3V4, V4), and sample types. Hence, caution should be exercised when interpreting 16S rRNA sequencing results across studies, especially when different primer sets and sample types are used.
Keywords:
oral microbiome
; 16S ribosomal RNA
; saliva
; oral rinse
; head and neck cancer
1. Introduction
Oral microbes have been associated with cancer and other diseases such as inflammatory bowel disease, periodontitis, and cardiovascular disease [1]. Oral microbes have been identified within cancer tissues [2], and oral sampling of cancer patients suggest the presence of a dysregulated oral microbiome [3]. Thus, the oral microbiome is viewed as a possible non-invasive, safe, and accessible diagnostic tool for cancer diagnostics. In head and neck cancers (HNC), early stage (T1-T2) disease is usually asymptomatic, with physical examination remains as the best intervention [4,5,6]. However, most patients (>60%) are diagnosed at a later stage (T3-T4), resulting in a reduced treatment window and lower overall survival (OS) rates (5-year OS = 36%) [4]. This situation is worse in lower-income countries, where late-stage disease has a 5-year OS of only 3% [4]. Hence, it is crucial to have an affordable, rapid, user-friendly and minimally invasive diagnostic tool for HNC detection screening.
16S ribosomal RNA (rRNA) sequencing of oral samplings have been utilised in HNC studies to study differences in the microbiome between cancer, premalignant and healthy oral samples [7]. Oral samples are primarily collected from saliva [8,9,10,11,12,13,14,15,16,17,18,19,20,21,22,23,24,25], oral rinse [26,27,28,29], or by swabbing oral sites [7]. Collecting saliva or oral rinse is straightforward and involves the participant providing a sample into a tube. Oral rinse involves using a fixed volume of solution (~ 10 mL), like normal saline [27,29,30,31,32,33,34] or distilled water [35]. These methods attempt to sample the oral cavity without sampling a particular site, making them more practical for diagnostic screening. In contrast, swabbing involves collecting samples from specific sites, such as buccal, gingival, tongue, or tumour-adjacent area, as seen in previous HNC oral microbiome studies (reviewed in meta-analyses [7,36,37,38]). Since oral microbes are site-specific, with some bacteria preferring particular locations [39], data from swabs can be biased based on the collection site, making diagnostics dependent on region-specific sampling [23,40]. Therefore, saliva or oral rinse may be more suitable and uniform methods for developing oral microbiome diagnostic compared to swabs.
The healthy core salivary microbiome primarily consists of the bacterial phyla Firmicutes, Proteobacteria, Actinobacteria, Bacteroidetes, and Fusobacteria, with the most common genera being Streptococcus, Prevotella, and Neisseria [41]. Importantly, numerous host factors such as age, diet, gender, smoking, alcohol consumption, disease status (e.g. periodontitis, cancer) and treatment have been shown to affect microbial composition [41]. Alpha- and beta-diversities are commonly compared between saliva of HNC and healthy individuals, however conflicting results prevent the formation of a consensus microbial diversity shift between HNC and healthy states [7,15,16,23,28]. As an example, Fusobacterium is inconsistently reported as being elevated in either HNC [28,42] or healthy [9,15,23] saliva samples. We and others have shown that elevated Fusobacterium in HNC tissues is associated with better overall survival in HNC [26,43,44,45]. However, it is unclear if abundance of Fusobacterium in the saliva can be linked to disease status. Moreover, inconsistencies were also reported for other known beneficial (Bifidobacterium) or oral commensal (Streptococcus and Prevotella) bacterial genera [8,9,13,23,28]. Oral rinse sampling also displayed some inconsistencies in reporting for alpha- and beta-diversities between HNC and healthy samples [26,27,29,31,32,33,34,35,46,47]. However, unlike saliva sampling, taxa level information for oral rinse were more consistent across studies [26,27,29,31,32,33,34,35,46,47].
Other than microbiome profiling, studies have also evaluated the diagnostic potential (i.e. to discriminate cancer from healthy) of using specific microbes detected in the saliva [11,12,19,20,48,49,50] or oral rinse [26,29,32,33,34] for HNC. For example, a combination of 12 genera (Fusobacterium, Neisseria, Streptococcus, Rothia, Granulicatella, Actinomyces, Lautropia, Corynebacterium, Oribacterium, Peptostreptococcus, Cardiobacterium and Abiotrophia) have been used to distinguish healthy from HNC oral rinse [26,29]. The reported receiver operating characteristic (ROC) analysis using 16S rRNA abundance of specific HNC-discriminating microbes, either alone or combined with clinical variables, achieved an area under the ROC curve (AUROC) ranging from 0.63 – 0.95 for saliva samples [11,12,19,20,48,49,50] and 0.62 – 0.98 for oral rinse samples [26,29,32,33,34] in comparative studies of HNC and healthy controls/donors. These findings suggest that oral sampling using saliva and oral rinse could potentially serve as a diagnostic tool for HNC. Thus, performing a meta-analysis of published 16S rRNA datasets derived from saliva or oral rinse samplings is needed to determine if these oral microbiome signatures can be used for HNC diagnostics.
Several systematic reviews and meta-analyses have attempted to provide a consensus HNC oral microbiome signature by using processed [7,36,37,51,52,53,54] or re-analysed [55] studies of 16S rRNA sequencing data collected from saliva, swab, oral rinse and tissues. Critically, these systematic reviews and meta-analyses have relied on extracting the reported post-analysis microbiome data rather than re-analysis of raw datasets. This neglects important confounders including data pre-processing, sequencing depth [56,57], inter-patient variations [41], amplification primer biasness [58], and sequencing techniques utilised in individual studies. Additionally, most meta-analyses studies consolidated different oral sampling types as one cohort, even though different oral samplings can exhibit distinct microbial communities [23,39,40,59]. Re-analysis of 16S rRNA oral microbiome data comparing healthy to HNC samples while ignoring the oral sampling utilised [55], may have issues with the overall interpretation of results. Hence, in this study, we analysed how different sampling types (saliva, oral rinse) can affect the HNC oral microbiome. Due to the diverse sampling sites reported with swab collection [7,36,37,38], we chose to focus on saliva and oral rinse sampling. The goal of this meta-analysis was to identify if there were differences in 16S rRNA microbial diversity and taxa level abundance between HNC, premalignant and healthy individuals in multiple cohorts of saliva and oral rinse samples, while identifying potential confounders that may influence analyses. Moreover, we investigated if these differences were consistent across saliva and oral rinse sampling methods. Lastly, we explored the potential of 16S rRNA sequencing of saliva and oral rinse as a diagnostic tool for HNC.
2. Materials and Methods
This study was performed according to the Preferred Reporting Items for Systematic Reviews and Meta-Analyses (PRISMA) Statement (Appendix A) [60].
2.1. Selection Criteria, Database Search and Study design
The inclusion criteria for this study were: 1) presence of metadata to distinguish sample and subject types, 2) Illumina short-read amplicon 16S rRNA sequencing, 3) saliva or oral rinse. The exclusion criteria for this study were: 1) samples without metadata. 2) other non-Illumina short-read 16S rRNA sequencing technologies. 3) any other sample types that were not saliva and oral rinse, 4) any samples with treatment and/or antibiotic usage. Database search and extractions were performed on 1 February 2024 by three independent reviewers and datasets published after this date were not included (Table S1). Risk of bias (RoB) was assessed using RoB2 assessment spreadsheet (ROB2_IRPG_beta_v9) and search terms are provided in Table S1 [61].
2.2. Downloading, Pre-Processing and Metadata Collection of 16S rRNA Datasets
All published raw 16S rRNA sequencing datasets were downloaded from NCBI SRA using SRA Toolkit [62]. Metadata for all samples were obtained from NCBI SRA or directly defined based on information provided in the publications. Primers and adapters were removed using cutadapt plugin in QIIME2, followed by denoising using QIIME2 plugin, Divisive Amplicon Denoising Algorithm 2 (DADA2) [63,64,65]. Sequences from different studies were then merged into a table before classification using QIIME2 and SILVA reference database (version silva-138–99-nb-classifier) [64]. Pre-processing of raw microbial data were previously described [43]. Briefly, bacteria amplicon sequence variants (ASVs) were agglomerated into genus level and low abundances ASVs were filtered using PreFL from PLSDA-batch (keep.spl = 10, keep.var = 0.01), and samples with less than 1000 reads were also removed using phyloseq [66,67]. The total of remaining samples per study is detailed in Table S2. Overall, this study included 1423 samples collected using saliva (HNC = 508, healthy = 407, premalignant = 172) or oral rinse (HNC = 206, healthy = 130), as shown in Table S2.
2.3. Evaluation and Correcting for Batch Effects
To assess for batch-effects and effectiveness after batch correction, we used principal coordinate analysis (PCoA) density plot of Bray-Curtis distance, Permutational Multivariate Analysis of Variance (PERMANOVA) on both adjusted and unadjusted rarefied relative abundance [68]. For compositional data analysis (CoDA), the data were normalised using the central log ratio (CLR), and Euclidean distance of CLR-abundance was used for PCoA. Additional assessments included heatmap clustering analysis, alignment score, partial redundancy analysis (pRDA), and R2 assessment, as described previously [43,66].
Batch-adjustment was performed using MMUPHin (Meta-Analysis Methods with a Uniform Pipeline for Heterogeneity in microbiome studies) in R, to adjust for BioProject [68]. MMUPHin was performed only on V3V4 and V4 saliva, as other datasets did not require batch adjustment (Appendix B). Batch adjustment and evaluation are fully described in Appendix B. Subsequent analyses were performed on each primer set separately (Appendix B).
2.4. Alpha and Beta Diversity Analysis at the Genus Level
Short-read Illumina 16S rRNA sequencing is largely limited to genus level resolution, therefore alpha and beta-diversities analyses were performed at the genus level [69]. Conventional and compositional methods of analysis were performed for alpha- and beta-diversities, as described previously [43,56,70,71,72]. Briefly, samples were rarefied using rarefy_even_depth in phyloseq to sample with least depth (read = 1000) [67]. Alpha-diversity was measured using Shannon index, using microeco R package [73]. Differences in alpha-diversities between HNC, healthy, and premalignant samples within studies, were tested using Kruskal-Wallis test with Dunn’s multiple comparison and Mann-Whitney test.
For beta diversity analysis, rarefied relative abundance of all genera were ordinated using Bray-Curtis distance and visualised with a PCoA using phyloseq v1.46 and ggpubr v0.6 R packages [67]. PERMANOVA was used to determine differences in beta diversity between HNC, healthy, and premalignant groups [74], with dispersion (variances) assessed using the betadisper test from vegan v2.6 [74]. Since PERMANOVA assumes homogeneity of dispersion among groups, the betadisper test checked for differences in dispersion; significant differences in dispersion could influence PERMANOVA results. All tests were performed with 999 permutations. To address the compositionality in the microbiome data, CLR-transformation (offset = 0.5) was used to obtain scale-invariant values, mitigating discrepancies in library sizes [56]. The CLR abundance data were then analysed using Euclidean distances and plotted with a PCoA [67].
2.5. Differential Abundance Analysis between HNC, Healthy and Premalignant Oral Samples
Mean relative abundance at both the phylum and genera level were calculated separately for saliva and oral rinse samples using the phyloseq package. Further differential abundance analyses at the genus level were performed using the linear regression framework for differential abundance analysis (LinDA) with the microeco R package [73,75]. LinDA fits a linear model to CLR-transformed abundance data, correcting for compositional effects and biases [75]. We performed LinDA to compare HNC samples to healthy or premalignant oral samples. Analysis at the phylum level was not performed with LinDA, as it is not recommended with a small number of features [75]. P-values were adjusted using Bonferroni correction.
2.6. Multivariate Sparse Partial Least Squares Discriminant Analysis (sPLS-DA) Classification to Discriminate Oral Sampling
To test if saliva and oral rinse sampling can be discriminated, we applied sparse partial least squares discriminant analysis (sPLS-DA) using the mixOmics R package [76]. For the ‘tune.splsda’ function, we used M-folds = 10 and cross-validation = 100 to determine the optimal number of variable and components. The area under curve of the receiver operating characteristics (AUROC) curve was calculated using mixOmics. The AUC value served as a quantification of the discriminatory potential between sample types. A higher AUC value, closer to 1, signified a test approaching perfection in its ability to distinguish between the samples. Heatmaps were generated to visualise the variables that contribute to sample differentiation.
3. Results
3.1. Study Characteristics and Dataset
Our search strategy identified a total of 664 articles from PubMed, 1151 from EMBASE and 730 from Scopus. After removing duplicates, non-articles, and irrelevant articles, 123 articles remained (Figure 1). Following the application of our inclusion criteria, a further 107 articles were excluded, leaving 16 unique project accessions from 16 published articles (Figure 1, Table S2). After pre-processing and filtering, the final dataset included 336 oral rinse samples and 1087 saliva samples, with primer sets V3V4 (n = 645), V4 (n = 740) and V4-V5 (n = 38) (Table S2). The RoB2 assessments were performed on these selected studies and showed the overall low risk of bias (Table S1).
3.2. Patient Type, 16s rRNA Amplification Primer Sets, and Study Batch Affects Overall Microbial Composition of Saliva and Oral Rinse Samples
We first evaluated the effect of primer set usage and study batch (described in the supplementary material) [43,66], since specific primer regions and study batches can impact the overall microbial composition in 16S rRNA sequencing [58,68]. For saliva samples, both batch and primer effects persisted after applying MMUPHin adjustment, albeit with minor improvements (Figures S2 and S3). To minimize additional bias from primer sets [57,77,78], we analysed each primer sets separately for subsequent analysis for saliva samples. Overall, while not completely removing batch effects, MMUPHin adjustment reduced batch effects in saliva samples (Figures S4–S9). Subsequent analyses were based on the MMUPHin adjusted datasets.
Three studies using oral rinse samples (n = 336) and V3V4 primers were conducted by the same research group [27,29,30]. No batch effects were observed for these V3V4 oral rinse samples, likely due to similar sample processing, collection and patient demographics (Figure S10). Thus, MMUPHin adjustment was not applied for oral rinse samples.
3.3. HNC Alpha Diversity Differs between Saliva and Oral Rinse
To determine differences in alpha-diversity between patient type, Shannon index was measured for saliva and oral rinse independently (Figure 2, Figure S11 and Figure S12). Pooled and per-batch alpha diversities were compared between patient types for each primer set (Figure 2, Figure S11 and Figure S12). Overall, alpha diversity was different between HNC and healthy samples, however this difference was inconsistent between saliva and oral rinse. For saliva samples, alpha diversity was higher in healthy donors (median Shannon index: V3V4 = 2.223, V4 = 1.995, V4V5 = 2.161) compared to HNC patients (median Shannon index: V3V4 = 1.640, V4 = 1.883, V4V5 = 1.914) (Figures 2a,b and S11, Table S3). This finding was consistent in 8 out of 9 studies comparing HNC and healthy saliva samples, although some studies did not achieve statistical significance (Figure S11, Table S3). In contrast, oral rinse samples from HNC patients (median Shannon index: V3V4 = 1.832) displayed significantly higher alpha diversity to healthy donors (median Shannon index: V3V4 = 0.864) (Figure 2c, Table S4). All single studies comparing HNC and healthy oral rinse samples showed a similar trend to the pooled data (Figure S12). In this study, oral microbiome data from premalignant HNC patients were only available in saliva samples. Saliva from HNC had lower alpha diversity (median difference in Shannon index: V3V4 = -0.6688, V4 = -0.2824) compared to pre-malignant HNC saliva (Figure 2, Figure S2) with 2 out of 3 studies displaying a same trend (Figure S11a,b). Overall, the change in alpha diversity between HNC and healthy samples varied between saliva and oral rinse, irrespective of primer set used.
3.4. Saliva or Oral Rinse from HNC, Premalignant and Healthy Donors Have Similar Beta Diversities at the Genus Level
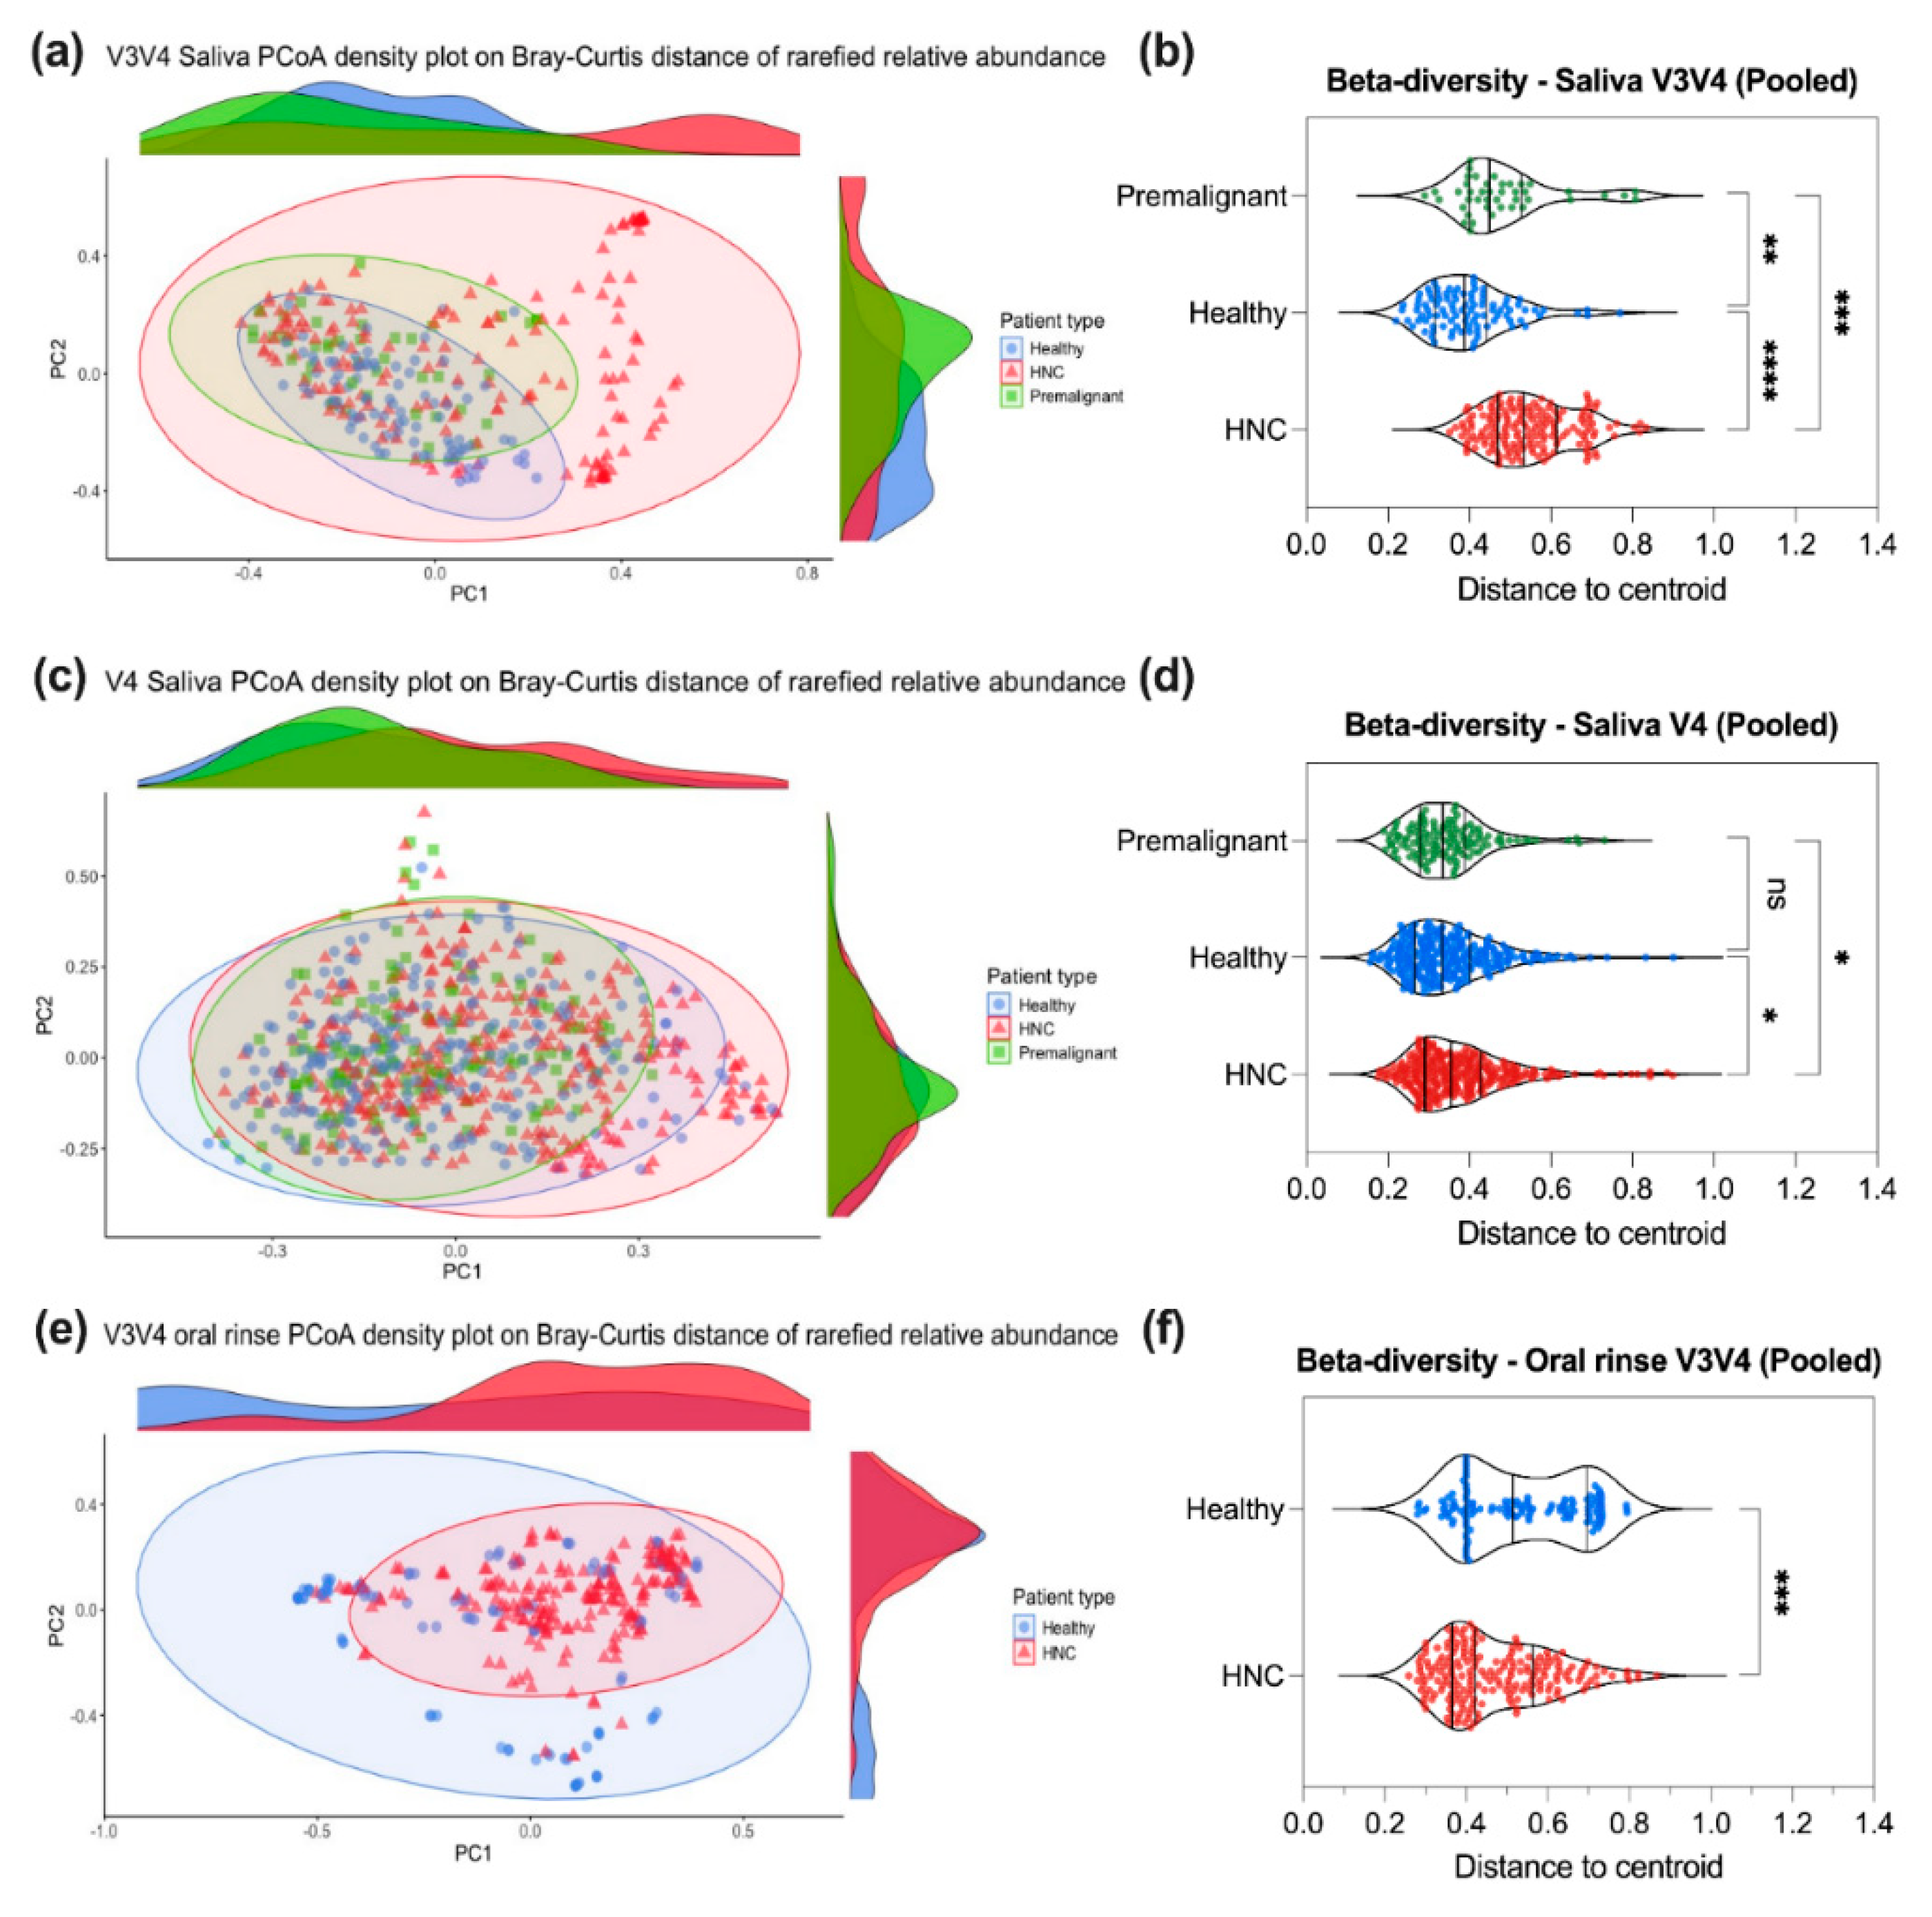
To assess differences in overall microbial composition (beta diversity) between patient types for saliva or oral rinse, we used PCoA density plot of Bray-Curtis distance on rarefied relative abundance (Figure 3), PCoA plot of Euclidean distance on CLR-abundance (Figure S14), PERMANOVA test, and differences in distance to centroid. Additionally, dispersion test of distance to centroid for each patient type group were tested using permutest to determine if differences in dispersions exist between groups.
In saliva samples, minimal distinction between patient types was observed in the PCoA density plot based on Bray-Curtis distance with rarefied relative abundance (Figure 3a,c and Figure S13a,c). Beta diversity, measured as the distance to the group centroid, was calculated for each sample using Bray-Curtis distance. Generally, saliva samples from HNC patients (median beta diversity index: V3V4 = 0.533, V4 = 0.355, V4V5 = n.s.) showed moderately increased beta diversity index compared to healthy (median beta diversity index: V3V4 = 0.388, V4 = 0.332, V4V5 = n.s.) and premalignant donors (median beta diversity index: V3V4 = 0.449, V4 = 0.334, V4V5 = NA) (Figure 3b,d and Figure S13b,d). Furthermore, a PERMANOVA test showed that the beta diversity of saliva samples was significantly different (p < 0.05) between HNC and healthy (PERMANOVA R2: V3V4 = 0.0584, V4 = 0.0175, V4V5 = 0.0779), as well as between HNC and premalignant saliva samples (PERMANOVA R2: V3V4 = 0.0305, V4 = 0.0238) (Table S5). However, using betadisper [74], we observed significant differences (p < 0.05) in dispersion between HNC and healthy, as well as between HNC and premalignant samples, indicating that differences in beta diversity were predominantly driven by difference in dispersion among groups rather than differences in their spatial medians (Table S5). Even with compositional approach (Euclidean distance of CLR-abundance) [56], we observed similar findings whereby beta diversity of saliva samples was largely consistent regardless of patient type (Figure S14, Table S6).
For oral rinse samples, the microbial composition of HNC and healthy samples was largely similar (Figure 3e). A slightly greater distinction between HNC and healthy oral samples was observed in Euclidean distance PCoA density plot based on on CLR-abundance (Figure S17a). Although the beta diversity of HNC oral rinse samples (median beta diversity index = 0.422) oral was lower than that of healthy samples (median beta diversity index = 0.515) (PERMANOVA: R2 = 0.0797, p < 0.001) (Figure 3f, Table S7), significant differences in dispersion (p < 0.001) were also observed between HNC and healthy samples (Table S7). Similar results were found in oral rinse samples using Euclidean distance of CLR-abundance (Figure S15, Table S8). Taken together, we found that beta diversity was largely similar across different donors, regardless of oral sampling technique. It is likely that any differences observed is primarily driven by the variability within the patient groups (HNC, premalignant, healthy) itself.
Figure 3.
Comparison of beta diversity between HNC, premalignant and healthy patient at the genus level. Based on conventional analysis method, raw abundance counts were rarefied and converted to relative abundance for (a) V3V4 saliva, (c) V4 saliva and (e) V3V4 oral rinse PCoA density plot on Bray-Curtis distance. Beta diversity for each sample was calculated as distance to centroid for each patient type for (b) V3V4 saliva, (d) V4 saliva and (f) V3V4 oral rinse. Kruskal-Wallis test with Dunn’s multiple comparison or Mann-Whitney test were performed to test for differences in beta diversity. ****p < 0.0001, ***p < 0.001, **p < 0.01, *p < 0.05, ns – not significant.
3.5. Differentially Abundant Genera between HNC and Healthy Oral Samples
The five most commonly detected phyla across all samples were Firmicutes, Bacteroidota, Fusobacteriota, Proteobacteria, and Actinobacteriota (Figures 4a,c and S16a, and Table 1) consistent with a previous report [41]. However, oral rinse and saliva samples captured slightly different microbial communities. Oral rinse samples has a higher abundance of Bacteroides and a lower abundance of Firmicutes compared to saliva samples (Figures 4a,c and S16a, and Table 1). At the genus level, Streptococcus, Neisseria, Prevotella, Porphyromonas, Veillonella, Fusobacterium, Rothia and Treponema were among the most prevalent across all saliva and oral rinse samples (Figures 4d,f and S16b, Tables 1 and S9a). Notable differences in relative abundance were also observed between sample type and primer sets for these genera (Figures 4d,f and S16b, Tables 1 and S9a). For instance, Streptococcus was detected at higher abundance using V4 or V4V5 primers than V3V4 primers in saliva samples, while the opposite trend was observed for Prevotella, with higher levels detected using V3V4 primers compared to V4 or V4V5 in saliva samples (Table S9a). Together, these finding suggest that the choice of primer sets, and oral sampling methods can significantly influence the detected microbial community, impacting the overall interpretation of the results.
We conducted differential abundance analysis using LinDA to compare difference between HNC, healthy and premalignant saliva and oral rinse samples (Figure 4g–k, Table S10) [75]. Similar to the beta diversity analysis, HNC saliva samples were more similar to healthy saliva when using V4 primers, with only seven bacterial genera showing significant differences (Figure 4i). In contrast, the V3V4 primers identified 20 bacterial genera that were significantly different between HNC and healthy saliva samples (Figure 4g). Both V3V4 and V4 primer sets consistently identified Neisseria (Log2FC: V3V4 = -3.48, V4 = -1.44), Leptotrichia (Log2FC: V3V4 = -2.76, V4 = -1.33) and Megasphaera (Log2FC: V3V4 = -1.86, V4 = -1.33) as enriched in healthy saliva, while Mycoplasma (Log2FC: V3V4 = 1.94, V4 = 0.821) was enriched in HNC saliva (Figure 4g,i, Table S10a). No significant differences were observed between HNC and healthy saliva when using V4V5 primers (Figure S18e, Table S10a). Critically, the data obtained with V4V5 primers were inconsistent to those generated using V3V4 and V4 primers (Table 10a). Of note, only one study reported the use of V4V5 primers. Fusobacterium, a cancer-associated microbe, was enriched in HNC saliva compared to healthy saliva only when using V3V4 primers (Log2FC = 3.83, p < 0.05), but not when using V4 primers (Log2FC = -0.48) or V4V5 (Log2FC = -1.38). Additionally, although not statistically significant, we observed an enrichment of oral commensal bacteria (mean > 5%) such as Prevotella (Log2FC: V3V4 = -2.31, p < 0.05; V4 = -0.99, p > 0.05) and Veillonella (Log2FC: V3V4 = -3.74, p < 0.05; V4 = -0.95, p > 0.05) in HNC saliva samples when using both V3V4 and V4 primers (Table S10a). No significant differences were observed for Streptococcus when using either V3V4 or V4 primers (Table S10a).
Interestingly, oral rinse sampling detected fewer differentially abundant genera between HNC and healthy samples, when compared to saliva sampling using the V3V4 primers. In oral rinse samples, ten bacterial genera were significantly enriched in HNC samples compared to healthy samples (Figure 4k, Table S10). Notably, Streptococcus (Log2FC = 7.16), Capnocytophaga (Log2FC = 2.97), Fusobacterium (Log2FC = 4.02), and Gemella (Log2FC = 2.75) were among the top genera elevated in HNC oral rinse (Figure 4k, Table S10b). Additionally, Fusobacterium and TM7x were the only genera showing consistent directionality of abundance across both saliva and oral rinse samples, regardless of the primer set used (Table S10a,b). In contrast, genera such as Veillonella, Alloprevotella, and Campylobacter exhibited differing trends between saliva and oral rinse samples (Table S10a, S10b). These findings further underscore the influence of sampling technique on oral microbiome studies.
Premalignant saliva samples were only available in the studies that used the V3V4 and V4 primer sets, and these were compared to HNC saliva samples (Figure 4h,j, Table S10a). It is important to note that few premalignant samples datasets were available for analysis (V3V4: n = 43, 2 studies; V4: n = 129, 1 study), which limits the interpretation of the results. Nevertheless, when comparing HNC to premalignant saliva samples, Abiotrophia (Log2FC: V3V4 = 3.16, p < 0.05; V4 = 2.04, p < 0.05) was the only genus consistently enriched in HNC saliva (Figure 4h,j, Table S10a). Additionally, using the V4 primers, Streptoccocus (Log2FC = 1.81, mean abundance = 32.5%) was significantly enriched in HNC, while Neisseria (Log2FC = -1.58, mean abundance = 10.1%) was enriched in premalignant saliva (Figure 4h, Table S10a).
Figure 4.
Microbial relative abundance and differential abundance analysis in saliva and oral rinse samples. Mean relative abundance of (a) V3V4 saliva (b) V4 saliva, and (c) V3V4 oral rinse samples at the phylum level. Mean relative abundance of (d) V3V4 saliva (e) V4 saliva, and (f) V3V4 oral rinse samples at the genus level. Differential abundance analysis (LinDA) was performed to determine differences between (g, i, k) HNC to healthy and (h, j) HNC to premalignant samples for (g, h) V3V4 saliva, (i, j) V4 saliva, and (k) V3V4 oral rinse samples. P-values were adjusted using Bonferroni method.
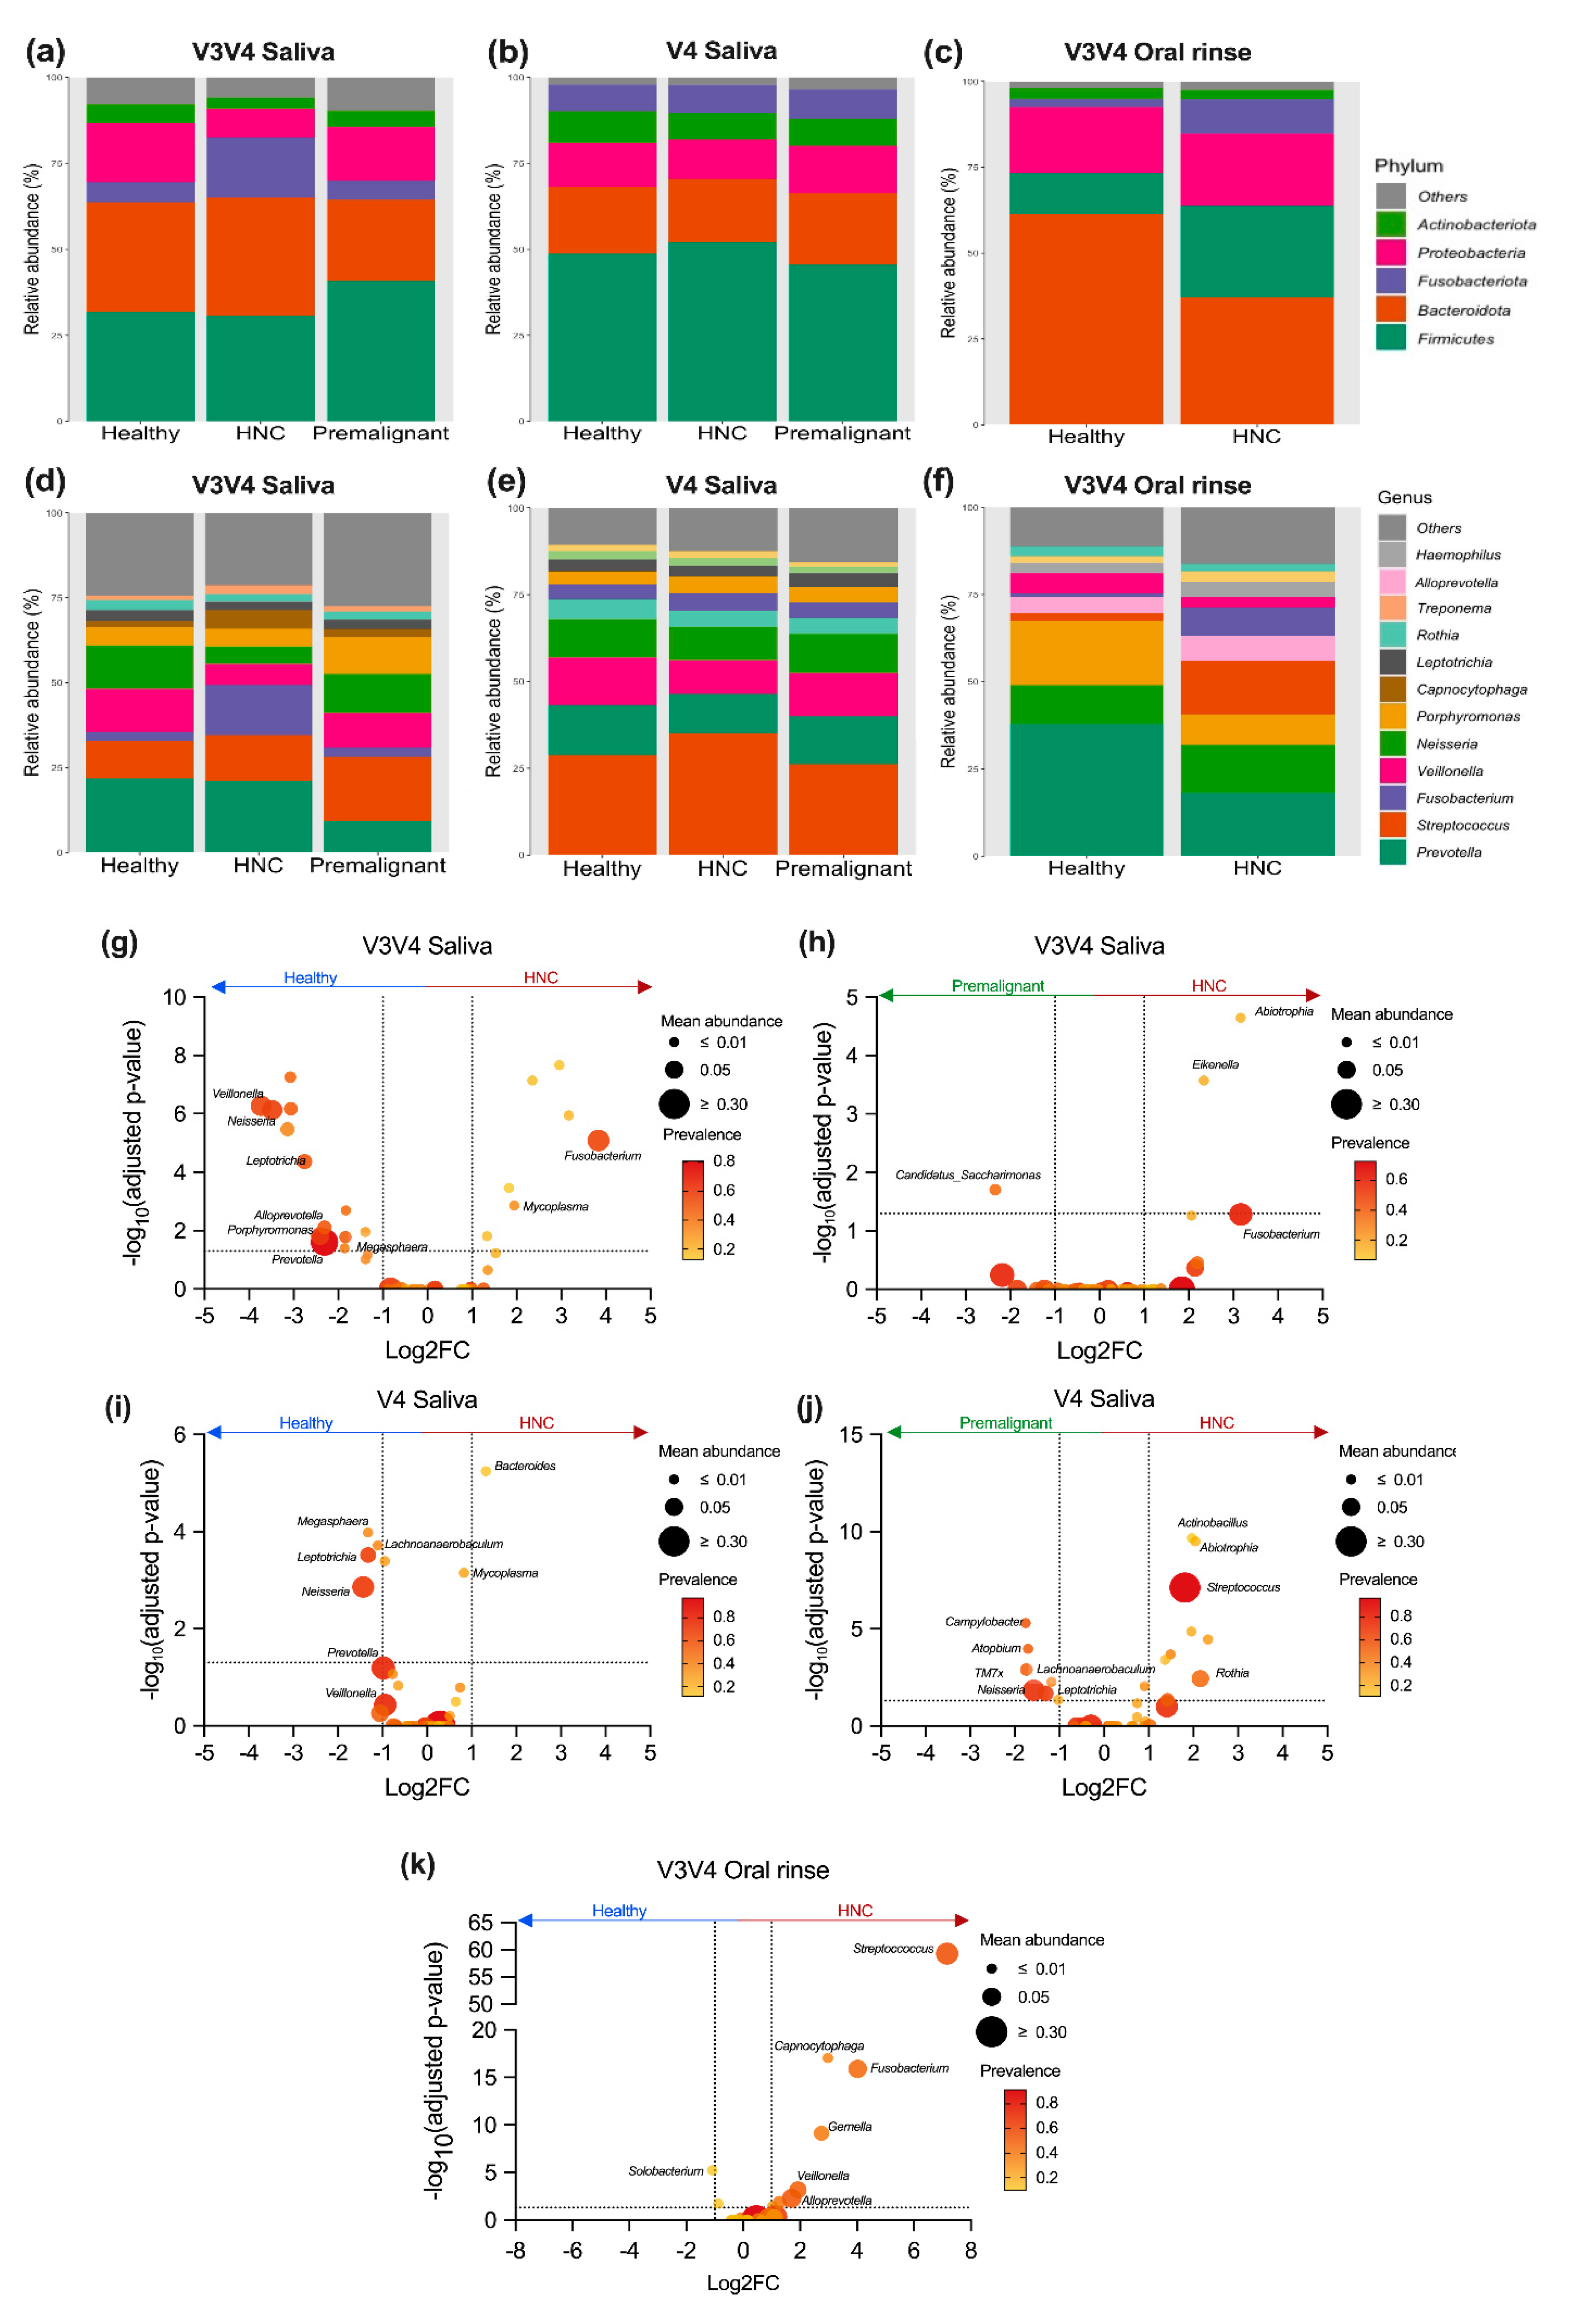

Table 1.
Mean relative abundance of core phylum and genera across saliva and oral rinse samples.
| Phylum |
Saliva Relative abundance (Mean ± SD) |
Oral rinse Relative abundance (Mean ± SD) |
| Firmicutes | V3V4 = 32.4 ± 23.4 % V4 = 49.7 ± 19.0 % V4V5 = 43.2 ± 14.5 % |
V3V4 = 20.9 ± 20.4 % |
| Bacteroidota | V3V4 = 32.2 ± 27.2 % V4 = 19.1 ± 14.3 % V4V5 = 33.0 ± 14.8 % |
V3V4 = 46.5 ± 29.5 % |
| Fusobacteriota | V3V4 = 12.2 ± 21.0 % V4 = 8.00 ± 9.01 % V4V5 = 2.93 ± 2.82 % |
V3V4 = 7.06 ± 11.3 % |
| Proteobacteria | V3V4 = 12.0 ± 16.0 % V4 = 12.4 ± 11.5 % V4V5 = 16.2 ± 13.8 % |
V3V4 = 20.3 ± 24.2 % |
| Actinobacteriota | V3V4 = 4.15 ± 7.78 % V4 = 8.32 ± 7.64 % V4V5 = 3.29 ± 3.46 % |
V3V4 = 2.90 ± 5.79 % |
| Genera |
Saliva Relative abundance (Mean ± SD) |
Oral rinse Relative abundance (Mean ± SD) |
| Streptococcus | V3V4 = 13.4 ± 17.4 % V4 = 31.1 ± 18.1 % V4V5 = 29.3 ± 16.2 % |
V3V4 = 10.3 ± 15.4% |
| Neisseria | V3V4 = 8.38 ± 13.8 % V4 = 10.5 ± 10.7 % V4V5 = 9.17 ± 7.65 % |
V3V4 = 12.7 ± 19.4 % |
| Prevotella | V3V4 = 19.6 ± 21.9 % V4 = 13.0 ± 12.5 % V4V5 = 13.1 ± 9.35 % |
V3V4 = 25.8 ± 28.1 % |
| Porphyromonas | V3V4 = 6.05 ± 13.4 % V4 = 4.40 ± 7.04 % V4V5 = 12.9 ± 9.89 % |
V3V4 = 12.5 ± 21.6 % |
| Veillonella | V3V4 = 8.78 ± 10.8 % V4 = 11.6 ± 11.5 % V4V5 = 4.84 ± 4.93 % |
V3V4 = 4.1 ± 9.2 % |
3.6. Classification of Oral Samples Based on sPLS-DA
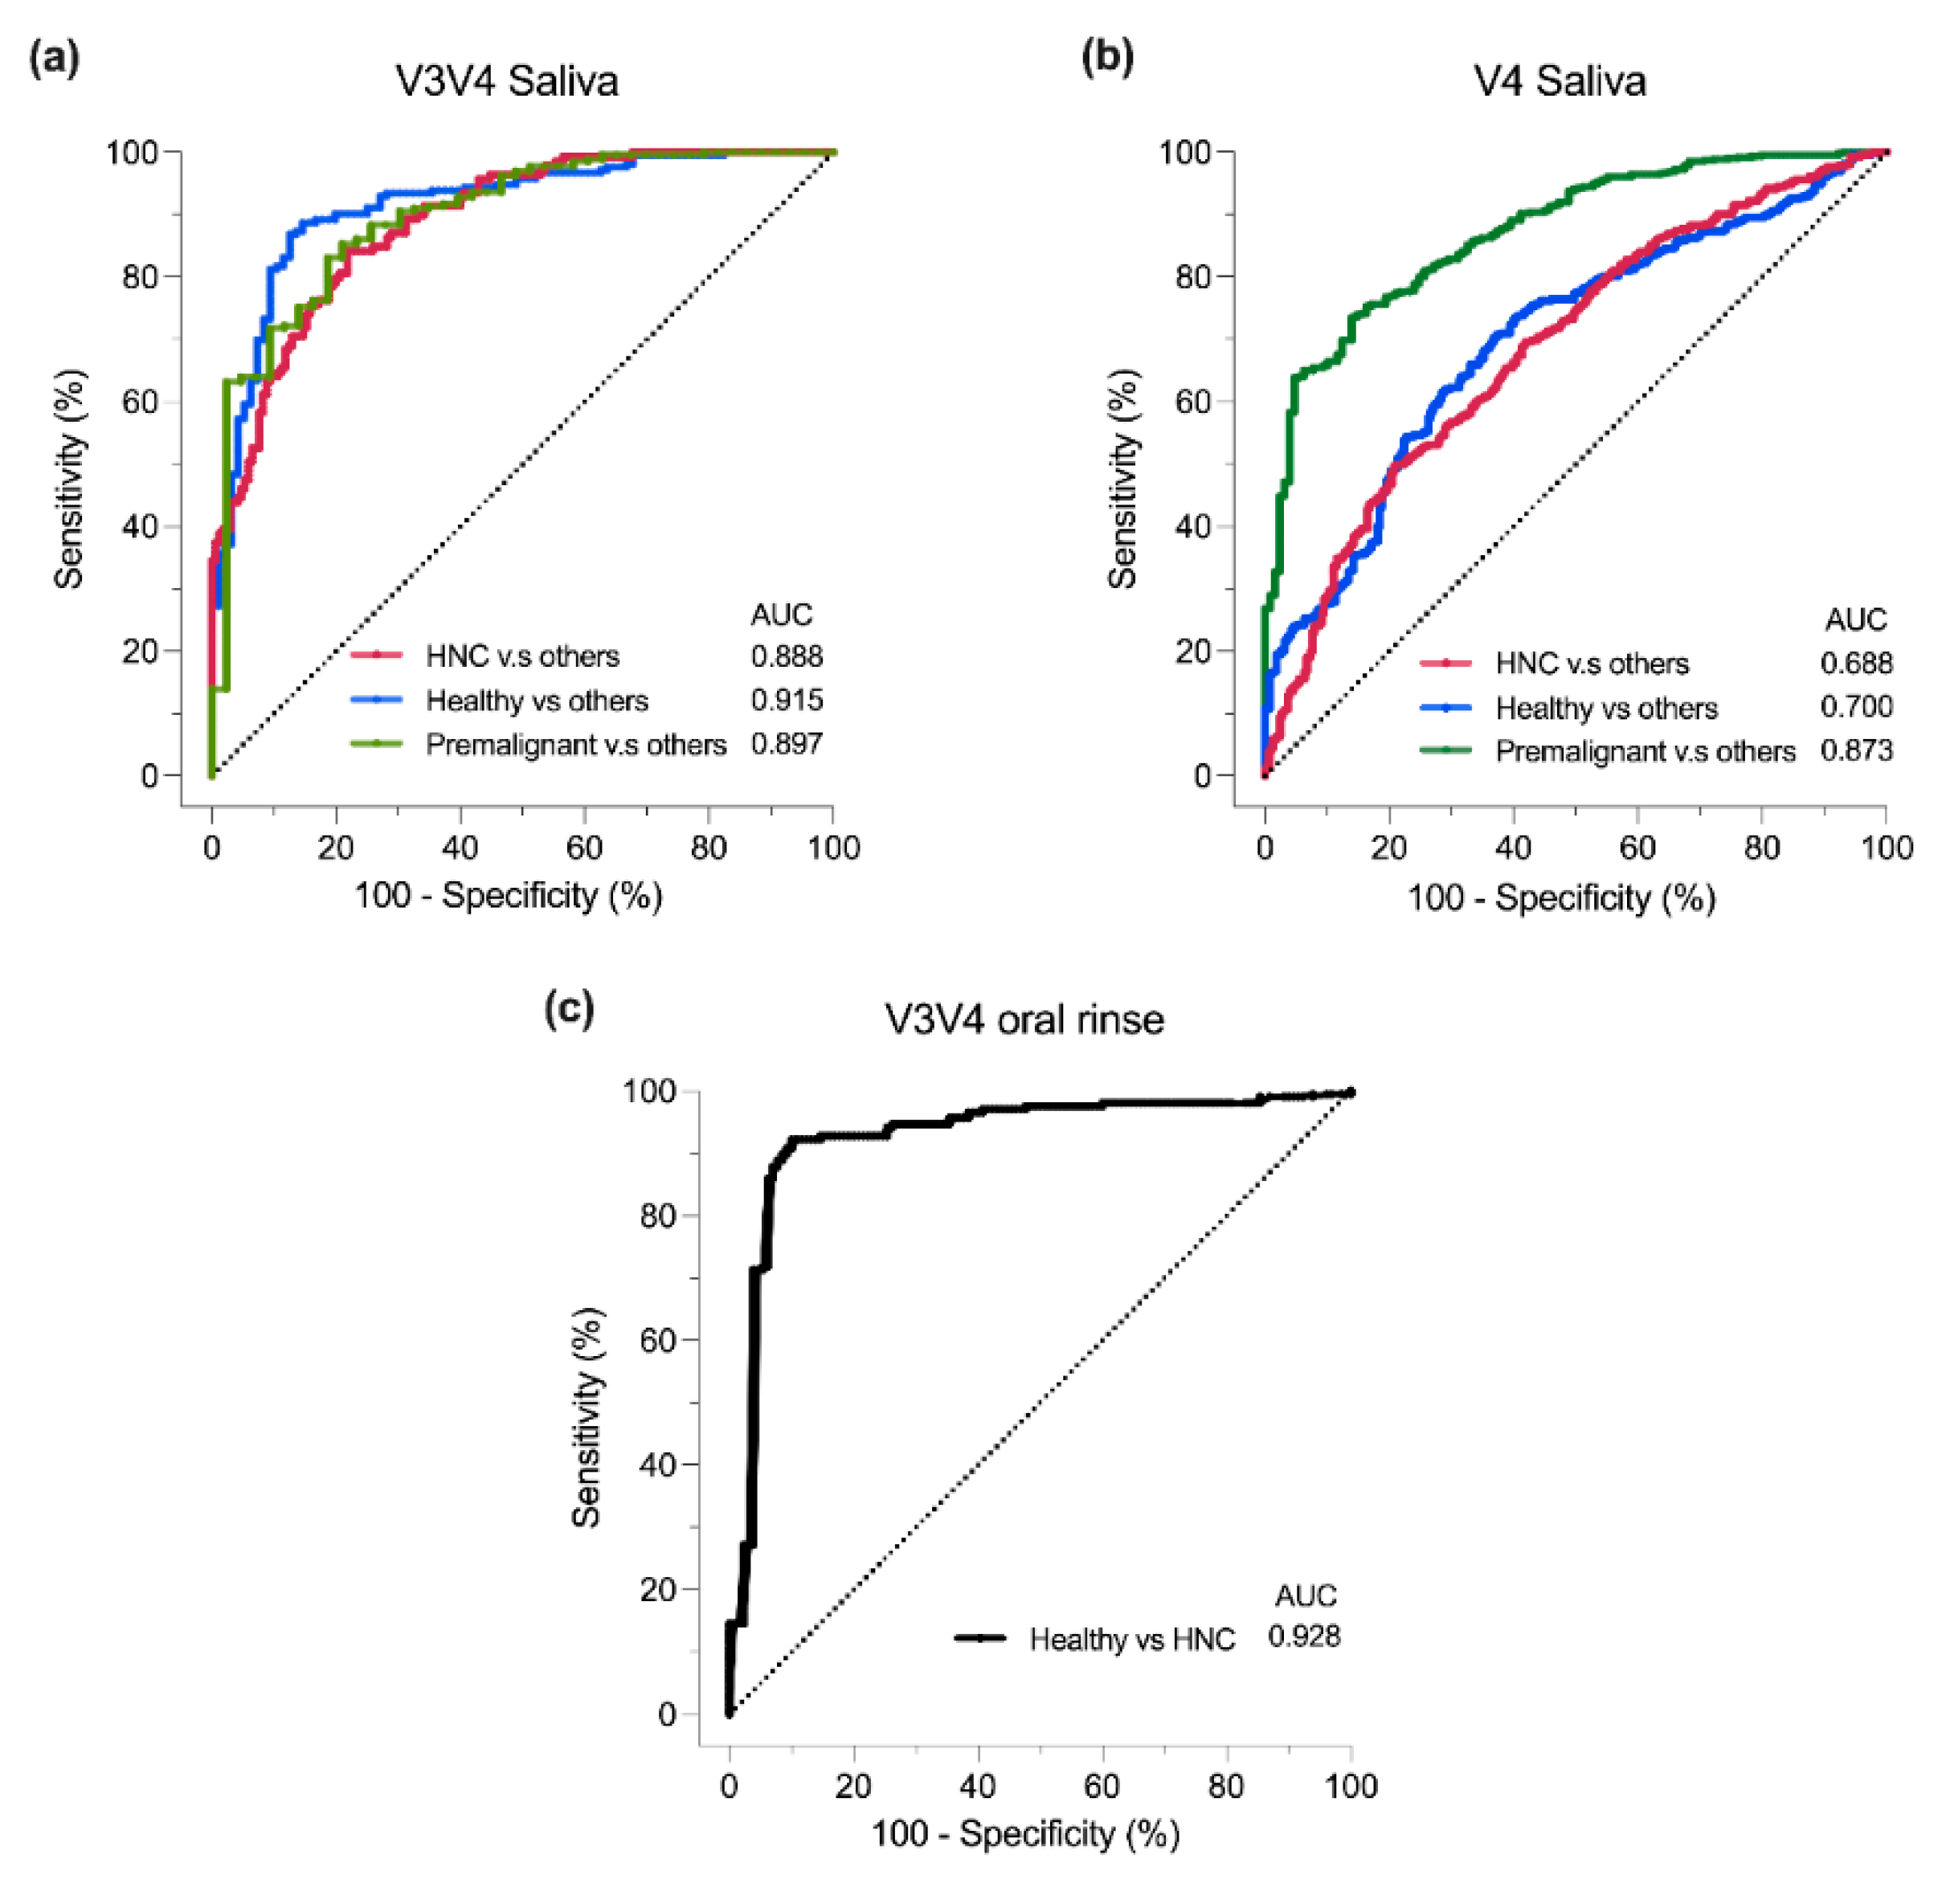
Lastly, the sPLS-DA multivariate model was employed to assess whether HNC samples could be discriminated from their healthy counterparts [79]. Due to the availability of data, the only analysis utilised the V3V4 saliva, V4 saliva, and V3V4 oral rinse datasets. The area under the curve (AUC) was calculated for each donor group versus the others, serving as a metric for the model’s ability to differentiate HNC from healthy and premalignant donors. Generally, an AUC of > 0.9, 0.8 to 0.9 and < 0.7 is a measure of excellent, good and poor classifier performance, respectively.
For saliva samples, the AUC values varied between the V3V4 and V4 primer sets. In V3V4 saliva samples, the AUC values for a donor group versus others were: HNC vs others = 0.888 (p < 0.05), healthy vs others = 0.915, and premalignant vs others = 0.897 (p < 0.05) (Figure 5a). In contrast, for V4 saliva samples, the AUC values were lower: HNC vs others = 0.688 (p < 0.05), healthy vs others = 0.700 (p < 0.05), and premalignant vs others = 0.873 (p < 0.05) (Figure 5b). This suggests that when using saliva samples, the V4 primers were less effective at distinguishing HNC patients from other donor types compared to the V3V4 primers. Of note, V3V4 saliva dataset had a smaller sample size (HNC = 170, healthy = 96, premalignant = 43) than V4 saliva samples (HNC = 329, healthy = 282, premalignant = 129) (chi-squared: p = 0.008), which may result in the differences in AUC. Additionally, AUC may also be affected by the remaining batch-effect after batch-correction. For V3V4 oral rinse samples, sPLS-DA was able to discriminate HNC and healthy samples (AUC = 0.928, p < 0.05) (Figure 5c). Of note, all the datasets obtained for oral rinse samples originated from the same group. Overall, we found that both saliva and oral rinse sampling exhibited ability to discriminate HNC from premalignant or healthy donors and that this was highly dependent on the primer sets used for 16s rRNA amplification.
4. Discussion
There is increasing evidence that oral microbiome dysbiosis may be linked to HNC. Identifying and characterising the key microbes that contribute to disease HNC pathobiology is an exciting avenue for the development of new diagnostics and treatment strategies. 16S rRNA microbiome sequencing has been the gold standard for microbiome analysis and several attempts have been made to determine if this technique, when applied to oral samplings, can be developed as a non-invasive cancer diagnostic test for HNCs [7,8,9,13,15,16,23,26,27,28,29,31,32,33,34,35,42,43,44,45,46,47]. However, current studies report inconsistent findings regarding oral bacterial abundance and diversities present in HNCs in relation to healthy and premalignant donors [7,8,9,13,15,16,23,26,27,28,29,31,32,33,34,35,42,43,44,45,46,47]. In this study, we conducted a meta-analysis of 14 studies and showed that primer set usage and oral sampling types can have a significant impact on the microbiome data and that considering these key factors can lead to better discrimination between HNC, healthy and premalignant samples.
We found that alpha-diversity (Shannon index) displayed a similar donor type dependent trend across saliva samples regardless of the 16s rRNA amplification primer set used. We found that HNC patients saliva displayed lower richness and evenness when compared to healthy donors corroborating previous reports [11,23,28,50,80,81,82,83,84,85]. HNC saliva displayed lower alpha-diversity when compared to premalignant samples. Importantly, the overall trend of alpha-diversity was consistent regardless of primer type used. Furthermore, we showed that HNC oral rinse contained greater alpha-diversity than healthy oral rinse samples [27,32,47]. Unlike a previous study which combined various oral sample types (swabs – undefined oral sites, tissues, saliva) and primer sets (V1-V3, V4, V1-V4, V3-V4, V4) in their re-analysis [55], we were able to identify statistically significant differences in alpha-diversity between HNC and other donor types by separating the analysis based on sampling method [11,23,28,50,80,81,82,83,84,85]. Different sample types, even from the same patient, will display some discrepancies in microbiome detected [86]. Oral microbes are site are site-specialist and bacteria species usually prefer a particular oral site and less likely to be found at other sites [23,39,40,87]. Hence, swab-based sampling is likely to be biased due to differences in the specific sites chosen for sampling. More importantly, it is expected that intratumoural bacteria present within the tissue samples will contain a different microbiome profile [21] due to differences in environment (i.e. oxygen level) [88]. Hence, it is recommended to take caution when interpreting a combination of sample types. Moreover, a direct comparison between saliva (OMNIgene ORAL kit or fixed in Saccomanno’s fixative) and oral rinse (Scope mouthwash or nonethanol mouth wash) showed different microbial profiles from the same healthy individuals [89], supporting our study. Hence, oral sampling is critical for interpreting HNC oral microbiome data [40] and it is recommended to only use one method when performing comparisons across subject groups [89].
For HNC studies [8,12,15,23,25,26,27,29,32,47,55,84,90,91], differences in beta diversity is usually measured by PERMANOVA, which holds an assumption of homogeneity of multivariate dispersion [92]. However, some of these studies did not report beta-dispersion. Our findings on beta diversity was in accordance to a previous meta-analysis [55], whereby scarce clustering was observed between patient types, albeit PERMANOVA analysis was statistically significant. Importantly, this study shows that the significant differences observed from PERMANOVA is primarily driven by differences in beta-dispersion of samples [92]. Based on these findings, beta-diversities for saliva and oral rinse are likely similar between HNC and healthy donors as previously reported [11,46,55].
Microbial community abundance is also affected by primer set usage and oral sampling technique [40,58]. Surprisingly, marked differences were already evident at the phylum level in V3V4 oral rinse samples. This effect was more apparent at the genus level, even for the highly abundant genera detected. Without paired saliva and oral rinse samples from the same patient to benchmark, one cannot exclude interpatient or study differences causing this phenomenon. At the genus level, we observed similarities to previous reports where Neisseria [8,14,81,83,93], Leptotrichia [81,83], and Megasphaera [25] were elevated in healthy saliva, while Mycoplasma [16] was elevated in HNC saliva. We also found contradictory results on the abundances for Neisseria [16,23,28,50] and Leptotrichia [16,23]. Importantly, we believe that our findings are more robust, because of our significantly larger sample sizes and the consistency of our results from both V3V4 and V4 primer set data. Although limited to small sample size in premalignant saliva samples, we also identified consistent elevation in Abiotrophia in HNC saliva, when compared to premalignant saliva samples.
In contrast to previous studies [25,81,83], our meta-analysis suggest that Streptococcus abundance is similar between HNC and healthy saliva samples. Streptococcus is enriched in HNC tumour tissues, with species-specific effects such as tumour growth promotion (S. mutans) or CD8+ T cell activation (S. anginosus, S. mitis, S. salivarius) [43]. Additionally, Neisseria species N. flavescens and N. sicca can induce HNC necroptosis and pyroptosis in vitro and in vivo respectively [94,95]. However, N. sicca can also suppress tumour inflammation by downregulating NF-kB and IL-6 [94]. This highlights the complexity of the oral microbiome, the limitations of genera level identification, and the need for higher taxonomical resolution for subsequent studies on the oral microbiome’s impact to HNC disease progression [72,96].
For V3V4 oral rinse samples, there were a total of 10 genera significantly elevated in HNC patients. When compared to V3V4 saliva samples, Fusobacterium and TM7x were the only genera that was consistent across both sampling techniques, while contrary to this result Veillonella, Alloprevotella, and Campylobacter were lower in HNC saliva. The remaining 5 bacterial genera identified in oral rinse samples were not significantly different across donors in V3V4 saliva. Taken together with our alpha-diversity findings, we reveal that sampling technique is critical for oral microbiome analysis. The interpretation of oral microbiome studies including systematic reviews and meta-analyses that combine different sampling techniques should be viewed with this limitation in mind [38,53,55].
Finally, we used sPLS-DA model [76] to assess 16S rRNA sequencing oral microbiome profiling’s ability to classify different HNC disease states. We found varying discriminating potential between V3V4 and V4 saliva datasets, with the V3V4 saliva dataset being most similar to previous studies with AUCs within similar range in saliva (AUC = 0.63 – 0.95) and oral rinse (AUC = 0.62 – 0.98) samples [11,12,19,20,26,29,32,33,34,48,49,50]. Additionally, since all the oral rinse data originate from the same research group, more studies are required to determine if there are geographical differences that are currently not captured by this dataset.
This comprehensive study on saliva and oral rinse samples in HNC highlights the use of short-read 16S rRNA sequencing microbiome analysis as a potential clinical diagnostic. It is crucial to recognise the inherent limitations of this study. While MMUPHin batch correction was employed to alleviate batch effects, it is insufficient to eradicate batch effect completely. Most batch-correction tools are designed to mitigate or alleviate technical variations rather than being modelled particularly to specific sources (i.e. differences in extraction protocols, primers, amplicon regions amplified) [57,68,78]. Moreover, batch effects can give rise to misleading interpretations in machine learning models [97]. Interpretability of machine learning (ML) models, which functions as a “black box”, remains a key limitation due to the lack of clear biological understanding of features [97]. Thus, incorporating prior knowledge on features into current models may address these issues [97]. Furthermore, we cannot rule out that batch effects may reflect geographical differences, which include lifestyle factors such as diet which is known to affect oral microbial diversity [41]. Additionally, this study may be improved by increasing the sample size. This may be achieved by including all publicly available oral samples such as swabs and excluded saliva or oral rinse samples, to provide a larger cohort and range of sample types. However, limited available metadata in the excluded studies such as the specific site of swab taken, and treatment (therapeutic and antibiotic usage) will skew overall interpretations if included. In addition, we do not have full clinical metadata such as TNM staging which can provide better insights to whether certain microbiome profiles may have discriminatory and prognostic potential[32]. For instance, Fusobacterium periodonticium, Parvimonas micra, Streptococcus constellatus, and Filifactor alocis showed good discriminatory potential (AUC > 0.8) for stage 4 oral squamous cell carcinoma [32].
Conventionally, bacterial 16S rRNA sequencing is performed by amplifying a particular variable region of 16S rRNA gene (V3-V4, V4, V4-V5, V6-V8 regions), using short-read sequencing technologies [58]. As shown in this study, differences in 16S rRNA region and primer amplification bias can skew the overall microbial community leading to misinterpretation of the underlying biology [58]. Moreover, short-read 16S rRNA sequencing is limited to genus level resolution due to the 16S rRNA gene coverage [43,72,96]. With the advancement in long-read sequencing technologies, one option is to sequence the whole 16S rRNA gene which can provide species level taxonomical coverage, while minimising primer bias if optimised and benchmarked well [72,96]. Alternatively, metagenomics, a more costly approach, can be used to avoid amplification and primer biasness, while providing microbial genome level resolution if sequenced with ample depth [43,72,96]. Currently, HNC is commonly diagnosed after the tumour has significantly progressed necessitating the need of cost-effective, accurate, and rapid diagnostic tools for HNCs [98]. Virome’s CancerDetect® Oral & Throat kit is the only commercial non FDA-approved saliva based oral and oropharyngeal cancer detection kit available and is based on profiling the microbial transcriptome [98].We propose that our study will aid in the development of microbial genomic based tools for HNC diagnostics.
5. Conclusions
In conclusion, this study highlights the current state of using oral microbial genomics as a diagnostic tool for HNCs. Oral sampling (saliva and oral rinse), and primer set usage in short-read 16S rRNA sequencing are key determinants in the data generated and are the likely cause of discrepancies observed in the field. Critically, the core microbiome and overall microbial composition of saliva and oral rinse samples were largely similar. As a diagnostic tool, using short-read 16S rRNA sequencing alone would be inadequate justifying the adoption of cutting-edge microbial screening methods such as long-read 16S rRNA sequencing or metagenomics.
Supplementary Materials
The following supporting information can be downloaded at: preprints.org, Figure S1: Workflow of study; Figure S2: PCoA density plot on Euclidean distance of CLR-abundance for all saliva; Figure S3: PCoA density plot on Bray-Curtis distance of rarefied relative abundance for all saliva; Figure S4: V3V4 saliva samples for unadjusted and after MMUPHin adjustment based on CLR-abundance; Figure S5: V3V4 saliva samples for unadjusted and after MMUPHin adjustment based on rarefied relative abundance; Figure S6: V4 saliva samples for unadjusted and after MMUPHin adjustment based on CLR-abundance; Figure S7: V4 saliva samples for unadjusted and after MMUPHin adjustment based on rarefied relative abundance; Figure S8: V4V5 saliva samples for unadjusted and after MMUPHin adjustment based on CLR-abundance; Figure S9: V4V5 saliva samples for unadjusted and after MMUPHin adjustment based on rarefied relative abundance; Figure S10: PCoA density plot on for V3V4 unadjusted oral rinse samples; Figure S11: Figure S11. Comparison of alpha-diversity per study for HNC, premalignant and healthy saliva samples; Figure S12: Comparison of alpha-diversity per study for HNC, premalignant and healthy oral rinse samples; Figure S13: Comparison of V4V5 saliva beta diversity between HNC, premalignant and healthy patient at the genus level; Figure S14: Comparison of saliva beta diversity between HNC, premalignant and healthy patient at the genus level based on CLR-abundance; Figure S15: Comparison of oral rinse beta diversity between HNC and healthy patient at the genus level based on CLR-abundance; Figure S16: Microbial relative abundance and differential abundance analysis for V4V5 saliva samples; Table S1: Risk of bias and search terms; Table S2: Samples information and study batch post filtering and processing; Table S3: Alpha diversity analysis statistics for saliva samples; Table S4: Alpha diversity analysis statistics for oral rinse samples; Table S5: Beta diversity analysis for saliva based on rarefied relative abundance; Table S6: Beta diversity analysis for saliva based on CLR-abundance; Table S7: Beta diversity analysis for oral rinse based on rarefied relative abundance; Table S8: Beta diversity analysis for oral rinse based on CLR-abundance; Table S9: Relative abundance for saliva and oral rinse; Table S10: Differential abundance analysis for saliva and oral rinse samples
Author Contributions
Conceptualization, K.Y. S.V and K.F; methodology, K.Y., F.M., and R.L.; formal analysis, K.Y.; investigation, K.Y., F.M., R.L.; resources, A.P., P.W., S.V.; data curation, K.Y., F.M., and R.L.; writing—original draft preparation, K.Y., E.S., S.V. and K.F; writing—review and editing, K.Y., E.S., K.F., S.V., A.P., P.W., and R.V.; visualization, K.Y.; supervision, K.F., S.V., A.P., P.W., R.V; funding acquisition, S.V., A.P., P.W. R.W, and K.F All authors have read and agreed to the published version of the manuscript.
Funding
This work is supported by an NHMRC investigator grant APP1196832 to P.W., a The Garnett Passe and Rodney Williams Senior Fellowship to S.V., a Ray and Shirl Norman Cancer Research Trust Project Grant to A.P, S.V, R.V and K.F and The University of Adelaide Postgraduate Research Scholarship to K.Y, F.M. and R.L.
Institutional Review Board Statement
Not applicable.
Informed Consent Statement
Not applicable.
Data Availability Statement
No new sequencing data were generated, and BioProject of all sequencing data can be found in supplementary document.
Acknowledgments
We would like to thank the previous study authors for uploading their datasets to NCBI and providing sufficient metadata for this work.
Conflicts of Interest
The authors declare no conflicts of interest.
Appendix A
Appendix A contains PRISM 2020 checklist
Appendix B
Appendix B describes batch adjustment and evaluation (Figure S2-S10).
References
- Peng, X., L. Cheng, Y. You, C. Tang, B. Ren, Y. Li, X. Xu and X. Zhou. “Oral microbiota in human systematic diseases.” International journal of oral science 14 (2022): 14.
- Nejman, D., I. Livyatan, G. Fuks, N. Gavert, Y. Zwang, L. T. Geller, A. Rotter-Maskowitz, R. Weiser, G. Mallel, E. Gigi, et al. “The human tumor microbiome is composed of tumor type-specific intracellular bacteria.” Science 368 (2020): 973-80. [CrossRef]
- Irfan, M., R. Z. R. Delgado and J. Frias-Lopez. “The oral microbiome and cancer.” Frontiers in immunology 11 (2020): 591088. [CrossRef]
- Sykes, E. A., N. Weisbrod, E. Rival, A. Haque, R. Fu and A. Eskander. “Methods, detection rates, and survival outcomes of screening for head and neck cancers: A systematic review.” JAMA Otolaryngology–Head & Neck Surgery 149 (2023): 1047-56. [CrossRef]
- Li, Q., Y. Tie, A. Alu, X. Ma and H. Shi. “Targeted therapy for head and neck cancer: Signaling pathways and clinical studies.” Signal Transduction and Targeted Therapy 8 (2023): 31. [CrossRef]
- Johnson, D. E., B. Burtness, C. R. Leemans, V. W. Y. Lui, J. E. Bauman and J. R. Grandis. “Head and neck squamous cell carcinoma.” Nature Reviews Disease Primers 6 (2020): 92. [CrossRef]
- Ting, H. S. L., Z. Chen and J. Y. K. Chan. “Systematic review on oral microbial dysbiosis and its clinical associations with head and neck squamous cell carcinoma.” Head Neck 45 (2023): 2120-35. [CrossRef]
- Wolf, A., C. Moissl-Eichinger, A. Perras, K. Koskinen, P. V. Tomazic and D. Thurnher. “The salivary microbiome as an indicator of carcinogenesis in patients with oropharyngeal squamous cell carcinoma: A pilot study.” Scientific Reports 7 (2017): 5867. [CrossRef]
- Kumpitsch, C., C. Moissl-Eichinger, J. Pock, D. Thurnher and A. Wolf. “Preliminary insights into the impact of primary radiochemotherapy on the salivary microbiome in head and neck squamous cell carcinoma.” Scientific Reports 10 (2020): 16582. [CrossRef]
- Du, Y., R. Feng, E. T. Chang, J. W. Debelius, L. Yin, M. Xu, T. Huang, X. Zhou, X. Xiao and Y. Li. “Influence of pre-treatment saliva microbial diversity and composition on nasopharyngeal carcinoma prognosis.” Frontiers in Cellular and Infection Microbiology 12 (2022): 831409. [CrossRef]
- Chen, M. Y., J. W. Chen, L. W. Wu, K. C. Huang, J. Y. Chen, W. S. Wu, W. F. Chiang, C. J. Shih, K. N. Tsai, W. T. Hsieh, et al. “Carcinogenesis of male oral submucous fibrosis alters salivary microbiomes.” J Dent Res 100 (2021): 397-405. [CrossRef]
- Chen, J.-W., J.-H. Wu, W.-F. Chiang, Y.-L. Chen, W.-S. Wu and L.-W. Wu. “Taxonomic and functional dysregulation in salivary microbiomes during oral carcinogenesis.” Frontiers in Cellular and Infection Microbiology 11 (2021): 663068. [CrossRef]
- Lee, W. H., H. M. Chen, S. F. Yang, C. Liang, C. Y. Peng, F. M. Lin, L. L. Tsai, B. C. Wu, C. H. Hsin, C. Y. Chuang, et al. “Bacterial alterations in salivary microbiota and their association in oral cancer.” Scientific Reports 7 (2017): 16540. [CrossRef]
- Zhou, X., Y. Hao, X. Peng, B. Li, Q. Han, B. Ren, M. Li, L. Li, Y. Li, G. Cheng, et al. “The clinical potential of oral microbiota as a screening tool for oral squamous cell carcinomas.” Front Cell Infect Microbiol 11 (2021): 728933. [CrossRef]
- Vesty, A., K. Gear, K. Biswas, F. J. Radcliff, M. W. Taylor and R. G. Douglas. “Microbial and inflammatory-based salivary biomarkers of head and neck squamous cell carcinoma.” Clin Exp Dent Res 4 (2018): 255-62. [CrossRef]
- Oyeyemi, B. F., U. S. Kaur, A. Paramraj, R. Tandon, A. Kumar and N. S. Bhavesh. “Microbiome analysis of saliva from oral squamous cell carcinoma (oscc) patients and tobacco abusers with potential biomarkers for oral cancer screening.” Heliyon 9 (2023). [CrossRef]
- Torralba, M. G., G. Aleti, W. Li, K. J. Moncera, Y. H. Lin, Y. Yu, M. M. Masternak, W. Golusinski, P. Golusinski, K. Lamperska, et al. “Oral microbial species and virulence factors associated with oral squamous cell carcinoma.” Microb Ecol 82 (2021): 1030-46. [CrossRef]
- Zakrzewski, M., O. M. Gannon, B. J. Panizza, N. A. Saunders and A. Antonsson. “Human papillomavirus infection and tumor microenvironment are associated with the microbiota in patients with oropharyngeal cancers-pilot study.” Head Neck 43 (2021): 3324-30. [CrossRef]
- Granato, D. C., L. X. Neves, L. D. Trino, C. M. Carnielli, A. F. Lopes, S. Yokoo, B. A. Pauletti, R. R. Domingues, J. O. Sa and G. Persinoti. “Meta-omics analysis indicates the saliva microbiome and its proteins associated with the prognosis of oral cancer patients.” Biochimica et Biophysica Acta (BBA)-proteins and proteomics 1869 (2021): 140659. [CrossRef]
- Hao, Y., Z. Zeng, X. Peng, P. Ai, Q. Han, B. Ren, M. Li, H. Wang, X. Zhou and X. Zhou. “The human oral–nasopharynx microbiome as a risk screening tool for nasopharyngeal carcinoma.” Frontiers in Cellular and Infection Microbiology 12 (2022): 1013920. [CrossRef]
- Zeng, B., J. Tan, G. Guo, Z. Li, L. Yang, X. Lao, D. Wang, J. Ma, S. Zhang and G. Liao. “The oral cancer microbiome contains tumor space–specific and clinicopathology-specific bacteria.” Frontiers in Cellular and Infection Microbiology 12 (2022): 942328. [CrossRef]
- Nie, F., L. Wang, Y. Huang, P. Yang, P. Gong, Q. Feng and C. Yang. “Characteristics of microbial distribution in different oral niches of oral squamous cell carcinoma.” Frontiers in Cellular and Infection Microbiology 12 (2022): 905653. [CrossRef]
- Pandey, D., M. Szczesniak, J. Maclean, H. C. H. Yim, F. Zhang, P. Graham, E. M. El-Omar and P. Wu. “Dysbiosis in head and neck cancer: Determining optimal sampling site for oral microbiome collection.” Pathogens 11 (2022): 1550. [CrossRef]
- Medeiros, M. C. d., S. The, E. Bellile, N. Russo, L. Schmitd, E. Danella, P. Singh, R. Banerjee, C. Bassis and G. R. Murphy III. “Salivary microbiome changes distinguish response to chemoradiotherapy in patients with oral cancer.” Microbiome 11 (2023): 268. [CrossRef]
- Mäkinen, A. I., V. Y. Pappalardo, M. J. Buijs, B. W. Brandt, A. A. Mäkitie, J. H. Meurman and E. Zaura. “Salivary microbiome profiles of oral cancer patients analyzed before and after treatment.” Microbiome 11 (2023): 171. [CrossRef]
- Chen, Z., P. Y. Wong, C. W. K. Ng, L. Lan, S. Fung, J. W. Li, L. Cai, P. Lei, Q. Mou, S. H. Wong, et al. “The intersection between oral microbiota, host gene methylation and patient outcomes in head and neck squamous cell carcinoma.” Cancers (Basel) 12 (2020). [CrossRef]
- Chan, J. Y. K., C. W. K. Ng, L. Lan, S. Fung, J. W. Li, L. Cai, P. Lei, Q. Mou, K. Meehan, E. H. L. Lau, et al. “Restoration of the oral microbiota after surgery for head and neck squamous cell carcinoma is associated with patient outcomes.” Front Oncol 11 (2021): 737843. [CrossRef]
- Sawant, S., J. Dugad, D. Parikh, S. Srinivasan and H. Singh. “Identification & correlation of bacterial diversity in oral cancer and long-term tobacco chewers- a case-control pilot study.” J Med Microbiol 70 (2021). [CrossRef]
- Zhu, H., H. C. Yip, M. K. Cheung, H. C. Chan, C. Ng, E. H. Lau, Z. W. Yeung, E. W. Wong, L. Leung and X. Qu. “Convergent dysbiosis of upper aerodigestive microbiota between patients with esophageal and oral cavity squamous cell carcinoma.” International Journal of Cancer 152 (2023): 1903-15. [CrossRef]
- Chen, Z., P. Y. Wong, C. W. K. Ng, L. Lan, S. Fung, J. W. Li, L. Cai, P. Lei, Q. Mou, S. H. Wong, et al. “The intersection between oral microbiota, host gene methylation and patient outcomes in head and neck squamous cell carcinoma.” Cancers 12 (2020): 3425. [CrossRef]
- Benjamin, W., K. Wang, K. Zarins, E. Bellile, F. Blostein and I. Argirion. Oral microbiome community composition in head and neck squamous cell carcinoma. Cancers (basel). 2023; 15 (9): 2549. [CrossRef]
- Yang, C.-Y., Y.-M. Yeh, H.-Y. Yu, C.-Y. Chin, C.-W. Hsu, H. Liu, P.-J. Huang, S.-N. Hu, C.-T. Liao and K.-P. Chang. “Oral microbiota community dynamics associated with oral squamous cell carcinoma staging.” Frontiers in microbiology 9 (2018): 862. [CrossRef]
- Lim, Y., N. Fukuma, M. Totsika, L. Kenny, M. Morrison and C. Punyadeera. “The performance of an oral microbiome biomarker panel in predicting oral cavity and oropharyngeal cancers.” Frontiers in Cellular and Infection Microbiology 8 (2018): 267. [CrossRef]
- Srivastava, A., S. Mishra, P. K. Garg, A. K. Dubey, S. Deo and D. Verma. “Comparative and analytical characterization of the oral bacteriome of smokeless tobacco users with oral squamous cell carcinoma.” Applied Microbiology and Biotechnology 106 (2022): 4115-28. [CrossRef]
- Shitozawa, Y., K. Haro, M. Ogawa, A. Miyawaki, M. Saito and K. Fukuda. “Differences in the microbiota of oral rinse, lesion, and normal site samples from patients with mucosal abnormalities on the tongue.” Scientific Reports 12 (2022): 16839. [CrossRef]
- Yu, X., Y. Shi, R. Yuan, Z. Chen, Q. Dong, L. Han, L. Wang and J. Zhou. “Microbial dysbiosis in oral squamous cell carcinoma: A systematic review and meta-analysis.” Heliyon 9 (2023). [CrossRef]
- Gopinath, D., R. K. Menon, M. Banerjee, R. S. Yuxiong, M. G. Botelho and N. W. Johnson. “Culture-independent studies on bacterial dysbiosis in oral and oropharyngeal squamous cell carcinoma: A systematic review.” Critical reviews in oncology/hematology 139 (2019): 31-40. [CrossRef]
- Bronzato, J. D., R. A. Bomfim, D. H. Edwards, D. Crouch, M. P. Hector and B. P. Gomes. “Detection of fusobacterium in oral and head and neck cancer samples: A systematic review and meta-analysis.” Archives of oral biology 112 (2020): 104669. [CrossRef]
- Baker, J. L., J. L. Mark Welch, K. M. Kauffman, J. S. McLean and X. He. “The oral microbiome: Diversity, biogeography and human health.” Nature Reviews Microbiology 22 (2024): 89-104.
- Caselli, E., C. Fabbri, M. D’Accolti, I. Soffritti, C. Bassi, S. Mazzacane and M. Franchi. “Defining the oral microbiome by whole-genome sequencing and resistome analysis: The complexity of the healthy picture.” BMC microbiology 20 (2020): 1-19. [CrossRef]
- Ruan, X., J. Luo, P. Zhang and K. Howell. “The salivary microbiome shows a high prevalence of core bacterial members yet variability across human populations.” npj Biofilms and Microbiomes 8 (2022): 85. [CrossRef]
- Takahashi, Y., J. Park, K. Hosomi, T. Yamada, A. Kobayashi, Y. Yamaguchi, S. Iketani, J. Kunisawa, K. Mizuguchi and N. Maeda. “Analysis of oral microbiota in japanese oral cancer patients using 16s rrna sequencing.” Journal of Oral Biosciences 61 (2019): 120-28. [CrossRef]
- Yeo, K., R. Li, F. Wu, G. Bouras, L. T. H. Mai, E. Smith, P. J. Wormald, R. Valentine, A. J. Psaltis, S. Vreugde, et al. “Identification of consensus head and neck cancer-associated microbiota signatures: A systematic review and meta-analysis of 16s rrna and the cancer microbiome atlas datasets.” J Med Microbiol 73 (2024). [CrossRef]
- Chan, J. Y. K., M. K. Cheung, L. Lan, C. Ng, E. H. L. Lau, Z. W. C. Yeung, E. W. Y. Wong, L. Leung, X. Qu, L. Cai, et al. “Characterization of oral microbiota in hpv and non-hpv head and neck squamous cell carcinoma and its association with patient outcomes.” Oral Oncol 135 (2022): 106245. [CrossRef]
- Neuzillet, C., M. Marchais, S. Vacher, M. Hilmi, A. Schnitzler, D. Meseure, R. Leclere, C. Lecerf, C. Dubot, E. Jeannot, et al. “Prognostic value of intratumoral fusobacterium nucleatum and association with immune-related gene expression in oral squamous cell carcinoma patients.” Scientific Reports 11 (2021): 7870. [CrossRef]
- Hayes, R. B., J. Ahn, X. Fan, B. A. Peters, Y. Ma, L. Yang, I. Agalliu, R. D. Burk, I. Ganly and M. P. Purdue. “Association of oral microbiome with risk for incident head and neck squamous cell cancer.” JAMA oncology 4 (2018): 358-65. [CrossRef]
- Shay, E., N. Sangwan, R. Padmanabhan, S. Lundy, B. Burkey and C. Eng. “Bacteriome and mycobiome and bacteriome-mycobiome interactions in head and neck squamous cell carcinoma.” Oncotarget 11 (2020): 2375. [CrossRef]
- Heng, W., W. Wang, T. Dai, P. Jiang, Y. Lu, R. Li, M. Zhang, R. Xie, Y. Zhou and M. Zhao. “Oral bacteriome and mycobiome across stages of oral carcinogenesis.” Microbiology spectrum 10 (2022): e02737-22. [CrossRef]
- Li, Y., X. Tan, X. Zhao, Z. Xu, W. Dai, W. Duan, S. Huang, E. Zhang, J. Liu and S. Zhang. “Composition and function of oral microbiota between gingival squamous cell carcinoma and periodontitis.” Oral Oncology 107 (2020): 104710. [CrossRef]
- Zuo, H. J., M. R. Fu, H. L. Zhao, X. W. Du, Z. Y. Hu, X. Y. Zhao, X. Q. Ji, X. Q. Feng, W. Zhumajiang, T. H. Zhou, et al. “Study on the salivary microbial alteration of men with head and neck cancer and its relationship with symptoms in southwest china.” Frontiers in Cellular and Infection Microbiology 10 (2020): 514943. [CrossRef]
- Peter, T. K., M. H. H. Withanage, C. L. Comnick, C. Pendleton, S. Dabdoub, S. Ganesan, D. Drake, J. Banas, X. J. Xie and E. Zeng. “Systematic review and meta-analysis of oral squamous cell carcinoma associated oral microbiome.” Front Microbiol 13 (2022): 968304. [CrossRef]
- Metsäniitty, M., S. Hasnat, T. Salo and A. Salem. “Oral microbiota-a new frontier in the pathogenesis and management of head and neck cancers.” Cancers (Basel) 14 (2021). [CrossRef]
- Su Mun, L., S. Wye Lum, G. Kong Yuiin Sze, C. Hock Yoong, K. Ching Yung, L. Kah Lok and D. Gopinath. “Association of microbiome with oral squamous cell carcinoma: A systematic review of the metagenomic studies.” Int J Environ Res Public Health 18 (2021). [CrossRef]
- Ramos, R. T., C. S. Sodré, P. M. G. R. de Sousa Rodrigues, A. M. P. da Silva, M. S. Fuly, H. F. Dos Santos, L. S. Gonçalves, D. de Carvalho Ferreira and M. G. Ribeiro. “High-throughput nucleotide sequencing for bacteriome studies in oral squamous cell carcinoma: A systematic review.” Oral and Maxillofacial Surgery 24 (2020): 387-401. [CrossRef]
- Delaney, C., C. L. R. Veena, M. C. Butcher, W. McLean, S. M. A. Shaban, C. J. Nile and G. Ramage. “Limitations of using 16s rrna microbiome sequencing to predict oral squamous cell carcinoma.” APMIS (2023). [CrossRef]
- Gloor, G. B., J. M. Macklaim, V. Pawlowsky-Glahn and J. J. Egozcue. “Microbiome datasets are compositional: And this is not optional.” Front Microbiol 8 (2017): 2224. [CrossRef]
- Nearing, J. T., A. M. Comeau and M. G. I. Langille. “Identifying biases and their potential solutions in human microbiome studies.” Microbiome 9 (2021): 113. [CrossRef]
- Johnson, J. S., D. J. Spakowicz, B. Y. Hong, L. M. Petersen, P. Demkowicz, L. Chen, S. R. Leopold, B. M. Hanson, H. O. Agresta, M. Gerstein, et al. “Evaluation of 16s rrna gene sequencing for species and strain-level microbiome analysis.” Nat Commun 10 (2019): 5029. [CrossRef]
- Wang, S., F. Song, H. Gu, X. Wei, K. Zhang, Y. Zhou and H. Luo. “Comparative evaluation of the salivary and buccal mucosal microbiota by 16s rrna sequencing for forensic investigations.” Frontiers in microbiology 13 (2022): 777882. [CrossRef]
- Page, M. J., J. E. McKenzie, P. M. Bossuyt, I. Boutron, T. C. Hoffmann, C. D. Mulrow, L. Shamseer, J. M. Tetzlaff, E. A. Akl, S. E. Brennan, et al. “The prisma 2020 statement: An updated guideline for reporting systematic reviews.” Rev Esp Cardiol (Engl Ed) 74 (2021): 790-99. Declaración PRISMA 2020: una guía actualizada para la publicación de revisiones sistemáticas. [CrossRef]
- Sterne, J. A., J. Savović, M. J. Page, R. G. Elbers, N. S. Blencowe, I. Boutron, C. J. Cates, H.-Y. Cheng, M. S. Corbett and S. M. Eldridge. “Rob 2: A revised tool for assessing risk of bias in randomised trials.” bmj 366 (2019).
- Team, S. T. D. “Sra toolkit.” (2020).
- Callahan, B. J., P. J. McMurdie, M. J. Rosen, A. W. Han, A. J. Johnson and S. P. Holmes. “Dada2: High-resolution sample inference from illumina amplicon data.” Nat Methods 13 (2016): 581-3. [CrossRef]
- Bolyen, E., J. R. Rideout, M. R. Dillon, N. A. Bokulich, C. C. Abnet, G. A. Al-Ghalith, H. Alexander, E. J. Alm, M. Arumugam, F. Asnicar, et al. “Reproducible, interactive, scalable and extensible microbiome data science using qiime 2.” Nat Biotechnol 37 (2019): 852-57. [CrossRef]
- Martin, M. “Cutadapt removes adapter sequences from high-throughput sequencing reads.” EMBnet. journal 17 (2011): 10-12. [CrossRef]
- Wang, Y. and L. C. KA. “Plsda-batch: A multivariate framework to correct for batch effects in microbiome data.” Brief Bioinform 24 (2023). [CrossRef]
- McMurdie, P. J. and S. Holmes. “Phyloseq: An r package for reproducible interactive analysis and graphics of microbiome census data.” PLoS ONE 8 (2013): e61217. [CrossRef]
- Ma, S., D. Shungin, H. Mallick, M. Schirmer, L. H. Nguyen, R. Kolde, E. Franzosa, H. Vlamakis, R. Xavier and C. Huttenhower. “Population structure discovery in meta-analyzed microbial communities and inflammatory bowel disease using mmuphin.” Genome biology 23 (2022): 208. [CrossRef]
- Curry, K. D., Q. Wang, M. G. Nute, A. Tyshaieva, E. Reeves, S. Soriano, Q. Wu, E. Graeber, P. Finzer, W. Mendling, et al. “Emu: Species-level microbial community profiling of full-length 16s rrna oxford nanopore sequencing data.” Nat Methods 19 (2022): 845-53. [CrossRef]
- Kodikara, S., S. Ellul and K.-A. Lê Cao. “Statistical challenges in longitudinal microbiome data analysis.” Briefings in Bioinformatics 23 (2022): bbac273. [CrossRef]
- Susin, A., Y. Wang, K.-A. Lê Cao and M. L. Calle. “Variable selection in microbiome compositional data analysis.” NAR Genomics and Bioinformatics 2 (2020): lqaa029. [CrossRef]
- Yeo, K., J. Connell, G. Bouras, E. Smith, W. Murphy, J. C. Hodge, S. Krishnan, P. J. Wormald, R. Valentine, A. J. Psaltis, et al. “A comparison between full-length 16s rrna oxford nanopore sequencing and illumina v3-v4 16s rrna sequencing in head and neck cancer tissues.” Arch Microbiol 206 (2024): 248. [CrossRef]
- Liu, C., Y. Cui, X. Li and M. Yao. “Microeco: An r package for data mining in microbial community ecology.” FEMS Microbiol Ecol 97 (2021). [CrossRef]
- Oksanen, J. “Vegan: Community ecology package-r package version 1.17-8.” http://CRAN. R-project. org/package= vegan (2011).
- Zhou, H., K. He, J. Chen and X. Zhang. “Linda: Linear models for differential abundance analysis of microbiome compositional data.” Genome biology 23 (2022): 95. [CrossRef]
- Rohart, F., B. Gautier, A. Singh and K.-A. Lê Cao. “Mixomics: An r package for ‘omics feature selection and multiple data integration.” PLoS Computational Biology 13 (2017): e1005752. [CrossRef]
- Abellan-Schneyder, I., M. S. Matchado, S. Reitmeier, A. Sommer, Z. Sewald, J. Baumbach, M. List and K. Neuhaus. “Primer, pipelines, parameters: Issues in 16s rrna gene sequencing.” mSphere 6 (2021). [CrossRef]
- Gibbons, S. M., C. Duvallet and E. J. Alm. “Correcting for batch effects in case-control microbiome studies.” PLoS Computational Biology 14 (2018): e1006102. [CrossRef]
- Topçuoğlu, B. D., Z. Lapp, K. L. Sovacool, E. Snitkin, J. Wiens and P. D. Schloss. “Mikropml: User-friendly r package for supervised machine learning pipelines.” Journal of open source software 6 (2021). [CrossRef]
- Sharma, A. K., W. T. DeBusk, I. Stepanov, A. Gomez and S. S. Khariwala. “Oral microbiome profiling in smokers with and without head and neck cancer reveals variations between health and disease.” Cancer Prev Res (Phila) 13 (2020): 463-74. [CrossRef]
- Guerrero-Preston, R., F. Godoy-Vitorino, A. Jedlicka, A. Rodríguez-Hilario, H. González, J. Bondy, F. Lawson, O. Folawiyo, C. Michailidi, A. Dziedzic, et al. “16s rrna amplicon sequencing identifies microbiota associated with oral cancer, human papilloma virus infection and surgical treatment.” Oncotarget 7 (2016): 51320-34. [CrossRef]
- Frank, D. N., Y. Qiu, Y. Cao, S. Zhang, L. Lu, J. M. Kofonow, C. E. Robertson, Y. Liu, H. Wang, C. L. Levens, et al. “A dysbiotic microbiome promotes head and neck squamous cell carcinoma.” Oncogene 41 (2022): 1269-80. [CrossRef]
- Zhu, W., W. Shen, J. Wang, Y. Xu, R. Zhai, J. Zhang, M. Wang, M. Wang and L. Liu. “Capnocytophaga gingivalis is a potential tumor promotor in oral cancer.” Oral Dis 30 (2024): 353-62. [CrossRef]
- Liu, Q. Y., Y. Liao, Y. X. Wu, H. Diao, Y. Du, Y. W. Chen, J. R. Xie, W. Q. Xue, Y. Q. He, T. M. Wang, et al. “The oral microbiome as mediator between oral hygiene and its impact on nasopharyngeal carcinoma.” Microorganisms 11 (2023). [CrossRef]
- Banavar, G., O. Ogundijo, R. Toma, S. Rajagopal, Y. K. Lim, K. Tang, F. Camacho, P. J. Torres, S. Gline, M. Parks, et al. “The salivary metatranscriptome as an accurate diagnostic indicator of oral cancer.” npj Genomic Medicine 6 (2021): 105. [CrossRef]
- Omori, M., N. Kato-Kogoe, S. Sakaguchi, N. Fukui, K. Yamamoto, Y. Nakajima, K. Inoue, H. Nakano, D. Motooka and T. Nakano. “Comparative evaluation of microbial profiles of oral samples obtained at different collection time points and using different methods.” Clinical Oral Investigations 25 (2021): 2779-89. [CrossRef]
- Zaura, E., B. J. F. Keijser, S. M. Huse and W. Crielaard. “Defining the healthy “core microbiome” of oral microbial communities.” BMC microbiology 9 (2009): 259. [CrossRef]
- Dhakal, A., R. Upadhyay, C. Wheeler, R. Hoyd, V. Karivedu, M. E. Gamez, S. Valentin, M. Vanputten, P. Bhateja, M. Bonomi, et al. “Association between tumor microbiome and hypoxia across anatomic subsites of head and neck cancers.” Int J Mol Sci 23 (2022). [CrossRef]
- Yano, Y., X. Hua, Y. Wan, S. Suman, B. Zhu, C. L. Dagnall, A. Hutchinson, K. Jones, B. D. Hicks, J. Shi, et al. “Comparison of oral microbiota collected using multiple methods and recommendations for new epidemiologic studies.” mSystems 5 (2020). [CrossRef]
- Mougeot, J. C., M. F. Beckman, H. C. Langdon, R. V. Lalla, M. T. Brennan and F. K. Bahrani Mougeot. “Haemophilus pittmaniae and leptotrichia spp. Constitute a multi-marker signature in a cohort of human papillomavirus-positive head and neck cancer patients.” Front Microbiol 12 (2021): 794546. [CrossRef]
- Hayes, R. B., J. Ahn, X. Fan, B. A. Peters, Y. Ma, L. Yang, I. Agalliu, R. D. Burk, I. Ganly, M. P. Purdue, et al. “Association of oral microbiome with risk for incident head and neck squamous cell cancer.” JAMA Oncol 4 (2018): 358-65. [CrossRef]
- Kers, J. G. and E. Saccenti. “The power of microbiome studies: Some considerations on which alpha and beta metrics to use and how to report results.” Front Microbiol 12 (2021): 796025. [CrossRef]
- Unlu, O., M. Demirci, T. Paksoy, A. B. Eden, H. D. Tansuker, A. Dalmizrak, C. Aktan, F. Senel, A. V. Sunter, O. Yigit, et al. “Oral microbial dysbiosis in patients with oral cavity cancers.” Clinical Oral Investigations 28 (2024): 377. [CrossRef]
- Shen, X., B. Zhang, X. Hu, J. Li, M. Wu, C. Yan, Y. Yang and Y. Li. “Neisseria sicca and corynebacterium matruchotii inhibited oral squamous cell carcinomas by regulating genome stability.” Bioengineered 13 (2022): 14094-106. [CrossRef]
- Baraniya, D., V. Jain, R. Lucarelli, V. Tam, L. Vanderveer, S. Puri, M. Yang and N. N. Al-Hebshi. “Screening of health-associated oral bacteria for anticancer properties in vitro.” Front Cell Infect Microbiol 10 (2020): 575656. [CrossRef]
- Connell, J. T., K. Yeo, G. Bouras, A. Bassiouni, K. Fenix, C. Cooksley, S. Vreugde, P. J. Wormald and A. J. Psaltis. “Enhanced phylogenetic insights into the microbiome of chronic rhinosinusitis through the novel application of long read 16s rrna gene amplicon sequencing.” Rhinology (2024). [CrossRef]
- Kumar, B., E. Lorusso, B. Fosso and G. Pesole. “A comprehensive overview of microbiome data in the light of machine learning applications: Categorization, accessibility, and future directions.” Front Microbiol 15 (2024): 1343572. [CrossRef]
- “Microbiome test spots oral cancers.” Nature Biotechnology 39 (2021): 650-50. [CrossRef]
Figure 1.
Study selection flowchart.
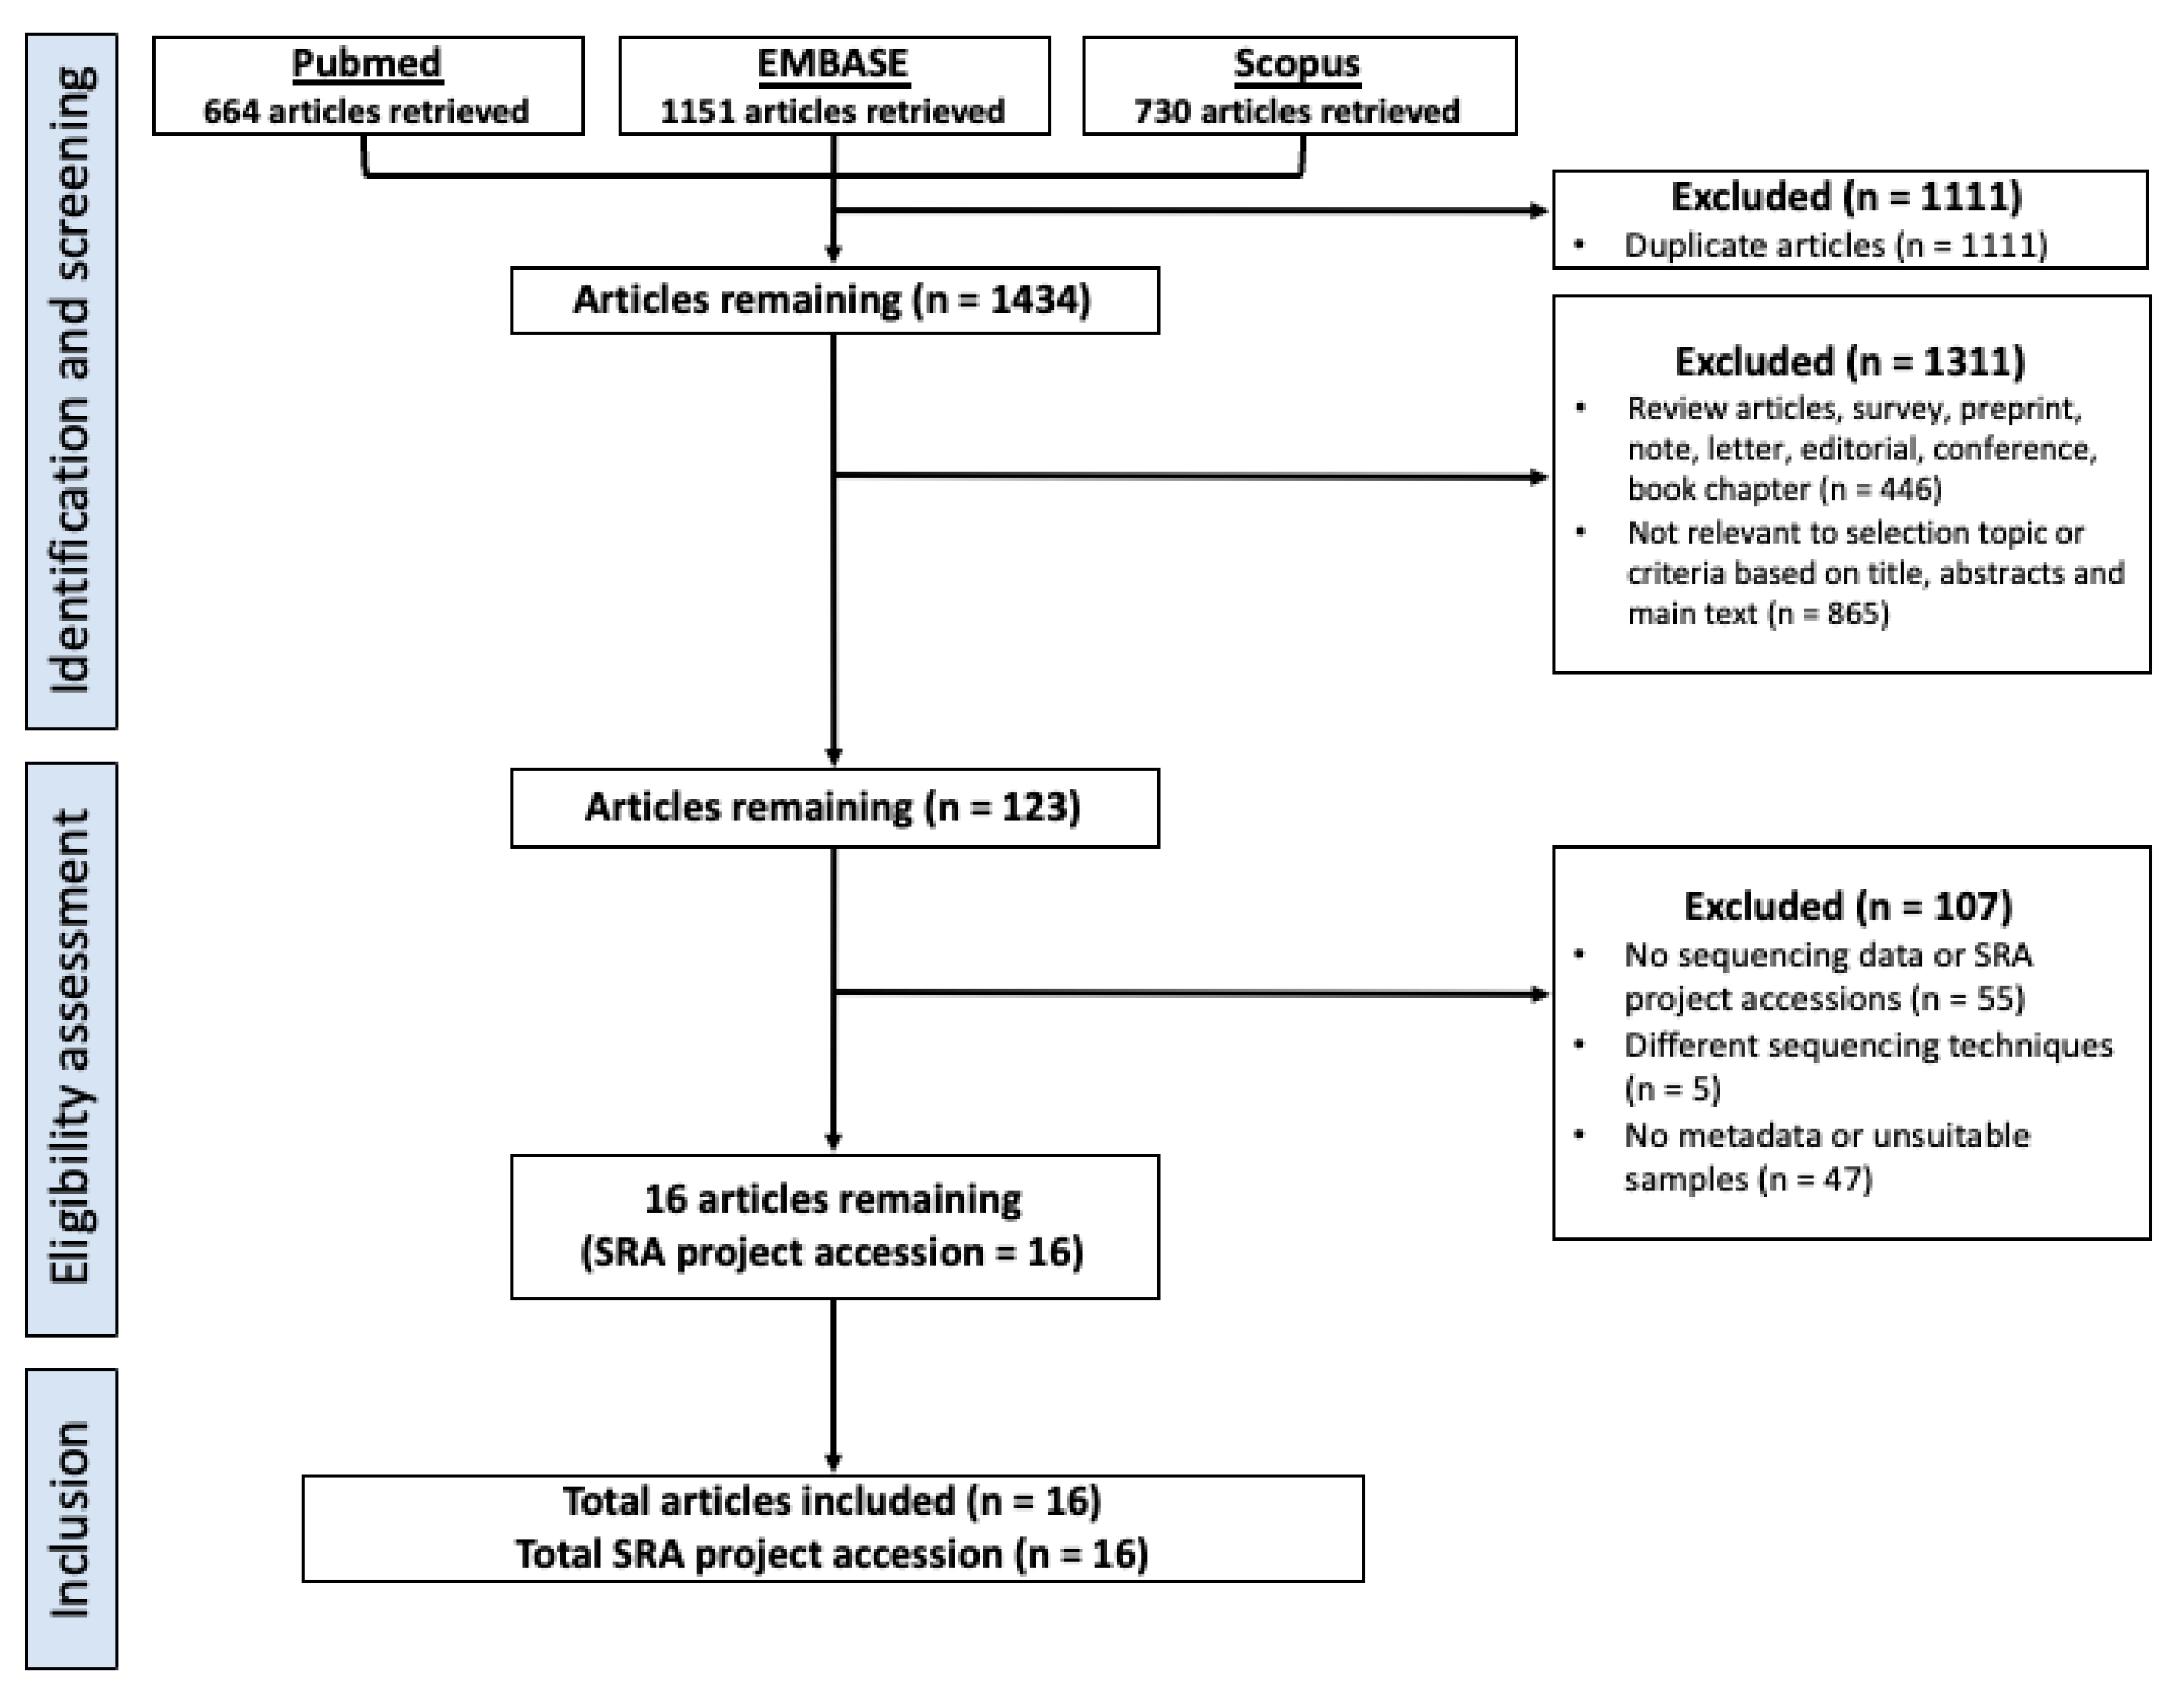
Figure 2.
Comparison of pooled alpha-diversity between HNC, premalignant and healthy patient at the genus level. Shannon diversity was measured using rarefied abundance. Shannon index for (a) pooled V3V4 saliva – HNC (n = 170), healthy (n = 96), premalignant (n = 43), (b) pooled V4 saliva – HNC (n = 329), healthy (n = 282), premalignant (n = 129), and (c) pooled V3V4 oral rinse – HNC (n = 206), healthy (n = 130) samples. Kruskal-Wallis test with Dunn’s multiple comparison and Mann-Whitney test were performed to compared different sample groups, black line represents median. ****p < 0.0001, ***p < 0.001, **p < 0.01, *p < 0.05, ns – not significant.
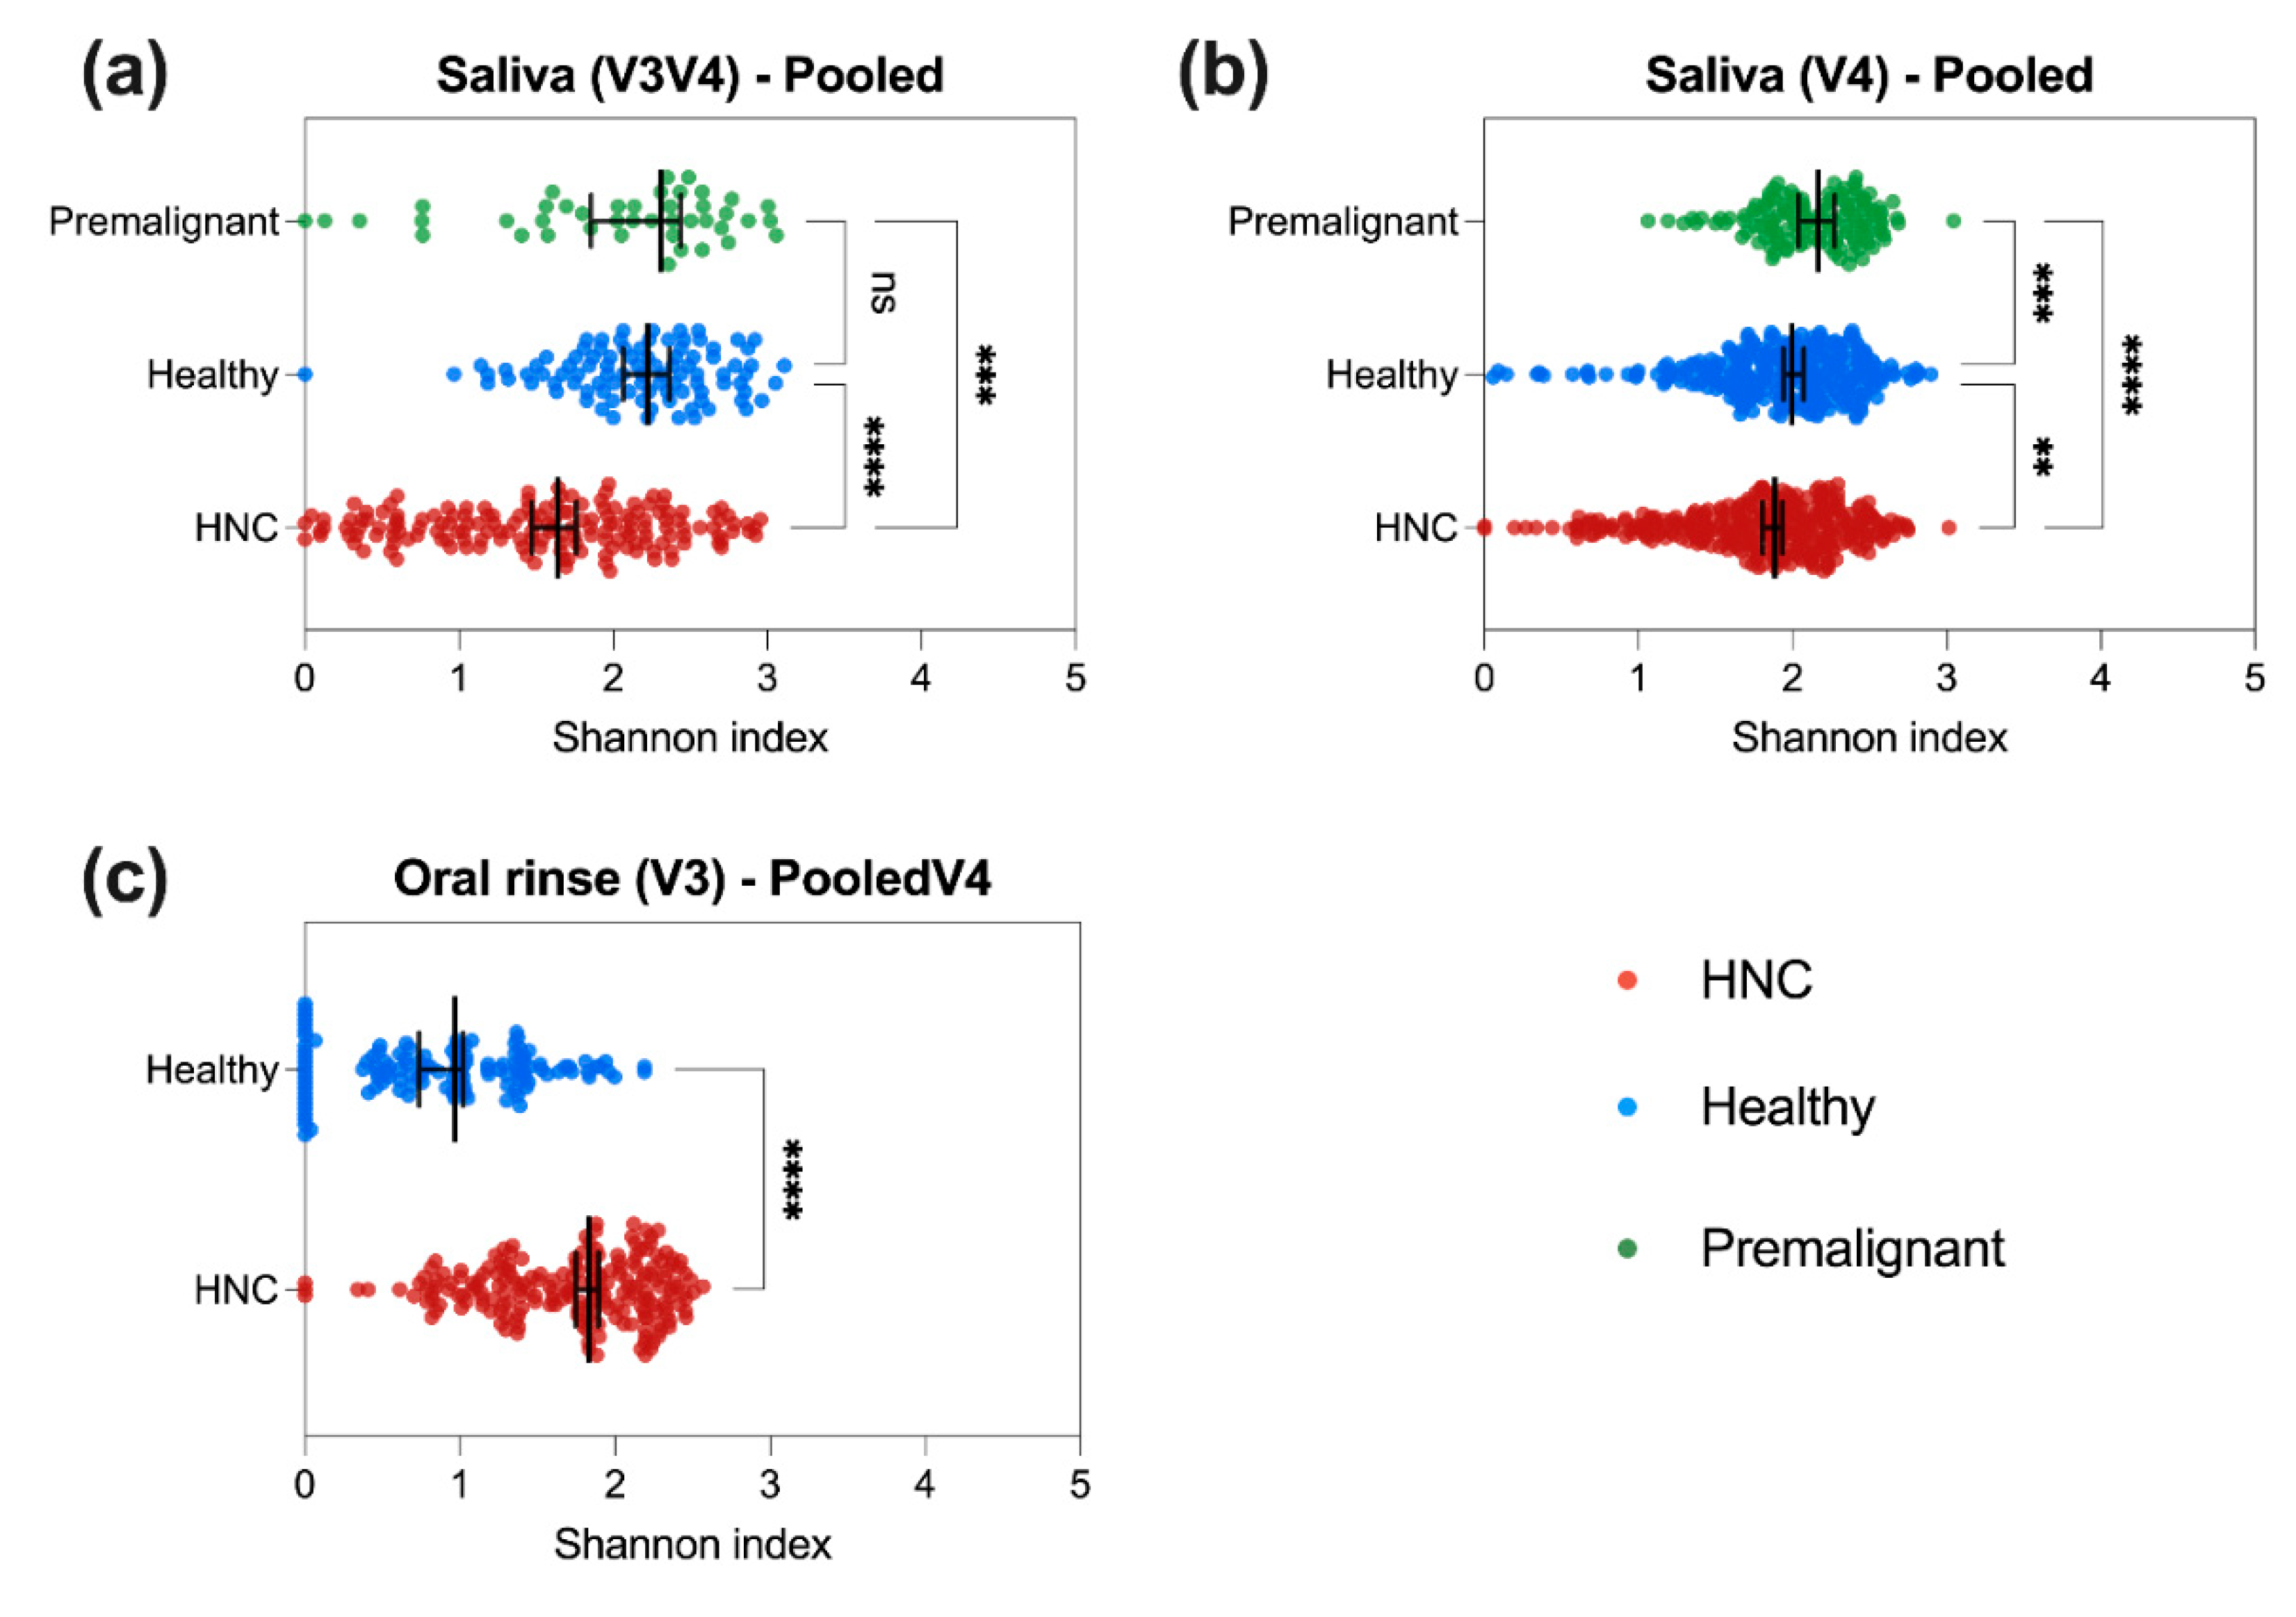
Figure 5.
Discriminant analysis using AUROC curves based on sPLS-DA model of oral microbiome. AUROC curves of (A) V3V4 saliva, (B) V4 saliva and (C) V3V4 oral rinse. AUC was calculated for each ‘one vs other’ patient groups and Wilcoxon test was used to test for differences between one group from others.
Disclaimer/Publisher’s Note: The statements, opinions and data contained in all publications are solely those of the individual author(s) and contributor(s) and not of MDPI and/or the editor(s). MDPI and/or the editor(s) disclaim responsibility for any injury to people or property resulting from any ideas, methods, instructions or products referred to in the content. |
© 2024 by the authors. Licensee MDPI, Basel, Switzerland. This article is an open access article distributed under the terms and conditions of the Creative Commons Attribution (CC BY) license (http://creativecommons.org/licenses/by/4.0/).
Copyright: This open access article is published under a Creative Commons CC BY 4.0 license, which permit the free download, distribution, and reuse, provided that the author and preprint are cited in any reuse.


