Submitted:
23 August 2024
Posted:
26 August 2024
You are already at the latest version
Abstract
In vivo proton (1H) magnetic resonance spectroscopy (MRS) is a powerful noninvasive method which can measure Alzheimer’s disease (AD) related neuropathological alterations at the molecular level. AD biomarkers include amyloid-beta (Aβ) plaques and hyperphosphorylated tau neurofibrillary tangles. These biomarkers can be detected via postmortem analysis, but also in living individuals through positron emission tomography (PET) or biofluid biomarkers of Aβ and tau. This review offers an overview of biochemical abnormalities detected by 1H MRS within the biologically defined AD spectrum. It includes a summary of earlier studies that explored the association of 1H MRS metabolites with biofluid, PET, and postmortem AD biomarkers, and examined how apolipoprotein e4 allele carrier status influences brain biochemistry. Studying these associations is crucial for understanding how AD pathology affects brain homeostasis throughout the AD continuum and may eventually facilitate to develop potential novel therapeutic approaches.
Keywords:
Alzheimer’s disease
; mild cognitive impairment
; magnetic resonance spectroscopy
; amyloid
; tau
; biofluid biomarkers
; apolipoprotein ε4
1. Introduction
Alzheimer’s disease (AD) is an irreversible neurodegenerative disorder accounting for 60-80 of all dementia cases. More than 55 million people live with AD and other dementias, and this number is expected to rise [1]. AD dementia imposes a significant burden on the healthcare system and primary caregivers. Patients with AD dementia experience a progressive decline in both cognitive and physical abilities, leading to substantial challenges in daily functioning and quality of life. Recent progress in disease-modifying therapies, such as monoclonal antibodies, has emphasized the need for early and precise diagnosis of AD's underlying pathology through surrogate biomarkers [2]. Detecting AD pathology at the earliest stage, before significant brain damage occurs, is essential for timely intervention, which can improve outcomes. Proton (1H) magnetic resonance spectroscopy (MRS) is a non-invasive method to detect changes in brain biochemistry linked to molecular-level pathological processes related to AD. The integration of 1H MRS with other biomarkers acquired through positron emission tomography (PET) and biofluid analysis enhances the ability to diagnose AD at an early stage and monitor the impact of interventions, potentially leading to improved patient outcomes.
1H MRS offers the advantage of monitoring biochemical alterations over time, making it a valuable tool for tracking disease progression as a prognostic tool and the efficacy of therapeutic interventions. Monitoring metabolite changes during the AD continuum provide a more detailed picture of the disease process, allowing for the identification of specific biochemical pathways affected by AD pathology. A variety of metabolites, which reflects different physiological functions, can be measured in the brain using 1H MRS. For example, alterations in total N-acetylaspartate (tNAA: N-acetyl aspartate, NAA plus N-acetyl aspartylglutamate, NAAG) signal is associated with neuronal integrity, myo-inositol (mIns) reflects glial activity, glutamate (Glu) and gamma-aminobutyric acid (GABA) represent excitatory and inhibitory neurotransmission, respectively, while total choline (choline, Cho; phosphocholine, PCho; glycerophosphocholine, GPC) is associated with cell membrane turnover, and total creatine (tCr = creatine, Cr plus phosphocreatine, PCr) is linked to energy metabolism. Given the varying precision in naming some of the 1H MRS metabolites NAA, Cr and Cho may sometimes refer the total sum as explained in the “total” definitions in this review.
The accumulation of amyloid-beta (Aβ) plaques outside the neurons and the accumulation of neurofibrillary tangles composed of hyperphosphorylated tau inside the neurons start more than two decades before the clinical symptoms of AD dementia manifest [3,4,5]. AD neuropathology can be measured through postmortem examination or using biomarkers in living people. The clinical diagnostic criteria for AD dementia have evolved over time. In 2018, the US National Institute on Aging and the Alzheimer’s Association (NIA-AA) committee proposed the biological definition and diagnosis of AD as a research framework by using biomarkers acquired from living people during the AD continuum [6]. The NIA-AA framework has enabled a purely biological definition of AD by categorizing individuals based on biomarker evidence of AD pathology using amyloid-tau-neurodegeneration (ATN) [6]. In ATN classification, ‘A’ refers to Aβ proteinopathy pathway, ‘T’ to tau proteinopathy pathway, and ‘N’ to neurodegeneration. This biomarker classification scheme has recently been revised [7]. While the new revised biological disease staging using PET and biofluid markers will continue to increase our understanding about the disease progression, 1H MRS biomarkers has potential to add a crucial neurochemical dimension to increase our understanding regarding neuropathological alterations in AD continuum and enhance the accuracy of early AD diagnosis. Unlike biofluid biomarkers, which reflect the global pathology, 1H MRS data can provide regionally specific biochemical changes in the brain.
The biologically defined AD continuum that begins with the appearance of brain pathology in asymptomatic individuals and progresses through stages of increasing pathological burden, eventually leading to clinical symptoms [6,8]. The AD continuum stages includes preclinical stage, where the participants are cognitively unimpaired (with or without amyloid or tau biomarkers); the prodromal stage includes the early symptomatic phenotype (e.g. MCI) and AD dementia stage refers to the phase where severe cognitive symptoms are present which effects social and daily activities [9]. With recent advances in in vivo biomarker fields (i.e., neuroimaging and biofluid markers), progression of AD pathology in vivo is now possible starting from preclinical stages long before the irreversible brain damage occurs.
The focus of this review was to summarize the relationship between 1H MRS metabolites and biomarkers acquired through PET (tau, amyloid), biofluid and post-mortem AD pathology analysis across the AD continuum in the brain (Table 1). There are several excellent older reviews on changes of 1H MRS metabolites in AD continuum for further reading [10,11,12,13,14,15,16,17,18].
2. Commonly Studied 1H MRS metabolites in AD
2.1. NAA
NAA is a small molecule which is synthetized from aspartate and acetyl-coenzyme A in the brain. It is a marker of neural health, viability, and synaptic integrity [19]. NAA has a high amplitude signal at 2.01 part per million (ppm), relative to the standard tetramethysilane. The peak also includes minor contributions from other metabolites such NAAG at 2.04 ppm. These overlapping signals from acetyl moieties of both molecule at 2.01-2.04 ppm range (plus lower amplitude signals from other ppm ranges, see de Graaf, 2007) is ascribed as NAA or total NAA (tNAA: NAA + NAAG) [20,21,22,23,24,25]. NAA is found primarily in neural cells and synthesized in mitochondria [21,22,23]. A lower NAA/Cr ratio has been associated with loss of synaptic integrity [19]. A reduction of NAA levels (using water as an internal reference or Cr) in patients with AD dementia compared to cognitively unimpaired participants is one of the most frequent findings of 1H MRS studies [26,27,28,29,30,31,32,33,34,35,36,37,38,39,40].
2.2. mIns
The well resolved spectral peak of mIns is assigned to 3.56 ppm [41,42]. mIns is considered as a glial marker and/or an osmolyte [43]. An increase in mIns was linked with elevated glial marker on PET (18kDa TSPO). TSPO PET uptake has been associated with neuroinflammation and glial cell activation [44] or density of inflammatory cells [45]. This association support the notion that mIns can be a marker of neuroinflammation or density of inflammatory cells. Many studies consistently demonstrated an increase in mIns (or mIns/Cr) in several gray and white matter brain regions in people with AD dementia compared to controls [12,26,27,28,29,31,36,37,38,40,43,46,47]. It has been proposed that an increase in the mIns/Cr ratio occurs during the early stages of the disease progression, which is then followed by a decrease in the NAA/Cr ratio and an increase in the Cho/Cr ratio at later stages of the disease [40].

Table 1.
Summary of association studies between 1H MRS and other biomarkers including biofluid, PET and postmortem pathology.
Table 1.
Summary of association studies between 1H MRS and other biomarkers including biofluid, PET and postmortem pathology.
| Authors | Cohort | Magnet field strength and acquisition parameters | Voxel locations and size | Key findings |
|---|---|---|---|---|
| [48] | CU (n=30) | 7T, TR=644, MRSI, FIDLOVS | Posterior cingulate gyrus and precuneus | ↑ GABA and ↑ Glu were associated ↑ Aβ burden on PET (PiB) with a positive effect modification by APOE e4 allele. |
| [49] | AD (11), MCI (8), CU (n=26) |
3T, TR/TE=2000/30 ms, MRSI, PRESS | Posterior cingulate gyrus, dorsolateral prefrontal cortex |
↓Glu/tCr was associated with ↑ tau load on PET with florzolatau in the posterior cingulate gyrus of AD dementia patients. ↑ plasma NfL was associated with MRS metabolites (↓ tNAA/tCr and ↓ Glu/tCr) in the right dorsolateral prefrontal cortex of patients with AD dementia. |
| [50] | CU (Aβ – and Aβ+) (n=338), MCI (Aβ+)(n=90) | 3T, TR/TE=2000/30 ms, single voxel, PRESS | Posterior cingulate cortex /precuneus region | ↑ mIns/tCr ratio in the posterior cingulate gyrus was associated with ↑ posterior cingulate gyrus and neuocortical meta-ROI Aβ (flutemetamol) and tau (RO948) load on PET only in APOE e4 allele carriers. ↑ plasma GFAP was associated with ↑ mIns/tCr (posterior cingulate gyrus) only in APOE e4 allele carriers. |
| [51] | CU women: CSF Aβ negative (n=71); CU Aβ positive women (n=37); MCI (CSF Aβ positive) women (n=12) |
3T, TR/TE=2000/20 ms; TR/TE=2000/68 ms/; single voxel; PRESS and MEGA-PRESS | Medial frontal cortex | ↑ Glx, ↓ GABA, and ↑ mIns/tCr ratio in MCI compared to CU CSF Aβ42 negative and positive participants. ↑ Age was associated with ↓ levels of GABA in CU and MCI groups. |
| [52] | CU (A−T−N−) (37); early AD (A+T+N−) (n=16); late AD (A+T+N+)(n=15)a | 3T, TR/TE=2000/32 ms; single voxel; PRESS | Posterior cingulate cortex /precuneus region | ↓ NAA/Cr in early AD (A+T+N−) and late AD (A+T+N+) compared to controls (A-T-N-; A+T-N-). ↑ mIns/Cr in late AD compared to controls. ↓NAA/Cr correlated with ↑ global Aβ load (PIB) and tau load (flortaucipir) on PET in whole cohort. |
| [53] | CU (n=40) | 3T, TR/TE= 3000/30 ms, single voxel; sLASER |
Posterior cingulate gyrus (automated VOI prescription) | ↑Tau PET (flortaucipir) in posterior cingulate gyrus correlated with ↓NAA/tCr and ↓Glu/tCr. |
| [54] | CSF Aβ42 positive (n=111); CSF Aβ42 negative (n=174); | 3T, TR/TE= 3000/30 ms, single voxel; PRESS | Posterior cingulate cortex /precuneus region | Visit 2 (~2.3 years after baseline): ↑ Cho/Cr, ↑mIns/Cr, ↓NAA/Cr, and ↓NAA/mI in CSF Aβ positive compared to CSF Aβ negative cases. Visit 3 (~4 years after baseline): ↑mIns/Cr, ↓NAA/Cr, and ↓NAA/mI in CSF Aβ positive compared to CSF Aβ negative cases. CSF Aβ positivity at baseline was associated with ↑mIns/Cr and ↓NAA/mIns ↑ Rate of change in the MCI Aβ positive for mIns/Cr and NAA/mIns compared to MCI Aβ negative. |
| [55] | CU younger controls (<60 years) (n=27); CU older controls (>60 years) (n=27); AD (>60 years) (n=25) | 3T, TR/TE= 1600/(31-229) ms ms, single voxel, 2D J-PRESS |
Posterior cingulate cortex /precuneus region | ↑ mIns associated with ↑CSF tau, and ↑CSF p-Tau 181; ↑ GABA associated with ↑CSF p-Tau 181p in AD dementia group |
| [56] | Two cohorts: younger age (n=30) (20–40 years); CU (n=151): older individuals (60–85 years). | 3T, TR/TE=4000/8.5 ms, single voxel, SPECIAL | Posterior cingulate cortex /precuneus region | ↑ mIns, ↑ Cr, ↑mIns/NAA, ↓ GSH, ↓ Glu in older participants compared to younger participants. |
| [57] | CU (n=289) | 1.5T, TR/TE=2000/25 ms, single voxel, PRESS | Posterior cingulate gyrus | ↑ mIns/Cr ratio in participants with two copies of APOE e4 allele compared with participants with non-carriers. ↓The NAA/mIns ratio in participants (APOE e4/e4) compared with those who were heterozygous for the APOE e4 allele and non-carriers. |
| [58]. | CU (n=15) | 3T, TR/TE=1500/68 ms, single voxel, J-edited spin echo difference method | Posterior cingulate cortex /precuneus region | ↓GSH was associated with↑the temporal and parietal Aβ load on PET with PiB. |
| [59] | aMCI (n=14); CU (n=32) | 3T, TR/TE= 3000/30 ms, single voxel, sLASER |
Posterior cingulate gyrus | ↑ Global cortical Aβ load (PiB) on PET correlated with ↓Glu/mIns ratio in the entire cohort. |
| [60] | CU older adults (n=594) c | 3T, TR/TE= 2000/30 ms, single voxel, PRESS |
Posterior cingulate gyrus | ↓ NAA/mIns and ↑ mIns/Cr at baseline were associated with ↑rate of Aβ deposition on serial PIB PET. |
| [61] | CU CSF Aβ42 negative (n=156); CU CSF Aβ42 positive (n=49), MCI CSF Aβ42 positive (n=88) | 3T, TR/TE= 2000/30 ms, single voxel, PRESS | Posterior cingulate/precuneus | ↑ mIns/Cr, ↑ Cho/Cr, ↓ NAA/Cr in MCI (CSF Aβ42 positive) compared to CU (CSF Aβ42 negative). ↑mIns/Cr in CU (CSF Aβ42 positive) compared to CU (CSF Aβ42 negative). ↑ mIns/Cr in APOE e4 allele carrier CU (CSF Aβ42 negative) compared to non e4 carrier CU (CSF Aβ42 negative). ↑ mIns/Cr and ↑ Cho/Cr were associated with ↑ Aβ deposition on PET (flutemetamol) in amyloid positive (on PET) cognitively unimpaired participants. ↑ mIns/Cr was associated with ↑ Aβ deposition on PET (flutemetamol) and in CSF Aβ42 positive cognitively unimpaired participants. |
| [62] | CU (n=16), aMCI (n=11) | 3T; TR/TE = 2000/32ms, single voxel, 2D-PRESS | Bilateral hippocampi | No difference in mIns/Cr between APOE e4 allele carriers and non-carriers |
| [63] | CU (n=21); aMCI (n=15) | 3T, TR/TE= 3000/68 ms, single voxel, MEGA-PRESS | Posterior cingulate gyrus | ↓ NAA was lower in Aβ positive subjects compared to Aβ negative (PiB PET) subjects. ↓ NAA was in APOE e4 allele carriers compared to non-carriers. |
| [64] |
APOE e4 allele non carriers (n=89); APOE e4 allele carriers (n=23) |
3T, TR/TE= 1600/30 ms, single voxel, PRESS | Posterior cingulate gyrus | ↑ Cho/Cr and ↑ mIns/Cr increase with age in APOE e4 allele carriers. ↑ Cho/Cr ratio APOE e4 carriers compared to non-carriers. |
| [19] | No to low likelihood of AD (n=17); Intermediate to high likelihood of AD likelihood (n=24) | 3T, TR/TE= 2000/30 ms, single voxel, PRESS | Posterior cingulate gyrus | ↓ NAA/Cr and NAA/mIns were associated with ↓synaptic integrity and ↑higher p-tau pathology. ↑Aβ burden was associated with ↑ mIns/Cr and ↓ NAA/mIns. ↑GFAP-positive astrocytic burden showed a trend of association with decreased NAA/Cr and NAA/mIns. |
| [65] | CU (n=17); AD (n=19) | 3T, TR/TE= 2000/30 ms, single voxel, PRESS | Hippocampus, posterior cingulate gyrus and right parietal gyrus | ↓NAA/Cr (hippocampus) was correlated with ↓CSF Aβ42. ↓NAA/Cr (parietal gyrus) was correlated with ↑CSF p-tau. ↑mIns/Cr (posterior cingulate gyrus) was correlated with ↑t-tau; |
| [66] | All subjects (n=109); AD dementia (n=40); non-AD dementia, (n=14); MCI of AD type (n=29) MCI of non-AD type (n=26) |
1.5T, TR/TE= 2000/272, single voxel, PRESS | Medial temporal lobe | ↓ NAA was correlated with ↓CSF Aβ42 in patient with AD dementia. |
| [67] | CU (n=311) | 1.5 T, 2000/30 ms, single voxel, PRESS | Posterior cingulate gyrus | ↑mIns/Cr and ↑Cho/Cr was associated ↑ Aβ load on PET (PIB). |
| [68] | Low AD likelihood (n=11); intermediate AD likelihood (n=9); high AD likelihood (n=34) | 1.5 T/ 2000/30 ms, single voxel, PRESS | Posterior cingulate gyrus | ↓ NAA/Cr, ↑mIns/Cr, ↓ NAA/mIns in postmortem frequent neuritic plaque group compared to neuritic sparse plaque group ↓ NAA/Cr in frequent neuritic plaque group compared to neuritic moderate plaque group. ↑mIns/Cr and ↓ NAA/mIns in neuritic moderate plaque group compared to neuritic sparse plaque group. ↓ NAA/Cr, ↑mIns/Cr, ↓ NAA/mIns in high-likelihood AD group compared to low-likelihood AD group ↑mIns/Cr in high-likelihood AD group compared to intermediate-likelihood AD group. ↓NAA/Cr, ↑mI/Cr, and ↓NAA/mI ratios were associated with higher Braak NFT stage, higher neuritic plaque score, and greater likeli-hood of AD. |
| [69] | CU (n=61); patient group (MCI + AD dementia (n=46) | 1.5 T/ 2000/30 ms, single voxel, PRESS | Posterior cingulate/precuneus | No differences were noted on 1H-MRS metabolite ratios (NAA/Cr, mIns/Cr, NAA/mIns) across APOE e4 carriers and non-carriers. |
| [40] | CU (63); MCI (21); AD dementia (21) | 1.5 T/ 2000/30 or 135 ms, single voxel, PRESS | Posterior cingulate gyrus; medial occipital; left superior temporal lobe | ↑ NAA/Cr ratios (medial occipital) in patients with AD dementia correlated with APOE e4 carrier status |
| [70] | postmortem brain with AD pathology (49); non-demented control (5) | In vitro ,11.7 T, perchloric acid extracts | Autopsy brain samples from various brain regions | ↑ mIns, ↑ GPC, ↓ Glu, in APOE e3/e3 samples from AD dementia patients compared to samples from normal control brains samples ↓NAA in APOE e3/e3 and APOE e4/e4 AD samples from AD dementia patients compared to samples from normal control brains (APOE e3/e3). |
Abbreviations: Aβ: Amyloid-beta; AD: Alzheimer's Disease; aMCI: Amnestic Mild Cognitive Impairment; APOE: Apolipoprotein E; A−T−N−: Negative for amyloid-beta, tau, and neurodegeneration markers; A+T+N−: Positive for amyloid-beta and tau, negative for neurodegeneration markers; A+T+N+: Positive for amyloid-beta, tau, and neurodegeneration markers; CU: Cognitively unimpaired; CSF: Cerebrospinal fluid; FIDLOVS: Free-Induction-Decay-Localized-by-Outer-Volume-Suppression; GFAP: Glial Fibrillary Acidic Protein; GPC: Glycerophosphocholine; MCI: Mild Cognitive Impairment; MEGA-PRESS: Mescher-Garwood Point-Resolved Spectroscopy; MRSI: Magnetic resonance spectroscopy imaging; mIns: myo-inositol; NAA: N-Acetylaspartate; NfL: Neurofilament light; NFT: Neurofibrillary tangles; PET: Positron emission tomography; PiB: Pittsburgh compound B; PRESS: Point-Resolved Spectroscopy Single-Voxel Sequence; p-tau: Phosphorylated tau; RO948: Tau PET ligand; tCr: sLASER: adiabatic selective refocusing sequence; Total creatine; TR/TE: Repetition time/echo time; VOI: Volume of interest; MMSE: Mini Mental State Examination; MRS: Magnetic resonance spectroscopy; GABA: γ-Aminobutyric Acid; Glx: Glu (glutamate) + Gln (glutamine).
2.3. Cho
Choline is considered a cell membrane (phospholipid) turnover, white matter integrity and cellular density biomarker [43,71,72]. The peak at 3.2 ppm is assigned to mobile choline-containing compounds including PCho and GPC ascribed as total Cho (tCho), which are found in the myelin and the cell membrane [20,71,72,73]. While some studies reported a change in Cho signal related with AD pathology, the direction of change is not always consistent. Some reported an increase [37,40,74,75,76,77], and others reported a decrease or no change [26,29,31,33,78,79] in patients with AD dementia compared to controls. Elevation of Cho in the AD dementia may be due to an increased membrane catabolism in response to an increased demand for acetylcholine synthesis, which leads an increase in PCho and GPC [18,80,81].
2.4. Glu, Gln, Glx
The spectral peaks of Glu (at 2.35 ppm) and Gln (at 2.45 ppm), measured through conventional 1H MRS sequences, overlap at commonly used clinical MR field strengths (1.5 T and 3T) [46]. Therefore, these two peaks are generally assigned as Glx (Glu +Gln). Glu, a precursor of GABA, is an excitatory neurotransmitter, and mainly synthesized through Glu-Gln cycle [82,83]. Earlier studies reported a decrease in glutamate or Glx in patients with AD dementia and MCI compared to cognitively unimpaired participants [34,59,63,84,85].
2.5. GABA
GABA is a primary inhibitory neurotransmitter in the brain. Differentiation of GABA from other overlapping peaks of Glx (at 2.35 ppm), NAA, Cr and PCr (at 3.02 ppm) at lower field strengths (≤ 3T) is challenging. Spectral editing methods or employment of 2 dimensional spectroscopy protocols are needed to resolve overlapping signals [86]. Riese et al. reported that GABA levels were lower in patients with amnestic MCI compared to elderly controls [63]. In contrast, a study observed no significant change in GABA levels between normal elderly participants and those with AD dementia [87].
2.6. GSH
Glutathione (GSH) is considered as an important antioxidant in the brain [88]. A decrease in GSH levels in a variety of brain regions, including the hippocampus, frontal cortex, posterior cingulate cortex, and anterior cingulate cortex, has been demonstrated in patients with AD dementia as compared with age-matched cognitively unimpaired participants [89,90,91]. However, a recent meta-analysis reported that there was no change in GSH peroxidase and GSH reductase activities and GSH levels in human specimens [92].
2.7. Cr
The Cr and PCr system play role in energy metabolism for adenosine triphosphate regeneration and act as an energy buffer [93]. Since there are overlapping singlets of Cr and PCr peaks at 3.03 ppm and 3.9 ppm at 3T and lower fields, their sum ascribed as Cr or total Cr (tCr) is used in many studies, generally as an internal reference metabolite to calculate relative metabolite levels (metabolite/tCr) [17,94]. While tCr remains constant in various diseases such as AD dementia [28,29,31,94], it has been shown that total Cr levels may change with age [56,95,96,97] and white matter hyperintensity volume [98]. It is highly recommended that tCr levels should be used as an internal reference after confirming that its concentration (relative to water) is not changed [99].
3. Association of 1H MRS Metabolites with Postmortem Neuropathology
Correlation studies between antemortem 1H MRS metabolite alterations and postmortem neuropathology are limited. Histopathological findings serve as a gold standard to validate 1H MRS findings to monitor AD continuum and better understand how metabolite changes are associated with topographical neuropathological alterations [19,68].
We reported that a decrease in NAA/Cr and an increase in mIns/Cr (posteriorcingulate gyrus) correlates with postmortem Alzheimer-type pathology including the postmortem Braak neurofibrillary tangle stage, higher neuritic plaque score, and greater likelihood of AD (Figure 1) [68]. The study suggested that the mIns/Cr ratio may be more sensitive to early pathologic changes than the NAA/Cr ratio. Melissa et al. showed that antemortem 1H MRS metabolites (e.g., NAA/Cr and NAA/mIns) linked to postmortem AD neuropathology, including the amyloid burden, synaptic integrity, and tau pathology [19]. In particular, the study identified a correlation between increased mIns/Cr and decreased NAA/mIns in the posterior cingulate gyrus with postmortem amyloid burden. Additionally, the study found an association between NAA/Cr and synaptic vesicle immunoreactivity but not neural density in the posterior cingulate gyrus across the entire cohort, including AD patients and control subjects. No such association was observed between Cho/Cr and mIns/Cr ratios and synaptic vesicle immunoreactivity which.
The study reported that postmortem late extracellular neurofibrillary tangle pathology was not correlated with NAA/Cr, mIns/Cr, Cho/Cr, and NAA/mIns. There was also no association between CD68 (a marker for activated phagocytic microglia)-positive microglia and any of the metabolite ratios studied in the study (i.e., NAA/Cr, mIns/Cr, Cho/Cr, and NAA/mIns) [19]. One of the important findings of this study was the association between NAA/Cr with synaptic integrity marker and pTau, but not with neural loss or late extracellular neurofibrillary tangle pathology. Supporting evidence of these findings reported later in an in vivo study using tau (Flortaucipir) PET with [53].
4. Association of 1H MRS Metabolites with Tau and Amyloid PET
4.1. NAA
In cognitively unimpaired cohort, there was no statistically significant association between NAA/Cr (posterior cingulate gyrus) and Aβ deposition on PET imaging (11 C Pittsburgh compound B, henceforth PiB) after adjusting for sex and age [67]. In line with this study, it was reported that neither global cortical Aβ nor local (posterior cingulate gyrus) Aβ load on PiB PET were correlated with NAA (posterior cingulate gyrus) in a cohort consist of cognitively unimpaired participants and those with amnestic MCI [63]. However, the study reported that NAA was lower in Aβ positive participants compared to Aβ negative participants. Zeydan et al. examined 1H MRS metabolite profile in the posterior cingulate gyrus in two groups (i.e. cognitively unimpaired participants and participants with amnestic MCI) using advanced sLASER MRS protocol [59]. A study reported that the level of NAA, mIns, Cr, and Cho between amnestic MCI participants, who were Aβ-positive on PiB PET, and cognitively unimpaired participants, who were Aβ-negative on PiB PET were not statistically significant [59]. We recently reported that Aβ deposition on PET was not associated with NAA/tCr ratios in the posterior cingulate gyrus of cognitively unimpaired participants, while higher in tau PET load was associated with a lower NAA/tCr ratio [53]. Extending these findings, a current study reported no significant association between tNAA/tCr with Aβ-load on PIB PET within the gray matter (posterior cingulate gyrus or dorsolateral prefrontal cortex) [49]; however this study reported a decrease in tNAA/tCr ratio in patients with patients with AD dementia in the gray matter. These studies suggest that an increase in Aβ-load may not be directly associated with NAA in preclinical and prodromal stages of AD pathology.
Current studies have investigated the association between 1H MRS and both tau and Aβ loads on PET in cognitively unimpaired individuals. Our group recently investigated the association between brain metabolites with tau and Aβ load on PET [53]. An increase in the posterior cingulate gyrus tau load on Flortaucipir PET was associated with lower NAA/tCr in cognitively unimpaired older adults [53] (Figure 2). Extending these findings, a decreased NAA/Cr ratio in the posterior cingulate gyrus was associated with elevated tau and Aβ load on PET in a cohort consisting of participants with non-AD and AD dementia who were categorized based on their A/T/N status based on PET and MRI [52]. The study reported that NAA/Cr ratio in early AD (A+T+N−) and late AD (A+T+N+) was lower compared to controls (A-T-N− and A+T-N-). An association between elevated NAA/Cr and an increase in global Aβ load on PET and tau load on PET was present in the whole cohort. Furthermore, the study reported that NAA/Cr ratio
4.2. mIns
In a cognitively unimpaired cohort, elevated mIns/Cr in the posterior cingulate gyrus was associated with an increased Aβ load on PiB PET [67]. Voevodska et al. reported an association between higher Aβ load on PET with higher mIns/Cr and mIns/NAA (posterior cingulate gyrus) ratios in cognitively unimpaired participants who were classified as Aβ positive based on Aβ CSF levels [61]. The study also reported that when Aβ positivity was based on PET with Flutemetamol, the association between elevated mIns/Cr and increased Aβ load in cognitively unimpaired controls was sustained [61]. However, these associations were not present in the CSF Aβ42 negative cognitively unimpaired controls, suggesting that a certain level of neuropathological accumulation driven by amyloid load may be required to observe these associations [61]. Nedelska et al. reported that elevated mIns/Cr and lower NAA/mIns (posterior cingulate gyrus) in cognitively unimpaired participants at baseline were associated with baseline Aβ load and an increased rate of Aβ deposition on PiB PET over time [60]. Extending these findings, a higher level of mIns/Cr (posterior cingulate gyrus) was reported in participants with biologically defined late AD dementia (A+ T+ N+) with cognitive impairment compared with cognitively unimpaired participants (A-T-N- and A+ T-N- )[52] , but no statistically significant difference in mIns/Cr ratio was observed between cognitively unimpaired and biologically defined early AD participants (A+T+N-). The study also demonstrated an association between higher mIns/Cr and higherglobal Aβ load on PET (PiB) and tau load on PET in the entire cohort.
4.3. Cho
The Cho/Cr ratio in the posterior cingulate gyrus was associated with an increased Aβ load on PET (PIB) in a relatively large cognitively unimpaired cohort (n = 311) [67]. Partially in line with this study, Voevodskaya et al. reported that elevated Cho/Cr in the posterior cingulate gyrus region in cognitively unimpaired participants was associated with an increased Aβ load on PET with flutemetamol, but only in amyloid PET positive cognitively unimpaired participants [61]. Interestingly, when the CU group classified as amyloid positive based on CSF Aβ42 levels instead of PET, Cho/Cr was no longer associated with Aβ load on PET or CSF Aβ load [61]. This suggest that Aβ load in CSF and PET might be capturing distinct aspect of amyloid pathology. In addition, the variability in CSF Aβ42 level in these participants might have influenced the relationship between Cho/Cr and amyloid load, making the association less detectable in the Aβ positive group based on CSF analysis.
Spotorno et al. reported no correlation between tCho/tCr and Aβ and tau load on PET, and no moderation effect of APOE ε4 genotype on these associations in a cohort consisting of CU (Aβ negative and Aβ positive on PET), MCI (Aβ positive on PET) [50]. Most recently, Chen et al. reported no change in Cho/Cr between normal (A−T−N− and A+T-N-), biologically defined early AD (A+T+N−) and late AD (A+T+N+) groups [52]. The results of Sportorno et al. are not fully in line with result from those of Kantarci et al. (2011) which might be attributed to differences in the characteristics of participants among the studies. The participants in the study by Kantarci et al. (2011) were relatively older than those enrolled in the study by Sportorno et al. (2022). This suggests that the association between Cho and Aβ load on PET might be more detectable when neuropathological alterations have progressed further in older participants.
4.4. Glx and Glu
Rieze et al. reported no association between Glx and Aβ deposition on PiB PET (global and local [posterior cingulate gyrus]) in a cohort consist of participants with amnestic MCI and cognitively unimpaired participants [63]. Zeydan et al. reported a decrease in Glu and Glu/mIns ratio in the amnestic MCI group (Aβ positive on PET with PiB) compared to the cognitively unimpaired group (Aβ negative on PET with PiB) in the posterior cingulate gyrus [59]. A decrease in Glu/mIns ratio was associated with a higher global cortical Aβ deposition in whole cohort consist of amnestic MCI and cognitively unimpaired participants [59]. In addition, the study reported that this correlation was not present when groups (participants with amnestic MCI and cognitively unimpaired participants) were analyzed independently. Only few studies have investigated the association between 1H MRS metabolites and both tau and amyloid loads on PET in cognitively unimpaired individuals and patients with AD. An increase in the posterior cingulate gyrus tau deposition on PET with 18F-flortaucipir was associated with lower Glu/tCr ratios in cognitively unimpaired older adults [53] (Figure 2) and biological sex modified this association. However, association between Glu/tCr and Aβ deposition on PET with PIB was not statistically significant. Chen et al. categorized their cohort as cognitively unimpaired controls (A−T−N− and A+T-N-), early AD (A+T+N−), and late AD (A+T+N+) dementia using PET and MRI data. The study reported no difference in Glu/tCr across groups (controls, biologically defined early AD and late AD). Matsuaoka et al. reported that a decrease in Glu/tCr in posterior cingulate was associated with an increase in tau load on PET with florzolatau in participants AD dementia [49]. Riese et al. (2015) studied a cohort of MCI and healthy controls and found no difference in Glx between groups categorized as Aβ negative and Aβ positive on PET [63].
4.5. GABA
GABAergic dysfunction has been reported in the AD continuum [100]. Some studies reported lower GABA/Cr in patients with AD dementia [100], others found no change in GABA levels compared to controls [87]. Rieze et al. reported that similar GABA levels in posterior cingulate gyrus among groups classified as Aβ positive and negative on PET [63]. The study also reported no correlation between GABA and Aβ deposition on PiB PET (global and local [posterior cingulate gyrus]) in a cohort consist of participants with amnestic MCI and no cognitive impairment.
4.6. GSH
In cognitively unimpaired participants, a negative correlation between GSH levels (posterior cingulate gyrus) and brain amyloid load on PET (PiB) in the temporal and parietal regions was reported suggesting preclinical changes in GSH level might be early biomarker of AD pathology [58]. In a recent study, no difference in GSH/tCr (posterior cingulate gyrus) across groups (controls: A-T-N- and A+T-N-;biologically defined early AD: A+T+N- and late AD: A+T+N+ ) was found [52]. Further research is needed to explore the relationship between GSH levels and Aβ and tau pathology [92].
5. Association of 1H MRS Metabolites with Biofluid Biomarkers
The emergence of blood-based plasma biomarkers represents a major recent breakthrough in identifying biological indicators of AD. These biofluid biomarkers are non-invasive, readily accessible, and cost-effective, making them crucial for detecting AD throughout its preclinical, prodromal and dementia stages. The most extensively evaluated AD-related plasma biomarkers include Aβ, especially Aβ40, Aβ42, and their ratio Aβ42/Aβ40, phosphorylated tau (p-tau) protein at epitopes 181, 217, and 231 (p-tau181, p-tau217, and p-tau231) which reflect neuritic plaques and neurofibrillary tangle pathologies [101,102,103]. It has been demonstrated that Aβ42/Aβ40 ratio in plasma correlates with CSF AD biomarkers, and amyloid PET [104,105,106]. Similarly, the level of p-tau proteoforms were associated with CSF, PET, and post-mortem AD neuropathological markers [107,108,109,110].
Plasma neurofilament light chain (NfL) and glial fibrillary acidic protein (GFAP) have been commonly studied in AD research [101,102,103]. The NfL is a marker of neuroaxonal damage, and elevated NfL is associated with progression of neurodegenerative disorders such as AD, Huntington’s disease, Multiple Sclerosis [111,112]. Interestingly, it has been reported that plasma NfL but not CSF NfL was significantly associated with cognition [113] suggesting CSF and plasma biomarkers might provide complementary information rather than being directly interchangeable. Plasma GFAP, a marker of astrocytic activation, is associated with the elevated risk and severity of AD type and non-AD type dementia [114,115]. While biofluid AD markers in plasma can also be measured in CSF, lumbar punctures, however, are burdensome and costly, and requires specialized training, limiting their use, if serial assessment is required.
5.1. NAA
Lower medial temporal lobe NAA was correlated with lower CSF Aβ42 within patients with AD dementia [66]. Neither CSF tau nor CSF pTau181 were correlated with NAA within all dementia group (i.e. AD dementia, non-AD dementia, MCI of AD type and MCI of non-AD type) or any individual dementia groups. Bittner et al. studied the correlation of hippocampal, posterior cingulate gyrus and right parietal gyrus NAA with CSF Aβ42, CSF p- and t-tau in cognitively unimpaired and AD dementia patients [65]. Lower hippocampal NAA/Cr ratio in patients with AD dementia was associated with lower CSF Aβ42 levels, but not with CSF p-tau or t-tau, whereas lower parietal NAA/Cr was associated with higher CSF p-tau, but not with CSF Aβ42, or t-tau [65]. Voevodska et al. (2016) showed that NAA/Cr ratio in posterior cingulate gyrus was lower in MCI (CSF Aβ42 positive) compared to cognitively unimpaired individuals (CSF Aβ42 negative) [61]. Voevodskaya et al. (2019) reported that estimated rate of change in NAA/Cr in the posterior cingulate gyrus was -2.0%/year in a cohort consist of cognitively normal controls, mild cognitive impairment, and subject with cognitive decline who were classified based on their CSF Aβ load as CSF Aβ positive or CSF Aβ negative at baseline [54]. However, the estimated rate of change of NAA/Cr was not significant in CSF Aβ negative group. The metabolite ratios were also compared based within CSF Aβ positive and negative groups at baseline (visit 1), visit 2 and visit 3 with a gap of approximately 2 years between visits. It was shown that NAA/Cr ratio was lower in CSF Aβ negative group compared to CSF Aβ positive group at visit 2 and visit 3 [54].
Hone-Blanchet reported that tNAA in the medial frontal cortex did not change among older women categorized as cognitively unimpaired Aβ positive, cognitively unimpaired Aβ negative and MCI (Aβ positive) groups [51]. Furthermore, CSF Aβ 42 levels were not associated with level of tNAA and other metabolites (e.g., tCho, tNAA/mIns, Glx, mIns, GABA, GABA/tCr) [51]. Matsuoka et al. showed that there was a significant association between increased plasma NfL and a decreased tNAA/tCr in the right dorsolateral prefrontal cortex of participants with AD dementia; however, there was only a trend of association between elevated plasma NfL and decreased tNAA/tCr from the posterior cingulate gyrus, but this correlation did not reach statistically significance.
These studies highlight the value of integrating data from AD-specific CSF and plasma markers. Combination of both fluid and MRS biomarkers can track the progression of cognitive decline during the preclinical and prodromal phases of AD [54]. These studies also show that there are regional differences regarding how MRS metabolites correlated with AD CSF biomarkers which might be related with regional progression of NFT and amyloid pathology.
5.2. mIns
A serial MRI/MRS study was conducted in cognitively unimpaired individuals for 7 years [57]. Seven years after the baseline measurements, CSF and 1H MRS data were collected in subjects who were converted to MCI/AD, Parkinson’s disease, and dementia with Lewy bodies. The study demonstrated that CSF Aβ42, CSF p-tau were not correlated with NAA/mIns ratio in this cohort. Voevodska et al. (2019) showed that there were no differences between NAA/mIns in posterior cingulate gyrus/precuneus region between CSF Aβ42 positive and Aβ42 negative participants (60 years or older) at baseline (visit 1) in a longitudinal design. However approximately 2.3 years (visit 2), and approximately 4 years (visit 3) after the baseline visit, a decrease in NAA/mIns in CSF Aβ42 positive compared to CSF Aβ42 negative participants was observed. The study reported that being CSF Aβ42 positive at visit 1 was associated with a decrease in NAA/mIns over time in all cohort (CSF Aβ42 positive and negative cases) (the model was adjusted for baseline age, sex, and APOE ε4 carriership). Furthermore, the study reported that a higher rate of change in the MCI CSF Aβ42 positive participants compared to MCI CSF Aβ42 negative participants [54]. Hone-Blanchet reported that mIns/tCr ratio in the medial frontal cortex was elevated in MCI (CSF Aβ positive) compared to cognitively unimpaired CSF Aβ negative and Aβ positive women [51]. In another study, an increase in plasma GFAP associated with elevated mIns/tCr in posterior cingulate gyrus/precuneus region in a cohort consist of cognitively unimpaired (Aβ negative and positive on PET with flutemetamol) and MCI (Aβ positive on PET) participants who were APOE ε4 carriers [50].
5.3. Cho
Voevodska et al. (2016) reported that Cho/Cr in participants with MCI (all CSF Aβ42 positive) was higher compared to cognitively unimpaired participants who were CSF Aβ42 negative. Voevodska et al. (2019) showed that there were no differences between Cho/Cr in posterior cingulate gyrus/precuneus region between CSF Aβ42 positive and CSF Aβ42 negative participants (60 years or older participants) at baseline (visit 1)[54]. However approximately 2.3 years (visit 2) after the baseline visit, an increase in Cho/tCr ratio in CSF Aβ42 positive compared to CSF Aβ42 negative participants was observed when the groups compared with each other at the same visit. There was no difference in Cho/Cr ratios among CSF Aβ42 positive and negative groups at visit 3 (approximately 4 years after the baseline)[54].
5.4. Glu
Matsuoka et al showed that there was a significant association between increased plasma NfL and a decreased Glu/tCr in the right dorsolateral prefrontal cortex of participants with AD dementia, and there was only a trend of association between elevated plasma NfL and decreased Glu/tCr in the posterior cingulate gyrus, but this correlation did not reach statistical significance [49].
5.5. GABA
Hone-Blanchet et al. demonstrated that GABA levels in the medial frontal cortex of participants with MCI were lower compared to cognitively unimpaired participants (CSF Aβ42 positive and Aβ42 negative) Blanchet et al., 2022). While older age was correlated with lower GABA levels in both cognitively unimpaired participants CSF Aβ42 positive and Aβ42 negative participants, CSF biomarkers (Aβ42, t-tau and p-tau) were not associated with GABA, and GABA/Cr levels.
6. Influence APOE ε4 Allele on 1H MRS Metabolites
Carrying one or two copies of APOE ε4 allele elevates the risk factor for late-onset AD dementia. A recent study showed that almost all participants who were homozygotes for e4 allele (ε4/ε4) exhibited AD pathology (A+T+N+)[48]. However, only few studies investigated whether APOE ε4 carrier status effect the metabolite levels or e4 carrier status modify the relationship between 1H MRS metabolites and AD biomarkers. Some studies reported no effect of APOE ε4 carrier status on metabolite levels, and their association of with AD biomarkers (Aβ and tau load), but others reported that APOE ε4 allele carrier status effects the metabolite levels and/or the relationship between the metabolites and AD biomarkers [40,48,50,56,57,60,61,62,63,69,70].
No differences in metabolite ratios (NAA/Cr, mIns/Cr, NAA/mIns) were found across APOE genotype (i.e., e4 carriers and non-carriers) within cognitively unimpaired control and patient (MCI+AD dementia) group [69]. Riese et al. reported no difference in GABA and Glx levels between APOE ε4 carriers and non-carriers in a cohort consisting of cognitively unimpaired individuals and those with amnestic MCI [63]. In another study, no difference in mIns/Cr between APOE ε4 carriers and non-carriers was found in a cohort which included both cognitively unimpaired participants and subjects with amnestic MCI [62]. In line with this study, Voevodska et al. reported that APOE ε4 allele carrier status did not affect the mIns/Cr levels (posterior cingulate gyrus) across cognitively unimpaired CSF Aβ42 positive, and CSF Aβ42 negative, MCI groups (CSF Aβ42 positive) [61]. Nedeslska et al. reported that APOE ε4 allele carrier status did not modify the relationship between MRS metabolites (NAA/mIns, mIns/Cr) and rate of Aβ deposition on serial PET [60]. A serial MRI/MRS study was conducted in cognitively unimpaired individuals for 7 years [57]. At baseline, the mIns/Cr ratio was elevated in subjects with two copies of the APOE ε4 allele compared to non-carriers. Additionally, the NAA/mIns ratio was significantly decreased in subjects who were homozygous for the APOE ε4 allele compared to those who were heterozygous for the APOE ε4 allele and non-carriers. However, the NAA/Cr ratio showed no significant difference between subjects with and without the APOE ε4 allele [57]. Suri et al. showed that there was no significant effect of three APOE groups (e3 carrier, e3 homozygotes, e4 carriers) or an interaction between APOE groups and age on the metabolite profile in the posterior cingulate gyrus in individuals who were younger (between 20-40 years old) and cognitively unimpaired older age cohort (between 60 and 85 years old) [56]. In a cohort composed of subjects without cognitive impairment and with MCI who were APOE ε4 allele carriers, no association between tau load on PET with mIns/tCr (posterior cingulate gyrus) were observed [50].
In postmortem perchloric acid brain extracts, an increase in mIns and GPC, a decrease in Glu and NAA was observed in AD brains with APOE e3/e3 allele carriers status compared to normal control brains with APOE e3/e3 allele carrier status [70]. The study also reported differences between e3/e3 AD and e4/e4 AD brains. For example, NAA was lower, and GPC was higher in e4/e4 AD brains compared to e3/e3 AD brains. We reported NAA/Cr ratio of patients with AD dementia significantly correlated with APOE ε4 carrier status [40]. Riese et al. reported that NAA levels were lower in cohort of participants who were cognitively unimpaired participants and those with amnestic MCI, who had APOE ε4 allele compared to those without it [63]. A recent study compared metabolite ratios of cognitively unimpaired group who were carrying two copies of APOE ε4 allele (i.e. APOE ε4 homozygotes) with non-carriers [57]. The study reported a higher mIns/Cr in APOE ε4/ ε4 homozygotes compared to non ε4 carriers. Furthermore, a decrease in NAA/mIns ratio was reported in those with ε4/ ε4carriers compared with subjects with only one copy of ε4 allele. A recent study using voxel wise analysis demonstrated an association between elevated Aβ load on PET with increased mIns/tCr ratio (posterior cingulate gyrus) only in APOE ε4 allele carrier group (cognitively unimpaired + MCI) [50]. A recent study investigated the influence of APOE ε4 carrier status on the relationship between GABA and Glu (posterior cingulate gyrus) and Aβ load on PET. The study reported that elevated gray matter GABA and Glu was associated with higher Aβ load on PET with positive effect modification by APOE ε4 allele carrier status [48].
More research is needed to understand the impact of APOE ε4 on 1H MRS metabolites. While some findings suggest significant alterations in certain metabolite ratios among APOE ε4 carriers, particularly homozygotes, further research is needed to clarify these relationships and their implications for understanding and diagnosing AD.
7. Future Directions
AD biomarker (PET, CSF, plasma) and MRS studies suggest that the association of 1H MRS with Aβ and/or tau pathology may vary based on the AD stage and the topographical heterogeneity of the disease, with these associations being region-specific. For example, some studies observed an association between 1H MRS metabolites, such as NAA, and Aβ load on PET in a cohort involving participants with prodromal and AD dementia stages of the disease. In contrast, the association between 1H MRS metabolites (NAA/Cr and Glu/Cr) and tau load on PET was detected even at the preclinical stage in cognitively unimpaired participants. These findings indicate that correlations between AD biomarkers and 1H MRS metabolites vary by region, which may be related to the spatial progressions of amyloid and tau pathologies. For example, amyloid pathology progresses from the neocortical regions to the limbic and subcortical regions, while tau pathology begins in transentorhinal cortex and spreads to the paralimbic and neocortical areas [116,117]. While considering the association between metabolic changes in the various brain regions with AD biomarkers (PET, CSF, plasma), it is crucial to consider the spatial and temporal dynamics of amyloid and tau pathologies to understand the underlying mechanisms of AD progression.
Various studies reported conflicting findings regarding the association of brain metabolites with Aβ/tau pathology. These differences can be partially attributed to variations in cohort characteristics, acquisition and quantification methodologies, disease stage and progression, and genetic factors. Variability in the characteristics populations studied, including differences in age, cognitive status (cognitively unimpaired, MCI, AD dementia), and genetic factors (e.g., APOE status and carrying one of two copies of ε4 allele), and race, can influence the outcomes. Some studies focused on cognitively unimpaired individuals, while others included participants with amnestic MCI or MCI and AD dementia or mix groups. There are also methodological variations between studies. Some studies used higher field MRS and other used relatively lower field MRS with varying acquisition protocols and regions of interest. Advanced techniques such as the sLASER protocol coupled with automated volume of interest prescription may provide increased sensitivity and specificity compared to other methods [118]. Variation in the disease staging might be a source of contrasting findings. The relationship between metabolites and AD biomarkers may not be as pronounced as in later stages, where significant neuronal loss and metabolic changes are more evident. Understanding these differences may help in interpreting the results and drawing more comprehensive conclusions about the underlying biochemical processes in AD.
Ultra-high field MR clinical systems (7T and higher) offer promising opportunities, including enhanced spectral resolution, improved signal-to-noise ratio, and reliable quantification of low-concentration metabolites like Glu, Glc, Gln, GSH, and GABA. Further research is required to fully understand and harness the clinical potential of ultra-high-field MRS in the AD continuum.
¹H MRS holds significant promise for monitoring disease progression, especially in clinical trials targeting early predementia pathology. Future studies should focus on evaluating the potential of ¹H MRS alongside plasma biomarkers in this setting, with careful consideration given to underrepresented racial and ethnic groups, as well as the role of biological sex as a variable [119].
There are ongoing affords to harmonize, standardize and optimize 1H MRS methods for both single-center and multicenter studies [120,121,122,123]. Future MRS studies should consider the consensus recommendations from experts to facilitate multicenter studies and ensure reproducibility of results [121]. Recent advancements in 1H MRS including the automated volume of interest prescription pipeline [118] which enables fast and automated voxel placement and eliminates the requirement of manual voxel placement, and enables higher inter- and intra-subject consistency of voxel placement, would enhance the clinical integration of MRS and enhance its use in clinical trials as an outcome measure [118]. Furthermore, future MRS studies can incorporate the advanced MRS protocols such as modified sLASER to overcome limitations of conventional MRS sequences such as chemical shift displacement errors at 3T and 7T [121].
Overall, integrating advancements in 1H MRS with recent developments in AD biomarkers field offer a comprehensive approach to understand disease progression, and evaluating treatment strategies.
References
- 2024 Alzheimer's disease facts and figures. Alzheimers Dement 2024, 20, 3708–3821. [CrossRef]
- van Dyck, C.H.; Swanson, C.J.; Aisen, P.; Bateman, R.J.; Chen, C.; Gee, M.; Kanekiyo, M.; Li, D.; Reyderman, L.; Cohen, S.; Froelich, L.; Katayama, S.; Sabbagh, M.; Vellas, B.; Watson, D.; Dhadda, S.; Irizarry, M.; Kramer, L.D.; Iwatsubo, T. Lecanemab in Early Alzheimer's Disease. N Engl J Med 2023, 388, 9–21. [Google Scholar] [CrossRef] [PubMed]
- Jack, C.R.; Knopman, D.S.; Jagust, W.J.; Petersen, R.C.; Weiner, M.W.; Aisen, P.S.; Shaw, L.M.; Vemuri, P.; Wiste, H.J.; Weigand, S.D.; Lesnick, T.G.; Pankratz, V.S.; Donohue, M.C.; Trojanowski, J.Q. Tracking pathophysiological processes in Alzheimer's disease: An updated hypothetical model of dynamic biomarkers. The Lancet Neurology 2013, 12, 207–216. [Google Scholar] [CrossRef] [PubMed]
- Bateman, R.J.; Xiong, C.; Benzinger, T.L.; Fagan, A.M.; Goate, A.; Fox, N.C.; Marcus, D.S.; Cairns, N.J.; Xie, X.; Blazey, T.M.; Holtzman, D.M.; Santacruz, A.; Buckles, V.; Oliver, A.; Moulder, K.; Aisen, P.S.; Ghetti, B.; Klunk, W.E.; McDade, E.; Martins, R.N.; Masters, C.L.; Mayeux, R.; Ringman, J.M.; Rossor, M.N.; Schofield, P.R.; Sperling, R.A.; Salloway, S.; Morris, J.C. Clinical and biomarker changes in dominantly inherited Alzheimer's disease. N Engl J Med 2012, 367, 795–804. [Google Scholar] [CrossRef] [PubMed]
- Villemagne, V.L.; Burnham, S.; Bourgeat, P.; Brown, B.; Ellis, K.A.; Salvado, O.; Szoeke, C.; Macaulay, S.L.; Martins, R.; Maruff, P.; Ames, D.; Rowe, C.C.; Masters, C.L. Amyloid β deposition, neurodegeneration, and cognitive decline in sporadic Alzheimer's disease: A prospective cohort study. Lancet Neurol 2013, 12, 357–367. [Google Scholar] [CrossRef]
- Jack, C.R., Jr.; Bennett, D.A.; Blennow, K.; Carrillo, M.C.; Dunn, B.; Haeberlein, S.B.; Holtzman, D.M.; Jagust, W.; Jessen, F.; Karlawish, J.; Liu, E.; Molinuevo, J.L.; Montine, T.; Phelps, C.; Rankin, K.P.; Rowe, C.C.; Scheltens, P.; Siemers, E.; Snyder, H.M.; Sperling, R. NIA-AA Research Framework: Toward a biological definition of Alzheimer's disease. Alzheimers Dement 2018, 14, 535–562. [Google Scholar] [CrossRef] [PubMed]
- Jack, C.R., Jr.; Andrews, J.S.; Beach, T.G.; Buracchio, T.; Dunn, B.; Graf, A.; Hansson, O.; Ho, C.; Jagust, W.; McDade, E.; Molinuevo, J.L.; Okonkwo, O.C.; Pani, L.; Rafii, M.S.; Scheltens, P.; Siemers, E.; Snyder, H.M.; Sperling, R.; Teunissen, C.E.; Carrillo, M.C. Revised criteria for diagnosis and staging of Alzheimer's disease: Alzheimer's Association Workgroup. Alzheimer's & Dementia 2016, 1–27. [Google Scholar]
- Dubois, B.; Hampel, H.; Feldman, H.H.; Scheltens, P.; Aisen, P.; Andrieu, S.; Bakardjian, H.; Benali, H.; Bertram, L.; Blennow, K.; Broich, K.; Cavedo, E.; Crutch, S.; Dartigues, J.F.; Duyckaerts, C.; Epelbaum, S.; Frisoni, G.B.; Gauthier, S.; Genthon, R.; Gouw, A.A.; Habert, M.O.; Holtzman, D.M.; Kivipelto, M.; Lista, S.; Molinuevo, J.L.; O'Bryant, S.E.; Rabinovici, G.D.; Rowe, C.; Salloway, S.; Schneider, L.S.; Sperling, R.; Teichmann, M.; Carrillo, M.C.; Cummings, J.; Jack, C.R.; Proceedings of the Meeting of the International Working, G. ; the American Alzheimer's Association on "The Preclinical State of, A.D.; July; Washington Dc, U.S.A. Preclinical Alzheimer's disease: Definition, natural history, and diagnostic criteria. Alzheimers Dement 2016, 12, 292–323. [Google Scholar] [CrossRef]
- Dubois, B.; Villain, N.; Frisoni, G.B.; Rabinovici, G.D.; Sabbagh, M.; Cappa, S.; Bejanin, A.; Bombois, S.; Epelbaum, S.; Teichmann, M.; Habert, M.O.; Nordberg, A.; Blennow, K.; Galasko, D.; Stern, Y.; Rowe, C.C.; Salloway, S.; Schneider, L.S.; Cummings, J.L.; Feldman, H.H. Clinical diagnosis of Alzheimer's disease: Recommendations of the International Working Group. Lancet Neurol 2021, 20, 484–496. [Google Scholar] [CrossRef]
- Valenzuela, M.J.; Sachdev, P. Magnetic resonance spectroscopy in AD. Neurology 2001, 56, 592–598. [Google Scholar] [CrossRef]
- Firbank, M.J.; Harrison, R.M.; O’Brien, J.T. A Comprehensive Review of Proton Magnetic Resonance Spectroscopy Studies in Dementia and Parkinson’s Disease. Dementia and Geriatric Cognitive Disorders 2002, 14, 64–76. [Google Scholar] [CrossRef]
- McKiernan, E.; Su, L.; O'Brien, J. MRS in neurodegenerative dementias, prodromal syndromes and at-risk states: A systematic review of the literature. NMR in Biomedicine 2023, 36, e4896. [Google Scholar] [CrossRef] [PubMed]
- Gao, F.; Barker, P.B. Various MRS Application Tools for Alzheimer Disease and Mild Cognitive Impairment. American Journal of Neuroradiology 2014, (6 suppl), S4–S11. [Google Scholar] [CrossRef]
- Piersson, A.D.; Mohamad, M.; Rajab, F.; Suppiah, S. Cerebrospinal Fluid Amyloid Beta, Tau Levels, Apolipoprotein, and 1H-MRS Brain Metabolites in Alzheimer's Disease: A Systematic Review. Academic Radiology 2021, 28, 1447–1463. [Google Scholar] [CrossRef] [PubMed]
- Wang, H.; Tan, L.; Wang, H.F.; Liu, Y.; Yin, R.H.; Wang, W.Y.; Chang, X.L.; Jiang, T.; Yu, J.T. Magnetic Resonance Spectroscopy in Alzheimer's Disease: Systematic Review and Meta-Analysis. Journal of Alzheimer's Disease 2015, 46, 1049–1070. [Google Scholar] [CrossRef] [PubMed]
- Sheikh-Bahaei, N.; Chen, M.; Pappas, I. Magnetic Resonance Spectroscopy (MRS) in Alzheimer's Disease. Methods Mol Biol 2024, 2785, 115–142. [Google Scholar]
- Zhang, N.; Song, X.; Bartha, R.; Beyea, S.; D'Arcy, R.; Zhang, Y.; Rockwood, K. Advances in high-field magnetic resonance spectroscopy in Alzheimer's disease. Curr Alzheimer Res 2014, 11, 367–388. [Google Scholar] [CrossRef]
- Graff-Radford, J.; Kantarci, K. Magnetic resonance spectroscopy in Alzheimer’s disease. Neuropsychiatric Disease and Treatment 2013, 9, 687–696. [Google Scholar]
- Murray, M.E.; Przybelski, S.A.; Lesnick, T.G.; Liesinger, A.M.; Spychalla, A.; Zhang, B.; Gunter, J.L.; Parisi, J.E.; Boeve, B.F.; Knopman, D.S.; Petersen, R.C.; Jack, C.R., Jr.; Dickson, D.W.; Kantarci, K. Early Alzheimer's disease neuropathology detected by proton MR spectroscopy. J Neurosci 2014, 34, 16247–16255. [Google Scholar] [CrossRef]
- Öz, G.; Alger, J.R.; Barker, P.B.; Bartha, R.; Bizzi, A.; Boesch, C.; Bolan, P.J.; Brindle, K.M.; Cudalbu, C.; Dinçer, A.; Dydak, U.; Emir, U.E.; Frahm, J.; González, R.G.; Gruber, S.; Gruetter, R.; Gupta, R.K.; Heerschap, A.; Henning, A.; Hetherington, H.P.; Howe, F.A.; Hüppi, P.S.; Hurd, R.E.; Kantarci, K.; Klomp, D.W.J.; Kreis, R.; Kruiskamp, M.J.; Leach, M.O.; Lin, A.P.; Luijten, P.R.; Marjańska, M.; Maudsley, A.A.; Meyerhoff, D.J.; Mountford, C.E.; Nelson, S.J.; Pamir, M.N.; Pan, J.W.; Peet, A.C.; Poptani, H.; Posse, S.; Pouwels, P.J.W.; Ratai, E.-M.; Ross, B.D.; Scheenen, T.W.J.; Schuster, C.; Smith, I.C.P.; Soher, B.J.; Tkáč, I.; Vigneron, D.B.; Kauppinen, R.A.; Group, F. t. M. C. Clinical Proton MR Spectroscopy in Central Nervous System Disorders. Radiology 2014, 270, 658–679. [Google Scholar] [CrossRef]
- Moffett, J.R.; Ross, B.; Arun, P.; Madhavarao, C.N.; Namboodiri, A.M. N-Acetylaspartate in the CNS: From neurodiagnostics to neurobiology. Progress in neurobiology 2007, 81, 89–131. [Google Scholar] [CrossRef]
- Luyten, P.R.; den Hollander, J.A. Observation of metabolites in the human brain by MR spectroscopy. Radiology 1986, 161, 795–798. [Google Scholar] [CrossRef]
- Urenjak, J.; Williams, S.R.; Gadian, D.G.; Noble, M. Specific expression of N-acetylaspartate in neurons, oligodendrocyte-type-2 astrocyte progenitors, and immature oligodendrocytes in vitro. J Neurochem 1992, 59, 55–61. [Google Scholar] [CrossRef]
- Tallan, H.H. Studies on the distribution of N-acetyl-L-aspartic acid in brain. J Biol Chem 1957, 224, 41–45. [Google Scholar] [CrossRef] [PubMed]
- de Graaf, R.A. In vivo NMR Spectroscopy: Principles and techniques. 2nd ed. Hoboken, NJ: Wiley,. Wiley: 2007; p 592.
- Miller, B.L.; Moats, R.A.; Shonk, T.; Ernst, T.; Woolley, S.; Ross, B.D. Alzheimer disease: Depiction of increased cerebral myo-inositol with proton MR spectroscopy. Radiology 1993, 187, 433–437. [Google Scholar] [CrossRef] [PubMed]
- Huang, W.; Alexander, G.E.; Chang, L.; Shetty, H.U.; Krasuski, J.S.; Rapoport, S.I.; Schapiro, M.B. Brain metabolite concentration and dementia severity in Alzheimer's disease: A (1)H MRS study. Neurology 2001, 57, 626–632. [Google Scholar] [CrossRef]
- Moats, R.A.; Ernst, T.; Shonk, T.K.; Ross, B.D. Abnormal cerebral metabolite concentrations in patients with probable Alzheimer disease. Magn Reson Med 1994, 32, 110–115. [Google Scholar] [CrossRef] [PubMed]
- Shonk, T.K.; Moats, R.A.; Gifford, P.; Michaelis, T.; Mandigo, J.C.; Izumi, J.; Ross, B.D. Probable Alzheimer disease: Diagnosis with proton MR spectroscopy. Radiology 1995, 195, 65–72. [Google Scholar] [CrossRef] [PubMed]
- Frederick, B.B.; Satlin, A.; Yurgelun-Todd, D.A.; Renshaw, P.F. In vivo proton magnetic resonance spectroscopy of Alzheimer's disease in the parietal and temporal lobes. Biol Psychiatry 1997, 42, 147–150. [Google Scholar] [CrossRef]
- Parnetti, L.; Tarducci, R.; Presciutti, O.; Lowenthal, D.T.; Pippi, M.; Palumbo, B.; Gobbi, G.; Pelliccioli, G.P.; Senin, U. Proton magnetic resonance spectroscopy can differentiate Alzheimer's disease from normal aging. Mech Ageing Dev 1997, 97, 9–14. [Google Scholar] [CrossRef]
- Jessen, F.; Block, W.; Träber, F.; Keller, E.; Flacke, S.; Papassotiropoulos, A.; Lamerichs, R.; Heun, R.; Schild, H.H. Proton MR spectroscopy detects a relative decrease of N-acetylaspartate in the medial temporal lobe of patients with AD. Neurology 2000, 55, 684–688. [Google Scholar] [CrossRef]
- Christiansen, P.; Schlosser, A.; Henriksen, O. Reduced N-acetylaspartate content in the frontal part of the brain in patients with probable Alzheimer's disease. Magnetic Resonance Imaging 1995, 13, 457–462. [Google Scholar] [CrossRef] [PubMed]
- Antuono, P.G.; Jones, J.L.; Wang, Y.; Li, S.J. Decreased glutamate + glutamine in Alzheimer's disease detected in vivo with (1)H-MRS at 0.5 T. Neurology 2001, 56, 737–742. [Google Scholar] [CrossRef] [PubMed]
- Dixon, R.M.; Bradley, K.M.; Budge, M.M.; Styles, P.; Smith, A.D. Longitudinal quantitative proton magnetic resonance spectroscopy of the hippocampus in Alzheimer's disease. Brain 2002, 125 Pt 10 Pt 10, 2332–2341. [Google Scholar] [CrossRef]
- Catani, M.; Cherubini, A.; Howard, R.; Tarducci, R.; Pelliccioli, G.P.; Piccirilli, M.; Gobbi, G.; Senin, U.; Mecocci, P. (1)H-MR spectroscopy differentiates mild cognitive impairment from normal brain aging. Neuroreport 2001, 12, 2315–2317. [Google Scholar] [CrossRef] [PubMed]
- Kantarci, K.; Petersen, R.C.; Boeve, B.F.; Knopman, D.S.; Tang-Wai, D.F.; O'Brien, P.C.; Weigand, S.D.; Edland, S.D.; Smith, G.E.; Ivnik, R.J.; Ferman, T.J.; Tangalos, E.G.; Jack, C.R., Jr. 1H MR spectroscopy in common dementias. Neurology 2004, 63, 1393–1398. [Google Scholar] [CrossRef]
- Shiino, A.; Watanabe, T.; Shirakashi, Y.; Kotani, E.; Yoshimura, M.; Morikawa, S.; Inubushi, T.; Akiguchi, I. The profile of hippocampal metabolites differs between Alzheimer's disease and subcortical ischemic vascular dementia, as measured by proton magnetic resonance spectroscopy. J Cereb Blood Flow Metab 2012, 32, 805–815. [Google Scholar] [CrossRef]
- Hattori, N.; Abe, K.; Sakoda, S.; Sawada, T. Proton MR spectroscopic study at 3 Tesla on glutamate/glutamine in Alzheimer's disease. Neuroreport 2002, 13, 183–186. [Google Scholar] [CrossRef]
- Kantarci, K.; Jack, C.R.; Xu, Y.C.; Campeau, N.G.; O’Brien, P.C.; Smith, G.E.; Ivnik, R.J.; Boeve, B.F.; Kokmen, E.; Tangalos, E.G.; Petersen, R.C. Regional metabolic patterns in mild cognitive impairment and Alzheimer’s disease. A 1H MRS study 2000, 55, 210–217. [Google Scholar] [CrossRef]
- Michaelis, T.; Merboldt, K.D.; Hänicke, W.; Gyngell, M.L.; Bruhn, H.; Frahm, J. On the identification of cerebral metabolites in localized 1H NMR spectra of human brain in vivo. NMR Biomed 1991, 4, 90–98. [Google Scholar] [CrossRef]
- Govindaraju, V.; Young, K.; Maudsley, A.A. Proton NMR chemical shifts and coupling constants for brain metabolites. NMR Biomed 2000, 13, 129–153. [Google Scholar] [CrossRef]
- Rae, C.D. A guide to the metabolic pathways and function of metabolites observed in human brain 1H magnetic resonance spectra. Neurochem Res 2014, 39, 1–36. [Google Scholar] [CrossRef] [PubMed]
- Ratai, E.-M.; Alshikho, M.J.; Zürcher, N.R.; Loggia, M.L.; Cebulla, C.L.; Cernasov, P.; Reynolds, B.; Fish, J.; Seth, R.; Babu, S.; Paganoni, S.; Hooker, J.M.; Atassi, N. Integrated imaging of [11C]-PBR28 PET, MR diffusion and magnetic resonance spectroscopy 1H-MRS in amyotrophic lateral sclerosis. NeuroImage: Clinical 2018, 20, 357–364. [Google Scholar] [CrossRef] [PubMed]
- Nutma, E.; Fancy, N.; Weinert, M.; Tsartsalis, S.; Marzin, M.C.; Muirhead, R.C.J.; Falk, I.; Breur, M.; de Bruin, J.; Hollaus, D.; Pieterman, R.; Anink, J.; Story, D.; Chandran, S.; Tang, J.; Trolese, M.C.; Saito, T.; Saido, T.C.; Wiltshire, K.H.; Beltran-Lobo, P.; Phillips, A.; Antel, J.; Healy, L.; Dorion, M.-F.; Galloway, D.A.; Benoit, R.Y.; Amossé, Q.; Ceyzériat, K.; Badina, A.M.; Kövari, E.; Bendotti, C.; Aronica, E.; Radulescu, C.I.; Wong, J.H.; Barron, A.M.; Smith, A.M.; Barnes, S.J.; Hampton, D.W.; van der Valk, P.; Jacobson, S.; Howell, O.W.; Baker, D.; Kipp, M.; Kaddatz, H.; Tournier, B.B.; Millet, P.; Matthews, P.M.; Moore, C.S.; Amor, S.; Owen, D.R. Translocator protein is a marker of activated microglia in rodent models but not human neurodegenerative diseases. Nat Commun 2023, 14, 5247. [Google Scholar] [CrossRef] [PubMed]
- Best, J.G.; Stagg, C.J.; Dennis, A. Chapter 2.5 - Other Significant Metabolites: Myo-Inositol, GABA, Glutamine, and Lactate. In Magnetic Resonance Spectroscopy; Stagg, C., Rothman, D., Eds.; Academic Press: San Diego, 2014; pp. 122–138. [Google Scholar]
- Bitsch, A.; Bruhn, H.; Vougioukas, V.; Stringaris, A.; Lassmann, H.; Frahm, J.; Brück, W. Inflammatory CNS demyelination: Histopathologic correlation with in vivo quantitative proton MR spectroscopy. AJNR Am J Neuroradiol 1999, 20, 1619–1627. [Google Scholar]
- Schreiner, S.J.; Van Bergen, J.M.G.; Gietl, A.F.; Buck, A.; Hock, C.; Pruessmann, K.P.; Henning, A.; Unschuld, P.G. Gray matter gamma-hydroxy-butyric acid and glutamate reflect beta-amyloid burden at old age. Alzheimers Dement (Amst) 2024, 16, e12587. [Google Scholar] [CrossRef]
- Matsuoka, K.; Hirata, K.; Kokubo, N.; Maeda, T.; Tagai, K.; Endo, H.; Takahata, K.; Shinotoh, H.; Ono, M.; Seki, C.; Tatebe, H.; Kawamura, K.; Zhang, M.R.; Shimada, H.; Tokuda, T.; Higuchi, M.; Takado, Y. Investigating neural dysfunction with abnormal protein deposition in Alzheimer's disease through magnetic resonance spectroscopic imaging, plasma biomarkers, and positron emission tomography. Neuroimage Clin 2024, 41, 103560. [Google Scholar] [CrossRef]
- Spotorno, N.; Najac, C.; Stomrud, E.; Mattsson-Carlgren, N.; Palmqvist, S.; van Westen, D.; Ronen, I.; Hansson, O. Astrocytic function is associated with both amyloid-beta and tau pathology in non-demented APOE ϵ4 carriers. Brain Commun 2022, 4, fcac135. [Google Scholar] [CrossRef]
- Hone-Blanchet, A.; Bohsali, A.; Krishnamurthy, L.C.; Shahid, S.S.; Lin, Q.; Zhao, L.; Bisht, A.S.; John, S.E.; Loring, D.; Goldstein, F.; Levey, A.; Lah, J.; Qiu, D.; Crosson, B. Frontal Metabolites and Alzheimer's Disease Biomarkers in Healthy Older Women and Women Diagnosed with Mild Cognitive Impairment. J Alzheimers Dis 2022, 87, 1131–1141. [Google Scholar] [CrossRef]
- Chen, Q.; Abrigo, J.; Liu, W.; Han, E.Y.; Yeung, D.K.W.; Shi, L.; Au, L.W.C.; Deng, M.; Chen, S.; Leung, E.Y.L.; Ho, C.L.; Mok, V.C.T.; Chu, W.C.W. Lower Posterior Cingulate N-Acetylaspartate to Creatine Level in Early Detection of Biologically Defined Alzheimer's Disease. Brain Sci 2022, 12. [Google Scholar] [CrossRef]
- Kara, F.; Joers, J.M.; Deelchand, D.K.; Park, Y.W.; Przybelski, S.A.; Lesnick, T.G.; Senjem, M.L.; Zeydan, B.; Knopman, D.S.; Lowe, V.J.; Vemuri, P.; Mielke, M.M.; Machulda, M.M.; Jack, C.R.; Petersen, R.C.; Oz, G.; Kantarci, K. (1)H MR spectroscopy biomarkers of neuronal and synaptic function are associated with tau deposition in cognitively unimpaired older adults. Neurobiol Aging 2022, 112, 16–26. [Google Scholar] [CrossRef]
- Voevodskaya, O.; Poulakis, K.; Sundgren, P.; van Westen, D.; Palmqvist, S.; Wahlund, L.-O.; Stomrud, E.; Hansson, O.; Westman, E.; Swedish Bio, F.S.G. Brain myoinositol as a potential marker of amyloid-related pathology: A longitudinal study. Neurology 2019, 92, e395–e405. [Google Scholar] [CrossRef] [PubMed]
- Mullins, R.; Reiter, D.; Kapogiannis, D. Magnetic resonance spectroscopy reveals abnormalities of glucose metabolism in the Alzheimer's brain. Ann Clin Transl Neurol 2018, 5, 262–272. [Google Scholar] [CrossRef]
- Suri, S.; Emir, U.; Stagg, C.J.; Near, J.; Mekle, R.; Schubert, F.; Zsoldos, E.; Mahmood, A.; Singh-Manoux, A.; Kivimäki, M.; Ebmeier, K.P.; Mackay, C.E.; Filippini, N. Effect of age and the APOE gene on metabolite concentrations in the posterior cingulate cortex. Neuroimage 2017, 152, 509–516. [Google Scholar] [CrossRef] [PubMed]
- Waragai, M.; Moriya, M.; Nojo, T. Decreased N-Acetyl Aspartate/Myo-Inositol Ratio in the Posterior Cingulate Cortex Shown by Magnetic Resonance Spectroscopy May Be One of the Risk Markers of Preclinical Alzheimer's Disease: A 7-Year Follow-Up Study. J Alzheimers Dis 2017, 60, 1411–1427. [Google Scholar] [CrossRef] [PubMed]
- Chiang, G.C.; Mao, X.; Kang, G.; Chang, E.; Pandya, S.; Vallabhajosula, S.; Isaacson, R.; Ravdin, L.D.; Shungu, D.C. Relationships among Cortical Glutathione Levels, Brain Amyloidosis, and Memory in Healthy Older Adults Investigated In Vivo with (1)H-MRS and Pittsburgh Compound-B PET. AJNR Am J Neuroradiol 2017, 38, 1130–1137. [Google Scholar] [CrossRef] [PubMed]
- Zeydan, B.; Deelchand, D.K.; Tosakulwong, N.; Lesnick, T.G.; Kantarci, O.H.; Machulda, M.M.; Knopman, D.S.; Lowe, V.J.; Jack, C.R., Jr.; Petersen, R.C.; Öz, G.; Kantarci, K. Decreased Glutamate Levels in Patients with Amnestic Mild Cognitive Impairment: An sLASER Proton MR Spectroscopy and PiB-PET Study. J Neuroimaging 2017, 27, 630–636. [Google Scholar] [CrossRef]
- Nedelska, Z.; Przybelski, S.A.; Lesnick, T.G.; Schwarz, C.G.; Lowe, V.J.; Machulda, M.M.; Kremers, W.K.; Mielke, M.M.; Roberts, R.O.; Boeve, B.F.; Knopman, D.S.; Petersen, R.C.; Jack, C.R.; Kantarci, K. H-1-MRS metabolites and rate of beta-amyloid accumulation on serial PET in clinically normal adults. Neurology 2017, 89, 1391–1399. [Google Scholar] [CrossRef]
- Voevodskaya, O.; Sundgren, P.C.; Strandberg, O.; Zetterberg, H.; Minthon, L.; Blennow, K.; Wahlund, L.O.; Westman, E.; Hansson, O.; Swedish Bio, F. s. g. , Myo-inositol changes precede amyloid pathology and relate to APOE genotype in Alzheimer disease. Neurology 2016, 86, 1754–1761. [Google Scholar] [CrossRef]
- Yin, Z.; Wu, W.; Liu, R.; Liang, X.; Yu, T.; Chen, X.; Feng, J.; Guo, A.; Xie, Y.; Yang, H.; Huang, M.; Tian, C.; Zhang, B.; Xu, Y. APOE genotype and age modifies the correlation between cognitive status and metabolites from hippocampus by a 2D (1)H-MRS in non-demented elders. PeerJ 2015, 3, e1202–e1202. [Google Scholar] [CrossRef]
- Riese, F.; Gietl, A.; Zölch, N.; Henning, A.; O'Gorman, R.; Kälin, A.M.; Leh, S.E.; Buck, A.; Warnock, G.; Edden, R.A.E.; Luechinger, R.; Hock, C.; Kollias, S.; Michels, L. Posterior cingulate γ-aminobutyric acid and glutamate/glutamine are reduced in amnestic mild cognitive impairment and are unrelated to amyloid deposition and apolipoprotein E genotype. Neurobiology of aging 2015, 36, 53–59. [Google Scholar] [CrossRef]
- Gomar, J.J.; Gordon, M.L.; Dickinson, D.; Kingsley, P.B.; Uluğ, A.M.; Keehlisen, L.; Huet, S.; Buthorn, J.J.; Koppel, J.; Christen, E.; Conejero-Goldberg, C.; Davies, P.; Goldberg, T.E. APOE genotype modulates proton magnetic resonance spectroscopy metabolites in the aging brain. Biol Psychiatry 2014, 75, 686–692. [Google Scholar] [CrossRef]
- Bittner, D.M.; Heinze, H.J.; Kaufmann, J. Association of 1H-MR spectroscopy and cerebrospinal fluid biomarkers in Alzheimer's disease: Diverging behavior at three different brain regions. J Alzheimers Dis 2013, 36, 155–163. [Google Scholar] [CrossRef]
- Jessen, F.; Lewczuk, P.; Gür, O.; Block, W.; Ende, G.; Frölich, L.; Hammen, T.; Arlt, S.; Kornhuber, J.; Kucinski, T.; Popp, J.; Peters, O.; Maier, W.; Träber, F.; Wiltfang, J. Association of N-acetylaspartate and cerebrospinal fluid Aβ42 in dementia. J Alzheimers Dis 2011, 27, 393–399. [Google Scholar] [CrossRef] [PubMed]
- Kantarci, K.; Lowe, V.; Przybelski, S.A.; Senjem, M.L.; Weigand, S.D.; Ivnik, R.J.; Roberts, R.; Geda, Y.E.; Boeve, B.F.; Knopman, D.S.; Petersen, R.C.; Jack, C.R., Jr. Magnetic resonance spectroscopy, β-amyloid load, and cognition in a population-based sample of cognitively normal older adults. Neurology 2011, 77, 951–958. [Google Scholar] [CrossRef]
- Kantarci, K.; Knopman, D.S.; Dickson, D.W.; Parisi, J.E.; Whitwell, J.L.; Weigand, S.D.; Josephs, K.A.; Boeve, B.F.; Petersen, R.C.; Jack, C.R., Jr. Alzheimer disease: Postmortem neuropathologic correlates of antemortem 1H MR spectroscopy metabolite measurements. Radiology 2008, 248, 210–220. [Google Scholar] [CrossRef] [PubMed]
- Kantarci, K.; Smith, G.E.; Ivnik, R.J.; Petersen, R.C.; Boeve, B.F.; Knopman, D.S.; Tangalos, E.G.; Jack, C.R., Jr. 1H magnetic resonance spectroscopy, cognitive function, and apolipoprotein E genotype in normal aging, mild cognitive impairment and Alzheimer's disease. J Int Neuropsychol Soc 2002, 8, 934–942. [Google Scholar] [CrossRef] [PubMed]
- Klunk, W.E.; Panchalingam, K.; McClure, R.J.; Stanley, J.A.; Pettegrew, J.W. Metabolic alterations in postmortem Alzheimer's disease brain are exaggerated by Apo-E4. Neurobiol Aging 1998, 19, 511–515. [Google Scholar] [CrossRef]
- Lin, J.C.; Gant, N. Chapter 2.3 - The Biochemistry of Choline. In Magnetic Resonance Spectroscopy; Stagg, C., Rothman, D., Eds.; Academic Press: San Diego, 2014; pp. 104–110. [Google Scholar]
- Miller, B.L.; Chang, L.; Booth, R.; Ernst, T.; Cornford, M.; Nikas, D.; McBride, D.; Jenden, D.J. In vivo 1H MRS choline: Correlation with in vitro chemistry/histology. Life Sci 1996, 58, 1929–1935. [Google Scholar] [CrossRef]
- Barker, P.B.; Breiter, S.N.; Soher, B.J.; Chatham, J.C.; Forder, J.R.; Samphilipo, M.A.; Magee, C.A.; Anderson, J.H. Quantitative proton spectroscopy of canine brain: In vivo and in vitro correlations. Magn Reson Med 1994, 32, 157–163. [Google Scholar] [CrossRef]
- Meyerhoff, D.J.; MacKay, S.; Constans, J.M.; Norman, D.; Van Dyke, C.; Fein, G.; Weiner, M.W. Axonal injury and membrane alterations in Alzheimer's disease suggested by in vivo proton magnetic resonance spectroscopic imaging. Ann Neurol 1994, 36, 40–47. [Google Scholar] [CrossRef]
- MacKay, S.; Meyerhoff, D.J.; Constans, J.M.; Norman, D.; Fein, G.; Weiner, M.W. Regional gray and white matter metabolite differences in subjects with AD, with subcortical ischemic vascular dementia, and elderly controls with 1H magnetic resonance spectroscopic imaging. Arch Neurol 1996, 53, 167–174. [Google Scholar] [CrossRef]
- MacKay, S.; Ezekiel, F.; Di Sclafani, V.; Meyerhoff, D.J.; Gerson, J.; Norman, D.; Fein, G.; Weiner, M.W. Alzheimer disease and subcortical ischemic vascular dementia: Evaluation by combining MR imaging segmentation and H-1 MR spectroscopic imaging. Radiology 1996, 198, 537–545. [Google Scholar] [CrossRef] [PubMed]
- Fayed, N.; Andrés, E.; Viguera, L.; Modrego, P.J.; Garcia-Campayo, J. Higher glutamate+glutamine and reduction of N-acetylaspartate in posterior cingulate according to age range in patients with cognitive impairment and/or pain. Acad Radiol 2014, 21, 1211–1217. [Google Scholar] [CrossRef]
- Su, L.; Blamire, A.M.; Watson, R.; He, J.; Hayes, L.; O'Brien, J.T. Whole-brain patterns of 1H-magnetic resonance spectroscopy imaging in Alzheimer's disease and dementia with Lewy bodies. Translational Psychiatry 2016, 6, e877. [Google Scholar] [CrossRef]
- Chantal, S.; Labelle, M.; Bouchard, R.W.; Braun, C.M.; Boulanger, Y. Correlation of regional proton magnetic resonance spectroscopic metabolic changes with cognitive deficits in mild Alzheimer disease. Arch Neurol 2002, 59, 955–962. [Google Scholar] [CrossRef]
- Wurtman, R.J.; Blusztajn, J.K.; Maire, J.C. "Autocannibalism" of choline-containing membrane phospholipids in the pathogenesis of Alzheimer's disease-A hypothesis. Neurochem Int 1985, 7, 369–372. [Google Scholar] [CrossRef] [PubMed]
- Satlin, A.; Bodick, N.; Offen, W.W.; Renshaw, P.F. Brain proton magnetic resonance spectroscopy (1H-MRS) in Alzheimer's disease: Changes after treatment with xanomeline, an M1 selective cholinergic agonist. Am J Psychiatry 1997, 154, 1459–1461. [Google Scholar]
- Hertz, L. Functional interactions between neurons and astrocytes I. Turnover and metabolism of putative amino acid transmitters. Progress in neurobiology 1979, 13, 277–323. [Google Scholar] [CrossRef] [PubMed]
- Bak, L.K.; Schousboe, A.; Waagepetersen, H.S. The glutamate/GABA-glutamine cycle: Aspects of transport, neurotransmitter homeostasis and ammonia transfer. J Neurochem 2006, 98, 641–653. [Google Scholar] [CrossRef]
- Hyman, B.T.; Van Hoesen, G.W.; Damasio, A.R. Alzheimer's disease: Glutamate depletion in the hippocampal perforant pathway zone. Ann Neurol 1987, 22, 37–40. [Google Scholar] [CrossRef]
- Rupsingh, R.; Borrie, M.; Smith, M.; Wells, J.L.; Bartha, R. Reduced hippocampal glutamate in Alzheimer disease. Neurobiol Aging 2011, 32, 802–810. [Google Scholar] [CrossRef]
- Puts, N.A.; Edden, R.A. In vivo magnetic resonance spectroscopy of GABA: A methodological review. Prog Nucl Magn Reson Spectrosc 2012, 60, 29–41. [Google Scholar] [CrossRef]
- Huang, D.; Liu, D.; Yin, J.; Qian, T.; Shrestha, S.; Ni, H. Glutamate-glutamine and GABA in brain of normal aged and patients with cognitive impairment. Eur Radiol 2017, 27, 2698–2705. [Google Scholar] [CrossRef] [PubMed]
- Rae, C.D.; Williams, S.R. Glutathione in the human brain: Review of its roles and measurement by magnetic resonance spectroscopy. Anal Biochem 2017, 529, 127–143. [Google Scholar] [CrossRef] [PubMed]
- Mandal, P.K.; Tripathi, M.; Sugunan, S. Brain oxidative stress: Detection and mapping of anti-oxidant marker 'Glutathione' in different brain regions of healthy male/female, MCI and Alzheimer patients using non-invasive magnetic resonance spectroscopy. Biochem Biophys Res Commun 2012, 417, 43–48. [Google Scholar] [CrossRef] [PubMed]
- Shukla, D.; Mandal, P.K.; Tripathi, M.; Vishwakarma, G.; Mishra, R.; Sandal, K. Quantitation of in vivo brain glutathione conformers in cingulate cortex among age-matched control, MCI, and AD patients using MEGA-PRESS. Hum Brain Mapp 2020, 41, 194–217. [Google Scholar] [CrossRef] [PubMed]
- Mandal, P.K.; Saharan, S.; Tripathi, M.; Murari, G. Brain Glutathione Levels - A Novel Biomarker for Mild Cognitive Impairment and Alzheimer's Disease. Biological Psychiatry 2015, 78, 702–710. [Google Scholar] [CrossRef]
- Zabel, M.; Nackenoff, A.; Kirsch, W.M.; Harrison, F.E.; Perry, G.; Schrag, M. Markers of oxidative damage to lipids, nucleic acids and proteins and antioxidant enzymes activities in Alzheimer's disease brain: A meta-analysis in human pathological specimens. Free Radic Biol Med 2018, 115, 351–360. [Google Scholar] [CrossRef]
- Wyss, M.; Kaddurah-Daouk, R. Creatine and creatinine metabolism. Physiol Rev 2000, 80, 1107–1213. [Google Scholar] [CrossRef]
- Rackayova, V.; Cudalbu, C.; Pouwels, P.J.W.; Braissant, O. Creatine in the central nervous system: From magnetic resonance spectroscopy to creatine deficiencies. Analytical Biochemistry 2017, 529, 144–157. [Google Scholar] [CrossRef]
- Chang, L.; Ernst, T.; Poland, R.E.; Jenden, D.J. In vivo proton magnetic resonance spectroscopy of the normal aging human brain. Life Sciences 1996, 58, 2049–2056. [Google Scholar] [CrossRef] [PubMed]
- Maudsley, A.A.; Domenig, C.; Govind, V.; Darkazanli, A.; Studholme, C.; Arheart, K.; Bloomer, C. Mapping of brain metabolite distributions by volumetric proton MR spectroscopic imaging (MRSI). Magn Reson Med 2009, 61, 548–559. [Google Scholar] [CrossRef]
- Saunders, D.E.; Howe, F.A.; van den Boogaart, A.; Griffiths, J.R.; Brown, M.M. Aging of the adult human brain: In vivo quantitation of metabolite content with proton magnetic resonance spectroscopy. J Magn Reson Imaging 1999, 9, 711–716. [Google Scholar] [CrossRef]
- Oppenheimer, S.M.; Bryan, R.N.; Conturo, T.E.; Soher, B.J.; Preziosi, T.J.; Barker, P.B. Proton magnetic resonance spectroscopy and gadolinium-DTPA perfusion imaging of asymptomatic MRI white matter lesions. Magn Reson Med 1995, 33, 61–68. [Google Scholar] [CrossRef] [PubMed]
- Ongür, D.; Prescot, A.P.; Jensen, J.E.; Cohen, B.M.; Renshaw, P.F. Creatine abnormalities in schizophrenia and bipolar disorder. Psychiatry Res 2009, 172, 44–48. [Google Scholar]
- Bai, X.; Edden, R.A.; Gao, F.; Wang, G.; Wu, L.; Zhao, B.; Wang, M.; Chan, Q.; Chen, W.; Barker, P.B. Decreased γ-aminobutyric acid levels in the parietal region of patients with Alzheimer's disease. J Magn Reson Imaging 2015, 41, 1326–1331. [Google Scholar]
- Mielke, M.M.; Dage, J.L.; Frank, R.D.; Algeciras-Schimnich, A.; Knopman, D.S.; Lowe, V.J.; Bu, G.; Vemuri, P.; Graff-Radford, J.; Jack, C.R., Jr.; Petersen, R.C. Performance of plasma phosphorylated tau 181 and 217 in the community. Nat Med 2022, 28, 1398–1405. [Google Scholar] [CrossRef]
- Jack, C.R., Jr.; Wiste, H.J.; Algeciras-Schimnich, A.; Weigand, S.D.; Figdore, D.J.; Lowe, V.J.; Vemuri, P.; Graff-Radford, J.; Ramanan, V.K.; Knopman, D.S.; Mielke, M.M.; Machulda, M.M.; Fields, J.; Schwarz, C.G.; Cogswell, P.M.; Senjem, M.L.; Therneau, T.M.; Petersen, R.C. Comparison of plasma biomarkers and amyloid PET for predicting memory decline in cognitively unimpaired individuals. Alzheimers Dement 2024, 20, 2143–2154. [Google Scholar]
- Pais, M.V.; Forlenza, O.V.; Diniz, B.S. Plasma Biomarkers of Alzheimer's Disease: A Review of Available Assays, Recent Developments, and Implications for Clinical Practice. J Alzheimers Dis Rep 2023, 7, 355–380. [Google Scholar]
- Janelidze, S.; Teunissen, C.E.; Zetterberg, H.; Allué, J.A.; Sarasa, L.; Eichenlaub, U.; Bittner, T.; Ovod, V.; Verberk, I.M.W.; Toba, K.; Nakamura, A.; Bateman, R.J.; Blennow, K.; Hansson, O. Head-to-Head Comparison of 8 Plasma Amyloid-β 42/40 Assays in Alzheimer Disease. JAMA Neurology 2021, 78, 1375–1382. [Google Scholar]
- Nabers, A.; Perna, L.; Lange, J.; Mons, U.; Schartner, J.; Güldenhaupt, J.; Saum, K.U.; Janelidze, S.; Holleczek, B.; Rujescu, D.; Hansson, O.; Gerwert, K.; Brenner, H. Amyloid blood biomarker detects Alzheimer's disease. EMBO Molecular Medicine 2018, 10, e8763. [Google Scholar] [CrossRef] [PubMed]
- Nakamura, A.; Kaneko, N.; Villemagne, V.L.; Kato, T.; Doecke, J.; Doré, V.; Fowler, C.; Li, Q.-X.; Martins, R.; Rowe, C.; Tomita, T.; Matsuzaki, K.; Ishii, K.; Ishii, K.; Arahata, Y.; Iwamoto, S.; Ito, K.; Tanaka, K.; Masters, C.L.; Yanagisawa, K. High performance plasma amyloid-β biomarkers for Alzheimer’s disease. Nature 2018, 554, 249–254. [Google Scholar] [CrossRef] [PubMed]
- Janelidze, S.; Mattsson, N.; Palmqvist, S.; Smith, R.; Beach, T.G.; Serrano, G.E.; Chai, X.; Proctor, N.K.; Eichenlaub, U.; Zetterberg, H.; Blennow, K.; Reiman, E.M.; Stomrud, E.; Dage, J.L.; Hansson, O. Plasma P-tau181 in Alzheimer’s disease: Relationship to other biomarkers, differential diagnosis, neuropathology and longitudinal progression to Alzheimer’s dementia. Nature Medicine 2020, 26, 379–386. [Google Scholar] [CrossRef] [PubMed]
- Karikari, T.K.; Pascoal, T.A.; Ashton, N.J.; Janelidze, S.; Benedet, A.L.; Rodriguez, J.L.; Chamoun, M.; Savard, M.; Kang, M.S.; Therriault, J.; Schöll, M.; Massarweh, G.; Soucy, J.-P.; Höglund, K.; Brinkmalm, G.; Mattsson, N.; Palmqvist, S.; Gauthier, S.; Stomrud, E.; Zetterberg, H.; Hansson, O.; Rosa-Neto, P.; Blennow, K. Blood phosphorylated tau 181 as a biomarker for Alzheimer's disease: A diagnostic performance and prediction modelling study using data from four prospective cohorts. The Lancet Neurology 2020, 19, 422–433. [Google Scholar] [CrossRef] [PubMed]
- Janelidze, S.; Berron, D.; Smith, R.; Strandberg, O.; Proctor, N.K.; Dage, J.L.; Stomrud, E.; Palmqvist, S.; Mattsson-Carlgren, N.; Hansson, O. Associations of Plasma Phospho-Tau217 Levels With Tau Positron Emission Tomography in Early Alzheimer Disease. JAMA Neurology 2021, 78, 149–156. [Google Scholar] [CrossRef]
- Mielke, M.M.; Hagen, C.E.; Xu, J.; Chai, X.; Vemuri, P.; Lowe, V.J.; Airey, D.C.; Knopman, D.S.; Roberts, R.O.; Machulda, M.M.; Jack, C.R., Jr.; Petersen, R.C.; Dage, J.L. Plasma phospho-tau181 increases with Alzheimer's disease clinical severity and is associated with tau- and amyloid-positron emission tomography. Alzheimer's & Dementia 2018, 14, 989–997. [Google Scholar]
- Gafson, A.R.; Barthélemy, N.R.; Bomont, P.; Carare, R.O.; Durham, H.D.; Julien, J.P.; Kuhle, J.; Leppert, D.; Nixon, R.A.; Weller, R.O.; Zetterberg, H.; Matthews, P.M. Neurofilaments: Neurobiological foundations for biomarker applications. Brain 2020, 143, 1975–1998. [Google Scholar] [CrossRef]
- Mattsson, N.; Cullen, N.C.; Andreasson, U.; Zetterberg, H.; Blennow, K. Association Between Longitudinal Plasma Neurofilament Light and Neurodegeneration in Patients With Alzheimer Disease. JAMA Neurology 2019, 76, 791–799. [Google Scholar] [CrossRef]
- Mielke, M.M.; Syrjanen, J.A.; Blennow, K.; Zetterberg, H.; Vemuri, P.; Skoog, I.; Machulda, M.M.; Kremers, W.K.; Knopman, D.S.; Jack, C., Jr.; Petersen, R.C.; Kern, S. Plasma and CSF neurofilament light: Relation to longitudinal neuroimaging and cognitive measures. Neurology 2019, 93, e252–e260. [Google Scholar] [CrossRef]
- Verberk, I.M.W.; Laarhuis, M.B.; van den Bosch, K.A.; Ebenau, J.L.; van Leeuwenstijn, M.; Prins, N.D.; Scheltens, P.; Teunissen, C.E.; van der Flier, W.M. Serum markers glial fibrillary acidic protein and neurofilament light for prognosis and monitoring in cognitively normal older people: A prospective memory clinic-based cohort study. The Lancet Healthy Longevity 2021, 2, e87–e95. [Google Scholar] [CrossRef]
- Heller, C.; Foiani, M.S.; Moore, K.; Convery, R.; Bocchetta, M.; Neason, M.; Cash, D.M.; Thomas, D.; Greaves, C.V.; Woollacott, I.O.; Shafei, R.; Van Swieten, J.C.; Moreno, F.; Sanchez-Valle, R.; Borroni, B.; Laforce, R., Jr.; Masellis, M.; Tartaglia, M.C.; Graff, C.; Galimberti, D.; Rowe, J.B.; Finger, E.; Synofzik, M.; Vandenberghe, R.; de Mendonca, A.; Tagliavini, F.; Santana, I.; Ducharme, S.; Butler, C.R.; Gerhard, A.; Levin, J.; Danek, A.; Frisoni, G.; Sorbi, S.; Otto, M.; Heslegrave, A.J.; Zetterberg, H.; Rohrer, J.D. Plasma glial fibrillary acidic protein is raised in progranulin-associated frontotemporal dementia. J Neurol Neurosurg Psychiatry 2020, 91, 263–270. [Google Scholar] [CrossRef] [PubMed]
- Braak, H.; Braak, E. Neuropathological stageing of Alzheimer-related changes. Acta Neuropathol 1991, 82, 239–259. [Google Scholar] [CrossRef] [PubMed]
- Thal, D.R.; Rüb, U.; Orantes, M.; Braak, H. Phases of A beta-deposition in the human brain and its relevance for the development of AD. Neurology 2002, 58, 1791–1800. [Google Scholar] [CrossRef] [PubMed]
- Park, Y.W.; Deelchand, D.K.; Joers, J.M.; Hanna, B.; Berrington, A.; Gillen, J.S.; Kantarci, K.; Soher, B.J.; Barker, P.B.; Park, H.; Oz, G.; Lenglet, C. AutoVOI: Real-time automatic prescription of volume-of-interest for single voxel spectroscopy. Magn Reson Med 2018, 80, 1787–1798. [Google Scholar] [CrossRef]
- Kantarci, K.; Jicha, G.A. Development of <sup>1</sup>H MRS biomarkers for tracking early predementia Alzheimer disease. Neurology 2019, 92, 209–210. [Google Scholar]
- Deelchand, D.K.; Adanyeguh, I.M.; Emir, U.E.; Nguyen, T.-M.; Valabregue, R.; Henry, P.-G.; Mochel, F.; Öz, G. Two-site reproducibility of cerebellar and brainstem neurochemical profiles with short-echo, single-voxel MRS at 3T. Magnetic resonance in medicine 2015, 73, 1718–1725. [Google Scholar] [CrossRef]
- Öz, G.; Deelchand, D.K.; Wijnen, J.P.; Mlynárik, V.; Xin, L.; Mekle, R.; Noeske, R.; Scheenen, T.W.J.; Tkáč, I. Advanced single voxel (1) H magnetic resonance spectroscopy techniques in humans: Experts' consensus recommendations. NMR Biomed 2020, e4236. [Google Scholar] [CrossRef]
- Bell, T.K.; Godfrey, K.J.; Ware, A.L.; Yeates, K.O.; Harris, A.D. Harmonization of multi-site MRS data with ComBat. NeuroImage 2022, 257, 119330. [Google Scholar] [CrossRef]
- Harris, A.D.; Amiri, H.; Bento, M.; Cohen, R.; Ching, C.R.K.; Cudalbu, C.; Dennis, E.L.; Doose, A.; Ehrlich, S.; Kirov, I.I.; Mekle, R.; Oeltzschner, G.; Porges, E.; Souza, R.; Tam, F.I.; Taylor, B.; Thompson, P.M.; Quidé, Y.; Wilde, E.A.; Williamson, J.; Lin, A.P.; Bartnik-Olson, B. Harmonization of multi-scanner in vivo magnetic resonance spectroscopy: ENIGMA consortium task group considerations. Frontiers in Neurology 2023, 13. [Google Scholar] [CrossRef]
Figure 1.
1H MR spectroscopic metabolite ratios plotted according to Braak NFT stage (horizontal axis). For each Braak NFT stage diagnosis, individual values, a box plot of the distribution, and the estimated mean and 95% CI (darker lines) for the mean are shown. The mean and CI were derived from ANCOVA models and are assumed for a 78-year-old woman in whom the interval from 1H MR spectroscopy to death is 2 years. With permission from Radiology [68].serves as synaptic integrity marker. Furthermore, a higher postmortem pTau burden was associated with lower NAA/Cr and NAA/mIns ratios, while Cho/Cr was not associated with postmortem pTau.
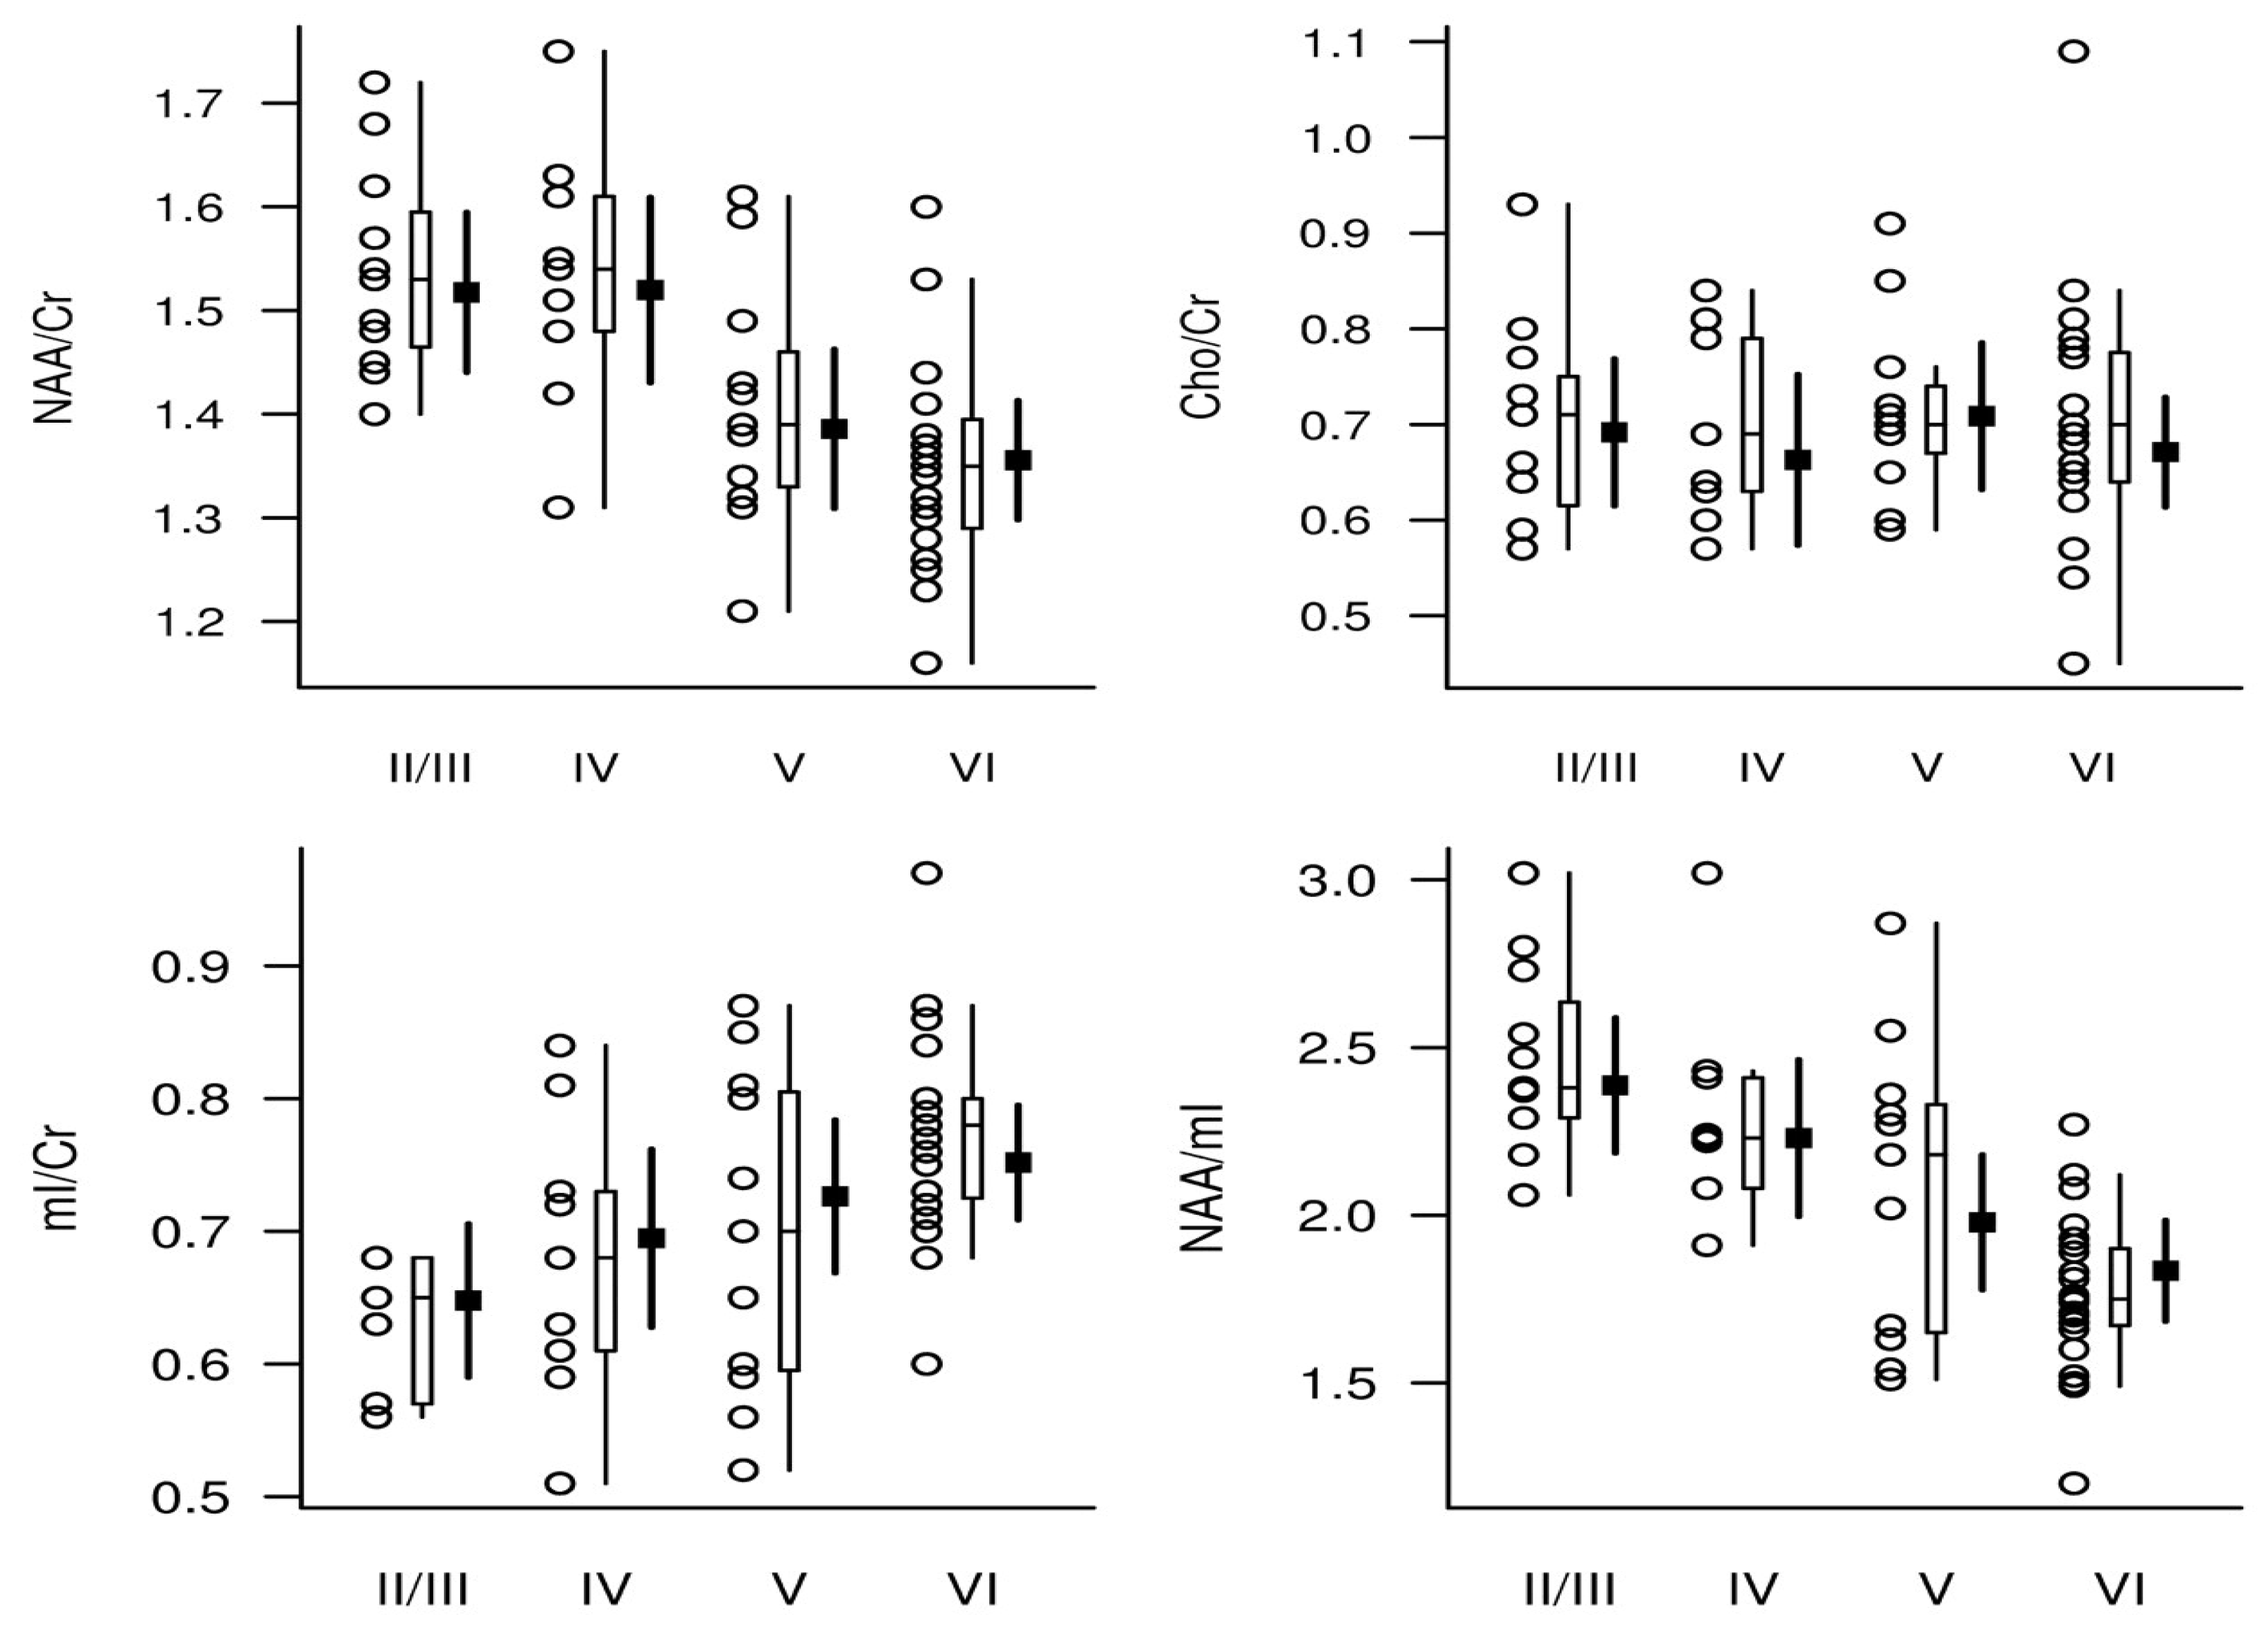
Figure 2.
Sagittal (A), coronal (B), and transverse (C) T1– weighted magnetic resonance images with superimposed posterior cingulate gyrus magnetic resonance spectroscopy volume of interest (20×20×20 mm3). Representative 1H MRS spectra, AV-1451-PET and PiB-PET of a clinically normal individual. The thick red curve on the representative MRS spectra is the LCModel fit to the data. The thin curve under the spectra is the baseline. The residual (data minus the fit to the data) is shown on the top of the spectra. (D) Single voxel proton (1H) magnetic resonance (MR) spectrum acquired from the posterior cingulate gyrus of a cognitively unimpaired participant (age = 81) at 3 T with sLASER sequence. The thick red curve on the representative MR spectrum is the LCModel fit to the data. The thin curve under the spectrum is the fitted baseline. The residual (data minus the fit to the data) is shown at the top of the spectrum. The chemical shift axis is labeled in parts per million (ppm) unit. The Y axis is an intensity scale of each spectral line with no unit. (E) The representative cortical flortaucipir PET and PiB PET scans were acquired from the same participant. The participant had low NAA/tCr = 1.20 and Glu/tCr = 0.99, high PCG flortaucipir standard value uptake unit ratio of 1.22, and high PCG PiB standard value uptake unit ratio of 3.06. The PET scans were registered to the T1-weighted MR image and displayed together. We observed flortaucipir uptake in the skull of this participant. The meningeal and bone uptake of flortaucipir is known manifestation of off-target binding. The cause is unknown. In contrast such off-target uptake in PiB is not seen except with rare cases of bone uptake in diseases with high rates of bone remodeling (e.g., hyperostosis frontalis interna). The representative color scale shows the standardized uptake value ratios. Abbreviations: Glu, glutamate; Lip, lipid signal; NAA, N-acetylaspartate; PET, positron emission tomography; PiB, Pittsburgh compound-B; tCr, phosphocreatine + creatine; tCho, phosphocholine + glycerophosphocholine; mIns, myo-inositol. (For interpretation of the references to color in this figure legend, the reader is referred to the Web version of this article.). This figure, originally appearing as Figure 1 and Figure 2; is reprinted from “1H MR spectroscopy biomarkers of neuronal and synaptic function are associated with tau deposition in cognitively unimpaired older adults”, Neurobiology of Aging, Volume 112, April 2022, Pages 16-26, with permission from Elsevier.could be used to discriminate A-T-N− and A+T-N-) from participants with early AD (A+T+N-).
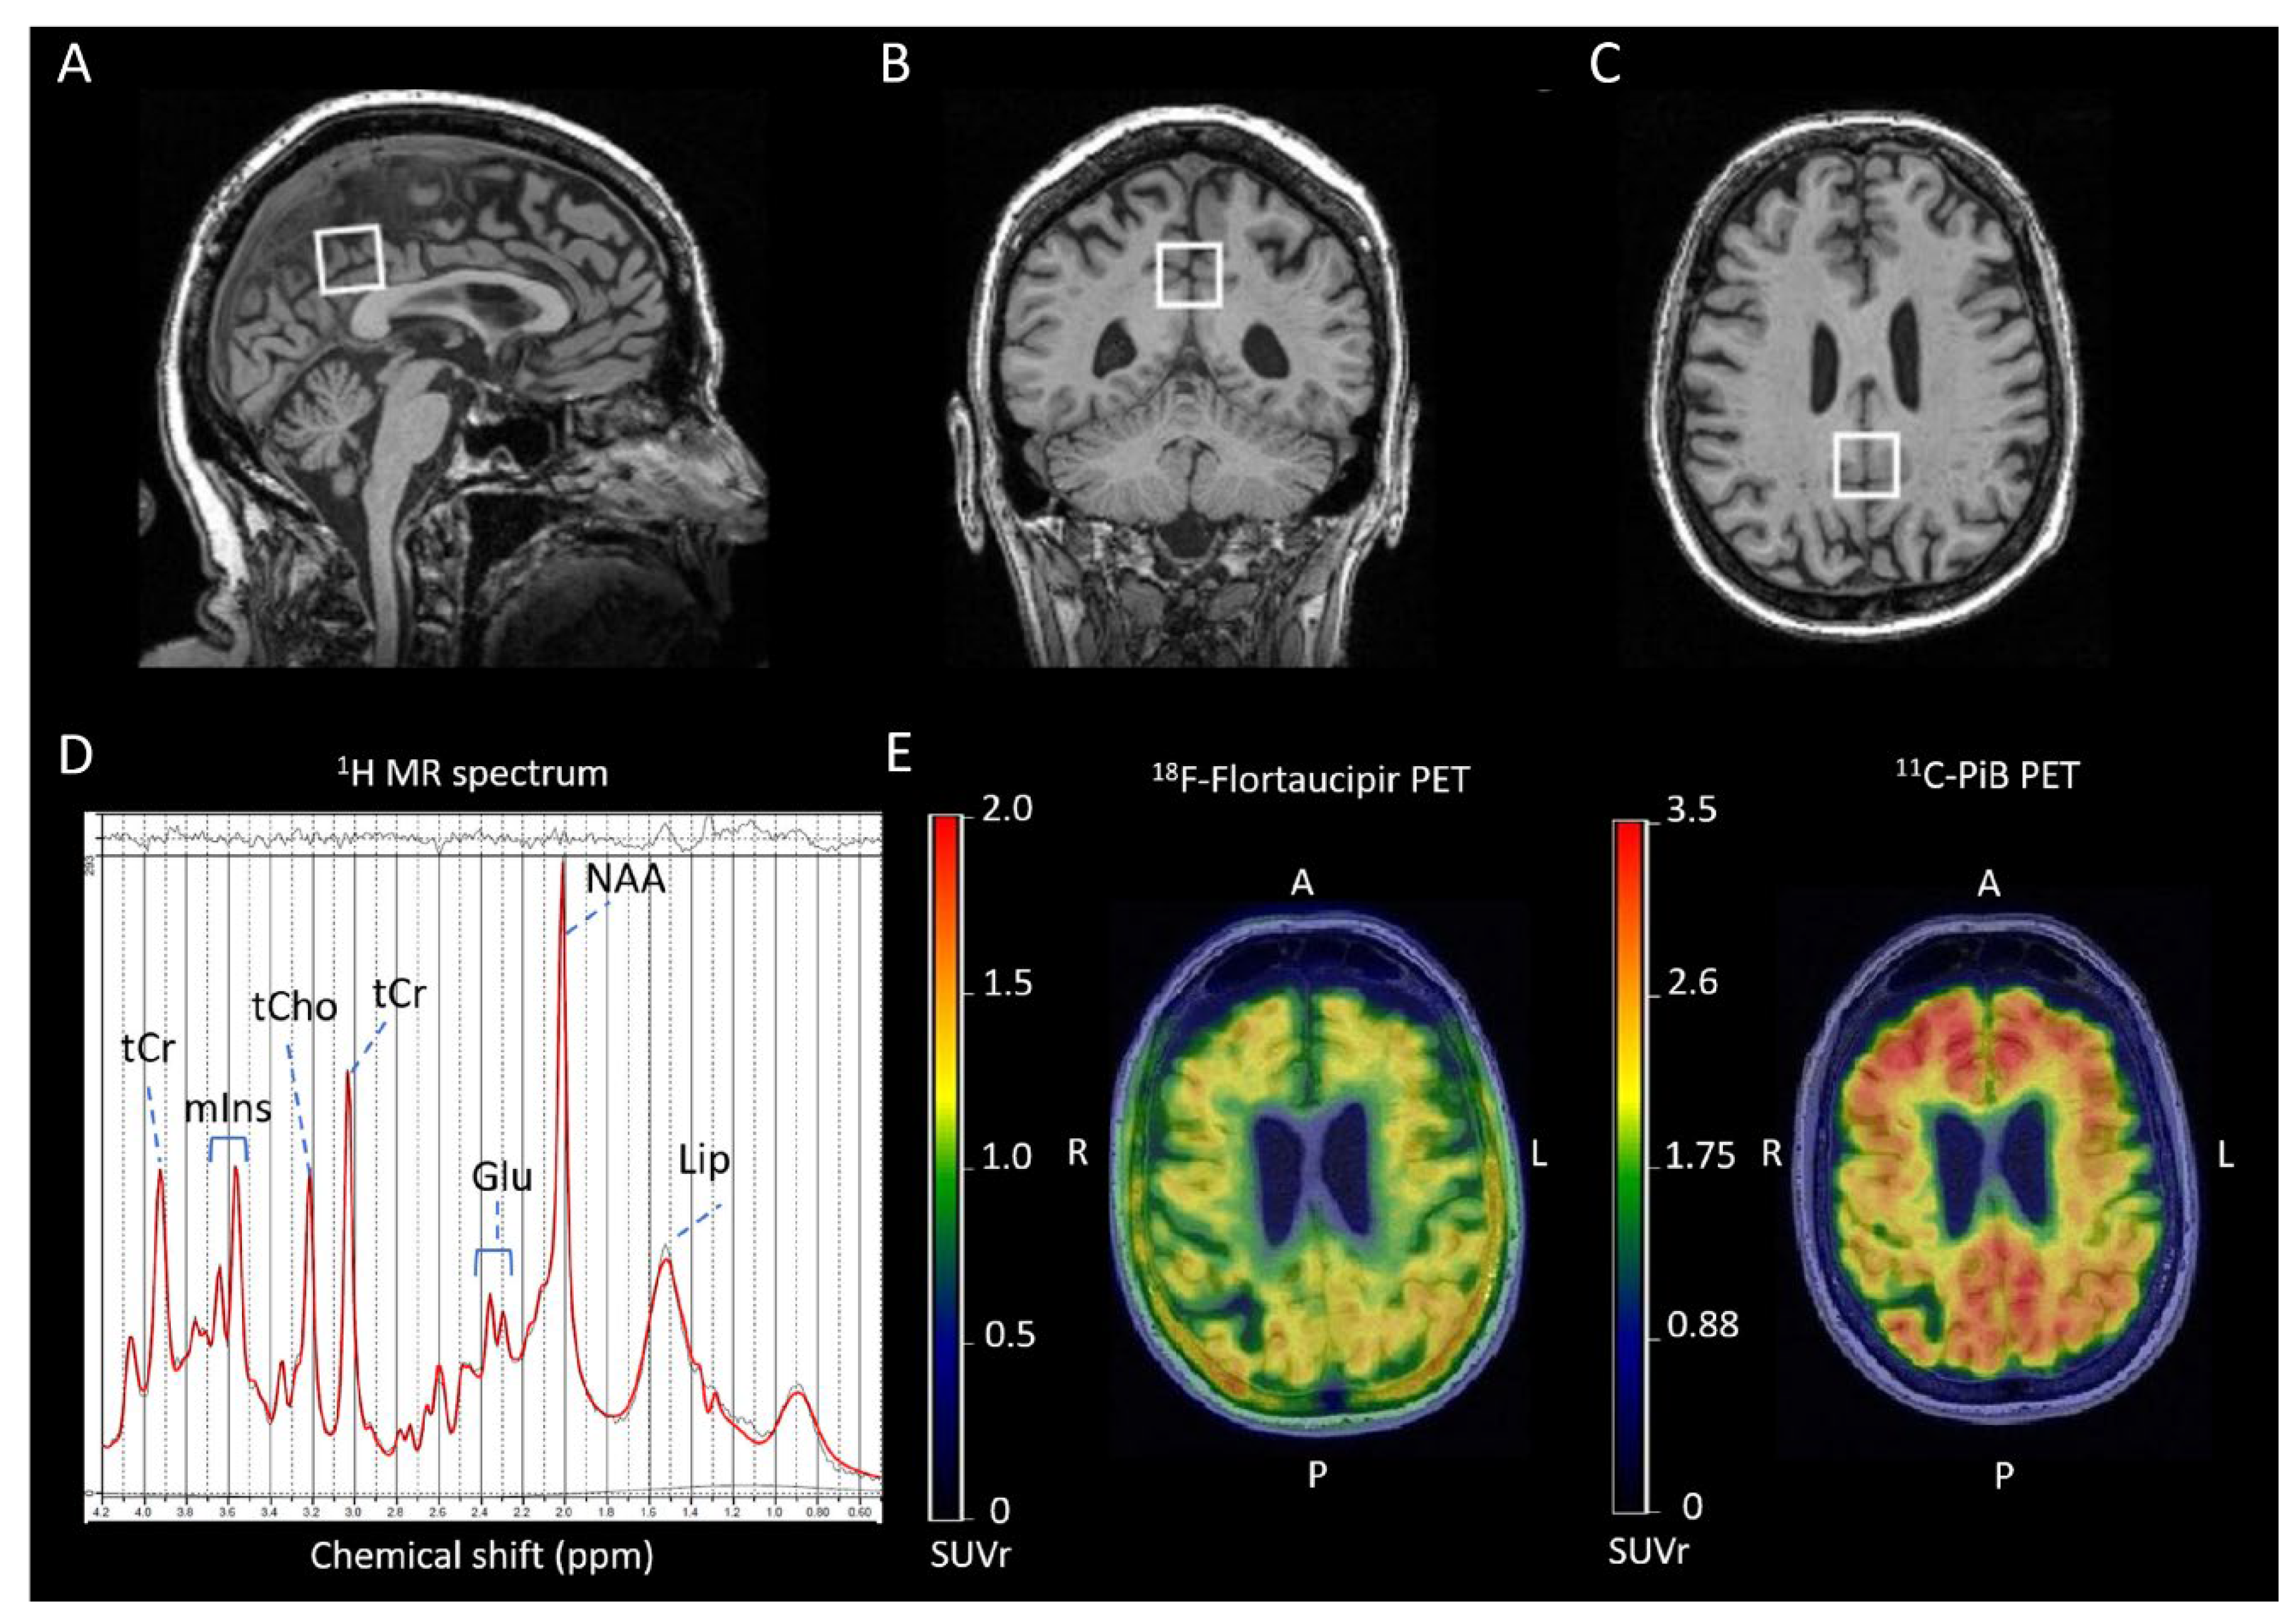
Disclaimer/Publisher’s Note: The statements, opinions and data contained in all publications are solely those of the individual author(s) and contributor(s) and not of MDPI and/or the editor(s). MDPI and/or the editor(s) disclaim responsibility for any injury to people or property resulting from any ideas, methods, instructions or products referred to in the content. |
© 2024 by the authors. Licensee MDPI, Basel, Switzerland. This article is an open access article distributed under the terms and conditions of the Creative Commons Attribution (CC BY) license (http://creativecommons.org/licenses/by/4.0/).
Copyright: This open access article is published under a Creative Commons CC BY 4.0 license, which permit the free download, distribution, and reuse, provided that the author and preprint are cited in any reuse.


