
Submitted:
25 August 2024
Posted:
26 August 2024
You are already at the latest version
Abstract
We examine worldwide Property and Casualty and Life and Health insurance companies from 2004 until 2023, implementing panel regression models and mediation analysis to show that insurers raise their reserves when they face increasing costs for their potential environmental damages, ultimately reducing their profitability and underwriting capacity.
Our findings extend to the insurance sector the previous evidence on banks, demonstrating that environmental damages could affect profits and solvency of financial intermediaries.
These insights are important especially for insurance managers and regulators.
Keywords:
insurance companies
; environmental damages
; environmental damage costs
; environmental impact ratios
; profitability
; leverage
1. Introduction
The growing trend of sustainability and environmental consciousness within the insurance industry incentivizes insurers to adopt responsible behaviors and green policies. The United Nations’ Principles for Sustainable Insurance (PSI) were launched in 2012 to guide the insurance industry in addressing environmental, social, and governance (ESG) risks and opportunities (www.unepfi.org/insurance/insurance/). “Sustainable insurance" (also known as “green” or “ethical insurance”) refers to integrating sustainable and eco-friendly practices in the insurance business, in order to improve performances, reduce risk, and contribute fostering the sustainability of the entire economic system and environment [1].
While the awareness of the corporate world toward sustainability is growing, how to assess corporate environmental “impacts” and environmental performance objectively and efficiently remains an open question [2]. Researchers and evaluators in the international development community discuss the definition of “impact" and its measurement. The most commonly used definition is the definition given by the Organisation for Economic Co-operation and Development (OECD): Positive and negative, primary and secondary long-term effects produced by an intervention, directly or indirectly, intended or unintended (cdn.odi.org/media/documents/10352.pdf).
The concept of impact develops along multiple layers, while the focus of this article is the cost incurred by corporations for their “environmental impact". “Environmental impact" is any positive or negative change in environmental quality resulting from human interference, able to change the natural rhythm of the processes of a system [3].
Environmental impacts affect corporations on several aspects. The literature has treated this topic more frequently in relation to the management of non-financial firms like for example industrial, materials, or energy companies. However, financial intermediaries (primarily banks and insurers) play a key role for the transition to ESG and for the economy-wide risk management. Therefore, it is important to understand whether also financial corporations can create potential damages to the environment, ultimately affecting their performance. There is evidence that environmental damage costs impinge on the profitability of banks [4], but we could not find results for insurance companies.
To fill this gap of knowledge, we study environmental damage costs of worldwide insurers from 2004 until 2023. Using the S&P Capital Trucost database, we download environmental impact ratios, which estimate, in monetary terms, the negative externality on the society and the environment derived from the companies’ use of natural resources (water, minerals, metals, natural gas, oil, coal, forestry, and agriculture), the pollution of air, land or water, or the generation of greenhouse gas or waste. Environmental impact ratios indicate to what extent revenues would be liable for the company’s potential environmental damages. Using panel data regressions, we show that greater environmental damage costs lead insurers to decrease their reserves. Our mediation analysis reveals that this behavior reduces profits and underwriting capacity (i.e. high leverage). Furthermore, we show that the price-to-book ratio of insurers is inversely related with their environmental impact ratios. Therefore, our interpretation is that insurers are willing to set aside high reserve levels to cover expenses due to their potential environmental damages. However, this behavior may constrain growth opportunities, reflecting into lower profits, underwriting capacity, and equity value.
These findings contribute to extend the previous evidence on banks [4] to the broader set of financial intermediaries, demonstrating that environmental damages would sort a relevant effect on the profitability and leverage of insurers. Therefore, our intuition is that the inappropriate (intended or unintended) use of environmental resources is harmful for the environment, while also impinges on corporate financial health. This holds not only for businesses that, more evidently, manage natural resources or interact more directly with the natural environment, but it applies also to the financial sector. This insight is important for policy makers and insurance professionals. In particular, focusing on the insurance business, we highlight that environmental costs influence reserves, i.e. a key item for the stability and financial integrity of insurance companies. Based on our results, insurance managers and actuaries could obtain hints for an efficient reserve management.
2. Literature
With the growing interest on corporate sustainability, a few studies treated the topic of sustainability in the insurance sector. [5] conduct a systematic literature review on the research about ESG in the insurance sector, reporting that, so far, scholars gave more attention on the areas of risk, underwriting and investment management, compared to other areas like, for example, claims management and sales. Moreover, within the existing studies, climate change and the environmental factor have received even stronger focus.
In this stream of research, a few article demonstrate that sustainability affects insurers’ financial performance. Nonetheless, the evidence is heterogeneous. For example, [6] finds that sustainable insurers exhibit higher return-on-assets (i.e. are more profitable) and tend to purchase low reinsurance compared to less sustainable firms. In contrast, [7] reports that high ESG insurers have low return-on-assets and pay high taxes. Other papers use market-based measures of equity performance. For example, [8] reveal that upgrades in the ESG ratings of insurers lead to abnormal stock returns. Similarly, [9] finds that stocks issued by Property and Casualty insurers with high ESG scores deliver positive excess returns. The author shows that also the price-to-book ratio, i.e. a widely employed measure of equity performance for insurers, is negatively related to the company’s ESG score. In line with these previous studies, our analysis uses insurers’ return-on-assets and price-to-book ratios in order to measure corporate performance and valuation. The innovative feature in our approach will be to test the impact on these dimensions from environmental damage costs.
In fact, in the broad framework of corporate sustainability, environmental impacts (and damages) cover a key aspect, with important consequences on financial management. Most of the literature focuses on non-banking firms, for which the interplay with environmental resources is evidently straightforward. For example, [10] uses environmental data from Japanese chemical companies showing that environmental costs decrease firms’ profitability. Analysing Japanese manufacturing firms, [11] discover that greenhouse gas reductions increase their financial performance.
Other studies discussed environmental damage costs from an accounting perspectives. Among others, [12] and [13] outline the main elements of environmental management accounting (EMA), which is performed by private or public corporations combining financial accounting, cost accounting and mass balances to increase material efficiency, reduce environmental impacts and risks, and reduce costs of environmental protection.
In the context of financial intermediaries (primarily banks and insurers), we have scarce evidence on environmental damages. Nonetheless, recent evidence in [4] shows that banks environmental damage costs affect in a negative way the profitability of banks. Evidently, the financial sector plays a key role in leading toward a more sustainable development [14,15], therefore it is important to understand more deeply if financial firms can create damages to the environment, and to what extent these damages may impinge on their financial health. As mentioned, the relevance of environmental aspects are recognized in the existing insurance literature [5], but we know very little about environmental impacts of insurance firms. To fill this gap of knowledge, our analysis uses environmental impact ratios, which quantify the damage (in economic terms) due to the usage of natural resources and the interaction with the environment.
3. Data and variables
3.1. Sample and Variables
S&P Global Trucost provides environmental data for worldwide companies classified by industries and geographies. We consult the “Environmental Register” of Trucost to obtain environmental data on insurance companies (Property and Casualty and Life and Health) from all geographies, i.e. Africa, Asia-Pacific, Europe, Latin America and the Caribbean, Middle East, United States and Canada. In particular, we download so-called environmental “impact ratios". For each company, this number is the ratio between estimated environmental “damage costs" and total revenues. “Damage costs" quantify, in monetary terms, the negative externality associated with the use of a natural resource (water, minerals, metals, natural gas, oil, coal, forestry, and agriculture), the emission of a pollutant, or the generation of greenhouse gas or waste. Impact ratios include both direct damage costs, i.e. environmental costs due to a company’s direct operations, and also indirect damage costs, i.e. costs arising inside the company’s supply chain. For the assessment of environmental damages, Trucost uses mainly annually updated information disclosed by the company itself. Damage costs are computed by multiplying the company’s natural resources used or pollutants emitted (e.g. m3 of water or tCO2e) by environmental valuation coefficients. Valuation coefficients are factors that represent the average damage value, i.e., the external cost of damage to human, natural and built capital, resulting from an organization’s direct and indirect use of natural resources or the emission of pollutants. In lack of company’s disclosure, Trucost uses an econometrics environmental input‒output model (EEIO) that approximates the damage originating from the company’s operations as well as its supply chain tiers. More information on Trucost can be found at https://www.spglobal.com/esg/trucost, while the outline about the methodology implemented for the collection of environmental data can be found at https://portal.s1.spglobal.com/survey/documents/SPG_S1_Trucost_Environmental_Data_Methodology.pdf. In the Appendix 5 we report an example of the environmental data classification provided by S&P Capital Trucost. We display items for a Property and Casualty insurer (State Farm Insurance) as well as a Life and Health insurer (MetLife).
We have in the sample a total of 1,866 insurer-year observations. Table 1 displays the sample composition across geographies and insurance segments. We have a larger number of Property and Casualty insurers, mainly located in the United States and Canada, Asia-Pacific, and Europe. The Life and Health insurers in the sample, instead, are concentrated in Asia-Pacific, followed by United States and Canada, and Europe.
For each company, the environmental impact ratio is denoted with , and divides the total environmental damage costs by the total revenues of the company. Thus, represents potential costs if the insurer would be held responsible for its environmental damages. Our goal is to test whether environmental impacts measured by are associated with the level of insurance reserves. To measure reserves, we use the following variables. is the natural logarithm of total insurance reserves and liabilities for insurance and investment contracts (in dollar terms). are total policy reserves as a multiple of GAAP equity, while are reserves for insurance and investment contracts as a percent of total assets.
Moreover, we verify the effect from on leverage, profitability, and equity value. Our measure for leverage () is the ratio of gross premiums to policholder surplus [16,17,18,19]. We also tested models using the ratio of net premiums written to surplus, but results changed very marginally. For this reason, we let them available upon request. This ratio measures the efficiency with which the insurer uses its capital resources to generate business. An insurers with a relatively low is not fully utilizing its capital, and it has more room for growth, i.e. has higher capacity to underwrite new policies. In contrast, a high indicates a more aggressive underwriting and greater risk. For insurers with high leverage, the exposure to pricing errors is also larger. Potential losses due to underpricing of policies are related to the amount of premiums written, while policyholder surplus measures the cushion available to absorb such losses [20].
To assess profitability, we employ alternatively the net margin ratio or the return-on-assets. The margin ratio () is net income divided by total net premiums earned [16,17]. It calculates the degree of profit of the insurer produced from its total revenue. It measures the amount of net profit that a company obtains per dollar of revenue gained. [21] shows that operating margins are positively correlated with the rate of solvency. Thus, a high (low) margin ratio is a signal for high (low) financial solidity. The return-on-assets () is the ratio of net income to total assets, and high denotes higher profitability. For example, [7] uses the return-on-assets to assess the profitability of insurers in relation to corporate sustainability.
To assess the value of the company’s equity, we compute the price-to-book ratio () [22]. [23] recommend to use book value multiples in valuing insurance companies compared to earnings multiples. The authors argues that, unlike nonfinancial firms, the book value of equity seems to be a reasonable predictor of future earnings of insurers, as proved for example by evidence from [20]. Finally, in our regressions the variable accounts for the company’s size, and is computed as the natural logarithm of total assets [16].
The definitions of all our variables are summarized in Table 2. After winsorizing the variables at the 1st and 99th percentiles to mitigate the potential influence of outliers, for each segment we display descriptive statistics in Table 3, while correlation coefficients in Table 4 and Table 5. We notice that does not differ considerably between the two groups, as the median is 0.26 in both segments. This value is close in magnitude to impact ratios estimated for banks by [4]. Reserves are higher for Life and Health insurers, for which and are respectively 7.0% and 72%, compared to lower values equal to 2.4% and 57.8% for Property and Casualty insurers. Instead, Property and Casualty insurers seem to be more profitable, with median equal to 2.4% with respect to 0.7% of Life and Health insurers. However, is close to 10% inside both groups. The correlation tables reveal a positive correlation between and reserves, with maxim correlation equal to 0.13. For Property and Casualty insurers the correlation is significant with and , while for Life and Health insurers the correlation is significant with and .
4. Results
4.1. Effect from Environmental Damage Costs on Reserves
Our goal is to test whether there is a significant association between environmental costs (measured by ) and insurance reserves. A high indicates that a huge share of the insurer’s revenue will have to cover costs for environmental damages. In order to offset liabilities originated from environmental damages, we expect that the insurer will increase its reserves. Therefore, our conjecture is that environmental impact ratios sort a positive effects on insurance reserves.
To test this hypothesis more formally, we estimate the following equation of bank j’s reserves in year t on environmental impact ratios:
The subscript r denotes the measure for reserves among , , and . is the impact ratio. are fixed effects for the insurance segment (s) between Property and Casualty and Life and Health. are fixed effects for the geographic area (g) among Africa, Asia-Pacific, Europe, Latin America and Caribbean, Middle East, United States and Canada. Finally, are year (t) fixed effects. Standard errors are clustered at the firm level.
In line with our conjecture, Table 6 shows that reserves increase significantly in environmental impact ratios. The effect on is higher in magnitude, with coefficient close to 0.29. Therefore, it seems that insurers facing increasing environmental damage costs set aside also more money for unexpected losses.
4.2. Effect from environmental damage costs on profits and leverage
In Table 7 we test if plays a significant role on profitability and leverage. We use the model in (1) using as dependent variable alternatively , , and . The equations include also a control for , to assess if we estimate a significant effect from environmental costs at the net of the corporate size. We find that the coefficient on is significantly negative on both and , in line with evidence of [4] based on environmental damage costs of banks, showing that banks’ profitability is negatively correlated with environmental impact ratios. Leverage, instead, increases in .
We now want to verify if the patterns displayed in Table 7 are mediated by the effect from on reserves that we found in Table 6. In fact, the previous literature shows that high levels of reserves may impinge on insurers’ profits and solvency. For example, [24] study the practice of over-reserving, arguing that one of the primary causes lies in the desire of insurers to develop a safety margin to help offset possible future adverse loss experience, thus providing increased security for policyowners. The authors develop a theoretical model proving that over-reserving reduces net income, also causing some deterioration of the financial strength of the company as measured by . [25] examines reserve errors inside property and liability insurers, arguing that high reserve levels impair surplus, diminishing also policyholders’ confidence. Finally, [26] proposes a model to explain the underwriting cycle, in which insurer profits and capacity are positive correlated.
Therefore, based on this previous evidence, we advance the hypothesis that increasing reserves due to potential environmental damage costs impact in a negative way insurers’ capacity and profitability. To test this argument more formally, we conduct a mediation analysis. Statistical mediation analysis is about quantifying the indirect effect of an independent variable (X) on the dependent variable (Y) through a third variable called the mediator (M). That is, X has a direct effect on Y, while has also an indirect effect on Y mediated by M. We follow the procedure of [27] that modifies the method originally introduced by [28]. The procedure works as follows. In a first step we estimate the following system of equations:
The first equation estimates the direct effect from X on Y. The second equation tests the relationship between X and the mediator variable, which is assumed to be significant, and important also to explain the ultimate effect observed on Y. In the third equation we regress Y on M partialling out, or statistically controlling for X. If there is full mediation, both the coefficients c and b must be statistically significant, as this means that Y and M may be correlated because X causes both. If c’ is not significant, it indicates that the magnitude of the effect from X to Y is reduced to zero after controlling for the mediator.
In a second step, we can compute the Sobel’s z-test [29] to test explicitly that the direct effect reduces significantly through the indirect (mediated) path:
where a and b are the coefficients estimated by the system of simultaneous equations, while and are the standard errors of the two coefficients. For example, if z≥±1.645, then the mediation (c – c’ or a * b) is statistically significant at 0.10. Complete mediation implies that the z is significant and the direct path from X to Y captured by the coefficient c is not significant. See more details about this procedure at https://davidakenny.net/cm/mediate.htm.
We use , , and as the outcome variable (Y) for three separate mediation analyses. The independent variable (X) is , while the mediator (M) is . This procedure allows to assess if the effect from environmental costs on profits and leverage is channeled by reserves. Table 8, Table 9 and Table 10 show estimates from the three systems of equations, together with the Sobel’s z-statistics. The results show that full mediation for is accepted with a 5% level of significance, while for and mediation is accepted with a 10% level of significance. Clearly, the mediation analysis reveals that reserves explain in a considerable way the impact that environmental costs have on leverage. In fact, the 62% of the effect of on is mediated by . We also verified that the results are similar applying the procedure in [30], based on a bootstrap test of the indirect effect (a * b). Furthermore, we tested that the procedure gave similar results also using the other two proxies for reserves ( and ). All these latter results are omitted for brevity but available from the author upon request. Therefore, based on our mediation analyses, we conclude that, through an effect on reserves, high costs for environmental damages lower profits and underwriting capacity.
4.3. Effects from Environmental Damage Costs on Price-to-Book Ratios
We now verify if environmental costs have an impact on the company equity valuation. To approximate the insurer’s equity value we use the price-to-book ratio (). In addition, to improve the reliability of the valuation metric, we follow [23], who proposes to use a method that simultaneously extracts information from both book value and earnings instead than using univariate price multiples. The approach is to condition the price-to-book ratio on the return-on-equity, so that the resulting valuation reflects earnings in addition to book value. The author shows that this method improves the valuation accuracy of book value multiples. Therefore, to implement this method, we run a preliminary regression of on return-on-equity plus fixed effects, calling the predicted values . In a second stage, we estimate a panel regression of on controlling for the company’s .
In Table 11 columns (1)-(2) we find that the effect from on and is positive and significant. To gain a deeper insight, in columns (2)-(3) we test models that include also a quadratic term (×). These models reveal an interesting behavior: While the coefficient on is highly negative, the coefficient on the squared term is positive although smaller in magnitude. Thus, we observe that the equity value of our firms decreases non linearly in environmental costs. That is, when environmental costs are substantially high, the value of insurers diminishes less compared to situations when environmental costs are lower. Our results are consistent with findings from [4] that price-to-book ratios of banks decrease in environmental impact ratios. The author, however, does not test non-linearities.
The pattern we outline instead, suggests that the price-to-book ratio, as a standard benchmark for the valuation of insurers, could be biased by high environmental damage costs. Our intuition is that, when environmental costs are substantial, increased reserves would reduce equityholders’ surplus in a greater proportion than the market value of equity, leading to a higher .
4.4. Environmental Impact Ratios and Environmental Ratings
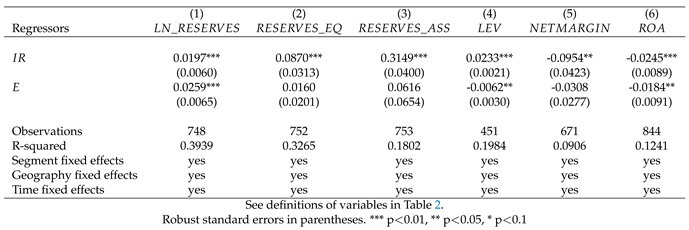
Finally, we study the relationship between environmental impact ratios and the environmental performances of our insurers measured by the environmental pillar (E) of their ESG ratings. In our database we could find ESG ratings available only from 2014, and we have a sample of 900 firm-year observations with not-missing and E. However, for these firms few accounting data are not available, therefore the following regressions could be estimated on a subsample which is approximately the 40% of our initial sample.
In Table 4 and Table 5 the correlation between and E is negative, but small in magnitude and not significant. Despite the low correlation, we verify if including E in our regressions would change the effect from . Table 12 shows that the coefficient on has same sign as in Table 6 and Table 7, i.e. positive and highly significant on reserves and leverage, while negative on profitability. Therefore, also using a subsample of insurers with environmental ratings, we observe that environmental impact ratios play a relevant role on reserves, profits, and leverage. The influence of E on our dependent variables is less evident. There is a positive impact on reserves measured by , while the other two measures of reserves do not change considerably. Similarly, diminishes in E, but the change of is not relevant. Finally, we notice that reacts oppositely to and E: The underwriting capacity seems to decrease with environmental costs, while improves in environmental ratings. Overall, these outcomes suggest that environmental damage costs and environmental ratings measure different aspects of insurance companies’ sustainability. However, our baseline outcomes reveal to be robust also controlling for environmental ratings.
5. Conclusion
Using data from worldwide Property and Casualty and Life and Health insurers from 2004 to 2023, we find that costs for potential environmental damages affect in a significant way insurance reserves, ultimately harming profits and underwriting capacity. At the same time, we also observe that price-to-book ratios, i.e. a standard benchmark for the valuation of insurers, decrease non-linearly in environmental impact ratios.
The key insight from our findings is that costs for environmental damages, which typically are a serious concern inside non-financial firms, e.g. the industrial, energy, or materials sectors, seem to be an important matter also for insurance companies. In fact, we show that insurers’ profits, leverage, and price-to-book ratios are significantly associated with environmental impact ratios. The implication for insurance managers and policy makers is that improvements in the environmental management of insurers could reflect into greater profitability and value. In addition, we also recommend to insurance managers and investors to take into consideration that potential environmental damage costs could affect valuation measures based on equity book values.
Nonetheless, we acknowledge that the analysis presents few limitations that follow-up research could contribute overcoming. First, one could exploit the granularity of the database to study more deeply the composition of environmental damage costs. As we show in our Appendix 5, the largest share of the total environmental damage costs seems to be generated in the supply chain. Moreover, among the different categories of environmental costs, it appears that costs for air pollution, green house gas emissions and water use are much larger than costs for the use of land and water pollutants, the use of natural resources and the waste produced. Research focused on supply chain management could examine how these costs are generated along the supply chain, so that we could better disentangle the mechanism that drive insurers to increase reserves when they incur greater environmental damage costs.
Furthermore, accounting studies could dig deeper into the composition of reserves and their relation with environmental damages. We used in our analysis figures that are standardized for global insurers, nonetheless focusing on specific countries could allow to separate more specifically certain figures. To give an example, in our database the Canadian insurance statements separate the general and contingency reserve from earthquake reserve, mortgage reserve and nuclear reserve.
Regarding the sample composition, it would be possible also to include in the sample multi-line insurance firms, for which our database provides environmental data too. This could be one way to verify whether business diversification is not a relevant issue for our findings.
Concerning effects on company valuation, as already mentioned, our results could be extended by testing alternative measures of value, like for example price-to-earnings ratios or Tobin’s Q.
Finally, we recognize that, based on our focus on reserves, we could only test effects from environmental impact ratios on insurance liabilities. However, it will be interesting to verify if environmental impacts are related also to insurers’ assets, ultimately reflecting on their risk-taking.
Overall, all these suggestions would help to improve our understanding about insurers’ costs for their environmental damages, and their consequences on financial management. This article is a first piece of research on this topic, which is important for improving sustainability standards in the financial sector.
Appendix
MetLife, Inc. – Environmental profile
| Financial Data | ||
| Trucost Revenue ($M) | 69,898 | |
| Environmental Damage Costs | Direct and Indirect Cost ($M) | Impact Ratio (%) = Damage Cost/Revenue |
| Total Environmental Damage Costs | 162.78 | 0.23 |
| Direct Environmental Damage Costs | 1.93 | 0.00 |
| Supply Chain Environmental Damage Costs | 160.85 | 0.23 |
| Total Air Pollutants Damage Costs | 31.46 | 0.05 |
| Direct Air Pollutants Damage Costs | 0.28 | 0.00 |
| Supply Chain Air Pollutants Damage Costs | 31.18 | 0.05 |
| Total GHG Damage Costs | 64.53 | 0.09 |
| Direct GHG Damage Costs | 0.66 | 0.00 |
| Supply Chain GHG Damage Costs | 63.88 | 0.09 |
| Total Land & Water Pollutants Damage Costs | 7.00 | 0.01 |
| Direct Land & Water Pollutants Damage Costs | 0.00 | 0.00 |
| Supply Chain Land & Water Pollutants Damage Costs | 7.00 | 0.01 |
| Total Natural Resource Use Damage Costs | 6.22 | 0.01 |
| Direct Natural Resource Use Damage Costs | 0.00 | 0.00 |
| Supply Chain Natural Resource Use Damage Costs | 6.22 | 0.01 |
| Total Waste Damage Costs | 9.19 | 0.01 |
| Direct Waste Damage Costs | 0.99 | 0.00 |
| Supply Chain Waste Damage Costs | 8.21 | 0.01 |
| Total Water Damage Costs | 44.37 | 0.06 |
| Direct Water Damage Costs | 0.00 | 0.00 |
| Supply Chain Water Damage Costs | 44.37 | 0.06 |
State Farm Mutual Insurance – Environmental profile
| Financial Data | ||
| Trucost Revenue ($M) | 61,745 | |
| Environmental Damage Cost | Direct and Indirect Cost ($M) | Impact Ratio (%) = Damage Cost/Revenue |
| Total Environmental Damage Costs | 183.26 | 0.30 |
| Direct Environmental Damage Costs | 2.12 | 0.00 |
| Supply Chain Environmental Damage Costs | 181.14 | 0.29 |
| Total Air Pollutants Damage Costs | 31.84 | 0.05 |
| Direct Air Pollutants Damage Costs | 0.20 | 0.00 |
| Supply Chain Air Pollutants Damage Costs | 31.64 | 0.05 |
| Total GHG Damage Costs | 78.51 | 0.13 |
| Direct GHG Damage Costs | 1.05 | 0.00 |
| Supply Chain GHG Damage Costs | 77.46 | 0.13 |
| Total Land & Water Pollutants Damage Costs | 7.68 | 0.01 |
| Direct Land & Water Pollutants Damage Costs | 0.00 | 0.00 |
| Supply Chain Land & Water Pollutants Damage Costs | 7.68 | 0.01 |
| Total Natural Resource Use Damage Costs | 8.34 | 0.01 |
| Direct Natural Resource Use Damage Costs | 0.00 | 0.00 |
| Supply Chain Natural Resource Use Damage Costs | 8.34 | 0.01 |
| Total Waste Damage Costs | 9.62 | 0.02 |
| Direct Waste Damage Costs | 0.87 | 0.00 |
| Supply Chain Waste Damage Costs | 8.75 | 0.01 |
| Total Water Damage Costs | 47.27 | 0.08 |
| Direct Water Damage Costs | 0.00 | 0.00 |
| Supply Chain Water Damage Costs | 47.27 | 0.08 |
References
- Scordis, N.A.; Suzawa, Y.; Zwick, A.; Ruckner, L. Principles for sustainable insurance: Risk management and value. Risk Management and Insurance Review 2014, 17, 265–276. [Google Scholar] [CrossRef]
- Mastrandrea, R.; ter Burg, R.; Shan, Y.; Hubacek, K.; Ruzzenenti, F. Assessments of the environmental performance of global companies need to account for company size. Communications Earth & Environment 2024, 5, 42. [Google Scholar]
- Hoshino Neta, C.S.; da Cal Seixas, S.R. Environmental Impacts and Sustainable Development. In Encyclopedia of Sustainability in Higher Education; Springer, 2019; pp. 596–601.
- Bressan, S. Does the environmental impact of banks affect their financial performance? Journal of Banking Regulation forthcoming.
- Aburto Barrera, L.I.; Wagner, J. A systematic literature review on sustainability issues along the value chain in insurance companies and pension funds. European Actuarial Journal 2023, 13, 653–701. [Google Scholar] [CrossRef] [PubMed]
- Bressan, S. Reinsurance and sustainability: Evidence from international insurers. Journal of Applied Finance & Banking 2023, 13, 153–184. [Google Scholar]
- Bressan, S. ESG, Taxes, and Profitability of Insurers. Sustainability 2023, 15, 13937. [Google Scholar] [CrossRef]
- Di Tommaso, C.; Mazzuca, M. The stock price of European insurance companies: What is the role of ESG factors? Finance Research Letters 2023, 56, 104071. [Google Scholar] [CrossRef]
- Bressan, S. Effects from ESG scores on P&C insurance companies. Sustainability 2023, 15, 12644. [Google Scholar] [CrossRef]
- Nuzula, N. Does environmental cost affect Japanese Firms’ performance. In Innovation Management, Entrepreneurship and Sustainability (IMES 2018); Vysoká škola ekonomická v Praze, 2018; pp. 821–830.
- Iwata, H.; Okada, K. How does environmental performance affect financial performance? Evidence from Japanese manufacturing firms. Ecological Economics 2011, 70, 1691–1700.
- Jasch, C. The use of Environmental Management Accounting (EMA) for identifying environmental costs. Journal of Cleaner production 2003, 11, 667–676. [Google Scholar] [CrossRef]
- Jasch, C. Environmental management accounting (EMA) as the next step in the evolution of management accounting, 2006.
- Jeucken, M.; Bouma, J.J. The changing environment of banks. In Sustainable Banking; Routledge, 2017; pp. 24–38.
- Weber, O.; Feltmate, B. Sustainable banking: Managing the social and environmental impact of financial institutions; University of Toronto Press, 2016.
- Chen, R.; Wong, K.A. The determinants of financial health of Asian insurance companies. Journal of risk and insurance 2004, 71, 469–499. [Google Scholar] [CrossRef]
- Lee, S.H.; Urrutia, J.L. Analysis and prediction of insolvency in the property-liability insurance industry: A comparison of logit and hazard models. Journal of Risk and insurance 1996, pp. 121–130.
- Ambrose, J.M.; Carroll, A.M. Using best’s ratings in life insurer insolvency prediction. Journal of Risk and Insurance 1994, pp. 317–327.
- Pinches, G.E.; Trieschmann, J.S. The efficiency of alternative models for solvency surveillance in the insurance industry. Journal of Risk and Insurance 1974, pp. 563–577.
- Nissim, D. Analysis and valuation of insurance companies. CE| ASA (Center for Excellence in Accounting and Security Analysis) Industry Study 2010.
- Kramer, B. An ordered logit model for the evaluation of Dutch non-life insurance companies. De Economist 1996, 144, 79–91.
- Foster, G. Valuation parameters of property-liability companies. The Journal of Finance 1977, 32, 823–835.
- Nissim, D. Relative valuation of US insurance companies. Review of Accounting Studies 2013, 18, 324–359.
- Anderson, J.J.; Thompson, H.E. Financial implications of over-reserving in nonlife insurance companies. Journal of Risk and Insurance 1971, pp. 333–342.
- Grace, E.V. Property-liability insurer reserve errors: A theoretical and empirical analysis. Journal of Risk and Insurance 1990, pp. 28–46.
- Berger, L.A. A model of the underwriting cycle in the property/liability insurance industry. The Journal of Risk and Insurance 1988, 55, 298–306.
- Iacobucci, D.; Saldanha, N.; Deng, X. A meditation on mediation: Evidence that structural equations models perform better than regressions. Journal of Consumer Psychology 2007, 17, 139–153.
- Baron, R.M.; Kenny, D.A. The moderator–mediator variable distinction in social psychological research: Conceptual, strategic, and statistical considerations. Journal of Personality and Social Psychology 1986, 51, 1173.
- Sobel, M.E. Direct and indirect effects in linear structural equation models. Sociological Methods & Research 1987, 16, 155–176.
- Zhao, X.; Lynch Jr, J.G.; Chen, Q. Reconsidering Baron and Kenny: Myths and truths about mediation analysis. Journal of Consumer Research 2010, 37, 197–206.

Table 1.
Number of insurance companies in the sample
| Geography | Property and Casualty | Life and Health | Total |
|---|---|---|---|
| Africa | 13 | 69 | 82 |
| Asia-Pacific | 250 | 333 | 583 |
| Europe | 145 | 151 | 296 |
| Latin America and Caribbean | 7 | 0 | 7 |
| Middle East | 29 | 9 | 38 |
| United States and Canada | 590 | 270 | 860 |
| Total | 1034 | 832 | 1,866 |
Table 2.
Definition of variables
| Variables | Definition |
|---|---|
| (%) | Total environmental damage costs (direct and indirect) in percentage to total revenues. Environmental damage costs are computed multiplying water used, waste generated, air pollution generated, greenhouse gas emissions, land and water pollution generated, natural resources used (minerals, metals, natural gas, oil, coal, forestry, and agriculture) by the respective environmental impact valuation coefficients elaborated by S&P Global Trucost. Valuation coefficients quantify the average damage value, i.e., the external cost of damage to human, natural and built capital, resulting from an organization’s direct and indirect use of natural resources or the emission of pollutants. In lack of company’s disclosure, Trucost uses an econometrics environmental input‒output model (EEIO) that approximates the damage originating from the company’s operations as well as its supply chain tiers. |
| Natural logarithm of total insurance reserves and liabilities for insurance and investment contracts. | |
| (%) | Total policy reserves as a percent of GAAP equity. |
| (%) | Total reserves for insurance and investment contracts as a percent of total assets. |
| Gross premiums written divided by policyholder surplus | |
| (%) | Net income as a percent of total premiums earned. |
| (%) | Net income as a percent of total assets. |
| Natural logarithm of total assets | |
| Market value of equity divided by total book value equity. Market value of equity is calculated as the product between average share price and total shares outstanding. | |
| Predicted values from a regression of on return-on-equity, and fixed effects for segment, geography, and time. | |
| E (0-100) | S&P Capital IQ environmental score from ESG scores. |
Table 3.
Descriptive statistics for insurers
| Mean | Median | Min | Max | Standard dev | |
|---|---|---|---|---|---|
| Property and Casualty | |||||
| 0.3698 | 0.2600 | 0.2212 | 81.9201 | 2.5429 | |
| 15.9111 | 16.2134 | 9.1615 | 20.5232 | 1.7715 | |
| (%) | 2.9801 | 2.3756 | 0.0000 | 42.2954 | 2.6771 |
| (%) | 54.7823 | 57.7870 | 0.0000 | 88.6401 | 17.1367 |
| 1.5351 | 1.2944 | -18.991 | 41.9522 | 2.0101 | |
| (%) | 11.4809 | 9.5645 | -12.9733 | 43.6601 | 12.4267 |
| (%) | 2.62758 | 2.3633 | -17.6890 | 16.2553 | 3.7643 |
| 162.1000 | 131.3238 | 17.6282 | 585.6034 | 107.3765 | |
| 16.4211 | 16.7340 | 9.7496 | 21.1779 | 1.7571 | |
| E | 37.7800 | 30.0000 | 3.0000 | 97.0000 | 24.0901 |
| Life and Health | |||||
| 0.2762 | 0.2601 | 0.2204 | 1.7302 | 0.08316 | |
| 17.8625 | 18.1673 | 10.6423 | 21.9211 | 1.8073 | |
| (%) | 10.4209 | 7.0615 | 0.0000 | 42.2948 | 9.4681 |
| (%) | 64.7522 | 71.8589 | 0.0000 | 93.2867 | 20.5233 |
| 1.4187 | 1.1290 | 0.2993 | 13.9511 | 1.1686 | |
| (%) | 12.2190 | 10.8956 | -12.9799 | 43.6622 | 11.8418 |
| (%) | 1.0615 | 0.6627 | -17.6817 | 14.7387 | 2.4170 |
| 142.7000 | 113.6056 | 16.9637 | 585.6865 | 102.3837 | |
| 18.7301 | 19.0242 | 11.1326 | 23.2101 | 2.0070 | |
| E | 44.9600 | 44.0000 | 2.0000 | 98.0000 | 23.9805 |
| See definitions of variables in Table 2. | |||||
Table 4.
Correlation coefficients – Property and Casualty insurers
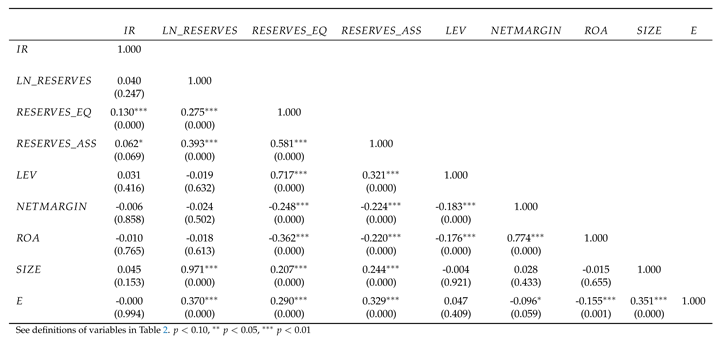 |
Table 5.
Correlation coefficients – Life and Health insurers
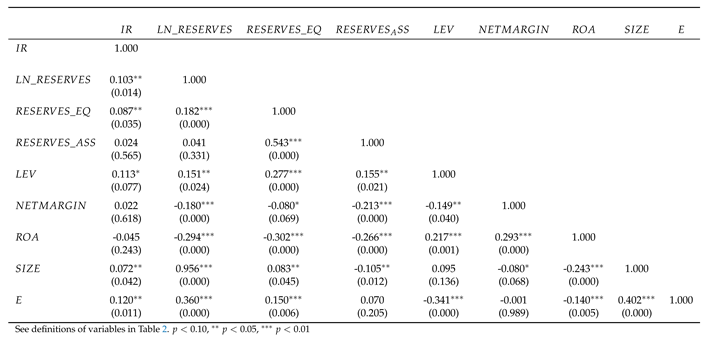 |
Table 6.
Regressions of reserves on environmental impact ratios
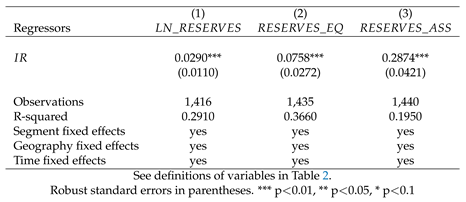 |
Table 7.
Regressions of profits (columns 1-2) and leverage (column 3) on environmental impact ratios
Table 7.
Regressions of profits (columns 1-2) and leverage (column 3) on environmental impact ratios
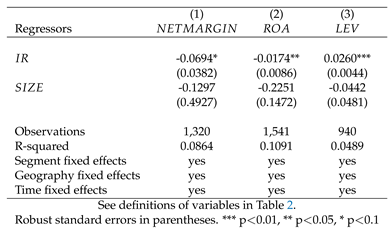 |
Table 8.
Effect from on mediated by
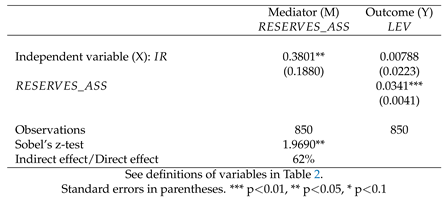 |
Table 9.
Effect from on mediated by
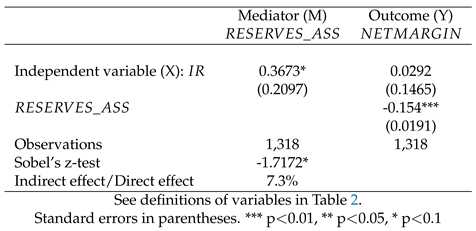 |
Table 10.
Effect from on mediated by
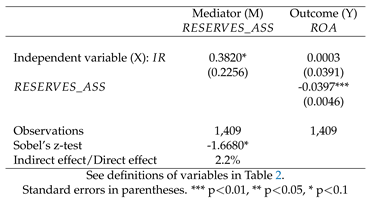 |
Table 11.
Regressions of equity valuation on environmental impact ratios
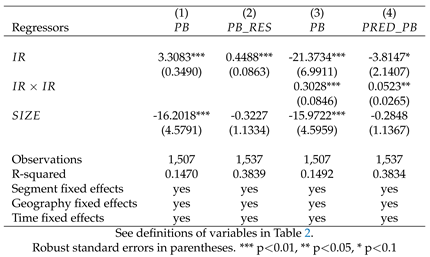 |
Table 12.
Regressions of reserves (columns (1)-(3)), leverage (column (4), and profits (columns (5)-(6)) on environmental impact ratios controlling for environmental scores
Table 12.
Regressions of reserves (columns (1)-(3)), leverage (column (4), and profits (columns (5)-(6)) on environmental impact ratios controlling for environmental scores
 |
Disclaimer/Publisher’s Note: The statements, opinions and data contained in all publications are solely those of the individual author(s) and contributor(s) and not of MDPI and/or the editor(s). MDPI and/or the editor(s) disclaim responsibility for any injury to people or property resulting from any ideas, methods, instructions or products referred to in the content. |
© 2024 by the authors. Licensee MDPI, Basel, Switzerland. This article is an open access article distributed under the terms and conditions of the Creative Commons Attribution (CC BY) license (http://creativecommons.org/licenses/by/4.0/).
Copyright: This open access article is published under a Creative Commons CC BY 4.0 license, which permit the free download, distribution, and reuse, provided that the author and preprint are cited in any reuse.


