
Submitted:
22 August 2024
Posted:
23 August 2024
You are already at the latest version
Abstract
Correlated binary data in a 2x2 table has been analyzed from both the frequentist and Bayesian perspectives, but a fully Bayesian hierarchical model has not been proposed. This is a commonly used model for correlated proportions when considering, for example, a diagnostic test performance where negative subjects are tested a second time. We consider a new hierarchical Bayesian model for the parameters resulting from a 2x2 table with a structural zero. We investigate the performance of the hierarchical model via simulation. We then illustrate the usefulness of the model by showing how a set of historical studies can be used to build a predictive distribution for a new study that can be used as a prior distribution for both the rate ratio and marginal probability of a positive test. We then show how the prior based on historical 2x2 tables can be used to power a future study that accounts for pre-experimental uncertainty. High quality prior information can lead to better decision making by improving precision in estimation and by providing realistic numbers to power studies.
Keywords:
meta-analytic prior
; structural-zero
; bayesian
1. Introduction
In some medical designs with a binary response, a second measurement is taken for some subjects, but not all. For example, Toyota et al. (1999) [1] consider data on a screening test for tuberculosis where only those testing negative on a first test are given a second test. Johnson and May (1995) [2] consider a common problem in medical studies where infected individuals are given a treatment and tested for improvement. In this situation, only those patients where no improvement is observed advance to a second phase and again checked for improvement. Data from both of these examples lead to 2 x 2 tables where one cell is fixed in advance to be 0. The data in a typical design and the underlying probabilities are provided in Table 1 in terms of the two stage treatment scheme. For a single table the quantities generally of interest are the risk difference and risk ratio which are often parameterized in terms of the [1, 1] cell probability and the marginal probability . The risk difference is defined to be , that is, the difference between the probability of no improvement and the conditional probability of no improvement in the second phase given no improvement in the first. The rate ratio is the ratio of no improvement in either phase to no improvement in the second phase given no improvement in the first phase and is computed as .
There has been considerable interest in various approaches to estimate and perform hypothesis tests about the risk difference and risk ratio for a single 2x2 table with a structural zero. An example from veterinary medicine originally in Agresti (2012) [3] and recently analyzed by Lu et al. (2022) [4] is where a sample of calves are tested for a primary pneumonia infection and checked again for a secondary infection. Calves who tested negative for the primary infection cannot develop the secondary infection, so that cell is the structural zero. Using this example as a motivation, Lu et al. (2022) consider various confidence interval procedures for the risk difference. Wang et al. (2024) [5] consider an exact interval for the risk ratio and compare their new interval to both frequentist and Bayesian intervals. They apply their new interval to the two-step tuberculosis data where only negative subjects are tested twice.
| Phase II | |||
| Phase I | + | - | Total |
| + | |||
| - | - | ||
| Total | |||
Though considerable work has been done on estimating the parameters of the model for a single population, less work has been done when multiple sources of information are available. Johnson and May (1995) [2] provide a frequentist approach to combining multiple tables and Tang and Jiang (2011) [6] extend the model for a frequentist test of equality of risk ratios across tables, but to date, no Bayesian approach has looked at multiple tables. A reasonable approach to combine 2x2 tables from multiple trials, sites, etc. is to employ a Bayesian hierarchical model (Gelman et al.) [7]. The Bayesian hierarchical model allows for a straightforward way to account for heterogeneity between the included studies, and provides an operational approach to incorporate prior information and to estimate numerous quantities simultaneously. The hierarchical modeling approach provides many advantages. The pooling of information across studies can provide more efficient estimation of all the study level risk ratios or risk differences. Also, the hierarchical model can provide a straight-forward way to rank and select sites by effectiveness of a treatment or risk of an infection.
The hierarchical model we propose here is similar in form to a random effects meta-analysis. Several authors, primarily in pharmaceutical applications, have discussed methods for using historical data to derive priors for a new study by predicting the parameter values based on a meta-analysis of historical studies. Sutton et al. (2007) [8] consider a hybrid Bayesian-frequentist approach to power a future study using a meta-analysis of historical studies to help determine the effect size. When used just for the control arm, these priors are sometimes referred to as meta-analytic predictive (MAP) priors. Neuenschwander et al. (2010) [9] provide an early example. Weber et al. (2021) [10] provide a user friendly R package to build MAP priors based on historical studies for experiments with binomial, Poisson, and normally distributed outcomes. These priors can be used as informative priors for new studies, but can also be used as part of a sample size determination procedure. Recent examples include Du and Wang (2016) [11] and Qi et al. (2023) [12].
In this paper, we propose a hierarchical model for a series of 2x2 tables with a structural zero. The main model we consider is a Bayesian version of Tang and Jiang (2006) [6] where interest is in the rate ratio. Specifically, the parameters for each study are the rate ratio and marginal probability of a response. The borrowing of strength across the studies improves inferences about the individual study parameters while also allowing for a variety of interesting statistical inference procedures. We apply the meta-analytic predictive prior method of Neuenschwander et al. (2010) [9] to develop a simulation based induced prior for the parameters of a new study. We illustrate how this prior can be used as a prior for data analysis and to determine the sample size required for a future study that achieves a desired power or probability of a successful trial. We propose an alternative hierarchical model in Section 5 for the case where the risk difference is of interest.
2. Bayesian Model
In this section we describe the hierarchical Bayesian model we will use for inference for combining 2x2 tables with structural zeroes. Suppose we observe data from K sites or studies yielding 2x2 tables in the form of Table 1. We assume the parameters of the tables are exchangeable. The hierarchical model we propose is the following. The most common model for 2x2 tables with a structural zero uses a hierarchical trinomial model. For each study we have count vector ), and
where ). For a single study, this distribution has likelihood
We reparameterize model (10) similar to Tang and Jiang (2011) in terms of the nuisance parameter = and rate ratio = . The rate ratio is defined on the positive real line and is confined between 0 and . The resulting likelihood is
In the most general case, we consider a hierarchical model on the log rate ratios and model the ’s with a hierarchical truncated beta distribution. For the rate ratios, we have
Modeling these site specific parameters with a normal distribution with shared hyper-parameters allows for “borrowing” or “pooling” of strength when estimating each of the site level effects and can be particularly beneficial when the sample sizes are small. In general, we would imagine little information would be available on the parameters and . Reasonable non-informative priors for the means would be where is a suitably chosen large number such as 100. Some controversy exists on what a suitable “non-informative” prior for the variance parameter in hierarchical models such as the one we propose here. Historically, an with often chosen to be 0.001 has often been used. Gelman (2004) has shown that this parameterization has many weaknesses, especially in the case of a small number of strata. Gelman (2004) determines the uniform distribution, half normal, and half t distributions as a prior for the standard deviation all out perform the inverse gamma for the variance. We provide code for both the cases of a uniform prior or a half-normal prior for the standard deviation . That is, either or where B is the upper bound of the uniform prior and is the scale parameter of the half-normal.
The model for the ’s requires careful thought due to the restriction that they are bounded by the minimum of 1 and . One common hierarchical model for probabilities is to assume
However, given the upper bound problem, we chose instead to remain on the probability scale. For this version of the hierarchical model, the ’s, conditional on , are assumed to have a truncated beta distribution,
We reparameterize the beta in terms of and . The grand mean, is assigned a prior and p is given a prior. The parameters of these distributions are generally selected to be non-informative. The joint posterior distribution of all the parameters is the product of the likelihood in (3), the normal distributions for the log rate ratios in (4), the beta distributions for the ’s, and the priors for the parameters at the top of the hierarchy. There is no apparent closed form for any of the parameters of this model. We use the software JAGS to perform inference. The code is available at https://github.com/will-stamey1/metaanalytic_for_2by2s. An alternative formulation of the hierarchical model that is more convenient for some scenarios is provided in Section 5.
2.1. Meta Analytic Based Prior
The hierarchical model described above can be used to perform inferences on the parameters of interest, but can also be used to determine a prior for a new study. Our framework is similar to that of Sutton et al. (2007) [8], Neuenschwander et al. (2010) [9], and Qi et al. (2023) [12]. As mentioned previously, we assume the parameters in the different studies to be exchangeable. This calls for careful selection of the included studies.
To determine the meta-analytic prior, we augment the MCMC analysis of the hierarchical model of Section 2. As part of the MCMC scheme, a new study is included with no observed data. The model based on the borrowed information from the historical studies, provides what are essentially prior-predictive distributions for both the study level parameters and the unobserved data of the new study. This is illustrated with the graphic in Figure 1, similar to Figure 1 of Weber et al. [10].
In order to get the predictive distribution for the parameters of the new study, we add the following trinomial distribution to the likelihood of the hierarchical model:
The probabilities of the above distribution depend on parameters and .
The predictive distribution for the parameters can be used as a prior distribution for the parameters of the new study. Weber et al. [10] use a mixture of parametric distributions to approximate the prior with the R package RBesT. The Monte Carlo samples from the meta-analysis can also be used as a numerical approximation to the prior. The prior predictive distribution of the data for the new study can be used to simulate likely values for the data in order to either power a new study or look at the probability of a successful trial for a specific sample size.
3. Simulation Study
We conducted a simulation to investigate both the performance of the hierarchical model and the impact on between trial variability on the informativeness of the resulting prior. We expand on the number of groups, but use the data of Tang and Jiang (2011) [6] to determine the parameter values for our first simulation. The data set they examine is for a two-phase treatment regimen in which a sample of patients first receives an initial treatment. Those who do not show improvement then proceed to a follow-up treatment. The parameter of interest is the risk ratio, the ratio of the conditional probability of no improvement in the second regimen given no improvement in the first regimen to the probability of no improvement in the first regimen. Values less than 1 indicate that the second regimen leads to an improvement. In Tang and Jiang [6], the groups are based on severity of disease. This would likely violate the exchangabilty assumption of our model, but the example works as an illustration. They find the s’ center approximately around 0.4 and the risk ratios’ center approximately at 0.7. So for our simulation, we choose = 0.4, = 20, and = log(0.7). We also looked at the case where the risk ratio is centered above 1 to make sure performance was not impacted in that case. We are interested in the impact of the between study variability of the rate ratio’s, so we consider two values of , 0.075 and 0.15. Also of interest is the effect of the amount of information. To observe this, we vary the number of studies (10, 25) and the number of observations in each study (30, 100). For these 8 combinations, we generated 1000 data sets for each combination. For each data set, the values at the top of the hierarchy remain the same, but, the study level ’s and ’s vary. So, for the simulation we keep track of the average posterior mean, standard deviation, and coverage of 95% intervals for , , , and . For the study level parameters, we keep track of the total average bias for all the ’s and and the overall coverage of the 95% intervals. The total average bias is calculated as
and
where is the posterior mean of and is the posterior mean for .
In Table 1 we provide the bias, confidence interval width, and coverage of 95% intervals for the parameters at the highest level of the rate ratio. In all cases, the coverage is at or above nominal and the intervals narrow as both sample size and number of studies increase. For the small number of studies case, the bias is large, but gets smaller for the larger sample size cases. The estimate for the between trial standard deviation exhibits substantial bias for just about all parameter and sample size combinations. We considered both the half-normal and uniform priors for the standard deviation and in both cases the posterior mean was significantly higher than the true value. However, the coverage was still nominal and the bias did lesson as the number of studies increased.

| K | N | RR | % Bias | CI Len. | Covrg. | % Bias | CI Len. | Covrg. | |
| 0.016 | 1.572 | 0.987 | 559.845 | 1.384 | 0.939 | ||||
| 0.075 | 5 | 100 | 0.7 | 11.346 | 0.907 | 0.995 | 309.051 | 0.932 | 0.972 |
| 0.075 | 25 | 30 | 0.7 | 9.393 | 0.487 | 0.96 | 215.909 | 0.569 | 0.963 |
| 0.075 | 25 | 100 | 0.7 | 2.626 | 0.254 | 0.964 | 68.492 | 0.293 | 0.971 |
| 0.15 | 5 | 30 | 0.7 | 29.463 | 1.593 | 0.988 | 237.95 | 1.398 | 0.973 |
| 0.15 | 5 | 100 | 0.7 | 9.571 | 0.955 | 0.988 | 124.16 | 0.975 | 0.971 |
| 0.15 | 25 | 30 | 0.7 | 7.97 | 0.499 | 0.965 | 72.776 | 0.593 | 0.985 |
| 0.15 | 25 | 100 | 0.7 | 1.881 | 0.277 | 0.962 | 13.319 | 0.334 | 0.973 |
| 0.075 | 5 | 30 | 1.2 | -21.146 | 1.415 | 0.991 | 487.342 | 1.269 | 0.952 |
| 0.075 | 5 | 100 | 1.2 | -4.157 | 0.826 | 0.99 | 273.414 | 0.853 | 0.962 |
| 0.075 | 25 | 30 | 1.2 | 2.946 | 0.434 | 0.963 | 158.607 | 0.467 | 0.978 |
| 0.075 | 25 | 100 | 1.2 | 1.177 | 0.233 | 0.972 | 52.875 | 0.259 | 0.974 |
| 0.15 | 5 | 30 | 1.2 | -24.444 | 1.453 | 0.992 | 207.106 | 1.295 | 0.979 |
| 0.15 | 5 | 100 | 1.2 | -4.343 | 0.874 | 0.99 | 104.379 | 0.899 | 0.978 |
| 0.15 | 25 | 30 | 1.2 | -1.851 | 0.453 | 0.958 | 48.451 | 0.501 | 0.98 |
| 0.15 | 25 | 100 | 1.2 | 0.089 | 0.262 | 0.961 | 9.757 | 0.304 | 0.969 |
Table 2 provides the same results for the model for the marginal probability. Again, coverage for both of the parameters was at or above nominal and the bias decreased as the sample size and number of studies increased.
| K | N | RR | % Bias | CI Len. | Covrg. | % Bias | CI Len. | Covrg. | |
| 0.075 | 5 | 30 | 0.7 | 7.319 | 0.293 | 0.976 | -19.023 | 39.597 | 0.995 |
| 0.075 | 5 | 100 | 0.7 | 2.914 | 0.253 | 0.994 | -13.191 | 39.052 | 0.984 |
| 0.075 | 25 | 30 | 0.7 | 1.961 | 0.117 | 0.973 | 1.579 | 31.757 | 0.971 |
| 0.075 | 25 | 100 | 0.7 | 0.31 | 0.097 | 0.966 | 1.95 | 25.075 | 0.961 |
| 0.15 | 5 | 30 | 0.7 | 7.531 | 0.293 | 0.977 | -19.077 | 39.584 | 0.995 |
| 0.15 | 5 | 100 | 0.7 | 3.725 | 0.255 | 0.991 | -14.237 | 38.596 | 0.982 |
| 0.15 | 25 | 30 | 0.7 | 2.217 | 0.117 | 0.97 | 1 | 31.621 | 0.974 |
| 0.15 | 25 | 100 | 0.7 | 0.949 | 0.097 | 0.955 | 1.272 | 24.979 | 0.966 |
| 0.075 | 5 | 30 | 1.2 | 10.535 | 0.325 | 0.971 | -21.277 | 39.622 | 0.995 |
| 0.075 | 5 | 100 | 1.2 | 5.438 | 0.27 | 0.973 | -14.135 | 39.619 | 0.983 |
| 0.075 | 25 | 30 | 1.2 | 3.512 | 0.143 | 0.97 | 2.742 | 34.249 | 0.983 |
| 0.075 | 25 | 100 | 1.2 | 1.273 | 0.109 | 0.966 | 1.363 | 26.424 | 0.97 |
| 0.15 | 5 | 30 | 1.2 | 10.351 | 0.326 | 0.969 | -21.974 | 39.37 | 0.993 |
| 0.15 | 5 | 100 | 1.2 | 4.965 | 0.271 | 0.981 | -14.894 | 39.411 | 0.983 |
| 0.15 | 25 | 30 | 1.2 | 3.119 | 0.144 | 0.975 | 0.625 | 33.726 | 0.982 |
| 0.15 | 25 | 100 | 1.2 | 1.157 | 0.11 | 0.961 | 0.422 | 26.774 | 0.973 |
Table 3 provides results for the study level parameters. These parameters changed with each data set which is why we looked at the overall bias using Equations (8) and (9) and the combined coverage. As can be seen, at the study level, the parameters are well estimated with the only moderately large biases in the case of only 5 studies and sample sizes of 30. The others combinations have relatively low bias and good coverage.
| K | N | RR | % Bias | Covrg. | % Bias | Covrg. | |
| 0.075 | 5 | 30 | 0.7 | 7.292 | 0.977 | 2.424 | 0.962 |
| 0.075 | 5 | 100 | 0.7 | 0.958 | 0.977 | 0.767 | 0.955 |
| 0.075 | 25 | 30 | 0.7 | 1.963 | 0.993 | 2.919 | 0.956 |
| 0.075 | 25 | 100 | 0.7 | 0.647 | 0.982 | 1.09 | 0.954 |
| 0.15 | 5 | 30 | 0.7 | 8.009 | 0.973 | 2.378 | 0.964 |
| 0.15 | 5 | 100 | 0.7 | 2.238 | 0.967 | 0.655 | 0.957 |
| 0.15 | 25 | 30 | 0.7 | 3.58 | 0.981 | 2.89 | 0.956 |
| 0.15 | 25 | 100 | 0.7 | 1.833 | 0.954 | 1.18 | 0.953 |
| 0.075 | 5 | 30 | 1.2 | 10.714 | 0.979 | 2.125 | 0.963 |
| 0.075 | 5 | 100 | 1.2 | 3.637 | 0.971 | 0.675 | 0.959 |
| 0.075 | 25 | 30 | 1.2 | 4.392 | 0.99 | 2.807 | 0.963 |
| 0.075 | 25 | 100 | 1.2 | 1.567 | 0.979 | 1.08 | 0.954 |
| 0.15 | 5 | 30 | 1.2 | 11.2 | 0.975 | 2.383 | 0.963 |
| 0.15 | 5 | 100 | 1.2 | 3.703 | 0.966 | 0.777 | 0.957 |
| 0.15 | 25 | 30 | 1.2 | 4.681 | 0.975 | 3.317 | 0.957 |
| 0.15 | 25 | 100 | 1.2 | 2.22 | 0.95 | 1.386 | 0.95 |
Finally, Table 4 provides the average of the predicted distributions for the parameters of the new studies. As can be seen, the predictive distributions are centered approximately at the mean of the population distribution and the 95% interval widths decrease for the larger study and sample size cases demonstrating that the method would provide reasonable prior distributions based on these historical studies.
| RR* | |||||||
| K | N | RR | Mean | CI Length | Mean | CI Length | |
| 5 | 30 | 0.075 | 0.7 | 1.017 | 2.883 | 0.429 | 0.64 |
| 5 | 30 | 0.075 | 1.2 | 1.653 | 4.487 | 0.442 | 0.664 |
| 5 | 100 | 0.075 | 0.7 | 0.786 | 1.508 | 0.412 | 0.598 |
| 5 | 100 | 0.075 | 1.2 | 1.378 | 2.399 | 0.422 | 0.61 |
| 25 | 30 | 0.075 | 0.7 | 0.719 | 0.957 | 0.408 | 0.473 |
| 25 | 30 | 0.075 | 1.2 | 1.259 | 1.395 | 0.414 | 0.482 |
| 25 | 100 | 0.075 | 0.7 | 0.705 | 0.484 | 0.401 | 0.453 |
| 25 | 100 | 0.075 | 1.2 | 1.219 | 0.762 | 0.405 | 0.46 |
| 5 | 30 | 0.15 | 0.7 | 1.045 | 2.975 | 0.43 | 0.641 |
| 5 | 30 | 0.15 | 1.2 | 1.725 | 4.807 | 0.441 | 0.667 |
| 5 | 100 | 0.15 | 0.7 | 0.813 | 1.669 | 0.415 | 0.602 |
| 5 | 100 | 0.15 | 1.2 | 1.39 | 2.651 | 0.42 | 0.613 |
| 25 | 30 | 0.15 | 0.7 | 0.729 | 1.038 | 0.409 | 0.474 |
| 25 | 30 | 0.15 | 1.2 | 1.26 | 1.561 | 0.412 | 0.486 |
| 25 | 100 | 0.15 | 0.7 | 0.713 | 0.614 | 0.404 | 0.455 |
| 25 | 100 | 0.15 | 1.2 | 1.229 | 1.02 | 0.405 | 0.462 |
4. Sample Size Determination
We now illustrate how the prior distribution generated from the historical studies can be used to power a future study. Without loss of generality, we assume the hypothesis of interest is:
The sample size determination procedure we consider here is simulation based and follows from [13] which has been modified to use with MAP priors by, for example, Qi et al (2023) [12]. The method allows for distinct priors for two different parts of the procedure. The design prior is necessarily informative and is used to predict what future data will look like. The design prior can be constructed from historical data or expert opinion. It is important to note that the design prior is similar to "design parameters" in frequentist sample size determination and should match study goals. For instance, for a frequentist sample size determination, the study is powered for a particular effect size of interest that matches, for instance, regulatory requirements or effects observed in previous studies. In contrast, the design prior specifies a distribution of that parameter on which the probability of detection is conditioned. This results in a probability of rejection/success etc. given the parameter is distributed in the manner specified by the design prior.
At the design stage, design priors can account for uncertainty regarding both nuisance parameters and primary parameters, or just in the nuisance parameters. That is, a prior can be assigned to the nuisance parameter(s) to account for pre-experimental uncertainty while a fixed value is assigned to the parameter of interest in the manner of frequentist sample size planning. The fixed value is usually set at some practically significant threshold. When a design prior is used for the focal parameter, the resulting rejection rate is often referred to as "assurance" or "Bayesian assurance" instead of power, see for example Pan and Bannerjee (2023) [14]. The algorithm we propose is provided below.
- Using historical studies, fit the meta-analysis model and determine the design priors for the current study parameters.
- Sample values from and . A different value for is drawn if interest is in assurance and is fixed at particular value for power.
- For sample of size n*, simulate new study data based on RR* and p*.
- Analyze the data (with either non-informative priors or using the informative prior) and determine posterior probability .
- Repeat steps 2 – 4 a large number of times and calculate power (or assurance for random RR*) by computing the proportion of data sets where the null is rejected.
- Repeat steps 2 – 5 with different sample sizes to obtain desired power/probability of successful trial.
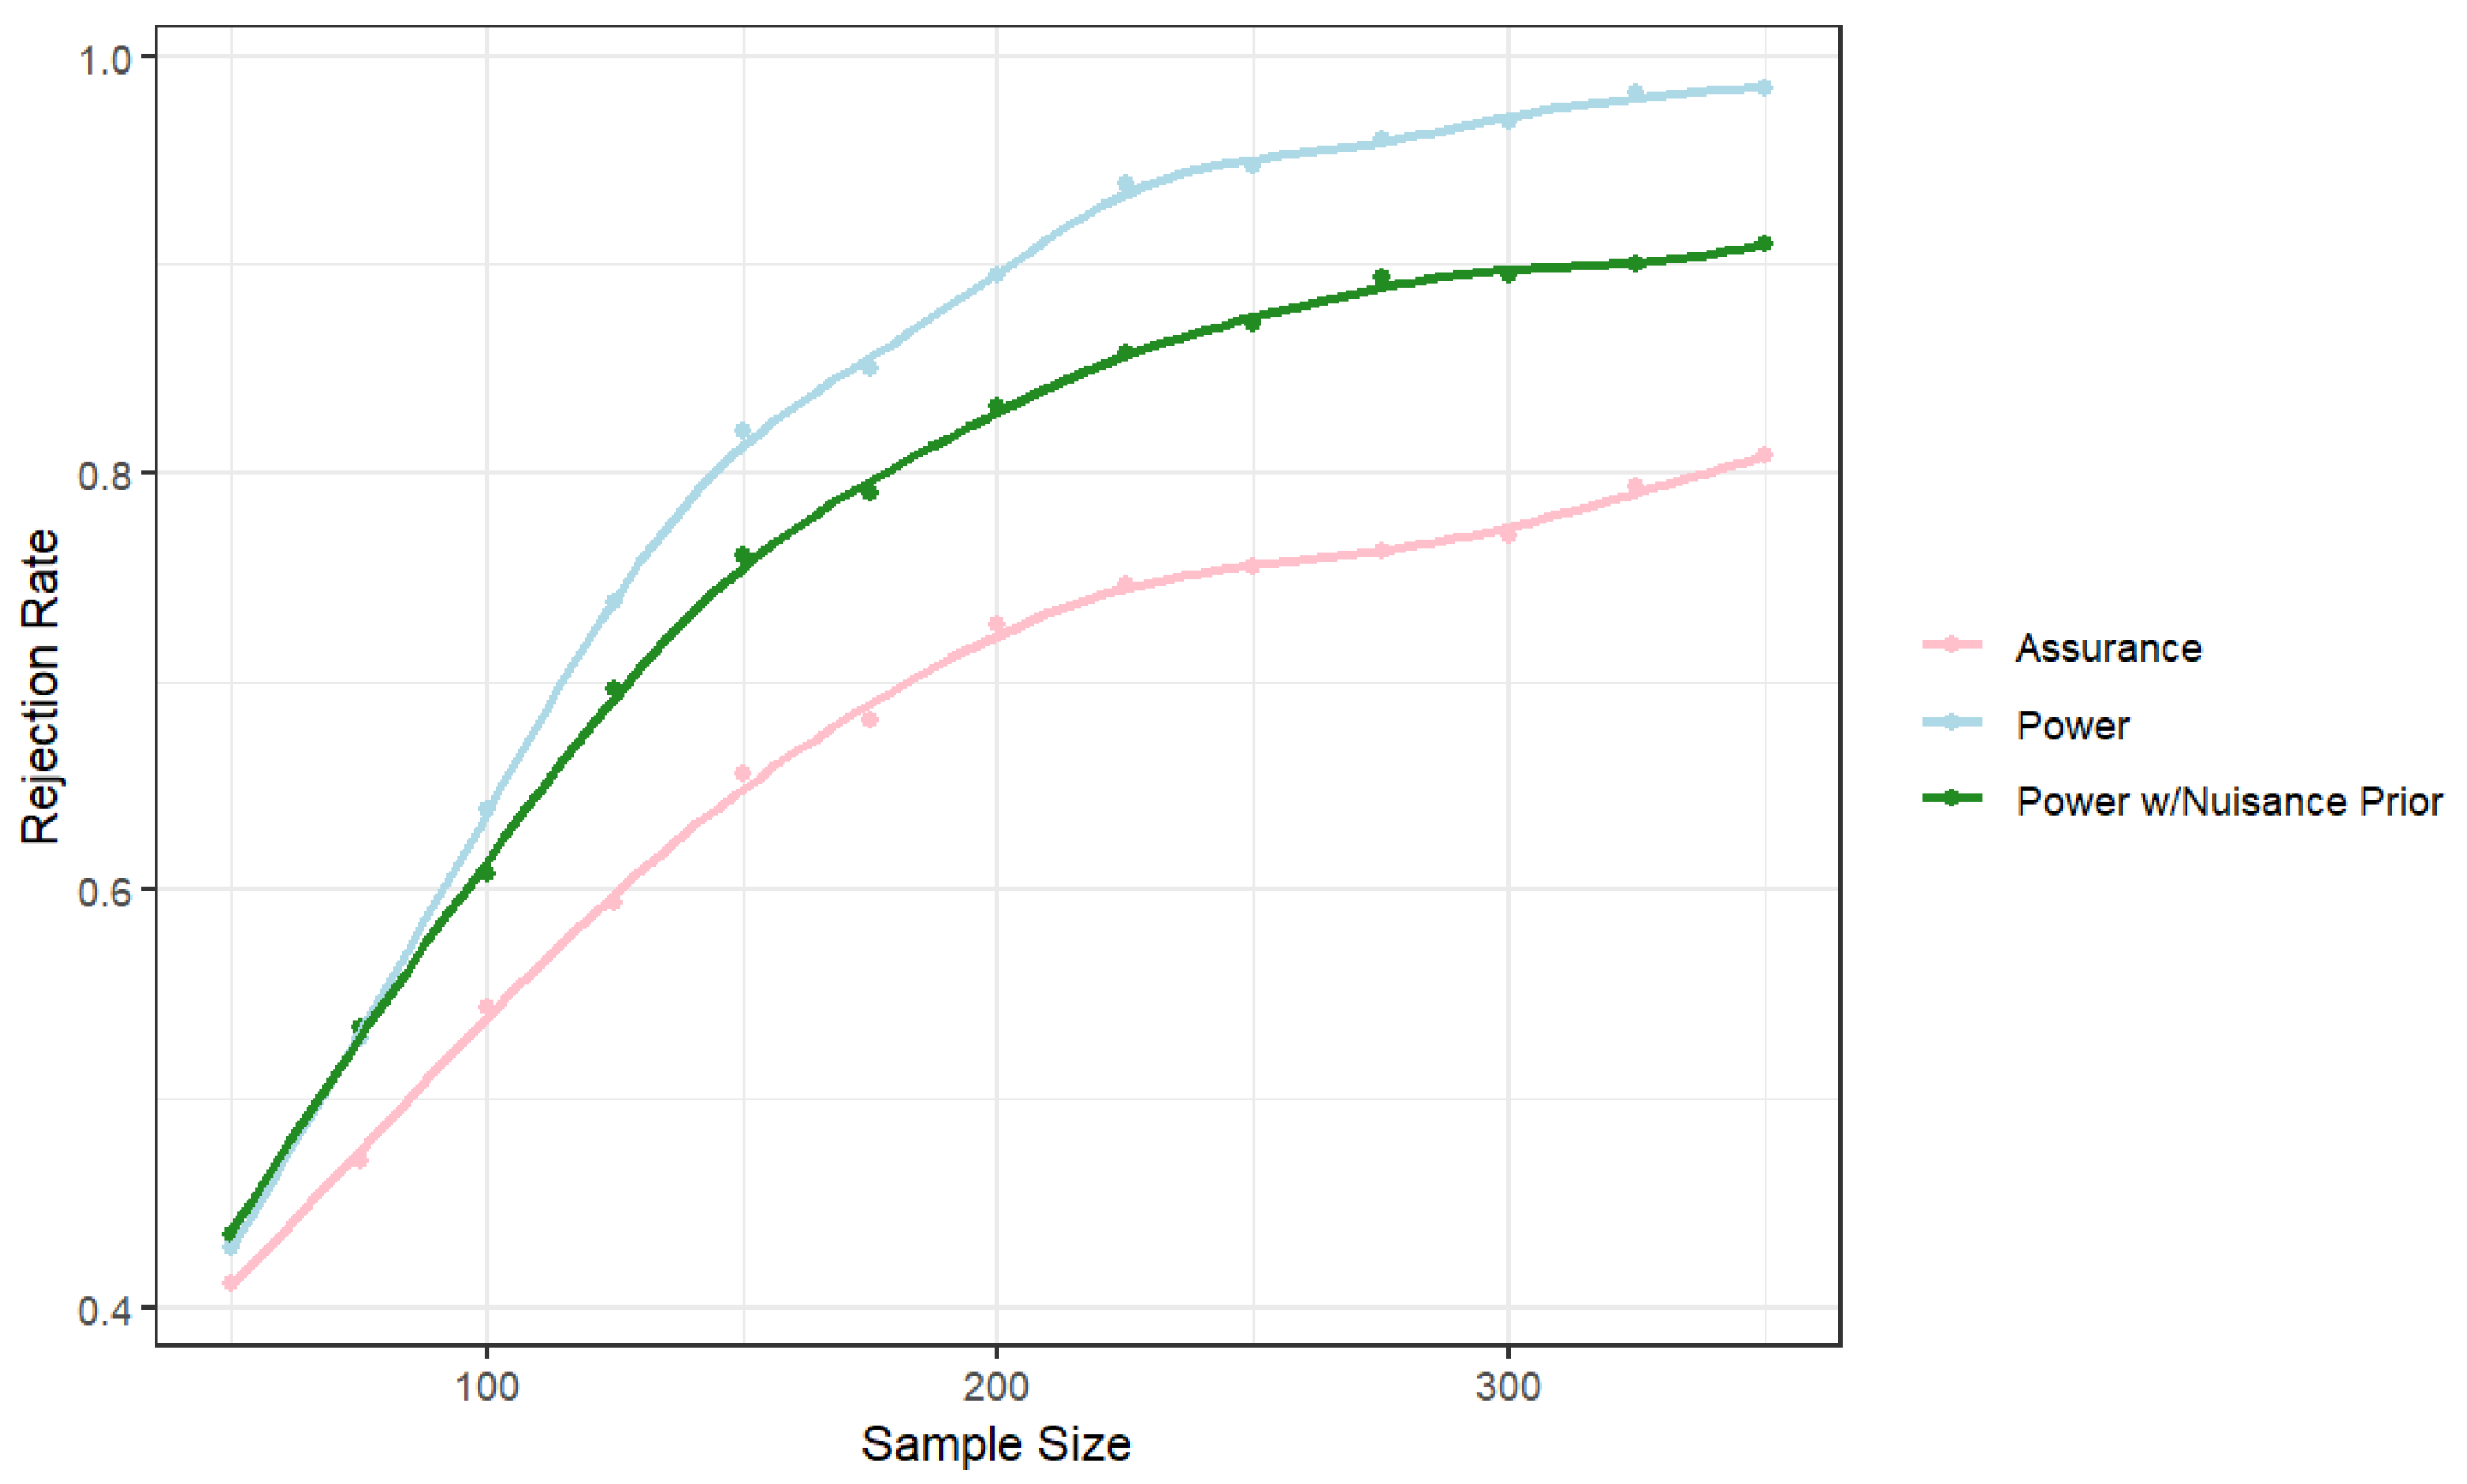
As an example, to formulate a design prior, we simulated 25 data sets of size n = 30 each. For this example, the global rate ratio was assumed to be 0.55 and the mean of the marginal probabilities was assumed to be 0.4. Suppose we seek a power of 0.8, Type I error probability of 0.05, and want to find the sample size to detect a rate ratio of 0.55. At the design stage, considering both the rate ratio and the marginal probability as fixed yields sample sizes similar to Tang et al. (2006) [15]. The fully Bayesian approach allows for the incorporation of uncertainty at the design stage. Figure 1 provides the powers/assurance for three cases. The first is where the rate ratio is assumed fixed at 0.55 and the marginal probability at 0.366. The second replaces the fixed value of with the induced prior from the predictive distribution based on the hierarchical model. Not surprisingly, this uncertainty at the design stage leads to a larger required sample size. Finally, we replaced the fixed value of the rate ratio with the predictive distribution to allow for uncertainty in both parameters. The resulting probability is no longer "power" because it is not a probability of rejection for a specific value. This quantity is commonly called assurance and depending on the amount of variability in the design prior for the parameter of interest, the assurance might not converge to 1 as the sample size increases.
To achieve a power/assurance of 0.8, we require approximately 140 observations if both parameters are assumed fixed at the design stage. If uncertainty in is accounted for at the design stage with the prior from the previous studies, then a sample size of approximately 180 observations is required. If the historical studies are used to provide informative priors for both parameters at the design stage, a sample of approximately 330 observations is required to obtain an assurance of 0.8.
5. Alternative Model
The hierarchical model described in Section 2 is convenient if interest is in the rate ratio. There are other inferential targets of interest for this model. If interest is the risk difference, the the conditional probability , or in homogeneity across tables, the parameterization of Johnson and May (1995) might be the preferred. We provide an alternative hierarchical model for these other circumstances and give an example how it can be used. The JAGS code for this model is found on the same github site as the earlier model.
At the first level, we assume the same data model as before,
We reparameterize the model in terms of the marginal probability and the conditional probability . This parameterization has the benefit that both parameters have support [0, 1]. The resulting likelihood is
Since both and are defined on [0, 1], we assume normal models on the logits of these parameters,
and
We assume the following priors for the top level of the hierarchy,
The risk difference for the ith study is . It might be of interest to test that the conditional and marginal probabilities are equal, but still allow for heterogeneity across strata. This simplifies the data model to the following likelihood:
For this reduced model, only a hierarchical model for the is required and it is the same as described above.
Finally, an intermediate model would be where the risk differences are equal across strata but still have baseline heterogeneity. That is, where is the common risk difference. In this case, the likelihood is
This model requires a prior for . For the multinomial probabilities above to be bounded between 0 and 1 we require
thus we give a prior where , , and a and b can be chosen to reflect expert opinion about the location of . In the absence of information, setting yields a uniform prior over the support.
For a specific data set, the best fitting model can be determined by comparing the Deviance Information Criterion numbers. As an example we consider data found in Johnson and May (1995). In this example, patients are stratified by severity of the disease and an initial treatment is administered. After one week, patients who demonstrate improvement are discharged while patients who do not show improvement are given a second phase and evaluated again one week later. The resulting data are provided in Table 5. We fit the models described in Section 2 using the JAGS software using two chains with a 5,000 iteration burn-in and inferences based on 25,000 iterations. Convergence was monitored via the Gelman-Rubin statistic and graphically with the history plots. No indication of a lack of convergence was noted. The DIC for the model where the marginal and conditional probabilities are equal is 69.41, the DIC for the intermediate model with dqual across strata was found to be 66.93, while the DIC for the most general model was found to be 69.30. Thus the DIC indicates that the model where the differences between the conditional and marginal probabilities are equal across strata is the best fitting.
Table 5.
Data for two phase treatment stratified by severity of disease.
| Phase II | |||
|---|---|---|---|
| Phase I | No Imp | Imp | Total |
| Mild | |||
| No Imp | 46 | 83 | 129 |
| Imp | 176 | 176 | |
| Total | 46 | 259 | 305 |
| Moderate | |||
| No Imp | 16 | 37 | 53 |
| Imp | 91 | 91 | |
| Total | 16 | 128 | 141 |
| Severe | |||
| No Imp | 6 | 21 | 27 |
| Imp | 43 | 43 | |
| Total | 6 | 64 | 70 |
6. Discussion
Numerous frequentist and Bayesian procedures have been proposed for estimating parameters in a correlated 2x2 table with a structural zero. The Bayesian hierarchical model we propose extends previous work in that it is the first Bayesian model to consider estimation in the context of multiple tables. Further, it provides tools to use this set of tables for use in future studies. These tools use the informative priors derived from historic data to assist with analysis and estimation or serve as design priors in sample size planning.
The simulation study illustrated that as the sample sizes and number of studies increased, all parameters were well estimated, except the between study variance, which was overestimated. Though the overestimation diminishes as numbers of studies increase, it does not appear to go away. Adding an informative prior does improve estimation. However, even with this overestimation of the variance, the study level parameters are very well estimated, so unless interest centers on the between study variance, we still recommend the relatively diffuse priors we used in the paper.
We are interested in expanding the applicability and deepening the effectiveness of this toolkit. One avenue for future research is the broadening of the model scope - bringing this approach to related but different table settings. Some examples are settings with comparison of multiple second stage treatments, or settings with K tests/treatments rather than just 2.
Another route for future research involves the incorporation of covariates into the use of the MAP prior for both estimation and sample size planning. In settings where the focal parameters are related to the covariate mix of a given sub-population, the MAP prior could adapt to the covariate mix of the new experiment population, weighting more heavily the experiments in the experiment history which are more similar. This would result in a more effective use of the available information.
References
- Toyota, M.; Kudo, K.; Sumiya, M.; Kobori, O. High frequency of individuals with strong reaction to tuberculin among clinical trainees. Japanese journal of infectious diseases 1999, 52, 128–129.
- Johnson, W.D.; May, W.L. Combining 2 × 2 tables that contain structural zeros. Statistics in medicine 1995, 14, 1901–1911.
- Agresti, A. Categorical data analysis; John Wiley & Sons, 2012.
- Lu, H.; Cai, F.; Li, Y.; Ou, X. Accurate interval estimation for the risk difference in an incomplete correlated 2 × 2 table: Calf immunity analysis. PLOS One 2022, 17.
- Wang, W.; Cao, X.; Xie, T. An optimal exact interval for the risk ratio in the 2× 2 2 * 2 table with structural zero 2024. 13.
- Tang, N.S.; Jiang, S.P. Testing equality of risk ratios in multiple 2× 2 tables with structural zero. Computational statistics & data analysis 2011, 55, 1273 – 1284.
- Gelman, A.; Stern, H.; Carlin, J.; Dunson, D.; Vehtari, A.; Rubin, D. Bayesian Data Analysis, 3rd ed.; CRC Press, 2013.
- Sutton, A.; Cooper, N.; Jones, D.; Lambert, P.; Thompson, J.; Abrams, K. Evidence-based sample size calculations based upon updated meta-analysis. Statistics in medicine 2007, 26, 2479–2500.
- Neuenschwander, B.; Capkun-Niggli, G.; Branson, M.; Spiegelhalter, D. Summarizing Historical Information on Controls in Clinical Trials. Clinical Trials 2010, 7, 5–18.
- Weber, S.; Li, Y.; Seaman III, J.W.; Kakizume, T.; Schmidli, H. Applying Meta-Analytic-Predictive Priors with the R Bayesian Evidence Synthesis Tools. Journal of Statistical Software 2021, 100, 1–32.
- Du, H.; Wang, L. A Bayesian power analysis procedure considering uncertainty in effect size estimates from a meta-analysis. Multivariate behavioral research 2016, 51, 589 – 605.
- Qi, H.; Rizopoulos, D.; van Rosmalen, J. Sample size calculation for clinical trials analyzed with the meta-analytic-predictive approach. Research Synthesis Methods. Research Synthesis Methods 2023, 14, 396–413.
- Wang, F.; Gelfand, A.E. A simulation-based approach to Bayesian sample size determination for performance under a given model and for separating models. Statistical Science 2002, pp. 193–208.
- Pan, J.; Banerjee, S. bayesassurance: An R Package for Calculating Sample Size and Bayesian Assurance. The R Journal 2023.
- Tang, M.L.; Tang, N.S.; Carey, V.J. Sample size determination for 2-step studies with dichotomous response. Journal of statistical planning and inference 2006, 136, 1166–1180.
Figure 1.
Rejection Rates Across Sample Sizes. The “Assurance" condition uses design priors on both and , while “Power" uses fixed values for each, and “Power w/Nuisance Prior" uses a fixed value for , the focal parameter, with a design prior on the nuisance parameter
Figure 1.
Rejection Rates Across Sample Sizes. The “Assurance" condition uses design priors on both and , while “Power" uses fixed values for each, and “Power w/Nuisance Prior" uses a fixed value for , the focal parameter, with a design prior on the nuisance parameter
Disclaimer/Publisher’s Note: The statements, opinions and data contained in all publications are solely those of the individual author(s) and contributor(s) and not of MDPI and/or the editor(s). MDPI and/or the editor(s) disclaim responsibility for any injury to people or property resulting from any ideas, methods, instructions or products referred to in the content. |
© 2024 by the authors. Licensee MDPI, Basel, Switzerland. This article is an open access article distributed under the terms and conditions of the Creative Commons Attribution (CC BY) license (http://creativecommons.org/licenses/by/4.0/).
Copyright: This open access article is published under a Creative Commons CC BY 4.0 license, which permit the free download, distribution, and reuse, provided that the author and preprint are cited in any reuse.


