
Submitted:
22 August 2024
Posted:
23 August 2024
You are already at the latest version
Abstract
In today's technologically advanced landscape, sensors feed critical data for accurate decision-making and actions. Ensuring the integrity and reliability of sensor data is paramount to system performance and security. This paper introduces an innovative approach utilizing discrete wavelet transforms (DWT) embedded within microcontrollers to scrutinize sensor data meticulously. Our methodology aims to detect and isolate malfunctions, misuse, or any anomalies before they permeate the system, potentially causing widespread disruption. By leveraging the power of wavelet-based analysis, we embed computational intelligence directly into the microcontrollers, enabling them to monitor and validate their outputs in real-time. This proactive anomaly detection framework is designed to distinguish between normal and aberrant sensor behaviors, thereby safeguarding the system from erroneous data propagation. Our approach significantly enhances the reliability of embedded systems, providing a robust defense against false data injection attacks and contributing to overall cybersecurity.
Keywords:
discrete wavelet transform
; embedded systems
; anomaly behavior analysis
; sensor fault detection
; computational intelligence
; cybersecurity
; false data injection
; anomaly detection
1. Introduction
In the rapidly evolving technological landscape, sensors are integral components that provide critical data for decision-making processes across various applications. Ensuring the reliability and accuracy of sensor data is critical, as any discrepancies can lead to significant errors and system failures. The importance of this issue is magnified in the context of embedded systems and the Internet of Things (IoT), where sensors operate in diverse and often harsh environments [1,2,3,4,5,6,7].
Recent advancements in computational intelligence have highlighted the need for robust methodologies to detect and mitigate false data injection and anomalies in sensor networks. Traditional approaches, such as signature-based Intrusion Detection Systems (IDS), while effective against known threats, fall short when confronting novel and sophisticated attacks. Therefore, it is desired to develop anomaly-based detection methods that can adapt to new threats and ensure system integrity.
Wavelet transforms, particularly Discrete Wavelet Transforms (DWT), have emerged as powerful tools in signal processing. They allow signals to be decomposed into different frequency components and analyze localized features. We propose a novel approach to real-time anomaly detection and fault isolation in sensor systems by embedding wavelet-based analysis directly into microcontrollers. This method aims to identify deviations from normal sensor behavior, thereby preventing the propagation of erroneous data throughout the system.
This paper leans on the work introduced in [30], targeting anomaly behavior analysis of sensors, the key differences are an innovative methodology for sensor fault detection using wavelet transforms and Euclidean distance calculations in embedded systems. We validate our approach through experiments involving embedded systems that simulate IoT network nodes. The results demonstrate a high detection rate with minimal false alarms, underscoring the efficacy of wavelet-based anomaly detection in enhancing sensor reliability and overall system security.
1.1. Background
With the raising use of IoT applications such as command and control, monitoring, and premises management, to name a few, ensuring the correct operation of all interconnected devices is becoming more and more challenging [20]. Predominantly, the proper functioning of sensors is crucial in IoT applications, requiring continuous research to detect and resolve device issues. Additionally, protecting data integrity as well as reducing potential risks are significant concerns for regular customers, businesses, and even researchers. The next sections show a summary of the most frequent types of sensor faults, some of the strategies applied to address these issues, and the current security techniques for data integrity.
1.1.2. Sensor Fault Classification
There are various methods for classifying sensor faults. For instance, sensor faults can be divided into incipient or abrupt categories according to [1]. Different techniques have been proposed for sensor fault classification, including deep-learning techniques [2] such as convolutional autoencoders [3], decision trees, and particle swarm optimization [4], support vector machine (SVM) and K-nearest neighbor (KNN) classification [5], and generative adversarial networks (GAN) combined with random forest [6]. Several applications regarding faulty systems can be studied; in references as [7]Time-frequency analysis (TFA) and deep learning technologies have been used to detect faults and classify unmanned aerial vehicles (UAVs). In reference [8] a mathematical model with two layers using data-driven methods has been developed for thermocouple sensor fault detection and classification in Nuclear Power Plants (NPP). An incipient fault is a short amount of erratic (abnormal) working status that develops over time, triggering more severe faults in the long term [1]. Some of the most common flaws in this area include sensor drift and bias.
Loss of accuracy is the result of sensor bias, where data samples are replaced with constant values. Since it is a common issue, many strategies have been applied, for instance, authors in [9] suggest the use of angular-rate-aided estimation methods to improve bias assessment. Authors in [10] studied the bias issue in accelerometers used in the drilling process and introduced a sensor fault detection and isolation method that outperforms previous strategies.
The drift phenomenon in sensors is the presence of an offset or bias parameter that slowly changes (drifts) over time. Authors in [11] introduced a sensor drift detection method based on grey models and discrete wavelet transform (DWT), using DWT to decompose the signal and grey models for detrending. On the other hand, authors in [12] propose a trinomial distribution for quantifying sensor drift in temperature sensors, the core of the method uses probabilistic neural networks (PNN) to estimate the correct temperature and then compare with the online values.
In addition to the drift and bias errors, a sudden fault can occur when the sensor unexpectedly stops working due to physical damage. This leads to a detectable fault parameter [1] that can be seen as sensor noise, short circuits, open circuits and/or random sensor faults. Sensor noise can show up in two types: internally (originating from the sensor and its inner circuit) and externally (occurring from an outside source). For instance, faulty connections and disconnections, respectively trigger short and open-circuit faults. Random sensor faults, on the other hand, stem from the intricate layout environment, potentially surpassing the sensor's capabilities [1].
1.2.3. Wavelets
Wavelets are short-duration waveforms used for analyzing functions. Wavelets allow splitting signals to into different frequency components and at different scales. Wavelet analysis involves decomposing signals into wavelet coefficients, representing their components at different scales and positions in time. This is different from approaches like the Fourier transform [13,14]. Due to these features, wavelets are widely used for solving problems related to time-varying non-stationary variables. The wavelet transform represents a signal as a set of essential functions (wavelets) obtained from the translation and scaling of a mother wavelet, given by equation (1):
Continuous wavelet transforms (CWT) enables the mapping of properties in non-stationary signals. In time-frequency, the coefficients in (2) are obtained by changing the scale and position parameters of a signal [13]:
There is also a discrete wavelet transform (DWT), which consists of the decomposition of the signal into a mutually orthogonal set of wavelets. The DWT is described thoroughly in [15] and in the seminal paper [16]. This transform is expressed by (3):
On the other hand, the DWT coefficients are represented by equation (4):
The simplest wavelet is the Haar wavelet, which is represented by a step function as shown in equation (5):
The discrete Haar wavelet transform is widely used due to its simplicity and has been enhanced for various applications [14]. The process involves applying an ordered fast form of the transform to analyze a discrete signal. It starts with a one-dimensional array of entries and then undergoes n iterations of the same basic transform. This transform calculates a sample using the average and the difference between two points of an approximation function.
Before the iteration number where , this array consists of step-functions defined by (6) or (7):
After iteration l, the array will have half as many coefficients of step functions and coefficients given by (8) or (9):
The calculation of the two wavelet coefficients, also called approximation coefficients and detail coefficients, in each iteration for an array of values is given by (10) and (11):
The pairs of new coefficients constitute two arrays given by (12) and (13):
This algorithm allows the preservation of the basic information of the whole array.
1.2.4. Anomaly Behavior Analysis
Current cyber-security solutions must be more effectively to cope with the exponential increase in the quantity and complexity of cyber-attacks [17,18,19,20,21]. Two important techniques for detecting such threats are signature-based and anomaly-based Intrusion Detection Systems (IDS) [18,22,23]. Signature-based IDS relies on a set of known attack signatures or identities. However, these systems fail when it comes to detecting new attack types or even known attacks with small modifications to their base signatures. On the other hand, anomaly-based detection approaches excel in identifying novel and emerging threats or failures.
Anomaly-based IDS establishes a baseline model of the system's normal behavior through offline training (under known conditions) and flags any activity that deviates from this model as abnormal [24,25,26]. Configuration, misuse, or any fault can lead to abnormal behavior. However, this approach may generate numerous false alarms, which is a significant disadvantage.
1.2.5. Quality Control
Quality engineering ensures that projects, products, or services meet specified standards. It includes monitoring, testing, control, and taking corrective actions to identify and rectify defects or deviations from quality criteria. The objective is to produce reliable and accurate results, minimize issues, and continually enhance the quality of a given output [27]. Usually, quality control is linked with the information provided by a device or manually by humans. Using multiple sensors in industrial environments could benefit quality control in production lines. These benefits include data analytics to detect possible issues in the whole process, the simulation of physical production through real-time data, and more worker engagement [27].
This work uses quality control techniques to inspect any sensor deviation. After obtaining the limits of normal operation, the samples from a sensor’s wavelets are inspected to determine whether they are exhibiting normal behavior [28].
The paper is organized as follows: Section I provided a theoretical background on IoT applications, sensor faults, quality control, anomaly behavior analysis, and wavelets. Section II details the proposed methodology for monitoring sensor functionality. Section III presents the experimental results, and Section IV offers conclusions and future work directions.
2. Materials and Methods
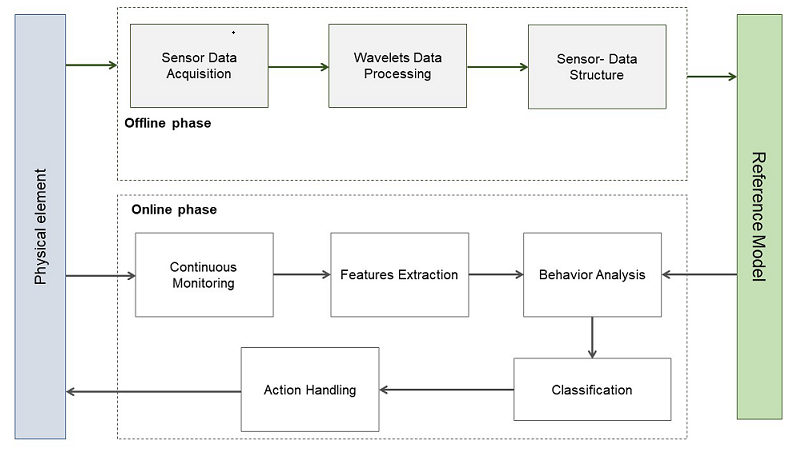
The methodology is divided into two phases: A) offline and B) online. The reference model is created offline, whereas the data obtained is compared against the data structure online. Figure 1 shows a general diagram of the proposed methodology.
2.1. Offline Phase
The sensors are connected to a custom-made embedded system board featuring an STM32F411CEU microcontroller (Figure 2). The data obtained is decomposed using the DWT method, as shown in Equations (1) to (5). At each level of decomposition, the extracted coefficients are used to build a data structure (reference model). The STM32F411 microcontroller is renowned for its advanced processing capabilities and integrated peripherals. It features a 100 MHz ARM Cortex-M4 core, providing sufficient processing power to handle wavelet transforms in real-time. Additionally, the STM32F411 includes a Floating-Point Unit (FPU), which significantly enhances performance in complex mathematical operations required for the DWT.
One of the key features of the STM32F411CEU is its wide range of peripherals, including high-resolution ADCs that enable precise sensor data acquisition. It also offers flexible communication interfaces such as SPI, I2C, and UART, facilitating integration with sensors and other system components. These features make the STM32F411 ideal for applications requiring efficient signal processing and high peripheral integration.
In the offline phase, the approximation and detail coefficients for n = 3 are obtained for the signal array x[2n], which stores the 8 most recent moisture values (2n = 8 incoming values) obtained from the sensor. Both coefficients are calculated through (10) and (11). After decomposing the signal, the coefficients from each level are combined into a 1-D array, which serves as the data structure.
The reference model is then built offline by using normal measurement attributes (normal Euclidean distance) for each sensor data structure (see Equation (12)). Ten arrays are used to find the control limits for normal operation. Each array is compared with the rest, which has 80 Euclidean distances (Euclidean samples, ES), to build control limits [29]. As mentioned in [28], ten samples are enough to inspect deviation from nominal values in a normally distributed population.
In the equation (12), represents an element of any of the 10 sample DWTs, while represents an element of the reference DWT, obtained after applying the DWT to the first sample.
The reference model is then built with information about the control limits and the reference vectors. The control limits are computed as described in (13):
The reference model contains the control limits and a reference vector to be compared with the incoming values.
2.2. Online Phase
To illustrate the proposed approach in a real-world scenario, we present a case study measuring soil moisture levels in a Coriandrum sativum (coriander) plant. The objective is to maintain soil moisture within an acceptable range with minimal variations. The architecture depicted in Figure 3 is applied, where the soil moisture sensor serves as the sensing element, and the actuator is represented by a valve that waters the plant. Additionally, two LEDs (green and red) indicate normal or abnormal behavior.
2.2.1. Continuous Monitoring
During the monitoring process, the microcontroller assists in gathering soil moisture level data. The sensor records eight soil moisture level values every 60 seconds at a sampling rate of 1 second. The limited number of samples (8 samples) makes implementing the proposed approach in resource-constrained embedded systems feasible. The sensor captures this data by converting the analog signal into a 10-bit digital value representing the soil moisture percentage.
2.2.2. Feature Extraction
In this stage, the data is processed similarly to wavelet data in the offline phase. The data is decomposed using a high-pass filter, aggregating the features into a 1-D vector. This new vector will aid in inspecting the sensor's behavior by comparing it to the reference model.
2.2.3. Behavior Analysis and Classification
The 1-D vector is compared with the representative vector in the reference model to obtain an Euclidean Distance. The same applies to the following 10 vectors to obtain the Euclidean distances. If any of the two conditions in (13) is met for (12) in any of the 10 distances, then the system is not behaving as expected, and the most probable cause is the sensor. If any conditions in (13) are not met, the data is classified as corrupt (wrong or harmful), then two actions will be triggered. The first action is conducted to stop the proliferation of the data, and the second is activating a visual alert.
2.3.4. Action Handling
The final stage involves activating one of two indicator LEDs based on the action determined by the classification unit. A green LED is turned on to indicate normal sensor functioning, while a red LED is activated to indicate a sensor fault. If a sensor fault is detected, the microcontroller will close the valve and send a message indicating the need to repair or replace the sensor.
3. Results
The system architecture illustrated in Figure 4 was utilized to implement the proposed approach. It is a basic communication network consisting of three primary components: a computer, an embedded system, and a set of sensors and actuators.
Figure 5 shows the testbed for the proposed approach. It includes a 32-bit microcontroller embedded in a custom-made board, which is connected to a soil moisture sensor using the sensor pinout: the analog output (AO), the ground (GND), and the voltage input (VCC). Pin A0 in the microcontroller was set as an analog input, while pins D1 and D0 were set as TX and RX connectivity pins, respectively. The sensor data was received using Algorithm 1, executed in a loop.
| Algorithm 1: Transmitting data through microcontroller. |
|
Input: Raw analog values coming from sensor. Output: Soil moisture percentage.
|
In Algorithm 1, incoming data is converted from analog to digital values and stored in a 32-element array. After that, these 32 elements are printed from the first to the last. The printed values are then received and plotted using Algorithm 2.
| Algorithm 2: Receiving data from microcontroller. |
|
Input: Printed digital value from 0 to 1023. Output: Plotted soil moisture values.
|
Algorithm 2 receives and splits the array the microcontroller sends into 32 values. Each value is multiplied by (100/1023) and subtracted from 100. This process converts each value from 0 to 1023 into a moisture percentage ranging from 0% to 100%. In this conversion, 100% represents the maximum moisture, and 0% represents the minimum moisture. Figure 6 displays the plot created using Algorithm 2. This plot illustrates normal moisture levels measured immediately after moderate plant watering.
Also, to evaluate the sensor behavior, the Euclidean distances of the Haar DWT were calculated and plotted for ten 1D 8-element arrays. Algorithm 3 summarizes the steps used to obtain these distances. This process involves creating a 1D wavelet pattern and a set of additional wavelets of the same dimension.
| Algorithm 3: Computing of Euclidean distances between DWTs |
|
Input: Soil moisture percentage Output: Euclidean distance between pattern and calculated wavelets
|
Figure 7 depicts a plot of the 30 Euclidean distances calculated using Algorithm 3. In the plot, all the values fall within the range defined by x̅ ± 3σ (green and blue lines), referred to as control limits (UCL and LCL). This outcome suggests that the sensor accurately measures stable moisture levels, indicated by the activation of a green LED. However, if the results fall outside these control limits, a red LED is activated, and the plant watering valve will close to allow for sensor replacement or repair. These procedures are summarized in Algorithm 4.
| Algorithm 4: Sensor element activation. |
|
Input: Euclidean distance between wavelets. Output: Signal to activate led and modify valve closing.
|
Figure 7 illustrates that all recent measurements fall within the three-sigma limits from the mean, indicating minimal deviation from the mean and, thus, the correct functioning of the sensor.
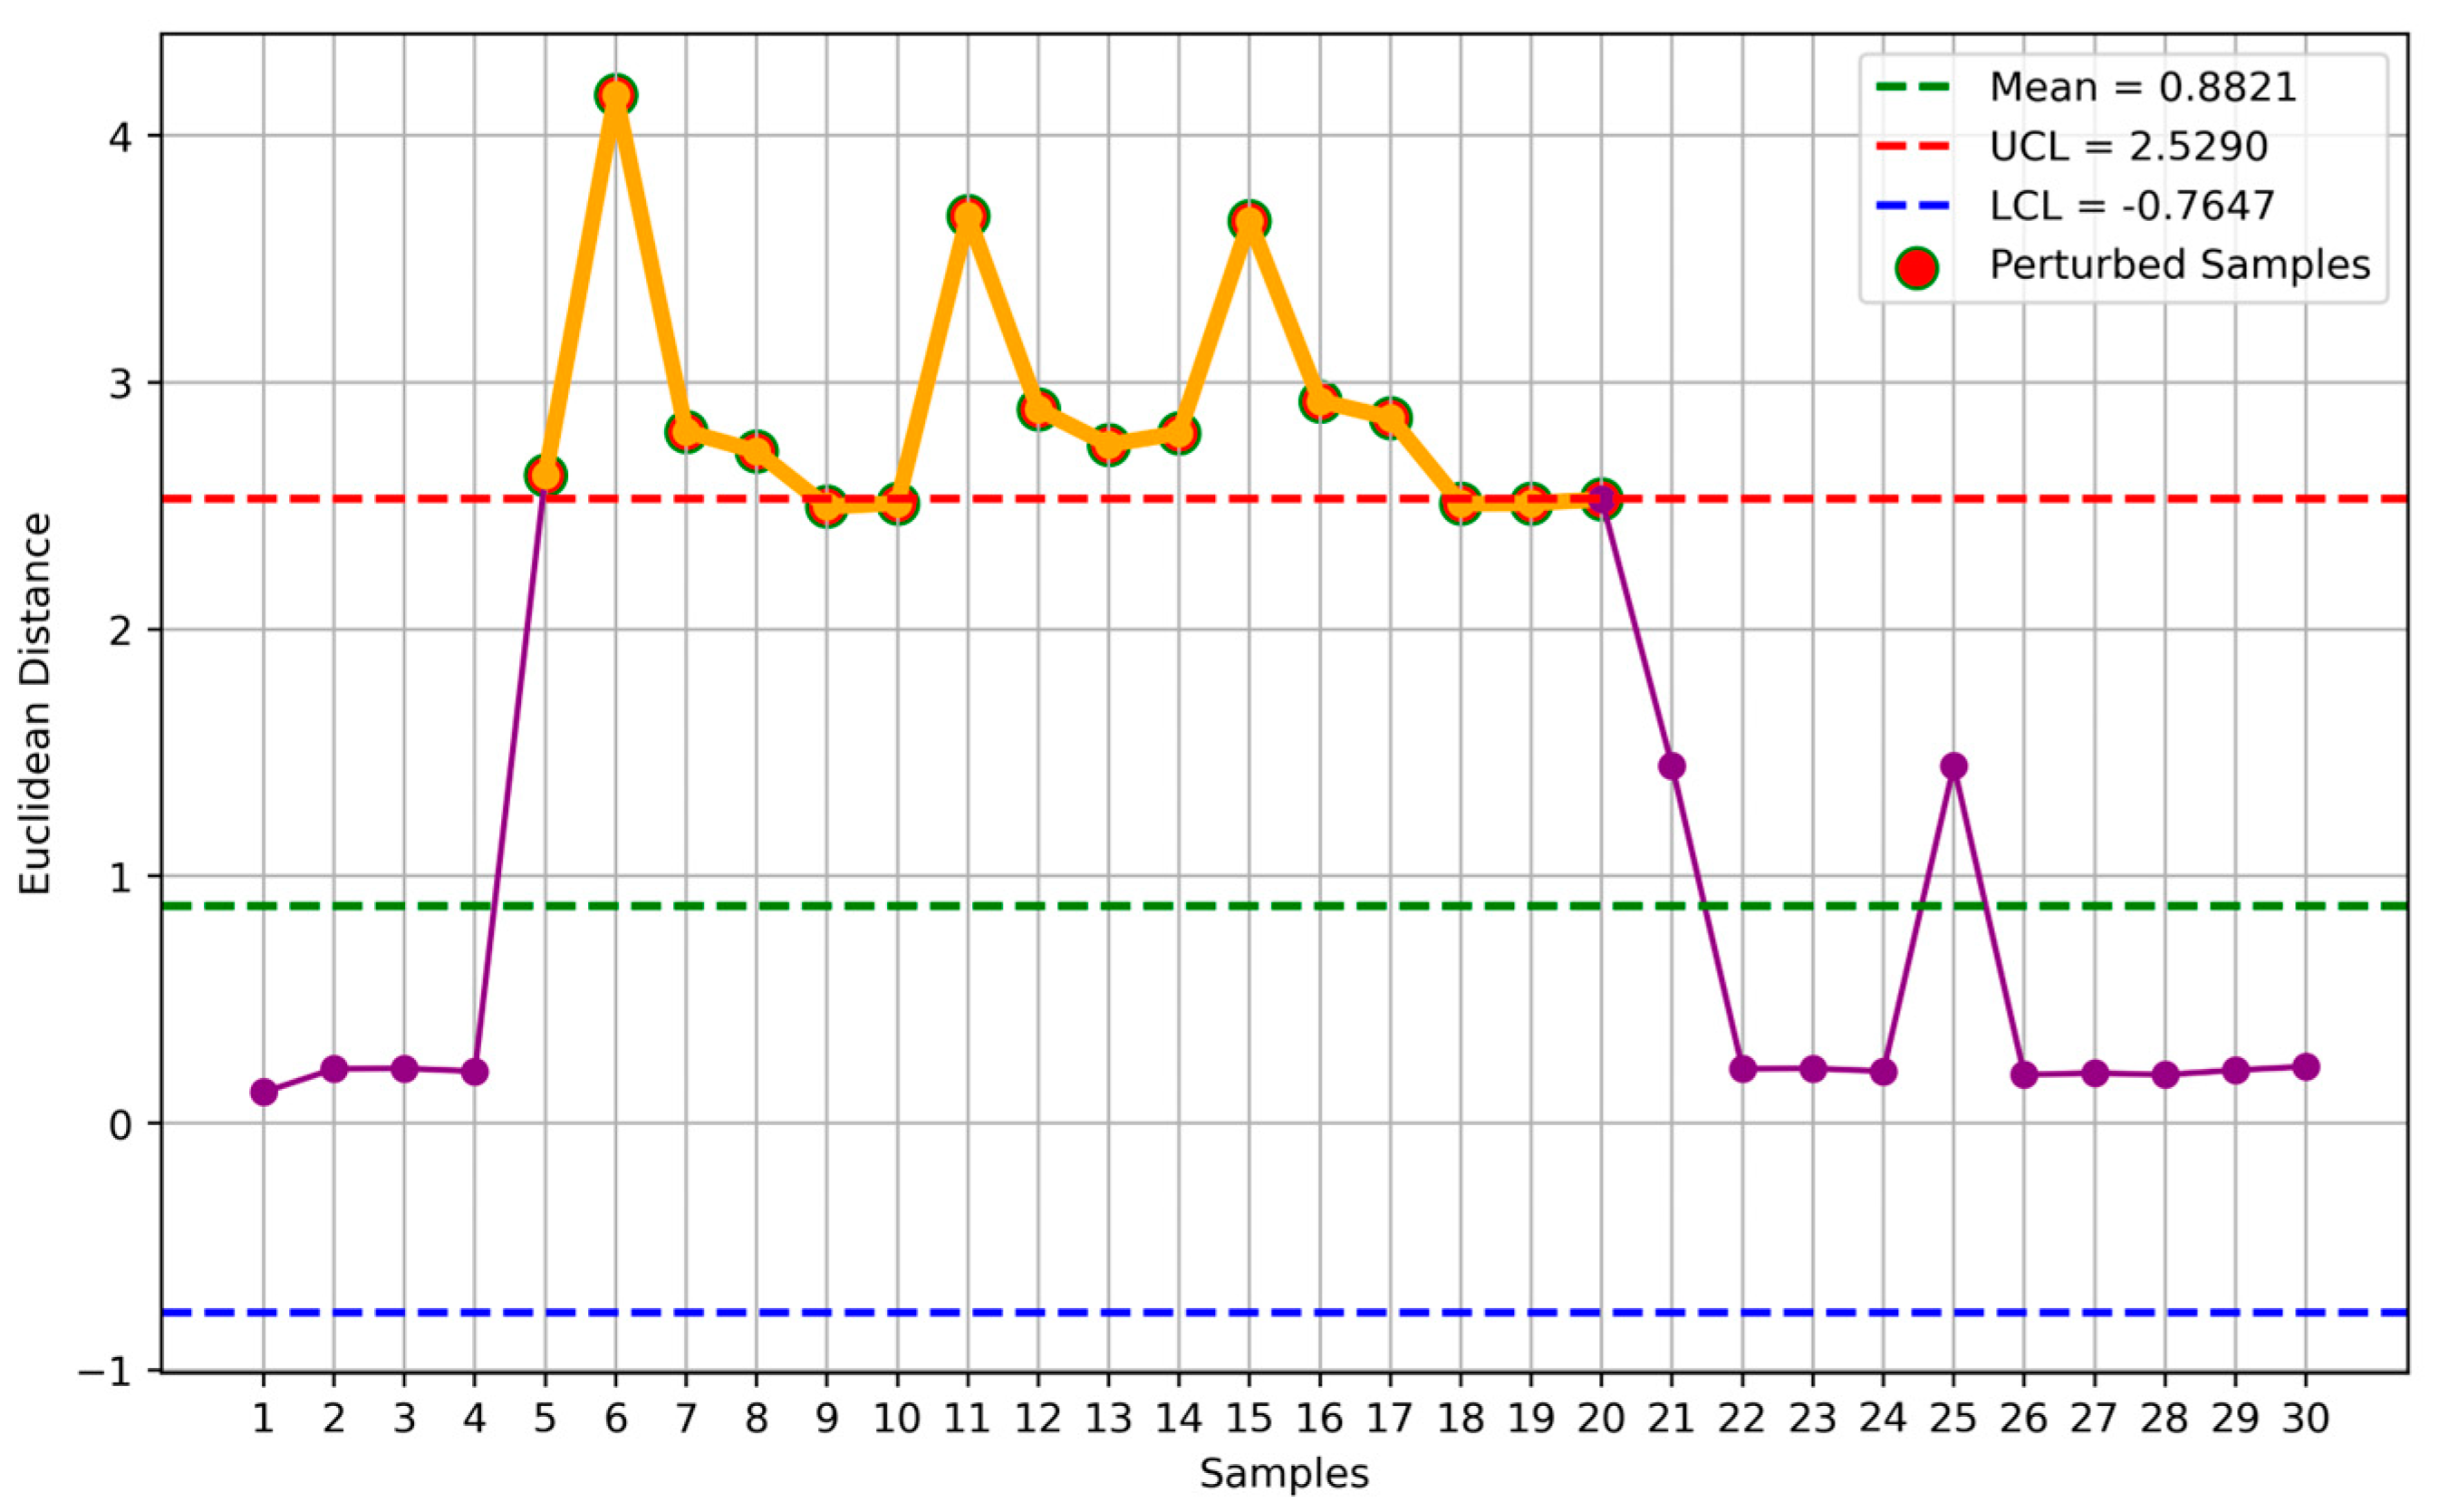
Once normal behavior has been identified, the next step is to manipulate the sensor to confirm its capability to detect issues. Figure 8 illustrates the comparison between normal and abnormal data. The abnormality was induced by introducing a perturbation signal provided by a variable resistance to the sensor and repositioning it to simulate various potential errors.
4. Discussion and Conclusions
In this paper, we have demonstrated that it is highly effective to continuously monitor the behavior of a soil moisture sensor by employing advanced techniques such as Discrete Wavelet Transform (DWT) together with Euclidean distances. These methods enable us to detect subtle changes in sensor performance, ensuring that any deviations from optimal functionality are identified and addressed. By maintaining the sensor’s accuracy and reliability, we can provide a precise and responsive system that consistently meets the moisture needs of plants. In summary, this work highlights the potential of integrating advanced sensor technologies to achieve significant improvements in anomaly detection.
The next stage of research involves considering multiple factors in the sensing process. This means using more sensors and monitoring a more comprehensive range of devices. Apart from soil moisture, we also need to consider light, nutrients, and temperature, as they considerably affect the development of living organisms. Therefore, sensors for these variables should be treated with the same level of importance. A potential area for future research is the use of more advanced forms of both discrete and continuous wavelet transform, which could provide more precise information about how the sensors function.
Supplementary Materials
The following supporting information can be downloaded at the website of this paper posted on Preprints.org.
Author Contributions
Conceptualization, Jesus Pacheco and Victor H. Benitez; Data curation, Guillermo Pérez; Formal analysis, Jesus Pacheco and Guillermo Pérez; Funding acquisition, Agustín Brau; Investigation, Jesus Pacheco and Guillermo Pérez; Methodology, Jesus Pacheco; Project administration, Jesus Pacheco; Resources, Jesus Pacheco, Victor H. Benitez and Agustín Brau; Software, Guillermo Pérez; Supervision, Jesus Pacheco; Validation, Jesus Pacheco and Guillermo Pérez; Visualization, Guillermo Pérez; Writing – original draft, Jesus Pacheco and Victor H. Benitez; Writing – review & editing, Jesus Pacheco, Victor H. Benitez and Agustín Brau.
Funding
This research received no external funding.
Data Availability Statement
The original contributions presented in the study are included in the article. Further inquiries can be directed to the corresponding author.
Acknowledgments
This work was supported by the department of Industrial Engineering at Universidad de Sonora.
Conflicts of Interest
The authors declare no conflicts of interest.
Published material
This article is a revised and expanded version of a paper entitled Anomaly Behavior Analysis for Sensors Fault Detection, which was presented at the 2023 IEEE Symposium Series on Computational Intelligence name, SSCI 2023 in Mexico City.
References
- Li, D.; Wang, Y.; Wang, J.; Wang, C.; Duan, Y. Recent Advances in Sensor Fault Diagnosis: A Review. Sens Actuators A Phys 2020, 309, 111990. [Google Scholar] [CrossRef]
- Fatima, N.; Riaz, S.; Ali, S.; Khan, R.; Ullah, M.; Kwak, D. Sensors Faults Classification and Faulty Signals Reconstruction Using Deep Learning. IEEE Access 2024, 12, 100544–100558. [Google Scholar] [CrossRef]
- Yang, J.W.; Lee, Y.D.; Koo, I.S. Convolutional Autoencoder-Based Sensor Fault Classification. International Conference on Ubiquitous and Future Networks, ICUFN 2018, 2018, 865–867. [Google Scholar] [CrossRef]
- Jiang, X.; Zhang, X.; Zhang, Y. Establishment and Optimization of Sensor Fault Identification Model Based on Classification and Regression Tree and Particle Swarm Optimization. Mater Res Express 2021, 8, 085703. [Google Scholar] [CrossRef]
- Jiang, C.Y.; Li, L.C.; Ye, C.L.; Yu, S.Y. Research on Sensor Fault Identification Based on Improved 1-v-r SVM Classification Method. International Journal of Advanced Media and Communication 2016, 6, 235–245. [Google Scholar] [CrossRef]
- Sun, Y.; Liu, S.; Yu, Y.; Zhao, T.; Zou, Z.; Zhang, J.; Zhang, S.; Zhang, H. Gas Sensor Fault Diagnosis for Imbalanced Data Based on Generative Adversarial Networks. J Phys Conf Ser 2021, 1732, 012033. [Google Scholar] [CrossRef]
- Huang, J.; Li, M.; Zhang, Y.; Mu, L.; Ao, Z.; Gong, H. Fault Detection and Classification for Sensor Faults of UAV by Deep Learning and Time-Frequency Analysis. Chinese Control Conference, CCC 2021, 2021, 4420–4424. [Google Scholar] [CrossRef]
- Mandal, S.; Santhi, B.; Sridhar, S.; Vinolia, K.; Swaminathan, P. A Novel Approach for Fault Detection and Classification of the Thermocouple Sensor in Nuclear Power Plant Using Singular Value Decomposition and Symbolic Dynamic Filter. Ann Nucl Energy 2017, 103, 440–453. [Google Scholar] [CrossRef]
- Troni, G.; Whitcomb, L.L. Field Sensor Bias Calibration with Angular-Rate Sensors: Theory and Experimental Evaluation with Application to Magnetometer Calibration. IEEE/ASME Transactions on Mechatronics 2020, 24, 1698–1710. [Google Scholar] [CrossRef]
- Jihani, N.; Kabbaj, M.N.; Benbrahim, M. Sensor Fault Detection and Isolation for Smart Irrigation Wireless Sensor Network Based on Parity Space. International Journal of Electrical and Computer Engineering (IJECE) 2023, 13, 1463–1471. [Google Scholar] [CrossRef]
- Han, X.; Jiang, J.; Xu, A.; Bari, A.; Pei, C.; Sun, Y. Sensor Drift Detection Based on Discrete Wavelet Transform and Grey Models. IEEE Access 2020, 8, 204389–204399. [Google Scholar] [CrossRef]
- Pereira, M.; Glisic, B. Detection and Quantification of Temperature Sensor Drift Using Probabilistic Neural Networks. Expert Syst Appl 2023, 213, 118884. [Google Scholar] [CrossRef]
- Rhif, M.; Abbes, A. Ben; Farah, I.R.; Martínez, B.; Sang, Y. Wavelet Transform Application for/in Non-Stationary Time-Series Analysis: A Review. Applied Sciences 2019, Vol. 9, Page 1345 2019, 9, 1345. [Google Scholar] [CrossRef]
- Guo, T.; Zhang, T.; Lim, E.; Lopez-Benitez, M.; Ma, F.; Yu, L. A Review of Wavelet Analysis and Its Applications: Challenges and Opportunities. IEEE Access 2022, 10, 58869–58903. [Google Scholar] [CrossRef]
- Verma, S.; Sahu, S.P.; Sahu, T.P. Discrete Wavelet Transform-Based Feature Engineering for Stock Market Prediction. International Journal of Information Technology (Singapore) 2023, 15, 1179–1188. [Google Scholar] [CrossRef]
- Daubechies, I. Orthonormal Bases of Compactly Supported Wavelets. Commun Pure Appl Math 1988, 41, 909–996. [Google Scholar] [CrossRef]
- Maseer, Z.K.; Yusof, R.; Bahaman, N.; Mostafa, S.A.; Foozy, C.F.M. Benchmarking of Machine Learning for Anomaly Based Intrusion Detection Systems in the CICIDS2017 Dataset. IEEE Access 2021, 9, 22351–22370. [Google Scholar] [CrossRef]
- Aldweesh, A.; Derhab, A.; Emam, A.Z. Deep Learning Approaches for Anomaly-Based Intrusion Detection Systems: A Survey, Taxonomy, and Open Issues. Knowl Based Syst 2020, 189, 105124. [Google Scholar] [CrossRef]
- Maseer, Z.K.; Yusof, R.; Al-Bander, B.; Saif, A.; Kadhim, Q.K. Meta-Analysis and Systematic Review for Anomaly Network Intrusion Detection Systems: Detection Methods, Dataset, Validation Methodology, and Challenges. 2023.
- Pacheco, J.; Benitez, V.H.; Felix-Herran, L.C.; Satam, P. Artificial Neural Networks-Based Intrusion Detection System for Internet of Things Fog Nodes. IEEE Access 2020, 8, 73907–73918. [Google Scholar] [CrossRef]
- Pacheco, J.; Hariri, S. Anomaly Behavior Analysis for IoT Sensors. Transactions on Emerging Telecommunications Technologies 2018, 29, e3188. [Google Scholar] [CrossRef]
- Idrissi, M.J.; Alami, H.; El Mahdaouy, A.; El Mekki, A.; Oualil, S.; Yartaoui, Z.; Berrada, I. Fed-ANIDS: Federated Learning for Anomaly-Based Network Intrusion Detection Systems. Expert Syst Appl 2023, 234, 121000. [Google Scholar] [CrossRef]
- Kwon, H.Y.; Kim, T.; Lee, M.K. Advanced Intrusion Detection Combining Signature-Based and Behavior-Based Detection Methods. Electronics 2022, 11, 867. [Google Scholar] [CrossRef]
- Bhavsar, M.; Roy, K.; Kelly, J.; Olusola, O. Anomaly-Based Intrusion Detection System for IoT Application. Discover Internet of Things 2023, 3, 1–23. [Google Scholar] [CrossRef]
- Thakkar, A.; Lohiya, R. A Review on Challenges and Future Research Directions for Machine Learning-Based Intrusion Detection System. Archives of Computational Methods in Engineering 2023, 30, 4245–4269. [Google Scholar] [CrossRef]
- Abdulganiyu, O.H.; Ait Tchakoucht, T.; Saheed, Y.K. A Systematic Literature Review for Network Intrusion Detection System (IDS). International Journal of Information Security 2023 22:5 2023, 22, 1125–1162. [Google Scholar] [CrossRef]
- Godina, R.; Matias, J.C.O. Quality Control in the Context of Industry 4.0. Springer Proceedings in Mathematics and Statistics 2019, 281, 177–187. [Google Scholar] [CrossRef]
- Montgomery, D.C. Introduction to Statistical Quality Control, 8th Edition | Wiley; 8th ed.; John Wiley & Sons, Inc, 2019; ISBN 978-1-119-39930-8.
- Godina, R.; Matias, J.C.O. Quality Control in the Context of Industry 4.0. Springer Proceedings in Mathematics and Statistics 2019, 281, 177–187. [Google Scholar] [CrossRef]
- Perez, G.; Pacheco, J.; Benitez, V. Anomaly Behavior Analysis for Sensors Fault Detection. 2023 IEEE Symposium Series on Computational Intelligence, SSCI 2023 2023, 1718–1723. [CrossRef]
Figure 1.
General diagram for the proposed methodology.
Figure 2.
Custom-made embedded system.
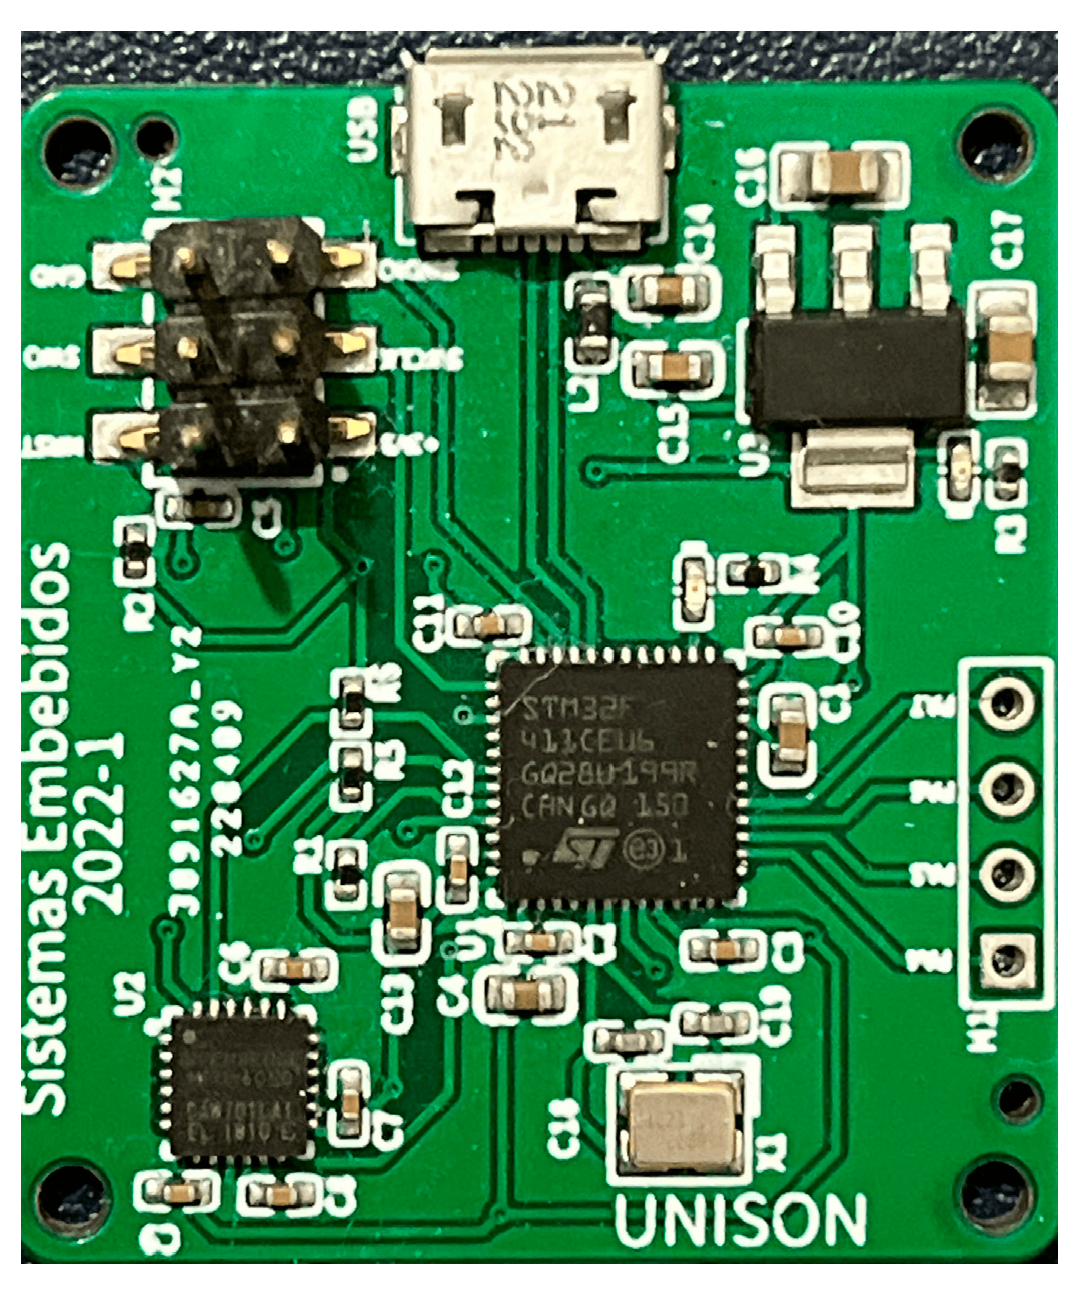
Figure 3.
The architecture applied for the measurement of soil moisture in a coriander plant.
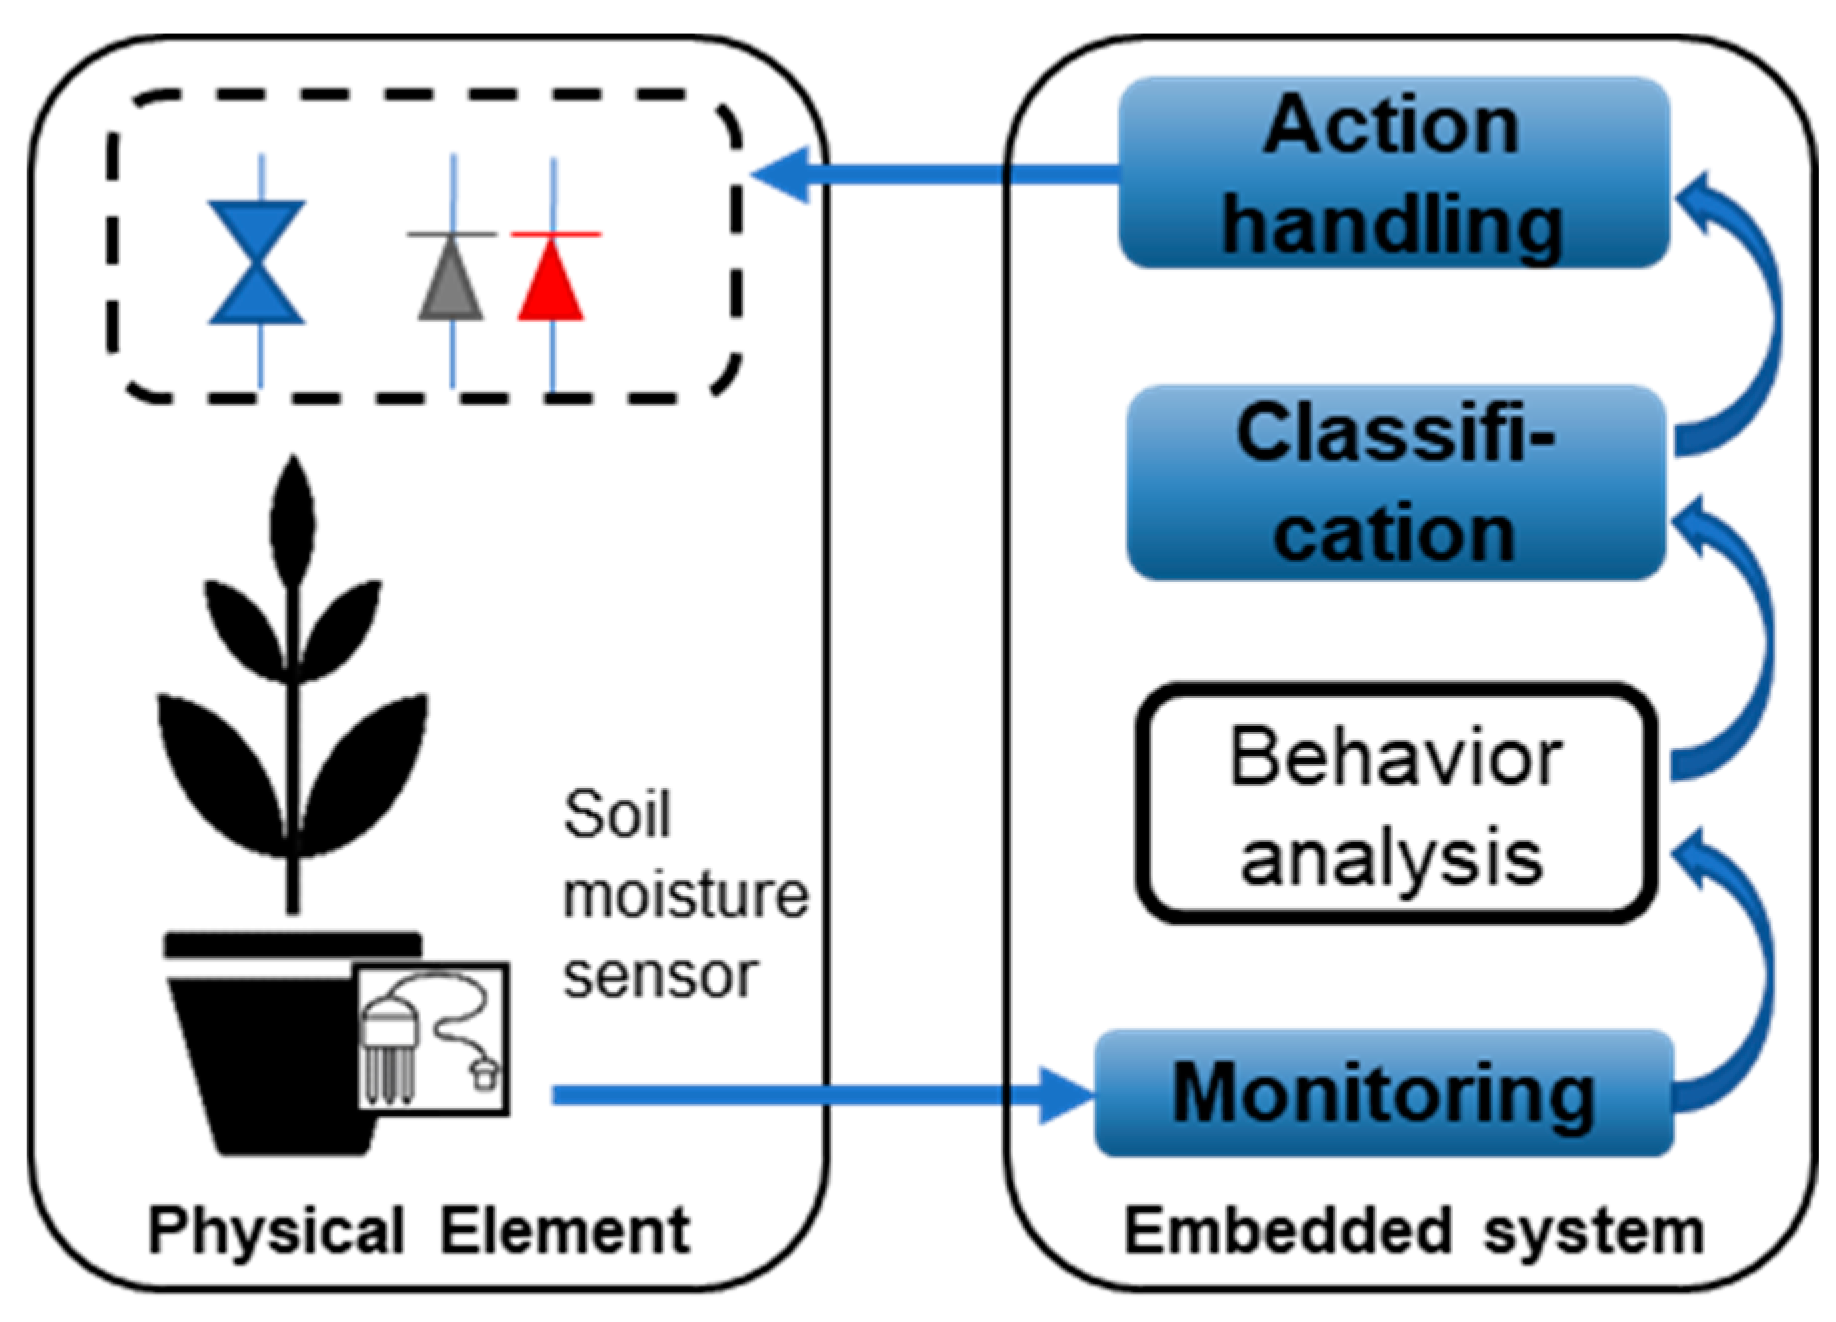
Figure 4.
System architecture.
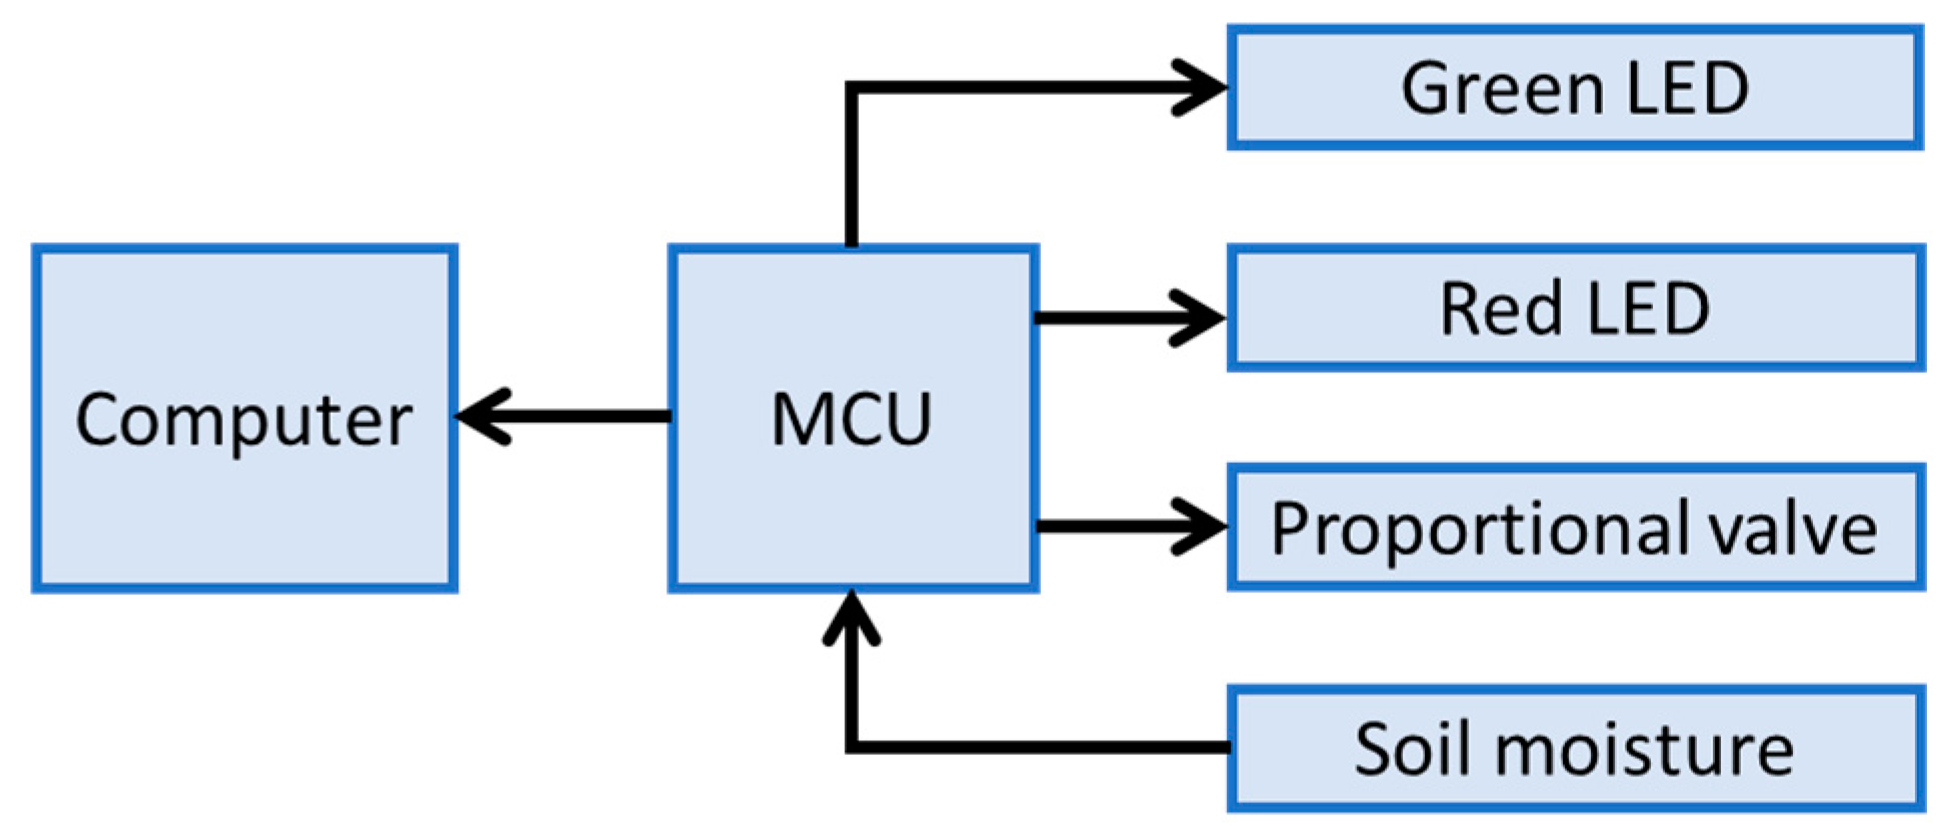
Figure 5.
Schematic diagram of the testbed.
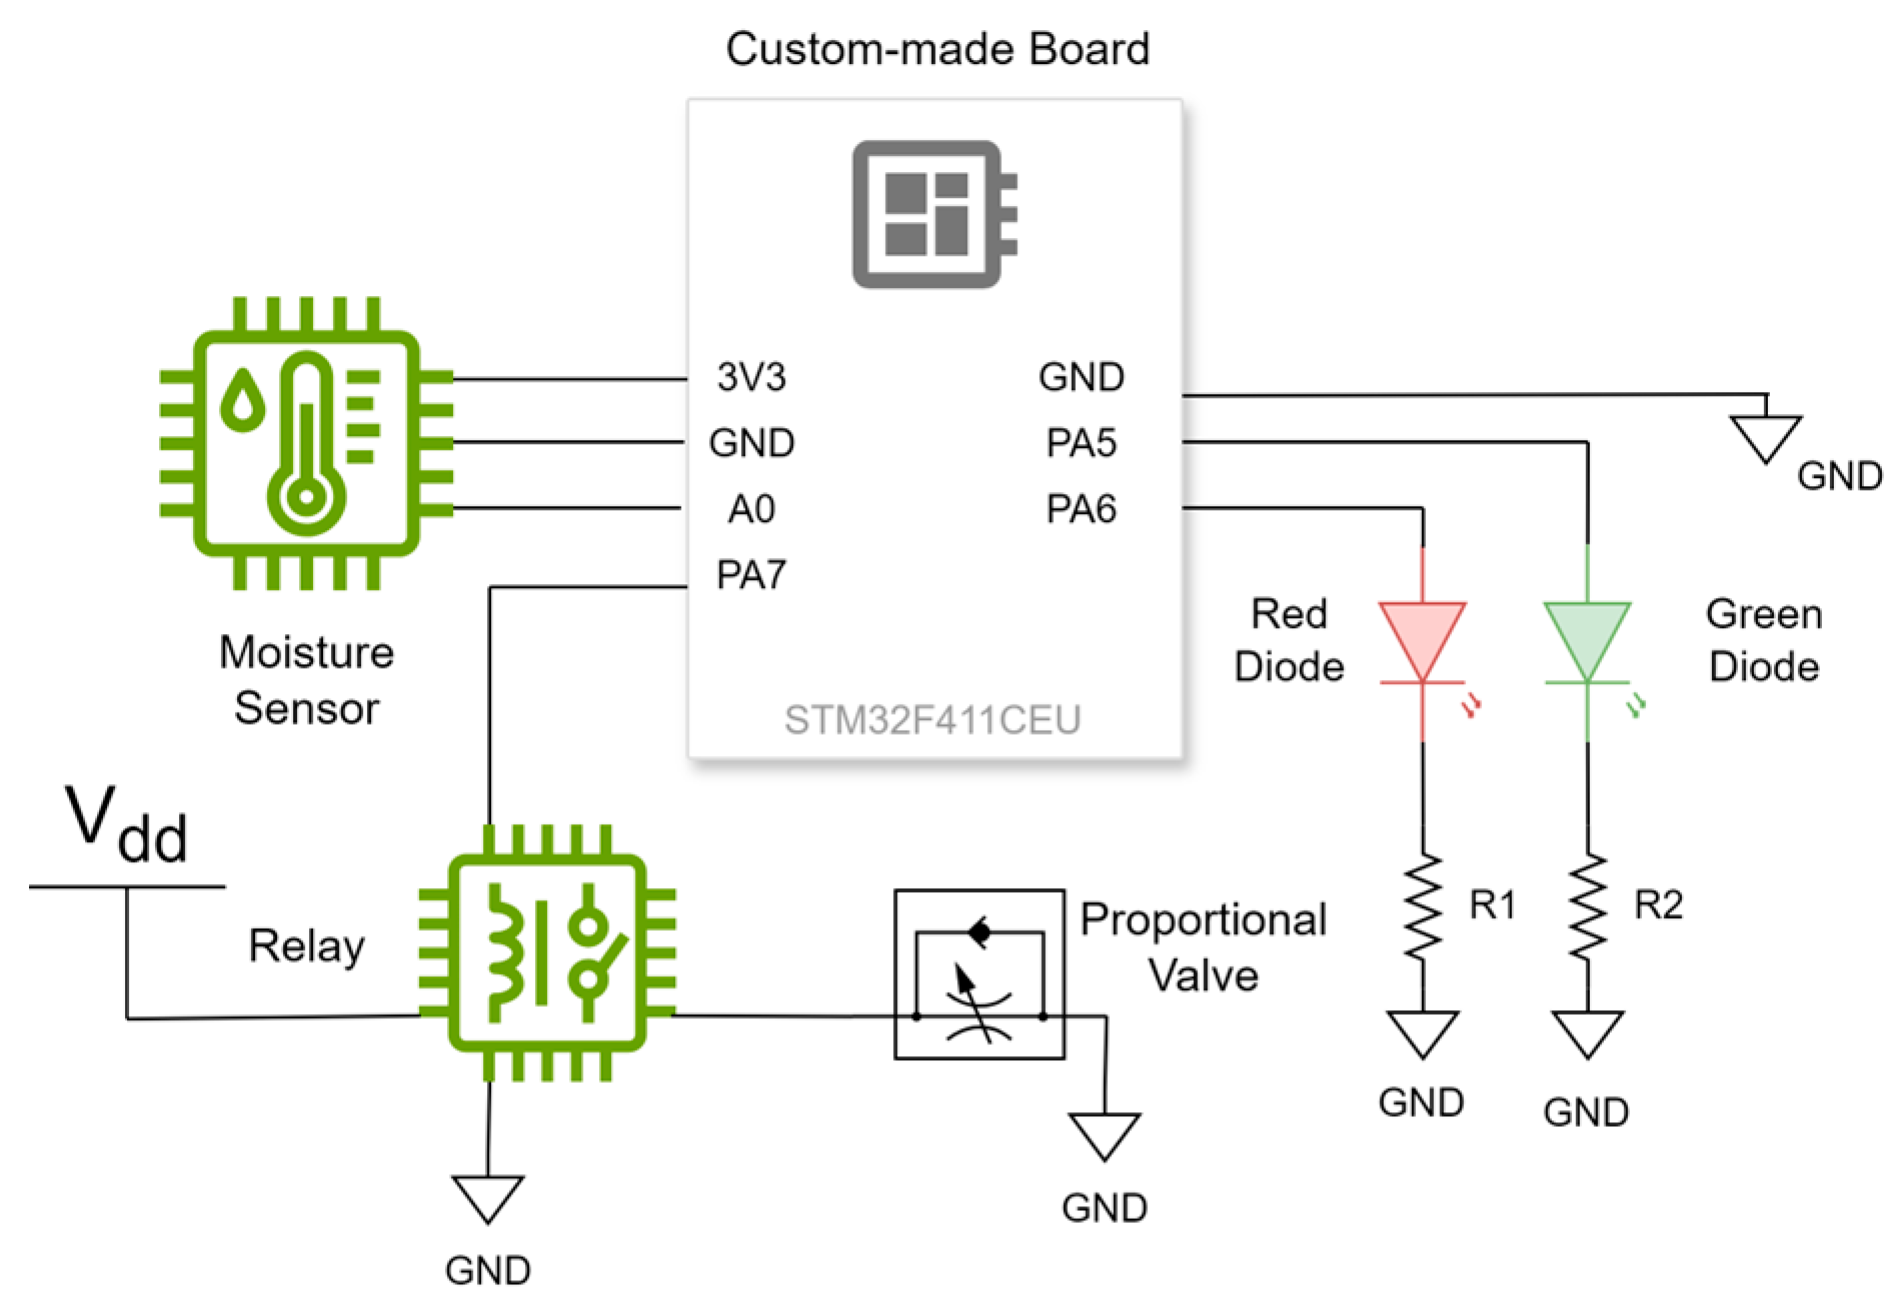
Figure 6.
Soil moisture percentages obtained from an array.
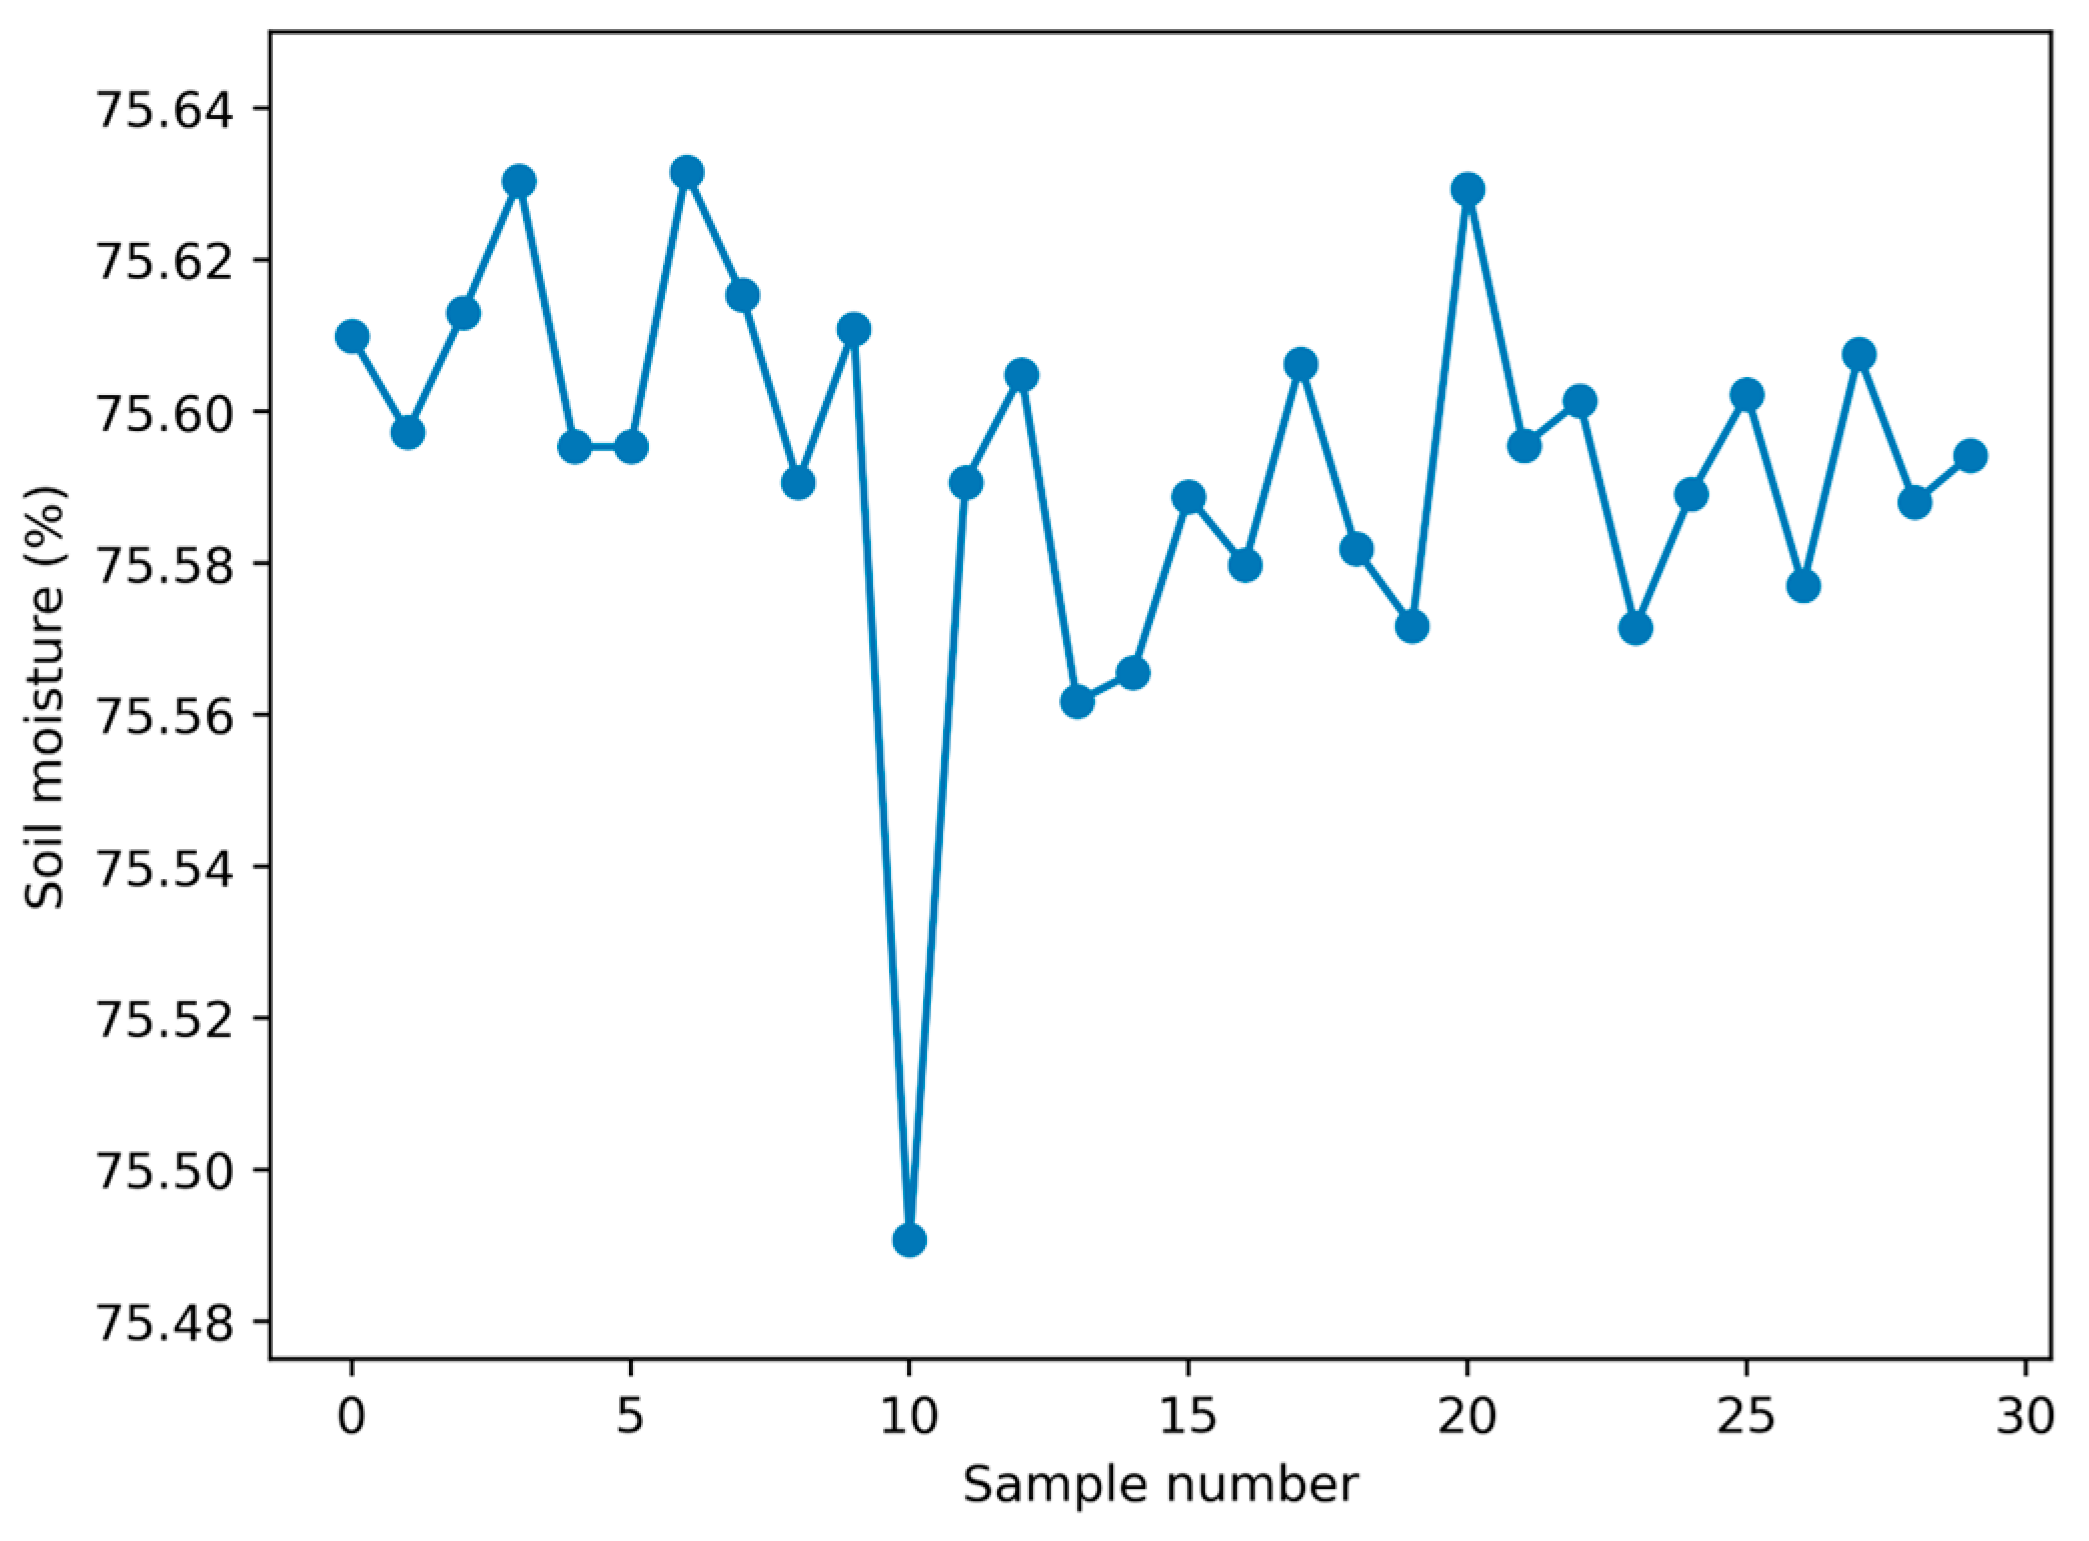
Figure 7.
Euclidean distances between the baseline wavelet and the online wavelets.
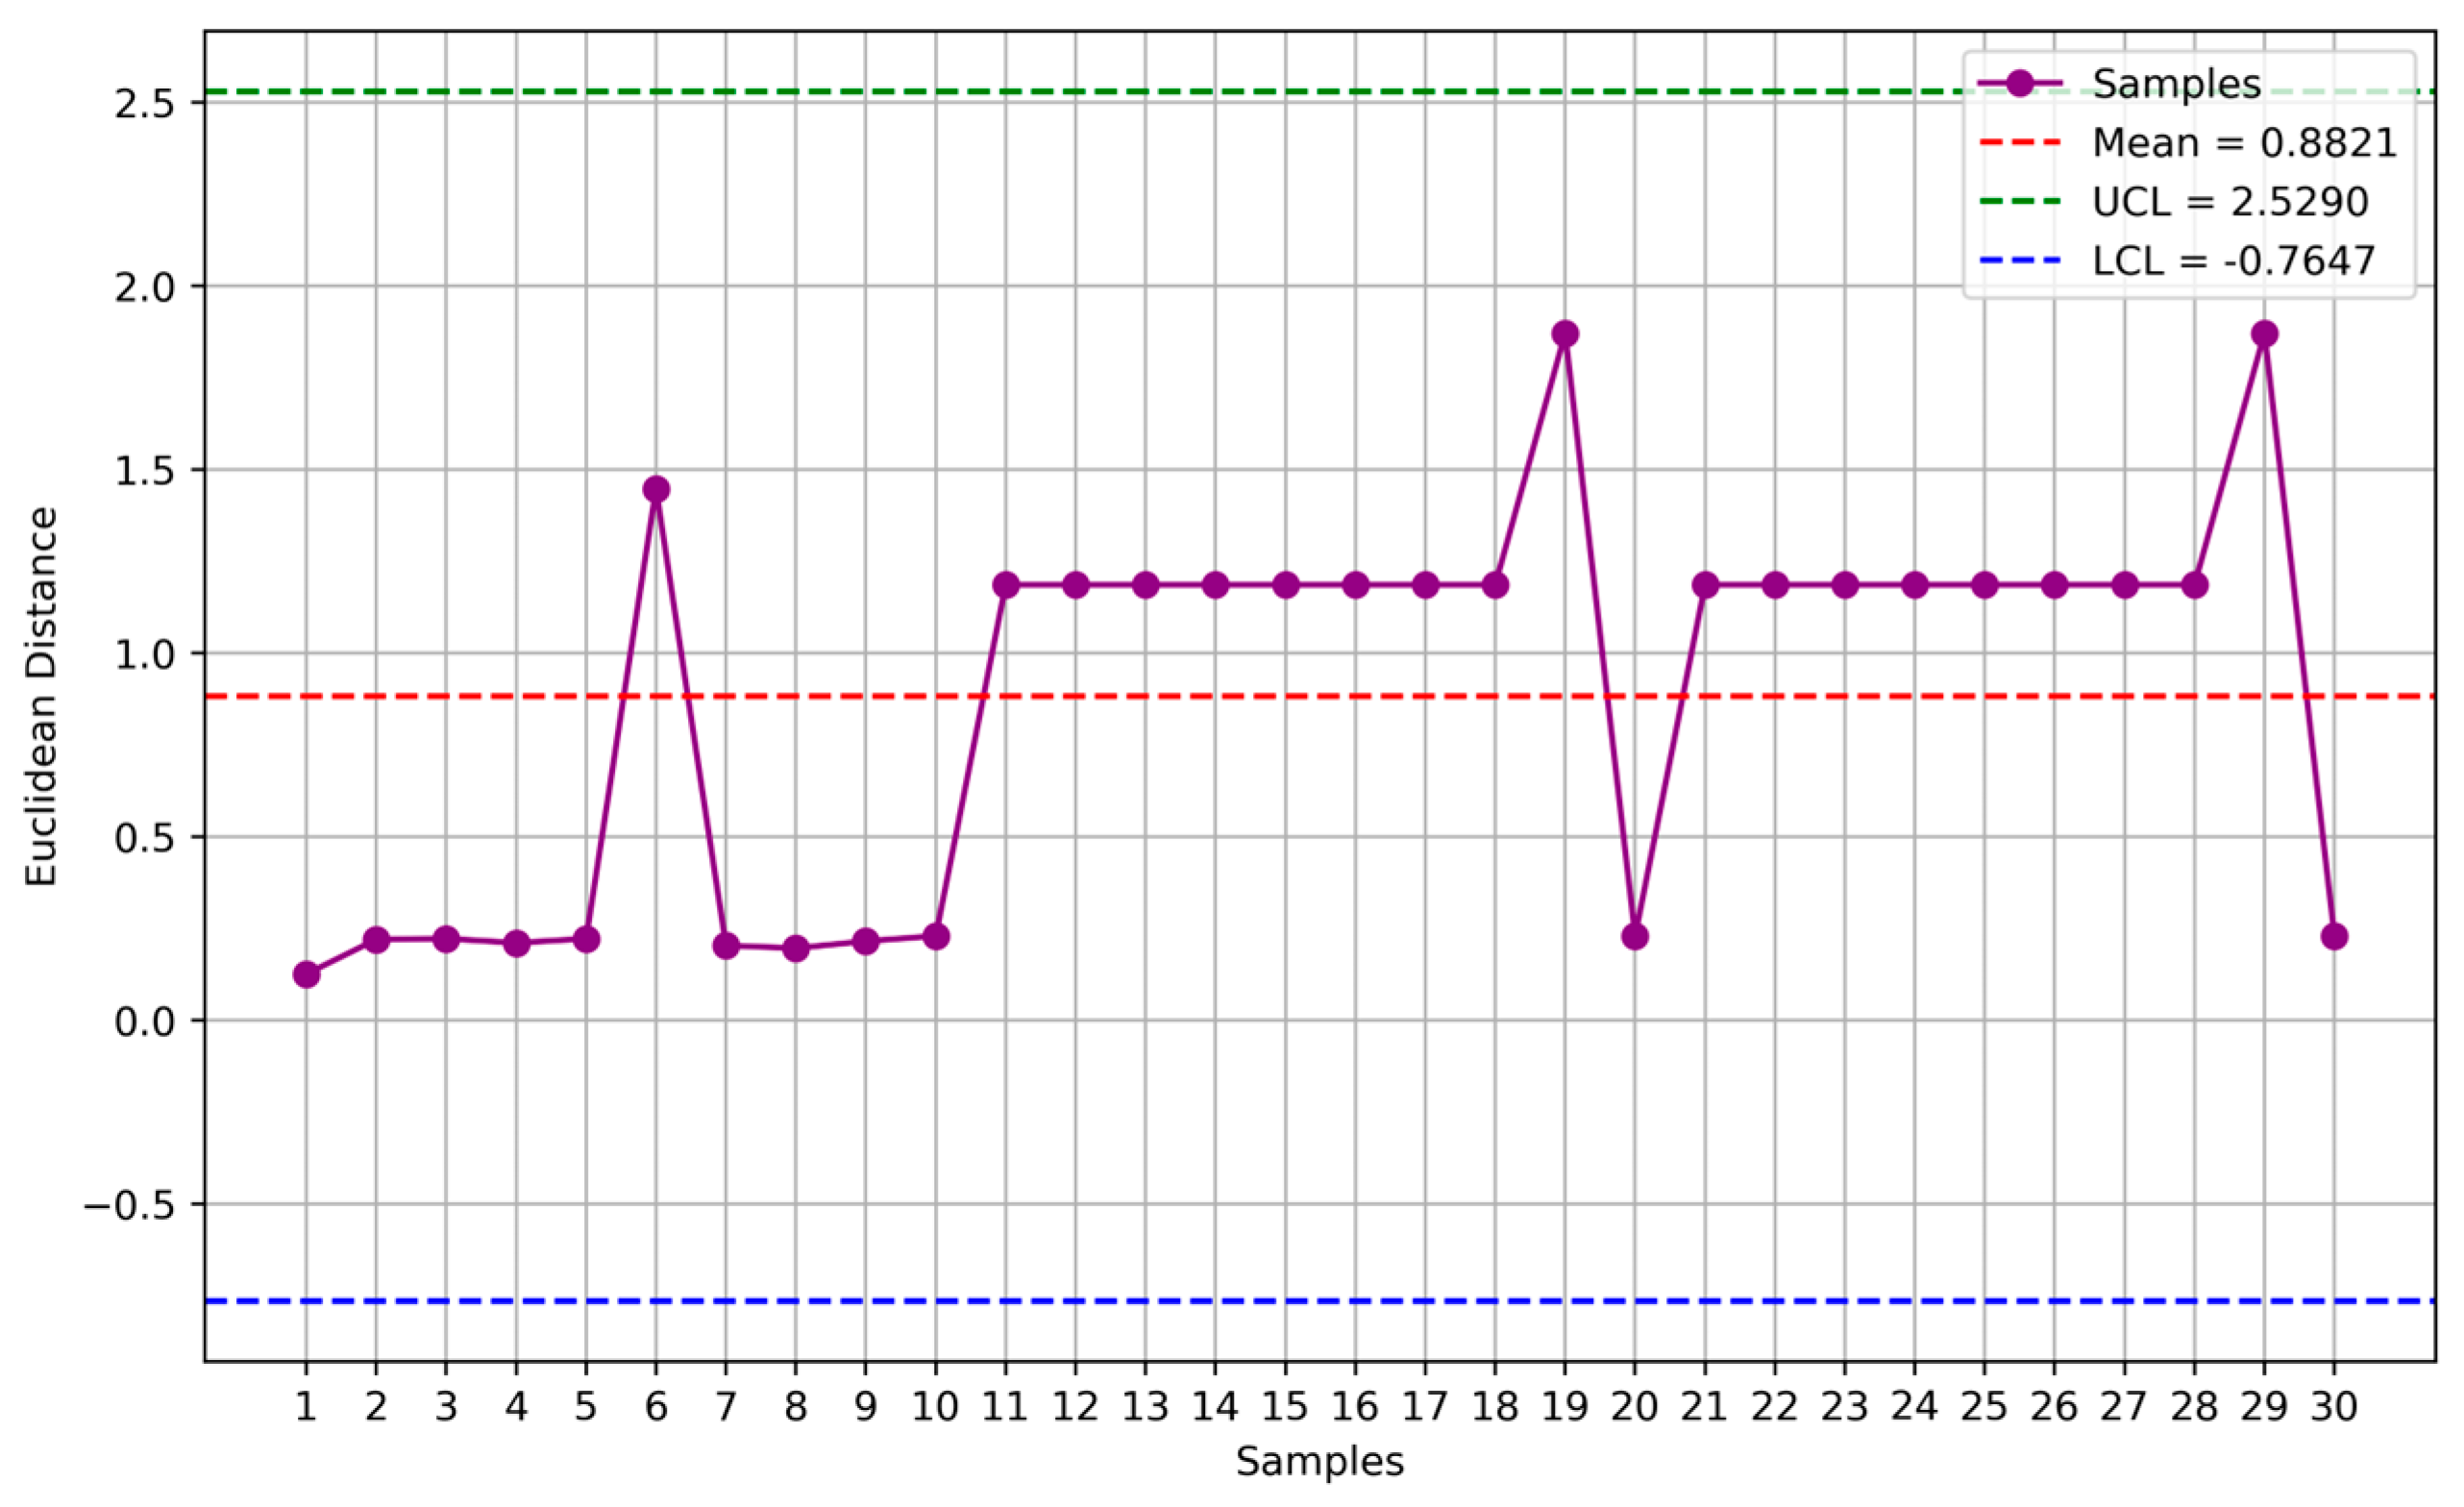
Figure 8.
Comparison between normal and abnormal behavior.
Disclaimer/Publisher’s Note: The statements, opinions and data contained in all publications are solely those of the individual author(s) and contributor(s) and not of MDPI and/or the editor(s). MDPI and/or the editor(s) disclaim responsibility for any injury to people or property resulting from any ideas, methods, instructions or products referred to in the content. |
© 2024 by the authors. Licensee MDPI, Basel, Switzerland. This article is an open access article distributed under the terms and conditions of the Creative Commons Attribution (CC BY) license (http://creativecommons.org/licenses/by/4.0/).
Copyright: This open access article is published under a Creative Commons CC BY 4.0 license, which permit the free download, distribution, and reuse, provided that the author and preprint are cited in any reuse.


