
Submitted:
22 August 2024
Posted:
23 August 2024
You are already at the latest version
Abstract
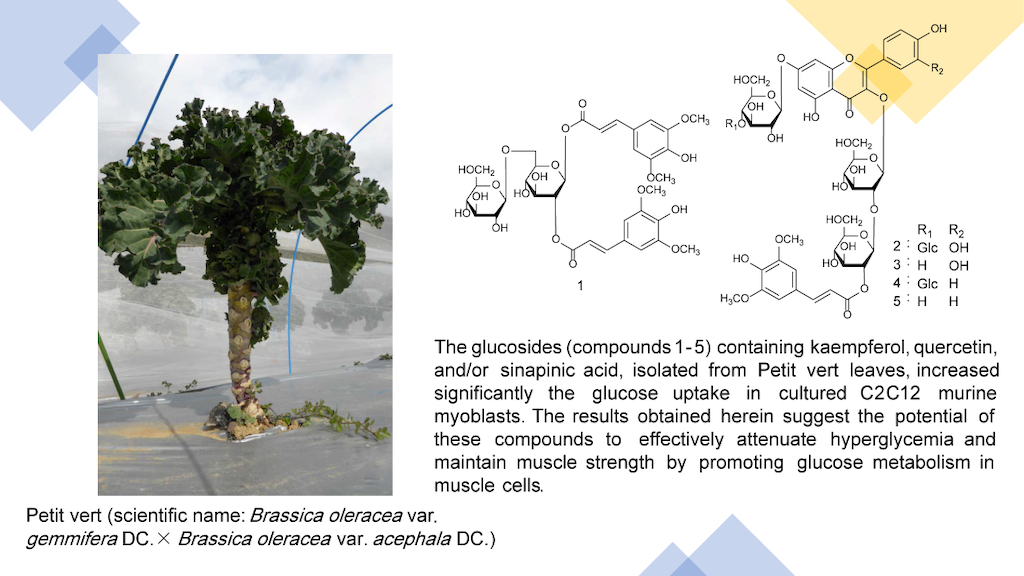
Petit vert (scientific name: Brassica oleracea var. gemmifera DC. × Brassica oleracea var. acephala DC.) is a new variety of vegetable created by crossbreeding kale and brussels sprouts (Brassica oleracea species). The present study aimed to identify biologically active compounds in extracts of the outer leaves of Petit vert by purification and to examine their biological activities. Dried and powdered outer leaves of Petit vert were extracted, fractionated, and purified to isolate active compounds. Nuclear magnetic resonance and mass spectrometries were performed to elucidate the structures of five compounds (1‒5). The compounds isolated from Petit vert leaves were glycosides that contained kaempferol, quercetin (flavonol), or sinapinic acid (phenylpropanoid). Glucose uptake in cultured C2C12 murine myoblasts in the absence of insulin was significantly increased by these compounds, kaempferol, sinapic acid, and ferulic acid, while that in the presence of insulin was also significantly increased by compounds 3 and 4, kaempferol, and sinapic acid. The present study reports for the first time the isolation of five compounds containing sinapic acid from the outer leaves of Petit vert and their stimulation of glucose uptake in cultured C2C12 murine myoblasts. The results obtained herein suggest the potential of these compounds to effectively attenuate hyperglycemia and maintain muscle strength by promoting glucose metabolism in muscle cells.
Keywords:
Petit vert leaves
; sinapic acid
; glucose uptake
1. Introduction
Polyphenols are phenolic compounds that are present in plants and play a role in defenses against harmful oxidative damage. Among polyphenol compounds, hydroxycinnamic acid and its derivatives are well-known chemical groups that have important biological functions, such as anti-inflammatory and antioxidant activities [1]. The beneficial effects of these compounds as preventive or therapeutic agents have already been demonstrated in various diseases, such as inflammatory damage and cancer [2,3]. Among hydroxycinnamic acids, sinapic acid [(2E)-3-(4-hydroxy-3,5-dimethoxyphenyl)prop-2-enoic acid], a natural herb phenolic acid compound, is present in herbs, such as oranges, grapefruits, cranberries, mustard seeds, and rapeseeds [4]. Sinapic acid was previously shown to prevent scopolamine-induced cognitive impairments in memory in a rat model [5,6]. It also exhibited anti-inflammatory activity in carbon tetrachloride-induced acute liver damage and significantly reduced proinflammatory cytokine levels [7,8]. Furthermore, sinapic acid attenuated and prevented oxidative stress, neuroinflammation, and cholinergic deficits [9].
Petit vert (scientific name: Brassica oleracea var. gemmifera DC. × Brassica oleracea var. acephala DC.) is a new variety of vegetable created by crossbreeding kale and brussels sprouts (Brassica oleracea species). Its anti-obesity effects were previously demonstrated in mice fed a high-fat diet containing 5% freeze-dried Petit vert [10]; however, the composition and identity of the active compounds present in Petit vert remain unclear. Since only the leafy side shoots of Petit vert are harvested, the outer leaves, which are of high nutritional value, are typically discarded because they contain rough fibers. Therefore, the present study aimed to identify biologically active compounds in extracts of the outer leaves of Petit vert by purification and to examine their biological activities. Dried and powdered outer leaves of Petit vert were extracted, fractionated, and purified to isolate active compounds. Nuclear magnetic resonance (NMR) and mass (MS) spectrometries were performed to elucidate the structures of five compounds. The compounds isolated from Petit vert leaves were glycosides containing either kaempferol, quercetin (flavonol), or sinapinic acid (phenylpropanoid).
2. Materials and Methods
2.1. Materials
Petit vert (B. oleracea var. gemmifera DC. × B. oleracea var. acephala DC.) was cultivated and harvested in a Brassica farm (Kawazu, Shizuoka Japan). Test compounds (1–5) were isolated from Petit vert. Quercetin (6), kaempferol (7), sinapic acid (8), ferulic acid (9), and caffeic acid (10) were purchased from Merck KGaA (Darmstadt, Germany). Penicillin-streptomycin solution, 0.25% trypsin/EDTA solution, cell count reagent SF (WST-8), and Dulbecco’s modified Eagle’s medium (DMEM) were purchased from Nacalai Tesque Inc. (Kyoto, Japan). Gelatin, type A and Gibco™ Insulin, human recombinant, zinc solution were purchased from MP Biomedicals (Irvine, CA, U.S.A.) and Thermo Fisher Scientific (Waltham, MA, U.S.A.), respectively. Fetal bovine serum (FBS) was obtained from Nichirei Biosciences Inc. (Tokyo, Japan). All other chemicals used were of the highest purity commercially available. All solvents were of high-performance liquid chromatography (HPLC) grade and water was of Milli-Q quality.
2.2. Extraction and Isolation
Petit vert leaves were lyophilized and ground to a powder in a domestic blender. Polyphenols were extracted from 400 g of dried Petit vert leaf powder with 6 L of methanol under reflux conditions for 2 h and then filtered. The filtrate was evaporated and the extract was suspended in 1.3 L of 90% aqueous methanol. The suspension was washed three times with 1.3 L of n-hexane, and the extract was evaporated and suspended in 1.3 L of distilled water. The extract was washed three times with 1.3 L of ethyl acetate. The extract was again evaporated and then dissolved in 1 L of distilled water. The extract was charged on a porous polymer gel (DIAION HP-20, Mitsubishi Chemical Co., Japan) column and eluted with 3 L of distilled water, 3 L of 50% aqueous methanol, and 3 L of methanol. Extracts were evaporated to obtain the phenolic extract (103.7, 8.4, and 2.4 g, respectively). The 50% aqueous methanol eluate (7.6 g) was charged on a TOYOPEARL HW-40 column (TOSOH, Japan) and then eluted with 10% aqueous ethanol and 50% aqueous ethanol to obtain eight fractions (fractions A–H). Fraction C (705 mg) was purified by preparative HPLC (Inertsil ODS-3, i.d., 30 × 250 mm, GL Sciences Inc., Japan), and compounds 2–5 (2; 41.6 mg, 3; 34.8 mg, 4; 90.5 mg, 5; 53.8 mg), which were of sufficient purity and quantity for complete chemical characterization, were isolated. The MeOH eluate (2.4 g) was charged on a TOYOPEARL HW-40 column (TOSOH, Japan) and then eluted with 50% aqueous ethanol and 85% aqueous ethanol to obtain six fractions (fractions A–F). Fraction B (785 mg) was purified by preparative HPLC (Inertsil ODS-3, i.d., 30 × 250 mm, GL Sciences Inc., Japan) and compound 1 (33.4 mg) was isolated.
2.3. Identification of Phenolic Compounds by HPLC
To isolate flavonoids and hydroxycinnamic acid derivatives, HPLC consisting of a degasser, quaternary pump, thermostat, a UV detector set at 330 nm, and an injection valve was used. Extracts were analyzed on a Cosmosil 2.5 Cholester column (100 × 3 mm, 2.5 µm; Nacalai Tesque, Inc.) at a temperature of 40°C using a gradient of (A) 0.1% trifluoroacetic acid in water and (B) acetonitrile. The following gradient with a flow rate of 0.75 mL/min was used: 6–11% B (0–20 min), 11–27% B (20–36 min), and 27% B isocratic (36–45 min).
2.4. Structural Elucidation of Phenolic Compounds by NMR and MS
The structures of compounds 1–5 were identified by NMR spectroscopy. 1H and 13C NMR spectra were analyzed on a JEOL lambda-500 spectrometer (JEOL, Tokyo, Japan) (500 MHz for 1H and 125 MHz for 13C) or a Bruker Avance 700 spectrometer (Bruker, Massachusetts, U.S.A.) (700 MHz for 1H and 175 MHz for 13C) in CD3OD or DMSO-d6. High resolution (HR)-electrospray ionization (ESI)-MS data on compounds 2‒5 were obtained using a Waters/Micromass Q-TOF micro MS (Waters, Massachusetts, U.S.A.) in the negative ion mode.
2.5. Cell Culture
C2C12 mouse myoblast cells were purchased from the American Type Culture Collection (Manassas, Virginia, U.S.A.). Cells were cultured in DMEM with 25 mM glucose, 10% FBS, and 1% antibiotic solution containing penicillin and streptomycin at 37°C in a humidified atmosphere of 5% CO2‒95% air. Cells were plated in a 96-well microplate (100 µl well-1) at a density of 4×10⁴ cells well-1. Confluent myoblasts were differentiated to myotubes by lowering serum concentrations to 0.1% and adding 5 µg/ml insulin. Myotubes formed after 4 days of incubation and were used in subsequent experiments.
2.6. Cell Viability Assay
Cell viability assays were performed using cell count reagent SF (WST-8). WST-8 reagent solution (10 µl) was added to each well of a 96-well microplate containing 100 µl of a cell suspension in culture medium and the test compounds (1–10) at various concentrations (1, 10, and 100 µM). Plates were incubated at 37°C for 24 h. Control wells (0.1% DMSO) containing the same volume of complete culture medium were included in each assay. After being cultured for 24 h, absorbance was measured at 450 nm using a microplate reader (Varioskan Flash, Thermo Fisher Scientific Waltham, MA, U.S.A.). Measurements were performed with triplicate dishes of three different experiments.
2.7. Assay of Glucose Uptake in C2C12 Mouse Myoblast Cells
The glucose uptake rate was measured using the Glucose Uptake-GloTM Assay kit (Promega Corporation, Madison, Wisconsin, U.S.A) according to the manufacturer’s instructions. This assay measures glucose uptake in cells based on the detection of 2-deoxyglucose-6-phosphate. Test compounds (1‒10) were added at various concentrations (1, 10, and 100 µM) to each well of a 96-well microplate containing cells in culture medium, and the plate was incubated at 37°C for 24 h. Control wells (0.1% DMSO) containing the same volume of complete culture medium were included in each assay. Before the assay on glucose uptake, cells were placed in serum-free medium for 18 h. C2C12 mouse myoblast cells were then cultured in DMEM with 25 mM glucose and 10% FBS in the presence or absence of insulin and the test substances (1, 10, and 100 μM) for 1 h. Fluorescence intensity was measured using a fluorescence spectrofluorometer (Varioskan Flash, Thermo Fisher Scientific Waltham, MA, U.S.A.) and used to calculate glucose into cells.
2.8. Statistical Analysis
Data were statistically analyzed using the Student’s t-test after an analysis of variance. Results are shown as the mean ± S.E. unless otherwise stated.
3. Results
3.1. Structural Elucidation of Phenolic Compounds by NMR
13C and 1H NMR spectroscopic data on compound 1 showed two characteristic anomeric proton and carbon signals for β-D-glucopyranosyl groups at δC 91.9, 103.1, δH 5.77 (1H, d, J=8.0 Hz), 4.20 (1H, d, J=8.0 Hz) and two trans-sinapoyl groups at δC 164.9, 148.0×2, 145.8, 138.4, 124.3, 113.5, 106.3×2, 56.1×2, δH 7.55 (1H, d, J=16.0 Hz), 6.99 (1H, s) ×2, 6.49 (1H, d, J=16.0 Hz), 3.77 (3H, s) ×2 and δC 165.6, 148.0×2, 147.3, 138.9, 124.0, 114.6, 106.6×2, 56.1×2, δH 7.53 (1H, d, J=16.0 Hz), 6.96 (1H, s) ×2, 6.44 (1H, d, J=16.0 Hz), 3.78 (3H, s) ×2. Therefore, compound 1 consisted of two β-D-glucopyranosyl and two trans-sinapoyl groups. Consistent with NMR spectroscopic data on compound 1 in the literature, compound 1 was assigned as 6-O-β-D-glucopyranosyl-β-D-{[1-O-3,5-dimethoxy-4-hydroxy-(E)-cinnamoyl],2-O-[3,5-dimethoxy-4-hydroxy-(E)-cinnamoyl]}-glucopyranoside [11].
The molecular formula for compound 2, C50H60O31, was established based on HR-ESI-MS [m/z: 1155.3058 [M-H]-]. The aglycone of compound 2 was identified as quercetin based on observations of 15 carbon signals, including twelve aromatic carbon signals (δC 164.1, 162.2, 157.3, 149.8, 145.9, 123.3×2, 117.2, 116.1, 107.5, 100.6, and 95.4), two olefin carbons (δC 157.5 and 135.0), and one carbonyl carbon (δC 179.1), and AM-type aromatic protons [δH 6.37 (1H, d, J=2.0 Hz) and 6.34 (1H, d, J=2.0 Hz)] derived from the A-ring and AMX-type aromatic proton signals [δH 7.50 (1H, d, J=2.0 Hz), 7.45 (1H, dd, J=8.5, 2.0 Hz), and 6.88 (1H, d, J=8.5 Hz)] derived from the B-ring, in 13C and 1H NMR spectroscopic data. Moreover, in the 13C and 1H NMR spectra of compound 2, four anomeric carbon and proton signals of β-D-glucopyranoses were observed at δC 96.9, 98.4, 101.2, 104.5 and δH 6.18 (1H, d, J=8.0 Hz), 5.24 (1H, d, J=8.0 Hz), 5.13 (1H, d, J=8.0 Hz), 4.48 (1H, d, J=8.0 Hz) together with signals due to one trans-sinapoyl group [δC 168.6, 148.7×2, 146.6, 138.7, 125.9, 115.9, 105.5×2, 56.2×2 and δH 7.30 (1H, d, J=16.0 Hz), 6.23 (1H, s)×2, 6.09 (1H, d, J=16.0 Hz), 3.59 (3H, s)×2]. 13C and 1H NMR signals were assigned (Table 1 and Table 2) based on the results of two-dimensional (2D)-NMR [1H-1H COSY, 1H-detected heteronuclear single-quantum correlation spectroscopy, and 1H-detected hetero-nuclear multiple-bond connectivity (HMBC)] measurements. In addition, the HMBC experiment provided information on sugar and ester linkages. 3JCOCHs were observed between C-3 of the aglycone (δC 135.0) and H-1 of β-D-glucopyranose (δH 6.18), C-2 of β-D-glucopyranose (δc 82.0) and H-1′ of β-D-glucopyranose (δH 5.24), C-7 of the aglycone (δC 164.1) and H-1″ of β-D-glucopyranose (δH 5.13), and C-4″ of β-D-glucopyranose (δc 80.1) and H-1‴ of β-D-glucopyranose (δH 4.48). Moreover, the acylation shift of the H-2′ signal of β-D-glucopyranose (δH 4.93) suggested that the sinapoyl group was attached at C-2′ of β-D-glucopyranose, which was supported by the results of the HMBC experiment. Therefore, compound 2 was identified as quercetin 3-O-β-D-[2-O-3,5-dimethoxy-4-hydroxy-(E)-cinnamoyl]glycopyranosyl-(1→2)-β-D-glycopyranoside-7-O-β-D-glucopyranosyl-(1→4)-β-D-glycopyranoside [12].
Based on HR-ESI-MS, compound 3 had the molecular formula C44H50O26, which was smaller by one glucosyl unit than that of compound 2 [m/z: 993.2518 [M-H]-]. 13C- and 1H-NMR spectroscopic data on the aglycone and 3-O-side chain were consistent with those of compound 2. However, since the signals of only one β-D-glucopyranosyl group were observed in the 7-O-side chain, this chain consisted of one β-D-glucopyranose. Therefore, compound 3 was identified as quercetin 3-O-β-D-[2-O-3,5-dimethoxy-4-hydroxy-(E)-cinnamoyl]glycopyranosyl-(1→2)-β-D-glycopyranoside-7-O-β-D-glucopyranoside [12,13].
Compounds 4 and 5 were assigned the molecular formulae C50H60O30 and C44H50O25, respectively, by HR-ESI-MS [compound 4: m/z: 1139.3077 [M-H]-, compound 5: m/z: 977.2565 [M-H]-]. The aglycones of compounds 4 and 5 were identified as kaempferol because AA′XX′-type aromatic proton signals derived from the B-ring were observed in each 1H NMR spectrum [δH 7.89 (1H, d, J=8.5 Hz)×2, 6.90 (1H, d, J=8.5 Hz)×2]. NMR spectroscopic data due to the sugar and ester moieties of compounds 4 and 5 were consistent with those of compounds 2 and 3, respectively. Therefore, the structures of compounds 4 and 5 were elucidated, as shown in Figure 1 [12,13,14,15]. In addition to the sinapoyl group containing the compounds reported herein, some flavonoid glycosides containing p-cumaroyl, caffeoyl, or feruloyl groups in their molecules were obtained. Since Petit vert is an improved variety of B. oleracea, similarities in its composition with that of B. oleracea were observed [12,14,15]. The HPLC analysis of Petit vert leaves and side shoots demonstrated that compounds 2–5 with flavonols were more abundant in the leaves than in the side shoots. On the other hand, compound 1, which contained only sinapic acid, was more abundant in the side shoots (Figure 2).
3.2. Effects on Glucose Uptake in Cultured C2C12 Murine Myoblasts
We examined the effects of the following 10 compounds on glucose uptake in cultured C2C12 murine myoblasts: the five compounds isolated from the outer leaves of Petit vert (compounds 1–5), quercetin, kaempferol (aglycone), and related acyl groups, including sinapic acid, ferulic acid, and caffeic acid. In a cytotoxicity assay, we measured the number of C2C12 cells after a 24-h incubation in differentiation medium supplemented with the test substances (final concentrations: 1, 10, and 100 μM). As shown in Table 3, a significant change was observed in the viable cell rate (% of the control) in the presence of compounds 1–5, quercetin, kaempferol, sinapic acid, ferulic acid, and caffeic acid at 1–100 µM, with a significant decrease (20–30%) being noted for 100 µM quercetin and kaempferol.
As described in the “Materials and Methods” section, cultured C2C12 cells were treated with differentiation medium containing the test compounds (1, 10, and 100 μM) in the presence or absence of insulin for 1 h, and glucose uptake levels in cells were measured. In comparison with the control, glucose uptake levels significantly increased in the absence of insulin when cells were cultured with compounds 1 (22.2–28.4%), 2 (30.9% at 1 μM), 3 (20.1–30.7%), 4 (27.4–45.5%), and 5 (14.9–16.8%) as well as with kaempferol (35.0–44.5%), sinapic acid (27.3–35.8%), and ferulic acid (16.2–20.5%) at 1, 10, and 100 μM (Table 4). A significant decrease was observed with compound 2, quercetin, and kaempferol at 100 μM. Caffeic acid did not significantly affect glucose uptake. Furthermore, glucose uptake in the presence of insulin was significantly increased by compounds 3 (1 μM) and 4 (100 μM), kaempferol (1, 10 μM), and sinapic acid (1–100 μM) (Table 5). A significant decrease in glucose uptake was noted with compounds 3 (100 μM), 4 (1 μM), and 5 (100 μM), quercetin (1–100 μM), and kaempferol (100 μM). Ferulic acid and caffeic acid did not significantly affect glucose uptake.
4. Discussion
In the present study, a Petit vert extract was prepared by extracting its dried and powdered outer leaves with MeOH. The extract was subsequently analyzed by HPLC. We identified several peaks that appeared to correspond to polyphenols with absorption at approximately UV 330 nm. The dried and powdered outer leaves of Petit vert were extracted, fractionated, and purified to isolate five compounds (compounds 1–5). NMR spectroscopy was performed for each of the components to elucidate their structures. Compounds 2‒5 isolated from Petit vert leaves were glycosides that contained either kaempferol or quercetin with a sinapoyl group. Compound 1 was previously isolated from broccoli florets [11], compounds 2, 3, and 5 from kale leaves [12], and compounds 4 and 5 from cabbage leaves [14,15]. Compounds 1–5 all contained sinapic acid, which is an acyl group. The HPLC analysis of Petit vert leaves and side shoots revealed that compounds 2–5 with flavonols were more abundant in the leaves than in the side shoots. On the other hand, compound 1, which contained only sinapic acid, was more abundant in the side shoots.
We investigated the effects of the following 10 compounds on glucose uptake in cultured C2C12 murine myoblasts: five compounds isolated from the outer leaves of Petit vert (compounds 1–5), quercetin, kaempferol, and related acyl groups, including sinapic acid, ferulic acid, and caffeic acid. Glucose uptake in cultured C2C12 murine myoblasts in the absence of insulin was significantly increased by compounds 1–5, kaempferol, sinapic acid, and ferulic acid (Table 4), while that in the presence of insulin was also significantly increased by compounds 3 and 4, kaempferol, and sinapic acid (Table 5). The significant decrease detected in glucose uptake at higher concentrations of quercetin and kaempferol may have been due to a reduction in the viable cell rate (Table 3). The five compounds isolated from the outer leaves of petit vert as well as quercetin, kaempferol, and sinapic acid increased glucose uptake in cultured C2C12 murine myoblasts. These results indicate that the biological activities of the outer leaves of Petit vert, such as increases in glucose uptake, were the summed effects of the phenolic compounds present.
Phenolic acids and their derivatives constitute one of the most common groups of phenolic compounds in plants. These molecules have emerged as high value added products because of their essential role in human nutrition and health [16,17]. Previous studies reported the effects of phenolic compounds, such as sinapic acid, related to those isolated from Petit vert leaves. For example, kaempferol was shown to exert anti-obesity effects because it increased insulin secretion in beta cells [18]. Sinapic acid has attracted increasing attention due to its numerous pharmacological effects [19]. It has been shown to exhibit antihyperglycemic [20], antioxidant [21], anti-inflammatory [22], anti-cancer [23], hepatoprotective [24], cardioprotective [25], renoprotective [26], neuroprotective [9], anti-diabetic [27], and anti-bacterial activities [28].
5. Conclusions
The present study reports for the first time the isolation of five compounds containing sinapic acid from the outer leaves of Petit vert and their stimulation of glucose uptake in cultured C2C12 murine myoblasts. The results obtained herein suggest the potential of these compounds to effectively attenuate hyperglycemia and maintain muscle strength by promoting glucose metabolism in muscle cells.
Authorship Contributions
Shizuo Yamada: Writing-original draft, Supervision, Investigation, Tsutomu Warashina: Investigation, Data curation, Formal analysis. Osamu Shirota: Investigation, Data curation, Formal analysis. Yoshihisa Kato: Writing draft, Formal analysis. Toshiyuki Fukuda, Investigation, Writing-review & editing, Supervision, Funding acquisition, Conceptualization.
Declaration of Interest
The authors declare no competing financial interest or personal relationships that could appeared to influence the work reported in this paper.
Data availability Statement
No data was used for the research described in the article.
References
- Ou, S.; Kwok, K.C. Ferulic acid: Pharmaceutical functions, preparation and applications in foods. J. Sci. Food Agric. 2004, 84, 1261–1269. [CrossRef]
- Fresco, P.; Borges, F.; Diniz, C.; Marques, M. New insights on the anticancer properties of dietary polyphenols. Med. Res. Rev. 2006, 26, 747–766. [CrossRef]
- Darvesh, A.S.; Carroll, R.T.; Bishayee, A.; Geldenhuys, W.J.; Van der Schyf, C.J. Oxidative stress and Alzheimer’s diseases: Dietary polyphenols as potential therapeutic agents. Expert Rev. Neurother. 2010, 10, 729–745. [CrossRef]
- Niciforovic, N.; Abramovic, H. Sinapic acid and its derivatives: Natural sources and bioactivity. Compr. Rev. Food Sci. Food Saf. 2014, 13, 34–51. [CrossRef]
- Karakida, F.; Ikeya, Y.; Tsunakawa, M.; Yamaguchi, T.; Ikarashi, Y.; Takeda, S.; Aburada, M. Cerebral protective and cognition-improving effects of sinapic acid in rodents. Biol. Pharm. Bull. 2007, 30, 514–519. [CrossRef]
- Lee, I-S.; Choi, G-Y.; Sreelatha, I.; Yoon, J-W.; Youn, S-H.; Maeng, S.; Park, J-H. Effect of sinapic acid on scopolamine-induced learning and memory impairment in SD rats. Brain Sci. 2023, 13, 427. [CrossRef]
- Lee, H.E.; Kim, D.H.; Park, S.J.; Kim, J.M.; Lee, Y.W.; Jung, J.M.; Lee, C.H.; Hong, J.G.; Liu, X.; Cai, M.; et al. Neuroprotective effect of sinapic acid in a mouse model of amyloid 1-42 protein-induced Alzheimer’s disease. Pharmacol. Biochem. Behav. 2012, 103, 260–266. [CrossRef]
- Verma, V.; Singh, D.; Kh, R. Sinapic acid alleviates oxidative stress and neuro- inflammatory changes in sporadic model of Alzheimer’s disease in rats. Brain Sci. 2020, 10, 923. [CrossRef]
- Zare, K.; Eidi, A.; Roghani, J.; Rohani, A.H. The neuroprotective potential of sinapic acid in the 6-hydroxydopamine-induced hemi-parkinsonian rat. Metab. Brain Dis. 2015, 30, 205–213. 10.1007/s11011-014-9604-6.
- Nishida, H.; Kuriyama, Y.; Kawakami, K.; Takei, Y.; Chiba, T.; Masuda, H.; Kazama, K.; Ohtsuka, A.; Sato, S.; Konishi, T. Anti-obesitic effect of petit vert on mice fed a high-fat diet. J. Jpn. Soc. Nutr. Food Sci. 2011, 64, 169–175. (in Japanese. [CrossRef]
- Price, K. R.; Casuscelli F.; Colquhoun, I. J.; Rhodes M. J. C. Hydroxycinnamic acid esters from broccoli florets. Phytochemistry, 1997, 45, 1683–1687. [CrossRef]
- Fiol M.; Adermann S.; Neugart S.; Rohn S.; Mügge C.; Schreiner M.; Krumberin A.; Kroh L. W. Highly glycosylated and acylated flavonols from kale (Brassica oleracea var. sabellica) - Structure-antioxidant activity relationship. Food Res. Int., 2012,47, 80–89. [CrossRef]
- Olsson, L. C.; Veit M.; Weissenböck G.; Bornman J. F. Differential flavonoid response to enhanced UV-B radiation in Brassica napus. Phytochemistry, 1998, 49, 1021–1028. [CrossRef]
- Nielsen J. K., Olesen C. E. L., Petersen M. K. Acylated flavonol glycosides from cabbage leaves. Phytochemistry, 1993, 34, 539–544. [CrossRef]
- Nielsen J. K.; Nørbæk R.; Olsen C. E. Kaempferol tetraglucosides from Cabbage leaves. Phytochemistry, 1998, 49, 2171–2176. [CrossRef]
- Ranilla, L.G.; Kwon, Y.-I.; Apostolidis, E.; Shetty, K. Phenolic compounds, antioxidant activity and in vitro inhibitory potential against key enzymes relevant for hyperglycemia and hypertension of commonly used medicinal plants, herbs and spices in Latin America. Bioresour. Technol. 2010, 101, 4676–4689. [CrossRef]
- Cory, H.; Passarellim S.; Szeto, J.; Tamez, M.; Mattei, J. The role of polyphenols in human health and food systems: A mini-review. Front. Nutr. 2018, 5. [CrossRef]
- Zhang, Y.; Liu, D. Flavonol kaempferol improves chronic hyperglycemia-impaired pancreatic beta-cell viability and insulin secretory function. Eur. J. Pharmacol. 2011, 670, 325–332. [CrossRef]
- Pandi, A.; Kalappan, V.M. Pharmacological and therapeutic applications of sinaptic acid-an updated review. Mol. Biol. Reports. 2021, 48, 3733–3745. 10.1007/s11033-021-06367-0.
- Cherng, Y.G.; Tsai, C.C.; Chung, H.H.; Lai, Y.W.; Kuo, S.C.; Cheng, J.T. Antihyperglycemic action of sinapic acid in diabetic rats. J. Agric. Food Chem. 2013, 61, 12053–12059. [CrossRef]
- Dubie, J.; Stancik, A.; Morra, M.; Nindo, C. Antioxidant extraction from mustard (Brassica juncea) seed meal using high-intensity ultrasound. J. Food Sci. 2013, 78, F542-E548. [CrossRef]
- Li, X.; Lin, J.; Ding, X.; Xuan, J.; Hu, Z.; Wu, D.; Zhu, X.; Feng, Z.; Ni, W.; Wu, A. The protective effect of sinapic acid in osteoarthritis: In vitro and in vivo studies. J. Cell. Mol. Med. 2019, 23, 1940–1950. [CrossRef]
- Balaji, D.; Muthukumaran, J.; Nalini, N. Chemopreventive effect of sinapic acid on 1,2-dimethylhydrazine-induced experimental rat colon carcinogenesis. Hum.Exp. Toxicol. 2014, 33, 1253–1268. [CrossRef]
- Shin D.S.; Kim, K.W.; Chung, H.Y.; Yoon, S.; Moon, J.O. Effect of sinapic acid against carbon tetrachloride-induced acute hepatic injury in rats. Arch. Pharm. Res. 2013, 36, 626–633. 10.1007/s12272-013-0050-5.
- Roy, S.J.; Mainzen Prince, P.S. Protective effects of sinapic acid on cardiac hypertrophy, dyslipidaemia and altered electrocardiogram in isoproterenol-induced myocardial infarcted rats. Eur. J. Pharmacol. 2013, 699, 213–218. [CrossRef]
- Ansari, M.A.; Raish, M.; Ahmad, A.; Alkharfy, K.M.; Ahmad, S.F.; Attia, S.M.; Alsaad, A.M.S.; Bakheel, S.A. Sinapic acid ameliorate cadmiun-induced nephrotoxicity: In vivo possible involvement of oxidative stress, apoptosis, and inflammation via NF-kaB NF-κB downregulation. Environ. Toxicol. Pharmacol. 2017, 51, 100–107. [CrossRef]
- Kanchana, G.; Shyni, W.J.; Rajadurai, M.; Periasamy, R. Evaluation of anti-hyperglycemic effect of sinapic acid in normal and streptozocin (STZ)-induced diabetic diabetes in albino rats. Global J. Pharmacol. 2011, 5, 33–39. chromeextension://efaidnbmnnnibpcajpcglclefindmkaj/https://idosi.org/gjp/5(1)11/7.
- Tesaki, S.; Tanabe, S.; Ono, H.; Fukushi, E.; Kawabata, J.; Watanabe, M. 4-Hydroky-3-nitrophenylacetic and sinapic acid as antibacterial compounds from Mustard seed. Biosci. Biotechnol. Biochem. 1998, 62, 998–1000. [CrossRef]
Figure 1.
Structures of compounds 1–10.
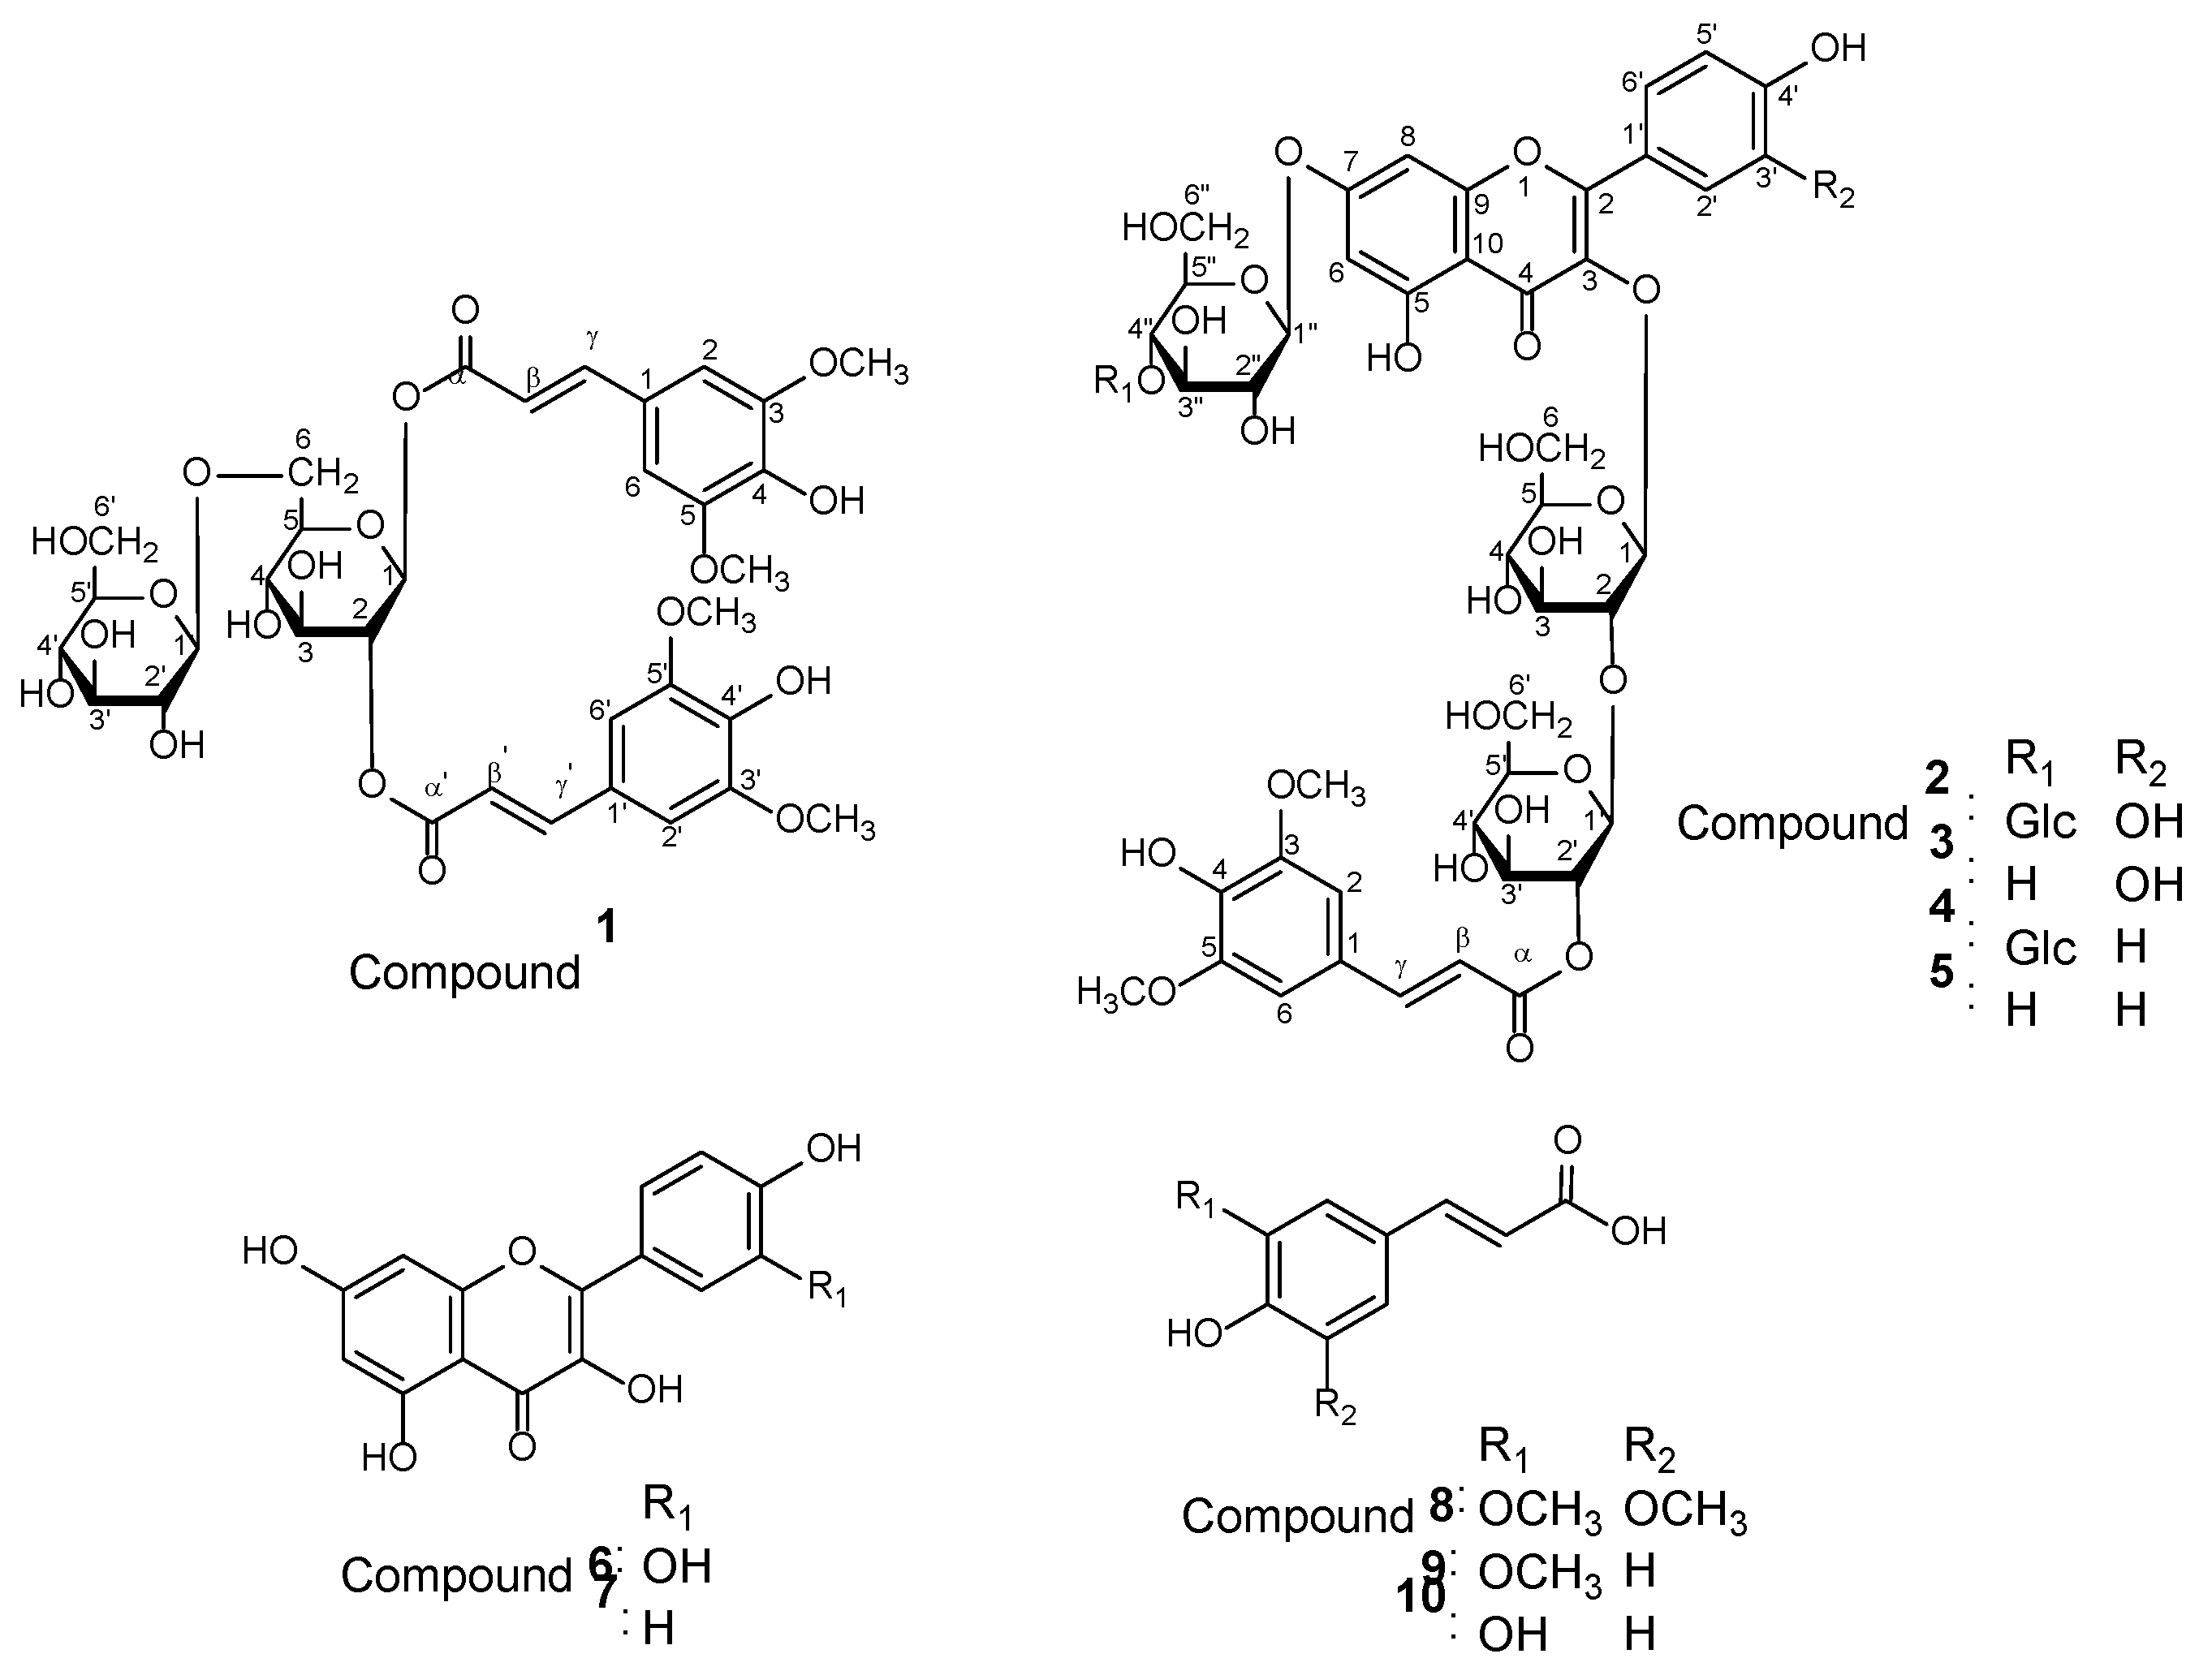
Figure 2.
HPLC Profiles of MeOH extracts from Petit vert leaf (a) and Petit vert side shoots (b). HPLC conditions [Column: Cosmosil 2.5Cholester (2.5 µm), i.d. 3.0 × 100 mm (NACALAI TESQUE, INC.); Mobile phase: A 0.1%TFA in water, B CH3CN, gradient, 0―20 min: 6―11% B linear, 20―36 min: 11―27% B linear, 36―45 min: 27% B ; Flow rate: 0.75 mL/min; Detection: UV 330 nm; Column temperature: 40℃].
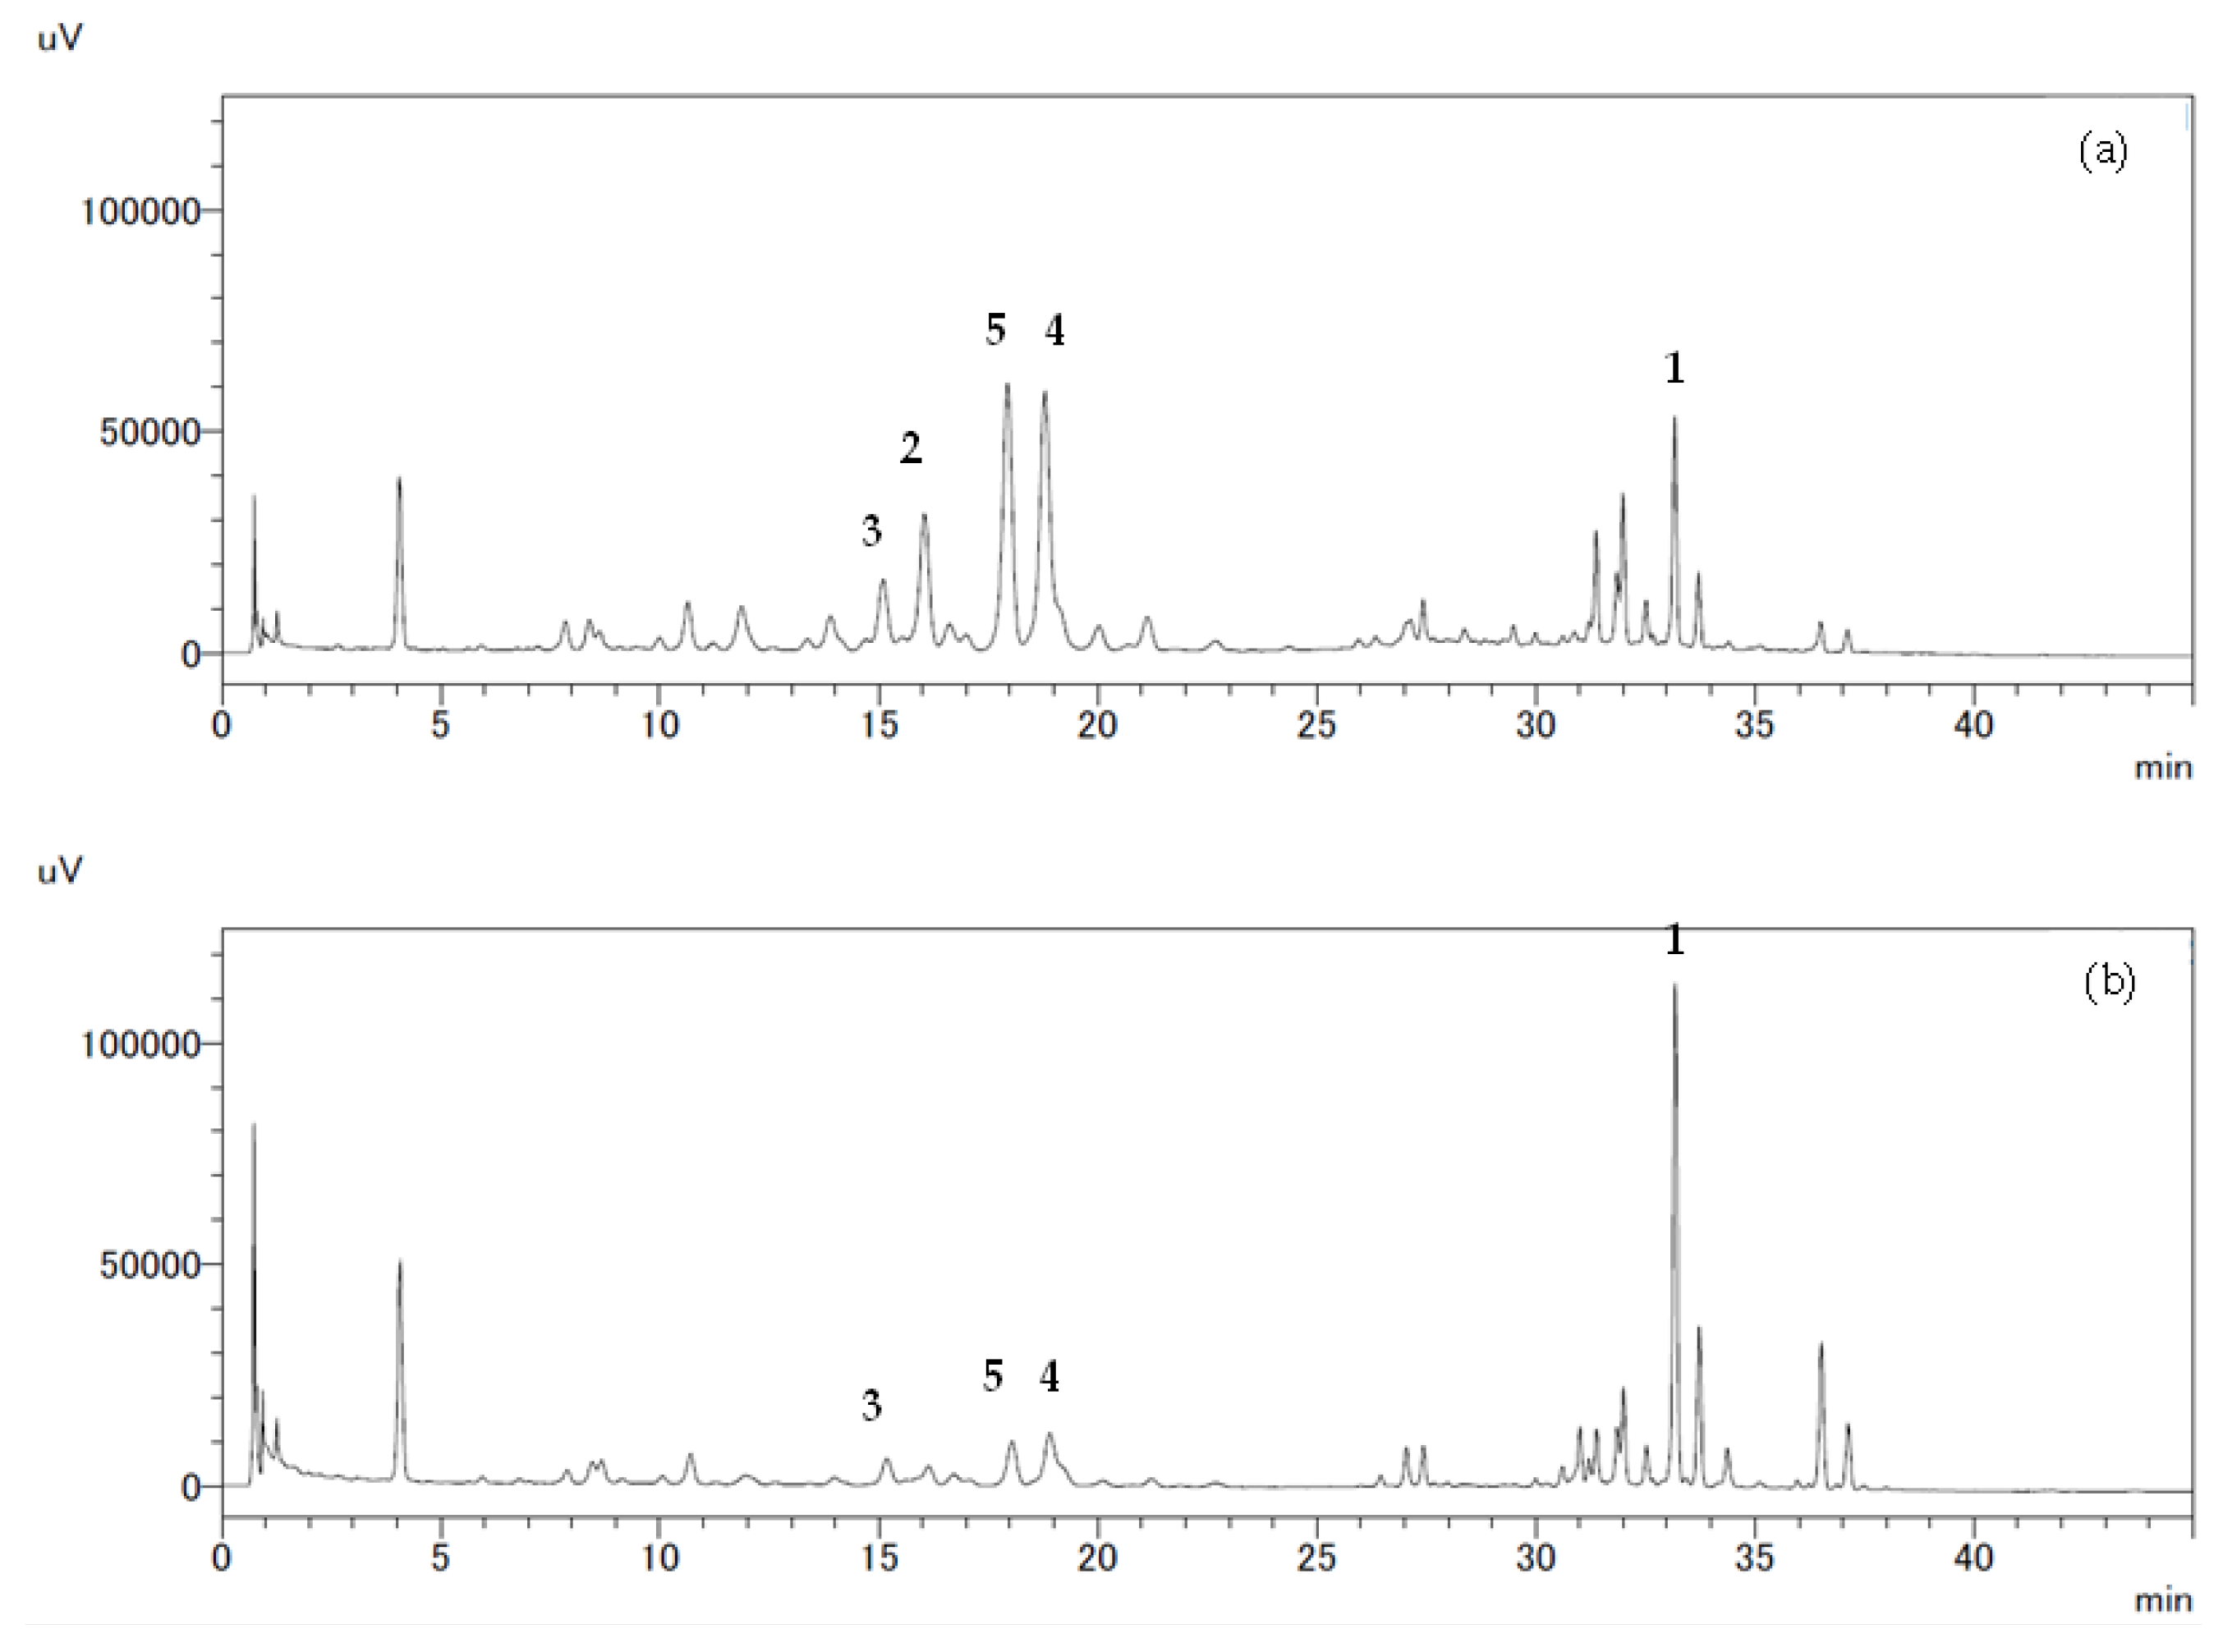

Table 1.
13C NMR spectroscopic data of flavonoid glycosides and a cinnamic acid derivative (δ/ppm; 175 or 125 MHz instruments).
Table 1.
13C NMR spectroscopic data of flavonoid glycosides and a cinnamic acid derivative (δ/ppm; 175 or 125 MHz instruments).
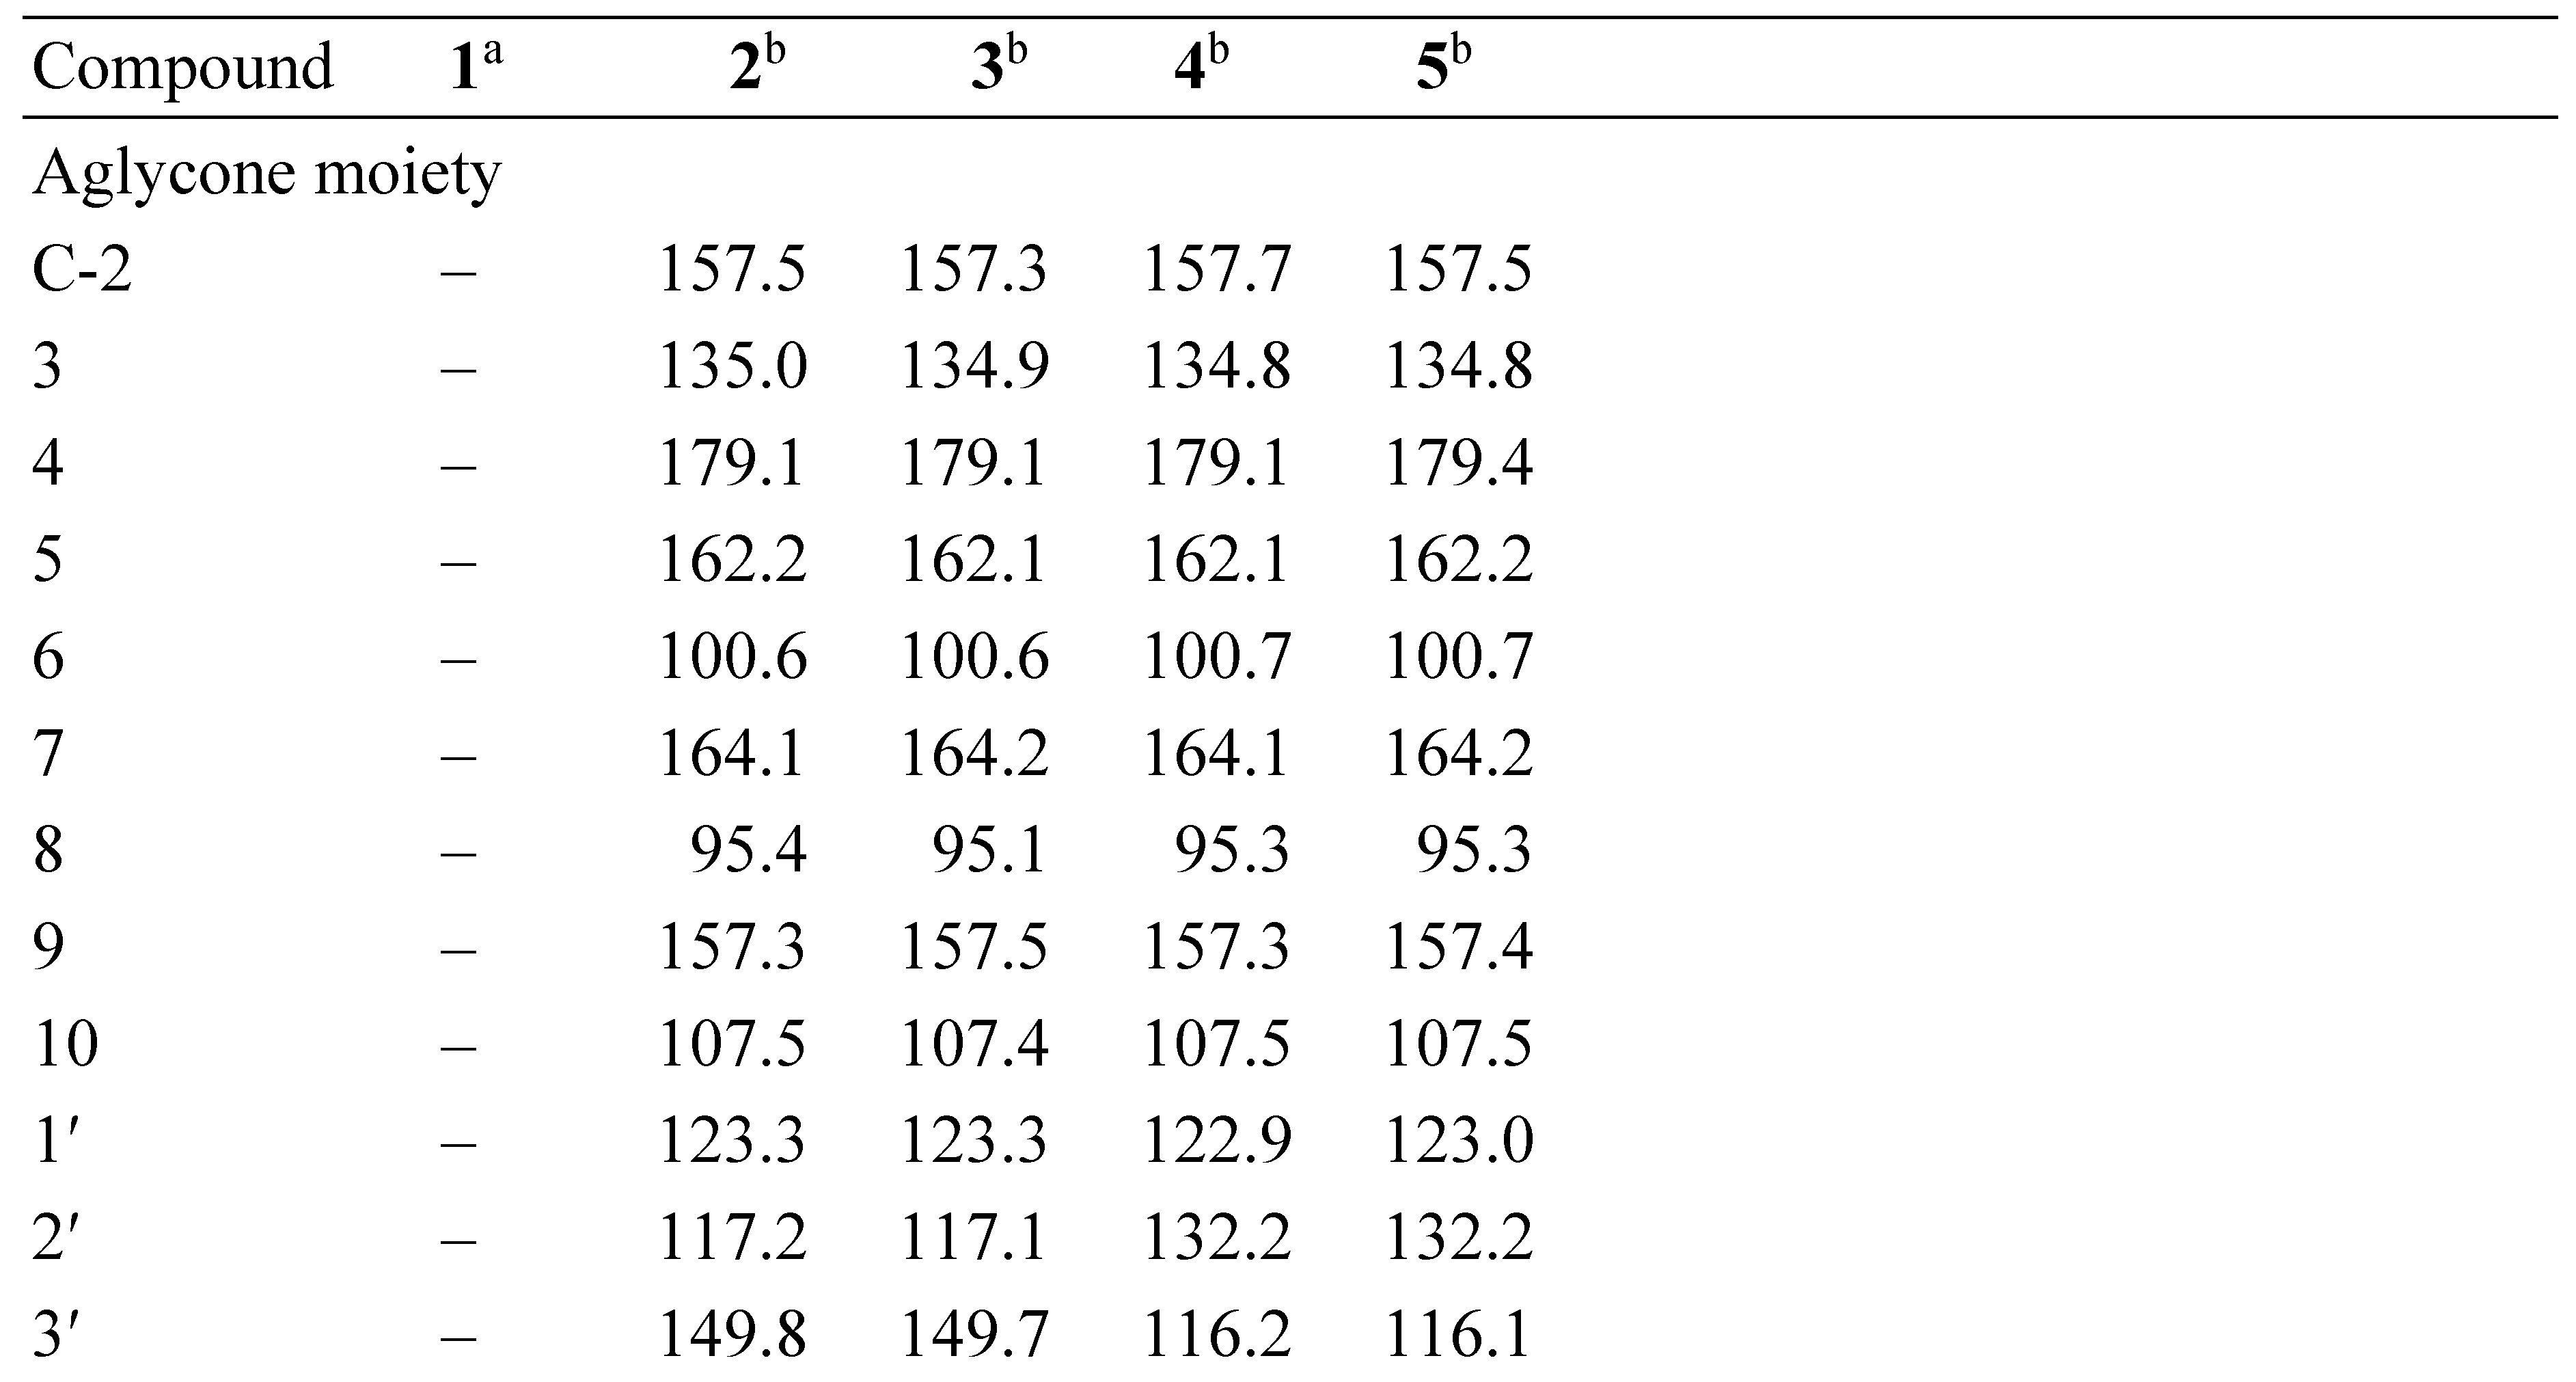
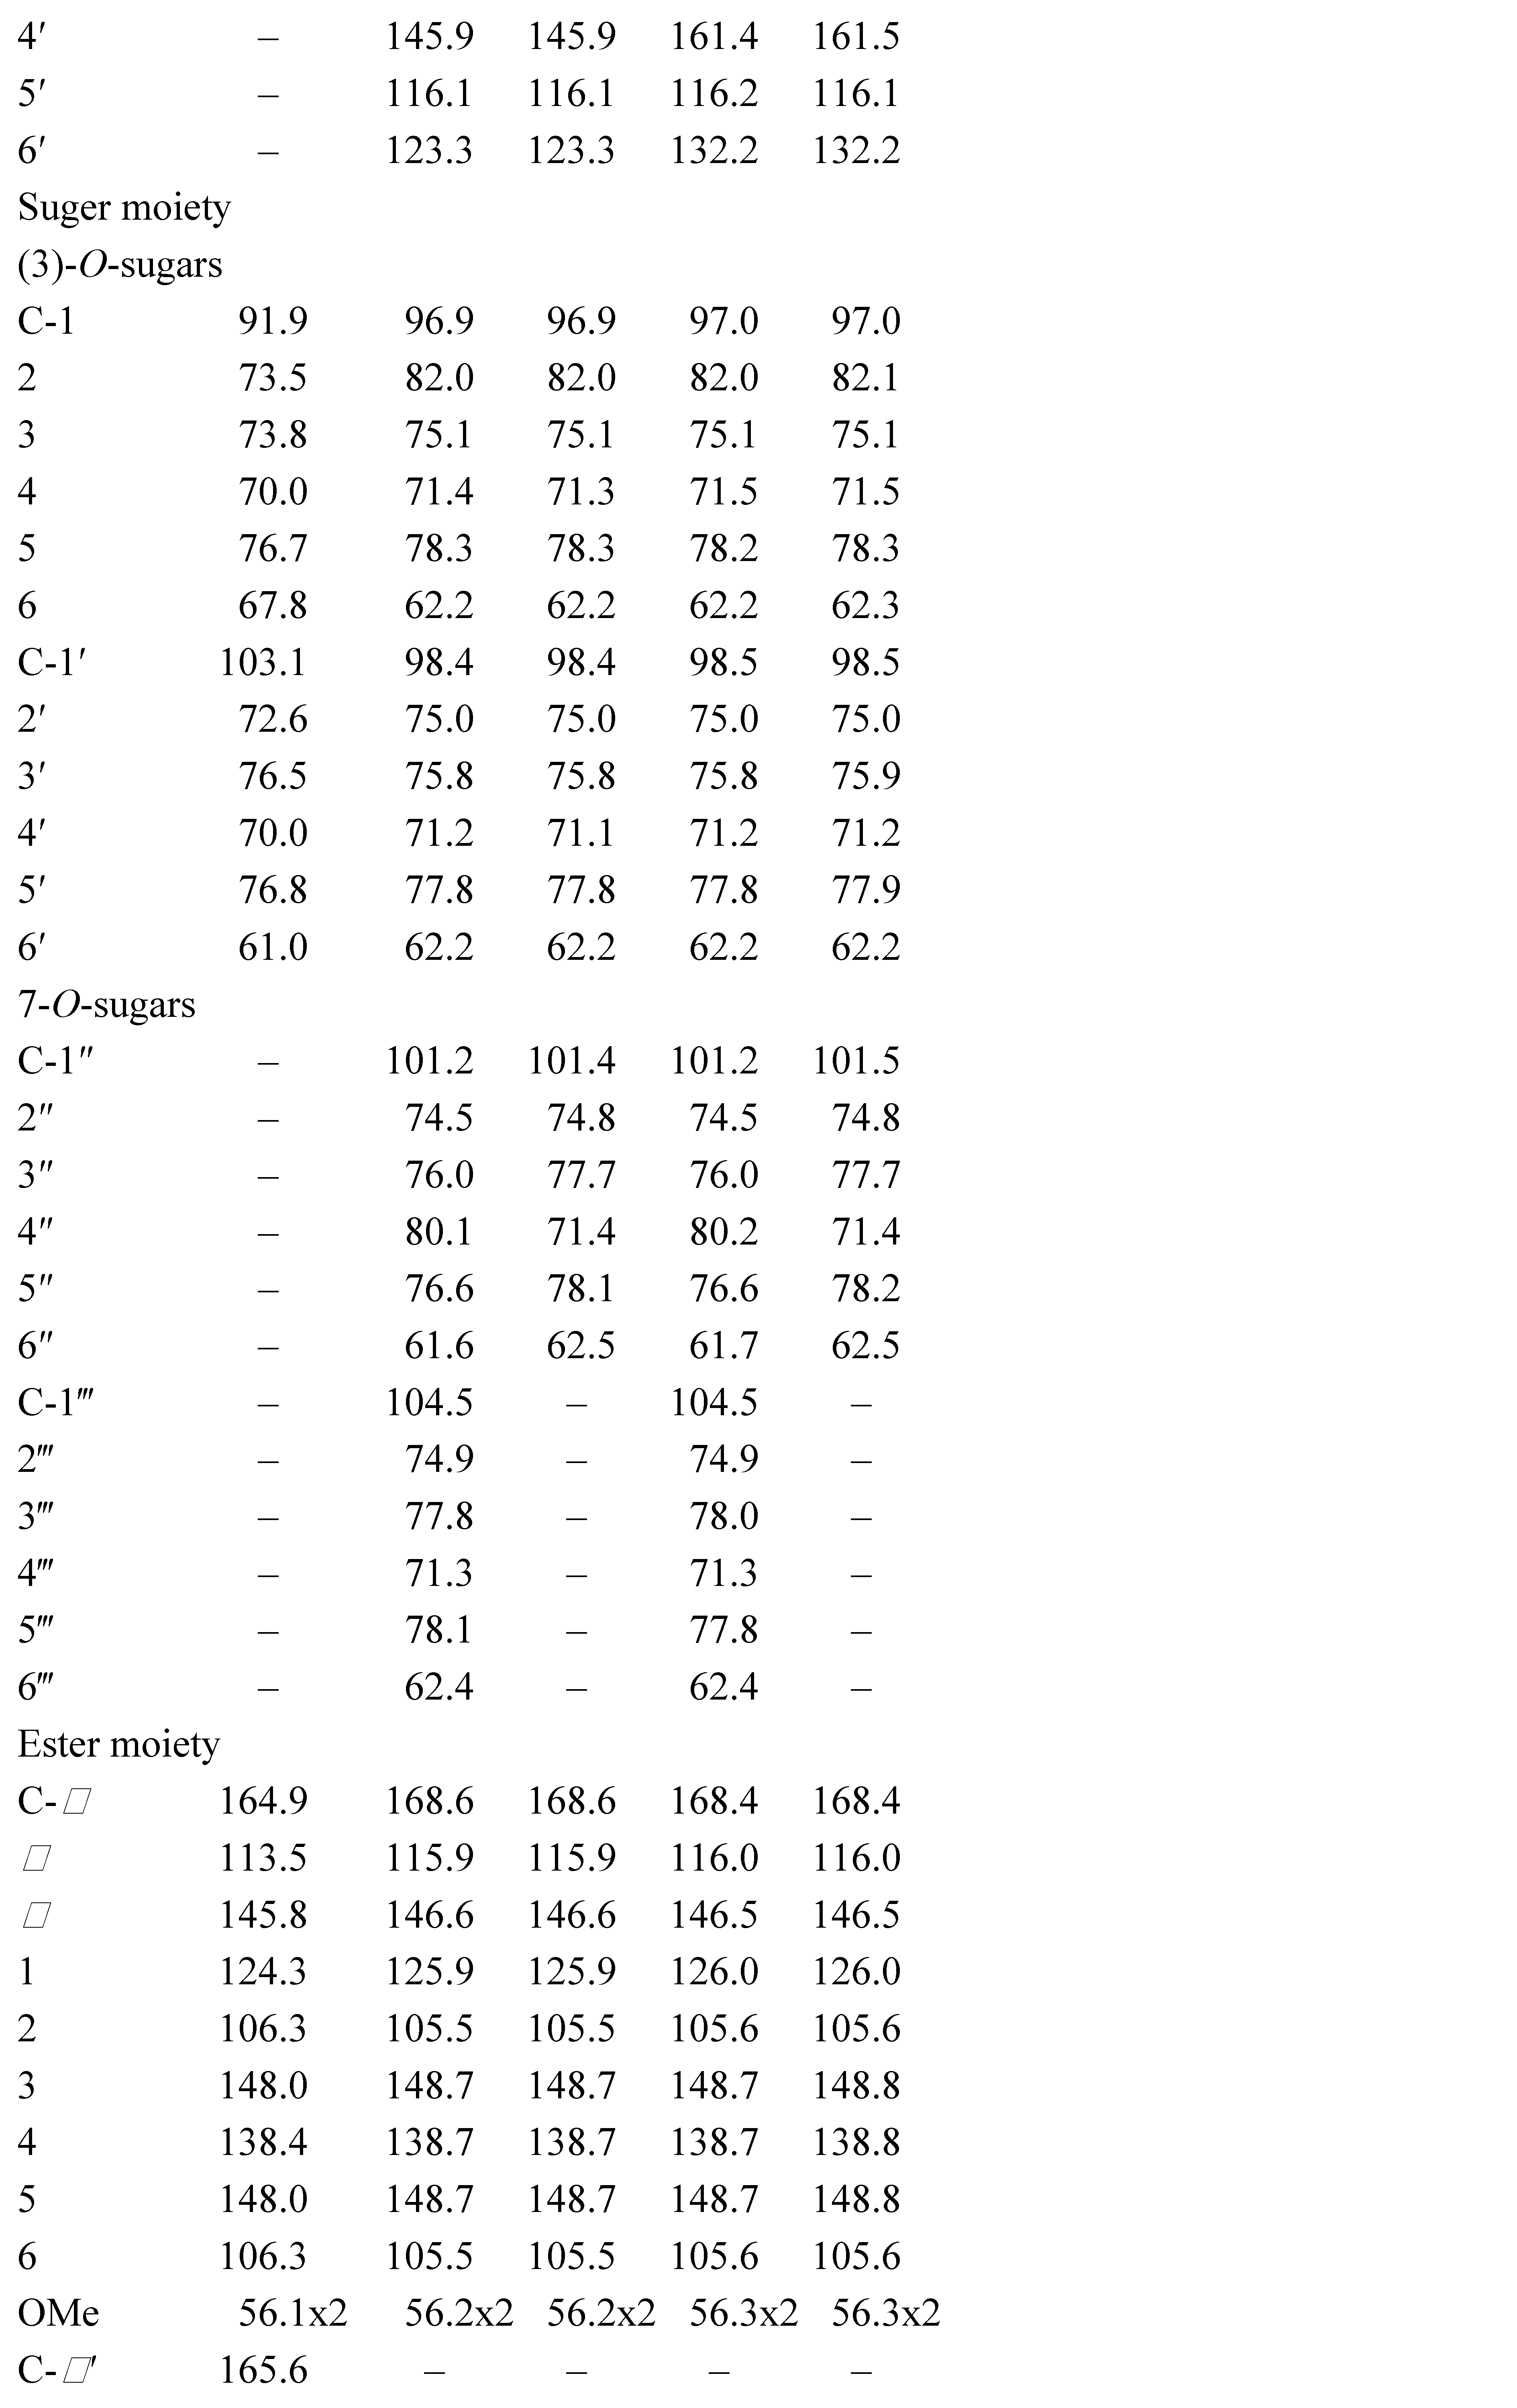
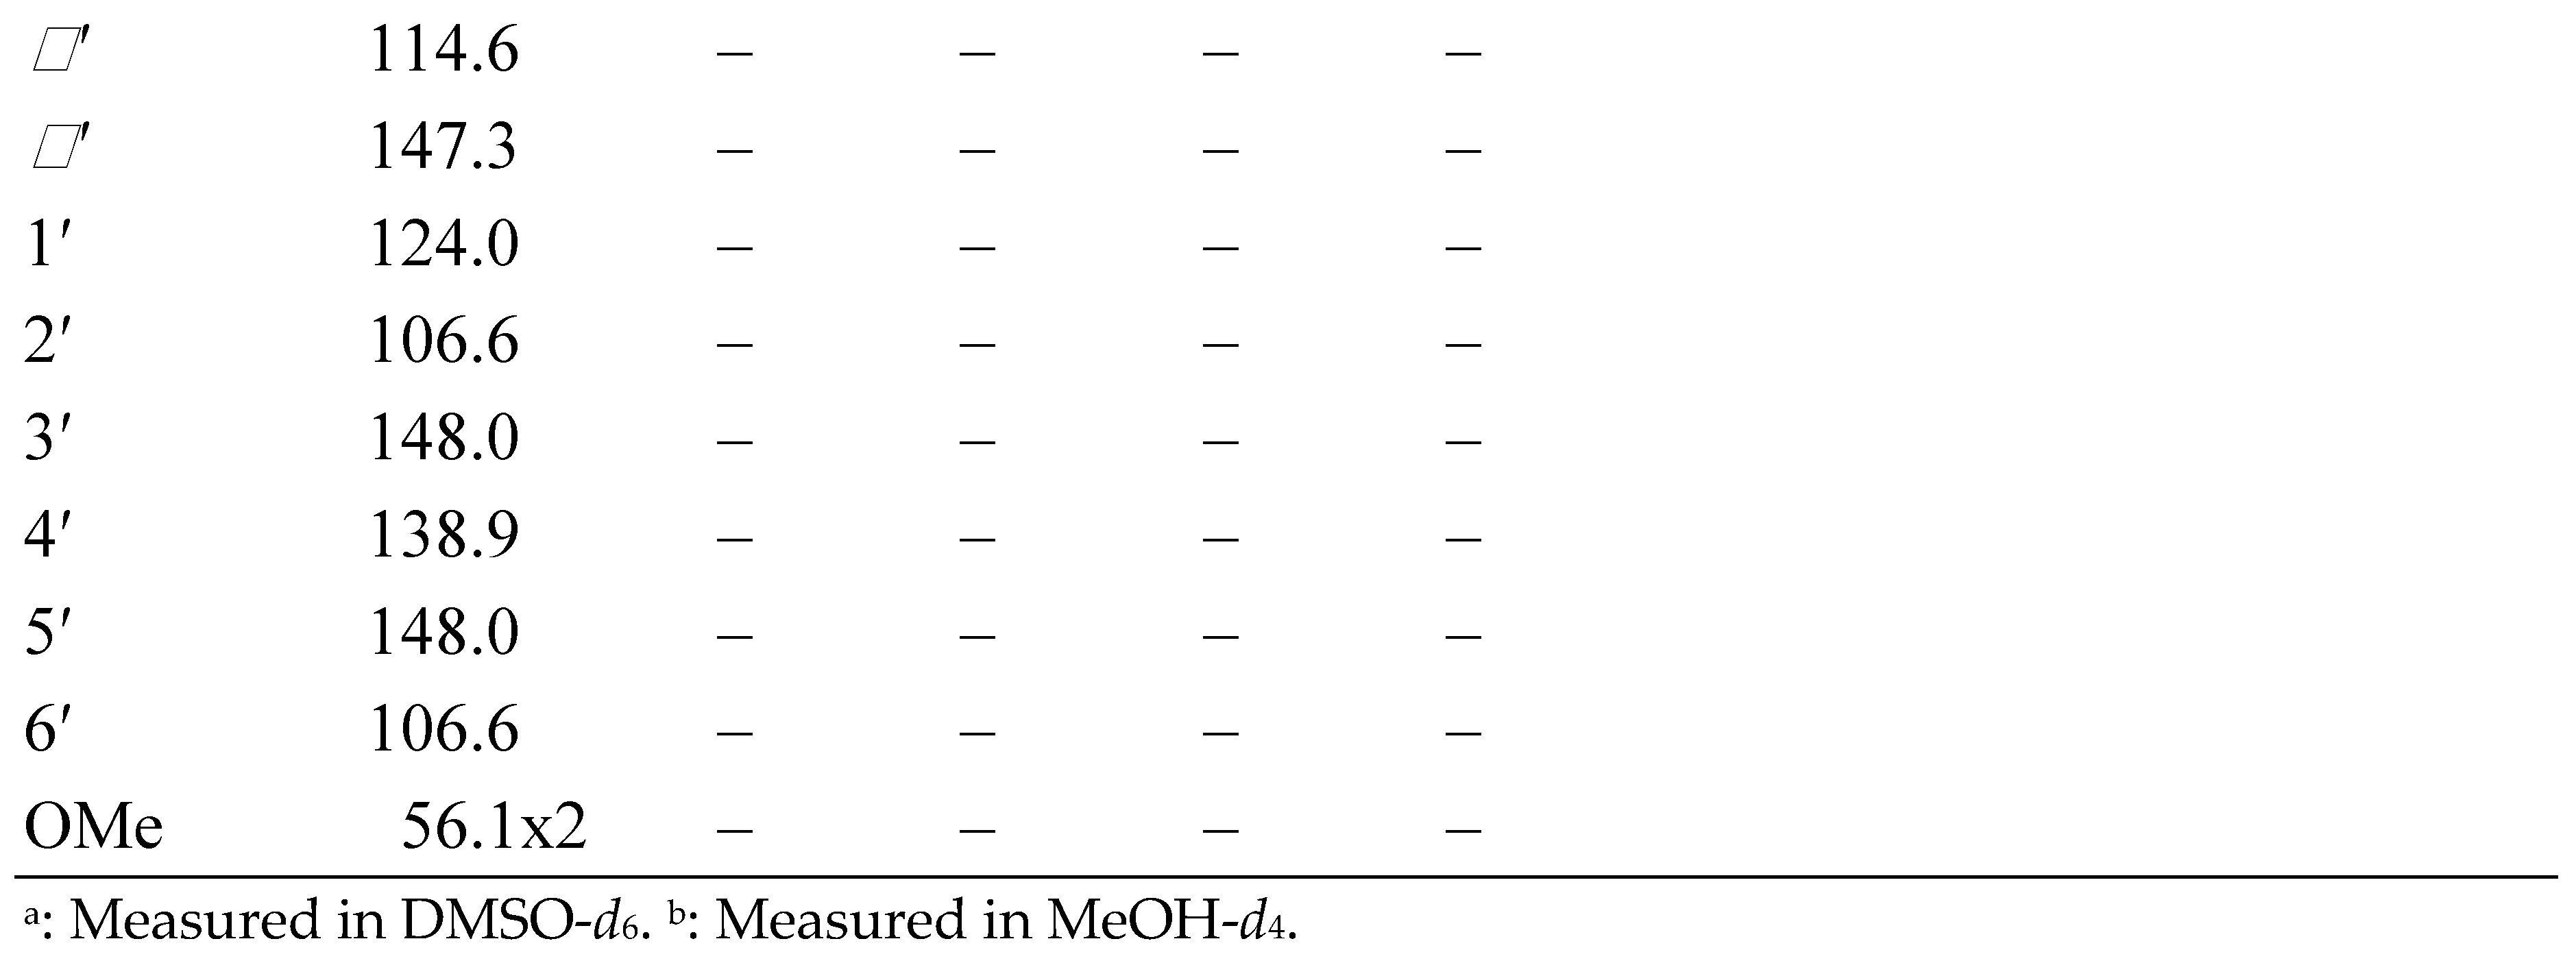
Table 2.
1H NMR spectroscopic data of flavonoid glycosides and a cinnamic acid derivative (δ/ppm; 700 or 500 MHz instruments).
Table 2.
1H NMR spectroscopic data of flavonoid glycosides and a cinnamic acid derivative (δ/ppm; 700 or 500 MHz instruments).
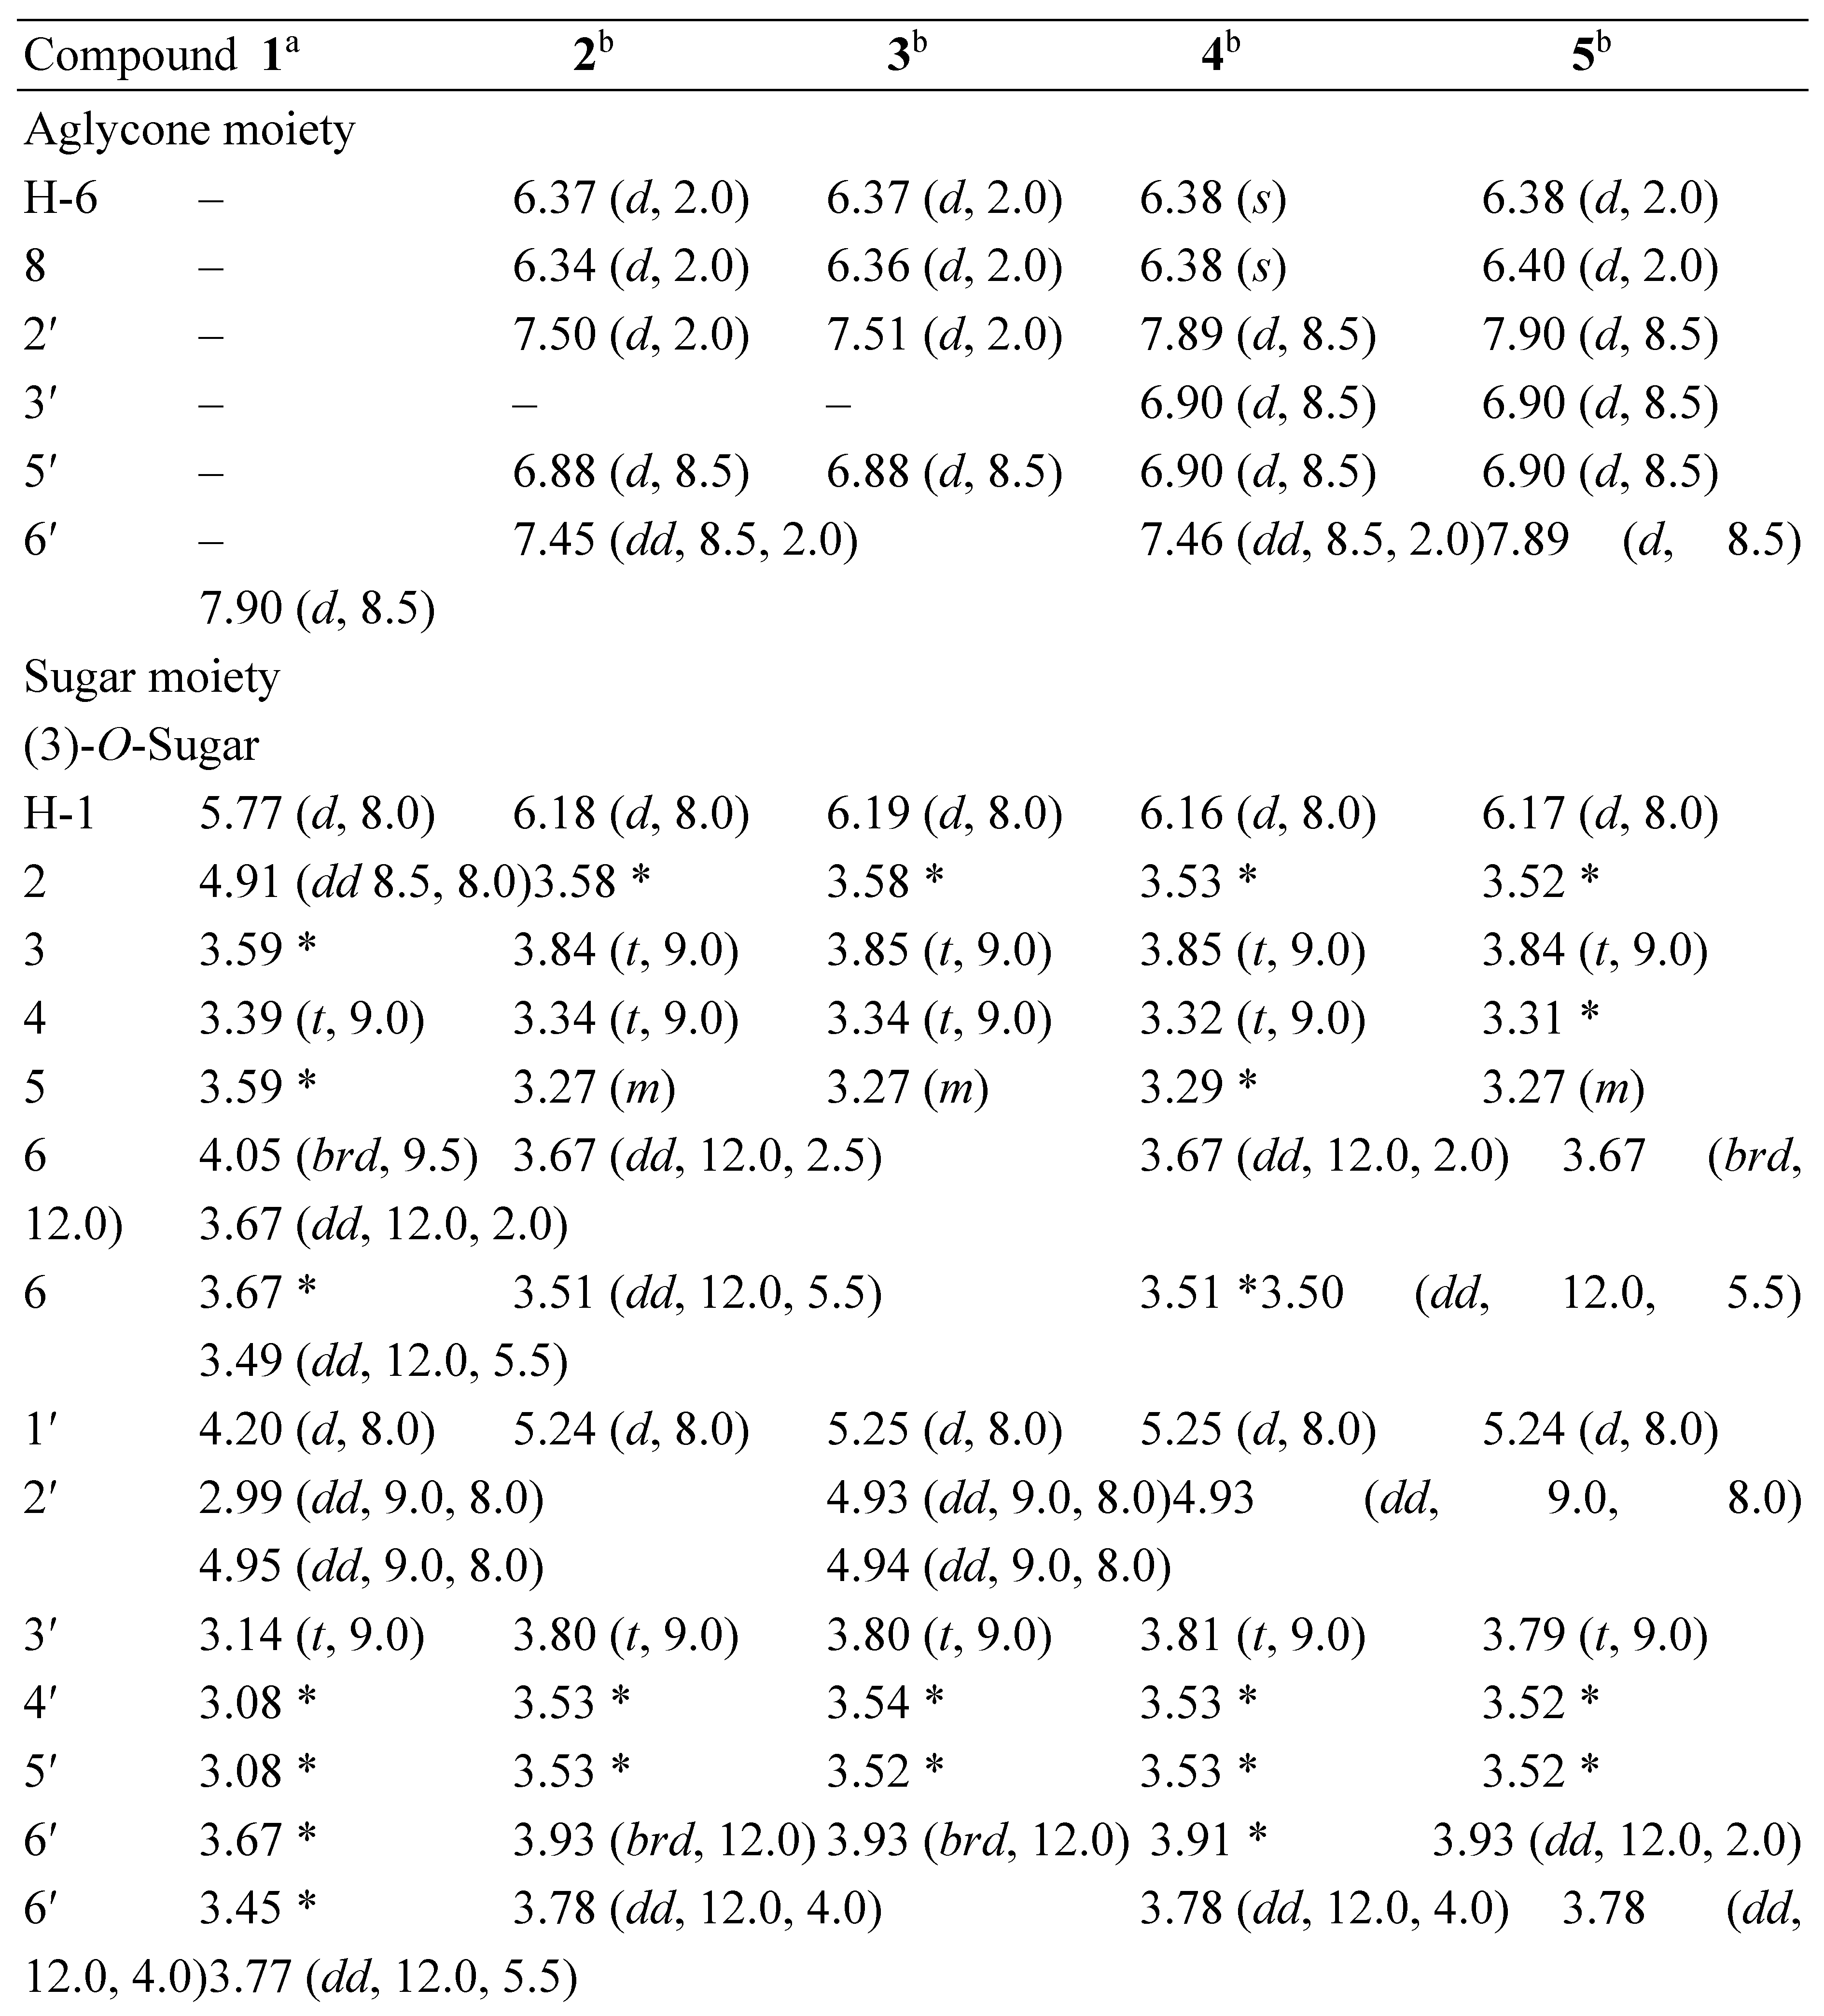
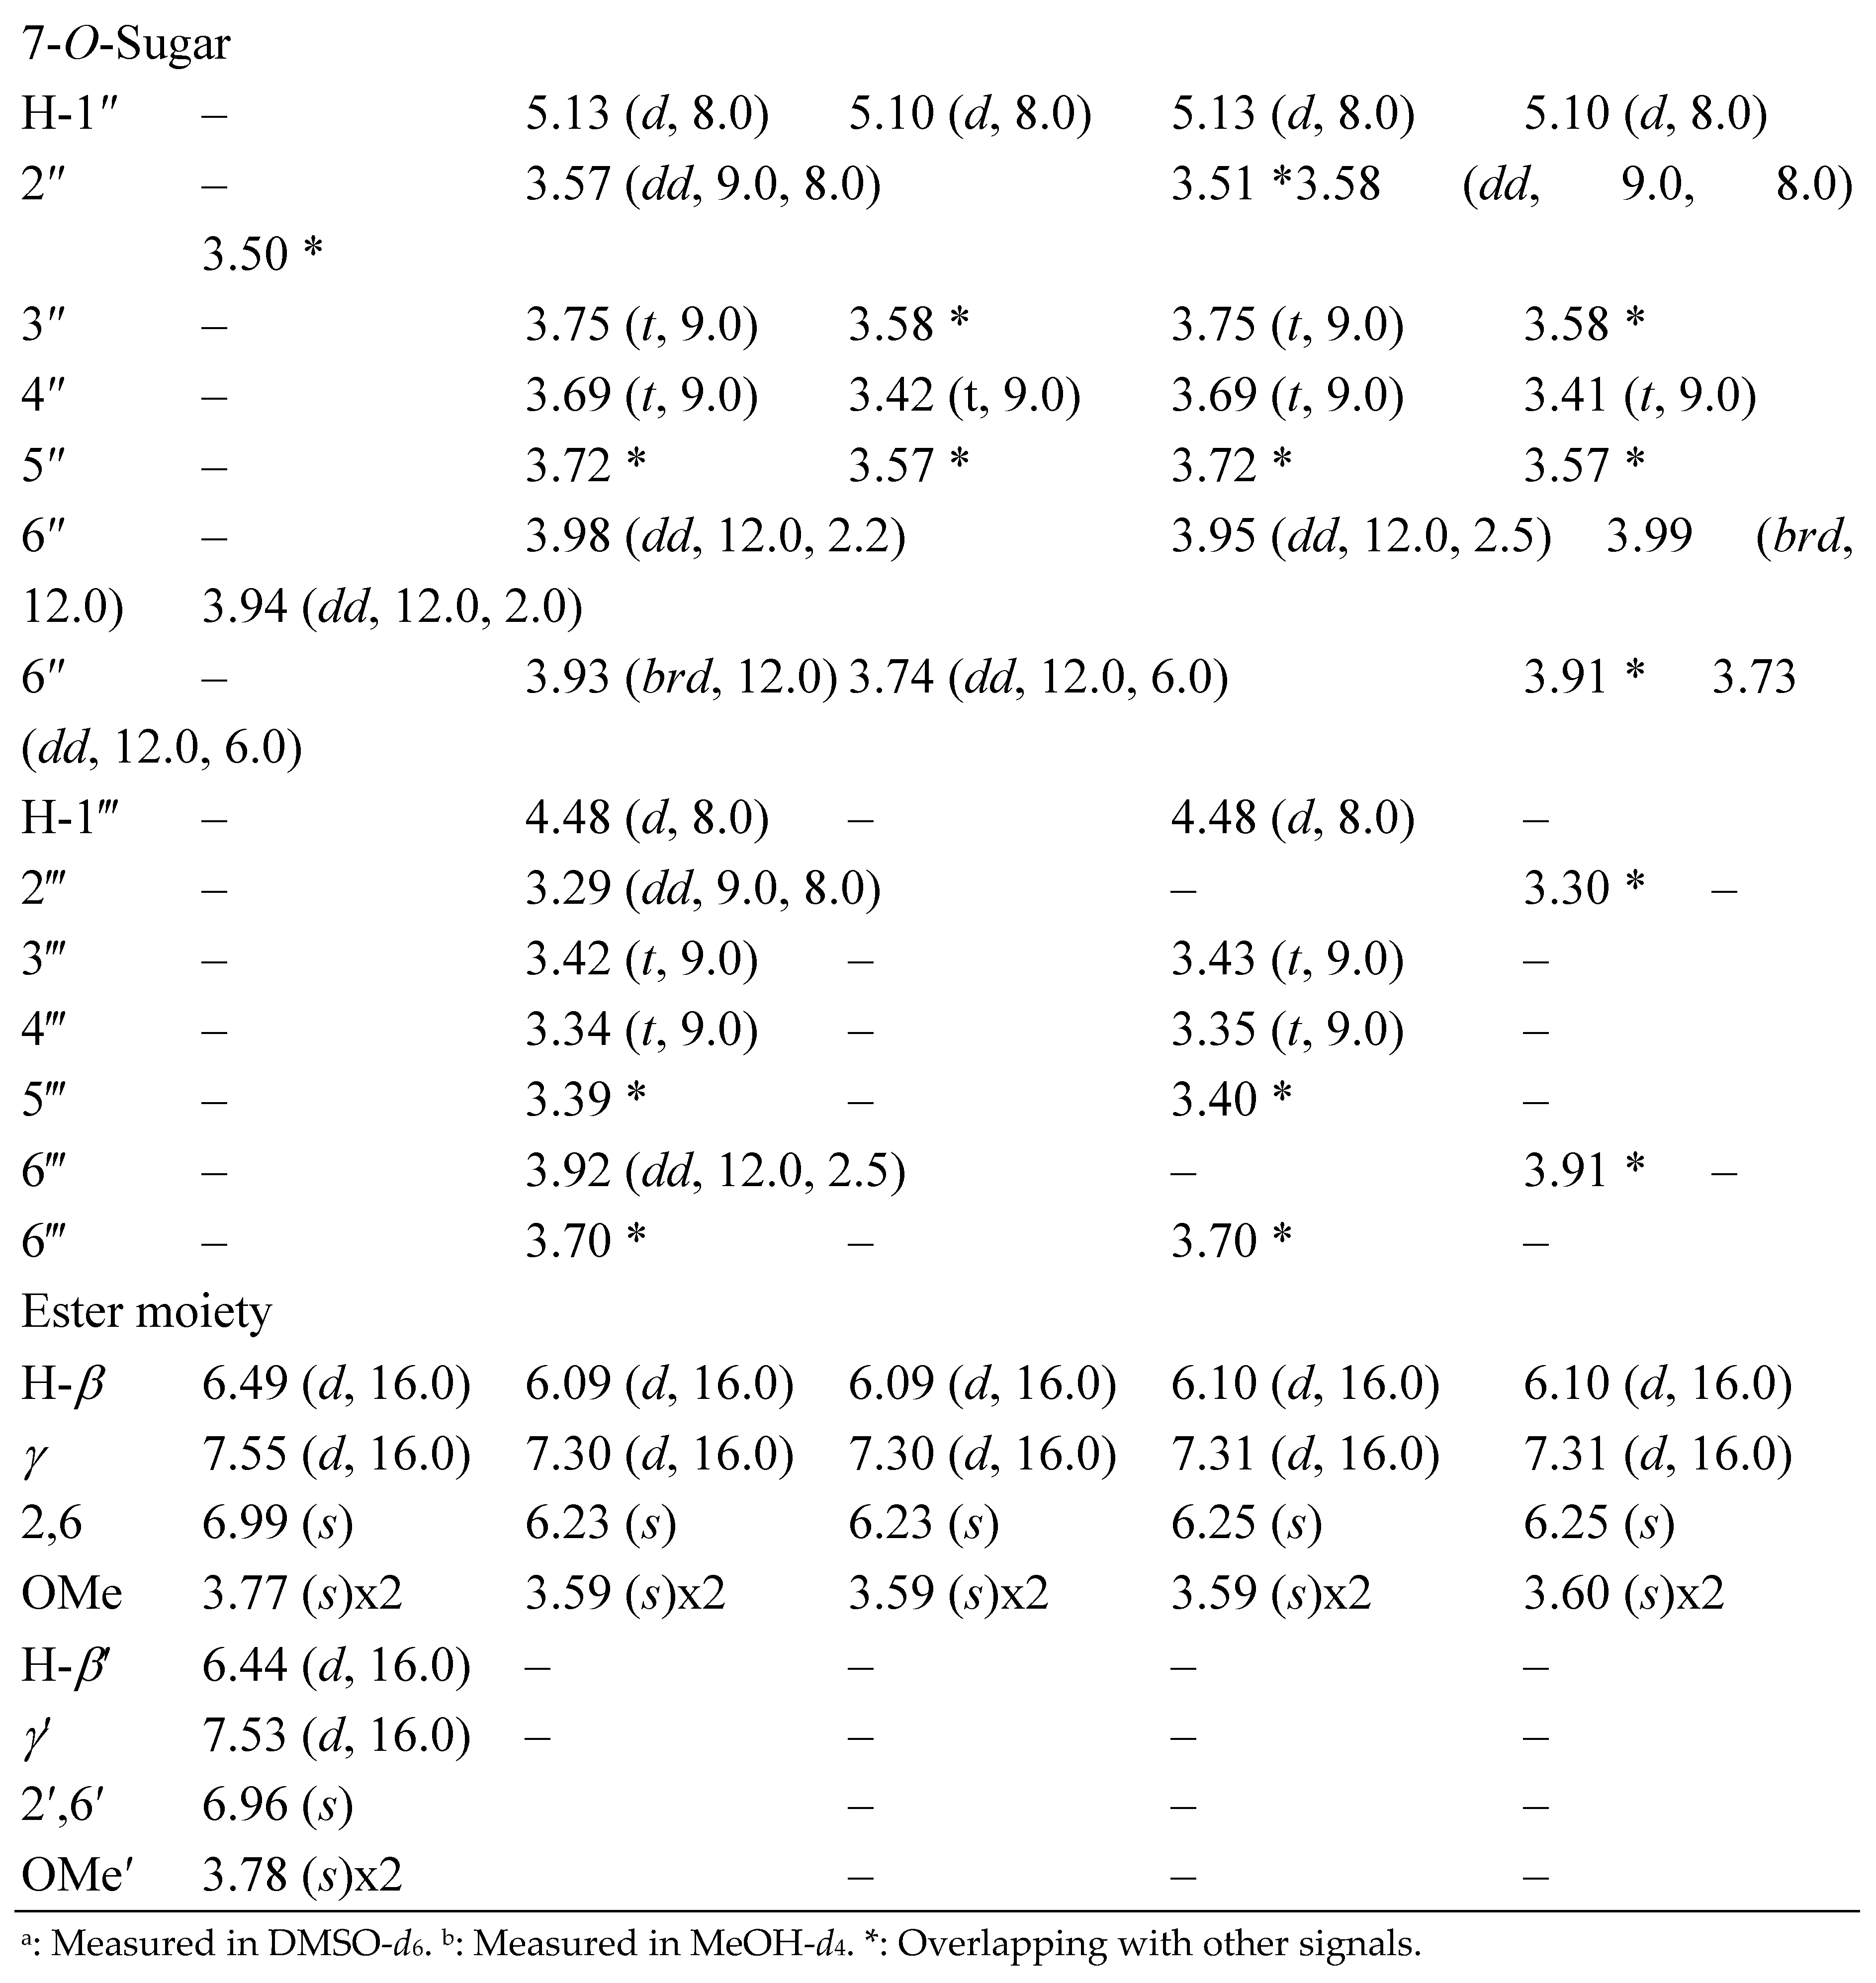
Table 3.
Effect of various compounds in the cytotoxicity assay.
| Test substance | Control | 1 | 10 (µM) |
100 |
| Viable cell rate (% of control) | ||||
| 1 | 100.0 ± 0.9 | 105.0 ± 1.6 | 101.4 ± 1.1 | 103.1 ± 0.7 |
| 2 | 100.0 ± 0.6 | 96.0 ± 0.9 | 94.9 ± 1.1 | 96.1 ± 1.0 |
| 3 | 100.0 ± 0.9 | 97.9 ± 0.4 | 98.9 ± 1.1 | 103.8 ± 1.1 |
| 4 | 100.0 ± 1.1 | 88.6 ± 0.8 | 93.5 ± 1.8 | 91.6 ± 0.7 |
| 5 | 100.0 ± 0.2 | 98.5 ± 2.5 | 102.0 ± 1.1 | 99.5 ± 0.8 |
| Quercetin (6) | 100.0 ± 0.6 | 102.0 ± 0.4 | 98.0 ± 1.1 | 76.6 ± 1.2* |
| Kaempferol (7) | 100.0 ± 1.2 | 105.7 ± 2.5 | 111.1 ± 1.7 | 66.6 ± 1.0* |
| Sinapic acid (8) | 100.0 ± 1.4 | 110.0 ± 1.4 | 107.0 ± 0.9 | 119.1 ± 2.4 |
| Ferulic acid (9) | 100.0 ± 0.6 | 102.4 ± 1.2 | 108.4 ± 1.3 | 111.5 ± 0.3 |
| Caffeic acid (10) | 100.0 ± 0.1 | 107.0 ± 1.7 | 107.8 ± 1.6 | 101.0 ± 2.4 |
- Each value represents the mean ± S.E. for 3 determinations.
- *P<0.05, significantly different from the control (0.1%DMSO).
Table 4.
Effects of various compounds on glucose uptake by C2C12 skeletal muscle cells in the absence of insulin.
Table 4.
Effects of various compounds on glucose uptake by C2C12 skeletal muscle cells in the absence of insulin.
| Test compounds | Control | 1 | 10 (µM) |
100 |
| Uptake (% of control) | ||||
| 1 | 100.0 ± 2.8 | 128.4 ± 5.5** | 125.2 ± 3.2*** | 122.1± 1.4*** |
| 2 | 100.0 ± 2.8 | 130.9 ± 8.0* | 108.7 ± 4.8 | 88.3 ± 1.8* |
| 3 | 100.0 ± 3.6 | 130.7 ± 6.9** | 120.1 ± 1.9** | 100.8 ± 3.7 |
| 4 | 100.0 ± 3.6 | 110.4 ± 5.6 | 127.4 ± 5.0** | 145.5 ± 2.8*** |
| 5 | 100.0 ± 3.7 | 116.8 ± 3.5* | 114.9 ± 2.5* | 103.0 ± 4.7 |
| Quercetin (6) | 100.0 ± 3.7 | 104.1 ± 3.5 | 102.3 ± 2.8 | 25.5 ± 0.7*** |
| Kaempferol (7) | 100.0 ± 4.4 | 135.0 ± 2.4*** | 144.5 ± 9.5** | 39.8 ± 1.4*** |
| Sinapic acid (8) | 100.0 ± 4.4 | 135.8 ± 6.8** | 129.7 ± 4.9** | 127.3 ± 3.7** |
| Ferulic acid (9) | 100.0 ± 3.7 | 105.6 ± 2.4 | 120.5 ± 2.8** | 116.2 ± 1.5** |
| Caffeic acid (10) | 100.0 ± 3.7 | 129.9 ± 11.7 | 111.9 ± 5.0 | 108.6 ± 7.1 |
- After treatment with various compounds at the indicated concentration in the absence of insulin, glucose uptake was measured using Promega Glucose Uptake-Glo™ Assay kit.
- Each value represents the mean ± S.E. for 5 determinations.
- *** P<0.001, **P<0.01, *P<0.05, significantly different from the control (0.1%DMSO).
Table 5.
Effects of various compounds on glucose uptake by C2C12 skeletal muscle cells in the presence of insulin.
Table 5.
Effects of various compounds on glucose uptake by C2C12 skeletal muscle cells in the presence of insulin.
| Test compounds | Control | 1 | 10 (µM) |
100 |
| Uptake (% of control) | ||||
| 1 | 100.0 ± 8.4 | 96.3 ± 4.0 | 92.1 ± 2.9 | 81.8 ± 1.8 |
| 2 | 100.0 ± 8.4 | 84.4 ± 1.9 | 82.2 ± 3.9 | 83.8 ± 5.2 |
| 3 | 100.0 ± 3.1 | 110.6 ± 2.6* | 120.5 ± 7.4 | 81.9 ± 4.6* |
| 4 | 100.0 ± 3.1 | 74.2 ± 2.9*** | 90.5 ± 1.7 | 123.1 ± 9.4* |
| 5 | 100.0 ± 3.5 | 114.5 ± 5.4 | 103.7 ± 5.7 | 81.1 ± 4.4* |
| Quercetin (6) | 100.0 ± 3.5 | 72.9 ± 5.5** | 76.8 ± 3.7** | 20.1 ± 1.8*** |
| Kaempferol (7) | 100.0 ± 4.6 | 148.4 ± 6.8*** | 132.7 ± 2.3*** | 31.7 ± 1.0*** |
| Sinapic acid (8) | 100.0 ± 4.6 | 116.5 ± 1.5* | 119.3 ± 2.7* | 123.0 ± 3.1** |
| Ferulic acid (9) | 100.0 ± 8.6 | 97.0 ± 2.0 | 118.7 ± 7.3 | 94.9 ± 2.2 |
| Caffeic acid (10) | 100.0 ± 8.6 | 94.3 ± 1.9 | 101.7 ± 5.6 | 99.5 ± 0.7 |
- After treatment with various compounds at the indicated concentration in the presence of insulin, glucose uptake was measured using Promega Glucose Uptake-Glo™ Assay kit.
- Each value represents the mean ± S.E. for 5 determinations.
- *** P<0.001, **P<0.01, *P<0.05, significantly different from the control (0.1%DMSO).
Disclaimer/Publisher’s Note: The statements, opinions and data contained in all publications are solely those of the individual author(s) and contributor(s) and not of MDPI and/or the editor(s). MDPI and/or the editor(s) disclaim responsibility for any injury to people or property resulting from any ideas, methods, instructions or products referred to in the content. |
© 2024 by the authors. Licensee MDPI, Basel, Switzerland. This article is an open access article distributed under the terms and conditions of the Creative Commons Attribution (CC BY) license (http://creativecommons.org/licenses/by/4.0/).
Copyright: This open access article is published under a Creative Commons CC BY 4.0 license, which permit the free download, distribution, and reuse, provided that the author and preprint are cited in any reuse.


