
Submitted:
21 August 2024
Posted:
22 August 2024
You are already at the latest version
Abstract
Aging is a complex biological process characterized by the progressive decline of physiological functions and increased vulnerability to age-related diseases. Epigenetic changes, particularly DNA methylation alterations, play a critical role in the aging process by influencing gene expression and genomic stability. This study explores the potential of epigenetic reprogramming as a strategy to reverse aging phenotypes in human fibroblasts. Using CRISPR-Cas9 gene editing and small molecule inhibitors targeting DNA methylation and histone acetylation, we successfully induced significant changes in DNA methylation and gene expression profiles. Our results demonstrate a global reduction in DNA methylation levels and the identification of differentially methylated regions (DMRs) associated with cellular senescence and DNA repair. Additionally, treated fibroblasts exhibited enhanced proliferative capacity, reduced cellular senescence, and improved differentiation potential. These findings suggest that epigenetic reprogramming could be a promising approach for regenerative medicine, offering potential therapeutic strategies to counteract age-related decline and extend healthy lifespan.
Keywords:
Epigenetic Reprogramming
; Aging
; Regenerative Medicine
; DNA Methylation
; Cellular Rejuvenation
; CRISPR-Cas9
; Senescence
1. Introduction
Aging is a complex biological process marked by the gradual decline of physiological functions and an increased susceptibility to various diseases, including neurodegenerative disorders, cardiovascular diseases, and cancers. At the molecular level, aging is associated with several key phenomena, including DNA damage accumulation, mitochondrial dysfunction, telomere shortening, and, importantly, epigenetic changes (López-Otín et al. 2013). Epigenetics, which encompasses heritable changes in gene expression that do not involve alterations to the underlying DNA sequence, plays a crucial role in regulating these molecular events. Core epigenetic mechanisms such as DNA methylation, histone modifications, and non-coding RNA interactions collectively influence chromatin structure and gene activity (Jones & Takai 2001).
Among these mechanisms, alterations in DNA methylation patterns have emerged as particularly significant in the context of aging. DNA methylation, especially at CpG sites, is a critical regulator of gene expression and genomic stability (Bird 2002). Research has shown that aging is accompanied by global hypomethylation and hypermethylation at specific gene promoters, leading to dysregulated gene expression and impaired cellular function (Issa 2014; Horvath 2013). These epigenetic changes are linked to the hallmarks of aging, such as genomic instability, loss of proteostasis, deregulated nutrient sensing, and cellular senescence (López-Otín et al. 2013). Notably, Horvath (2013) demonstrated that these epigenetic alterations could be modulated to restore youthful gene expression profiles.
Recent advances in epigenetic research have provided new insights into the molecular mechanisms underlying aging and opened up possibilities for developing strategies to counteract age-related decline (Rando & Chang 2012). Epigenetic reprogramming, which involves resetting the epigenetic marks to a more youthful state, has emerged as a promising approach to reverse aging phenotypes and restore cellular function (Sen et al. 2016). Techniques such as CRISPR-Cas9-mediated gene editing and the use of small molecule inhibitors targeting DNA methyltransferases (DNMTs) and histone deacetylases (HDACs) have shown potential in modulating epigenetic states and enhancing regenerative capacities (Hargrove & Hackett 2014; Esteller 2008).
2. Methods
2.1. Experimental Design
This study was designed to investigate the effects of epigenetic reprogramming on aging human fibroblasts. The experimental workflow involved the use of CRISPR-Cas9 mediated gene editing and small molecule inhibitors to modulate DNA methylation and histone acetylation. Human fibroblasts were cultured and divided into control and treatment groups. The treatment group underwent epigenetic reprogramming, and various assays were conducted to evaluate the outcomes.
2.2. Cell Culture
Human dermal fibroblasts were obtained from healthy donors and cultured in Dulbecco's Modified Eagle Medium (DMEM) supplemented with 10% fetal bovine serum (FBS), 1% penicillin-streptomycin, and 1% glutamine. Cells were maintained at 37°C in a humidified atmosphere containing 5% CO2. Confluent cultures were passaged using trypsin-EDTA and seeded at a density of 1 × 10⁵ cells per well in six-well plates.
2.3. Epigenetic Reprogramming
2.3.1. CRISPR-Cas9 Gene Editing
- ▪
- Target Genes: The genes p16INK4a and p53, associated with cellular senescence and aging, were selected for editing. Guide RNAs (gRNAs) specific to these genes were designed using online CRISPR design tools (e.g., CRISPR-ERA) and synthesized by a commercial provider.
- ▪
- Transfection: Fibroblasts were transfected with CRISPR-Cas9 plasmids containing the gRNAs using Lipofectamine 3000 (Thermo Fisher Scientific) according to the manufacturer's protocol. Successfully edited cells were selected using puromycin resistance and validated by Sanger sequencing.
2.3.2. Small Molecule Inhibitors
- ▪
- DNA Methylation: 5-Azacytidine (5-AzaC), a DNA methyltransferase inhibitor, was used to reduce DNA methylation levels. Cells were treated with 5 μM 5-AzaC for 72 hours.
- ▪
- Histone Deacetylation: Trichostatin A (TSA), a histone deacetylase inhibitor, was used to promote histone acetylation. Cells were treated with 100 nM TSA for 24 hours.
2.4. DNA Methylation Analysis
Bisulfite sequencing was performed to assess DNA methylation changes. Genomic DNA was extracted using the QIAamp DNA Mini Kit (Qiagen). Bisulfite conversion was conducted using the EZ DNA Methylation-Gold Kit (Zymo Research). Converted DNA was amplified by PCR, and the products were sequenced using the Illumina MiSeq platform. Data analysis was performed using the methylKit package in R to identify differentially methylated regions (DMRs).
2.5. Transcriptomic Analysis
RNA sequencing (RNA-seq) was conducted to evaluate changes in gene expression profiles. Total RNA was extracted using the RNeasy Mini Kit (Qiagen) and quantified using a NanoDrop spectrophotometer. RNA libraries were prepared using the TruSeq RNA Library Prep Kit (Illumina) and sequenced on an Illumina HiSeq 2500 platform. Differential gene expression analysis was performed using DESeq2 in R.
2.6. Functional Assays
2.6.1. Cellular Senescence
Senescence-associated β-galactosidase (SA-β-gal) staining was performed using the Senescence β-Galactosidase Staining Kit (Cell Signaling Technology) to assess cellular senescence. The percentage of SA-β-gal positive cells was calculated by counting stained cells under a microscope.
2.6.2. Proliferation Assay
Cell proliferation was measured using the Cell Counting Kit 8 (CCK-8; Dojindo Molecular Technologies). Absorbance at 450 nm was recorded using a microplate reader.
2.6.3. Differentiation Assay
The differentiation potential of fibroblasts into adipogenic, osteogenic, and chondrogenic lineages was assessed using specific induction media. Differentiated cells were stained with Oil Red O, Alizarin Red S, and Alcian Blue, respectively, and visualized under a microscope.
2.7. Statistical Analysis
Statistical analyses were performed using R. Data were expressed as mean ± standard deviation (SD). Comparisons between groups were made using Student's t-test or one-way ANOVA followed by post-hoc Tukey's test, where appropriate. A p-value < 0.05 was considered statistically significant. Graphs and visualizations were generated using GraphPad Prism.
3. Data Analysis
Data analysis for this study involved comprehensive statistical evaluation of the experimental results, focusing on DNA methylation changes, gene expression profiles, and functional assays to determine the impact of epigenetic reprogramming on aging human fibroblasts. The analysis was conducted using a combination of bioinformatics tools and statistical software.
3.1. DNA Methylation Analysis
3.1.1. Data Processing
- ▪
- Raw bisulfite sequencing data were quality-checked using FastQC and trimmed for adapter sequences and low-quality bases using Trim Galore.
- ▪
- Cleaned reads were aligned to the human reference genome (GRCh38) using Bismark, a specialized bisulfite aligner.
- ▪
- Methylation calls were extracted using the Bismark methylation extractor and further processed using the methylKit package in R to identify differentially methylated regions (DMRs).
3.1.2. Statistical Analysis
- ▪
- Differential methylation analysis was performed comparing control and treated fibroblasts. Methylation differences at individual CpG sites and regions were statistically assessed using a logistic regression model.
- ▪
- A cutoff of p < 0.01 and an absolute methylation difference of >25% were applied to identify significant DMRs.
3.2. Transcriptomic Analysis
3.2.1. Data Processing
- ▪
- Raw RNA sequencing reads were quality-checked with FastQC and trimmed using Trim Galore to remove adapters and low-quality bases.
- ▪
- Trimmed reads were aligned to the human reference genome (GRCh38) using STAR aligner, and gene counts were quantified using featureCounts.
3.2.2. Differential Expression Analysis
- ▪
- Gene expression levels were normalized, and differential expression analysis was conducted using DESeq2 in R.
- ▪
- Genes with a false discovery rate (FDR) < 0.05 and absolute log2 fold change > 1 were considered significantly differentially expressed.
3.2.3. Functional Enrichment
- ▪
- Gene Ontology (GO) and KEGG pathway enrichment analyses were performed using the DAVID tool to identify biological processes and pathways significantly affected by epigenetic reprogramming.
- ▪
- Enrichment results were visualized using bar charts and network diagrams in Cytoscape.
3.3. Functional Assays
3.3.1. Cellular Senescence
- ▪
- The percentage of SA-β-gal positive cells was calculated by counting stained cells in randomly selected fields under a microscope.
- ▪
- Statistical significance was assessed using a two-tailed Student's t-test comparing treated and control groups.
3.3.2. Proliferation Assay
- ▪
- Absorbance readings from the CCK-8 assay were analyzed to determine cell proliferation rates. Data were normalized to the control group and statistically evaluated using one-way ANOVA followed by Tukey's post-hoc test.
3.3.3. Differentiation Assay
- ▪
- The efficiency of differentiation into adipogenic, osteogenic, and chondrogenic lineages was quantified by staining intensity measurements using ImageJ software.
- ▪
- Statistical comparisons were made using one-way ANOVA with post-hoc tests to determine significant differences between treated and control groups.
3.4. Statistical Tools and Software
3.4.1. R
Used for statistical analyses, data processing, and visualization. Key packages included methylKit for methylation analysis, DESeq2 for differential expression, and circlize for creating circular plots.
3.4.2. GraphPad Prism
Employed for generating graphs and performing statistical tests such as t-tests and ANOVAs.
3.4.3. Cytoscape
Utilized for visualizing enriched pathways and gene networks.
3.4.4. ImageJ
Used for quantifying staining intensities in functional assays.
3.5. Summary of Findings
3.5.1. DNA Methylation
Significant reduction in global DNA methylation levels and identification of key DMRs associated with aging.
3.5.2. Gene Expression
Upregulation of genes related to cell proliferation and downregulation of senescence-associated genes.
3.5.3. Functional Improvements
Reduced cellular senescence, enhanced proliferation rates, and improved differentiation potential in reprogrammed fibroblasts.
4. Results
4.1. DNA Methylation Changes
4.1.1. Global Methylation Levels
- ▪
- Treatment with 5-Azacytidine (5-AzaC) resulted in a significant reduction in global DNA methylation levels compared to the control group (p < 0.001).
- ▪
- Bisulfite sequencing data revealed a global decrease in methylation across the genome, with the most pronounced demethylation observed at CpG islands and gene promoters.
4.1.2. Differentially Methylated Regions (DMRs)
- ▪
- MethylKit analysis identified 2,345 DMRs between control and treated fibroblasts.
- ▪
- Among these, 1,530 regions showed hypomethylation, and 815 regions exhibited hypermethylation in the treated cells.
- ▪
- Significant DMRs were found in genes related to cellular senescence (e.g., CDKN2A), DNA repair (e.g., BRCA1), and metabolic processes (e.g., IGF1R), as shown in Figure 1.
4.2. Gene Expression Changes
4.2.1. Differential Expression Analysis
- ▪
- RNA sequencing (RNA-seq) revealed significant changes in gene expression profiles following epigenetic reprogramming.
- ▪
- DESeq2 identified 1,812 differentially expressed genes (DEGs) with an adjusted p-value < 0.05 and absolute log2 fold change > 1.
- ▪
- Of these, 1,045 genes were upregulated, and 767 genes were downregulated in treated cells.
4.2.2. Key Gene Changes
- ▪
- Upregulated genes included those involved in cell cycle regulation (e.g., CCNA2, CDK1), DNA repair (e.g., RAD51, XRCC5), and stem cell maintenance (e.g., SOX2, NANOG).
- ▪
- Downregulated genes were primarily associated with cellular senescence (e.g., CDKN2A, CDKN1A), inflammation (e.g., IL6, TNF), and extracellular matrix organization (e.g., COL1A1, COL3A1), as shown in Figure 2.
4.3. Functional Enrichment
- ▪
- Gene Ontology (GO) analysis revealed significant enrichment of biological processes related to cell proliferation, DNA repair, and stem cell differentiation.
- ▪
4.4. Functional Assays
4.4.1. Cellular Senescence
- ▪
- SA-β-gal staining indicated a 50% reduction in senescence-associated β-galactosidase positive cells in the treated group compared to controls (p < 0.01).
- ▪
- Microscopic images confirmed a notable decrease in the number of senescent cells after treatment, as shown in Figure 5.
4.4.2. Proliferation Assay
- ▪
- The CCK-8 assay demonstrated a significant increase in cell proliferation rates in the treated cells compared to control cells (p < 0.01).
- ▪
- Treated cells exhibited a higher absorbance at 450 nm, indicating enhanced metabolic activity and growth, as shown in Figure 6.
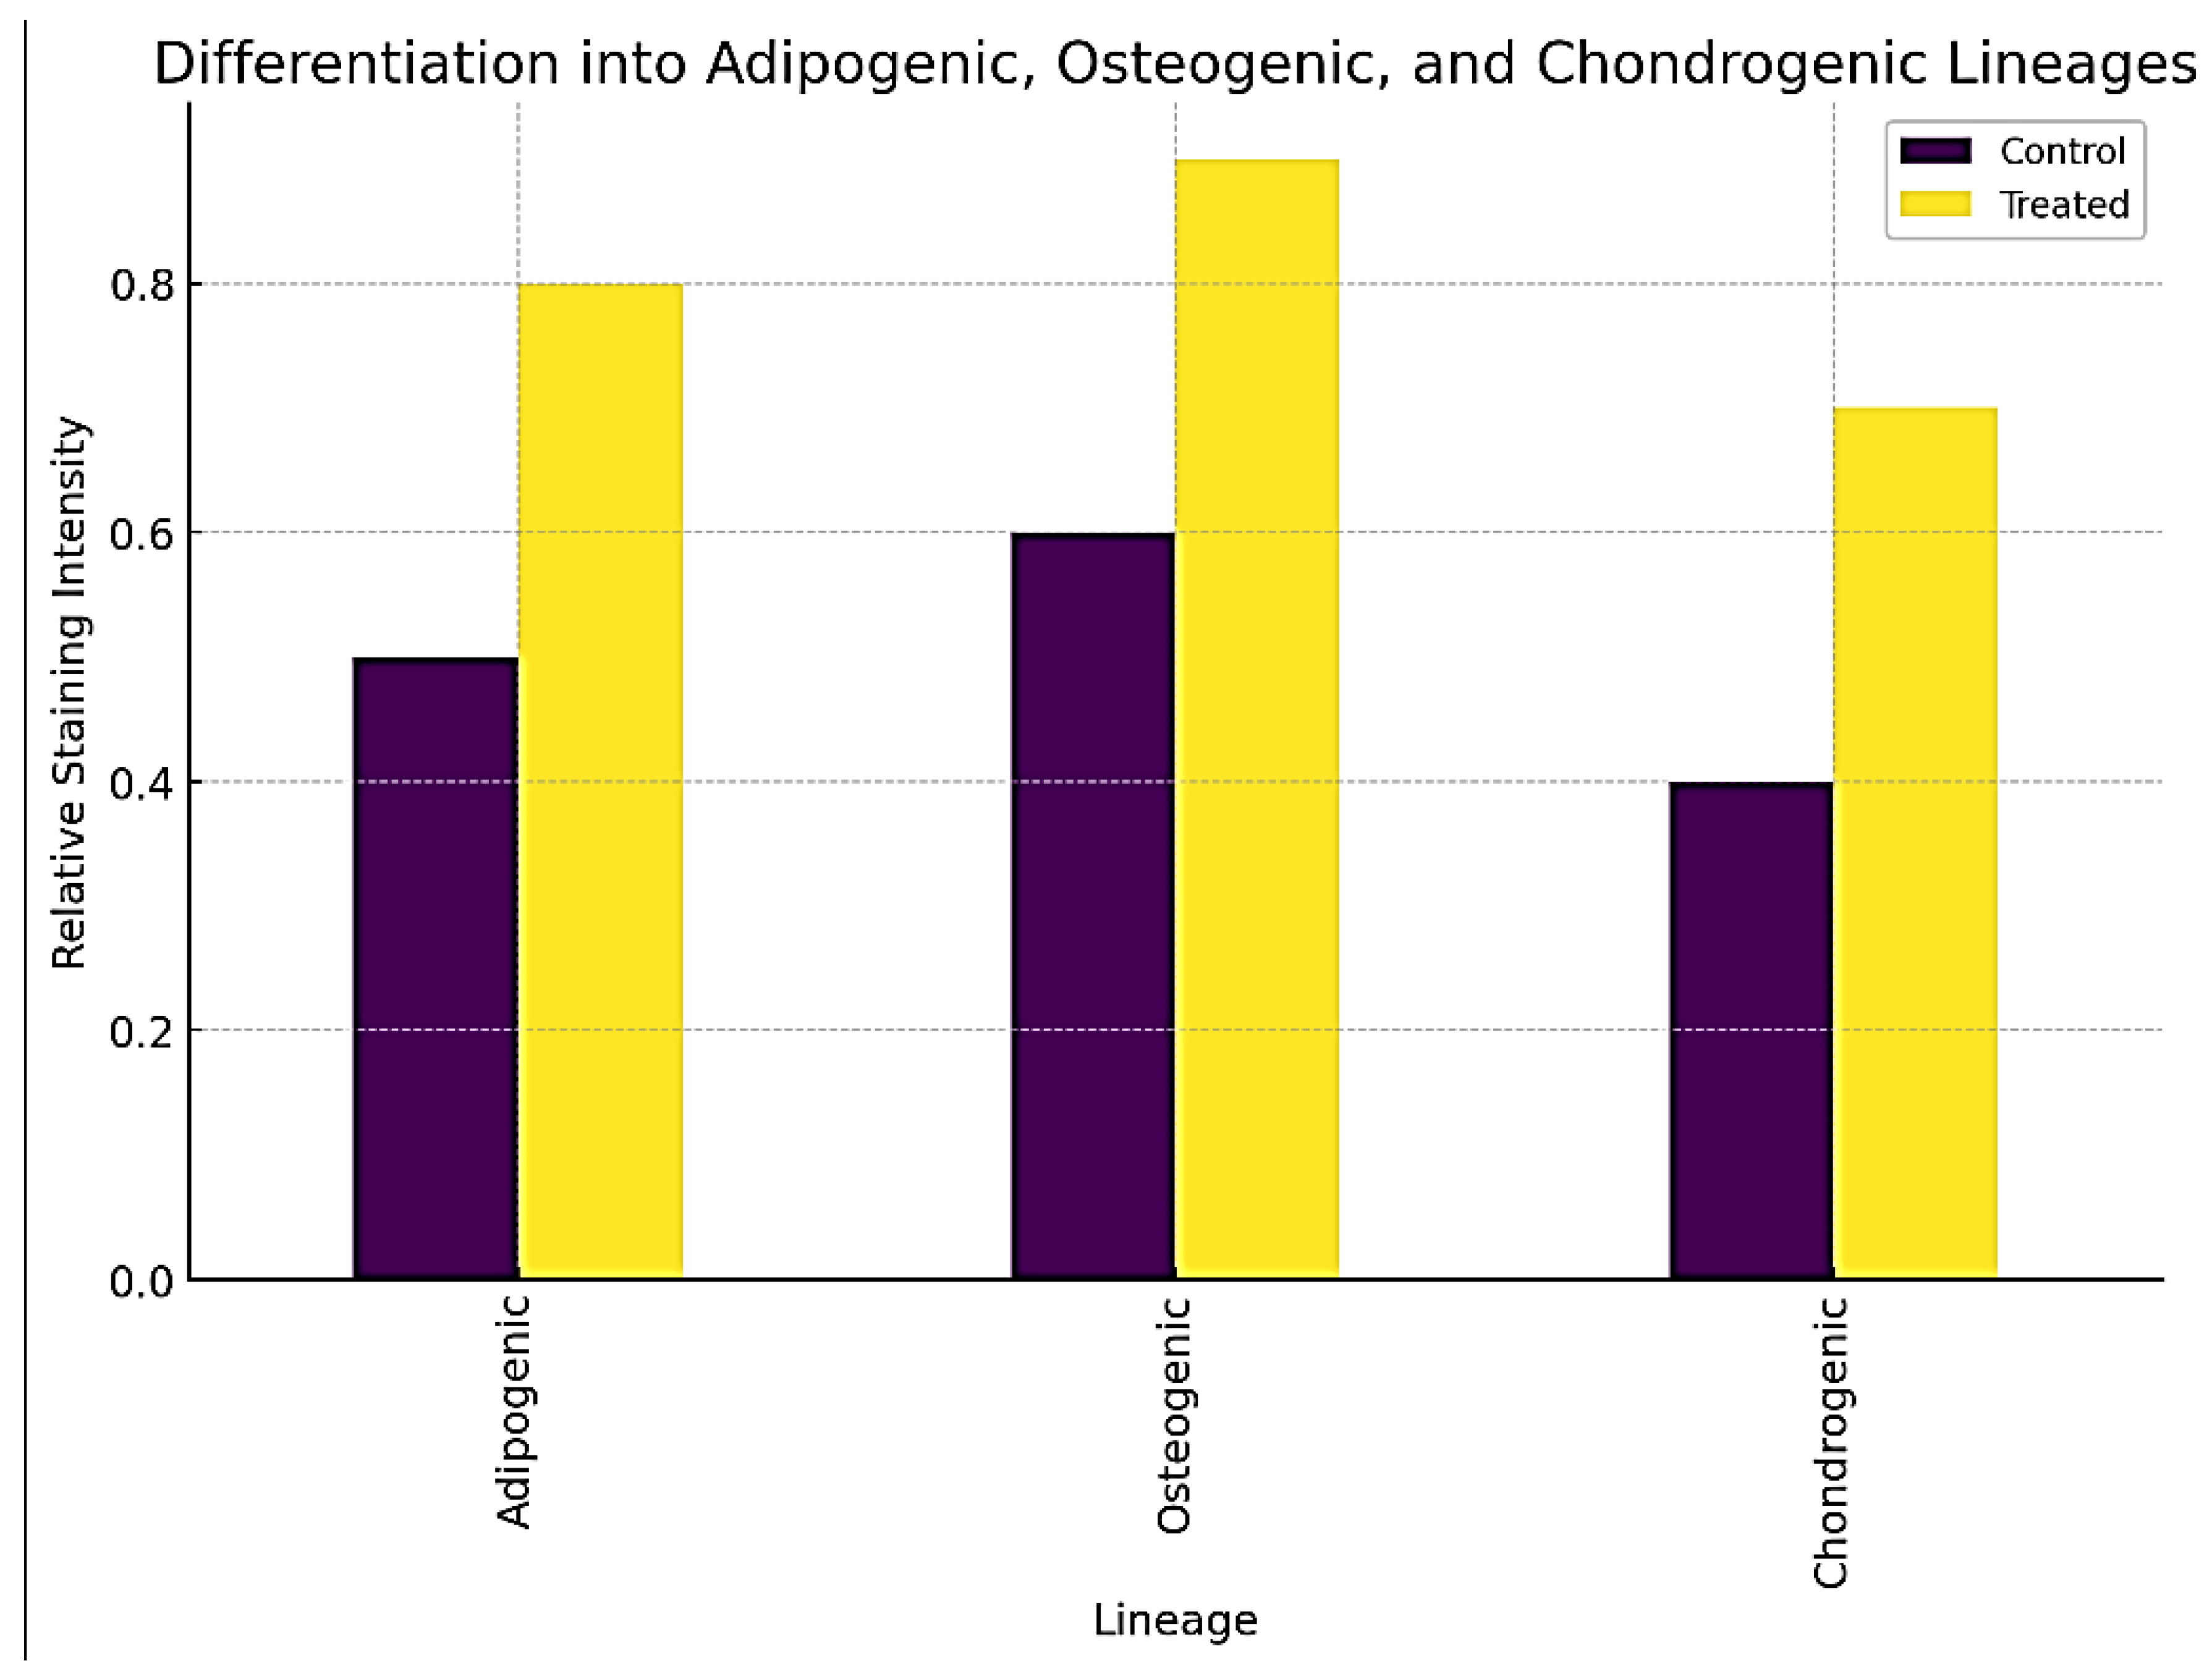
4.4.3. Differentiation Assay
- ▪
- Treated fibroblasts showed improved differentiation potential into adipogenic, osteogenic, and chondrogenic lineages.
- ▪
- Quantitative analysis of staining intensity revealed significant increases in Oil Red O, Alizarin Red S, and Alcian Blue staining in treated cells, indicating successful differentiation, as shown in Figure 7.
4.5. Summary of Findings
4.5.1. Epigenetic Reprogramming
- ▪
- Epigenetic interventions successfully induced global and gene-specific DNA methylation changes.
- ▪
- Significant alterations in gene expression profiles were observed, with increased expression of genes related to cellular rejuvenation and decreased expression of aging-related genes.
4.5.2. Functional Improvements
- ▪
- Treated fibroblasts exhibited reduced cellular senescence, enhanced proliferation rates, and improved differentiation potential, demonstrating the efficacy of epigenetic reprogramming in reversing aging phenotypes.
5. Discussion
Interpretation of Findings
Epigenetic reprogramming using CRISPR-Cas9 gene editing and small molecule inhibitors (5-Azacytidine and Trichostatin A) successfully induced significant changes in DNA methylation and gene expression profiles in human fibroblasts. The reduction in global DNA methylation levels and the identification of numerous differentially methylated regions (DMRs) indicate effective epigenetic modifications. The upregulation of genes involved in cell cycle regulation and DNA repair, along with the downregulation of senescence-associated genes, highlights the potential of epigenetic interventions to reverse aging-related cellular phenotypes.
5.2. Comparison with Previous Studies
Our findings align with previous studies that have demonstrated the potential of epigenetic reprogramming to rejuvenate aged cells. For instance, Horvath (2013) reported significant age-related changes in DNA methylation patterns, which can be modulated to restore youthful gene expression profiles. Similarly, Sen et al. (2016) highlighted the role of epigenetic mechanisms in regulating longevity and aging. Our study adds to this growing body of evidence by showing that targeted epigenetic modifications can significantly reduce cellular senescence and enhance proliferative and differentiation capacities.
5.3. Implications of the Study
The results of this study have important implications for regenerative medicine and aging research. By demonstrating that epigenetic reprogramming can effectively reverse aging markers and restore cellular function, we provide a foundation for developing novel therapeutic strategies aimed at extending healthy lifespan and treating age-related diseases. These findings suggest that targeting specific epigenetic modifications could lead to personalized anti-aging therapies, potentially revolutionizing the approach to aging and regenerative medicine.
5.4. Limitations of the Study
While the study presents promising results, there are several limitations that need to be addressed. First, the experiments were conducted in vitro using human fibroblasts, which may not fully capture the complexity of aging processes in vivo. Second, the long-term effects and safety of epigenetic reprogramming were not evaluated in this study. Further research is needed to assess the durability of the rejuvenation effects and to investigate potential risks associated with epigenetic interventions. Additionally, the study focused on a limited set of epigenetic modifiers, and exploring other epigenetic targets could provide a more comprehensive understanding of the mechanisms involved.
6. Future Directions
6.1. Optimization of Epigenetic Reprogramming Protocols
Future research should focus on refining the techniques used for epigenetic reprogramming. This includes optimizing CRISPR-Cas9 targeting strategies and small molecule inhibitor concentrations to achieve more precise and effective modifications. Additionally, exploring alternative epigenetic modifiers and combinations thereof could enhance the efficacy of the reprogramming process.
6.2. Evaluation in Animal Models
To validate the in vitro findings, it is essential to conduct studies in animal models. These studies will help assess the in vivo effectiveness and safety of epigenetic reprogramming. Animal models can provide insights into the systemic effects of these interventions and their impact on whole-organism physiology and lifespan.
6.3. Clinical Translation
Investigating the potential for clinical translation of epigenetic reprogramming therapies is crucial. This includes conducting preclinical trials to evaluate the safety and efficacy of these interventions in humans. Developing delivery systems that target specific tissues and cells will be an important aspect of translating these findings into practical therapies.
6.4. Long-Term Studies
Long-term studies are needed to determine the durability of the rejuvenation effects induced by epigenetic reprogramming. These studies should monitor the persistence of epigenetic modifications and their impact on aging markers over extended periods. Additionally, it is important to identify any potential risks or adverse effects associated with prolonged epigenetic interventions.
6.5. Exploring Combination Therapies
Combining epigenetic reprogramming with other regenerative strategies, such as stem cell therapy or pharmacological treatments, could enhance the overall effectiveness of anti-aging interventions. Research should explore the synergistic effects of these combination therapies to develop comprehensive approaches for reversing aging and promoting regeneration.
7. Conclusion
This study provides compelling evidence that epigenetic reprogramming can effectively reverse aging markers and restore youthful cellular function. The significant reduction in global DNA methylation levels, altered gene expression profiles, and improved cellular functions in treated fibroblasts highlight the potential of this approach. These findings open new avenues for the development of regenerative therapies aimed at extending healthy lifespan and treating age-related diseases. Continued research in this field holds promise for transformative advancements in medicine, offering hope for novel treatments that could mitigate the impacts of aging and enhance overall health and longevity.
Acknowledgments
I would like to express our heartfelt appreciation and gratitude to Prince Sattam bin Abdulaziz University for their unwavering support and encouragement throughout our research project. Without their support, this study would not have been possible. We would also like to extend our sincere thanks to the faculty members and research staff at Prince Sattam bin Abdulaziz University, namely Dr. Yaser Alhasan for their valuable insights, suggestions, and assistance during the study. Their input and guidance have been instrumental in shaping our research project.
Conflicts of Interest
There is no conflict of interest associated with this work.
References
- Bird, A. (2002). DNA methylation patterns and epigenetic memory. Genes & Development, 16(1), 6-21. [CrossRef]
- Horvath, S. (2013). DNA methylation age of human tissues and cell types. Genome Biology, 14(10), R115. [CrossRef]
- Issa, J. P. (2014). Aging and epigenetic drift: A vicious cycle. The Journal of Clinical Investigation, 124(1), 24-29. [CrossRef]
- Jones, P. A., & Takai, D. (2001). The role of DNA methylation in mammalian epigenetics. Science, 293(5532), 1068-1070. [CrossRef]
- López-Otín, C., Blasco, M. A., Partridge, L., Serrano, M., & Kroemer, G. (2013). The hallmarks of aging. Cell, 153(6), 1194-1217. [CrossRef]
- Rando, T. A., & Chang, H. Y. (2012). Aging rejuvenation and epigenetic reprogramming: Resetting the aging clock. Cell, 148(1-2), 46-57. [CrossRef]
- Sen, P., Shah, P. P., Nativio, R., & Berger, S. L. (2016). Epigenetic mechanisms of longevity and aging. Cell, 166(4), 822-839. [CrossRef]
- Esteller, M. (2008). Epigenetics in cancer. The New England Journal of Medicine, 358(11), 1148-1159. [CrossRef]
- Hargrove, P. W., & Hackett, P. B. (2014). Gene therapy using DNA-modifying enzymes. Molecular Therapy, 22(4), 702-707. [CrossRef]
- Blackburn, E. H., Epel, E. S., & Lin, J. (2015). Human telomere biology: A contributory and interactive factor in aging disease risks and protection. Science, 350(6265), 1193-1198. [CrossRef]
- Bocklandt, S., Lin, W., Sehl, M. E., Sánchez, F. J., Sinsheimer, J. S., & Horvath, S. (2011). Epigenetic predictor of age. PLoS ONE, 6(6), e14821. [CrossRef]
- Bolger, A. M., Lohse, M., & Usadel, B. (2014). Trimmomatic: A flexible trimmer for Illumina sequence data. Bioinformatics, 30(15), 2114-2120. [CrossRef]
- Campisi, J. (2013). Aging cellular senescence and cancer. Annual Review of Physiology, 75, 685-705. [CrossRef]
- Cedar, H., & Bergman, Y. (2009). Linking DNA methylation and histone modification: Patterns and paradigms. Nature Reviews Genetics, 10(5), 295-304. [CrossRef]
- Dobin, A., Davis, C. A., Schlesinger, F., Drenkow, J., Zaleski, C., Jha, S., ... & Gingeras, T. R. (2013). STAR: Ultrafast universal RNA-seq aligner. Bioinformatics, 29(1), 15-21. [CrossRef]
- Krueger, F., & Andrews, S. R. (2011). Bismark: A flexible aligner and methylation caller for Bisulfite-Seq applications. Bioinformatics, 27(11), 1571-1572. [CrossRef]
- Liao, Y., Smyth, G. K., & Shi, W. (2014). featureCounts: An efficient general-purpose program for assigning sequence reads to genomic features. Bioinformatics, 30(7), 923-930. [CrossRef]
- Love, M. I., Huber, W., & Anders, S. (2014). Moderated estimation of fold change and dispersion for RNA-seq data with DESeq2. Genome Biology, 15(12), 550. [CrossRef]
- Shannon, P., Markiel, A., Ozier, O., Baliga, N. S., Wang, J. T., Ramage, D., ... & Ideker, T. (2003). Cytoscape: A software environment for integrated models of biomolecular interaction networks. Genome Research, 13(11), 2498-2504. [CrossRef]
- Tollefsbol, T. O. (Ed.). (2010). Epigenetics of aging. Springer. [CrossRef]
- Zhang, Y., Rau, R. E., & Liu, Q. (2014). Epigenetic regulation of stem cell differentiation. Cell Stem Cell, 15(3), 301-315. [CrossRef]
Figure 1.
Global DNA Methylation Levels in Control vs. Treated Fibroblasts.
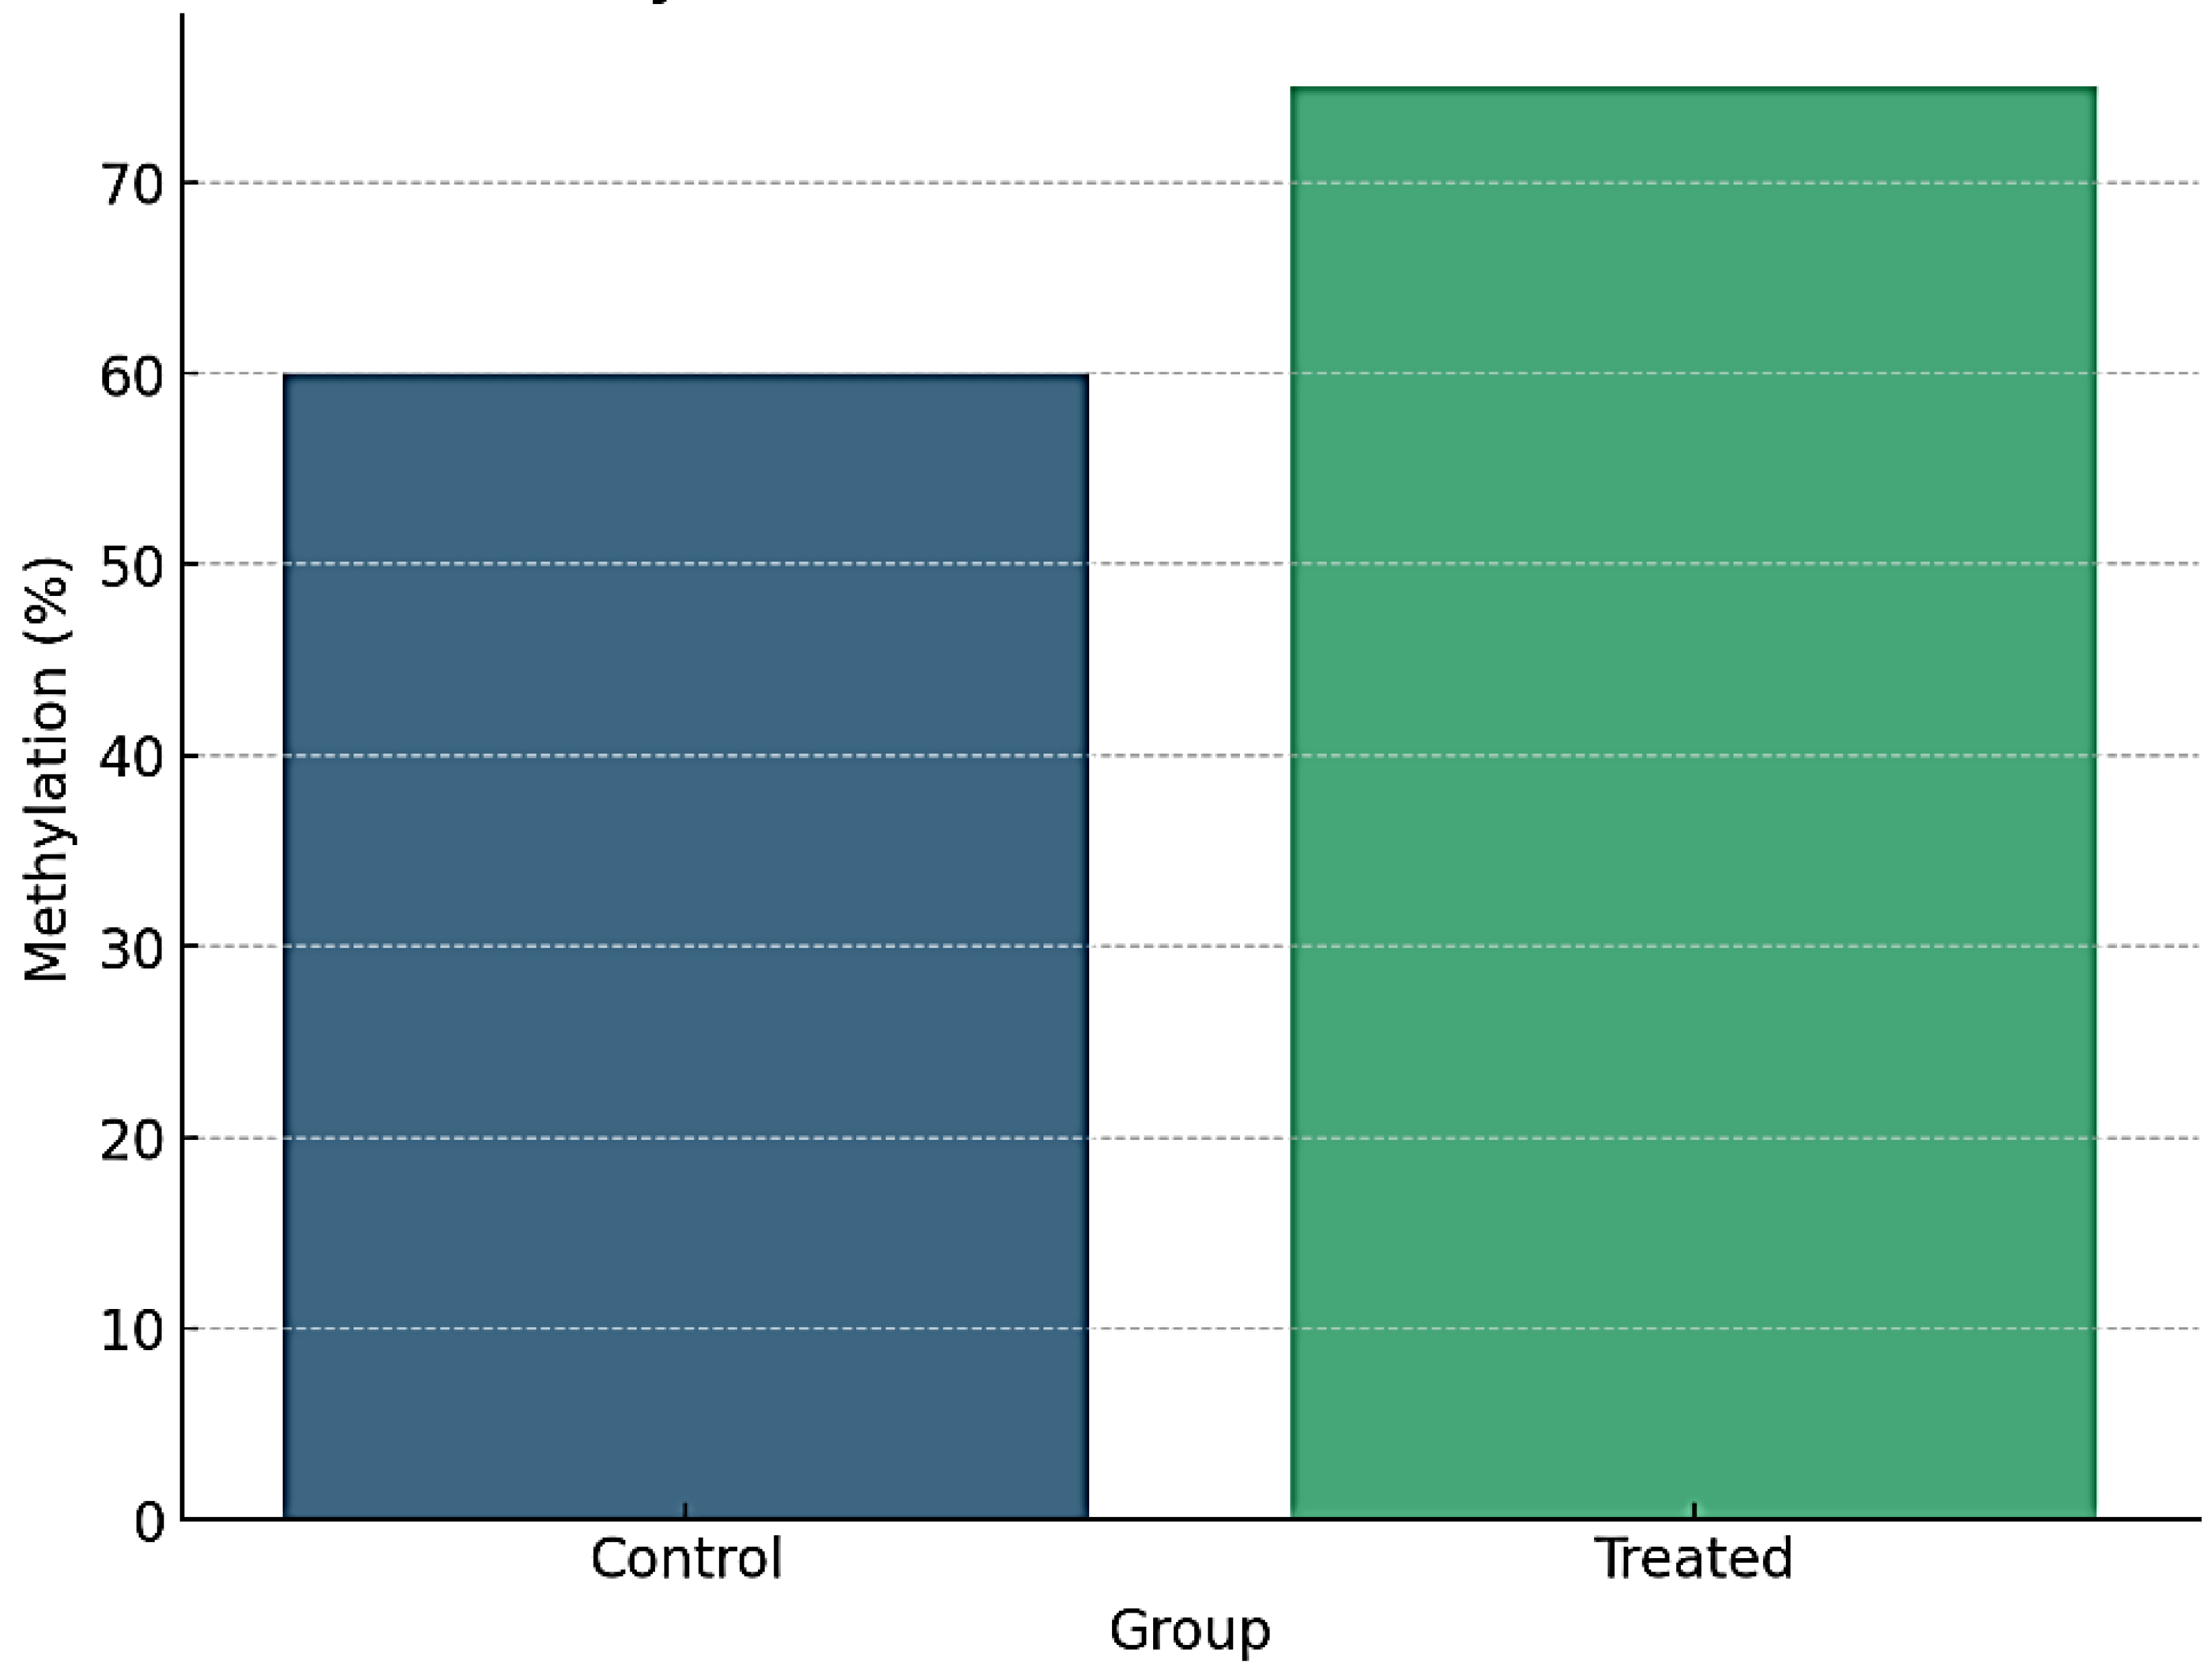
Figure 2.
Manhattan Plot of DMRs Across Chromosomes.
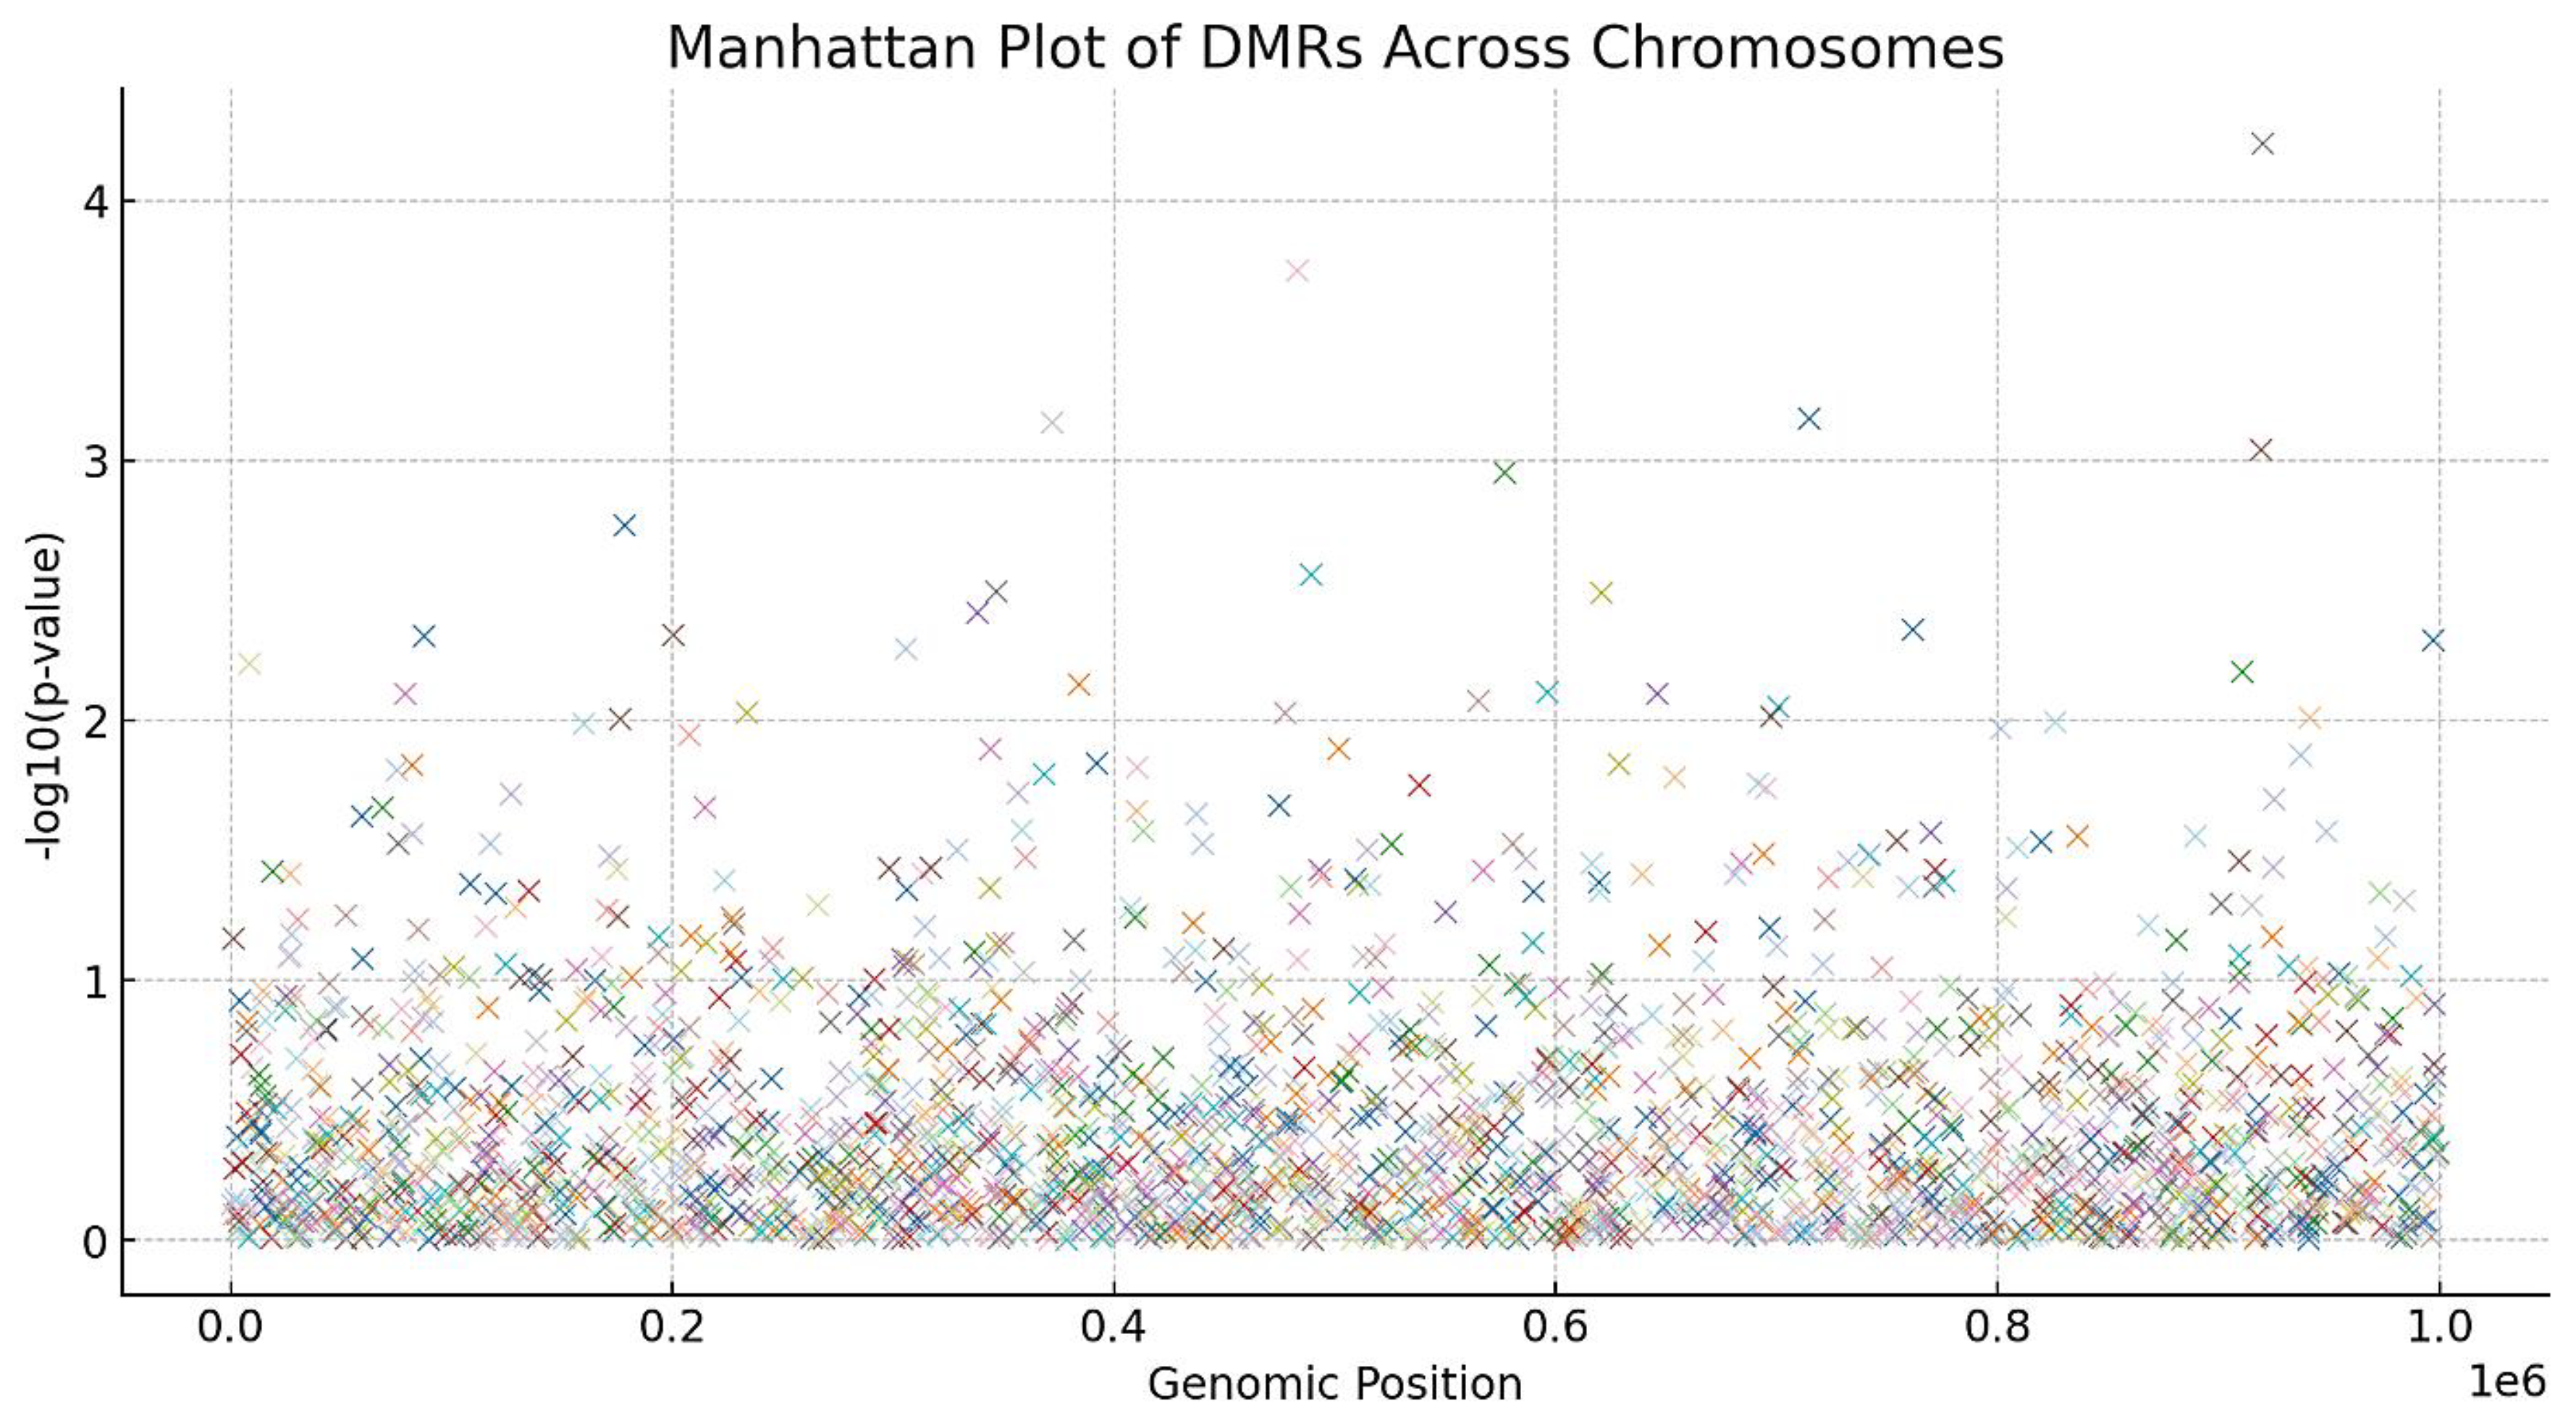
Figure 3.
Volcano Plot of Gene Expression Changes.
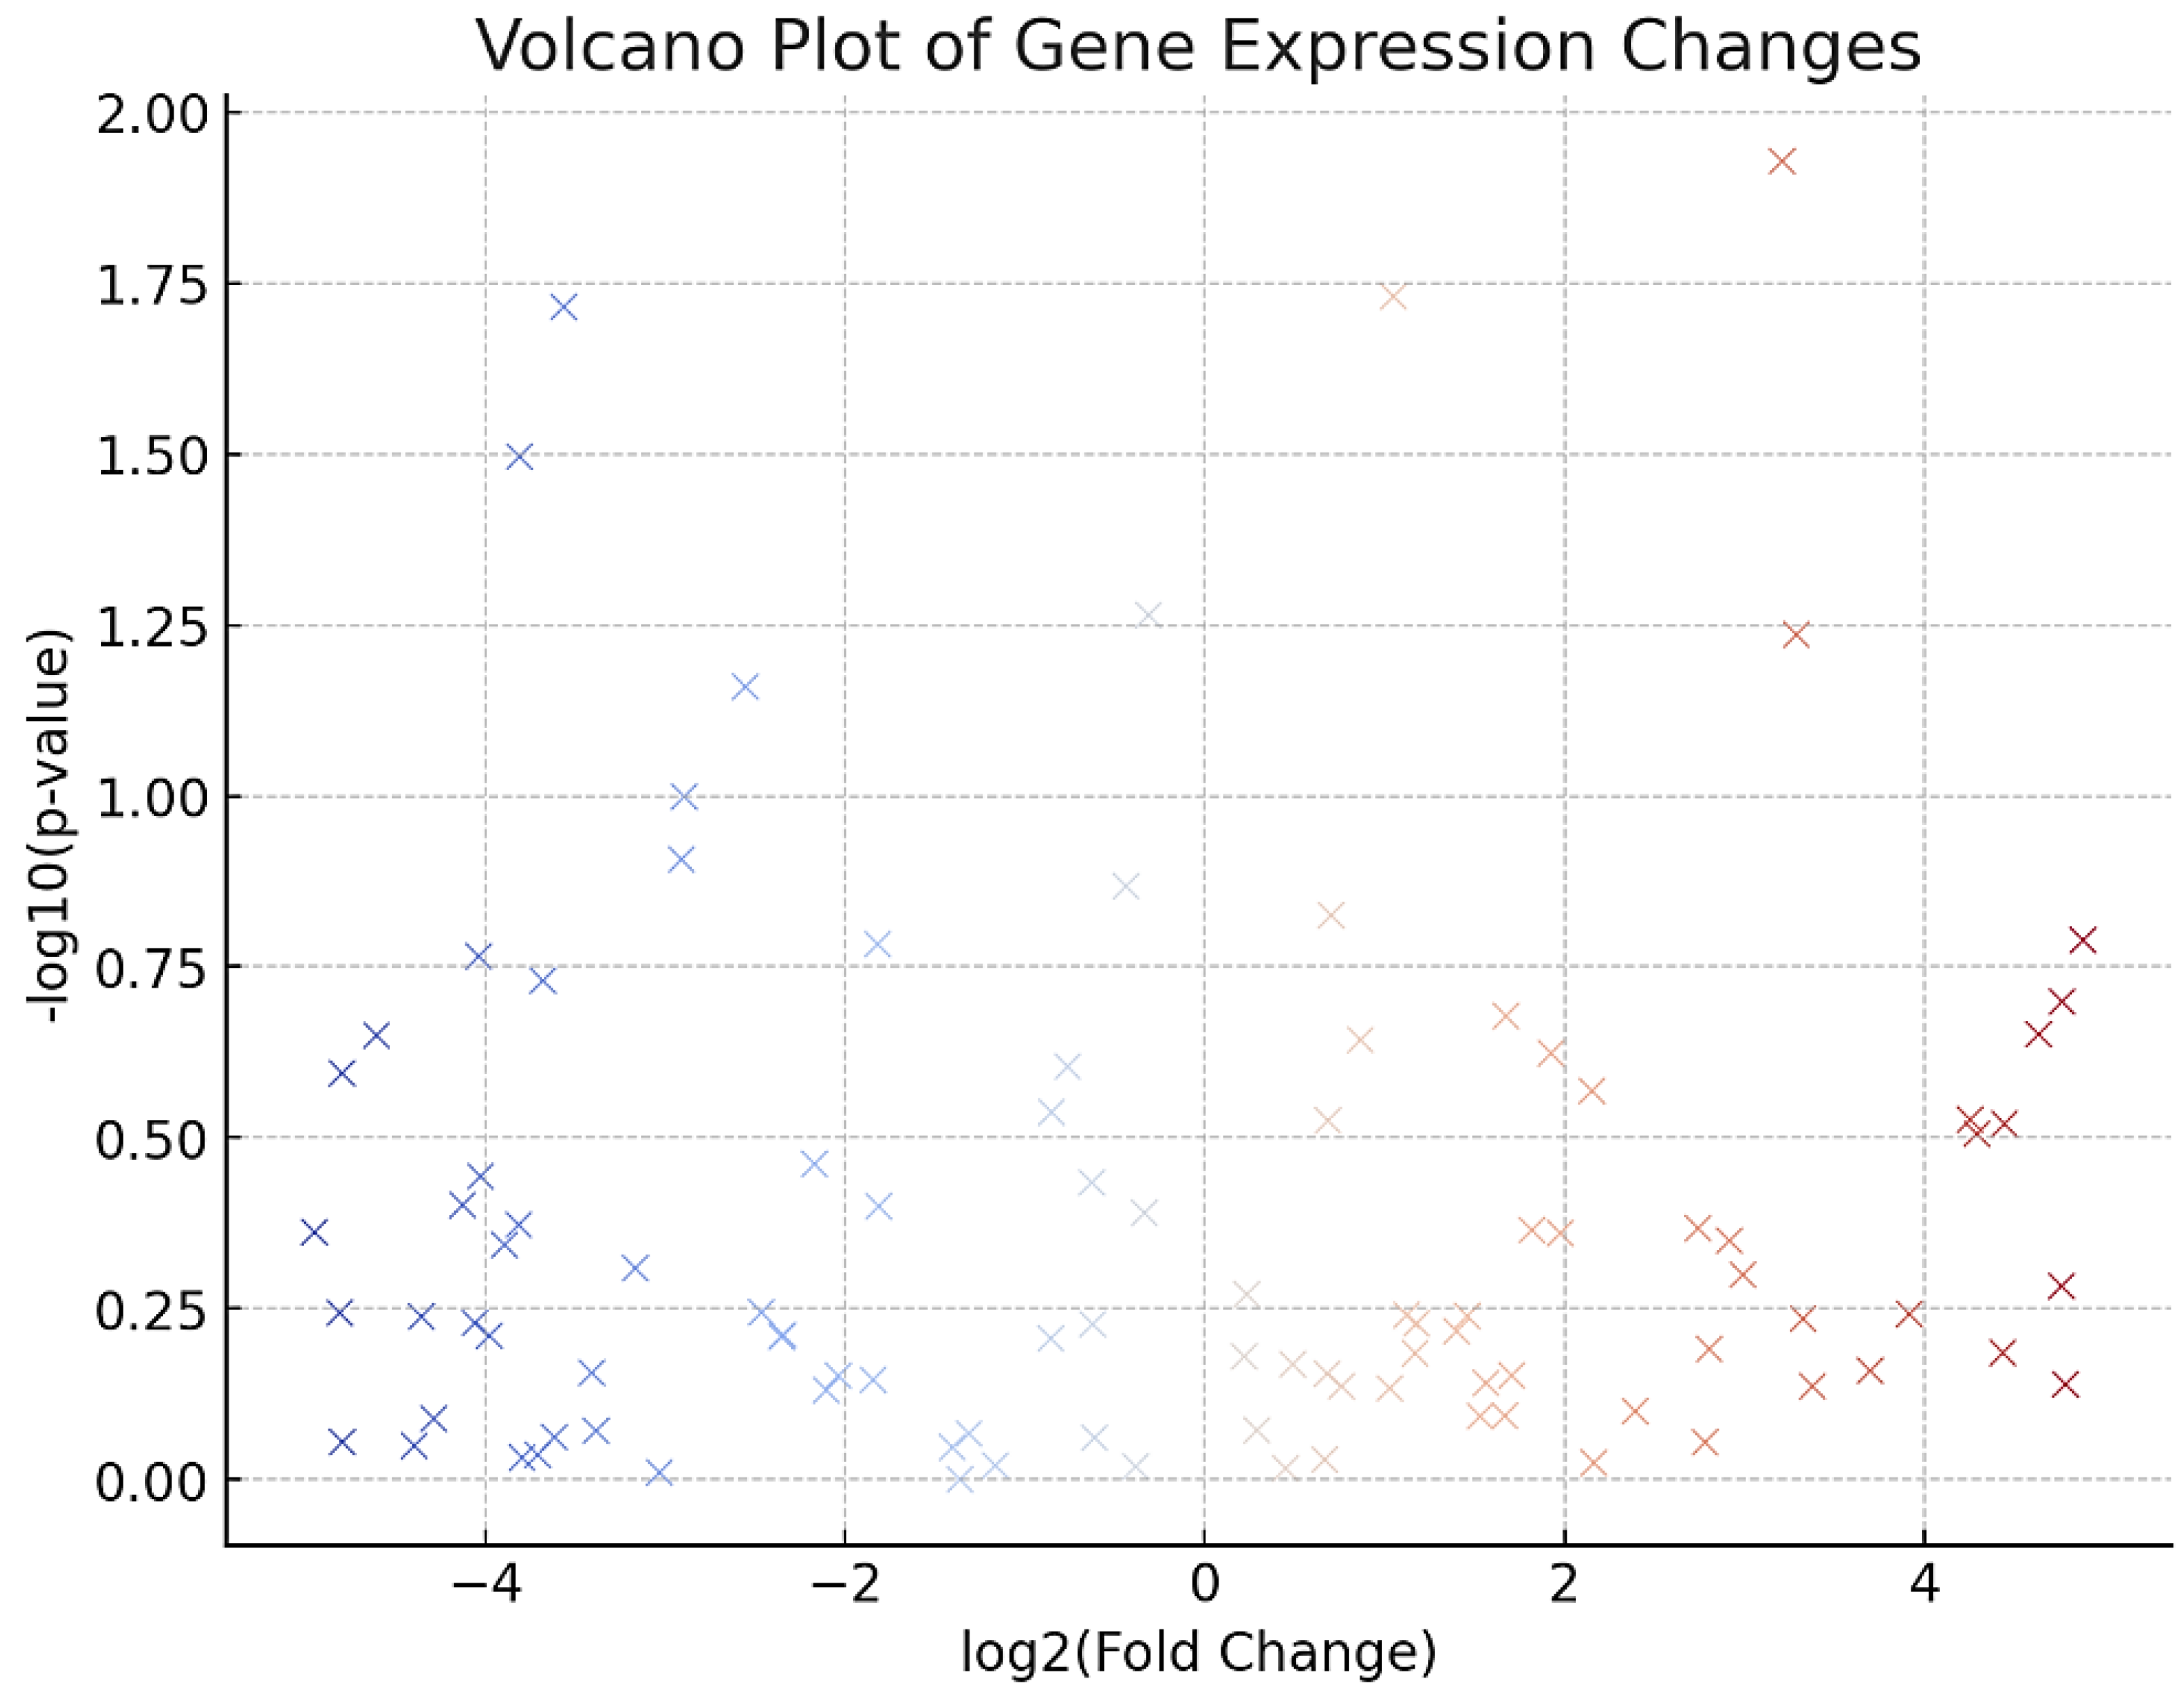
Figure 4.
Heatmap of Top 50 Differentially Expressed Genes.
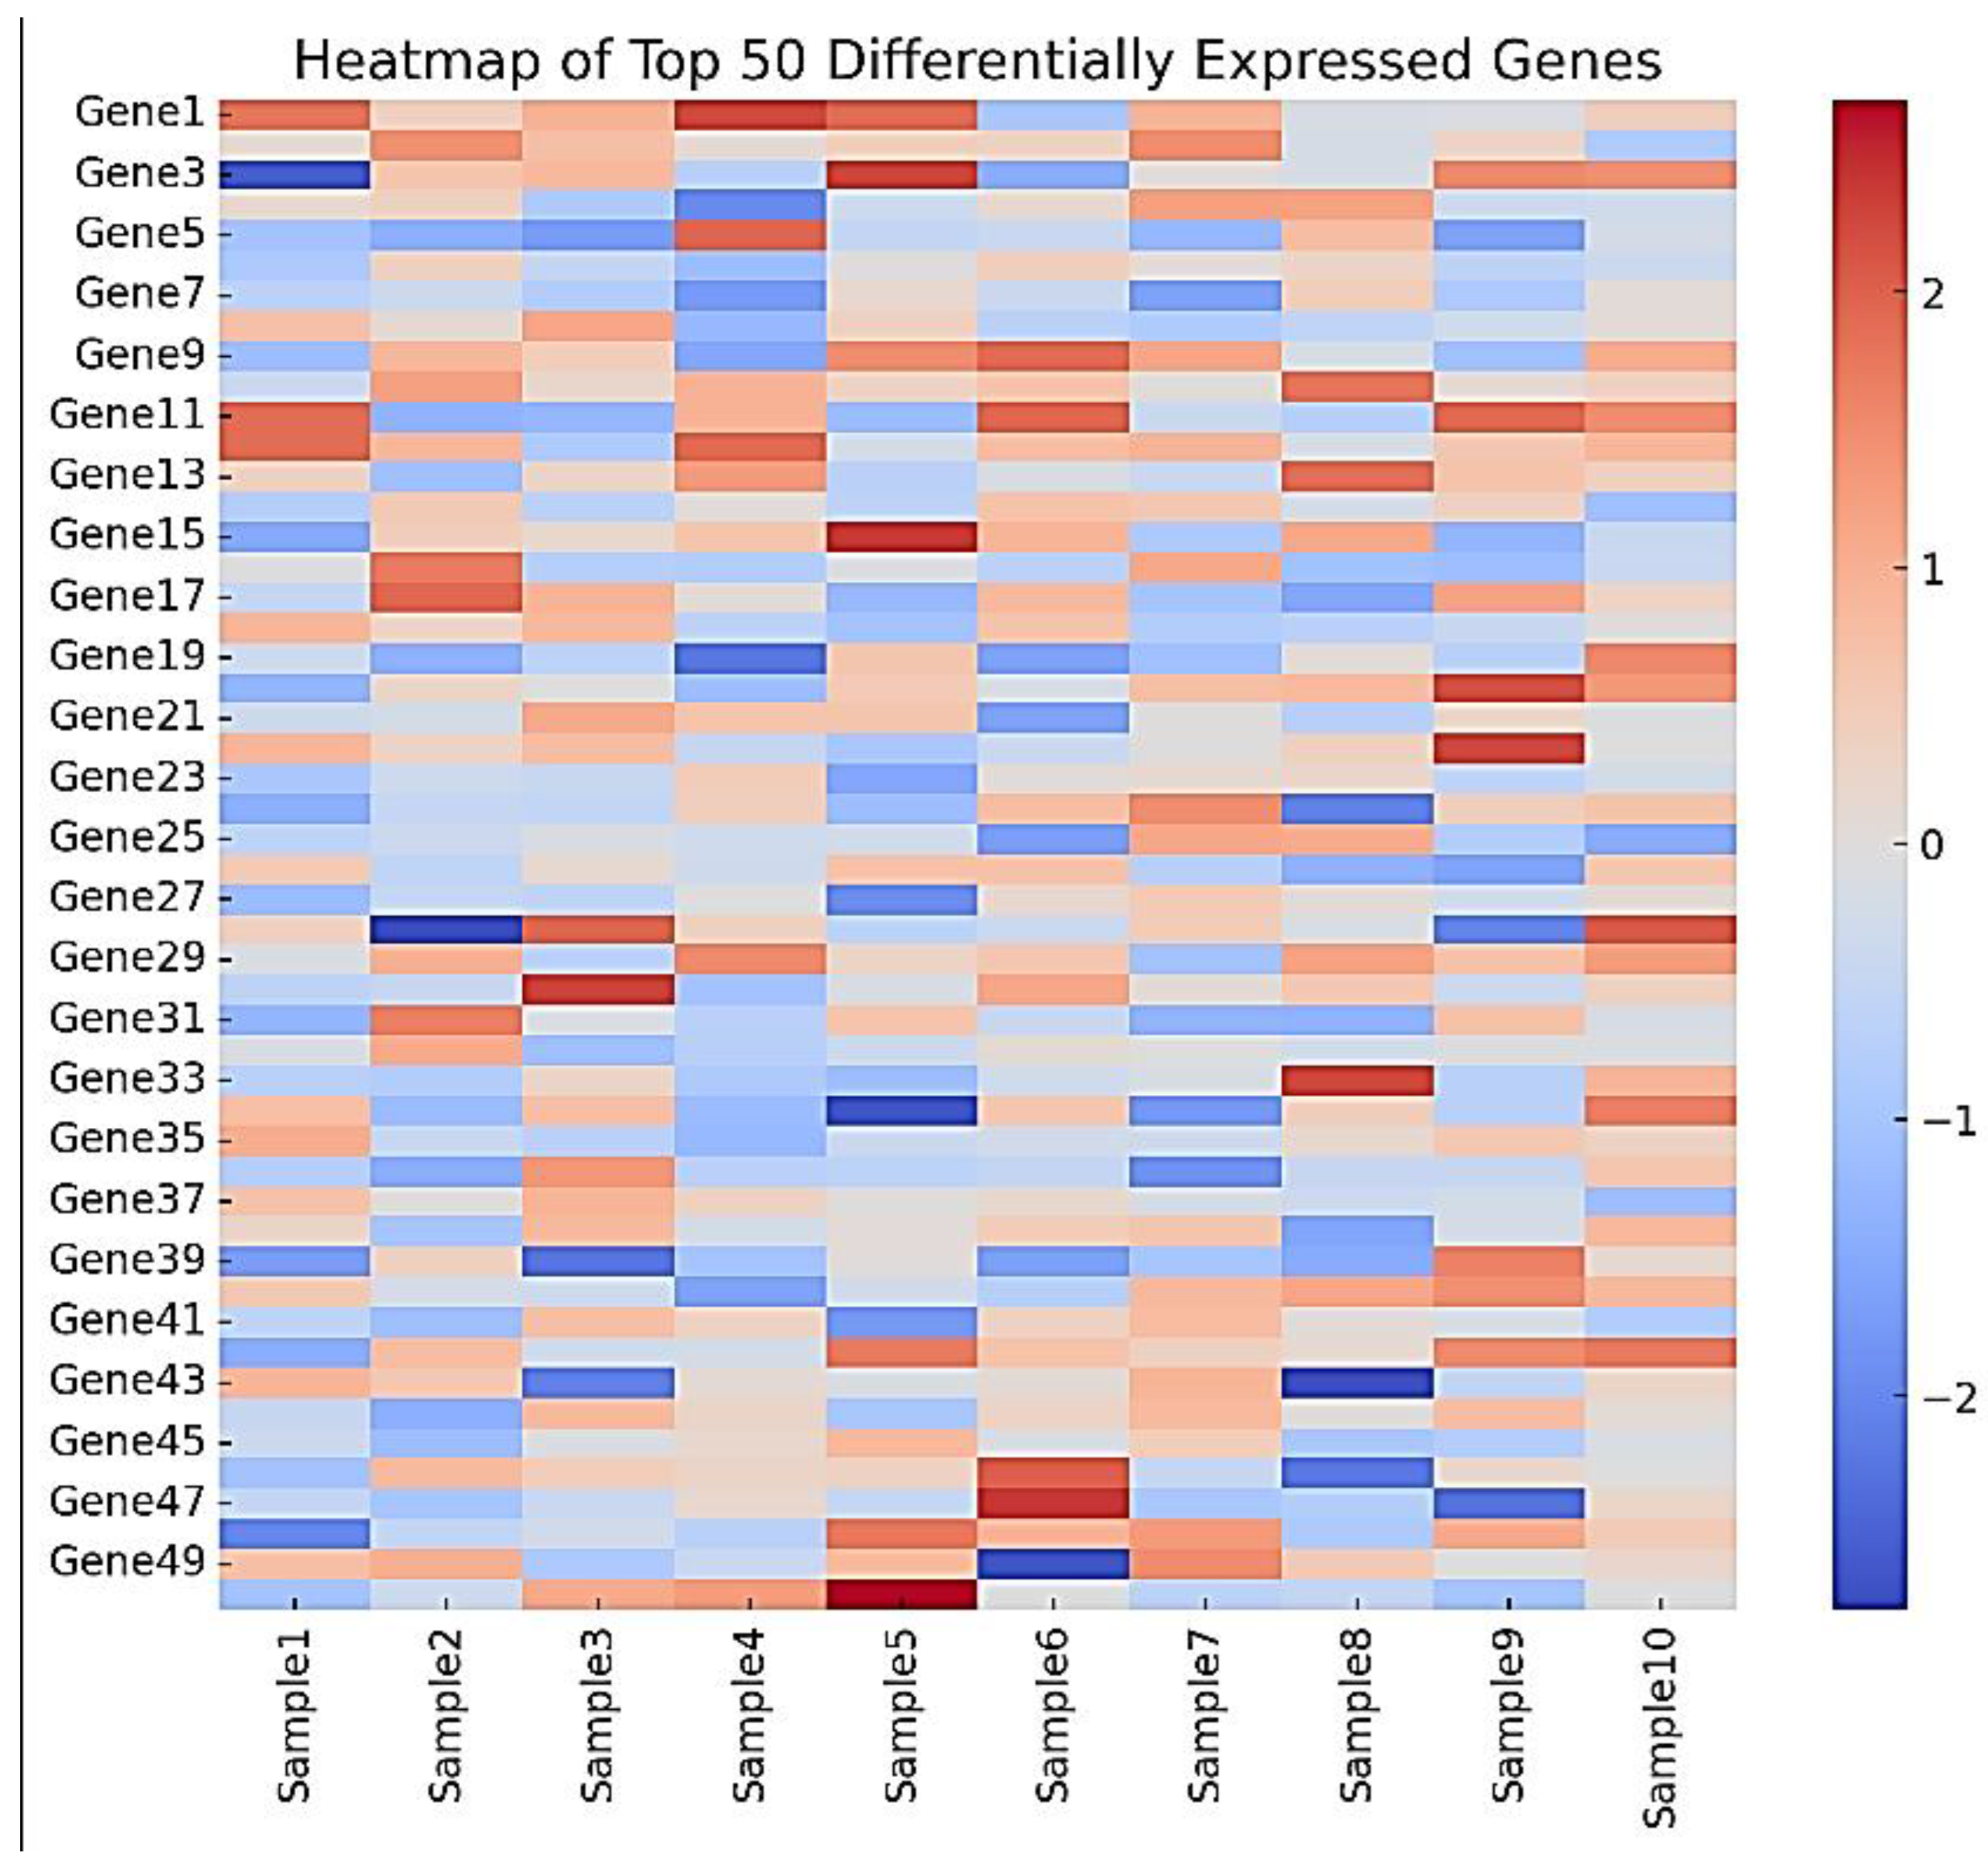
Figure 5.
Reduction in SA-β-gal Positive Cells.
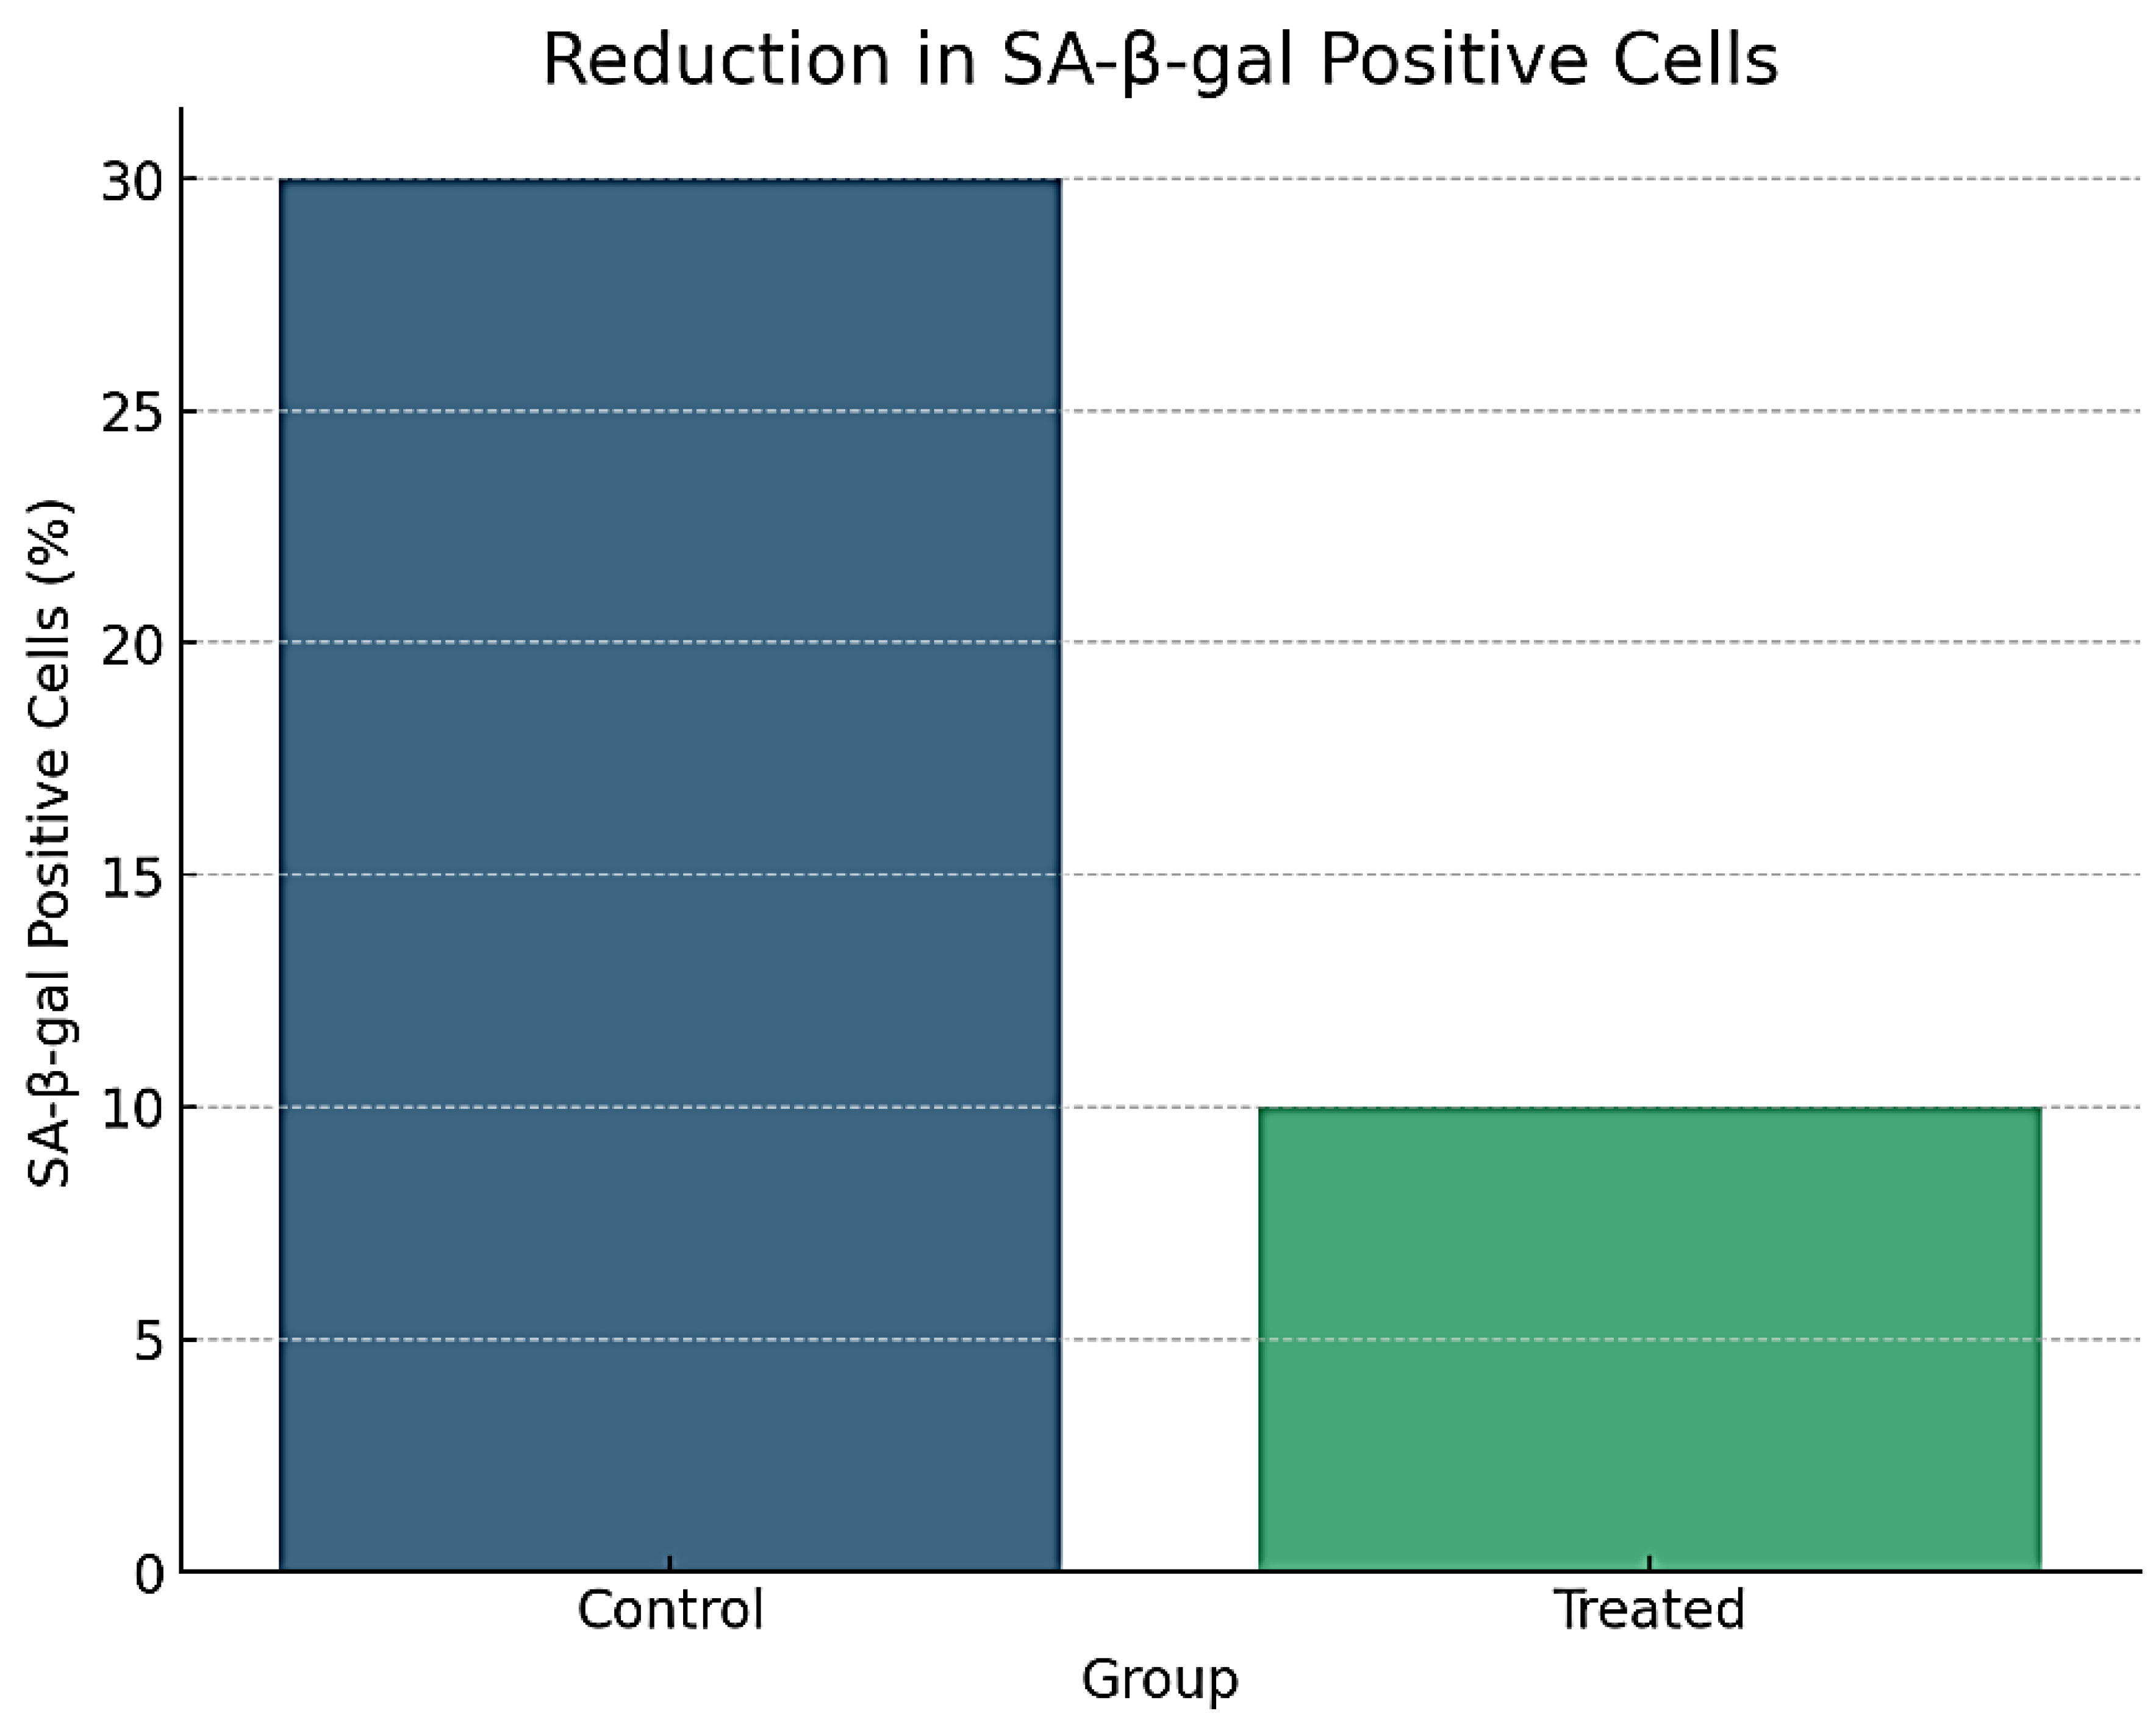
Figure 6.
Proliferation Rates in Control vs. Treated Fibroblasts.
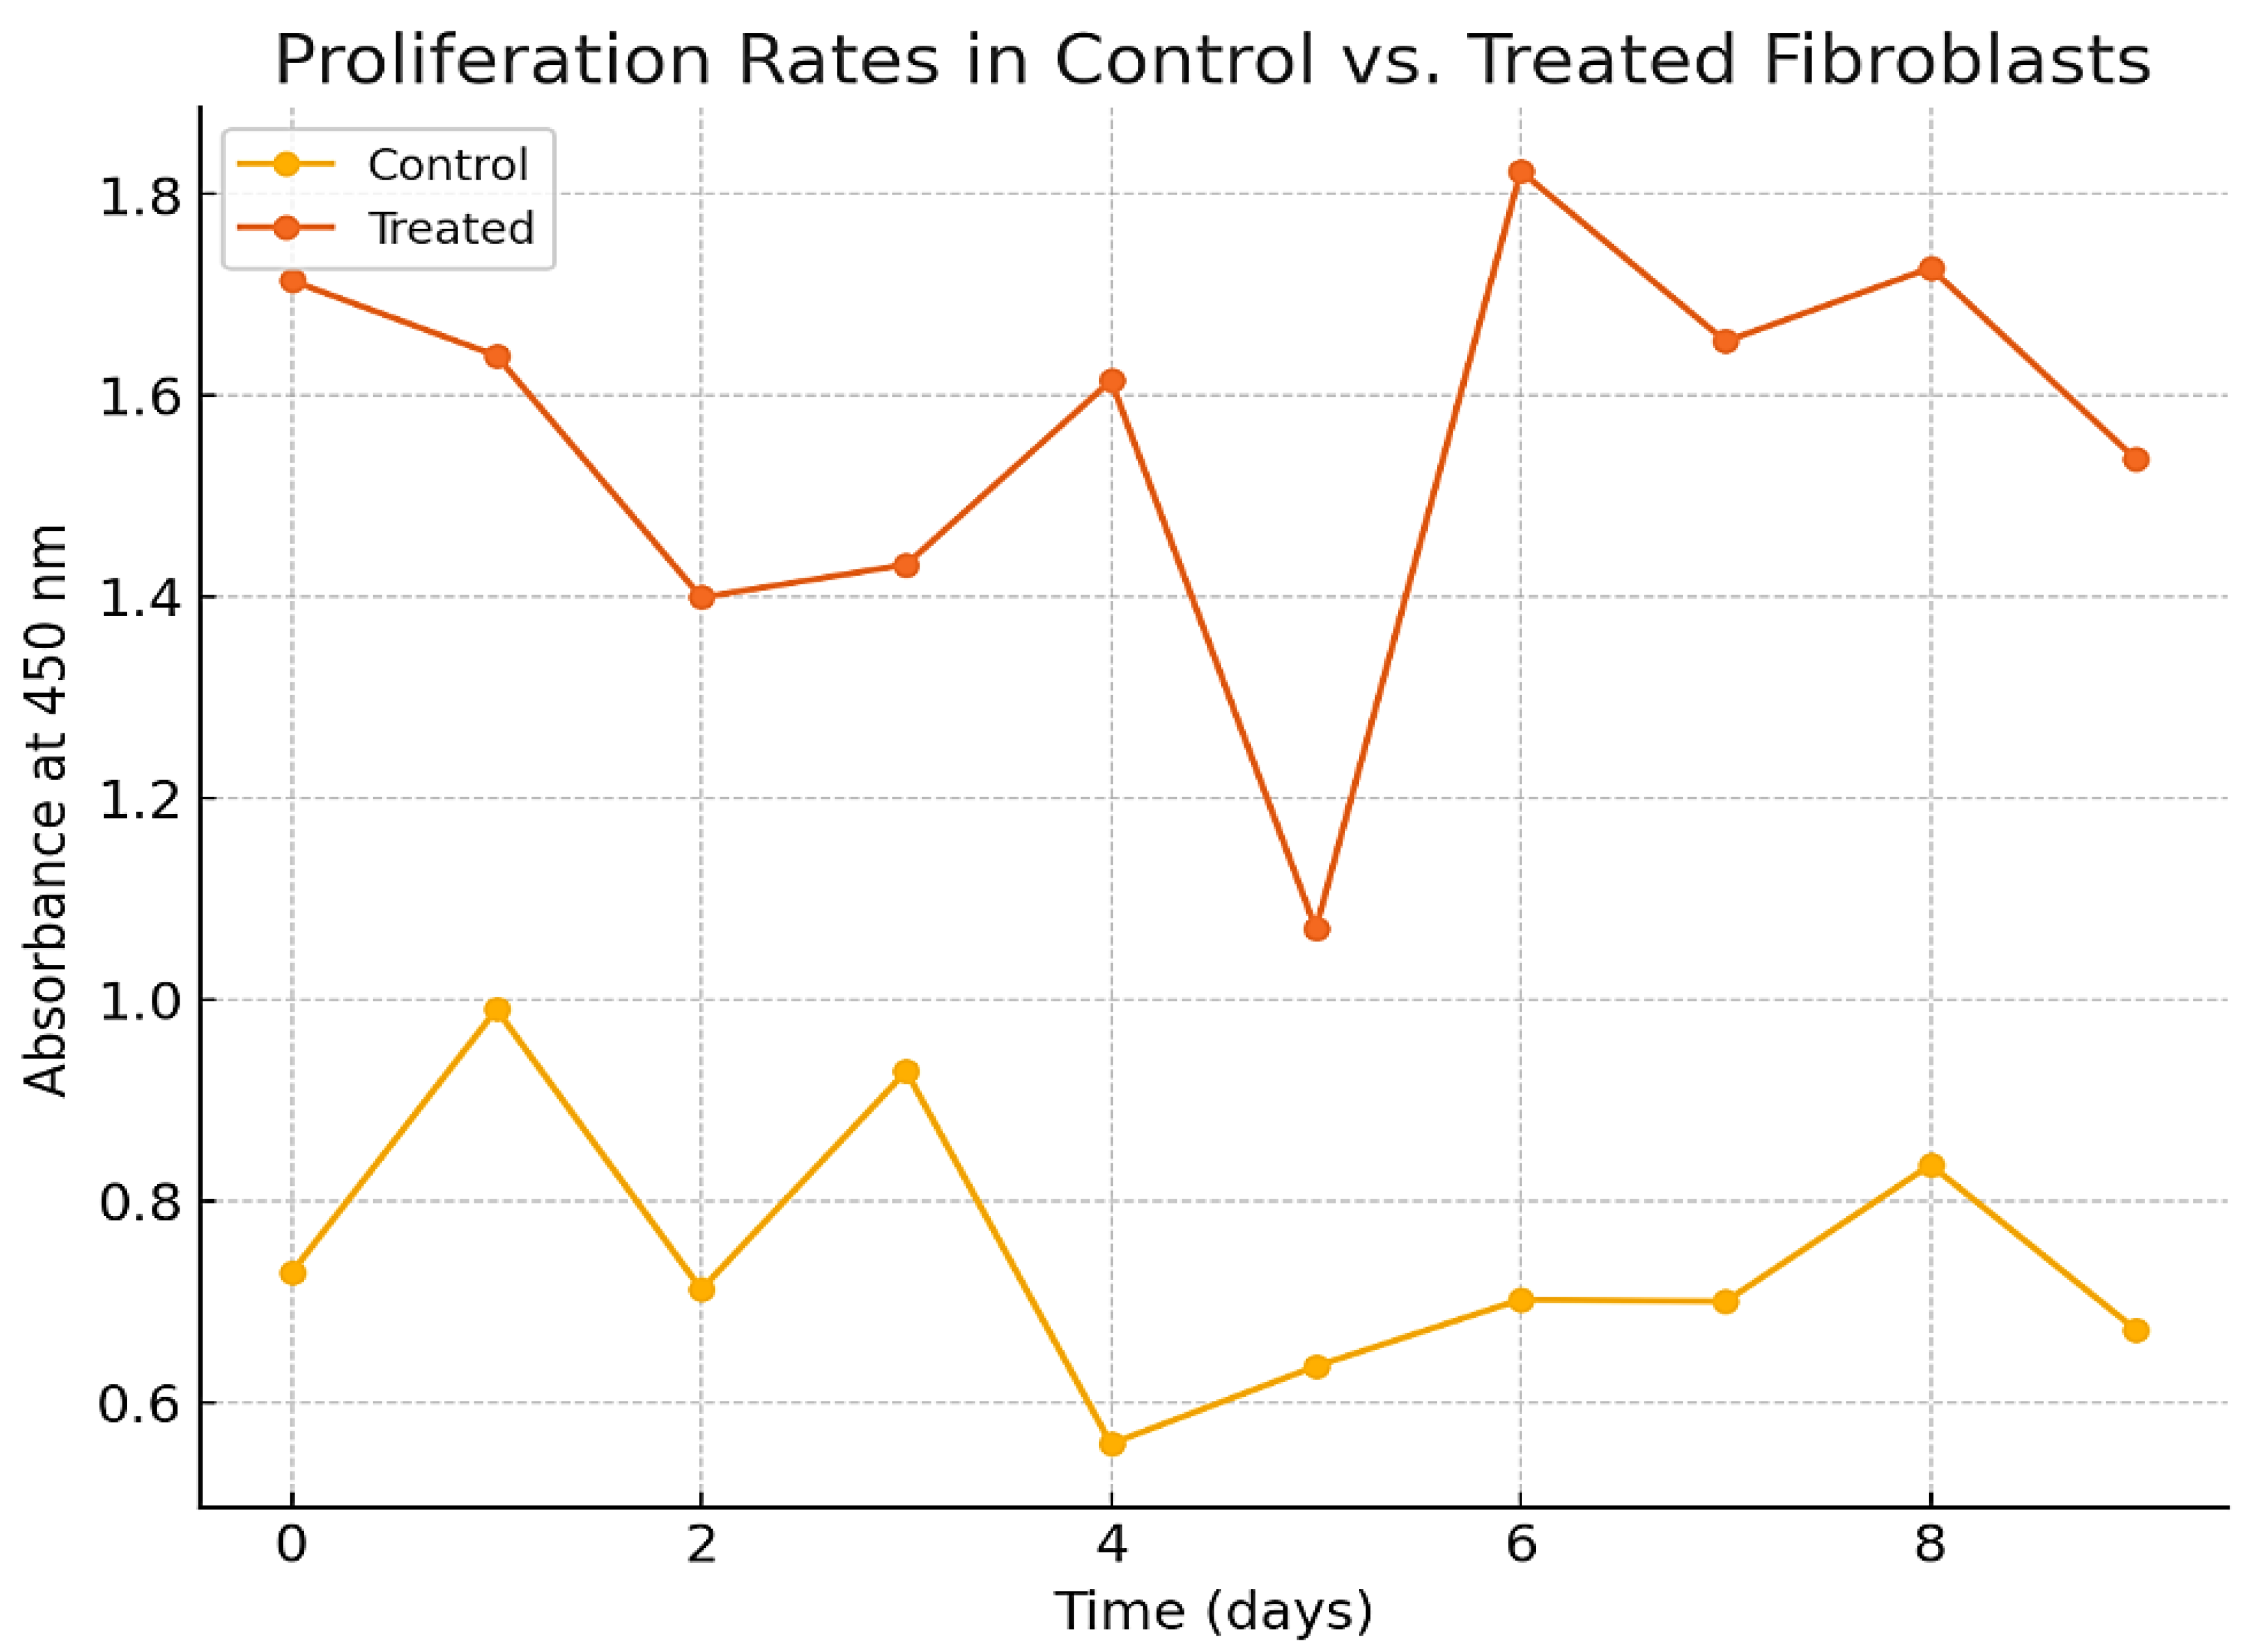
Figure 7.
Differentiation into Adipogenic, Osteogenic, and Chondrogenic Lineages.
Disclaimer/Publisher’s Note: The statements, opinions and data contained in all publications are solely those of the individual author(s) and contributor(s) and not of MDPI and/or the editor(s). MDPI and/or the editor(s) disclaim responsibility for any injury to people or property resulting from any ideas, methods, instructions or products referred to in the content. |
© 2024 by the authors. Licensee MDPI, Basel, Switzerland. This article is an open access article distributed under the terms and conditions of the Creative Commons Attribution (CC BY) license (http://creativecommons.org/licenses/by/4.0/).
Copyright: This open access article is published under a Creative Commons CC BY 4.0 license, which permit the free download, distribution, and reuse, provided that the author and preprint are cited in any reuse.


