
Submitted:
15 August 2024
Posted:
16 August 2024
You are already at the latest version
Abstract
The structure and diversity of tropical vegetation are shaped by biotic and abiotic factors, which function as environmental filters affecting plant performance in different spatial and temporal scales. We compared soil traits, vegetation structure and leaf traits (i.e., specific leaf area, polyphenols and chlorophyll content a/b and total) in early, intermediate and late successional stages of a tropical dry forests in southeastern Brazil. For this purpose, we measured leaf traits of the most abundant species in the same 18 plots (50 x 20m/ six per successional stage) in 2009 and 2018. We tested whether tree species growing in early forests have a greater investment in conservative traits related to chemical defenses and tolerance to desiccation compared to late-stage tree species. We observed contrasting results when comparing the chronosequence differences in leaf traits both in 2009 and 2018 and the temporal changes along this period. Specific leaf area was lower than expected for all successional stages while polyphenol content increased along time, contrary to other studies in tropical dry forests. These results suggest that contrasting environmental conditions such as soil water holding capacity and light availability are responsible of the observed pattern. Total chlorophyll content increase lightly, while the a/b chlorophyll ratio doubled in all successional stages, contrary to our hypothesis. Therefore, we suggest that the conservative-acquisitive spectrum in successional gradients of TDFs should be further investigated for a better understanding of plant community assemblages.
Keywords:
Conservative-acquisitive continuum
; Deciduous forest
; Environmental filters
; Functional strategies
; Sclerophylly
; Secondary succession
1. Introduction
Vegetation structure and diversity are affected by both biotic and abiotic factors, which operate as environmental filters at different spatial and temporal scales (Peña-Claros et al. 2012; Arruda et al. 2015; Silva et al. 2021). Therefore, it is expected that morpho-physiological plant traits associated to establishment, growth, survival and reproduction in different environments are strongly related to abiotic variables (Aguilar-Peralta et al. 2022; Vaca-Sánchez et al. 2022), constraining the occurrence and abundance of plant species across different communities (Alvarez-Añorve et al. 2012; Alves et al. 2021; Faccion et al. 2021). For example, in harsher stressful environmental conditions, stronger selective pressures can result in a lower variability of functional traits within the plant community (Violle et al. 2012; Fonseca et al. 2018; Alves et al. 2021). Thus, environmental filters may shape assemblages consisting of plant species with similar functional traits (Lebrija-Trejos et al. 2010a; Fonseca et al. 2018; Aguilar-Peralta et al. 2022). Indeed, several studies quantifying the morphological or physiological traits associated with plant performance have shown the importance of the environmental filters driving plant diversity patterns at a local scale (Alvarez-Añorve et al. 2012; Rodrigues et al. 2018; Silva et al. 2021).
Due to the dynamics of land use and cover in tropical regions, agricultural areas are frequently abandoned, generating a landscape dominated by secondary forests at different successional stages (Sanaphre et al. 2017, Mantero et al. 2020, Jakovac et al. 2021). This natural regeneration involves the gradual recolonization of disturbed areas by different species, modulated by changes in abiotic conditions such as increases in soil nutrient levels (Espírito-Santo et al. 2014, Ayala-Orozco et al. 2018, Van der Sande et al. 2023) and in forest structural complexity (i.e., greater plant height, basal area and canopy cover (Fonseca et al. 2018, Poorter et al. 2023). Understanding such process is fundamental to establish reliable indicators to distinguish successional stages of a given forest type, which is important for the enforcement of environmental policies on land use regulation (Espírito-Santo et al. 2020, Rosenfield et al. 2022) and to determine the adequacy of natural regeneration as an option in restoration programs (Chazdon et al. 2020, Crouzeilles et al. 2020).
Theories related to ecological succession in tropical regions were developed predominantly for tropical rain forests (Chazdon 2008; Lebrija-Trejos et al. 2010b, Poorter et al. 2023), but important differences in mechanisms driving natural regeneration have been documented in tropical dry forests (TDFs) (Lohbeck et al. 2013, 2015, Poorter et al. 2019, 2021). For example, in tropical rain forests, light availability is the main environmental filter determining the changes in the successional processes and species coexistence (Lebrija-Trejos et al. 2010b; Aguilar-Peralta et al. 2022). In contrast, water availability and temperature are most important in TDFs (Lebrija-Trejos et al. 2008; Aguilar-Peralta et al. 2022). Based on that, Lebrija-Trejos et al. (2010b) proposed different patterns for the variation in plant functional traits during succession in tropical rain and dry forests based on the leaf economy spectrum (LES) (Wright 2002). They hypothesized that, in rain forests, pioneer species have acquisitive leaf traits and late successional plants have conservative leaf traits associated to greater capacity of light uptake. On the other hand, TDF species would vary from conservative to acquisitive leaf traits in relation to water use (Poorter et al. 2019; Alves et al. 2021; Faccion et al. 2021). However, studies testing this hypothesis used mostly chronosequences (i.e., space-for-time substitution) and reported mixed results (Lohbeck et al. 2013, Poorter et al. 2019, Faccion et al. 2021, Aguilar-Peralta et al. 2022). Thus, long-term temporal data are necessary to more accurately determining successional trends on leaf traits and ecosystem functioning in tropical forests.
In this study, we determined the changes in physicochemical soil parameters, vegetation structure and leaf functional traits in a Brazilian TDF using two complementary approaches: (i) a chronosequence consisting of plots from early, intermediate and late successional stages; and (ii) the temporal comparison of functional trait changes after nine years of succession (2009-2018) in the same plots. Specifically, the following hypotheses were tested: (i) regardless of the sampling period (2009 or 2018), soil resource availability and structural vegetation traits (i.e. height, basal area, density and the Holdridge complexity index-HCI) increase along the chronosequence; (ii) in the chronosequence, pioneer species in early successional forests have greater investment in conservative traits, related to chemical defense and tolerance to desiccation (i.e. phenolic compounds and sclerophylly), whereas tree species in the intermediate and late stages will have greater investment in acquisitive traits, exhibiting a greater specific leaf area (SLA) and chlorophyll content; (iii) after nine years of succession, we expect that soil resource availability and vegetation structure increase for all successional stages; finally, (iv) leaf traits of tree species in all three successional stages will be different due to temporal changes in species composition or phenotypic plasticity. These changes will be more evident for the early stage, since the abiotic and biotic changes in this environment are usually faster. Thus, after nine years of succession, we expect that trees would change from an investment in conservative strategies, expressed in lower SLA and higher levels of polyphenols (i.e defense), to an investment in acquisitive strategies, exhinting higher SLA and chlorophyll content (a, b, ratio a/b, and total).
2. Materials and Methods
2.1. Study Area
This study was conducted at the Mata Seca State Park (MSSP), located in northern Minas Gerais state, Brazil. The MSSP was created in 2000 after the expropriation of farms where extensive livestock and irrigated agriculture were the main economic activities. This park covers 15,466 ha and is located in the Valley of the São Francisco River, between 14°97’02” – 14°53’08” S and 43°97’02” – 44°00’05” W. The original and currently predominant vegetation is the TDF, characterized by the presence of flat and fertile soils (IEF 2000). Approximately 1,525 ha of the MSSP are covered by abandoned pastures which are regenerating to early succesional forests, and the remaining area area is characterized by a mosaic of TDF in both secondary and old-growth forests (IEF 2000). This vegetation is dominated by dry-deciduous plant species (Pezzini et al. 2014). The region’s climate is Aw (according to Köppen, Alvares et al. 2013), characterized by the severe dry season from May to October. The average temperature in the region is 24ºC (Antunes 1994) and the average precipitation is 818 ± 242 mm (data from the Manga weather station, approximately 10 km from the MSSP).
Sampling was carried out in nine plots of 50 x 20 m (three per each successional stage) established in 2006, for which trees with diameter at breast height (DBH) ≥ 5 cm were censused annually until 2017. These plots are located along a 5 km transect that crosses forest areas in the three successional stages between the coordinates 14 ° 50’-14 ° 51 ‘S and 43 ° 57’-44 ° 00 W (Madeira et al. 2009; Nunes et al. 2014). Plot chronosequence were determined considering both the vertical (i.e. number of vegetation strata) and horizontal (i.e. tree density) structure of the vegetation, as well as the time elapsed since the disturbance and the type of previous land use Madeira et al. (2009). Thus, in 2009 the early succesional stage was composed mainly of sparse patches of woody vegetation, shrubs and herbs, with a single vertical layer formed by a discontinuous canopy of approximately 4 m in height. In 2018, these early-stage plots developed a taller forest, with approximately 7 m in height with a less representative shrub-herb layer. This area was used as pasture for at least 20 years and abandoned in 2000, with the creation of MSSP. The intermediate succesional stage was characterized by two vertical strata: (i) the first composed by fast-growing trees growing to 10-12 m high, forming a closed canopy, with some emerging trees up to 15 m; (ii) the second stratum was composed of a dense understory, with the dominance of lianas and juvenile trees. This area was used as pasture by an undefined period and abandoned in the late 1960s (40-45 years regenerating in 2009). Finally, the late succesional stage had three strata. The first stratum consisted by tall trees forming a closed canopy up to 20 m high. The second stratum was formed by a sparse understory with reduced light penetration and low density of juvenile trees and lianas. The third stratum possessed typical understory shrub and herbaceous species. There are no clear-cut records in this area for at least 50 years (Madeira et al. 2009). No changes were observed in the stratification of intermediate and late stages from 2009 to 2018.
2.2. Sampling Design
2.2.1. Characterization of Biotic and Abiotic Changes
For each plot, we calculated the average tree height and basal area, species richness and density of individuals in 2009 and 2017 (the last plot recensus; for methodological details see Madeira et al. 2009; Nunes et al. 2014). In addition, we calculated the Holdridge complexity index (HCI) for each plot, using the following formula: HCI = (Height x stem density x basal area x number of species)/1,000 (Holdridge et al. 1971). The HCI considers only arboreal individuals with DBH > 10 cm, but we use a modified version of the index because we sampled individuals with DBH ≥ 5 cm.
Chemical and physical analyses of the soil were also carried out on three samples 0-20 cm deep for each plot, in 2009 and 2018. Analyses of the soil samples from 2009 were carried out at EMBRAPA Solos (see Espírito-Santo et al. 2014) whereas the samples from 2018 were conducted at the soil analysis laboratory of the Institute of Agricultural Sciences (ICA) at the Federal University of Minas Gerais (UFMG), following the same EMBRAPA protocols used for the samples from 2009. Here, we also used soil texture (sand, silt and clay) to indicate soil water holding capacity (i.e., soils with higher clay content have higher water holding capacity). The environmental change associated with successional development was evaluated by measuring photosynthetically active radiation (PAR) in April 2009 and 2018, using a sensor (Smart Sensor S-LIA-M003) connected to an understory microclimate station installed in a plot of each successional stage.
2.2.2. Tree Species and Leaf Sampling
Based on plot structure and composition data, five tree species with the highest Importance Value (IV) in each plot were selected (see Alvarez-Añorve et al. 2012, Faccion et al. 2021). The IV expresses, numerically, the importance of a given species in the community (in this case, the successional stage), being determined through the sum of its values of relative density, frequency and dominance, expressed as a percentage (Müeller -Dombois & Ellenberg 1974). Thus, the species sampled were not necessarily the same per plot. In total, 13 tree species from 7 families were sampled in 2009 and 24 species from 16 families in 2018 (see Table 1). For all species, three individuals were marked in each plot (i.e. 15 individuals per plot) and leaf functional traits were evaluated. All measurements were performed in the middle of the rainy season (January 2009 and 2018).
The protocols used to obtain the leaf functional traits were defined by Faccion et al. (2021). To determine the leaf functional traits, 10 expanded leaves without visible damaged by herbivores and pathogens were collected from each of the 15 individuals previously marked per plot. Of the total number of leaves collected (N= 10) per individual, five were used to calculate the specific leaf area (SLA) dividing the total leaf area by dry weight. The leaf area was calculated using the ImageJ software (Rasband 2006). Afterwards leaves were oven-dried for 48 h at 70 ° C (Cornelissen et al. 2003) and weighed using an analytical balance. The other five leaves were used to determine the polyphenol content (μmol/cm2) (Dualex® Dual Excitation, prototype CNRS-LURE, France), and also used for chlorophyll extraction (see below). For statistical analysis, each variable was average per individual for all sampled species.
2.2.3. Polyphenol Content
Five leaves were used for non-destructive evaluation of polyphenols present in the leaf epidermis. The measurements were made in the field, with the aid of a double excitation fluorimeter (Dualex® Dual Excitation, prototype CNRS-LURE, France), which is based on the molar extinction coefficient of quercetin (ε) at 375nm (Cartelat et al. 2005). For each leaf, three readings were made on each surface (abaxial and adaxial), avoiding the central ribs. The sum of the abaxial and adaxial readings was divided by ε (since the derivatives of quercetin constitute the main family of flavonoids and, therefore, the ε of flavonoids is very similar), being then transformed into polyphenol content (µmol−1cm2) (Goulas et al. 2004). Since most polyphenols are concentrated in the epidermis of the leaves, this measure can be used to estimate the total content of leaf polyphenols (Goulas et al. 2004; Faccion et al. 2021).
2.2.4. Chlorophyll Content
From the sample used to quantify polyphenols, five leaves per individual of each species were used to determine the chlorophyll content. The leaf samples were wrapped in foil and then stored in a polystyrene box with ice and taken to the laboratory, where they were frozen at -18º C for analysis, following a method adapted from Hiscox and Israelstam (1979). Each 0.1g sample of leaf tissue in fractions was placed in a tube with dimethyl sulfoxide (DMSO, 99.9%) and put in water bath at 65ºC. The extraction process was considered complete when the leaf samples became visually transparent. Subsequently, the extracts were subjected to absorption analysis using a spectrophotometer (Femto 700 Plµs). The absorbance was measured at 645 and 663nm for chlorophylls b and a, respectively (Mackinney 1941). Hiscox and Israelstam (1979) found the same absorption patterns for chlorophyll extracts with DMSO and acetone, therefore, we used the Arnon’s equations (1949) to quantify the contents of chlorophylls a, b and total. The chlorophyll content was calculated from these equations and then converted in terms of concentration and expressed in milligrams of chlorophyll per gram of leaf tissue (mg/g)
2.3. Statistical Analyses
2.3.1. Characterization of Biotic and Abiotic Changes
The vegetation structural parameters (i.e., HCI, species richness, density of individuals, average tree height and basal area) (response variables) were compared between years (2009 and 2018) and between successional stages (explanatory variables) using generalized linear models (GLMs; one for each response variable), with pos-hoc comparison of means by contrast analyses (Reis-Jr et al. 2015). The residuals of the adjusted models were analyzed to assess the adequacy of the error distribution (Crawley 2007). These analyses were performed using R software (R Development Core Team 2018).
To determine the differences in plant species composition among successional stages and years, non-metric multidimensional scaling analyses (NMDS; Hammer et al. 2001) were performed using the Bray-Curtis dissimilarity index. Complete floristic composition data per plot obtained in 2009 and 2018 were included instead of only the species used for the analysis of leaf characteristics. To test the significance of the separation of the plots obtained through NMDS, we used a similarity analysis (ANOSIM). NMDS and ANOSIM analyses were performed using the Past software (Hammer et al. 2001).
The physicochemical parameters of the soil were also compared among succesional stages and years (2009 and 2018) using GLMs (one for each response variable). The same procedures applied in the analyses of vegetation structural parameters were used. The PAR values were not compared statistically, since there was data available only for one sensor per successional stage. Thus, only the PAR average was calculated for January 2009 and 2018 for each successional stage.
2.3.2. Leaf Functional Traits
Chlorophyll content, polyphenols and SLA (response variables) were compared among successional stages and years (explanatory variables) using GLMs (one model for each response variable), following the same procedures used for previous analyses. In addition, a Principal Component Analysis (PCA) was performed using the average values of all leaf traits. Due to the large discrepancies between the values of each variable, the logarithm of the average values per species in each plot was calculated to normalize data. To compare the three successional stages among years (explanatory variable) in functional terms, the scores for axis 1 generated by the PCA (response variable) were compared using a GLM. The PCA was conducted using the Past software (Hammer et al. 2001).
3. Results
3.1. Characterization of Biotic and Abiotic Changes
In both 2009 and 2018, Fabaceae and Bignoniaceae were the most representative families. As a whole, the most common species sampled in 2009 and 2018 were Combretum duarteanum, Handroanthus chrysotrichus, H. ochraceus and Astronium urundeuva. However, the species with highest IV changed along the chronosequence: in the early succesional stage, H. ochraceus, Machaerium acutifolium and A. urundeuva were the dominant species sampled in both 2009 and 2018. On the other hand, Combretum duarteanum, Commiphora leptophloeos and Tabebuia reticulata dominated in the intermediate and late succesional stages (see Table 1). Average tree height and basal area, species richness and the Holdridge complexity index (HCI) increased along successional stages (Table 2). Tree density increased along the chronosequence in 2009 but not in 2018, when the intermediate stage exhibited the lowest density (Table 2). The structural parameters did not change between 2009 and 2018, except for the HCI which decreased along the studied period in the intermediate and late stages (Table 2). The NMDS analysis based on the floristic composition indicated that there was no temporal difference for each successional stage (P > 0.05; Figure S1).
The mean values of PAR in the understory for 2009 were higher in the early and intermediate stages than in the late succesional stage. The PAR decreased 44% in the early stage from 2009 to 2018, indicating a relatively rapid canopy closure compared to the intermediate (13.6%) and late stage, where PAR values remained practically constant along the study period (Figure S2).
We detected significant differences in several physicochemical soil parameters along the chronosequences in both 2009 and 2018 (P < 0.05), mostly between the intermediate and the early/late stages (Table 3). Soils from the intermediate stage were more acidic and had lower values of K, Ca and Mg. Differences in soil physical parameters were also observed among the intermediate and the early/late stages, with the former exhibiting significant lower silt and higher clay content (i.e., water holding capacity) (Table 3). Significant temporal changes in soil chemistry were observed for P levels and the contents of organic matter and organic carbon. For physical traits, only clay content decreased significantly from 2009 to 2018 (Table 3).
3.2. Leaf Functional Traits
The trends observed in the chronosequence for leaf functional traits were not consistent in 2009 and 2018, except for the total and a/b chlorophyll content (Figure 1). For the SLA, the highest values were observed in the late stage in 2009 and in the intermediate stage in 2018 (Figure 1A). We observed a gradual decrease in polyphenol content along the chronosequence in 2009, but in 2018 the highest levels of these secondary compounds were detected in the intermediate stage (Figure 1B). The ratio between chlorophylls a/b did not differ between successional stages neither in 2009 or 2018, but the total chlorophyll content was lower in the intermediate stage in both years, although this difference was not statistically significant in 2018 (Figure 1CD).
On the other hand, consistent temporal changes in leaf functional traits were detected from 2009 to 2018, with the exception of polyphenol content. The SLA decreased in all succesional stages, although the temporal difference was not statistically significant for the intermediate stage (Figure 1A). The ratio between chlorophylls a/b almost doubled during the study period for all stages, although the total chlorophyll content did not change significantly (but tended to increase in all stages; Figure 1CD). Polyphenol content increased from 2009 to 2018 in the late stage and decreased in the early stage, with no statistically significant difference in the intermediate stage (Figure 1B).
The principal component analysis of the leaf traits indicated a clear separation between years (2009 and 2018), regardless of the successional stage (Figure 2). The first PCA axis explained 67.9% of the variation, while the second PCA axis explained 23.2%. The first axis was positively correlated with the ratio between chlorophylls a/b and polyphenol content, and negatively correlated with the SLA (Figure 2). The second axis correlated positively with the ratio between chlorophylls a/b and SLA, and negatively with polyphenol content (Table S1). For 2009, it was also possible to notice a separation between late-stage plots and early/intermediate stage plots (Figure 2). There was a statistically significant difference in the scores of the first axis of the PCA between 2009 and 2018 (GLM, P < 0.05).
4. Discussion
We observed contrasting successional patterns for leaf functional traits when using three different comparisons: a chronosequence in 2009 and 2018 and the actual temporal changes occurred in the forest along this nine-year period. As a whole, the predicted successional pattern was only observed for SLA (increased) and polyphenols (decreased) for the chronosequence in 2009 (see Table 4), and for chlorophyll a/b (increase) from 2009 to 2018. This lack of consistent is likely related to the fact that temporal changes in forest structure and abiotic conditions (light and soil parameters) followed an unexpected successional pathway due to stochastic events causing high tree mortality in intermediate and late stages. These results reveal the limitations of the space-for-time substitution approach to assess the regeneration of ecosystem functioning.
4.1. Temporal Changes Biotic and Abiotic Conditions
The environmental conditions of the three successional stages changed along nine years of natural regeneration, as demonstrated by the physical and chemical soil parameters, as well as by the PAR. Although there were no differences in the general composition of plant species in the successional stages between 2009 and 2018, the number of species sampled in each year was quite different (13 vs. 24). While the five plant species with the highest IV were the same (see Table 1), the IV values decreased over time, indicating a decrease in species dominance. In addition, these results suggest an increase in beta diversity in all successional stages. In 2009, the 15 individuals sampled in the three plots of the early stage belonged to seven species, increasing to ten species in 2018. A similar pattern was found for the intermediate (six to nine) and late (six to eleven) stages. However, the most striking results were recorded for the structure of the successional stages.
Contrary to our expectations, the average tree species richness decreased in all successional stages. The basal area, height and Holdridge Complexity Index (HCI) increased in the early succesional stage, but decreased in the more advanced succesional stages. According to several studies, structural complexity generally increases along forest natural regeneration (Lebrija-Trejos et al. 2010ab; Espírito-Santo et al. 2014; Becknell & Powers 2014). This unexpected result is probably related to the long period of drought that occurred between 2011 and 2016, aggravated by the occurrence of the El Niño Southern Oscillation (ENSO, 2015-2016) (Bretfeld et al. 2018). In fact, recent studies on tropical forests in Brazil (Rowland et al. 2015) and Panama (Meakem et al. 2017) have shown the negative impacts of the ENSO from 2015-2016, considered the most intense in the last 50 years (Bennett et al. 2023). These studies showed that drought-induced mortality is more common in the seedling stage and in large trees (Rowland et al. 2015, Meakem et al. 2017). In addition, in February 2011, a strong wind storm was recorded in the studied plots, causing tree fall and extensive canopy opening (MM Espírito-Santo, pers. obs.). Despite these unexpected structural changes, the PAR values decreased in the early and intermediate stages and remained stable in the late (see Figure S2), indicating canopy closure from 2009 to 2018. However, the results of the PAR must be interpreted with caution, since they represent a measurement of a single area of one plot per successional stage, not expressing all the variability of light distribution in the forest canopy.
In general, the temporal increase in organic matter and organic carbon suggests that soils have become more fertile, despite the observed decrease in K and P. In addition, there were significant changes in the physical structure of the soil in the early and late succesional stages, with a decrease in clay content and an increase in silt and sand. Studies performed in dry and tropical rain forests have shown that sites with low clay content also present high light incidence, directly influencing the vegetation composition and structure (Peña-Claros et al. 2012; Rodrigues et al. 2018). According to Espírito-Santo et al. (2014), in a study performed in the same plots, the marked difference in soils among successional stages may be a consequence of a more intense previous land use in the intermediate successional stage before 1972. Moreover, is likely that the lower soil fertility and higher water holding capacity observed in the intermediate succesional stage is a natural characteristic of the soil type where the forest developed (Van der Sande et al. 2023).
4.2. Leaf Traits and Successional Gradient
The variations in leaf traits among successional stages were not consistent between 2009 and 2018. Our hypothesis was partially corroborated for the chronosequence in 2009, for SLA and polyphenols, according to the conservative-acquisitive spectrum (see Table 4). Similar to our results, Faccion et al. (2021) found the lowest total chlorophyll values in the intermediate succesional stage, related to the intense exposure to solar radiation. However, the same pattern was not observed for the chronosequence in 2018, when none of the leaf traits varied as predicted by our proposed hypothesis.
The higher SLA and polyphenol content observed in the intermediate succesional stage in 2018 are due to the decrease in the average values of these traits in the early and late succesional stages (i.e. these variables did not exhibited significant temporal changes in the intermediate succesional stage). The soils of the early and late succesional stages became sandier in 2018, while the soil texture in the intermediate stage did not change, continuing with a high clay content. More clayey soils have greater water retention capacity (Rodrigues et al. 2018, 2019), acting as an environmental filter for plants with more acquisitive characteristics, such as greater SLA (Cardoso et al. 2011; Fonseca et al. 2018; Silva et al. 2021). However, high values of polyphenols would not be expected under these conditions. In 2018, the intermediate stage started to have a larger canopy opening, increasing the PAR due to changes in the forest structure (see Table 2).
The spatial patterns for the year 2009 and 2018 were practically similar in relation to chlorophyll a/b and total. The absence of differences in chlorophyll content are in line with the hypothesis that the variation in light incidence along TDF chronosequences are not so striking (Lebrija-Trejos et al. 2010a, 2011; Lohbeck et al. 2015). However, our results indicate expressive successional differences in the PAR in 2009, at least for the late stage.
4.3. Temporal Differences in Leaf Characteristics
In general, the temporal changes in leaf traits between 2009 and 2018 were more striking than the changes observed along the chronosequences in each year. However, many of these changes did not corroborate the hypothesis proposed according to the conservative-acquisitive spectrum of leaf economy during succession in TDFs (Lohbeck et al. 2015). The decrease in SLA in all successional stages (although the difference was not statistically significant for the intermediate stage) over time is the opposite of our expectation. The small increase observed in total chlorophyll, although not statistically significant, indicates a trend contrary to that predicted by the hypothesis, but it is reasonably consistent with that observed in the chronosequence (i.e. no difference in 2018). The most striking change was observed in the ratio between chlorophylls a/b, which doubled in all stages, also contradicting the predicted hypothesis. In TDFs, naturally thinner canopy than tropical rain forests, such drastic changes in the amount of light that passes through the canopy (Lebrija-Trejos et al. 2010a, 2011). Despite the rapid increase in total chlorophyll, the increase in the ratio between chlorophylls a/b suggests an increase in light incidence in all succesional stages, since lower levels of chlorophyll b are more commonly found in environments with a higher incidence of light (Li et al. 2018).
It is important to highlight the lack of consistency between the changes in leaf traits observed along the chronosequence (whose pattern was different in each year) and over the nine years of the present study. The only reasonably consistent pattern between the two approaches was observed for total chlorophyll (i.e. no difference). Despite being an extremely useful approach in studies on ecological succession, chronosequence is based on specific measurements of parameters and processes and its premises are often not confirmed in temporal follow-ups (Johnson & Miyanishi 2008). In the case of the present study, the temporal changes observed during the nine years of succession were contrary to our expectations (i.e. decrease in complexity) for the more advanced successional stages, due to stochastic events whose effects had a different intensity between stages. These results reinforce the need for long-term studies for a better understanding of the natural regeneration of ecosystem functioning in tropical forests.
The functional separation over time was mainly characterized by the change from acquisitive to conservative characteristics (i.e. general decrease in SLA and the ratio between chlorophylls a/b and increase in polyphenols in advanced stages), due to a decrease in the structural complexity of the forest in more advanced stages, probably caused by stochastic factors (i.e. windstorm in 2011 and long sequence of dry years), as discussed above. In our study, although different tree species were evaluated in each year, we compared only interspecific trait variations because previous studies indicated a very small variance in leaf traits at intraspecific level due to phenotypic plasticity (Faccion et al. 2021).
5. Conclusions
Few studies have accompanied successional changes in functional plant traits over time, in order to corroborate results obtained from chronosequences. The present study showed an inconsistency between the two approaches, which may be related to stochastic events that occurred over the nine-year interval between the samples. In 2009, the chronosequence partially corroborated the hypothesis of conservative-acquisitive changes in the spectrum of leaf economy throughout the succession in TDFs. However, the unexpected decrease in structural complexity and soil characteristics (nutrients and water holding capacity) in advanced successional stages over time “blurred” these differences in 2018. Over time, the intermediate and late succesional stages apparently became environments that supported plant with more conservative characteristics in 2018 than in 2009. Therefore, the conservative-acquisitive spectrum in regenerating TDFs should be further investigated preferentially with temporal data, as the intensity and direction of environmental filters are likely to change over time, especially with the possibility of increasing frequency of extreme events due to climate change.
Supplementary Materials
The following supporting information can be downloaded at the website of this paper posted on Preprints.org, Figure S1: title; Figure S2: title; Table S1: title.
Funding
National Council for Scientific and Technological Development (CNPq), FAPEMIG, Interamerican Institute for Global Change Research (IAI) and Coordination for the Improvement of Higher Education Personnel (CAPES).
Acknowledgments
We are grateful for the logistical support of the State Forestry Institute (IEF) of Minas Gerais during the fieldwork in the Mata Seca State Park.
References
- Aguilar-Peralta JS, Maldonado-López Y, Espírito-Santo MM, Reyes-Chilpa R, Oyama K, Fagundes M et al (2022) Contrasting successional stages lead to intra-and interspecificdifferences in leaf functional traits and herbivory levels in a Mexicantropical dry forest. Eur J For Res141:225–239. [CrossRef]
- Antunes FZ (1994) Caracterização Climática – Caatinga do Estado de Minas Gerais. Info Agropec 17:15–19.
- Alvares CA, Stape JL, Sentelhas PC, Gonc¸alves JLM, Sparovek G (2013) Koppen’s climate classification map for Brazil. Meteorol Z 22:711–728. [CrossRef]
- Alvarez-Añorve MY, Quesada M, Sánchez-Azofeifa GA, Avila-Cabadilla LD, Gamon JA (2012) Functional regeneration and spectral reflectance of trees during succession in a highly diverse tropical dry forest ecosystem. Ame J Botany 99:816–826. [CrossRef]
- Alves AM, Espírito-Santo MM, Silva JO, Faccion G, Sanchez-Azofeifa A, Ferreira KF (2021) Successional and intraspecific variations in leaf traits, spectral reflectance indices and herbivory in a Brazilian tropical dry forest. Front For Glob Change 4:780299. [CrossRef]
- Arnon DI (1949) Copper enzymes in isolated chloroplasts. Polyphenoloxidase in Beta vulgaris. Plant Physiol 24: 1–15. https://www.jstor.org/stable/4258165.
- Arruda DM, Schaefer CEGR, Correa GR, Rodrigues PMS, Duque-Brasil R, Ferreira-Jr WG, Oliveira-Filho AT (2015) Landforms and soil attributes determines the vegetation structure in the Brazilian semiarid. Folia Geobot 50:175–84. [CrossRef]
- Ayala-Orozco B, Gavito ME, Mora F, Siddique I, Balvanera P (2018) Resilience of soil properties to land-use change in a tropical dry forest ecosystem. L. Degrad. Dev. 29, 315–325. [CrossRef]
- Becknell JM & Powers JS (2014) Stand age and soils as drivers of plant functional traits and aboveground biomass in secondary tropical dry forest. Can J For Res 44:604–613. [CrossRef]
- Bennett AC, Rodrigues ST, Monteagudo-Mendoza A et al (2023) Sensitivity of South American tropical forests to an extreme climate anomaly. Nat. Clim. Chang. 13, 967–974. [CrossRef]
- Bretfeld M, Ewers BE, Hall JS (2018) Plant water use responses along secondary forest succession during the 2015-2016 El Niño drought in Panama. New Phytol 219(3) 885–899. [CrossRef]
- Cardoso FCG, Marques R, Botosso PC, Marques MCM (2011) Stem growth and phenology of two tropical trees in contrasting soil conditions. Plant Soil 354: 269–281. [CrossRef]
- Cartelat A, Cerovic ZG, Goulas Y, Meyer S, Lelarge C, Prioul JL et al (2005) Optically assessed contents of leaf polyphenolics and chlorophyll as indicators of nitrogen deficiency in wheat (Triticum aestivum L.). Field Crop Res 91: 35–49. [CrossRef]
- Chazdon R (2008) Chance and determinism in tropical forest succession. In: W. Carson, Schnitzer F (eds) Tropical forest community ecology. Wiley-Blackwell, Sussex, pp 384 –408.
- Chazdon RL, Lindenmayer D, Guariguata MR, Crouzeilles R, Benayas JMR & Chavero EL (2020) Fostering natural forest regeneration on former agricultural land through economic and policy interventions. Environmental Research Letters, 15(4), 043002.
- Crawley MJ (2007) Statistical computing – An introduction to data analysis using S-Plus. John Wiley & Sons, London.
- Cornelissen JHC, Lavorel S, Garnier E, Díaz S, Buchmann N, Gurvich DE, Poorter H (2003) A handbook of protocols for standardised and easy measurement of plant functional traits worldwide. Aust J Bot 51: 335-380. [CrossRef]
- Crouzeilles R, Beyer HL, Monteiro LM, Feltran-Barbieri R, Pessôa AC, Barros FS & Strassburg BB (2020) Achieving cost-effective landscape-scale forest restoration through targeted natural regeneration. Conservation Letters, 13(3), e12709.
- Espírito-Santo MM, Olívio-Leite L, Neves FS, Nunes YRF, Zazá-Borges MA, Falcão LAD et al (2014) Tropical dry forests of northern Minas Gerais, Brazil: Diversity, conservation status, and natural regeneration. In: Sánchez- Azofeifa A, Powers JS, Fernandes GW, Quesada M (eds) Tropical dry forests in the Americas: Ecology, conservation, and management. CRC Press, Boca Raton, pp 69–81.
- Espírito-Santo MM, Rocha AM, Leite ME, Silva JO, Silva LAP & Sanchez-Azofeifa, GA (2020) Biophysical and socioeconomic factors associated to deforestation and forest recovery in Brazilian tropical dry forests. Frontiers in Forests and Global Change, 3, 569184.
- Faccion G, Alves AM, Espírito-Santo MM, Silva JO, Sanchez-Azofeia A, Ferreira KF (2021) Intra- and interspecific variations on plant functional traits along a successional gradient in a Brazilian tropical dry forest. Flora 279:151815. [CrossRef]
- Fonseca MB, Silva JO, Falcão LAD, Dupin MGV, Melo GA, Espírito-Santo MM (2018) Leaf damage and functional traits along a successional gradient in Brazilian tropical dry forests. Plant Ecol 219:403–415. [CrossRef]
- Goulas Y, Cerovic ZG, Cartelat A, Moya I (2004) Dualex: A new instrument for field measurements of epidermal UV-absorbance by chlorophyll fluorescence. Appl Opt 43(2): 4488–4496. [CrossRef]
- Hammer Ø, Harper Dat, Ryan PD (2001) PAST: Paleontological Statistics Software Package for Education and Data Analysis. Palaeontologia Electronica. http://palaeo-electronica.org/2001_1/past/issue1_01.htm. Acessed 21 April 2019.
- Hiscox J, Israelstam GF (1979) A method for the extraction of chlorophyll from leaf tissue without maceration. Canad J Bot 57(12): 1332–1334. [CrossRef]
- Holdridge LR, Grenke WC, Hatheway WH, Liang T, Tosi JAJR (1971) Forest environments in tropical life zones: a pilot study. Pergamon Press, New York.
- IEF (2000) Instituto Estadual de Florestas. Technical opinion for the creation of the Mata Seca State Park. Technical report, Belo Horizonte, Minas Gerais.
- Jakovac, CC, Junqueira AB, Crouzeilles R, Peña-Claros M, Mesquita RCG & Bongers F (2021) The role of land-use history in driving successional pathways and its implications for the restoration of tropical forests. Biological Reviews 96, 1114-1134.
- Johnson EA & Miyanishi K (2008) Testing the assumptions of chronosequences in succession. Ecol lett 11(5): 419-431. [CrossRef]
- Lebrija-Trejos E, Bongers F, Pérez-García EA, Meave A (2008) Successional change and resilience of a very dry tropical deciduous forest following shifting agriculture. Biotropica 40:422–431. [CrossRef]
- Lebrija-Trejos E, Pérez-García EA, Meave JA, Bongers F, Poorter L (2010a) Functional traits and environmental filtering drive community assembly in a species-rich tropical system. Ecology 91 386–98. [CrossRef]
- Lebrija-Trejos E, Meave JA, Poorter L, Pérez-García EA, Bongers F (2010b) Pathways, mechanisms and predictability of vegetation change during tropical dry forest succession. Perspect Plant Ecol 12:267–275. [CrossRef]
- Lebrija-Trejos E, Pérez García EA, Meave JA, Poorter L, Bongers F (2011) Environmental changes during secondary succession in a tropical dry forest in Mexico. J Trop Ecol 27:1–13. [CrossRef]
- Li Y, Liu C, Zhang J, Yang H, Xu L, Wang Q, He N (2018) Variation in leaf chlorophyll concentration from tropical to cold-temperate forests: Association with gross primary productivity. Ecol Indic 85: 383–389. [CrossRef]
- Lohbeck M, Poorter L, Lebrija-Trejos E, Martínez-Ramos M, Meave JA, Paz H et al (2013) Successional changes in functional composition contrast for dry and wet tropical forest. Ecology 94:1211–1216. [CrossRef]
- Lohbeck M, Lebrija-Trejos E, Martı’nez- Ramos M, Meave JA, Poorter L, Bongers F (2015) Functional trait strategies of trees in dry and wet tropical forests are similar but differ in their consequences for succession. PLoS ONE 10(4):e0123741. [CrossRef]
- Mackinney G (1941) Absorption of light by chlorophyll solutions. J Biol Chem 140: 315–322. [CrossRef]
- Madeira BG, Espírito-Santo MM, D’Angelo-Neto S, Nunes YRF, Sánchez-Azofeifa GA, Fernandes GW et al (2009) Changes in tree and liana communities along a successional gradient in a tropical dry forest in south-eastern Brazil. Forest Ecol 201:291–304. [CrossRef]
- Mantero G, Morresi D, Marzano R, Motta R, Mladenoff DJ & Garbarino M (2020) The influence of land abandonment on forest disturbance regimes: a global review. Landscape Ecology, 35, 2723-2744.
- Meakem V, Tepley AJ, Gonzalez-Akre EB, Herrmann V, Muller-Landau HC, Wright SJ et al (2017) Role of tree size in moist tropical forest carbon cycling and water deficit responses. New Phytol 47: 38–48. [CrossRef]
- Müeller-Dombois D, Ellenberg HA (1974) Aims and methods of vegetation ecology. John Wiley, New York.
- Nunes YRF, Luz GR, Souza SR, Silva DL, Veloso MDM, Espírito-Santo MM, Santos RM (2014) Floristic, structural, and functional group variations in tree assemblages in a Brazilian tropical dry forest: Effects of successional stage and soil properties. In: Sánchez-Azofeifa A, Powers JS, Fernandes GW, Quesada M (eds) Tropical dry forests in the Americas: Ecology, Conservation, and Management. 1ed. Boca Raton, CRC Press, pp 325–349.
- Peña-Claros M, Poorter L, Alarcón A, Blate G, Choque U, Fredericksen TS et al (2012) Soil effects on forest structure and diversity in a moist and a dry tropical forest. Biotropica 44(3):276–283. [CrossRef]
- Pezzini FF, Ranieri BD, Brandão D, Fernandes GW, Quesada M, Espírito-Santo MM et al (2014) Changes in tree phenology along natural regeneration in a seasonally dry tropical forest. Plant Biosyst 148:965–974. [CrossRef]
- Poorter L, Rozendaal DMA, Bongers, F et al., (2019) Wet and dry tropical forests show opposite successional pathways in wood density but converge over time. Nat. Ecol. Evol. 5, eaau3114. [CrossRef]
- Poorter L, Craven D, Jakovac CC, Van Der Sande MT et al (2021). Multidimensional tropical forest recovery. Science, 374(6573), 1370-1376.
- Poorter L, Amissah L, Bongers F, Hordijk I, Kok J, Laurance SG & van der Sande MT (2023) Successional theories. Biological Reviews, 98(6), 2049-2077.
- R Development Core Team R (2018) A language and environment for statistical computing. R Foundation for Statistical Computing. Vienna, Austria. ISBN: 3–900051–07–0. http://www.R-project.org. Accessed 12 June 2019.
- Rasband WS (2006) ImageJ. U.S. National Institutes of Health, Bethesda, Maryland. Available at: http://rsb.info.nih.gov/ij. Accessed 26 January 2019.
- Reis-Jr R, Oliveira ML, Borges GRA (2015) RT4Bio: R Tools for Biologists. https://sourceforge.net/projects/rt4bio/. Accessed 26 June 2020.
- Rowland L, Da Costa A, Galbraith D, Oliveira R, Binks O, Oliveira A et al (2015) Death from drought in tropical forests is triggered by hydraulics not carbon starvation. Nature 528: 119–122. [CrossRef]
- Rodrigues PMS, Schaefer CEGR, Silva JO, Ferreira Júnior WG, Santos RM, Neri AV (2018) The influence of soil on vegetation structure and plant diversity in different tropical savannic and forest habitats. J Plant Ecol 11: 226-236. [CrossRef]
- Rodrigues PMS, Silva JO, Schaefer CE (2019) Edaphic properties as key drivers for woody species distributions in tropical savannic and forest habitats. Aust J Bot 67: 70-80. [CrossRef]
- Rosenfield MF, Jakovac CC, Vieira DLM, Poorter L, Brancalion PHS, Vieira ICG, Almeida DRA, Massoca P, Schietti J, Albernaz ALM, Ferreira MJ, Mesquita RCG (2022) Ecological integrity of tropical secondary forests: concepts and indicators. Biological Reviews. 98, 662-676. [CrossRef]
- Sanaphre-Villanueva L, Dupuy JM, Andrade JL, Reyes-García C, Jackson PC, Paz H (2017) Patterns of plant functional variation and specialization along secondary succession and topography in a tropical dry forest. Environ Res Lett 12(5): 055004. [CrossRef]
- Silva JO, Souza-Silva H, Rodrigues PMS, Cuevas-Reyes P, Espírito- Santo MM (2021) Soil resource availability, plant defense, and herbivory along a successional gradient in a tropical dry forest. Plant Ecol 222: 625–637. [CrossRef]
- Vaca-Sánchez MS, Maldonado-López Y, Oyama K, Delgado G, Aguilar-Peralta JS, Zazá Borges MA, et al (2022) Changes in herbivory patterns and insect herbivore assemblagesassociated to canopy of Quercus laurina: importance of oak speciesdiversity and foliar chemical defense. [CrossRef]
- Van Der Sande MT, Powers JS, Kuyper TW, Norden N, Salgado-Negret B, Silva de Almeida J & Poorter L (2023) Soil resistance and recovery during neotropical forest succession. Philosophical Transactions of the Royal Society B, 378(1867), 20210074.
- Violle C, Enquist BJ, Mcgill BJ, Jiang L, Albert CH, Hulshof C et al (2012) The return of the variance: intraspecific variability in community ecology. Trends Ecol Evol 27: 244-252. [CrossRef]
- Wright SJ (2002) Plant diversity in tropical forests: a review of mechanisms of species coexistence. Oecologia 130: 1-14. [CrossRef]
Figure 1.
Leaf functional traits of tree species along a chronosequence in a tropical dry forest in Brazil. Letters a, b, c on the bars = statistically significant differences among successional stages in 2009; letters d, e, f = differences among stages in 2018. * = statistically significant differences between years for each stage. Mean ± SE.
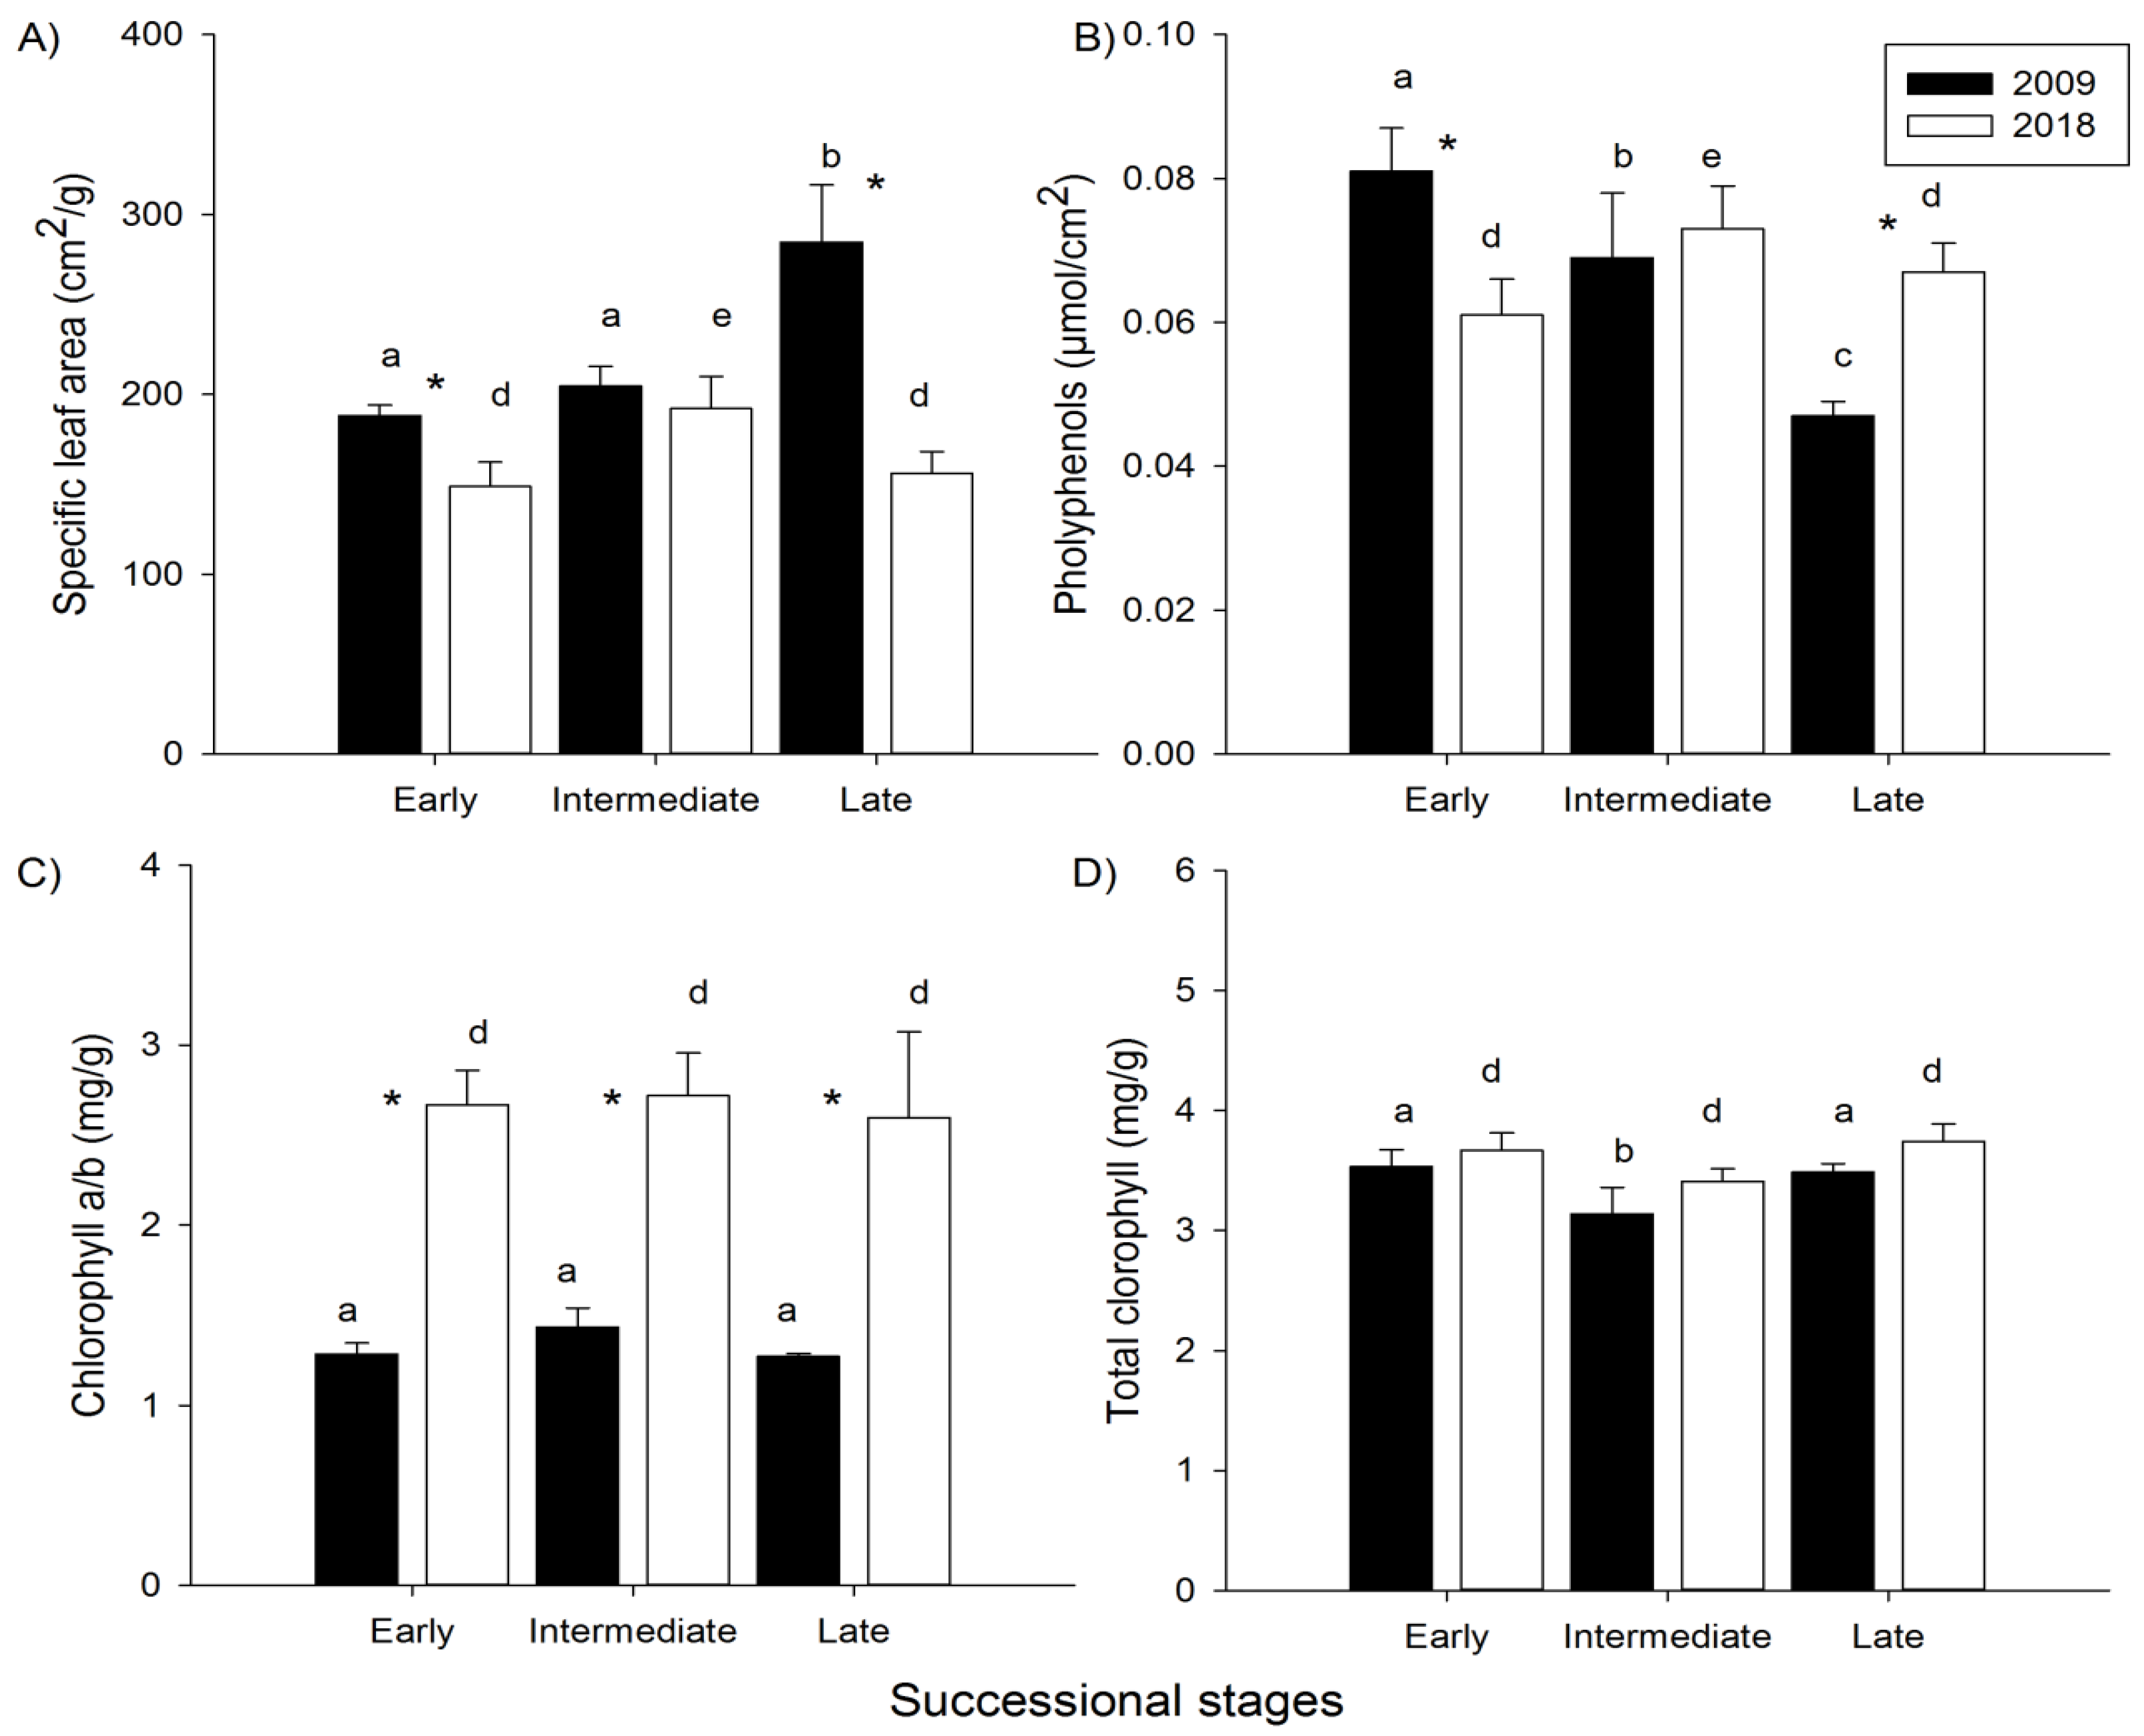
Figure 2.
Ordering of leaf functional traits of tree species in early, intermediate and late successional stages in 2009 and 2018 (n = three plots per stage) through principal component analysis (PCA). The variables that explained most of the variation in each axis are indicated.
Figure 2.
Ordering of leaf functional traits of tree species in early, intermediate and late successional stages in 2009 and 2018 (n = three plots per stage) through principal component analysis (PCA). The variables that explained most of the variation in each axis are indicated.
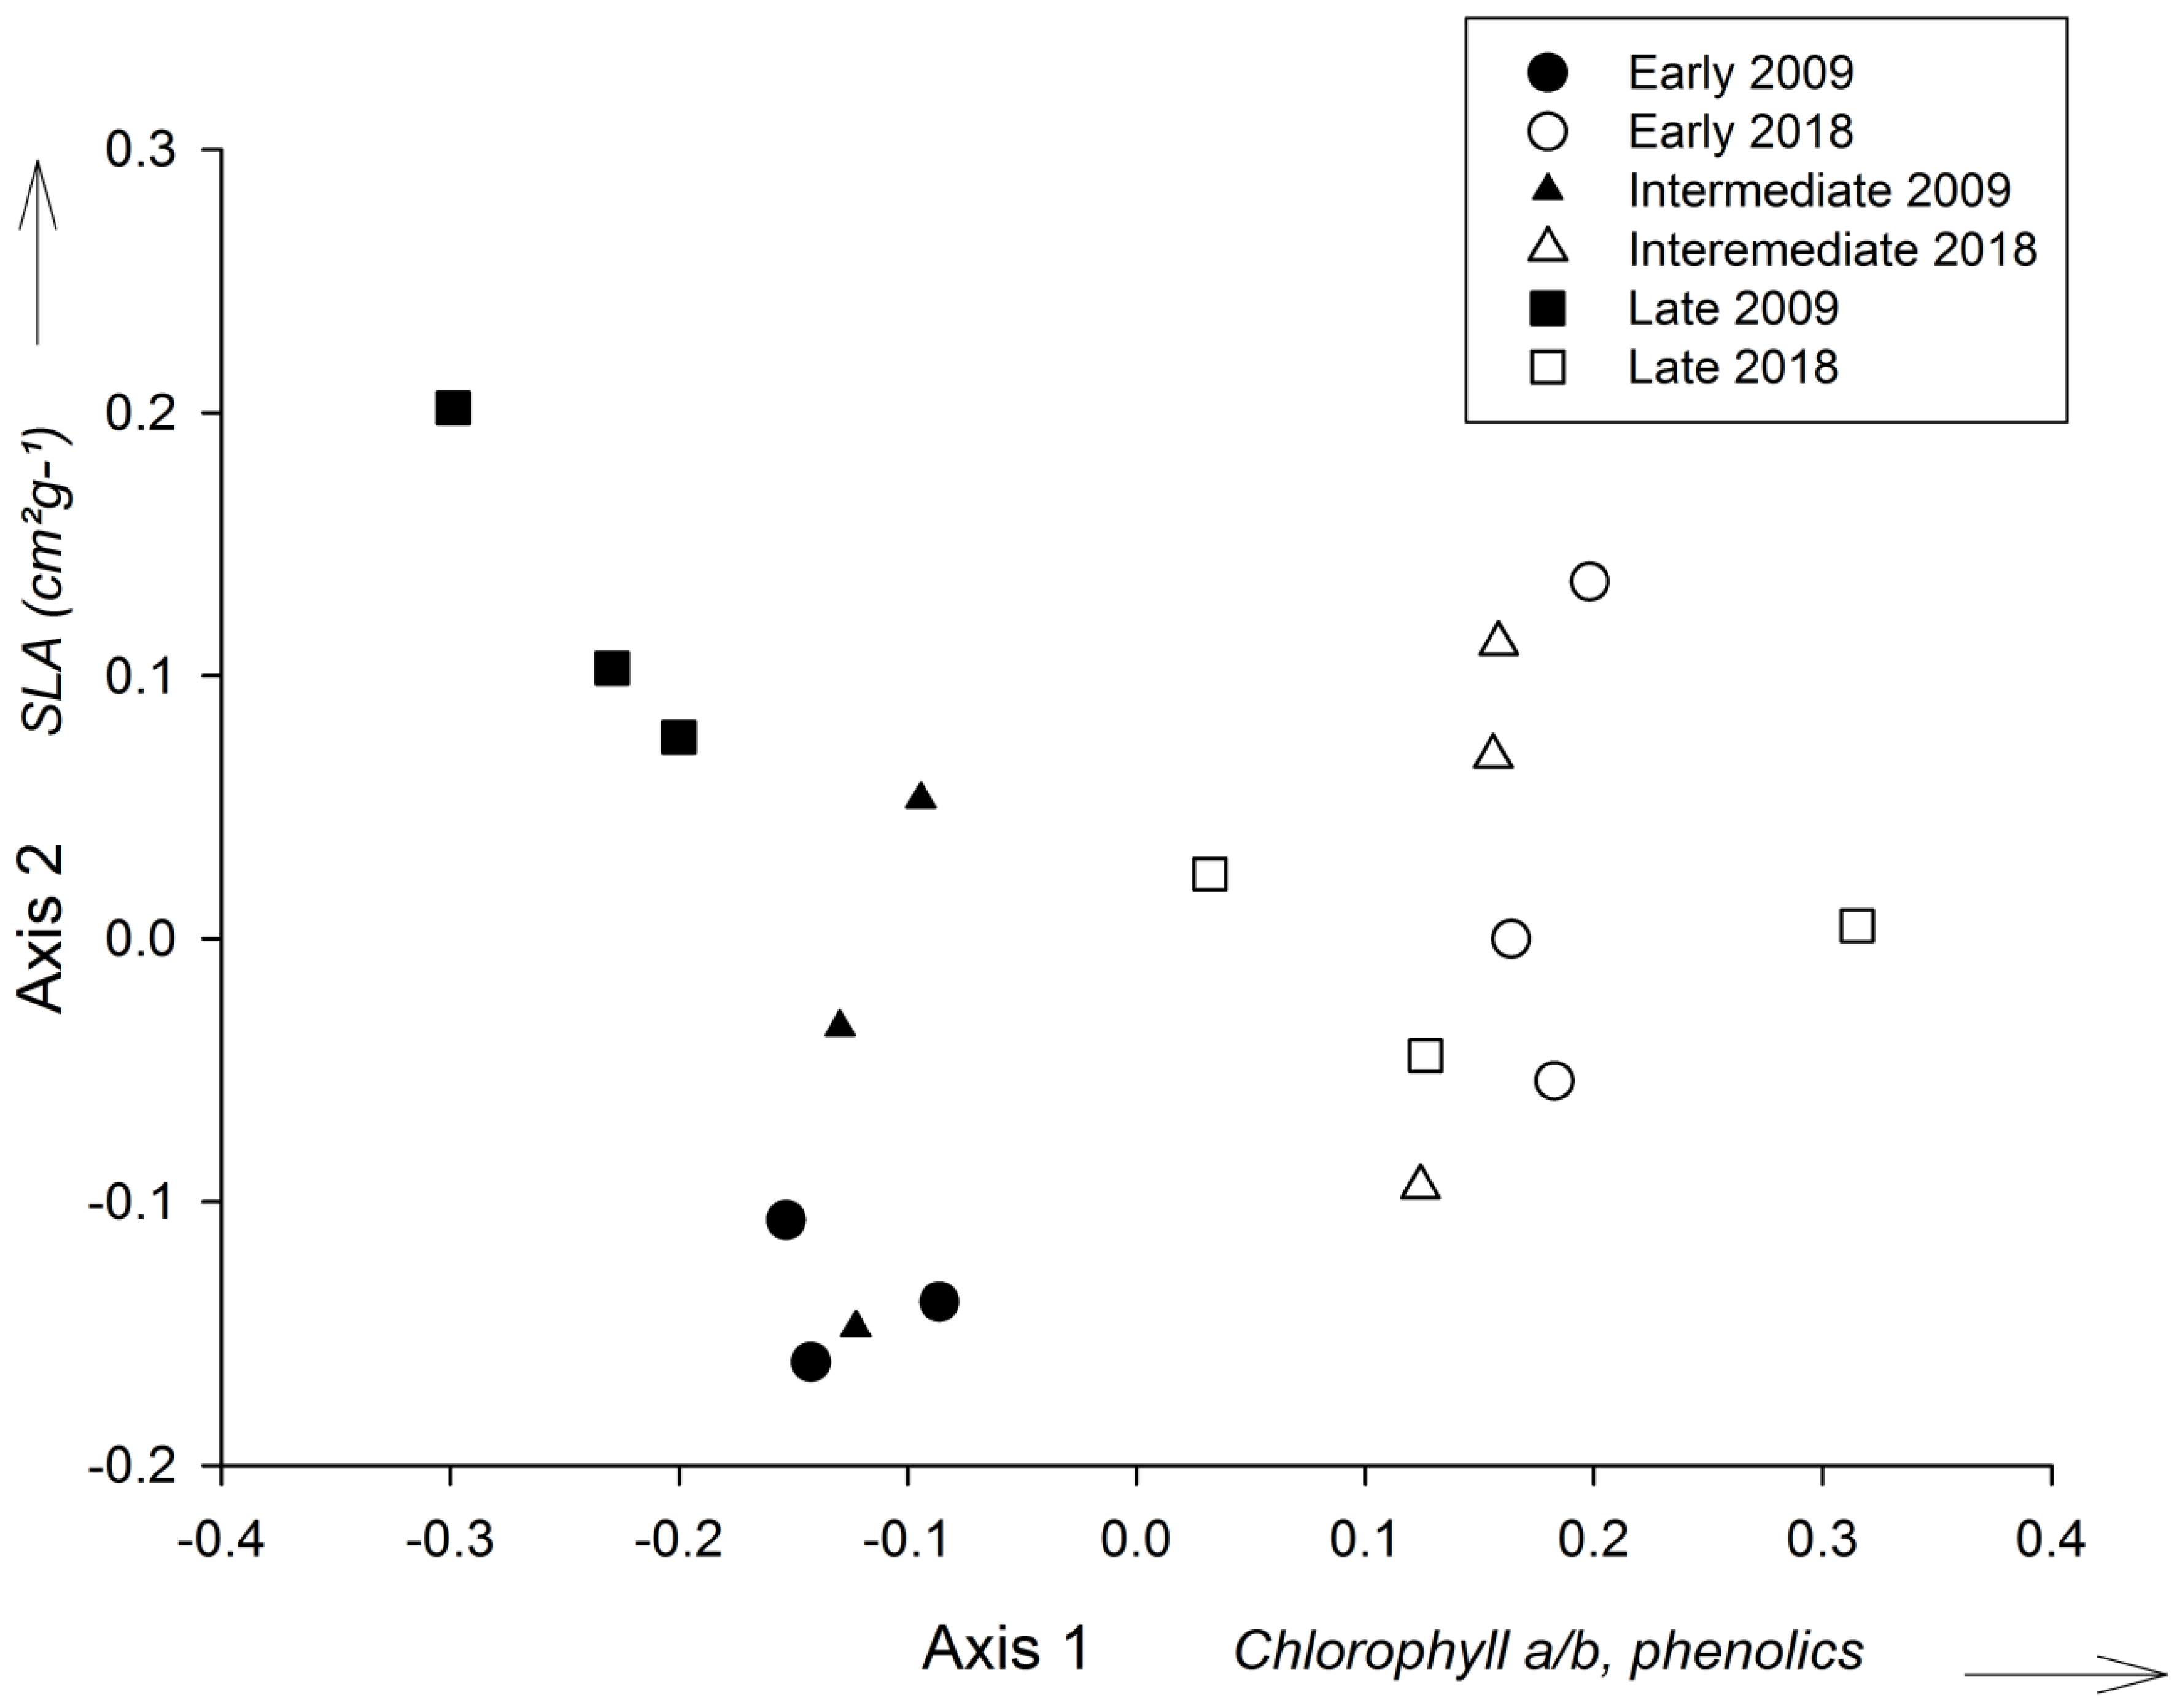

Table 1.
Tree species with the highest importance value (IV) at each successional stage in 2009 and 2018 in the Mata Seca State Park, Brazil.
Table 1.
Tree species with the highest importance value (IV) at each successional stage in 2009 and 2018 in the Mata Seca State Park, Brazil.
| Tree species | Family | Successional stage | |||
| IV | Early | Intermediate | Late | ||
| 2009 | |||||
| Astronium urundeuva | Anacardiaceae | 32.54 | X | ||
| Handroanthus chrysotrichus | Bignoniaceae | 26.63 | X | ||
| Tabebuia reticulata | Bignoniaceae | 22.13 | X | X | |
| Combretum duarteanum | Combretaceae | 20.92 | X | X | |
| Commiphora leptophloeos | Burseraceae | 11.97 | X | X | |
| Senna spectabilis | Fabaceae | 9.49 | X | ||
| Cenostigma pluviosum | Fabaceae | 9.43 | X | X | X |
| Terminalia fagifolia | Combretaceae | 9.31 | X | X | |
| Handroanthus ochraceus | Bignoniaceae | 8.60 | X | ||
| Machaerium acutifolium | Fabaceae | 5.59 | X | ||
| Mimosa tenuiflora | Fabaceae | 4.47 | X | ||
| Senegalia polyphylla | Fabaceae | 3.87 | X | ||
| Spondias tuberosa | Anacardiaceae | 3.77 | X | ||
| 2018 | |||||
| Astronium urundeuva | Anacardiaceae | 31.44 | X | X | |
| Handroanthus chrysotrichus | Bignoniaceae | 24.45 | X | ||
| Tabebuia reticulata | Bignoniaceae | 21.32 | X | X | |
| Combretum duarteanum | Combretaceae | 19.12 | X | X | |
| Commiphora leptophloeus | Burseraceae | 10.77 | X | X | |
| Terminalia fagifolia | Combretaceae | 8.87 | X | X | |
| Handroanthus ochraceus | Bignoniaceae | 7.99 | X | ||
| Handroanthus spongiosus | Bignoniaceae | 7.69 | X | ||
| Cenostigma pluviosum | Fabaceae | 7.47 | X | X | |
| Enterolobium contortisiliquum | Fabaceae | 7.21 | X | ||
| Aspidosperma parvifolium | Apocynaceae | 6.78 | X | ||
| Cochlospermum vitifolium | Bixaceae | 5.71 | X | ||
| Coccoloba schwackeana | Polygonaceae | 5.29 | X | ||
| Machaerium acutifolium | Fabaceae | 4.99 | X | ||
| Leutzelburgia andradelimae | Fabaceae | 4.83 | X | ||
| Manihot anomala | Euphorbiaceae | 4.32 | X | ||
| Randia armata | Rubiaceae | 4.21 | X | ||
| Acosmium lentiscifolium | Fabaceae | 3.98 | X | ||
| Aralia warmegiana | Araliaceae | 3.91 | X | ||
| Cordia incognita | Cordiaceae | 3.87 | X | ||
| Pereskia bahiensis | Cactaceae | 3.76 | X | ||
| Platymiscium floribundum | Fabaceae | 3.45 | X | ||
| Sapium glandulosum | Euphorbiaceae | 3.32 | X | ||
| Schinopsis brasiliensis | Anacardiaceae | 3.12 | X | ||
Table 2.
Forest structural parameters (mean ± standard error) in three successional stages in a Brazilian tropical dry forest in 2009 and 2018. HCI = Holdridge complexity index.
Table 2.
Forest structural parameters (mean ± standard error) in three successional stages in a Brazilian tropical dry forest in 2009 and 2018. HCI = Holdridge complexity index.
| Parameter | Early | Intermediate | Late | ||||||
| Year | Year | Year | |||||||
| 2009 | 2018 | Change | 2009 | 2018 | Change | 2009 | 2018 | Change | |
| Basal Area (m2 ha−1) | 0.50±0.09ª | 0.68±0.16d | +36% | 1.73±0.16b | 1.23±0.12e | -28% | 2.56±0.17c | 2.15±0.17f | -16% |
| Height (m) | 6.07±0.39ª | 7.34±0.77d | +20% | 8.92±0.22b | 8.51±0.50d | -4% | 10.0±0.64c | 9.49±0.29e | -5% |
| Density (ha−0.1) | 47.6±0.77ª | 57.5±10.5d | +20% | 50.4±0.58a | 44.1±3.54e | -12% | 62.3±0.42b | 56.9±3.01d | -8% |
| Species richness | 12.3±1.22ª | 10.3±1.22d | -16% | 22.2±1.19b | 19.0±1.21e | -14% | 21.8±1.40b | 19.3±1.30e | -15% |
| HCI | 2.42±0.88ª | 3.94±1.38d | +62% | 17.9±3.53b | 8.64±1.08e | -51%* | 35.3±5.02c | 22.5±2.58f | -36%* |
Letters a, b, c = statistically significant differences among successional stages in 2009; letters d, e, f = statistically significant differences among stages in 2018. * = statistically significant differences between years for each stage.
Table 3.
Physicochemical soil parameters (mean ± standard error) of three successional stages in a Brazilian tropical dry forest, in 2009 and 2018.
Table 3.
Physicochemical soil parameters (mean ± standard error) of three successional stages in a Brazilian tropical dry forest, in 2009 and 2018.
| Parameters | Early | Intermediate | Late | ||||||
| Year | Year | Year | |||||||
| 2009 | 2018 | 2009 | 2018 | 2009 | 2018 | ||||
| Chemical | Change | Change | Change | ||||||
| pH | 6.8±0.11ª | 6.36±0.14d | -6.0% | 5.3±0.05b | 5.16±0.0e | -2.0% | 6.63±0.16a | 6.36±0.03d | -4.0% |
| P Meh | 4.0±0.57ª | 1.0±0.07d | -75%* | 3.0±0.00a | 1.0±0.07d | -66%* | 3.0±0.44a | 1.0±0.33d | -200%* |
| K | 143.0±18.9ª | 96.0±7.96d | -32% | 64.0±2.6b | 53.0±1.6e | -17% | 126.0±12.8a | 108.0±9.13d | -14% |
| Ca | 8.0±0.18ª | 8.0±0.78d | 0% | 3.0±0.58b | 3.0±0.24e | 0% | 8.0±0.50a | 8.0±0.37d | 0% |
| Mg | 2.0±0.38ª | 3.0±0.76d | +50% | 1.0±0.03b | 1.0±0.08e | 0% | 2.0±0.15a | 3.0±0.09d | +50% |
| Organic matter | 3.0±0.09ª | 7.09±0.07d | +133%* | 3.0±0.02a | 5.0±0.06d | +66%* | 3.0±0.05a | 6.0±0.06d | +100%* |
| Organic C | 2.0±0.05ª | 4.0±0.04d | +100%* | 1.0±0.12a | 3.0±0.03d | +200%* | 3.0±0.06a | 4.0±0.39d | +33% |
| Physical | |||||||||
| Sand | 53.0±2.8ª | 55.0±4.8d | +3.0% | 48.0±1.2a | 47.0±1.15d | -2.0% | 43.0±6.3a | 55.0±8.3d | +27% |
| Silt | 20.0±1.0a | 30.0±3.6d | +50% | 14±0.72b | 15.0±1.76e | +7.0% | 23.0±3.35a | 29.0±7.85d | +26% |
| Clay | 27.0±2.4a | 15.0±1.76d | -44%* | 39.0±0.6b | 38.0 ±1.1e | -2.0% | 34.0±3.05c | 17±1.33d | -50%* |
Letters a, b, c = statistically significant differences among successional stages in 2009; letters d, e, f = statistically signifi-cant differences among successional stages in 2018. * = statistically significant differences between years for each stage.
Table 4.
Expected and observed patterns for vegetation structure, light and soil conditions and in leaf functional traits using a chronosequence (early, intermediate and late stages) approach in 2009 and 2018, and temporal data from 2009 to 2018 in a Brazilian tropical dry forest. HCI = Holdridge complexity index; PAR = photosynthetically active radiation; WHC = water holding capacity. Green shades indicate that the proposed pattern was corroborated.
| Parameter | Prediction | Observed trend | ||
| Chronosequence 2009 | Chronosequence 2018 | Temporal (2009-2018) | ||
| Biotic and abiotic changes | ||||
| HCI | Increase | Increase | Increase | Decrease in the intermediate and late |
| PAR | Decrease | Decrease | Higher in the intermediate | Decrease |
| Soil nutrients | Increase | Lower in the intermediate | Lower in the intermediate | Decrease in P and increase in organic matter |
| Soil WHC | Increase | Higher in the intermediate | Higher in the intermediate | Decrease in the early and late |
| Leaf functional traits | ||||
| SLA | Increase | Increase | Higher in the intermediate | Decrease |
| Polyphenols | Decrease | Decrease | Higher in the intermediate | Decrease in early, increase in intermediate and late |
| Total chlorophyll | Increase | Lower in the intermediate | No significant differences | No significant differences |
| Chlorophyll a/b | Increase | No significant differences | No significant differences | Increase |
Disclaimer/Publisher’s Note: The statements, opinions and data contained in all publications are solely those of the individual author(s) and contributor(s) and not of MDPI and/or the editor(s). MDPI and/or the editor(s) disclaim responsibility for any injury to people or property resulting from any ideas, methods, instructions or products referred to in the content. |
© 2024 by the authors. Licensee MDPI, Basel, Switzerland. This article is an open access article distributed under the terms and conditions of the Creative Commons Attribution (CC BY) license (http://creativecommons.org/licenses/by/4.0/).
Copyright: This open access article is published under a Creative Commons CC BY 4.0 license, which permit the free download, distribution, and reuse, provided that the author and preprint are cited in any reuse.


