Submitted:
16 August 2024
Posted:
16 August 2024
You are already at the latest version
Abstract
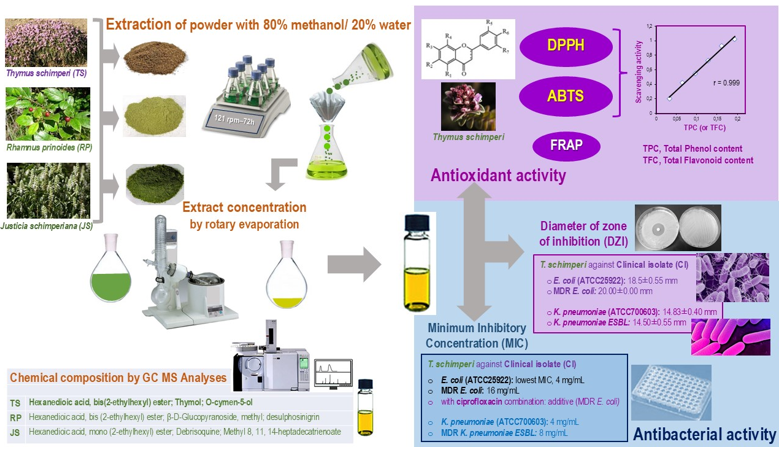
Potentially, traditional medicine is used to manage multidrug resistance (MDR) bacterial infections. This study determined the antioxidant and antibacterial activities of Thymus schimperi (Ts), Rhamnus prinoides (Rp) and Justicia schimperiana (Js) from Addis Ababa against MDR-Uropathogenic Bacteria. Hydromethanolic extracts were prepared. Quantitative determination of phytochemicals and DPPH, ABTS and FRAP assays for antioxidant activities were carried out. In vitro, antibacterial activity and minimum inhibitory concentration (MIC) were performed. Ts had the highest total phenolic (TPC), flavonoid (TFC) and proanthocyanidin content. GC-MS analyses identified 14 bioactive-compounds: in Ts extract, with hexanedioic acid, bis(2-ethylhexyl) ester, thymol, and o-cymen-5-ol being the most predominant, respectively; in Rp extract (6 compounds; hexanedioic acid, bis(2-ethylhexyl) ester, β-D-glucopyranoside, methyl and desulphosinigrin respectively); and in Js extract (5 bioactive-compounds: hexanedioic acid, mono (2-ethylhexyl) ester, debrisoquine, and 8,11,14-heptadecatrienoate, methyl ester) being predominant, respectively. The extracts' TPC showed a strong negative correlation with the DPPH assay (r= -0.999; p=0.023), while its TFC correlated significantly with the ABTS assay (r=0.999; p= 0.032). Ts showed the highest antibacterial activity against clinical isolates of Escherichia coli and Klebsiella pneumoniae ESBL at 1000 mg/mL, and TS had the lowest MIC (4 mg/mL) among evaluated extracts against E. coli (ATCC25922). In conclusion, Ts and Rp showed activity against patient-isolated MDR-uropathogenic E. coli and K. pneumoniae ESBL.
Keywords:
Thymus schimperi
; Rhamnus prinoides
; Justicia shimperiana
; multidrug resistance
; Escherichia coli
; Klebsiella pneumoniae ESBL
1. Introduction
The emergence of antimicrobial resistance is a major health challenge and an urgent priority for Ethiopian policymakers. Mainly, urinary tract infections (UTIs) are of great concern and common infections since previous UTIs can predispose to future infections. And, it is mostly caused by Gram-negative bacteria namely E. coli, P. aeruginosa and P. pneumoniae [1]. In this regard, medicinal plants can be used to overcome socioeconomic and health impact caused by multidrug resistance (MDR) bacteria, including methicillin resistance staphylococcus aureus and MDR Gram-negative bacteria such as E. coli and K. pneumoniae [2,3].
Traditional medicine in Ethiopia is a significant part of healthcare delivery due to its integration into local culture, and making it accessible to the majority of the population [4]. However, regulating this practice is challenging using the nationwide safety and effectiveness frameworks used to common medicine categorizations and descriptions [5,6].
Uncontrolled use of antibiotics certainly contributes to the emergence of MDR against many bacterial strains [7]. Spite of it, the combinations of drug-herbals have been reported to improve the efficacy of chemotherapeutic agents with low side-effect profiles to the living tissues [8] and antibiotics having no intrinsic antibacterial activity as well as susceptibility of bacteria to previously ineffective antibiotics [9].
Importantly, the method to tackle these infectious diseases might be establishing the therapeutic potential of the medicinal plants. To provide reliable evidence for potential therapeutics against MDR-uropathogenic bacteria from Addis Ababa, we selected three endemic Ethiopian medicinal plant species, Thymus schimperi, Rhamnus prinoides and Justicia schimperiana, used by traditional healers for the treatment of various diseases, including bacterial infections.
Thymus schimperi, Rhamnus prinoides and Justicia schimperiana are Ethiopian medicinal plants that have been used for treatment of various diseases, including bacterial infections. The genus Thymus is one of the genera from the family Lamiaceae. In Ethiopia, Thymus is characterized by two endemic species, namely Thymus schimperi and Thymus serrulatus. Locally, they are known as ‘Tosign’ (in Amharic). They grow between 2,200 and 4,000 m altitude, are perennial herbs, woody at the base, and are 5–40 cm high [10]. Traditionally, T. schimperi is claimed to treat various diseases such as renal disease, gonorrhea, cough, liver disease, and hypertension [11].
In Ethiopia, Rhamnus prinoides L'Herit (Rhamnus prinoides) is an endemic plant to Ethiopia that grows up to 6 m high. It is locally cultivated from 1000–3200 m, and widely planted in gardens [12]. It is also known as ‘Gesho’ (in Amharic). It is used as a laxative, diuretic, preventive for syphilis, depurative, and cholagogue. For children with tonsillitis or with tonsils removed, some macerated leaves of ‘Gesho’ are put in the mouth to relieve the pain [13]. It has been traditionally used to add flavor to the local alcoholic drinks, 'tella' and 'tej' (in Amharic), brewed from fermented barley, sorghum, or finger millet [14]. As per [12] report, Rhamnus prinoides is used to treat different kinds of bacterial infections and exhibits a strong antioxidant property due to the presence of polyphenols in sufficient amounts.
Justicia schimperiana is a plant belonging to the family of Acanthaceae. Justicia shimperiana has different local names in Ethiopia including ‘dhumuugaa’ (in Afaan Oromoo), ‘Sensel’ or ‘Simiza’ (in Amharic) and ‘Surpa’, ‘Kasha’ or ‘Keteso’ (in Sidama). This plant has several medicinal uses in different areas of Ethiopia. Accordingly, ethnobotanical study reports show that the plant is used in the treatment of various ailments such as evil eye, hepatitis B (jaundice), rabies, asthma, common cold, stomachache, diarrhea, tapeworm infestation, anthrax, wound, external parasite, ascariasis and skin irritation [15,16]. Moreover, the crude extract of J. schimperiana has shown to exhibit antibacterial activity against Neisseria gonorrhea and Shigella flexineri [17].
These studied plants have been checked with “World Flora Online” (www.floraonline.org), and the names of the plants correspond to the latest revision and have accepted names. To solve MDR, scientific studies of medicinal plants are necessary to sustain the traditional potential claims of medicinal activities. Therefore, this study aimed to evaluate the quantitative and qualitative phytochemical analysis, GC-MS characterization of bioactive constituents of the plants, and in vitro antioxidant and antibacterial activities of the three extracts against MDR-uropathogenic E. coli and K. pneumoniae ESBL and reference strains, as well as the synergistic activities between ciprofloxacin and each of these three plant extracts. Briefly, this study aimed to establish the antibacterial potential of the three aforementioned plants against MDR-uropathogenic E. coli and K. pneumoniae ESBL.
2. Materials and Methods
2.1. Plant Collection and Study Areas
Fresh leaves of Rhamnus prinoides was collected from the cultivated garden of a family on 15th May 2021 in Addis Ababa, Ethiopia. Then after, it was identified by taxonomist at National Herbarium, Department of Biology, College of Natural and Computational Sciences, Addis Ababa University and the specimen (number ME 001) and deposited for future reference. The second plant, Thymus schimperi leaves were collected on 30th July 2021 from Debre Birhan town near villages, Amhara Region, Ethiopia which is 120 Km away from Addis Ababa to Northwest direction. The third plant, Justicia shimperiana leaves were collected from Debre Markos, East Gojjam Zone, Amhara Region, 300 Km away from Addis Ababa, Northwest, Ethiopia. The in vitro antioxidant study was carried out in Addis Ababa University, College of Natural and Computational Sciences, in the Center of Food Science and Nutrition, Addis Ababa, Ethiopia. However, the antibacterial study was done in Ethiopian Public Health Institute (EPHI), Traditional and Modern Drugs Studies Directorate, Pharmacology laboratory, Addis Ababa, Ethiopia. The GC-MS analysis of the extracts was done in JIJE LaboGlass Private Limited Company, Addis Ababa, Ethiopia.
2.2. Chemicals and Reagents
In this study, the chemicals used were 2,2-diphenyl-1-picrylhydrazyl (DPPH) (Sigma-Aldrich-America), ascorbic acid (vitamin C), 2,2′-azino-di-(3-ethylbenzthiazoline sulfonic acid (ABTS) solution (Roche Diagnostic GmbH, Germany), (±)-6-Hydroxy-2,5,7,8-tetramethylchromane-2-carboxylic acid (Trolox®) (Sigma-Aldrich, America), ferrous sulfate, potassium persulfate (Carl Roth GmbH+ Co.KG, Germany), ciprofloxacin powder, catechin, gallic acid, Dimethyl sulfoxide (DMSO), and methanol (Alpha Chemika, India). The solvent methanol was of analytical grade.
2.3. Study Design
An experimental study design was used to carry out the phytochemical screening test and in vitro antibacterial activity evaluation of the selected medicinal plants against the patient isolated multi-drug resistance uropathogenic bacteria. All experimental tests were done in triplicates alongside the positive and negative controls.
2.4. Plant Extraction
Although a standardized extraction protocol has not been developed for herbal extracts, 20–95% of the solvents substances are frequently used by the herbal medicine industry to prepare plant crude extracts [18]. All three medicinal plants: Rhamnus prinoides, Thymus schimperi, and Justicia shimperiana were extracted with 80% methanol (and 20% distilled water). Two hundred grams of air-dried powdered plant (Thymus schimperi), 150 grams (Rhamnus prinoides), and 250 grams (Justicia shimperiana) materials were placed in a flat-bottom flask filled with 800 mL of methanol and 200 mL (distilled water) extracting solvents and macerated for 72 hours over a rotary shaker at 121 rpm. The suspension was filtered every 24 hours with Whatman Number 1 paper. The residue was re-macerated for the second and third times with fresh solvent. The resulting filtrate was then concentrated under reduced pressure in a rotary evaporator (R-300). The filtrate residue was further dried, followed by a water bath at 45°C, until the solvent was removed. After the solvent was evaporated, the remaining crude extracts were diluted with 10 mL of sterile distilled water and kept in an airtight bottle in the refrigerator until the experiment was carried out.
2.5. Phytochemical Screening
The qualitative phytochemical tests for the identification in the hydromethanolic (80% methanol) crude extract of leaves of Rhamnus prinoides, Thymus schimperi, and Justicia shimperiana were carried out by the methods described in [19,20,21,22,23,24,25]. All the extracts (0.05 g/mL) were subjected to phytochemical screening and performed following the standard protocols using different reagents and chemicals for the detection of the following constituents.
Test for Alkaloids: To the filtrate in test tube, 1 mL of Mayer’s reagent was added drop by drop. The formation of a greenish coloured or cream precipitate indicated the presence of alkaloids.
Test for steroid: Crude extract was mixed with 2mL of chloroform and concentrated H2SO4 was added sidewise. A red colour produced in the lower chloroform layer indicated the presence of steroids.
Test for Flavonoids: 2 mL of each extract was added with 2 mL of 2.0% sodium hydroxide, formation of intense yellow colour is observed. To this, 2 drops of 70% dilute hydrochloric acid were added and yellow colour was disappeared. Formation and disappearance of yellow colour indicates the presence of flavonoids in the sample extract.
Test for saponins: Crude extract was mixed with 5mL of distilled water in a test tube and it was shaken vigorously. The formation of stable foam was taken as an indication for the presence of saponins.
Test for Anthocyanin: Approximately 2 mL of the prepared plant extracts were added to 2 mL of 2N HCl and ammonia. The appearance of a pink red coloration that turned blue violet indicated the presence of anthocyanin.
Test for Coumarin: About 3 mL of 10% NaOH were added to 2 mL of plant extracts. The formation of a yellow colour was an indication for the presence of coumarins.
Test for phenols and tannins: Two milliliters of 5% solution of FeCl3 were added to 1 mL crude extracts. A black or blue-green colour indicated the presence of tannins and phenols.
Test for Terpenoids: Two milliliters of chloroform was added with the 5 ml of plant extract and evaporated on the water path and then boiled with 3 ml of H2S04 concentrated. A grey color formed indicated the entity of terpenoids.
2.6. Inoculum Preparations and Standardization
The patient isolated MDR bacterial strains from urine sample came for urine culture, E. coli, and K. pneumoniae ESBL and reference strains such as E. coli (ATCC25922), and K. pneumoniae (ATCC700603) were utilized to evaluate antibacterial activities of crude plant extracts. The clinical isolates were obtained from Arsho Medical Laboratory, Addis Ababa, Ethiopia. Each bacterial strain was inoculated and incubated (Incubator memmert ├) for 24 hours at 37°C. To prepare the final inoculum, the cultures were diluted with fresh Mueller-Hinton broth to achieve the required standardized turbidity of bacterial suspension (Optical Densities, OD) by measuring using UV-Visible Spectrophotometer at 625 nm, (OD values range from 0.08 to 0.1). It was equivalently match with the turbidity of 0.5 McFarland barium sulfate standard corresponding to 1.0×10⁸ colony forming units (cfu/mL) following the guideline of Clinical and Laboratory Standard Institute [26]. The turbidity of the inoculum tube was adjusted visually by either adding bacterial colonies or by adding sterile normal saline solution to that of the already prepared 0.5 McFarland standard. Finally, the inoculum amount of the bacteria was 5.0×10⁵.
2.7. Antibacterial Assay of Plant Extracts
Antibacterial activity of hydromethanolic leaf extracts was determined by agar well diffusion method [27,28]. Multidrug resistant (MDR) bacterial colonies in a subculture on blood agar plate media were incubated for 24 hours at 35 ± 2°C. The MDR bacterial colonies were dissolved in a normal saline solution with a turbidity equivalent to the 0.5 McFarland standard. One hundred μL of each MDR bacterium was inoculated in Muller Hilton agar (MHA) by spreading the bacterium on the surface of the agar using a sterilized glass spreader. After thirty minutes of inoculation, the wells were prepared using a sterilized steel cork borer (1 cm in diameter). The labeled four wells were with 100 μL of 250, 500, 750, and 1000 mg/mL of the crude extracts and making the final concentration of 25, 50, 75, and 100 mg/well, respectively. All plates were then incubated aerobically at 35 ± 2°C for 24 hours, then, the zone of inhibition was measured using a ruler. The experiment was done in three independent tests for each bacterial strains and the mean of zones of inhibitions was calculated for each extract. A 4% DMSO was used as a negative control. Ciprofloxacin (5 μg) was applied as a positive control.
2.8. Minimum Inhibitory Concentration
The minimum inhibitory concentrations (MICs) for all the crude extracts were evaluated against E. coli and K. pneumoniae ESBL and their reference strains were determined in triplicate using the 96-wells method in Mueller-Hinton broth according to CLSI (Clinical Laboratory Standardization Institute) [29]. A 4% DMSO was used to dilute crude plant extracts. To determine the MICs of each of the extracts, the concentrations prepared for each of the extracts, ranged between 0.03125 mg/mL and 64 mg/mL, while ciprofloxacin concentration ranged between 0.0024 and 5 μg/mL. For all the tested extracts and ciprofloxacin concentrations were prepared by serial dilution in double-strength MHB. A 100 µL of each of the bacterial strains was inoculated to each well. Blank Mueller-Hinton broth was used as a negative control. The wells were inoculated with the standardized (0.5 McFarland standard) bacterial inoculum and incubated at 37 °C for 24 hours. The MIC was defined as the lowest concentration that showed no growth in the Mueller Hinton broth. The result of bacterial inhibition was judged by comparison with growth in positive and negative controls [30].
2.9. Minimum Bactericidal Concentration (MBC)
MBC was determined by a method described in different studies [31]. In this method, the contents of all wells containing a concentration of the crude extracts above the minimum inhibitory concentration (MIC) value from each triplicate, in the MIC determination test, was streaked on Mueller Hinton agar with wire loop aseptically cleaned and incubated at 37°C for 24 hours. The lowest concentration of the extract which showed no bacterial growth after incubation was observed for each triplicate and noted as the MBC. The average value was taken for the MBC of test material against each bacterium. Further, the ratio of MBC/MIC of the extracts indicated the exact definition of the antibacterial effect. If the ratio MBC/MIC was ≤ 4, the effect was considered as bactericidal but if the ratio MBC/MIC was > 4, the effect was defined as bacteriostatic [32].
2.10. Checkerboard Assay
Checkerboard analysis was used to determine the impact on potency of the combination of the extract and the antibiotic in comparison to their individual activities. This comparison is then represented as the Fractional Inhibitory Concentration (FIC) index value. The FIC index value takes into account the combinations that produce the greatest change from the individual antibiotic’s MIC. To quantify the interactions between the extracts and the antibiotic being tested (the FIC index), the following equation is used: FIC index = (MIC of extract in combination/MIC of extract alone) + (MIC of antibiotics in combination/MIC of antibiotics alone). The combination was considered synergistic for ∑FIC ≤ 0.5, additive for 0.5 <∑FIC ≤ 1, indifferent for 1< ∑FIC ≤ 4, and antagonistic for ∑FIC > 4, according to EUCAST definition [33].
2.11. In vitro Antioxidant Studies
In these in vitro antioxidant assays, 1g of each of the extracts was dissolved in 20 mL of 99% methanol to make a concentration of 50 mg/mL and then diluted to prepare the series concentrations for antioxidant assays. For comparison in all the assays, reference chemicals were used.
2.12. DPPH Radical Scavenging Assay
Free radical scavenging ability of the extracts was tested by 2,2-diphenyl-1-picrylhydrazyl (DPPH) radical scavenging assay as described by [34,35]. The hydrogen atom donating ability of the plant extracts was determined by the de-colorization of methanol solution of 2,2-diphenyl-1-picrylhydrazyl (DPPH). DPPH produces violet/purple color in methanol solution and fades to shades of yellow color in the presence of antioxidants. A solution of 0.004% of DPPH (4 mg/100 mL) in methanol was prepared, and 3 mL of this solution was mixed with 1mL of extract in methanol at different concentrations (0.02-0.2 mg/mL). The reaction mixture was vortexed thoroughly and left in the dark at room temperature for 30 min. Ascorbic acid (3 mg/10 mL) was used as reference standard while methanol solution of DPPH was used as control. The optical density of the mixture was measured at 517 nm using PerkinElmer (Lambda 950 UV/VIS NIR spectrometer). Percentage of DPPH radical scavenging activity was calculated by the following equation: Percentage of DPPH radical scavenging activity = {(A0− A1)/A0} × 100; where A0 is the absorbance of the control, and A1 is the absorbance of the extract. The IC50 value was determined by using linear regression equation Y = Mx + C; where, Y = 50, M and C values were derived from the linear graph trendline (for both the standard and samples). The experiment was repeated three times at each concentration.
2.13. ABTS Radical Scavenging Assay
For ABTS assay, the procedure followed the method of [36] with some modifications. The stock solutions included 7.4 mM ABTS+ solution and 2.6 mM potassium persulfate solution. The working solution was then prepared by mixing the two stock solutions in equal quantities and allowing them to react for 24 hours at room temperature in the dark. The solution was then diluted by mixing 1 mL ABTS+ solution with 60 mL methanol to obtain an absorbance of 1.1±0.02 units at 734 nm using PerkinElmer (Lambda 950 UV/VIS NIR spectrometer). Fresh ABTS+ solution was prepared for each assay. The extracts (40 µL) were allowed to react with 2850 µL of the ABTS+ solution for 2 hours in a dark condition. Then, the optical density was taken at 734 nm using the spectrophotometer. The standard curve was linear at 300 µM Trolox. Results were expressed in mM Trolox equivalents (TE)/g of the extract. Additional dilution was needed if the ABTS value measured was over the linear range of the standard curve. The ABTS scavenging capacity of the extract was compared with that of trolox standard. All determinations were performed in triplicate (n = 3).
2.14. Ferric Reducing Antioxidant Power (FRAP) assay
The total antioxidant potential of the crude extracts was determined according to a method described by [37] as a measure of antioxidant power. The assay was based on the reducing power of a compound (antioxidant). A potential antioxidant reduced the ferric ion (Fe3+) to the ferrous ion (Fe2+); the latter forms a blue complex (Fe2+/ tripyridyltriazine (TPTZ)). The FRAP reagent was consisted of 300 mM acetate buffer (pH 3.6), 10 mM TPTZ in 40 mM HCl, and 20 mM FeCl3∙6H2O. The FRAP reagent was prepared by mixing the acetate buffer, TPTZ solution, and FeCl3∙6H2O solution in proportion of 10:1:1 (v/v/v). Briefly, an aliquot of appropriately diluted sample (1 mL) was mixed with 3 mL of freshly prepared FRAP reagent and mixed thoroughly. The reaction mixture was incubated at 37°C for 30 min. Optical density of the mixture was measured at 593 nm versus blank using PerkinElmer (Lambda 950 UV/VIS NIR spectrometer). Ferrous sulphate (0–1000 mM) was used to plot a calibration curve for quantification, and the results were expressed as mmol Fe2+ per 100 g of the extract. All samples were analyzed in triplicate.
2.15. Determination of Total Phenols
The total phenolic content of the three extracts was determined using the modified Folin–Ciocalteu method [38]. A 0.0625 g of gallic acid/standard chemical was dissolved in 50 mL of methanol. Here, the extracts (50 μL of the 50 mg/mL (stock solution) of each) were mixed with 5 mL of Folin–Ciocalteu reagent (previously diluted with distilled water 1:10 v/v) and 4 mL (75 g/L or 7.5%) of sodium carbonate (initially, it was kept in refrigerator for the last 24 hours). The mixture was vortexed for 15 s and allowed to stand for 30 min at 37oC for colour to develop. The optical density was measured in triplicate at 765 nm using an AJI-C03 UV-VIS spectrophotometer.
2.16. Determination of Total Flavonoids
Total flavonoids were estimated using the method of [39]. In this study, the standard chemical quercetin reagent (0.0125 g was dissolved in 50 mL of methanol) and run at a dose of 25-225 μL. One mL of 2% AlCl36H2O which was dissolved in 100 mL of volumetric flask in water and added to each of the extracts and to the standard. Then, it was added to 50 μL of R. prinoides and J. shimperiana, and to 150 μL of T. schimperi and finally allowed to stand for 60 min at room temperature before the optical density was measured at 415 nm using an AJI-C03 UV-VIS spectrophotometer.
2.17. Quantitation of Total Proanthocyanidins
The total proanthocyanidin was measured by the Vanillin/HCl method according to [40]. Briefly, 500 μL (0.5 mL) of T. schimperi and J. shimperiana, and 100 μL (0.1 mL) of R. prinoide from 50 mg/mL stock solution and were added to 3 mL of 4% Vanillin-methanol solution and hydrochloric acid (1.5 mL). The mixture was left for 15 min at room temperature, and then, the optical density was read at 500 nm. Total proanthocyanidins content was calculated from the standard curve for catechin.
2.18. Gas Chromatography-Mass Spectrometry (GC-MS) Analysis
To identify and characterize the bioactive chemicals profile of the hydromethanolic leaf crude extracts, 1 μL amount of concentration from each of the extracts of T. schimperi, R. prinoides, and J. schimperiana extract (of 50 mg/mL stock solution) was injected into a gas chromatography system (Agilent Technologies 7890B) coupled with an inert mass spectrometer (Agilent 5977B) with Single Quadrupole. The separation of the crude extract was achieved using a DB-5ms, capillary column (30 m x 0.25 mm x 0.25 μm) via an inlet split/splitless mode. Helium was used as the carrier gas with a linear velocity/column flow of 1 mL/min. The injector temperature was set at 250°C and oven temperature was kept 110°C for 2 min, and then increase by 10°C/min rate to 200°C and then by 5°C /min rate to 280°C for 9 min. Further, the Mass spectrometer experimental condition was explained as follows: Ionization mode: EI; EMV mode: Gain Factor; Gain Factor: 1; Transfer line temperature: 280°C; Ion Source temp: 230°C; Quad temp: 150°C; Solvent delay: 3 min; and Acquisition mode: SCAN. Finally, The NIST 14 mass spectrometry database library was used to identify the bioactive compounds.
2.19. Data Analysis
In antioxidant study, data were entered and statistically analyzed using SPSS Version 25 (SPSS Inc., Chicago, IL, USA) and Microsoft Office Excel 2017 (Microsoft, Redmond, WA, USA). All measurements were performed in triplicate, and results were expressed as mean ± standard deviation (SD). One-way ANOVA was performed to compare mean differences of the phytochemical contents (Total flavonoids, phenol, and proanthocyanidin contents) among the three extracts. If any mean difference exists in the phytochemical contents, List Significant Difference (LSD) test was used to identify where the differences were. The Pearson correlation coefficient (r) was used to analyze the association among total flavonoids, phenol, and proanthocyanidin contents versus the antioxidant activity (DPPH [IC 50%], ABTS [mean] and FRAP [mean]). In all the statistical tests, p ≤ 0.05 was considered as statistically significant. The findings of the antibacterial effects of the crude extracts in terms of zone of inhibitions, MIC and MBC were summarized in the form of means (± standard deviations). The presence of phytochemical screening results was classified as highly present (+++), moderately (++), slightly (+) and absent (–), respectively. Finally, to identify and characterize the bioactive chemicals profile of the crude extracts, GC-MS analysis was used.
3. Results
3.1. Qualitative Phytochemical Analysis
The findings of the preliminary phytochemical analysis (in qualitative form) showed the presence or absence of the secondary metabolites in the three hydromethanolic leave crude extracts are described in Table 1. Accordingly, the results of the tests on T. schimperi included a maximum of six types of phytochemical groups, such as alkaloids, coumarins, flavonoids, phenols, saponins, and terpenoids. The next, the R. prinoides contains phenol, tannin, flavonoids, coumarins, anthocyanin, alkaloids, and saponins. Finally, the third plant J. shimperiana extract contained five types of phytochemical groups, such as saponin, coumarins, flavonoids, phenol, and tannin.
3.2. Quantitative Phytochemical Analysis
In this study, the quantitative phytochemical analysis of the three hydromethanolic crude leaf extracts of T. schimperi, R. prinoides, and J. shimperiana was carried out to determine the total phenolic content, flavonoids, and proanthocyanidins and the findings have been presented in Table 2. The results demonstrated that the total flavonoid content was 90.39±0.35 Quercetin Equivalence (QE)/100 g of dry R. prinoides material; 82.43±2.53 QE/100 g of dry J. shimperiana material; and 227.96±3.69 QE/100 g of dry T. schimperi material. Among the three crude extracts, T. schimperi had the highest average (±SD) in phytochemical contents of flavonoids (227.96±3.69), phenolic (274.50±5.29), and proanthocyanidins (1618.06±1.32) (Table 2). The concentration-response (calibration) curve of the standard chemical quercetin in the determination of flavonoids contents was plotted in Figure 1A.
As shown in Table 2, the total phenolic contents of the three hydromethanolic of crude extracts were determined using the standard gallic acid. The standard gallic acid linear regression calibration curve is presented in Figure 1B. Total phenolic content of the extract was calculated as gallic acid Equivalent/100 g of the dry plant materials. And, accordingly, the highest phenolic quantity was detected in T. schimperi (274.50±5.29) followed by R. prinoides (229.21±2.82) (Table 2).
Among the three extracts, the highest proanthocyanidin content (catechin equivalence per 100 g of the dry plant material) was found in T. schimperi (1618.06±1.32) followed by J. shimperiana (1037.18±4.06) (Table 2). The linear regression curve of the catechin standard concentration (mg/mL) versus the optical density was shown in Figure 1C.
3.3. DPPH Radical Scavenging Assay
The result of various concentrations versus the DPPH scavenging activity in terms of percentage inhibition of the three hydromethanolic extracts with the positive control ascorbic acid is shown in Table 3. The synthetic antioxidant ascorbic acid was used as a positive control at the same concentrations of the tested extracts. The percentage inhibition of DPPH scavenging activities of the three hydromethanolic crude extracts was evaluated at concentrations of 0.02-0.2 mg/mL. There was an increase in DPPH radical scavenging activity with increasing concentrations of the extracts. At 0.2 mg/mL concentration, the percentage inhibition of all the extracts was relatively higher than the rest of the concentration. The scavenging effect of the standard drug ascorbic acid was higher than all the extracts. However, in all the extracts (T. schimperi, R. prinoides and J. shimperiana) tested, T. schimperi exhibited a comparable antioxidant activity with that of standard ascorbic acid at varying concentrations tested (0.02- 0.2 mg/mL) (Table 3).
3.4. Ferric Reducing Antioxidant Power Assay (FRAP assay)
The FRAP assay results of the three hydromethanolic leave crude extracts were expressed as mmole equivalent of ferrous sulfate and are shown in Figure 2. Similar to DPPH assay, all the extracts showed an antioxidant activity in FRAP assay. The T. schimperi extract showed the highest reducing antioxidant power among the extracts with 2521.60 mmole ferrous sulfate Eq (mmole Fe2+), followed by R. prinoides (1810.55 mmole Fe2+). The linear regression curve of the standard compound (ferrous sulfate) used in FRAP assay at different concentrations is presented in Figure 1D.
3.5. ABTS Assay
The ABTS radical scavenging activity of the three hydromethanolic leaf extracts with reference compound, 6-hydroxy-2,5,7,8- tetramethylchroman-2-carboxylic acid (Trolox®) is shown in Figure 3. The ABTS assay results were expressed as µmole equivalent of trolox®. The ABTS radical scavenging activity of the extracts was evaluated at 40 µL (n=3; triplicate). Therefore, the findings revealed that T. schimperi was the highest antioxidant activity with a mean of 27296.65 µmole trolox Eq (µmole trolox®), followed by R. prinoides (18857.62 µmole trolox®). The linear regression curve of the standard compound (Trolox®) in ABTS assay used at different concentrations is presented in Figure 1E.
3.6. Analyses
According to the one-way ANOVA analyses, there was a statistical significance (p < 0.05) in mean differences of each measurement across the column among the three extracts (Table 4).
Correlation between Antioxidant Assays & Phytochemical Contents
The Pearson correlation coefficients between the antioxidant assays and the Total Flavonoids Content (TFC), Total Phenol Content (TPC), and Total Proanthocyanidins Content (TPROC) were analyzed and presented in Table 5. The Total Phenol Contents showed almost a perfect negative correlation with the antioxidant activity value from DPPH (IC 50%) assay (r= -0.999) at a level of statistical significance (p=0.023). Further, the lowest IC50% means, the highest antioxidant activity. Additionally, these analyses revealed that the total flavonoid contents of the extracts correlated significantly with ABTS assay (mean of scavenging activity; r=0.999; p = 0.032). However, the total proanthocyanidins content did not correlate with the antioxidant activities of the extracts (Table 5).
3.7. In Vitro Evaluation of Antibacterial Activity
Except J. shimperiana, the rest of the results of this study showed the hydromethanolic crude leave extracts and their combination had an antibacterial activity against the patient isolated multi drug resistant (MDR) E. coli compared to the negative control. According to the records, T. Schimperi earned the highest diameter of zone of inhibition (DZI: 20.00±0.00 mm) at 1000 mg/mL concentration compared to all the uncombined tested extracts. However, the extract-extract combination of T. Schimperi and R. Prinoides had the same antibacterial activity as uncombined T. Schimperi extract at the maximum tested concentration (1000 mg/mL) (Table 6).
Largely, all the tested extracts except J. shimperiana showed a concentration dependent increase in antibacterial activity in the evaluation against E. coli (ATCC25922). T. Schimperi had the highest antibacterial activity at 1000 mg/mL and with this it had (DZI: 18.5±0.55 mm) diameter of the zone of inhibition compared to the other tested extracts. Following this, the extract-extract combination of T. Schimperi and R. prinoides had the second highest antibacterial activity (DZI: 14.5±0.55 mm) (Table 6).
In all the in vitro antibacterial activity evaluation against the E. coli (both clinical isolate and reference strain), the antibacterial activities of the extracts were totally lower than ciprofloxacin, the positive control. However, the antibacterial activity of ciprofloxacin against the E. coli (ATCC25922) was higher than its activity against to the MDR E. coli clinical isolate. This finding showed that the standard E. coli (ATCC25922) is a different strain and also, the clinically isolated E. coli had acquired a multi-drug resistance (Table 6).
In the in vitro antibacterial activity evaluation of the three extracts and the combination against the patient isolated MDR K. pneumoniae extended-spectrum β-lactamases (ESBL), T. schimperi had a concentration-dependent maximum inhibition compared to the tested extracts at corresponding similar concentrations. However, the antibacterial activity of T. schimperi was relatively lower compared to ciprofloxacin (DZI: 17.83±0.41 mm). In the T. schimperi and R. prinoides combination, the antibacterial activity was the second with the highest zone of inhibition (DZI: 11.90±0.10 mm) (Table 6).
Activities against K. pneumoniae (ATCC700603), T. schimperi showed the highest zone of inhibition (DZI: 14.83±0.40 mm) compared to the extracts and the combination. Antibacterial activity of R. prinoides extract had also a concentration-dependent increase across the concentrations tested and had a higher antibacterial activity than the activity against the patient isolated MDR K. pneumoniae ESBL (Table 6). In both MDR patient isolated K. pneumoniae extended-spectrum β-lactamases (ESBL) and K. pneumoniae (ATCC700603), the antibacterial activity of J. shimperiana was similar to the negative control (Table 6).
3.8. Minimum Inhibitory Concentration (MIC)
The findings of the MIC of the three hydromethanolic leave crude extracts are displayed in Table 7. In all the extracts, the concentration ranges for MIC determination were evaluated from 64 mg/mL up to 0.03125 mg/mL. within the tests, the MIC activity of the extracts against patient isolated MDR E. coli ranges from 4 mg/mL up to 8 mg/mL whereas against standard E. coli (ATCC25922) ranges 4 mg/mL up to 32 mg/mL. However, the concentration of the standard drug ciprofloxacin for the MIC tested against all E. coli strains was ranged from 5-0.0024 µg/mL.
Both T. schimperi alone and its combination with R. prinoides had the lowest MIC value (4 mg/mL) in the test against the clinical isolate MDR E. coli. However, T. schimperi was the only extract with the lowest MIC (4 mg/mL) among the extracts evaluated against E. coli (ATCC25922). The positive control (ciprofloxacin) had the lowest MIC value compared to all independent extracts and the two extracts combination. In the effect against the patient isolated MDR E. coli, ciprofloxacin MIC was identified at 0.156 µg/mL but MIC value was lowest enough in E. coli (ATCC25922) (0.0048 µg/mL). The lowest MIC of T. schimperi in antibacterial activity evaluation against patient isolated MDR K. pneumoniae was 8 mg/mL but 4 mg/mL (MIC) for activity against K. pneumoniae (ATCC700603) (Table 7).
3.9. Minimum Bactericidal Concentration (MBC)
Among the extracts tested for MBC determination, T. schimperi had the lowest MBC (16 mg/mL) in the evaluation against patient isolated MDR E. coli which were similar to the same concentration to the MBC against the reference strain E. coli (ATCC25922). The standard drug ciprofloxacin had the lowest MBC compared to the extracts. In the test against E. coli (ATCC25922), the MBC of ciprofloxacin was 0.0006 µg/mL. The lowest MBC of T. schimperi in antibacterial activity evaluation against patient isolated MDR K. pneumoniae was 32 mg/mL but 64 mg/mL (MBC) for activity against K. pneumoniae (ATCC700603) (Table 7). The ratio of MBC/MIC of the extracts revealed the exact definition of the antibacterial effect. Accordingly, for both E. coli strains, T. schimperi had a bactericidal effect. R. prinoides had a bacteriostatic in effect against patient isolated MDR E. coli. Whereas T. schimperi and R. prinoides combination showed bacteriostatic effect in the test against MDR E. coli clinical isolate (Table 7). In this study, the ratio of MBC to MIC of T. schimperi alone and in combination R. prinoides in the test against K. pneumoniae (ATCC700603) was bacteriostatic. However, in the test against patient isolated MDR K. pneumoniae ESBL, T. schimperi showed a bactericidal (Table 7).
3.10. Checkerboard Assay
To quantify the interactions, the Fractional Inhibitory Concentration (FIC) index of the checkerboard analysis in this study showed that the interaction of the combinations between T. schimperi extract and ciprofloxacin (positive control) was categorized as indifference in the activity against the three bacterial strains except for MDR E. coli clinical isolate (additive). Similarly, according to the FIC index value the R. prinoides and ciprofloxacin combinations showed an indifference interaction in the test against all the three bacterial strains except for E. coli (ATCC25922) (antagonist) (Table 8).
3.11. GC-MS Analyses
As shown in Table 9, the results obtained from GC-MS analyses of the hydromethanolic extract of T. schimperi clearly revealed the identification and presence of 14 bioactive compounds. The identified and matched compounds were represented with the name of the compound, molecular formula, molecular weight, retention time, percentage composition of the area, nature of the compounds, and chemical structure.
During the analyses, the first compound identified (peak 1) was observed at retention time (4.666 minutes) and the last compound (peak 14) was identified at longest retention time of (19.835 min). Among the compounds eluted, the major compounds identified in this T. schimperi crude extract were hexanedioic acid, bis (2-ethylhexyl) ester (RT: 19.835; 73.88%); thymol (RT: 5.799; 11.68%); O-Cymen-5-ol (RT: 5.931; 7.95%); and p-tert-Butylcatechol (RT: 7.853; 2.19%) respectively along with the other minor constituents. In the GC-MS analyses, chromatogram shows the peak area separation of the components. The mass spectrums of the three major bioactive compounds in T. schimperi crude extract confirmed are presented in Figure 4A-4C. The GC-MS chromatogram of hydromethanolic crude extract of T. schimperi is presented in Figure 6.
In the GC-MS analyses of the hydromethanolic crude extract of R. prinoides, six compounds were identified. In these analyses, the three abundant bioactive compounds identified among the eluted components were the following: hexanedioic acid, bis (2-ethylhexyl) ester (RT: 19.755; 79.36%); beta-D-Glucopyranoside, methyl (RT: 9.719; 10.03%); and Desulphosinigrin (RT: 11.132; 8.28%) (Table 10). The GC-MS chromatogram of hydromethanolic crude extract of R. prinoides is presented in Figure 8.
In this study, the GC-MS analyses of the hydromethanolic crude extract of J. schimperiana confirmed the presence of five bioactive compounds. The predominant compound was hexanedioic acid, mono (2-ethylhexyl) ester (RT: 19.841; 59.6% peak area). The second abundantly occurring bioactive compound was debrisoquine (RT: 13.364; 12.18%) followed by methyl 8, 11, 14-heptadecatrienoate (RT: 15.727; 10.79%) (Table 11). The GC-MS chromatogram of hydromethanolic crude extract of J. schimperiana is presented in Figure 10.
4. Discussion
In this study, the hydromethanolic extracts of the three plant extracts showed antioxidant activity. And the highest DPPH free radical scavenging activity was seen in T. schimperi, followed by R. prinoides extract. Several study reports [41,42] have explained that the lower IC50 values in a sample indicate higher antioxidant activity. As a result, the observed IC50 value indicated that T. schimperi had the greatest antioxidant activity. Though T. schimperi extract showed the highest IC50 value, it was closer to that of the IC50 of ascorbic acid, the greater the inhibitory effectiveness [43]. More or less, in all the extracts, the DPPH assay of this study revealed that the percent of DPPH inhibition was concentration dependent. This result is similar to the report by [41].
The quantitative phytochemical analyses of this study showed that the total phenol content (TPC), total flavonoids content (TFC), and total proanthocyanidin content (TPROC) were found in the highest concentration in T. schimperi extract compared to the other extracts. In the Pearson coefficient analyses, TPC showed a significant negative correlation with DPPH antioxidant activity, which showed that TPCs of the extracts had both hydrogen- and electron-donating abilities of antioxidant capacity. In earlier studies, reports indicated that there is a direct correlation between antioxidant activity and TPC found in extracts, as phenolic compounds have major antioxidant activity [44,45]. However, factors such as genetic and environmental conditions (like growth season and plant maturity) can cause variations in their values [46].
Also, the Pearson coefficient analyses of this study showed that there was a highest positive correlation between total flavonoid content (TFC) and ABTS radical scavenging activity. This study result is in line with previously reported studies [47,48]. These results suggest that this study extracts can be used as a natural source of antioxidants. Earlier reports [49,50] stated that flavonoids, which are plant secondary metabolites, demonstrated to scavenge oxygen species (ROS) consisting of free (OH) radicals.
Briefly, [51] reported that phenolic compounds are the most abundant secondary metabolites in plants, showing a wide range of distinct biological activities, and have received an increasing attention in recent years. Currently, evidence suggests phenolic compounds of plants were reported to have antioxidant [52], and antimicrobial activities [53]. The antimicrobial activity of flavonoids is due to their ability to bind with bacterial cell wall and to interact with extracellular and soluble protein [54].
In this evaluation study of the hydromethanolic crude extracts, T. schimperi had the highest antibacterial activity against the clinical isolates MDR E. coli and K. pneumoniae ESBL compared to the other extracts. Previously, [55,56] were reported, similar to the current finding, T. schimperi oil showed a moderate antibacterial activity on these specific organisms. The finding of this study is similar to several earlier study report by [57] which stated that the Ethiopian medicinal plants presented by local healers in the community were reported to have antibacterial activity against MDR bacterial infections.
The extract-extract combination of T. schimperi and R. prinoides had a similar antibacterial activity in the test against patient isolated MDR E. coli with uncombined T. schimperi. However, the antibacterial activity evaluation revealed that the effect against the rest of these three organisms was lower than uncombined T. schimperi extract. This result clearly indicates that the combined extracts of T. schimperi and R. prinoides did not show synergistic activities. This study is different from [58] report whose study on T. schimperi and Blepharis cuspidata combinations showed a synergistic activity. This could be due to the difference in the type of the combined plant material with T. schimperi, or a difference in the extraction method or other undisclosed factors.
Comparatively, the MIC of the T. schimperi extract had the lowest MIC than the other independent extracts during the antibacterial activity test, except with the MIC (equivalent) of its combination with R. prinoides, in the test against the clinical isolated MDR E. coli and K. pneumoniae EBSL. This result further confirmed that T. schimperi had the highest antibacterial activities for the entire patient isolated MDR bacteria and reference strains compared to the tested extracts. This current study finding is in line with [59] which stated that the lower MIC indicates that the plant extracts were stronger of activities of killing or inhibiting the test pathogens and vice versa. Additionally, this study clearly indicated that the ratio of MBC to MIC of the T. schimperi, except in the test against K. pneumoniae (ATCC 700603), showed a bactericidal activity.
According to the checkerboard analyses of the present study, the interaction of the combinations between the T. schimperi and ciprofloxacin was additive. This is interpreted as an overall antibacterial activity of the extract and positive control combination equals the sum of the individuals’ effect. Thirdly, following the extract-extract combinations’ activity, the R. prinoides extract showed an antibacterial activity against the patient-isolated, MDR E. coli and K. pneumoniae ESBL and their reference strains in a concentration-dependent manner, with a slight increased effect in both reference strains.
In the GC-MS analyses of this study, a total of 14 compounds were identified in the hydromethanolic leaf extract of T. schimperi. These identified compounds possess many biological properties. Hexanedioic acid, bis (2-ethylhexyl) ester (RT: 19.835; 73.88%) was the main component among the total compounds eluted. Several study reports showed that hexanedioic acid, bis (2-ethylhexyl) ester has numerous biological activities such as antioxidant and antibacterial activities [60,61]. The antioxidant and antibacterial activity of the T. schimperi extract in this study is the highest among the tested extracts. Therefore, together with other compounds eluted, hexanedioic acid, bis (2-ethylhexyl) ester offers this important antioxidant and antibacterial activity to have from T. schimperi extract.
Thymol, which is the second major component of T. schimperi extract during the GC-MS analyses, was reported as possessing different biological activities. Accordingly, thymol was stated to have antibacterial activity including against Gram-negative bacteria strains [62,63]. Therefore, the presence of thymol in higher concentration in the hydromethanolic extract of T. schimperi in this study could be the possible explanation for its higher antibacterial and antioxidant activities compared to the other extracts.
Obtained results showed that the third compound in the GC-MS analyses of T. schimperi extract was o-cymen-5-ol. According to [64], o-cymen-5-ol alone or together with zinc has shown direct antimicrobial effects, inhibiting oral disease-related processes, and showing synergistic effects against anaerobes. Further, o-cymen-5-ol was reported by [65] that it has antibacterial activity, absorb specific wavelengths of ultraviolet light, inhibits oxidation, and in cosmetics preparations has antiseptic, anti-acne, and extends the shelf life of products. A report from [66] reported that o-cymen-5-ol has an antibacterial activity. The T. schimperi‘s antibacterial and antioxidant activities possibly could be due to the presence of o-cymen-5-ol alone or together with other phytochemical constituents.
Similar to the finding of the GC-MS analyses of T. schimperi extract, the major constituent of the hydromethanolic crude extract of R. prinoides was hexanedioic acid, bis (2-ethylhexyl) ester. As previously mentioned, this compound has reported to have antioxidant and antibacterial activities [60,61].
The second abundant bioactive compound known as β-D-Glucopyranoside (methyl) among the total eluted compounds in the GC-MS analyses of R. prinoides, was reported to have antibacterial activity [67]. A study report by [68] also described that the β-D-Glucopyranoside (methyl), which is a chemical component found in phenols and flavonoids, could potentially have an antimicrobial, antibacterial effect, and used as a medication for different diseases. Therefore, the antibacterial effects of the R. prinoides in this study might be mediated from the biological activities of these identified compounds existing in adequate amounts during the GC-MS analyses.
5. Conclusions
The findings have shown that among all the three vegetal species, the Thymus schimperi extract showed both the highest antioxidant activity and the highest antibacterial activity against patient isolated MDR E. coli and K. pneumoniae ESBL and reference strains. The interaction of the combination of T. schimperi extract with ciprofloxacin was classified as additive in the case of E. coli MDR. The DPPH and ABTS scavenging activities were correlated with total phenol and flavonoid contents, respectively. Comparatively, Thymus schimperi extract had the highest total phenol, flavonoid and proanthocyanidin contents followed by Rhamnus prinoides extract. In the GC-MS analyses for identifying bioactive compounds, Thymus schimperi extract had 14 compounds, Rhamnus prinoides had 6 compounds and Justicia shimperiana had 5 compounds. The compounds identified have been reported to posess applications in different disease treatments. The presence of the different bioactive compounds and the highest antioxidant activity reported with Thymus schimperi may explain, at least in part, the best antibacterial activity against these patient isolated MDR E. coli and K. pneumoniae ESBL isolates.
6. Recommendation
This study should be expanded using in vivo assays against the targeted MDR uropathogenic induced infections. Similar to the current study and based on the multiple study reports, the identified bioactive compounds which are found in the hydromethanolic crude plant extracts with antibacterial activity against MDR uropathogenic bacteria should be tested in separate compound or in combination with each other or combined with other known compounds with antibacterial activity using both in vitro and in vivo models for antibacterial evaluation.
Authorship Contribution Statement
Conceptualization: Mebrahtu Eyasu (ME) and Sagrario Martín-Aragón (SM); Data curation: ME, and SM; Formal analyses: ME and SM; Funding acquisition: ME; Investigation: ME, SM, Juana Benedí (JB), José Antonio Romero (JAR); Methodology: ME and SM; Project administration: ME, SM, and JB; Resources: ME and SM; Software: ME and SM; Supervision: SM, JB, JAR; Writing – original draft: ME and SM; and Writing – review & editing: ME, SM, JB, JAR.
Data Availability
Chromatogram and fragments of common chemicals will be supplemented.
Declaration of Competing Interest
All authors declare no conflicts of interest.
Acknowledgments
This study was financially supported by the corresponding author as a self-sponsored PhD thesis work in Complutense University of Madrid, Faculty of Pharmacy, Department of Pharmacology, Pharmacognosy, and Botany, Madrid, Spain.
Ethical Consideration
The study was carried out after obtaining ethical clearance from St. Paul’s Hospital Millennium Medical College, Institutional Review Board (IRB), Addis Ababa, Ethiopia. Then, to proceed with the data collection, the study areas were communicated with an official letter together with the ethical clearance. In all the data, the study was done under the legal framework of the IRB guidelines.
List of Abbreviations
ABTS: 2, 2′-azino-di-(3-ethylbenzthiazoline sulfonic acid; ATCC: American Type Culture Collection; CLSI: Clinical and Laboratory Standard Institute; DMSO: Dimethyl sulfoxide; DPPH: 2,2-diphenyl-1-picrylhydrazyl; E. coli: Escherichia coli; EPHI: Ethiopian Public Health Institute; FIC: Fractional Inhibitory Concentration; FRAP: Ferric Reducing Antioxidant Power; GC-MS: Gas-Chromatography coupled with Mass Spectrometry; IC50%: Inhibitory Concentration 50%; J. shimperiana: Justicia shimperiana; K. pneumoniae ESBL: Klebsiella pneumoniae Extended Spectrum Beta-lactamase; MBC: Minimum Bactericidal Concentration; MDR: Multiple Drug Resistance; MHA: Mueller-Hinton Agar; MHB: Mueller-Hinton Broth; MIC: Minimum Inhibitory Concentration; OD: Optical Density; QE: Quercetin Equivalence; R. prinoides: Rhamnus prinoides; T. schimperi: Thymus schimperi; TFC: Total Flavonoid Content; TPC: Total Phenol Content; TPROC: Total Proanthocyanidin Content.
References
- Fair, R.J.; Tor, Y. Antibiotics and Bacterial Resistance in the 21st Century. Perspect. Med. Chem. 2014, 6, S14459. [CrossRef]
- Gadisa, E.; Weldearegay, G.; Desta, K.; Tsegaye, G.; Hailu, S.; Jote, K.; Takele, A. Combined antibacterial effect of essential oils from three most commonly used Ethiopian traditional medicinal plants on multidrug resistant bacteria. BMC Complement. Altern. Med. 2019, 19, 24. [CrossRef]
- Khameneh, B.; Iranshahy, M.; Soheili, V.; Bazzaz, B.S.F. Review on plant antimicrobials: a mechanistic viewpoint. Antimicrob. Resist. Infect. Control. 2019, 8, 1–28. [CrossRef]
- Bekele, G.; Reddy, P.R. Ethnobotanical Study of Medicinal Plants Used to Treat Human Ailments by Guji Oromo Tribes in Abaya District, Borana, Oromia, Ethiopia. Univers. J. Plant Sci. 2015, 3, 1–8. [CrossRef]
- Adams, D.; Dagenais, S.; Clifford, T.; Baydala, L.; King, W.J.; Hervas-Malo, M.; Moher, D.; Vohra, S. Complementary and Alternative Medicine Use by Pediatric Specialty Outpatients. Pediatrics 2013, 131, 225–232. [CrossRef]
- World Health Organization (WHO), 2013. WHO traditional medicine strategy, 2014-2023. World Health Organization. 2013, 1-76.
- Bologa, C.G.; Ursu, O.; Oprea, T.I.; Melançon, C.E., III; Tegos, G.P. Emerging trends in the discovery of natural product antibacterials. Curr. Opin. Pharmacol. 2013, 13, 678–687. [CrossRef]
- Mgbeahuruike, E.E., Yrj¨onen, T., Vuorela, H., Holm, Y., 2017. Bioactive compounds from medicinal plants: focus on Piper species. S. Afr. J. Bot. 112, 54–69.
- Aiyegoro, O.A.; Afolayan, A.J.; Okoh, A.I. Interactions of antibiotics and extracts of Helichrysum pedunculatum against bacteria implicated in wound infections. Folia Microbiol. 2010, 55, 176–180. [CrossRef]
- Derbie, A., Chandravanshi, B.S., 2011. Concentration levels of selected metals in leaves of different species of thyme (T. serrulatus and T. vulgaris) grown in Ethiopia. Biol. Trace Elem. Res. 141(1-3), 317-328.
- Damtie, D.; Mekonnen, Y. Thymus species in Ethiopia: Distribution, medicinal value, economic benefit, current status and threatening factors. Ethiop. J. Sci. Technol. 2016, 8, 81. [CrossRef]
- Chen, G.L., Munyao Mutie, F., Xu, Y.B., Saleri, F.D., Hu, G.W., Guo, M.Q., 2020. Antioxidant, anti-inflammatory activities and polyphenol profile of Rhamnus prinoides. Pharmaceuticals. 13(4), 55.
- Muzila, A., Msagati, T.A.M., Abegaz, B., Nindi, M.M., 2010. Characterization of Geshodin-metal complexation by electrospray-mass spectrometry. 11th NAPRECA Symposium, Book of Proceedings, Antananarivo, Madagascar. 35-44.
- D’avigdor, E.; Wohlmuth, H.; Asfaw, Z.; Awas, T. The current status of knowledge of herbal medicine and medicinal plants in Fiche, Ethiopia. J. Ethnobiol. Ethnomedicine 2014, 10, 38–38. [CrossRef]
- Abera, B. Medicinal plants used in traditional medicine by Oromo people, Ghimbi District, Southwest Ethiopia. J. Ethnobiol. Ethnomedicine 2014, 10, 40–40. [CrossRef]
- Chekole, G.; Asfaw, Z.; Kelbessa, E. Ethnobotanical study of medicinal plants in the environs of Tara-gedam and Amba remnant forests of Libo Kemkem District, northwest Ethiopia. J. Ethnobiol. Ethnomedicine 2015, 11, 1–38. [CrossRef]
- Geyid, A.; Abebe, D.; Debella, A.; Makonnen, Z.; Aberra, F.; Teka, F.; Kebede, T.; Urga, K.; Yersaw, K.; Biza, T.; et al. Screening of some medicinal plants of Ethiopia for their anti-microbial properties and chemical profiles. J. Ethnopharmacol. 2005, 97, 421–427. [CrossRef]
- Zhang, Q.-W.; Lin, L.-G.; Ye, W.-C. Techniques for extraction and isolation of natural products: a comprehensive review. Chin. Med. 2018, 13, 1–26. [CrossRef]
- Harborne, J.B., 1973. Phytochemicals Methods. Chapman and Hall Ltd., London, pp. 49-188.
- Sofowra, A., 1993. Medicinal Plants And traditional Medicine in Africa. Spectrum Books Ltd., Ibadan, Nigeria, pp. 191-289.
- Evans, W., 2002. Trease and Evans' Pharmacognosy New York: Elsevier Health Sciences. 21-24.
- Godghate, A., Sawant, R., Sutar, A., 2012. Phytochemical analysis of ethanolic extracts of roots of Carris carandus Linn. Rasayan J. Chem. 5(4), 456-459.
- Pandey, A., Tripathi, S., 2014. Concept of standardization, extraction and pre phytochemical screening strategies for herbal drug. J Pharmacogn Phytochem. 2(5), 115-119.
- Jaradat, N., Hussen, F., Al Ali, A., 2015. Preliminary Phytochemical Screening, Quantitative Estimation of Total Flavonoids, Total Phenols and Antioxidant Activity of Ephedra alata Decne. J. Mater Environ. Sci. 6(6), 1771-1778.
- Prabhavathi, R.M., Prasad, M.P., Jayaramu, M., 2016. Studies on Qualitative and Quantitative Phytochemical Analysis of Cissus quadrangularis. Adv. Appl. Sci. Res. 7(4), 11-17.
- Clinical and Laboratory Standards Institute (CLSI)., 2015. Methods for dilution antimicrobial susceptibility tests for bacteria that grow aerobically; Approved standard, Tenth edition. CLSI document M07-A10. Wayne, PA: Clinical and Laboratory Standards Institute; 2015. https://clsi.org/media/1632/m07a10 sample.pdf. Accessed October 10 2021.
- Andleeb, S.; Alsalme, A.; Al-Zaqri, N.; Warad, I.; Alkahtani, J.; Bukhari, S.M. In-vitro antibacterial and antifungal properties of the organic solvent extract of Argemone mexicana L.. J. King Saud Univ. - Sci. 2020, 32, 2053–2058. [CrossRef]
- Andualem, G., Umar, S., Getnet, F., Tekewe, A., Alemayehu, H., Kebede, N., 2014. Antimicrobial and phytochemical screening of methanol extracts of three medicinal plants in Ethiopia. Advan. Biol. Res. 8, 101–106.
- Clinical and Laboratory Standards Institute (CLSI)., 2013. Performance Standards for Antimicrobial Susceptibility Testing; Twenty third Informational Supplement, CLSI, Wayne, PA, USA.
- Wayne, P., 2012. Performance standards for antimicrobial susceptibility testing; twenty-second informational supplement. CLSI; 2012.
- Rouis, Z.; Abid, N.; Koudja, S.; Yangui, T.; Elaissi, A.; Cioni, P.L.; Flamini, G.; Aouni, M. Evaluation of the cytotoxic effect and antibacterial, antifungal, and antiviral activities of Hypericum triquetrifolium Turra essential oils from Tunisia. BMC Complement. Altern. Med. 2013, 13, 24–24. [CrossRef]
- Benjamin, T.T., Adebare, J.A., Remi Ramota, R., Rachael, K., 2012. Efficiency of some disinfectants on bacterial wound pathogens. Life Sci. J. 9, 2012.
- Petersen, P.J.; Labthavikul, P.; Jones, C.H.; Bradford, P.A. In vitro antibacterial activities of tigecycline in combination with other antimicrobial agents determined by chequerboard and time-kill kinetic analysis. J. Antimicrob. Chemother. 2006, 57, 573–576. [CrossRef]
- Ceylan, Y.; Usta, K.; Usta, A.; Maltas, E.; Yildiz, S. Evaluation of Antioxidant Activity, Phytochemicals and ESR Analysis of Lavandula Stoechas. Acta Phys. Pol. A 2015, 128, B483–483. [CrossRef]
- Ralte, L.; Bhardwaj, U.; Singh, Y.T. Traditionally used edible Solanaceae plants of Mizoram, India have high antioxidant and antimicrobial potential for effective phytopharmaceutical and nutraceutical formulations. Heliyon 2021, 7, e07907. [CrossRef]
- Arnao, M.B.; Cano, A.; Acosta, M. The hydrophilic and lipophilic contribution to total antioxidant activity. Food Chem. 2001, 73, 239–244. [CrossRef]
- Benzie, I.F.F.; Strain, J.J. The ferric reducing ability of plasma (FRAP) as a measure of “antioxidant power”: The FRAP assay. Anal. Biochem. 1996, 239, 70–76. http://linkinghub.elsevier.com/retrieve/pii/S0003269796902924.
- Apak, R., G¨uçl¨u, K., Ozy¨urek, M., Karademir, S.E., Erça˘g, E., 2006. The Cupric Ion Reducing Antioxidant Capacity (CUPRAC) and polyphenolic content of some herbal teas. Int. J. Food Sci. Nutr. 57(5-6), 292–304.
- Marinova, D., Ribarova, F., Atanasoval, M., 2005. Total phenolics and total flavonoids in Bulgarian fruits and vegetables. J. Univ. Chem. Technol. Metallurgy. 40(3), 255.
- Sun, B.; Ricardo-Da-Silva, J.M.; Spranger, I. Critical Factors of Vanillin Assay for Catechins and Proanthocyanidins. J. Agric. Food Chem. 1998, 46, 4267–4274. [CrossRef]
- Jadid, N., Dewi Hidayati, D., Hartanti, S.R., Arraniry, B.A., Rizka Yuanita Rachman, R.Y., Wikanta, W., 2017. Antioxidant Activities of Different Solvent Extracts of Piper retrofractum Vahl. using DPPH Assay. AIP Conference Proceedings. 1854, 020019.
- Boulfia, M.; Lamchouri, F.; Senhaji, S.; Lachkar, N.; Bouabid, K.; Toufik, H. Mineral Content, Chemical Analysis, In Vitro Antidiabetic and Antioxidant Activities, and Antibacterial Power of Aqueous and Organic Extracts of Moroccan Leopoldia comosa (L.) Parl. Bulbs. Evidence-Based Complement. Altern. Med. 2021, 2021, 1–17. [CrossRef]
- Chand, R.N., Gopalan, R.D., Christi, K., Chand, R.N., Gopalan, R.D., Christi, K., 2018. Evaluation of antioxidant properties in thirteen Fijian medicinal plants used in Alzheimer’s. Dis. Relat. Illn. 8, 11-17.
- Aryal, B.; Niraula, P.; Khadayat, K.; Adhikari, B.; Chhetri, D.K.; Sapkota, B.K.; Bhattarai, B.R.; Aryal, N.; Parajuli, N. Antidiabetic, Antimicrobial, and Molecular Profiling of Selected Medicinal Plants. Evidence-Based Complement. Altern. Med. 2021, 2021, 1–15. [CrossRef]
- Narangerel, T., Bonikowski, R., Jastrzabek, K., Kunicka-Styczyn´ska, A., Plucin´ska, A., et al., 2021. Chemical and Biological Characteristics of Oxytropis pseudoglandulosa Plant of Mongolian Origin. Mol. 26, 7573.
- Mediani, A.; Abas, F.; Ping, T.C.; Khatib, A.; Lajis, N.H. Influence of Growth Stage and Season on the Antioxidant Constituents of Cosmos caudatus. Plant Foods Hum. Nutr. 2012, 67, 344–350. [CrossRef]
- Fidrianny, I., Ari Sri Windyaswari, A.S., Wirasutisna, R.K., 2013. Antioxidant Capacities of Various Leaves Extract from Five Colors Varieties of Sweet Potatoes Tubers Using ABTS, DPPH Assays and Correlation with Total Flavonoid, Phenolic, Carotenoid Content. Research Journal of Medicinal Plants. 7, 130-140.
- Kainama, H.; Fatmawati, S.; Santoso, M.; Papilaya, P.M.; Ersam, T. The Relationship of Free Radical Scavenging and Total Phenolic and Flavonoid Contents of Garcinia lasoar PAM. Pharm. Chem. J. 2020, 53, 1151–1157. [CrossRef]
- Zhang, L.; Tu, Z.-C.; Xie, X.; Lu, Y.; Wang, Z.-X.; Wang, H.; Sha, X.-M. Antihyperglycemic, antioxidant activities of two Acer palmatum cultivars, and identification of phenolics profile by UPLC-QTOF-MS/MS: New natural sources of functional constituents. Ind. Crop. Prod. 2016, 89, 522–532. [CrossRef]
- du Toit, A.; de Wit, M.; Osthoff, G.; Hugo, A. Antioxidant properties of fresh and processed cactus pear cladodes from selected Opuntia ficus-indica and O. robusta cultivars. South Afr. J. Bot. 2018, 118, 44–51. [CrossRef]
- Zhang, Y., Cai, P., Cheng, G., Zhang, Y., 2022. A Brief Review of Phenolic Compounds Identified from Plants: Their Extraction, Analysis, and Biological Activity. Natural Product Communications. 17(1), 1–14.
- Martins, N.; Barros, L.; Ferreira, I.C. In vivo antioxidant activity of phenolic compounds: Facts and gaps. Trends Food Sci. Technol. 2016, 48, 1–12. [CrossRef]
- Karunakaran, T.; Ismail, I.S.; Ee, G.C.L.; Nor, S.M.M.; Palachandran, K.; Santhanam, R.K. Nitric oxide inhibitory and anti- Bacillus activity of phenolic compounds and plant extracts from Mesua species. Rev. Bras. de Farm. 2018, 28, 231–234. [CrossRef]
- Mogana, R.; Adhikari, A.; Tzar, M.N.; Ramliza, R.; Wiart, C. Antibacterial activities of the extracts, fractions and isolated compounds from Canarium patentinervium Miq. against bacterial clinical isolates. BMC Complement. Med. Ther. 2020, 20, 1–11. [CrossRef]
- Nasir, M.; Tafess, K.; Abate, D. Antimicrobial potential of the Ethiopian Thymus schimperi essential oil in comparison with others against certain fungal and bacterial species. BMC Complement. Altern. Med. 2015, 15, 1–5. [CrossRef]
- Cutillas, A.-B.; Carrasco, A.; Martinez-Gutierrez, R.; Tomás, V.; Tudela, J. Thymus mastichina L. essential oils from Murcia (Spain): Composition and antioxidant, antienzymatic and antimicrobial bioactivities. PLOS ONE 2018, 13, e0190790. [CrossRef]
- Chuah, E.L., Zakaria, Z.A., Suhaili, Z., Abu Bakar, S., Desa, M., 2014. Antimicrobial activities of plant extracts against methicillin-susceptible and methicillin-resistant Staphylococcus aureus. JMR 4(1), 6-13.
- Gadisa, E.; Weldearegay, G.; Desta, K.; Tsegaye, G.; Hailu, S.; Jote, K.; Takele, A. Combined antibacterial effect of essential oils from three most commonly used Ethiopian traditional medicinal plants on multidrug resistant bacteria. BMC Complement. Altern. Med. 2019, 19, 24. [CrossRef]
- Ibrahim, N.; Kebede, A. In vitro antibacterial activities of methanol and aqueous leave extracts of selected medicinal plants against human pathogenic bacteria. Saudi J. Biol. Sci. 2020, 27, 2261–2268. [CrossRef]
- Tayade, A.B.; Dhar, P.; Kumar, J.; Sharma, M.; Chauhan, R.S.; Chaurasia, O.P.; Srivastava, R.B. Chemometric Profile of Root Extracts of Rhodiola imbricata Edgew. with Hyphenated Gas Chromatography Mass Spectrometric Technique. PLOS ONE 2013, 8, e52797. [CrossRef]
- Ferdosi, M.F.H.; Khan, I.H.; Javaid, A.; Saeed, H.M.; Butt, I.; Munir, A. GC-MS ANALYSIS PROFILE AND BIOACTIVE COMPONENTS OF FLOWERS OF Bergenia ciliata, A WEED OF ROCK CREVICES. J. Weed Sci. Res. 2021, 27, 527–535. [CrossRef]
- Rúa, J.; del Valle, P.; de Arriaga, D.; Fernández-Álvarez, L.; García-Armesto, M.R. Combination of Carvacrol and Thymol: Antimicrobial Activity Against Staphylococcus aureus and Antioxidant Activity. Foodborne Pathog. Dis. 2019, 16, 622–629. [CrossRef]
- Kachur, K.; Suntres, Z. The antibacterial properties of phenolic isomers, carvacrol and thymol. Crit. Rev. Food Sci. Nutr. 2020, 60, 3042–3053. [CrossRef]
- Pizzey RL, Marquis RE, Bradshaw DJ. Antimicrobial effects of o-cymen-5-ol and zinc, alone and in combination in simple solutions and toothpaste formulations. Int Dent J. 2011; 61(3):33-40.
- ANECO., 2022. O-cymen-5-ol. Available at: https://www.anecochem.com/sale-15370896-o-cymen-5-ol.html. (accessed September 14 2022).
- Lesielle Adaptive Skincare., 2022. O-CYMEN-5-OL. https://www.lesielle.com/int/en/o-cymen-5-ol070#:~:text=O%2Dcymen%2D5%2Dol%20helps%20stabilize%20a%20product%20to,protects%20the%20skin%20from%20infections (accessed 9 July 2022).
- National Center for Biotechnology Information., 2022. PubChem Compound Summary for CID 445238, Methyl beta-D-glucopyranoside. https://pubchem.ncbi.nlm.nih.gov/compound/445238#section=Use-and-Manufacturing (accessed 10 July 2022).
- Panghal, M.; Kaushal, V.; Yadav, J.P. In vitro antimicrobial activity of ten medicinal plants against clinical isolates of oral cancer cases. Ann. Clin. Microbiol. Antimicrob. 2011, 10, 21–21. [CrossRef]
Figure 1.
A. Linear regression calibration curve of the standard quercetin for the determination of flavonoids. B. Linear regression calibration curve of the standard gallic acid for the determination of the total phenol content. C . Linear regression calibration curve of the standard catechin for the determination of proanthocyanidins. D. Linear regression calibration curve of the standard ferrous sulfate in the FRAP assay. E. The linear regression curve of the standard compound (Trolox®) used in ABTS assay.
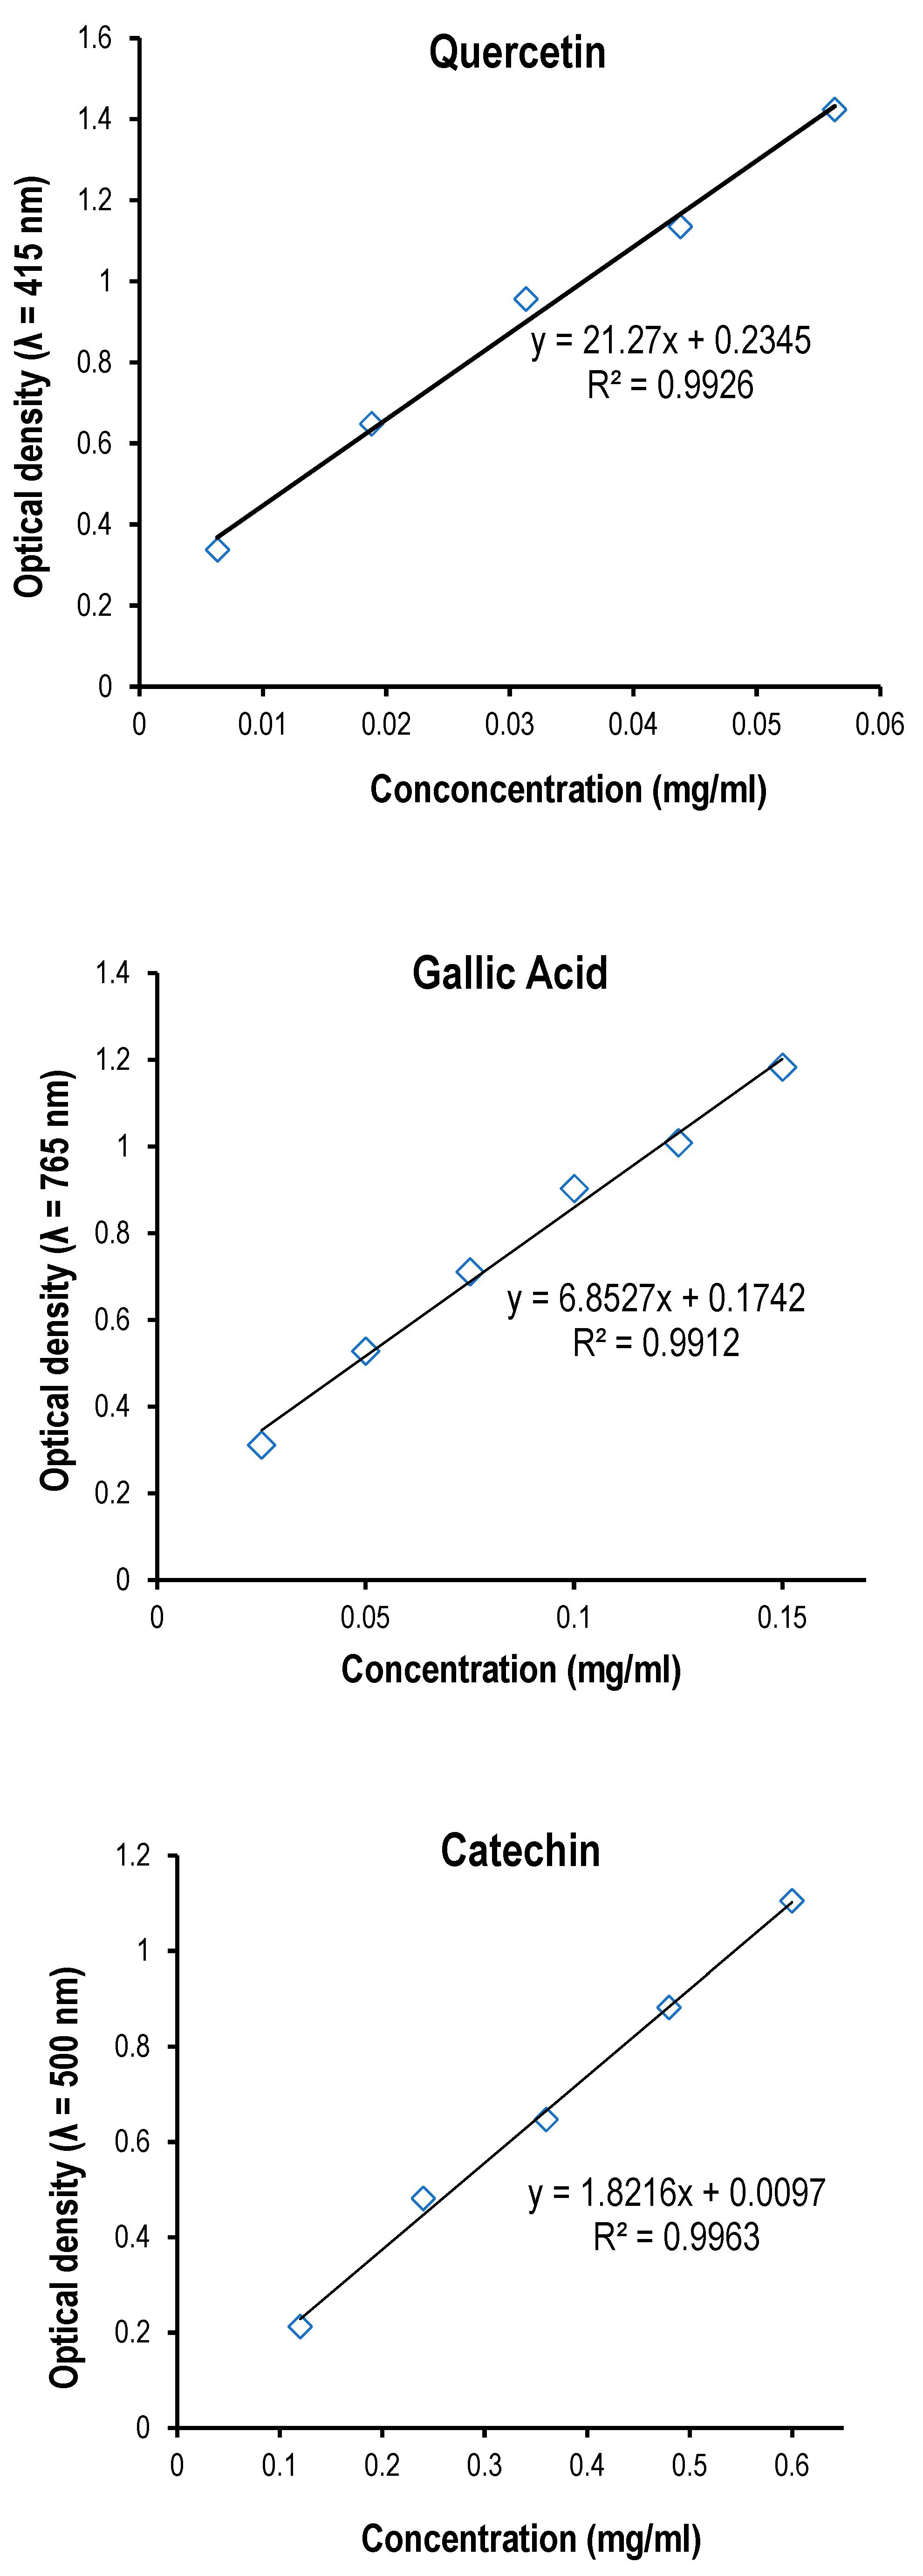
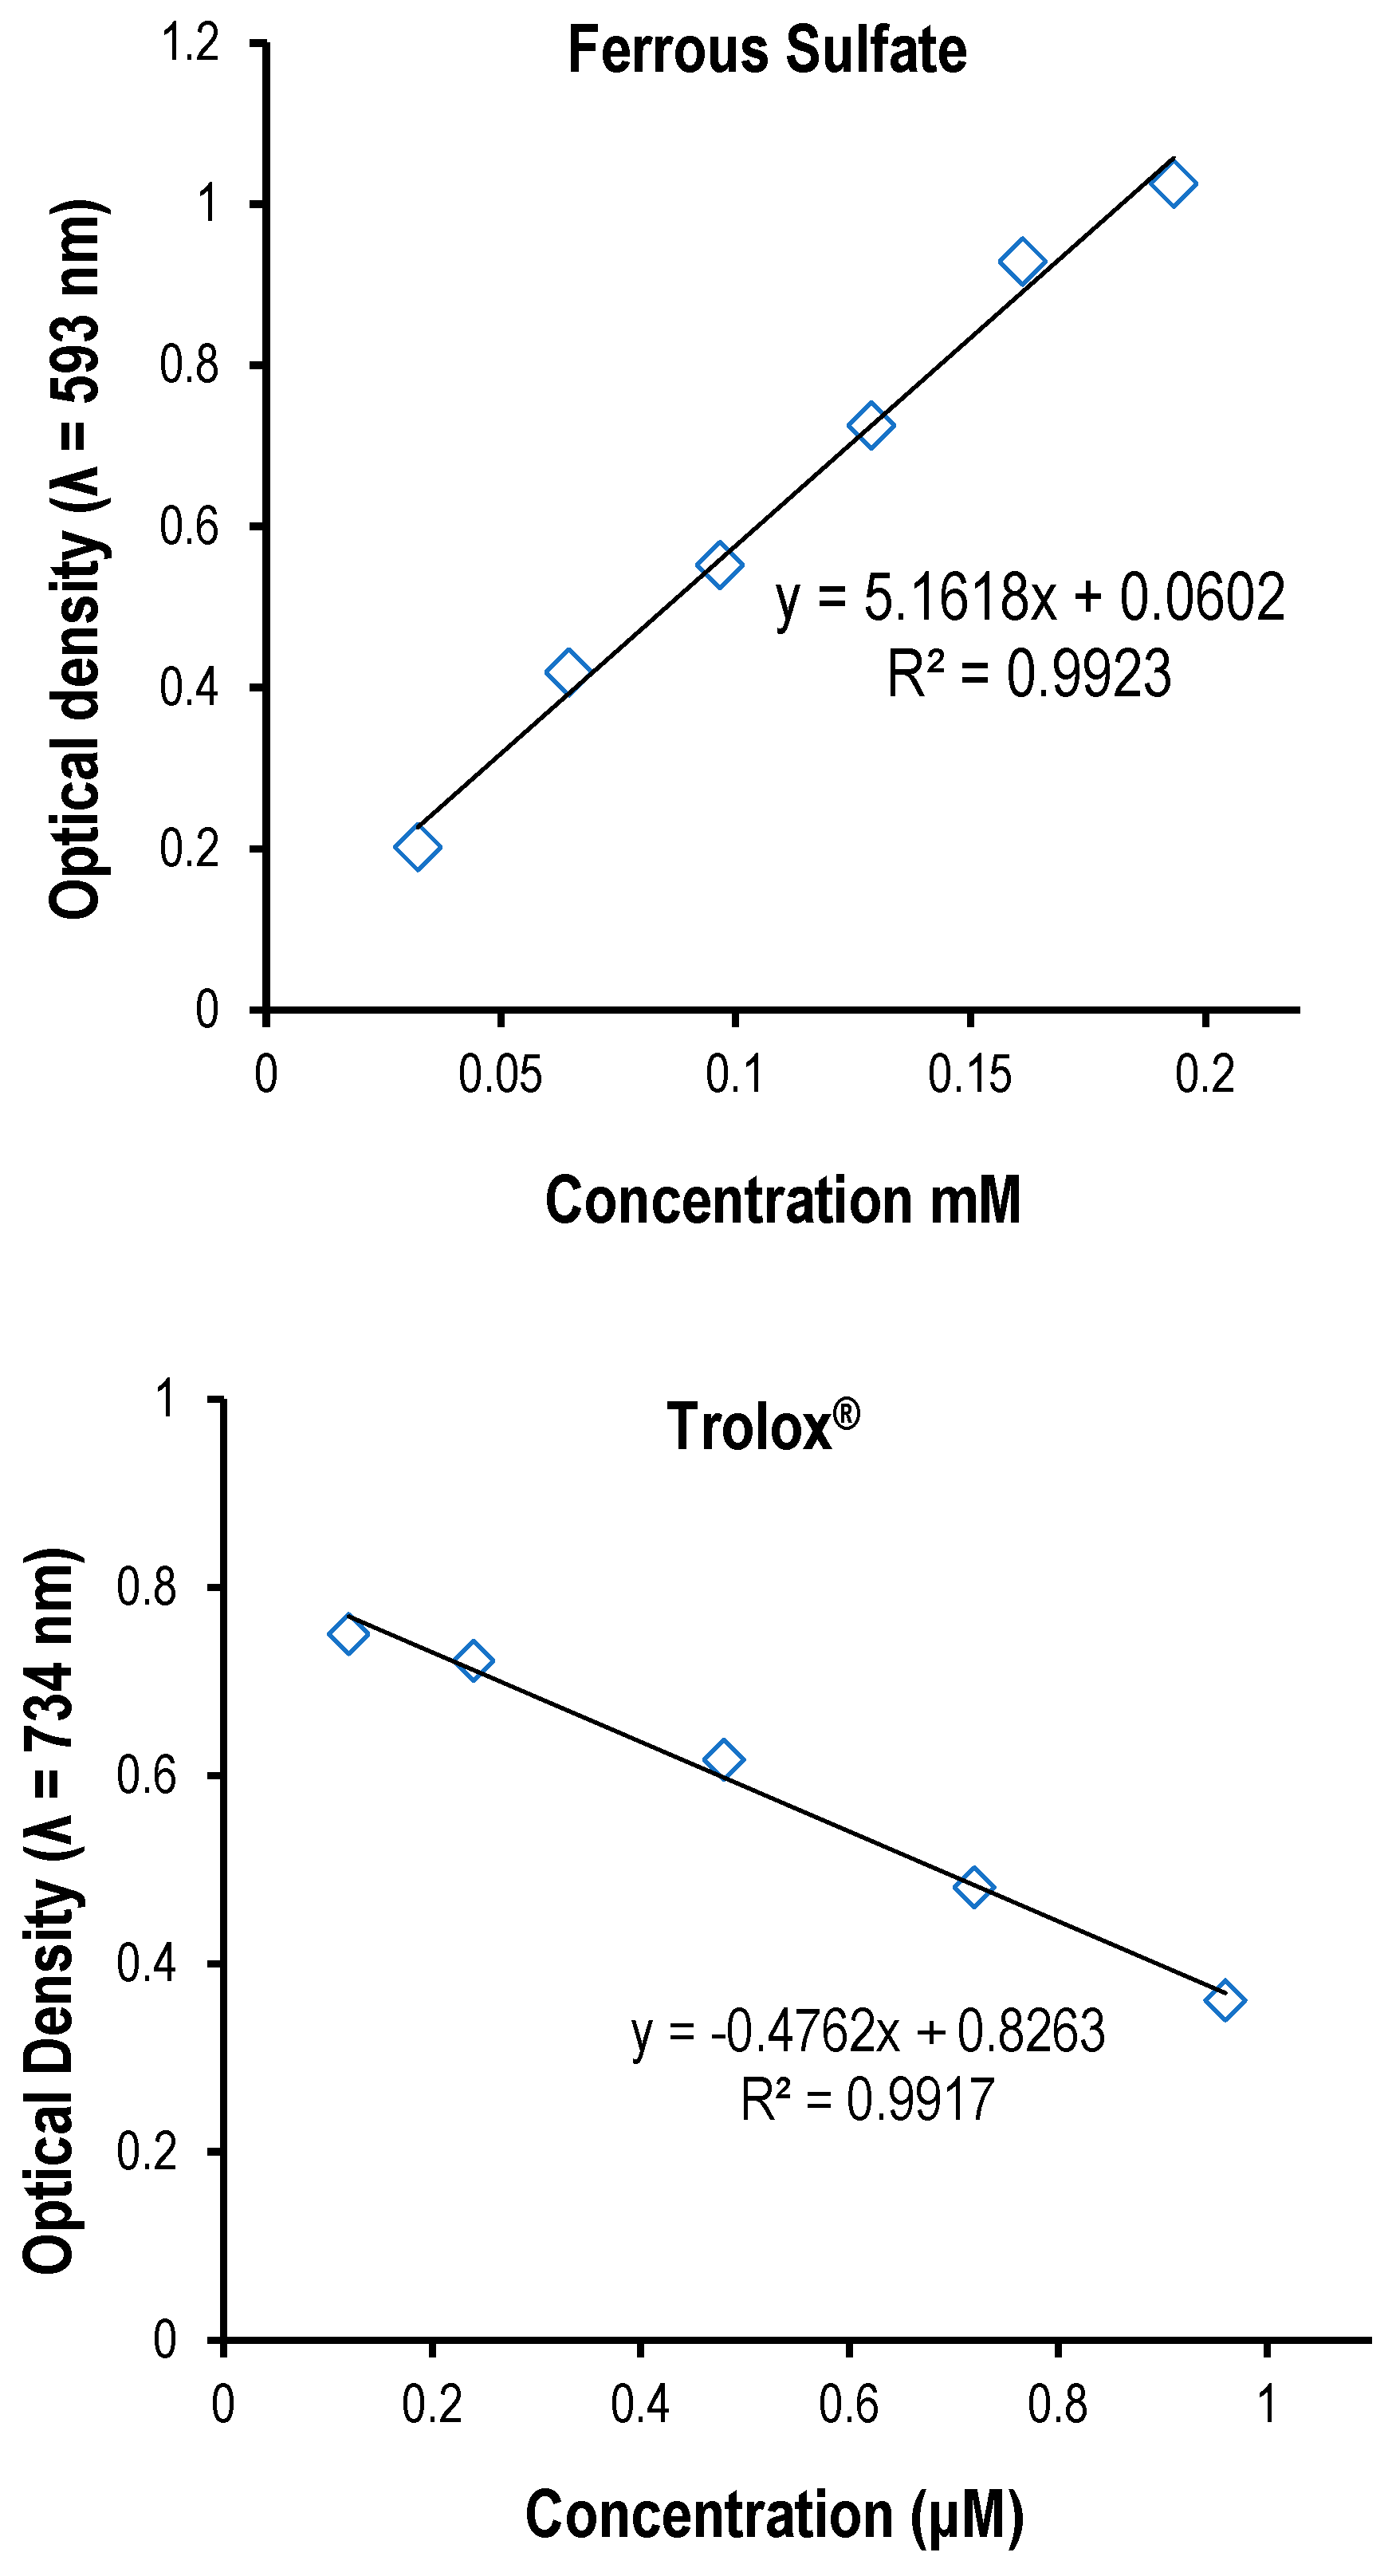
Figure 2.
Ferric reducing antioxidant power assay (FRAP assay) of R. prinoides, J. shimperiana and T. schimperi of hydromethanolic leaf crude extracts. The results are expressed as mmol ferrous sulfate (Fe2+) equivalence/ 100 g. The bars represent the mean ± standard deviation (SD) (n = 3).
Figure 2.
Ferric reducing antioxidant power assay (FRAP assay) of R. prinoides, J. shimperiana and T. schimperi of hydromethanolic leaf crude extracts. The results are expressed as mmol ferrous sulfate (Fe2+) equivalence/ 100 g. The bars represent the mean ± standard deviation (SD) (n = 3).
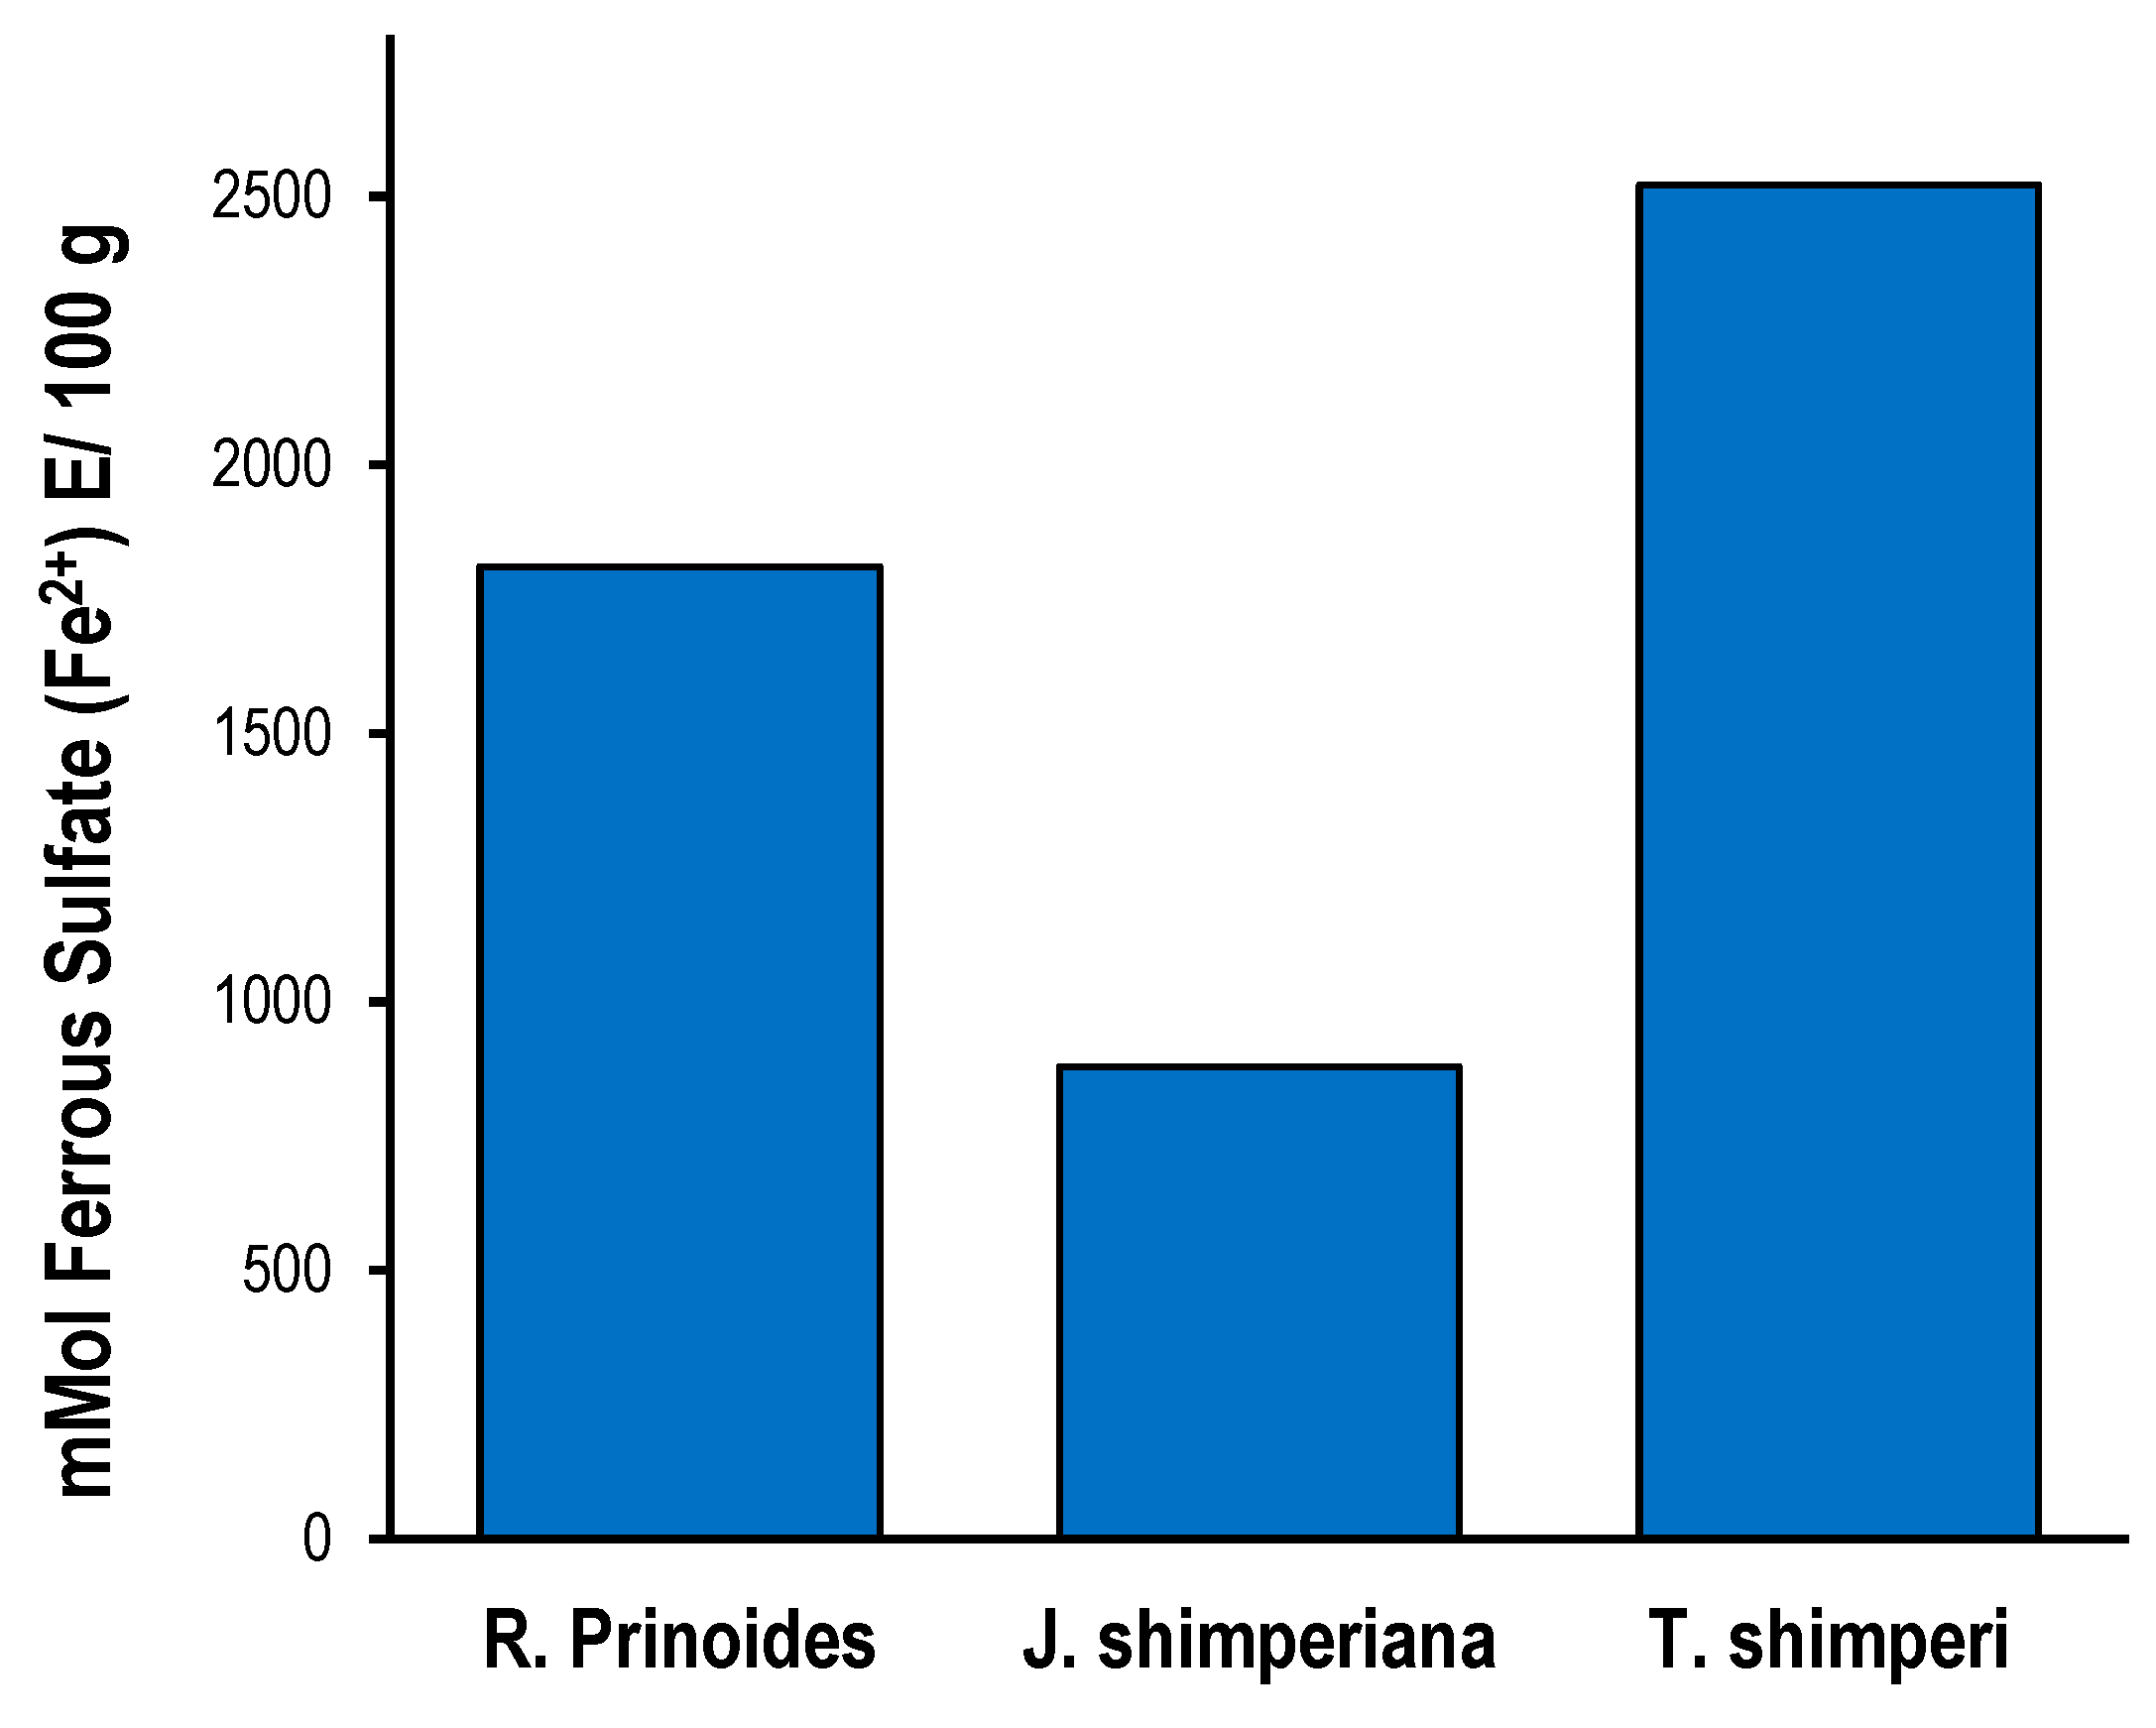
Figure 3.
ABTS assay of R. prinoides, J. shimperiana and T. Schimperi of hydromethanolic extracts. Results are expressed as µmole trolox® equivalence/100 g of dried extract. Data was represented as the mean±SD (n = 3).
Figure 3.
ABTS assay of R. prinoides, J. shimperiana and T. Schimperi of hydromethanolic extracts. Results are expressed as µmole trolox® equivalence/100 g of dried extract. Data was represented as the mean±SD (n = 3).
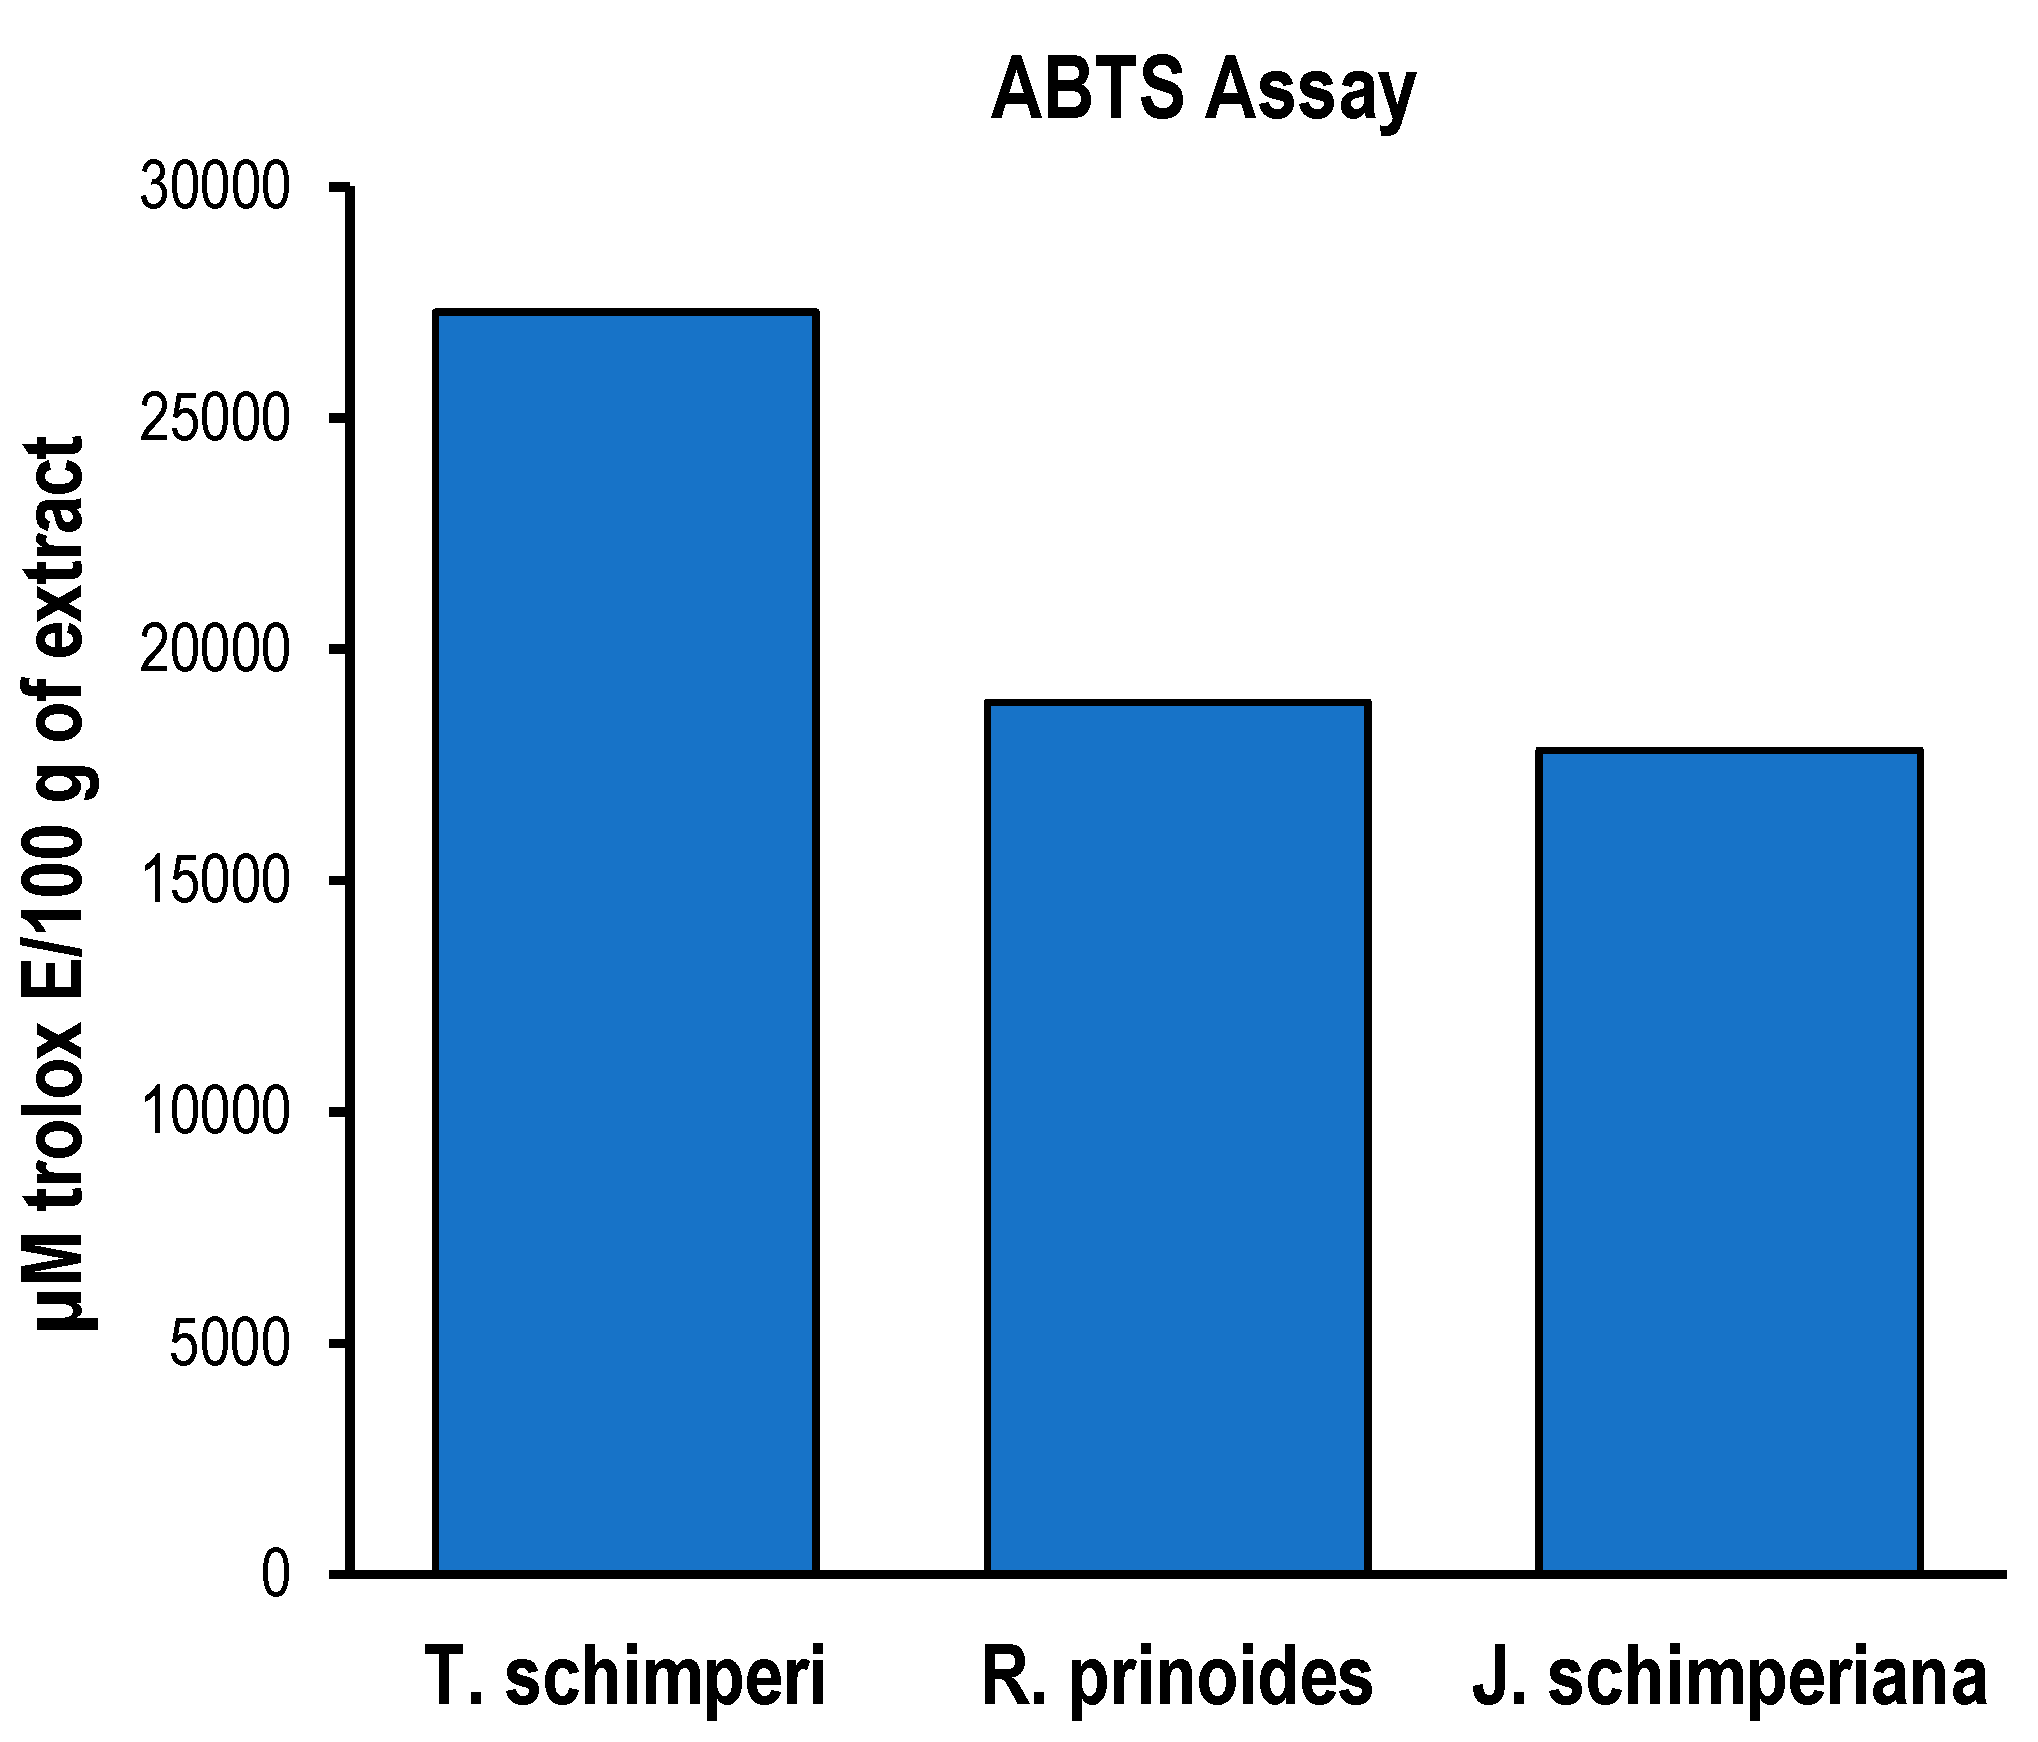
Figure 4.
A-4C. Peak fragmentation of the Chromatography Mass Spectrum of the three Major compounds from T. schimperi.
Figure 4.
A-4C. Peak fragmentation of the Chromatography Mass Spectrum of the three Major compounds from T. schimperi.
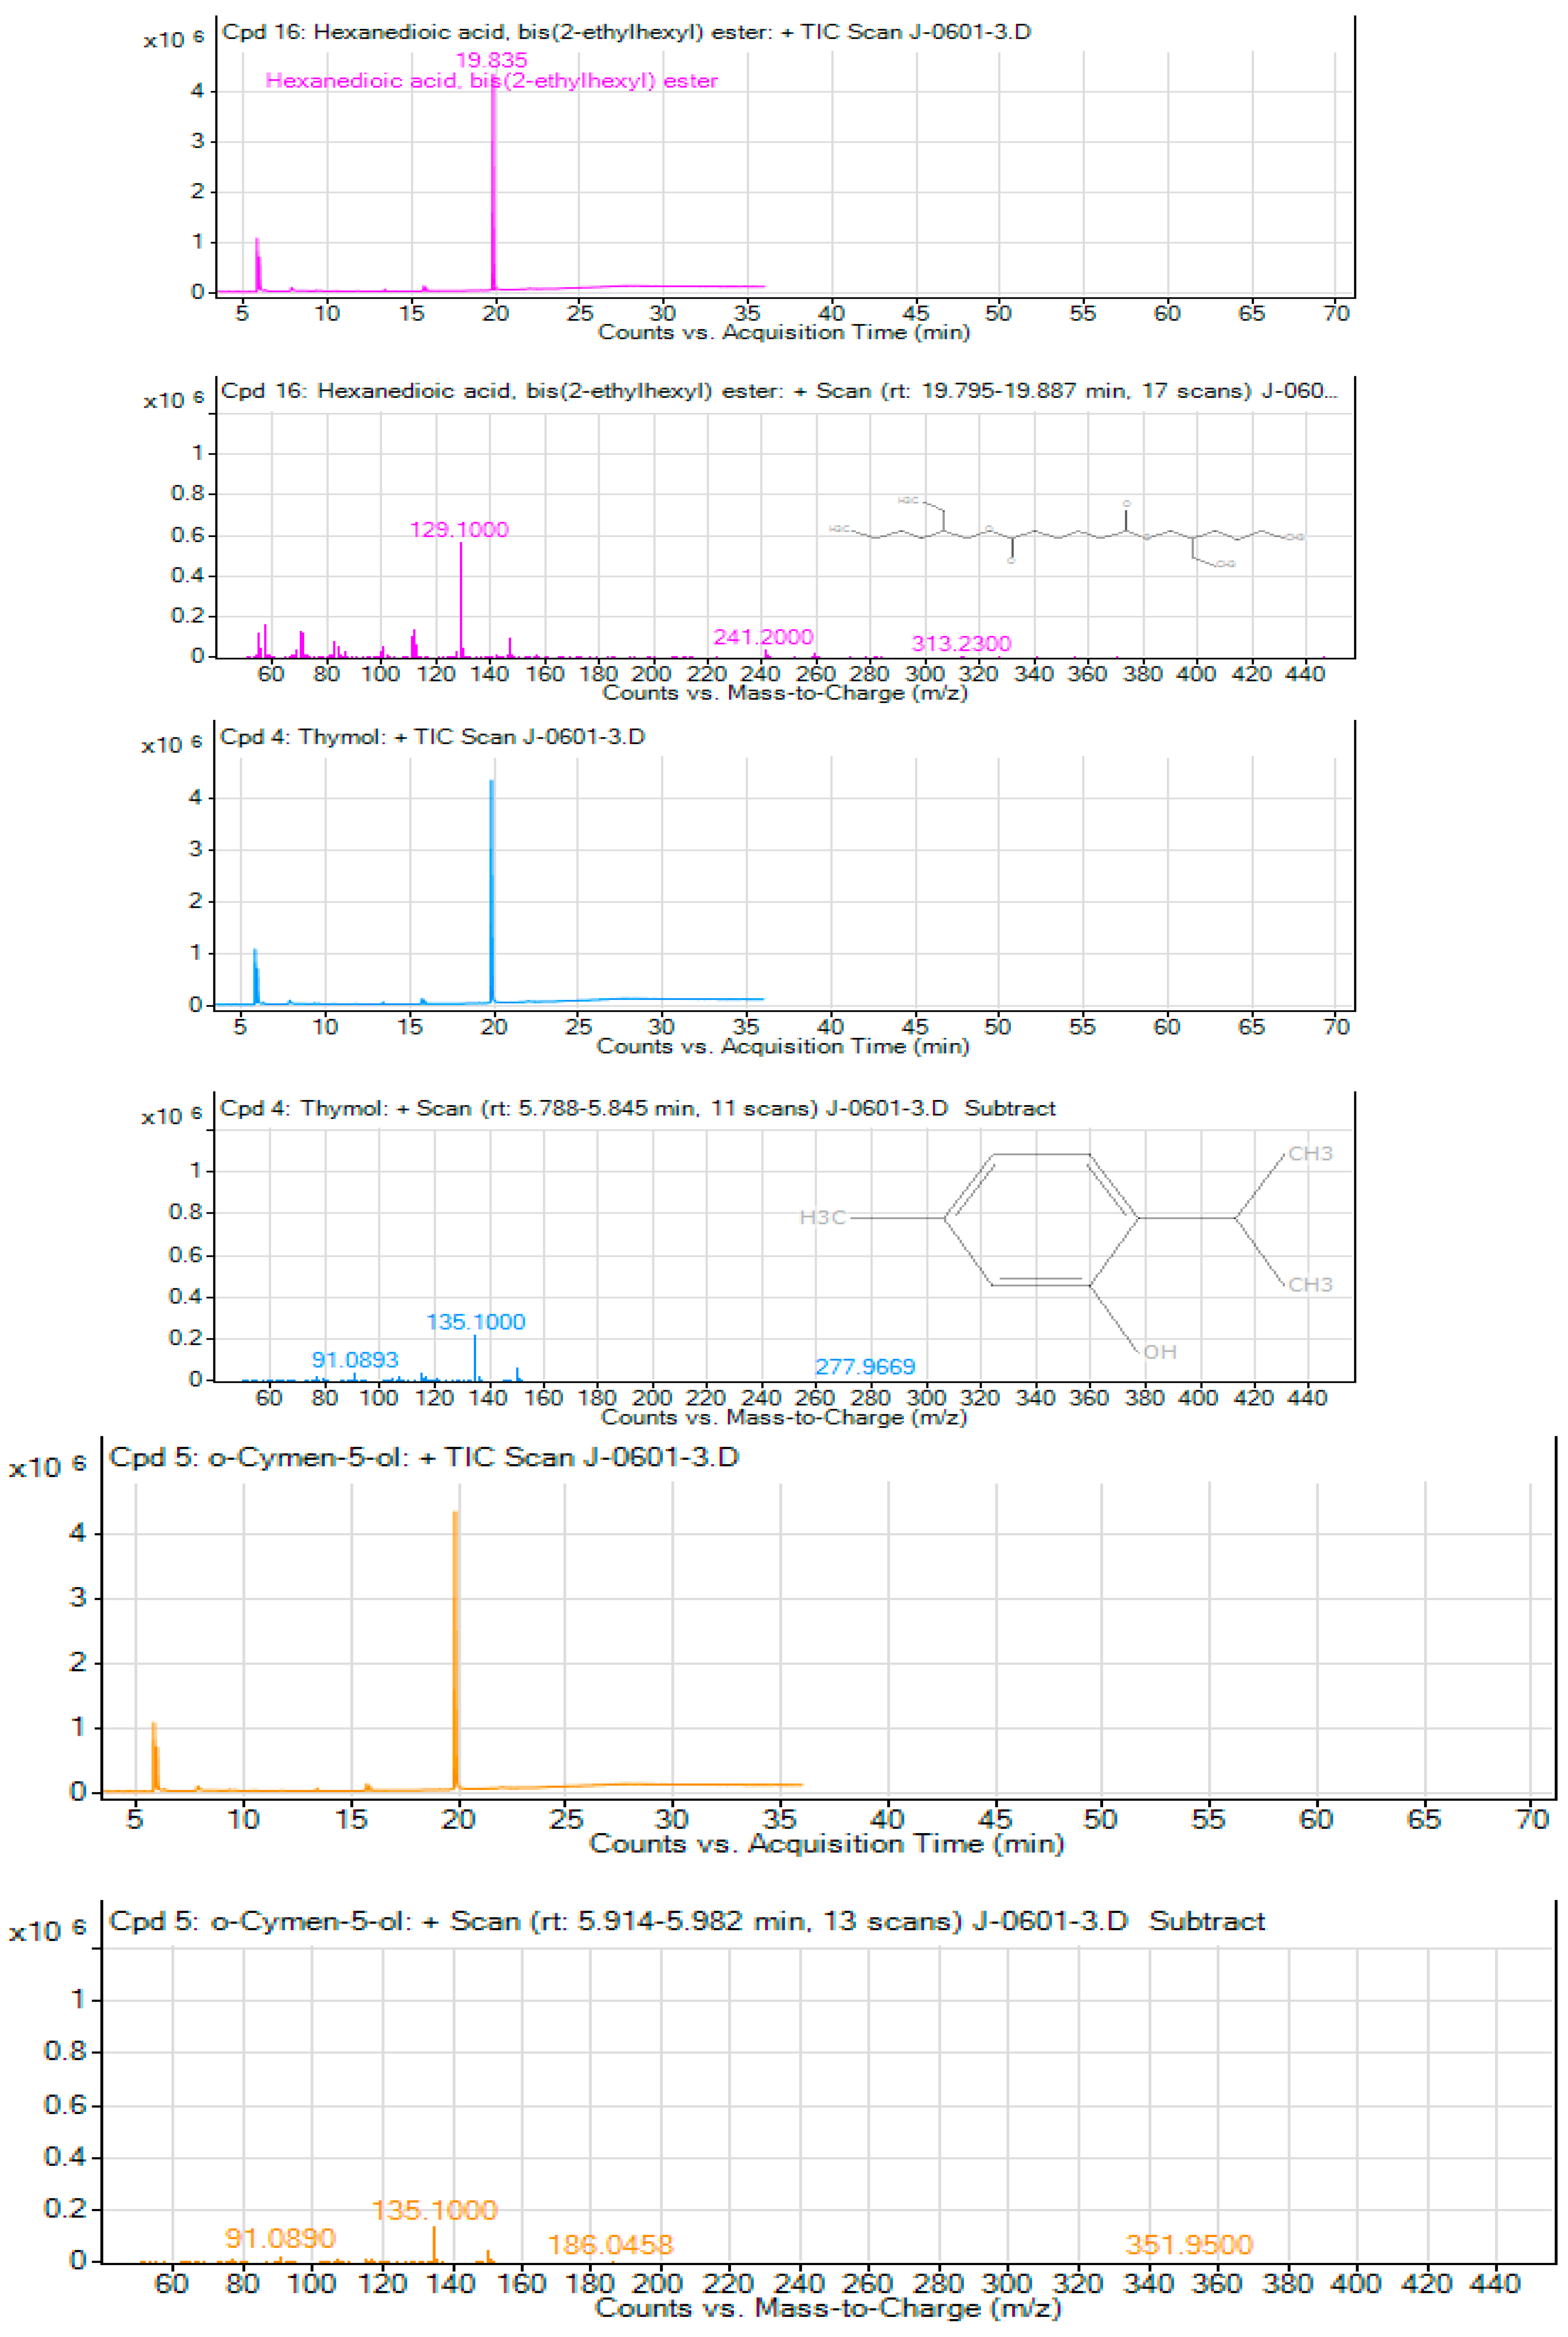
Figure 5.
Chemical Structure of the Bioactive Compounds Identified through GC-MS Analyses from the Hydromethanolic T. schimperi crude extract.
Figure 5.
Chemical Structure of the Bioactive Compounds Identified through GC-MS Analyses from the Hydromethanolic T. schimperi crude extract.

Figure 6.
The GC-MS chromatogram of hydromethanolic crude extract of T. schimperi.
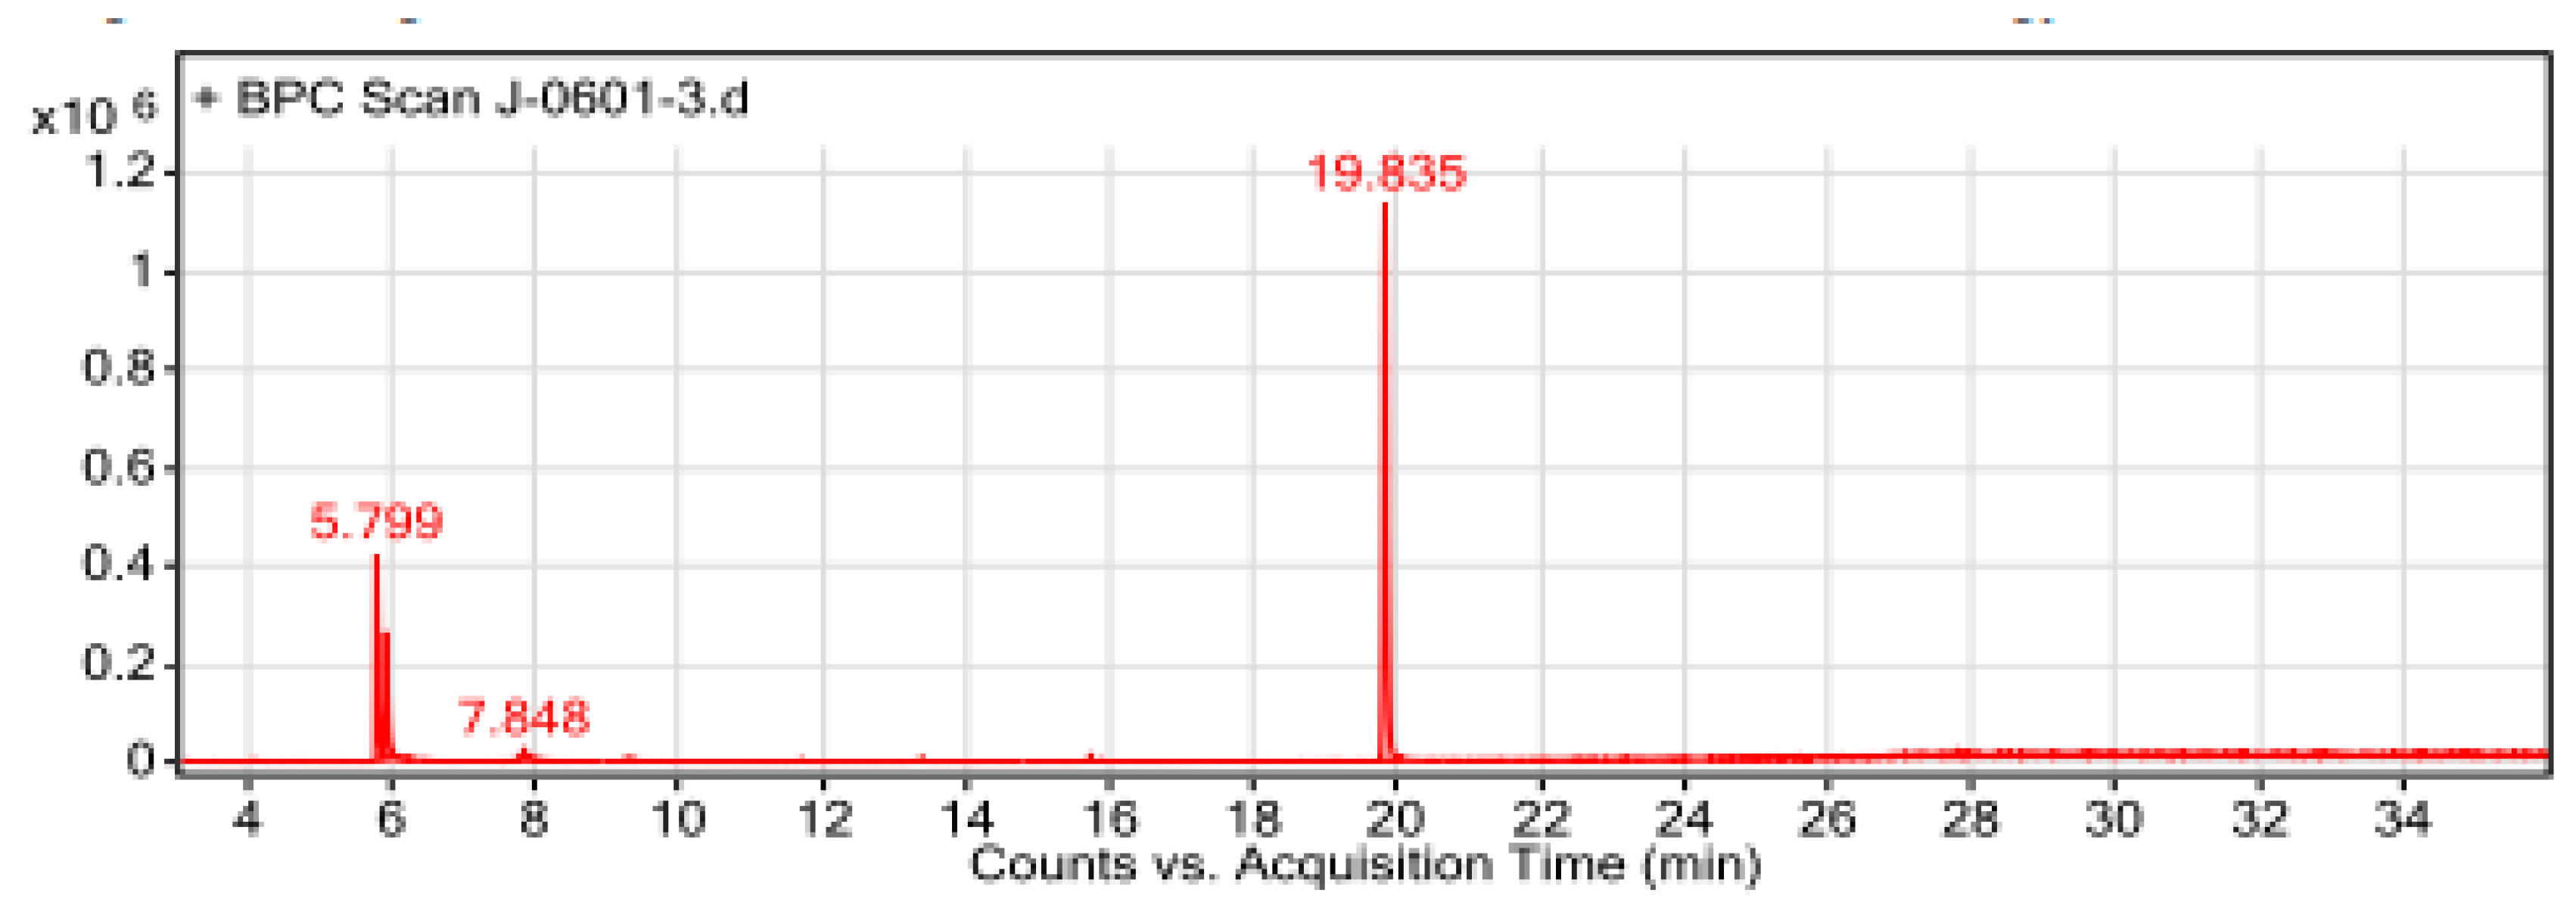
Figure 7.
Chemical Structure of the Bioactive Compounds Identified through GC-MS Analyses from the Hydromethanolic R. prinoides crude extract.
Figure 7.
Chemical Structure of the Bioactive Compounds Identified through GC-MS Analyses from the Hydromethanolic R. prinoides crude extract.
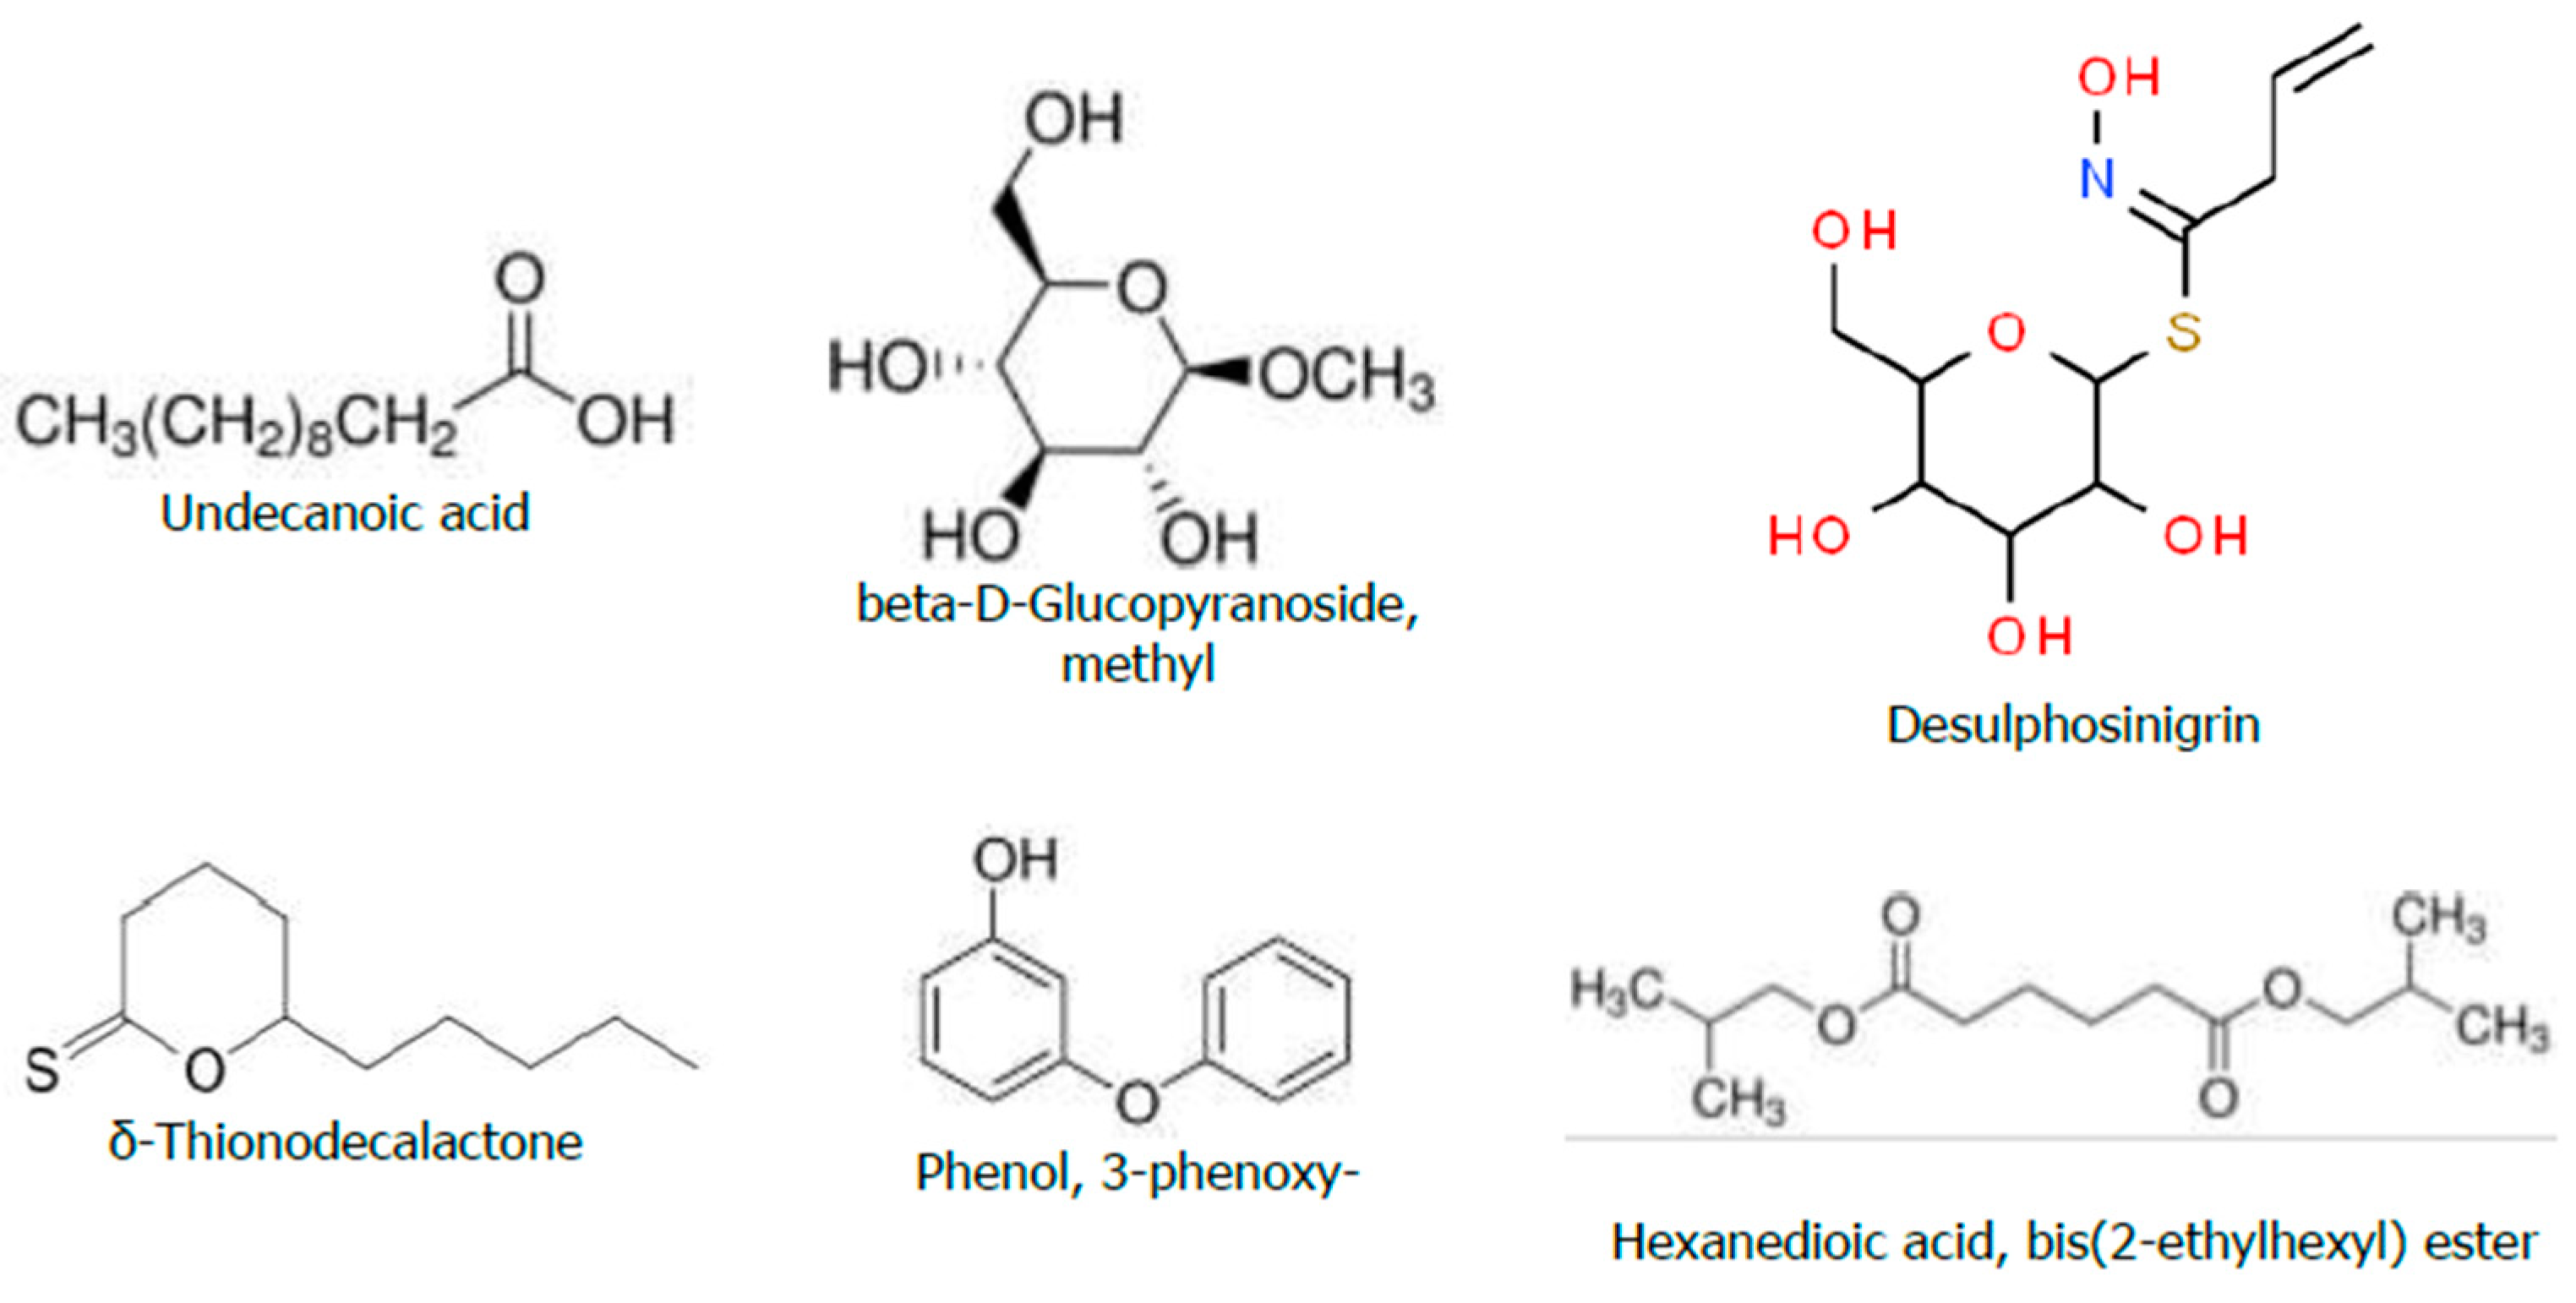
Figure 8.
The GC-MS chromatogram of hydromethanolic crude extract of R. prinoides.
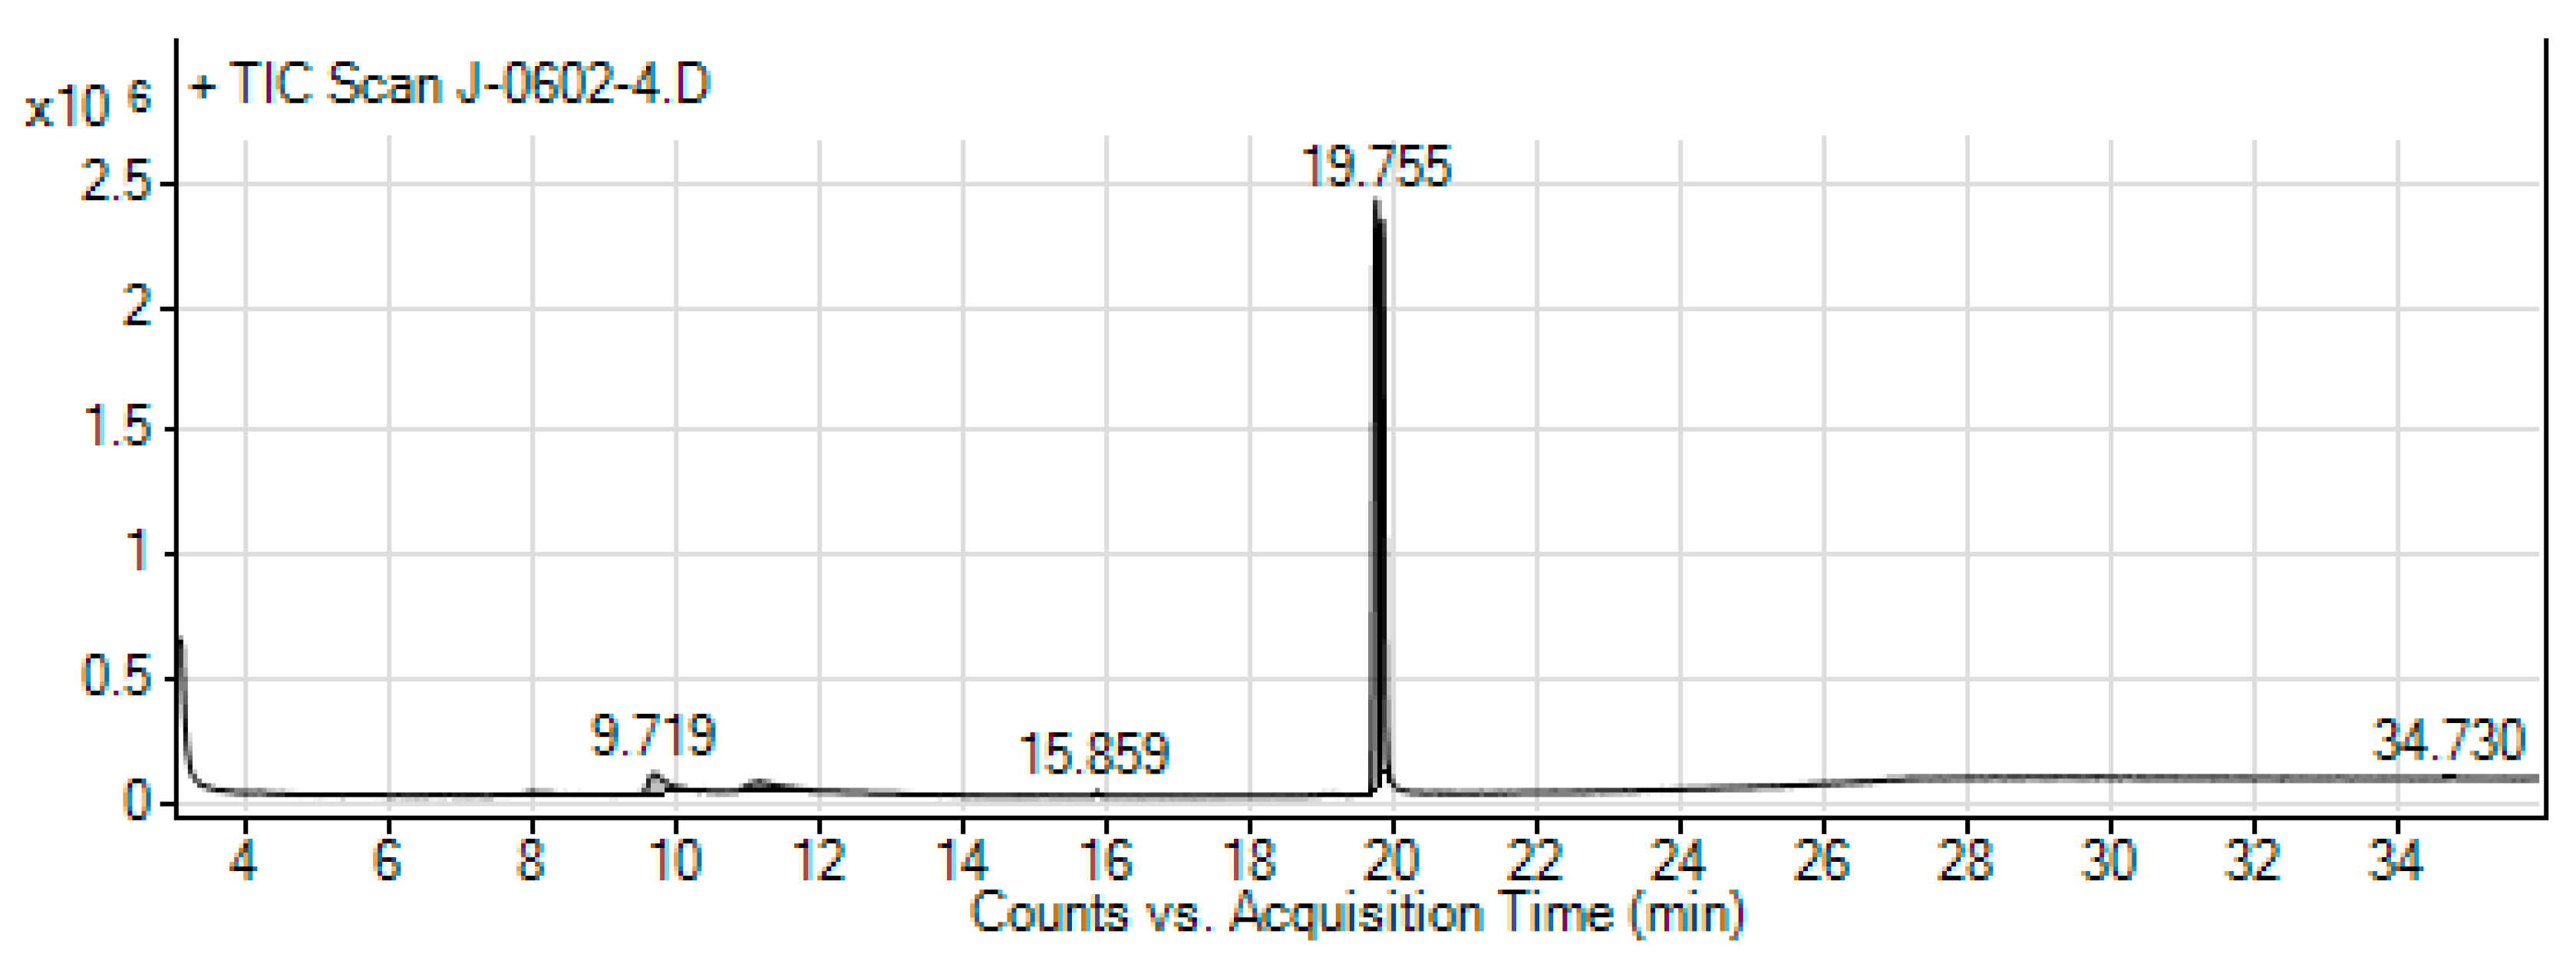
Figure 9.
Chemical structure of the Bioactive Compounds Identified through GC-MS Analysis from Hydromethanolic Crude J. shimperiana Extract.
Figure 9.
Chemical structure of the Bioactive Compounds Identified through GC-MS Analysis from Hydromethanolic Crude J. shimperiana Extract.
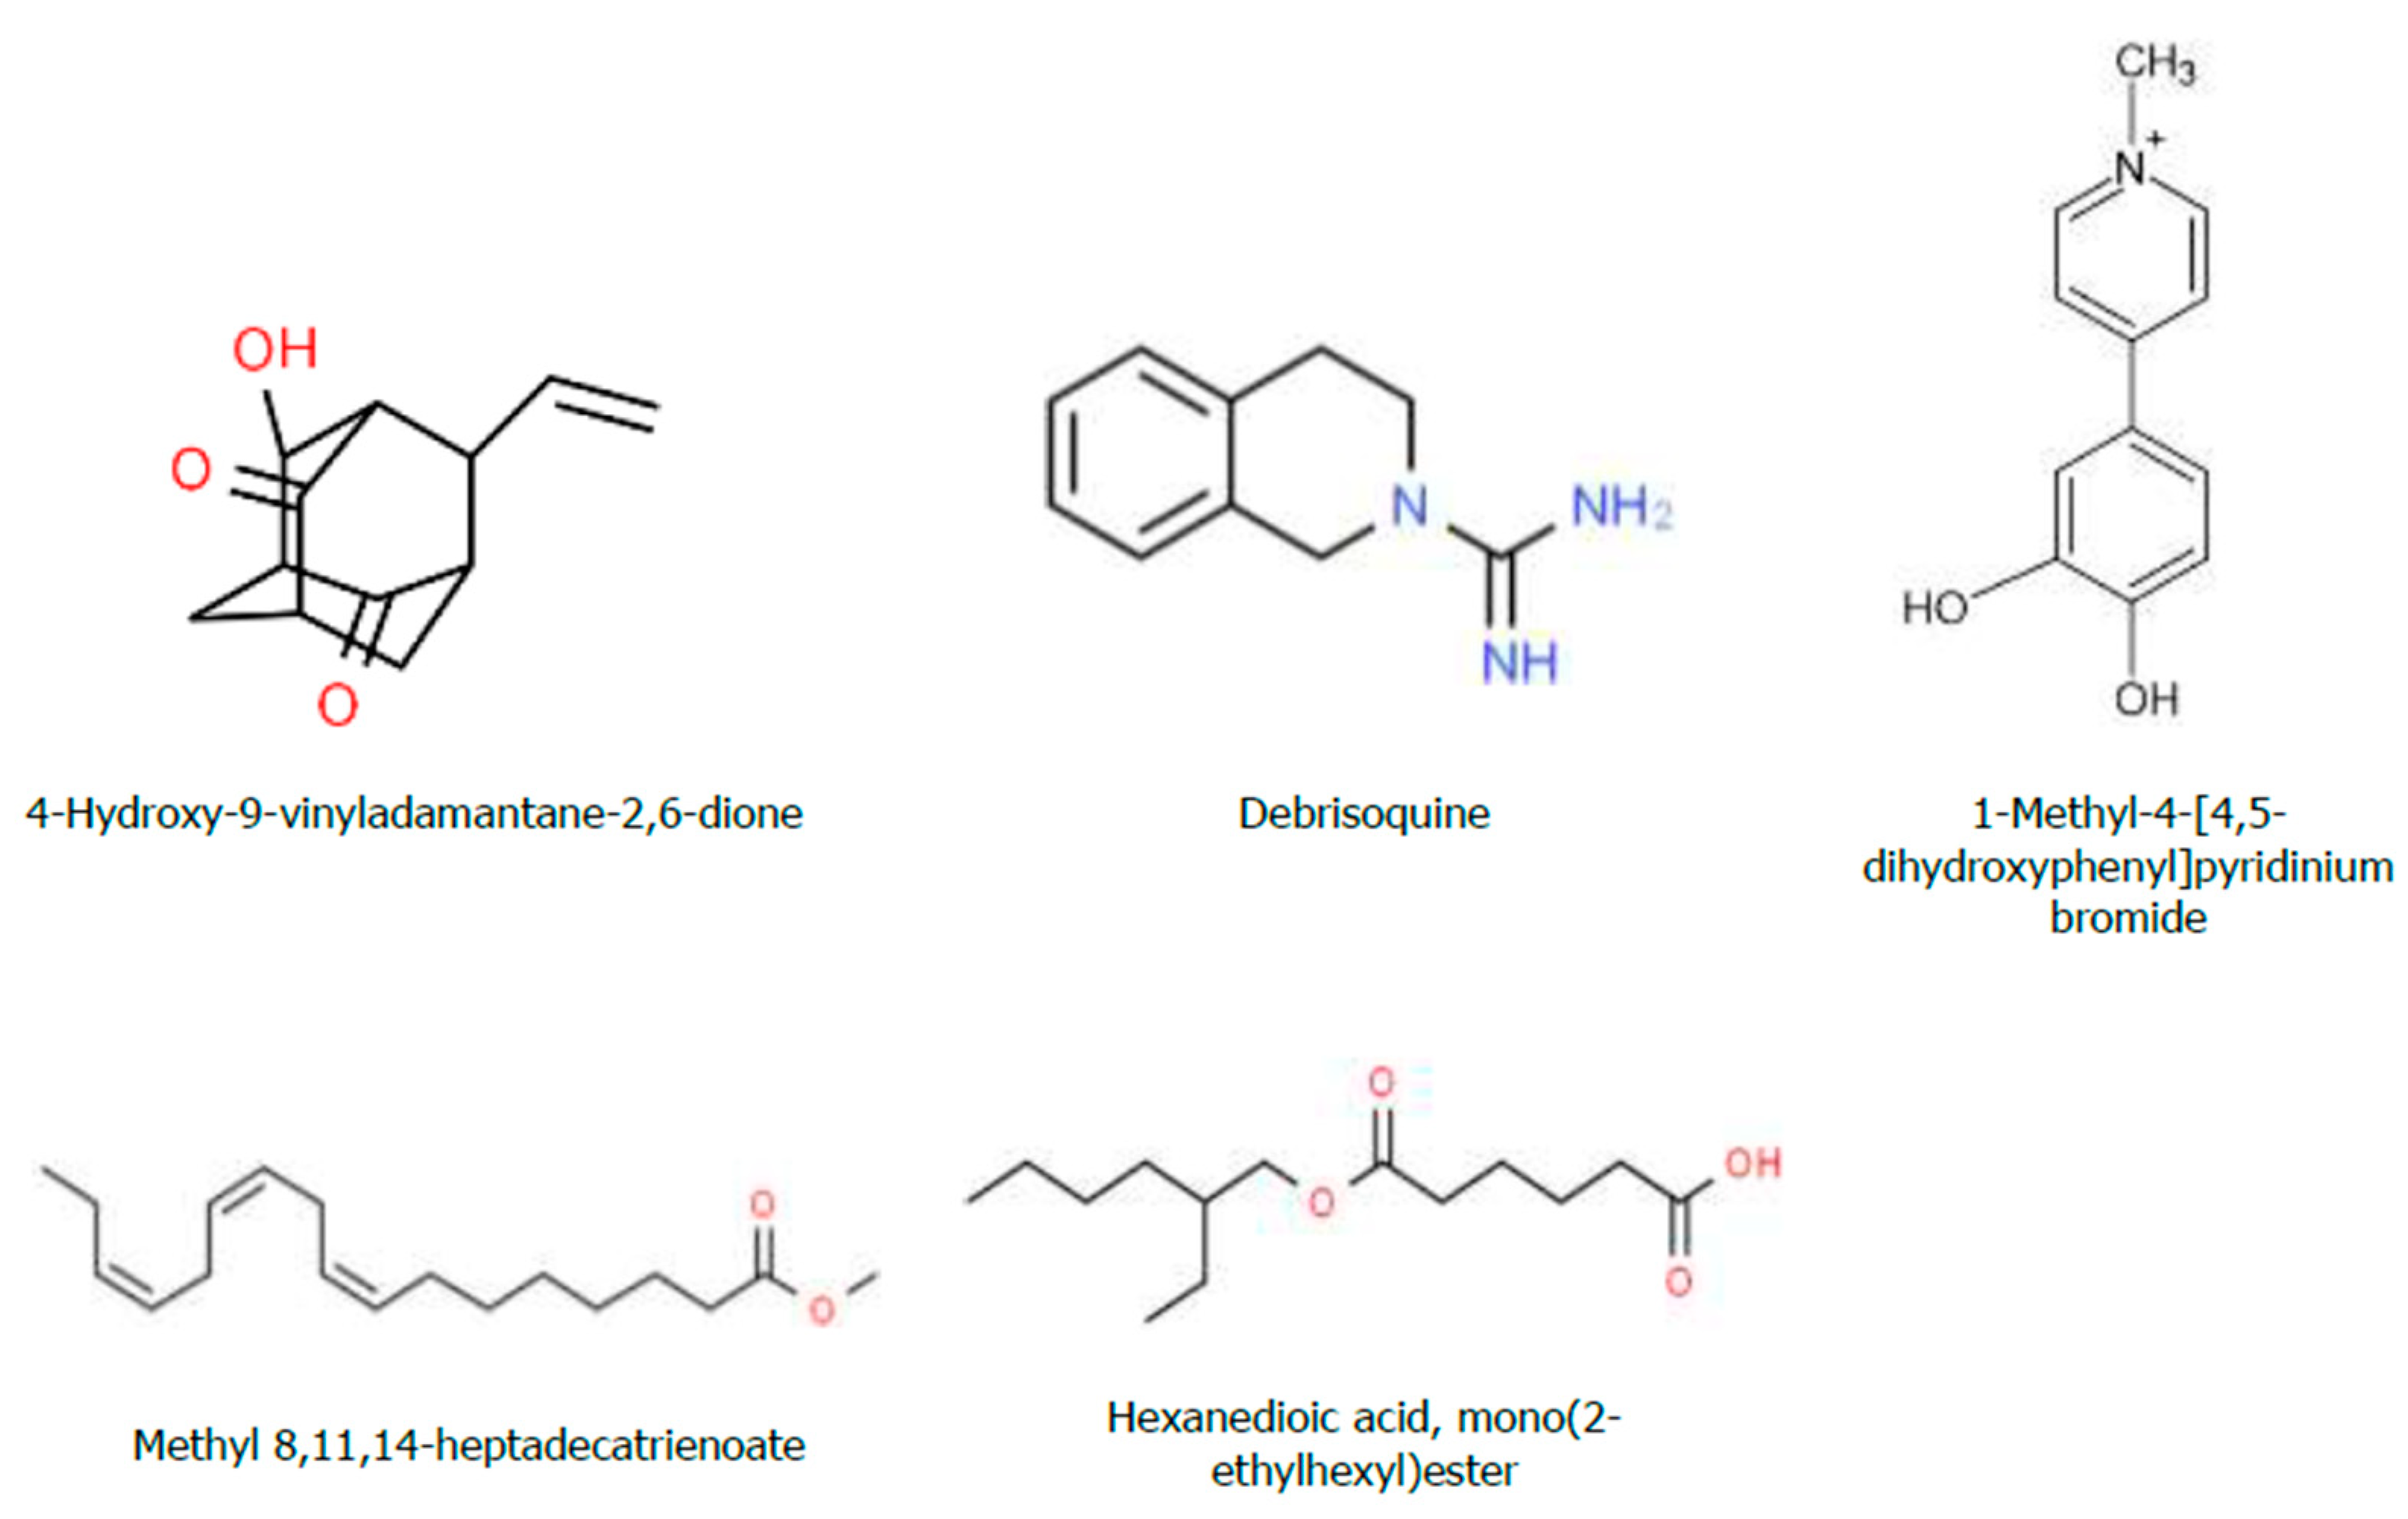
Figure 10.
The GC-MS chromatogram of hydromethanolic crude extract of J. schimperiana.
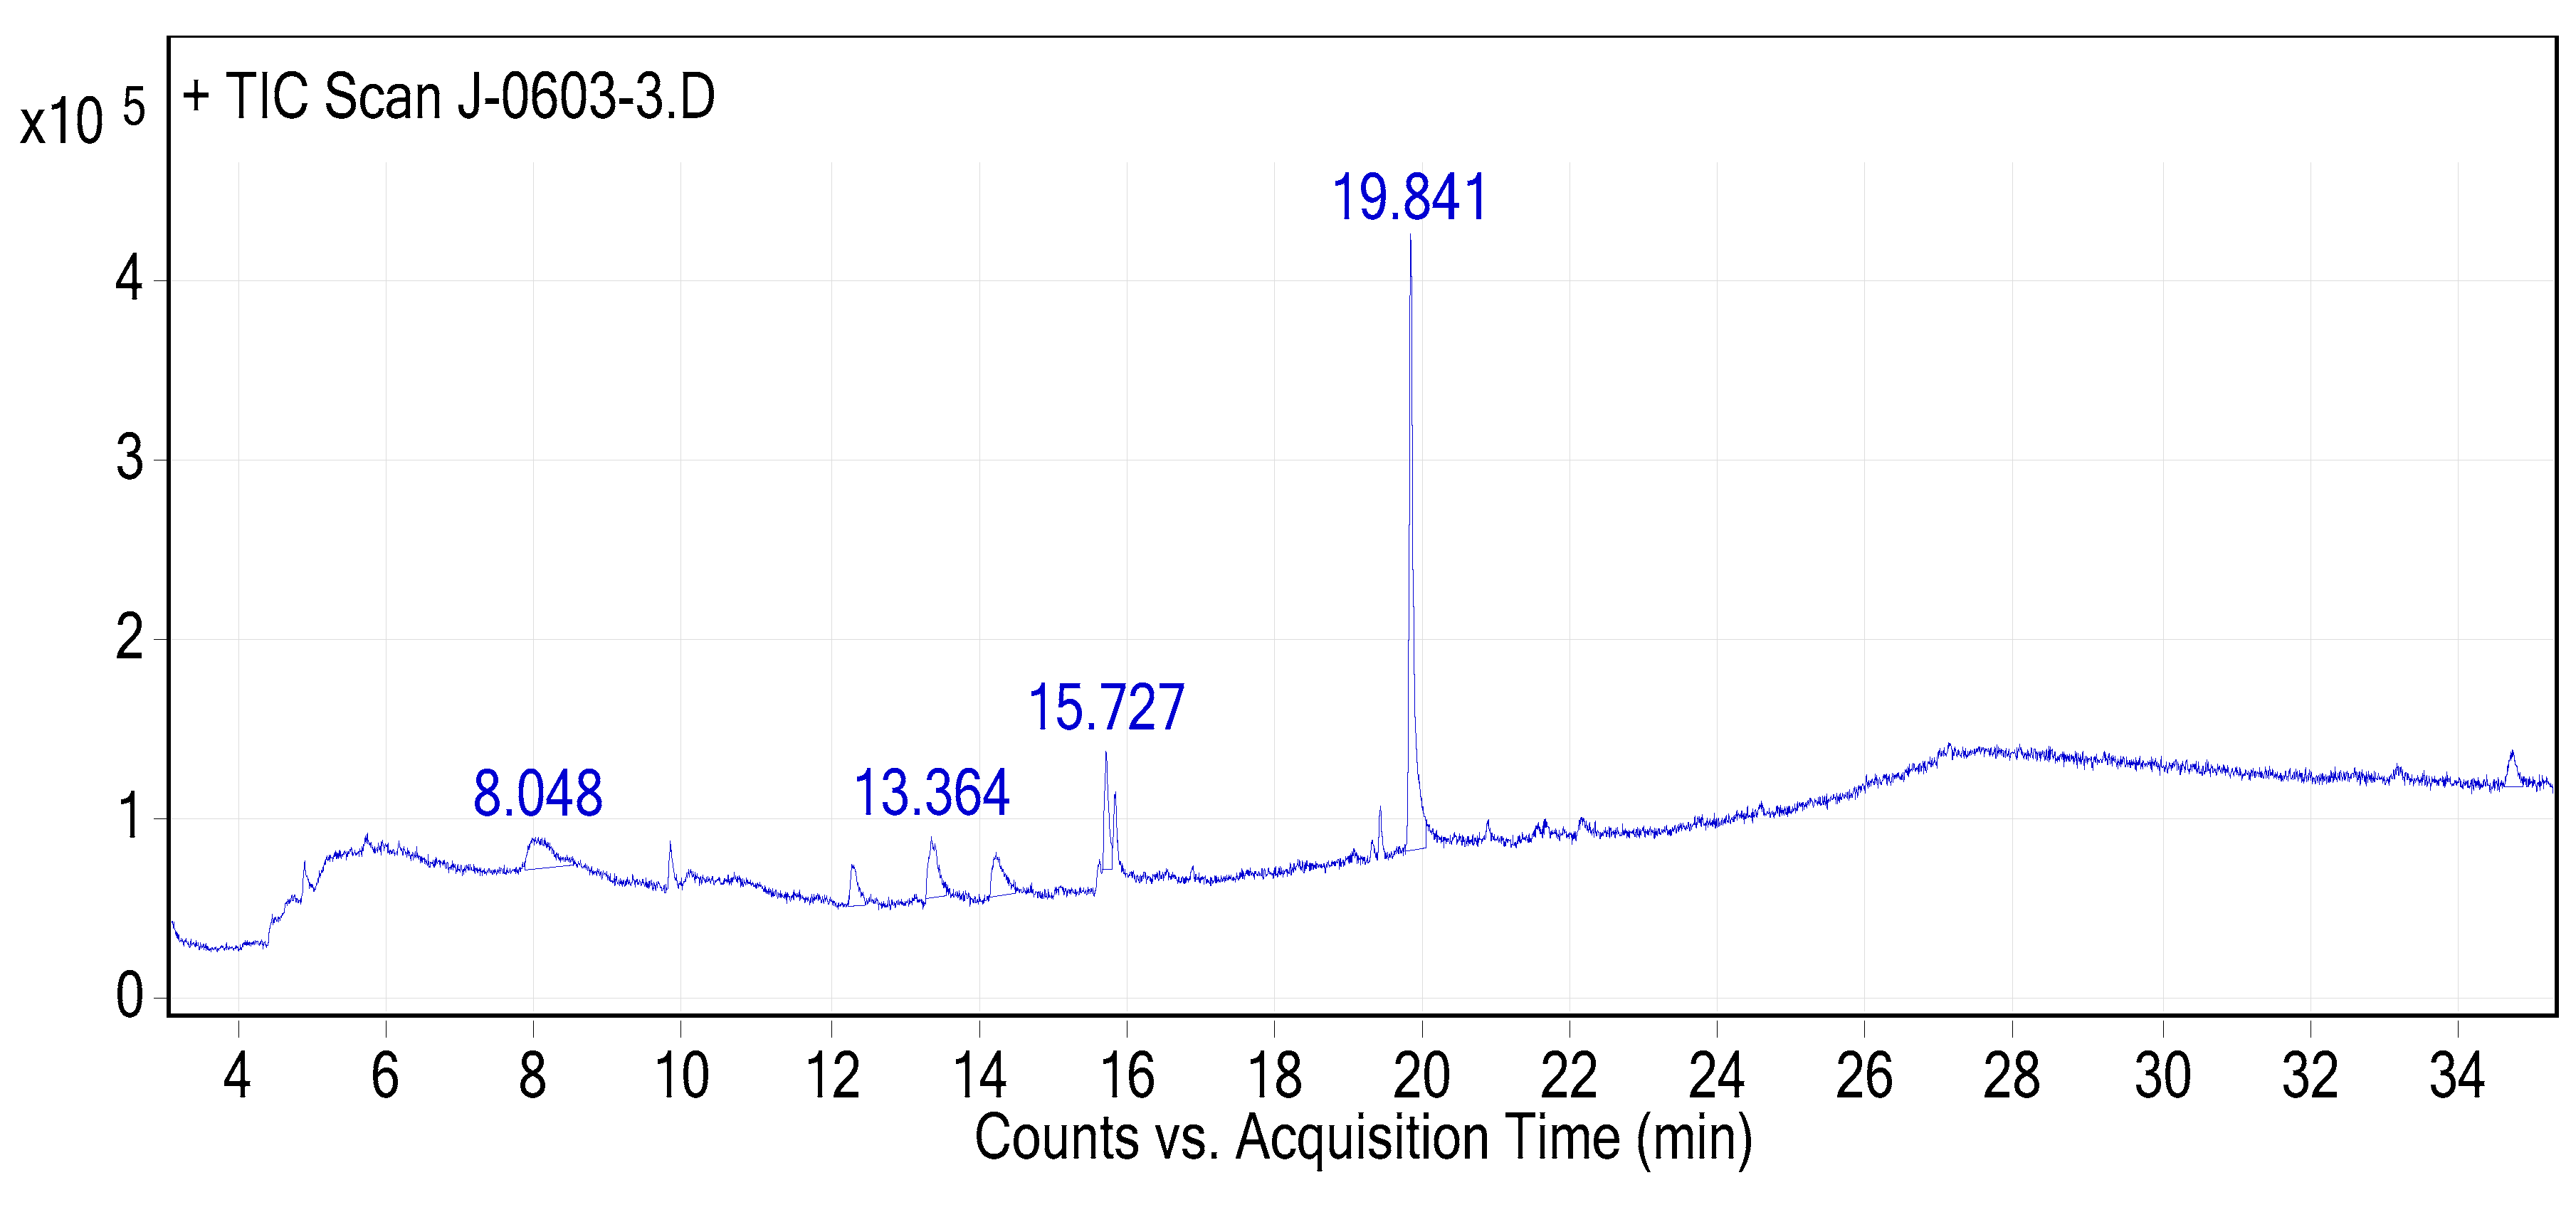

Table 1.
Preliminary phytochemical evaluation of the three hydromethanolic crude leaf extracts.
| SN. | Phytochemical constituents | T. schimperi | R. prinoides | J. shimperiana |
| 1 | Saponins | ++ | + | +++ |
| 2 | Steroids | - | - | - |
| 3 | Alkaloids | ++ | ++ | - |
| 4 | Anthocyanin | - | + | - |
| 5 | Coumarins | + | + | ++ |
| 6 | Flavonoids | ++ | ++ | ++ |
| 7 | Terpenoids | - | - | - |
| 8 | Phenol | +++ | +++ | +++ |
| 9 | Tannin | +++ | +++ | +++ |
+: Presence; -: Absence; (+): low; (++): Moderate; (+++): highest.
Table 2.
Quantity (Mean±SD) of phytochemicals of the three hydromethanolic crude extracts.
| Sample type | Flavonoids (mg Q˟ E/100 g) | Phenol (mg GA† E/100 g) | Proanthocyanidins (mg C‡E/100 g) |
| T. schimperi | 227.96±3.69 | 274.50±5.29 | 1618.06±1.32 |
| R. prinoides | 90.39±0.35 | 229.21±2.82 | 406.24±7.58 |
| J. shimperiana | 82.43±2.53 | 83.59±2.19 | 1037.18±4.06 |
The standard chemicals: Q˟: Quercetin; GA†: Gallic acid; and C‡: catechin.
Table 3.
The Bioactive Compounds Identified through GC-MS Analyses from the Hydromethanolic T. schimperi crude extract.
Table 3.
The Bioactive Compounds Identified through GC-MS Analyses from the Hydromethanolic T. schimperi crude extract.
| Peak # | Name of the Compound (CPD) | Formula | MW | RT | Nature (CPD) | %Area |
|---|---|---|---|---|---|---|
| 1 | α-Terpineol | C10H18O | 154.25 | 4.67 | Menthane monoterpenoids | 0.208649 |
| 2 | Thymoquinone | C10H12O2 | 164.201 | 5.31 | Monoterpene | 0.152454 |
| 3 | Thymol | C10H14O | 150.22 | 5.80 | Monoterpenoid phenol | 11.67551 |
| 4 | o-Cymen-5-ol | C10H14O | 150.221 | 5.93 | Phenolic compound | 7.944895 |
| 5 | Rosefuran | C10H14O | 150.22 | 6.29 | Aromatic | 0.313204 |
| 6 | p-tert-Butylcatechol | C10H14O2 | 166.217 | 7.85 | Catechol derivative organic cpd | 2.194801 |
| 7 | p-Cymene-2,5-diol | C10H14O2 | 166.2170 | 9.60 | Essential oil | 0.192658 |
| 8 | 4H-1,3,2-Dioxaborin, 6-ethenyl-2-ethyl-4-methyl-4-(2-methylpropyl)- | C12H21BO2 | 208.11 | 10.41 | - | 0.167239 |
| 9 | Phthalic acid, 2-cyclohexylethyl butyl ester | C20H28O4 | 332.4 | 11.71 | Ester | 0.14886 |
| 10 | Hexadecanoic acid, methyl ester | C17H34O2 | 270.4507 | 13.39 | Ester | 0.545681 |
| 11 | E-10-Methyl-11-tetradecen-1-ol propionate | C18H34O2 | 268.24 | 15.65 | Fatty alcohol esters | 0.254021 |
| 12 | Linolenic acid, methyl ester | C19H32O2 | 292.5 | 15.73 | Esterified form of linoleic acid | 1.434284 |
| 13 | Phytol, acetate | C22H42O2 | 338.5677 | 15.87 | Diterpenoid | 0.883479 |
| 14 | Hexanedioic acid, bis(2-ethylhexyl) ester | C22H42O4 | 370.5665 | 19.84 | Diester of 2-ethylhexanol and adipic acid | 73.88426 |
| MWT: Molecular Weight; RT: Retention Time. | ||||||
Table 4.
The Bioactive Compounds Identified through GC-MS Analysis from the Hydromethanolic Crude R. prinoides Extract.
Table 4.
The Bioactive Compounds Identified through GC-MS Analysis from the Hydromethanolic Crude R. prinoides Extract.
| Peak # | Name of the Compound (CPD) | Formula | MW | RT | % Area | Nature (CPD) |
|---|---|---|---|---|---|---|
| 1 | Undecanoic acid | C11H22O2 | 186.29 | 8.008 | 1.42 | Fatty acid |
| 2 | beta-D-Glucopyranoside, methyl | C7H14O6 | 194.1825 | 9.719 | 10.03 | O-glycosyl |
| 3 | Desulphosinigrin | C10H17NO6S | 279.31 | 11.132 | 8.28 | Carbohydrate |
| 4 | δ-Thionodecalactone | C10H18OS | 186.314 | 15.859 | 0.51 | Lactone |
| 5 | Phenol, 3-phenoxy- | C12H10O2 | 186.21 | 19.172 | 0.41 | Phenol |
| 6 | Hexanedioic acid, bis(2-ethylhexyl) ester | C22H42O4 | 370.6 | 19.755 | 79.36 | Diester of 2- ethylhexanol and adipic acid |
MWT: Molecular Weight; RT: Retention Time.
Table 5.
The Bioactive Compounds Identified through GC-MS Analysis from Hydromethanolic Crude J. schimperiana Extract.
Table 5.
The Bioactive Compounds Identified through GC-MS Analysis from Hydromethanolic Crude J. schimperiana Extract.
| Peak # | Name of compounds | Formula | MWT | RT | % Area | Nature (Cpd) |
|---|---|---|---|---|---|---|
| 1 | 4-Hydroxy-9-vinyladamantane-2,6-dione | C12H14O3 | 206.24 | 12.288 | 6.80 | - |
| 2 | Debrisoquine | C10H13N3 | 175.23 | 13.364 | 12.18 | Member of isoquinolines and a carboxamidine |
| 3 | 1-Methyl-4-[4,5-dihydroxyphenyl]pyridinium bromide | C12H12BrNO2 | 282.13 | 14.239 | 10.62 | - |
| 4 | Methyl 8,11,14-heptadecatrienoate | C18H30O2 | 278.43 | 15.727 | 10.79 | - |
| 5 | Hexanedioic acid, mono(2-ethylhexyl)ester | C14H26O4 | 258.35 | 19.841 | 59.60 | - |
Table 6.
DPPH inhibition (%) by the three hydromethanolic leave crude extracts.
| Tested samples | % Inhibition of DPPH | ||||||
|---|---|---|---|---|---|---|---|
| 0.02 mg/mL | 0.04 mg/mL | 0.08 mg/mL | 0.12 mg/mL | 0.16 mg/mL | 0.2 mg/mL | IC50% | |
| T. schimperi | 27.86 | 44.28 | 78.87 | 88.64 | 88.64 | 89.29 | 4.49 |
| R. prinoides | 14.95 | 37.28 | 41.87 | 57.71 | 75.78 | 84.03 | 9.79 |
| J. shimperiana | 5.12 | 6.01 | 16.46 | 17.93 | 24.55 | 35.03 | 30.68 |
| Ascorbic acid (standard) | 34.20 | 47.14 | 78.34 | 90.32 | 94.94 | 96.78 | 3.63 |
Table 7.
The in vitro antibacterial activity of the hydromethanolic crude leave extracts against the MDR Clinical Isolate and standard bacteria strain.
Table 7.
The in vitro antibacterial activity of the hydromethanolic crude leave extracts against the MDR Clinical Isolate and standard bacteria strain.
| Plant extracts (Against B1) | E. coli clinical isolate (MDR) | |||
|---|---|---|---|---|
| Zone of Inhibition (mm): Mean ± SD | ||||
| 250 mg/mL (Extract) | 500 mg/mL | 750 mg/mL | 1000 mg/mL | |
| T. schimperi | 17.17 ± 0.41 | 19.1 ± 0.98 | 19.70 ± 0.29 | 20.00 ± 0.00 |
| R. prinoides | 8.83 ± 0.26 | 9.5 ± 0.55 | 10.83 ± 0.41 | 11.00 ± 0.00 |
| J. shimperiana | 8.00 ± 0.00 | 8.00 ± 0.00 | 8.00 ± 0.00 | 8.00 ± 0.00 |
| T. schimperi and R. prinoides | 17.17 ± 0.41 | 19.17 ± 0.98 | 19.50 ± 0.49 | 20.00 ± 0.00 |
| Ciprofloxacin (5µL/mL) | 33.00± 0.00 | |||
| Negative control | 8.00 ± 0.00 | 8.00 ± 0.00 | 8.00 ± 0.00 | 8.00 ± 0.00 |
| Plant extracts (Against B2) | E. coli (ATCC25922) | |||
| Zone of Inhibition (mm): Mean ± SD | ||||
| 250 mg/mL (Extract) | 500 mg/mL | 750 mg/mL | 1000 mg/mL | |
| T. schimperi | 15.67 ± 0.52 | 17.67 ± 0.52 | 18.33 ± 0.52 | 18.5 ± 0.55 |
| R. prinoides | 8.83 ± 0.26 | 10.5 ± 0.55 | 10.66 ± 0.52 | 11.5 ± 0.55 |
| J. shimperiana | 8.00 ± 0.00 | 8.00 ± 0.00 | 8.00 ± 0.00 | 8.00 ± 0.00 |
| T. schimperi and R. prinoides | 10.17 ± 0.40 | 11.65 ± 0.35 | 12.00 ± 0.00 | 14.5 ± 0.55 |
| Ciprofloxacin (5µL/mL) | 37.00± 0.00 | |||
| Negative control | 8.00 ± 0.00 | 8.00 ± 0.00 | 8.00 ± 0.00 | 8.00 ± 0.00 |
| Plant extracts (Against B3) | MDR K. Pneumoniae CI | |||
| Zone of Inhibition (mm): Mean ± SD | ||||
| 250 mg/mL (Extract) | 500 mg/mL | 750 mg/mL | 1000 mg/mL | |
| T. schimperi | 12.5 ± 0.55 | 13.5 ± 0.55 | 14.00 ± 0.00 | 14.50 ± 0.55 |
| R. prinoides | 8.50 ± 0.50 | 8.75 ± 0.24 | 9.00 ± 0.00 | 10.00 ± 0.00 |
| J. shimperiana | 8.00 ± 0.00 | 8.00 ± 0.00 | 8.00 ± 0.00 | 8.00 ± 0.00 |
| T. schimperi and R. prinoides | 11.00 ± 0.00 | 11.58 ± 0.52 | 11.82 ± 0.12 | 11.90 ± 0.10 |
| Ciprofloxacin (5µL/mL) | 17.83 ± 0.41 | |||
| Negative control | 8.00 ± 0.00 | 8.00 ± 0.00 | 8.00 ± 0.00 | 8.00 ± 0.00 |
| Plant extracts (Against B4) | K. Pneumoniae (ATCC700603) | |||
| Zone of Inhibition (mm): Mean ± SD | ||||
| 250 mg/mL (Extract) | 500 mg/mL | 750 mg/mL | 1000 mg/mL | |
| T. schimperi | 12.5 ± 0.55 | 14.00 ± 0.00 | 14.00 ± 0.00 | 14.83 ± 0.40 |
| R. prinoides | 9.00 ± 0.00 | 10.00 ± 0.00 | 10.50 ± 0.55 | 11.00 ± 0.55 |
| J. shimperiana | 8.00 ± 0.00 | 8.00 ± 0.00 | 8.00 ± 0.00 | 8.00 ± 0.00 |
| T. schimperi and R. prinoides | 10.33 ± 0.52 | 11.5 ± 0.55 | 11.5 ± 0.55 | 11.5 ± 0.55 |
| Ciprofloxacin (5µL/mL) | 24.00 ± 0.00 | |||
| Negative control | 8.00 ± 0.00 | 8.00 ± 0.00 | 8.00 ± 0.00 | 8.00 ± 0.00 |
B1: E. coli (CI) MDR; B2: E. coli (ATCC25922); B3: K. pneumoniae CI; and B4: K. Pneumoniae (ATCC700603).
Table 8.
The MIC and MBC of the extracts and ciprofloxacin.
| Extract and ciprofloxacin | MDR E. coli (CI) | E. coli (ATCC25922) | |||||
|---|---|---|---|---|---|---|---|
| MIC | MBC | MBC/MIC | MIC | MBC | MBC/MIC | ||
| T. schimperi | 4 | 16 | 4 | 4 | 16 | 4 | |
| R. prinoides | 8 | 64 | 8 | 16 | >64 | ND | |
| J. shimperiana | 8 | >64 | ND | 32 | >64 | ND | |
| T. schimperi and R. prinoides | 4 | 32 | 8 | 16 | 64 | 4 | |
| Ciprofloxacillin | 0.156 µg/ml | 0.156 µg/ml | 1 | 0.0048 µg/ml | 0.0006 µg/ml | 0.125 | |
| Extract and ciprofloxacin | MDR K. pneumoniae CI (ESBL) | K. pneumoniae(ATCC700603) | |||||
| MIC | MBC | MBC/MIC | MIC | MBC | MBC/MIC | ||
| T. schimperi | 8 | 32 | 4 | 4 | 64 | 16 | |
| R. prinoides | 16 | > 64 | ND | 16 | > 64 | ND | |
| J. shimperiana | 16 | > 64 | ND | 16 | > 64 | ND | |
| T. schimperi and R. prinoides | 8 | > 64 | ND | 8 | 64 | 8 | |
| Ciprofloxacin (µg/mL) | 0.156 | 0.3125 | 2 | 0.156 | 0.156 | 1 | |
ND: Not determined.
Table 9.
Results of the Checkerboard analysis for the interactions between extracts and ciprofloxacin combination in the activities against the four bacteria strains.
Table 9.
Results of the Checkerboard analysis for the interactions between extracts and ciprofloxacin combination in the activities against the four bacteria strains.
| Item | Types of Bacterial Isolates | |||
|---|---|---|---|---|
| MDRE. coli CI | E. coli ATCC | MDR K. pneumoniae CI (ESBL) | K. pneumoniaeATCC | |
| TSA | 2 | 2 | 8 | 8 |
| TSC | 1 | 2 | 16 | 8 |
| CPRA | 0.156 | 0.0192 | 1.248 | 0.312 |
| CPRC | 0.078 | 0.0096 | 0.312 | 0.624 |
| FICTS | 0.5 | 1 | 2 | 1 |
| FICCPR | 0.5 | 0.5 | 0.25 | 2 |
| FIC index1 | 1 | 1.5 | 2.25 | 3 |
| Category | Additive | Indifference | Indifference | Indifference |
| RPA | 8 | 16 | 16 | 16 |
| RPC | 8 | 32 | 16 | 32 |
| CPRA2 | 0.156 | 0.0096 | 0.624 | 0.312 |
| CPRC2 | 0.156 | 0.312 | 0.312 | 0.312 |
| FICRP | 1 | 2 | 1 | 2 |
| FICCPR2 | 1 | 32.5 | 0.5 | 1 |
| FIC index2 | 2 | 34.5 | 1.5 | 3 |
| Interaction category | Indifference | Antagonist | Indifference | Indifference |
TSA: Thymus schimperi alone; TSC: Thymus schimperi combination; CPRA: Ciprofloxacin alone; CPRC: Ciprofloxacin combination; FICTS: Fractional Inhibitory Concentration of Thymus schimperi; FICCPR: Fractional Inhibitory Concentration index of Ciprofloxacin; FICindex1: Fractional Inhibitory Concentration index of Thymus schimperi combined with ciprofloxacin; RP: Rhamnus prinoides.
Table 10.
One-Way Analysis of Variance (ANOVA).
| Extracts | TFC (EC1) | TPC (EC1) | TPROC (EC1) | DPPH (IC50%) | ABTS (EC1) | FRAP (EC1) |
|---|---|---|---|---|---|---|
| T. schimperi | 227.96±3.69¶A | 274.50±5.29¶A | 1618.06±1.32¶A | 4.49 A | 27296.65¶A | 2521.60¶A |
| R. prinoides | 90.39±0.35¶A | 229.21±2.82¶A | 406.24±7.58¶A | 9.79 A | 1887.62¶A | 1810.55¶A |
| J. shimperiana | 82.43±2.53¶A | 83.59±2.19¶A | 1037.18±4.06¶A | 30.68A | 17825¶A | 879.28¶A |
| ANOVA | P<0.05 | P<0.05 | P<0.05 | P<0.05 | P<0.05 | P<0.05 |
¶ Mean ±SD (n=3); measurements in each column having similar letters (A) had statistical difference among the extracts at p ≤ 0.05 by Least Significant Difference (LSD) test; IC50%: Inhibitory Concentration; EC1: Effective Concentration.
Table 11.
Correlation Matrix Showing Relationship between Antioxidant Indices Versus TFC, TPC and TPROC of the three extracts.
Table 11.
Correlation Matrix Showing Relationship between Antioxidant Indices Versus TFC, TPC and TPROC of the three extracts.
| TFC (mg Q˟ E/100 g) |
TPC (mg GA†E/100 g) |
TPROC (mg C‡E/100 g) |
DPPH (IC50%) | ABTS (mean) | FRAP (Mean) | ||
| TFC | Pearson Correlation | 1 | 0.718 | 0.828 | -0.692 | 0.999* | 0.851 |
| Sig. (2-tailed) | 0.490 | 0.379 | 0.513 | 0.032 | 0.352 | ||
| N | 3 | 3 | 3 | 3 | 3 | 3 | |
| TPC | Pearson Correlation | 0.718 | 1 | 0.204 | -0.999* | 0.753 | 0.976 |
| Sig. (2-tailed) | 0.490 | 0.869 | 0.023 | 0.458 | 0.138 | ||
| N | 3 | 3 | 3 | 3 | 3 | 3 | |
| TPROC | Pearson Correlation | 0.828 | 0.204 | 1 | -0.168 | 0.798 | 0.410 |
| Sig. (2-tailed) | 0.379 | 0.869 | 0.893 | 0.412 | 0.731 | ||
| N | 3 | 3 | 3 | 3 | 3 | 3 | |
| DPPH (IC50%) | Pearson Correlation | -0.692 | -0.999* | -0.168 | 1 | -0.728 | -0.968 |
| Sig. (2-tailed) | 0.513 | 0.023 | 0.893 | 0.481 | 0.162 | ||
| N | 3 | 3 | 3 | 3 | 3 | 3 | |
| ABTS (mean) | Pearson Correlation | 0.999* | 0.753 | 0.798 | -0.728 | 1 | 0.877 |
| Sig. (2-tailed) | 0.032 | 0.458 | 0.412 | 0.481 | 0.319 | ||
| N | 3 | 3 | 3 | 3 | 3 | 3 | |
| FRAP (Mean) | Pearson Correlation | 0.851 | 0.976 | 0.410 | -0.968 | 0.877 | 1 |
| Sig. (2-tailed) | 0.352 | 0.138 | 0.731 | 0.162 | 0.319 | ||
| N | 3 | 3 | 3 | 3 | 3 | 3 | |
| *Correlation is significant at the 0.05 level (2-tailed); colors show repetitions of correlation. | |||||||
Disclaimer/Publisher’s Note: The statements, opinions and data contained in all publications are solely those of the individual author(s) and contributor(s) and not of MDPI and/or the editor(s). MDPI and/or the editor(s) disclaim responsibility for any injury to people or property resulting from any ideas, methods, instructions or products referred to in the content. |
© 2024 by the authors. Licensee MDPI, Basel, Switzerland. This article is an open access article distributed under the terms and conditions of the Creative Commons Attribution (CC BY) license (http://creativecommons.org/licenses/by/4.0/).
Copyright: This open access article is published under a Creative Commons CC BY 4.0 license, which permit the free download, distribution, and reuse, provided that the author and preprint are cited in any reuse.


