
Submitted:
14 August 2024
Posted:
15 August 2024
You are already at the latest version
Abstract
The primary objective of this study was to identify a rapid and noninvasive methodology for effectively differentiating various herbal species cultivated in Eastern Poland. Typically, a plant's chemical profile is obtained using chromatographic methods; however, spectroscopic methods can serve as a complementary or independent tool for determining similarities in the analyzed samples. The investigation centered on leaves of plant species from the Lamiaceae family, encompassing basil, lavender, oregano, sage, and thyme. UV-VIS and ATR-FTIR spectra of dried plant samples' powder were recorded and subsequently analyzed using chemometric tools. This paper assesses the relative performance of different discrimination methods, including both traditional methods based on machine learning and those dealing with specimens associated with a specific category. Among the methodologies tested, SIMCA showed the best performance, particularly effective for small training sets.
Keywords:
Keywords: UV-Vis
; ATR-FTIR
; multiclass discriminative analysis
; class oriented methods
; SIMCA
1. Introduction
The rapidly expanding herb-based industry necessitates comprehensive legislation and swift quality control measures for natural products. Food authentication procedures play a crucial role in evaluating whether a product aligns with its label description and adheres to established regulations and legal standards. Therefore, meticulous tracking of plant raw materials and their types is essential at every stage, including harvest, supply chain, and production, especially in pharmaceutical manufacturing. Given the substantial associated costs, there has been a recent surge in fraud, particularly involving the addition of less expensive herbal plants. This underscores the importance of robust quality control measures to ensure the integrity of herbal products in the market and maintain consumer confidence [1]. Since spices, herbs, or teas are often sold in powder form, rigorous laboratory quality control procedures require time and significant resources. Therefore, there is a need for methodologies for the rapid identification of adulterants as well as for quality control and differentiation of herb species [2,3]. The separation of mint samples [4] or the recognition of sage leaves using ATR-FTIR [5] are noteworthy examples in this context. To prevent any slowdown in the production process, the analysis should be conducted as promptly as possible, preferably in real-time [6]. On the other hand, herbal medicines and preparations are often intricate mixtures of various groups of secondary metabolites found in plants. Consequently, achieving fast and accurate analysis poses a challenging task. The Lamiaceae family, a substantial group of aromatic plants, contributes to this complexity. This family comprises approximately 236 genera and 7200 species, featuring herbaceous varieties such as oregano, sage, lavender, thyme, and basil. These aromatic plants contain diverse essential oils and valuable compounds, primarily employed in the perfumery, cosmetic, pharmaceutical, and food industries as biologically active ingredients, aroma enhancers, or preservatives. Their antibacterial, antifungal, and antioxidant properties also establish their prevalence in herbal medicine. The global market for herbs and spices holds significant value and continues to grow steadily, posing a risk of economic crimes such as product adulteration. Often disguised as legitimate medicinal items, these products can cause serious health risks due to potential errors or intentional contamination during production. Craftily manufactured to evade inspection, they are ultimately ineffective or entirely useless. In some instances, manufacturers claim a specific amount of plant extract in their products but fail to disclose the quantity of bioactive substances present. This lack of transparency raises significant concerns about the safety and efficacy of these items, posing risks to consumers' health and well-being [7].
Several analytical methods have been developed to discover and identify the characteristics of raw materials, creating a specific "fingerprint" for the evaluation and quality control of herbal products [8]. To date, gas chromatographic methods have been predominantly employed in fingerprint studies, offering detailed information about the identified compounds. Nevertheless, this analysis is both time-consuming and costly. Nowadays, alongside chromatographic methods, other analytical techniques such as nuclear magnetic resonance spectroscopy, infrared spectroscopy, Raman spectroscopy, and mass spectrometry are increasingly utilized for testing the authenticity of plant raw materials [3]. The combination of spectroscopic methods with chemometrics is noteworthy for its potential to reduce analysis time and lower testing costs. Published research results utilizing spectroscopic methods have primarily focused on verifying the authenticity of herbs used in Chinese medicine [9]. Additionally, these methods have been applied in the analysis of counterfeiting in expensive spices such as saffron [4], black pepper [5], sweet pepper [1], and various other herbs [3]. It was proven, that the combination of spectroscopic tests and chemometric methods allows for the quick and effective detection of false manufacturer declarations [3]. Due to variation in bioactive compounds among plant varieties [10], ensuring raw material authenticity is essential (e.g., myrtle leaves adulterating oregano, as reported by Wielogórska [2] and Black [11]. Authenticity studies described in the literature, particularly focusing on species within the buttercup family, have concentrated on examinations of various herbs. Notably, oregano [12] and thyme [13], along with mint [4], sage [5], and chamomile [14], have been subjects of investigation. While Gad et al. explored the authenticity of thyme using UV-VIS spectrophotometry [13], most of the referenced research predominantly relied on FT-IR spectroscopy.
To achieve a harmonious balance between the quality and efficacy of control procedures, innovative methods have been developed for the identification and discrimination of herbal plants and food. These methods integrate a diverse range of analytical techniques, coupled with the strategic application of chemometrics tools. Spectroscopic techniques such as ultraviolet-visible (UV-Vis), Raman, and Fourier transform infrared (FT-IR), in conjunction with mass spectrometry and high-performance chromatography, have played instrumental roles in accomplishing this task. In this work, ATR-FTIR [4,5,15,16,17,18,19,20,21,22,23,24,25,26,27,28,29] and UV-Vis [4,13,16,17,18,20,22,23,24,25,26,27,28,29,30,31,32,33,34,35,36] spectroscopy will be employed due to its accuracy, simplicity, and relatively low cost.
The primary objective of this study is to develop a streamlined procedure for processing spectroscopic and spectrophotometer data, aiming to achieve satisfactory results rapidly, effortlessly, and cost-effectively. These methods hold promise for effective utilization across various industry branches. To accomplish this task, it is crucial to identify an initial characteristic 'fingerprint' range that best reflects the differences between the species. Subsequently, by systematical evaluation of multi-class classification tools the most suitable methodology for identifying individual species with a performance exceeding 90% is established. While tested on our specific examples, this methodology is also expected to be effective for diverse applications, especially in scenarios requiring multi-class classification with limited herbs samples.
2. Results and discussion
2.1. UV-Vis Spectra Analysis
Figure 1 displays the UV-Vis raw spectra of hexane extracts from examined plant samples of the Lamiaceae family, including basil, oregano, lavender, thyme, and sage, without any data preprocessing. Spectra were collected within the 190-500 nm range and repeated three times. As depicted in Figure 1, the spectra of extracts from the same species can exhibit variations among specimens due to different factors. This variability makes unique assignments challenging. Hence, it is crucial to identify the characteristic features of the spectra of individual herbs that remain consistent, regardless of the aforementioned factors. For a more in-depth analysis of spectrum diversity, the curves corresponding to individual plants were separated and individually plotted in Figure S1(a-e) in the Supporting Information. For comparison purposes, the averaged spectra of the five herbs were also plotted in Figure S1(f).
Significant differences between the UV spectra of powdered herbs and their fresh counterparts stem from various factors. These include the degradation of certain compounds during the drying and grinding process, which alters the UV absorption profile, leading to varied peaks and intensities in the spectra. Fresh herbs contain volatile constituents crucial to their aroma and flavor. However, these volatile compounds often do not survive the drying and grinding process, resulting in the absence of their characteristic peaks in the UV spectra of powdered herbs. Additionally, exposure to air during processing can cause oxidation of certain compounds in the herb powder, leading them to absorb UV light at different wavelengths compared to fresh herbs. These collective factors result in a unique UV spectral pattern for powdered herbs in contrast to fresh ones, rendering the explicit attribution of spectral bands to individual compounds or herbs impractical [4]. Consequently, the only viable option is to isolate the spectral region that most accurately represents the characteristics of the specific species. A rough analysis of Figures 1 and S1 suggests two possible regions of spectral divergence: the first is the <280 nm wavelength range, while the second one corresponds to the 310-440 nm regime. In the former region, there is a rapid increase in absorbance – from A=1 for λ=280 nm to A>3 for λ=210 nm. Hence, there may be a concern if this variability actually reflects the differences in the chemical nature of particular samples or is rather associated with observable noise. In addition, as is clearly visible in Figure S2, the bands corresponding to individual samples of the same herb split significantly in this range it can be seen that this region is responsible for the differences between different varieties of the same herb. It is therefore not suitable for identifying species-specific characteristics. On the other hand, within the >440 nm band, the absorbance profiles of various plants exhibit significant similarity, leading to a deficiency in distinctive features and hindering effective differentiation. For this reason, the range of wavelengths of (310-440 nm) was chosen for further analysis. This range covers the most diverse region and may be related to the presence of volatile compounds and polyphenols present in the samples. The plot of this part of the raw spectrum, as well as further processing procedure is illustrated in Figure 2(a-d) below.
Since raw spectra have a photometric noise caused by interference of various physical and chemical factors or coming from the apparatus, preliminary (i.e. performed on raw data) chemometrics analysis may generate models with low explanatory power, indicating high variability across groups. The influence of the noise ratio on the spectral signal causes disturbances in the noise-to-signal ratio, resolution of spectra, and accuracy and precision of final models, which can lead to incorrect results. Because of this pre-processing (normalization) of the results is essential. The extensive exploration of various data pretreatment and chemometric approaches to enhance the quality of models has been the subject of thorough investigation in previous studies (refer to, for instance, ref. [37,38]). Although originally developed for the analysis of NMR spectra, the Probabilistic Quotient Normalization (PQN) methodology [39] received extensive validation in other applications as well [40,41,42]. In spectral analysis, the normalization process is commonly employed to eliminate variations in absorbance caused by fluctuations in the concentrations of test samples. PQN proves to be a particularly valuable method in this context, as it scales each signal relative to the median spectra as the reference, offering enhanced robustness against the influence of outliers. Our earlier research [4] demonstrated the remarkable effectiveness of PQN in discerning between mint subspecies, specifically in the spectra derived from powdered and n-hexane extracts of samples. Consequently, we incorporate this methodology into the current analysis to assess its effectiveness. The mean-centered and normalized spectra were smoothed with a Savitzky-Golay filter (Figure 2b), using a second-order polynomial and a 13-point window to minimize light scattering effects and the heteroscedastic noise. For each signal in the dataset, the first Savitzky-Golay was computed using a second-order polynomial with a 13-point window, as illustrated in Figure 2d. This process aimed to enhance subtle spectral features and extract additional information about the samples. The curves associated with thyme and basil are particularly prominent in the raw spectrum. However, following normalization, the spectral lines for sage become more distinct (Figure 2c), a trend further emphasized in the derivatives (Figure 2d). Despite these improvements, distinguishing the curves for lavender and oregano remains challenging based solely on the spectra. Indeed, the observations above are only indicative and can solely act as a preliminary assessment of the obtained spectra. For a more precise examination, the utilization of chemometric tools is essential. These insights remain relevant despite relying on only a portion of the spectrum for chemometric analysis.
2.2. FTIR-ATR Spectra Analysis
FTIR-ATR spectra were acquired in the 600-4000 cm-1 range using samples of ground-dried leaves from the examined plants. In the case of UV-VIS spectra, each measurement was repeated three times. Figure 3 displays ATR-FTIR spectra of the analyzed plant samples without preprocessing between 4000 and 600 cm-1. The partial spectra and their averaged values are in the Supporting Information in Figure S2(a-f).
It appears from Figure 3 that, as was the case for UV-VIS spectra, there are no substantial distinguishing features of the raw spectra of individual plants. The differences in the intensity of the bands and their location are not specific and do not allow direct differentiation between the five species of herbs studied. The characteristic bands result from various bond vibrations associated with functional groups on the surface of the plant material under study but do not allow detailed identification of the relevant chemical compounds. The most noticeable differences are in the intensities in some specific regions. Based on the correlation tables (Table S1), the corresponding types of vibrations, functional groups, and chemical compounds were assigned to the wavenumber. The first signal, at a wavenumber of about 670 cm-1, is most pronounced for sage and corresponds to deformation vibrations originating from phenols and alcohols. At 1070 cm-1, an absorption band is observed, correlating with stretching vibrations of alcohols, phenols, and saturated esters, with skeletal vibrations arising from cycloalkanes. Sage exhibits the highest absorbance, while lavender shows the lowest. Another intensive absorption band at 1247 cm-1, related to the stretching vibrations of C–O in saturated esters, dimers, alcohols, and phenols, is present in basil but weak in lavender. The vibrations of C–C bonds in hydrocarbon skeletons emerge between 1290 and 1100 cm-1, with variable intensity bands likely stemming from numerous branched chains within each chemical component of the sample – bands in the range of 1690 to 1560 cm-1 are attributed to alkenes. Strong signals at 1413 cm-1 arise from –CH2– and –CH3 scissoring vibrations, while those at 1597 and 1734 cm-1 come from stretching vibrations of C=O and –COO. The absorption band at 3300 cm-1 corresponds to the –OH vibration, while strong bands at 2850 and 2915 cm-1 arise from the –CH– and –CH2– as well as from the stretching vibration of –CH(CH3)– (asymmetric) and –CH(CH2)– (symmetric). The absorption band represents the stretching vibrations of alcohols, phenols, and saturated esters are represented by the absorption band at 1070 cm-1, whereas cycloalkanes are responsible for the skeleton vibrations. Upon thorough analysis of the raw spectra, substantial signal noise was identified in the ranges below 1000 cm-1 and above 1500 cm-1. Although signal quality could be enhanced through transformation, we found it more practical to focus on the less noisy part of the spectrum, specifically the 1000-1500 cm-1 region. Within this range, the portion containing characteristic bands corresponding to stretching (C-O) and skeletal (C-C) vibrations associated with the presence of phenolic compounds, alcohols, and saturated esters—characteristic of the studied herbs, including compounds such as carvone, terpinene-4-ol, thymol, carvacrol, lavandulyl, lavandulyl acetate, linalool, and linalyl acetate—emerges as the most sensitive to the specific plant. This particular range, depicted in Figure 4a, is the most sensitive to the specific plant, forming a unique 'fingerprint' for each species. The signals within this narrow bandwidth (1000-1300 cm-1) further emphasize the distinctiveness of this spectral signature. Further narrowing the fingerprint window does not give a noticeable improvement in performance and even slightly worsens it, so the most critical differences are reflected in this part of the spectrum. The detached portion of the FITR-ATR spectrum, considered the "fingerprint region," was handled similarly to the UV-Vis spectrum. The outcomes are depicted in Figure 4(b-d) below.
2.3. Multivariate Statistical Analysis and Classification
2.3.1. Principal Components Analysis
While maintaining the highest degree of diversity within the data sample, Principal Component Analysis (PCA) enables the expression of information as a few mutually orthogonal non-correlated variables, referred to as principal components (PCs). This approach aids in reducing the dimensionality of the spectral data to fewer components, facilitating subsequent analysis and mitigating the risk of drawing erroneous conclusions. Therefore, PCA was employed for the initial exploration of interrelationships among subspaces corresponding to individual plants and for the preliminary determination of the number of components further used in discriminative analysis. We used the previously defined "fingerprints" as their respective ranges to construct PCA models for UV-Vis and ATR-FTIR spectra, i.e. 310-440 nm for UV-Vis and 1000-1300 cm-1 for ATR-FTIR. During our analysis, it became evident that while differentiating spectra positively impacts the direct distinguishability of the samples; it doesn't fundamentally alter the results with chemometric methods. Consequently, all chemometric calculations were performed on PQN-normalized spectra without calculating derivatives. With 93 samples available in both cases, we obtained two input matrices of dimensions 93x159 (UV-Vis) and 93x156 (ATR-FTIR). The first three principal components for UV-Vis account for 81.9%, 14.7%, and 3.3% (99.9% in total) of the total variance. For ATR-FTIR, the corresponding values are 55.6%, 29.9%, and 9.1% (94.5% in total). In the case of UV-Vis, the contribution of additional components beyond the first three appears insignificant and can be disregarded, justified by Kaiser's rule as they correspond to eigenvalues less than one after the third component. However, for the ATR-FTIR matrix, up to five of the first components have eigenvalues greater than one, indicating a more substantial contribution. In addition to considering the percentage of variance explained by an individual component, another method to determine the appropriate number of components in PCA involves evaluating the variance retained after dimensionality reduction. This entails analyzing how effectively each component reconstructs the original data in conjunction with preceding components, allowing the understanding of the variance contributed by each component. The better the first n components reproduce the original spectrum, the more adequate the selection of a given number of them. Figures S3 and S4 depict the ATR-FTIR (S3) and UV-VIS (S4) spectra treated with PQN alongside the spectra reproduced using the 1 (a), 2 (b), and 3 (c) components of PCA. It is easily noticed that reproduction using only one component does not give the correct duplication of both types of spectra.
For the investigated samples, groups with similar patterns were visualized using PCA plots of the first two/three principal components. The scores-scores chart provides the most insightful representation of the diversity among samples from different species. Figure 5(a-b) displays the score plots of UV-Vis and ATR-FTIR data on the three primary principal components, explaining 99.9% and 94.5% of the overall variance, respectively. The supplementary information provides additional diagrams with centroids and confidence ellipses in Figure S5.
The 2D score plots with only two components are shown in Figures S6(a-b), illustrating that the first two principal components distinguish well between the UV-Vis spectra of thyme and lavender. The addition of the third component aids in separating the spectrum of sage more clearly, albeit with noticeable outliers. The spectrum of basil presents challenges, with individual points between sage and oregano. Eliminating outliers improves the separation of sage from oregano (Figure S5a). Despite the difficulties in basil differentiation due to its centroid being close to those of sage and oregano, including PCA components beyond three does not enhance the discriminative power of the model. The distinction is much simpler for ATR-FTIR spectra, as Figure S5(c-d) indicates, where sets representing particular plants are more clearly distinguishable than UV-Vis spectra. Similar positive outcomes are expected for oregano, thyme, and lavender. While sage poses a potential challenge due to outliers interfering with lavender and oregano, the situation seems more optimistic than for UV-Vis. For ATR-FTIR spectra, consecutive principal components (i.e., n>3) also carry significant information regarding the variance distribution. Notably, lavender and thyme exhibit clear overlap in 2D diagrams (Figure S6), but this overlap is no longer observed in the 3D plot (S5(c-d)). Therefore, a third component for lavender (or thyme) is expected to differentiate their positions in the PCA space. However, it's crucial to emphasize that the analysis of the entire PCA space provides only a preliminary orientation and does not definitively determine the number of components necessary to construct an effective model. This determination occurs during the model-building process.
2.3.2. Discriminant Analysis Methodology
The qualitative nature of PCA results provides only an initial understanding of the potential for further differentiation among the five investigated herbs. The Soft Independent Modeling of Class Analogy (SIMCA), initially developed in 1976 [43], stands as one of the most popular and widely utilized techniques in chemometrics [44,45]. As a Class Modeling (CM) method [3], SIMCA independently constructs a boundary in the variable hyperspace, where specimens associated with a specific category are likely located. This flexibility allows SIMCA to identify samples as belonging to none, one, or more modeled categories when considering multiple classes. Another commonly used multiclass classification methodology is PLS-DA [46] (Partial Least Squares Discriminant Analysis). In contrast to SIMCA, PLS-DA does not use PCA directly. Instead, it integrates partial least squares regression (PLS) elements with discriminant analysis to construct a model that maximizes the covariance between the predictor variables and the class labels. PLS-DA creates a unified predictive framework using partial least squares regression, simultaneously considering all classes to enhance discriminative ability. Whereas SIMCA constructs separate PCA models for each class and categorizes new samples based on their similarity to these class models, PLS-DA aims to discriminate between predefined classes by building a predictive model that can accurately classify samples into these classes. SVM (Support Vector Machine) is a versatile supervised learning algorithm used for both classification and regression tasks [47]. While SVM aims to maximize the margin between the nearest points of different classes, it does not create individual models for each class as SIMCA and PLS-DA do. Instead, SVM identifies the optimal hyperplane(s) that collectively separate the classes, rather than doing so individually. Consequently, SVM serves as a more general classification tool compared to SIMCA/PLS-DA, effectively separating different classes in the feature space without explicitly modeling each class separately. For further differentiation among the five investigated herbs, Linear Discriminant Analysis (LDA) [48] can also be employed as a classification technique. LDA works by finding a linear combination of features that best separates two or more classes, maximizing the distance between the means of different classes while minimizing the variation within each class. Unlike SIMCA, which models each class independently, LDA creates a single predictive model that uses this linear combination to classify samples into predefined groups, enhancing the discrimination between classes.
Whereas SIMCA, PLS-DA, and SVM share similarities in their focus on class separation and modeling class-specific variability, the conventional machine learning (ML) methods, such as Artificial Neural Networks, Random Forests (RF), and Convolutional Neural Networks, are more general-purpose algorithms with broader applicability across different domains [49]. The Multilayer Perceptron (MLP) is an artificial neural network with multiple layers of nodes, learning by adjusting weights between neurons during training using backpropagation and gradient descent. Artificial Neural Networks (ANN) and MLP are essentially the same, with MLP being a specific type of ANN consisting of multiple layers of neurons, including at least one hidden layer. Random Forest is an ensemble learning method based on decision trees. It constructs multiple decision trees during training, where each tree is trained on a random subset of the training data and features. During discrimination analysis, RF aggregates the predictions of individual trees (usually through averaging or voting) to make the final prediction. RF is robust to overfitting, less sensitive to outliers, and generally requires less hyperparameter tuning than other algorithms. Despite the differences, both MLP and RF are powerful machine learning algorithms known for their robustness and ease of use.
Discriminative methods are particularly useful when there is a clear boundary between different data classes, and the goal is to find and utilize for classification. On the other hand, traditional machine learning methods may be more versatile and flexible in different scenarios but only sometimes focused on directly distinguishing classes. However, a prerequisite for its effective application is a sufficient number of data series, enabling efficient analysis and interpretation of results. As such, discriminative methods are likely more effective when limited datasets are available because they focus on clear class distinctions. Traditional machine learning methods are supposed to be flexible and efficient for large, diverse datasets. Exploring this matter through a real example with potential commercial applications offers an interesting perspective from a research standpoint.
2.3.3. Objectives
From the above considerations, two main objectives of this study emerge. Firstly, as mentioned in the introduction, it focuses on identifying the most effective discrimination methodology for the Lamiaceae family. Secondly, it aims to assess the comparative appropriateness of different methods in meeting this objective. The findings are also expected to yield insights into distinguishing other herbs when only limited samples are accessible.
2.3.4. UV-Vis Discriminant Analysis
To assess the performance of a classification model in identifying class members and strangers, metrics such as sensitivity (true positive rate) and specificity (true negative rate) are commonly used. Additionally, the number of true/false positives and negatives, along with other statistics, can provide insights into the model's effectiveness. Since all methods utilized here are supervised, it is necessary to define training and test sets for carrying out the classification. Here, the training set was selected randomly using different values of k, which represents a fraction of the total variables. Consequently, the number of items in the training set is equal to k×N, where N symbolizes the total number of samples (here N=93). The corresponding test sets, accounting for about (1-k)×N elements and never used in training, followed the same probability distribution as the training sets. The results are provided in Table 1. In this table, accuracy is defined as: 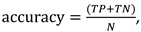 where F(P,N) means False Positives (Negatives), T(P,N) True Positives (Negatives). To compare the performance of different discrimination methodologies on the same dataset and to assess their robustness and sensitivity to class boundaries, various k coefficients, ranging from 0.3 to 0.8, are applied. The k coefficient refers to the proportion of data allocated to the training and test sets. For example, a k value of 0.3 means that 30% of the dataset is used for training, while the remaining 70% is for testing. This process allows for the evaluation of how each method handles varying levels of class separation or overlap, as represented by the different k values. By analyzing the resulting classification accuracies, one can determine which methods are more consistent or exhibit superior discrimination under various conditions. This comparison is crucial for selecting the most suitable methodology for specific datasets, especially when class separability varies. The results from applying the techniques described above on the UV dataset with different k values are summarized in Table 1. Due to the identical structure of the sample set, this table accurately illustrates the comparative efficacy of the various methodologies.
where F(P,N) means False Positives (Negatives), T(P,N) True Positives (Negatives). To compare the performance of different discrimination methodologies on the same dataset and to assess their robustness and sensitivity to class boundaries, various k coefficients, ranging from 0.3 to 0.8, are applied. The k coefficient refers to the proportion of data allocated to the training and test sets. For example, a k value of 0.3 means that 30% of the dataset is used for training, while the remaining 70% is for testing. This process allows for the evaluation of how each method handles varying levels of class separation or overlap, as represented by the different k values. By analyzing the resulting classification accuracies, one can determine which methods are more consistent or exhibit superior discrimination under various conditions. This comparison is crucial for selecting the most suitable methodology for specific datasets, especially when class separability varies. The results from applying the techniques described above on the UV dataset with different k values are summarized in Table 1. Due to the identical structure of the sample set, this table accurately illustrates the comparative efficacy of the various methodologies.Among the particular techniques, SIMCA stood out as the most consistent and accurate method, consistently achieving high accuracies across all values. Its performance culminated in a perfect accuracy of 1.0 at k=0.8, indicating excellent class discrimination even with varying training set sizes. LDA also showed strong results, particularly at higher values, with perfect accuracy at k=0.8, though it exhibited more variability at lower values, suggesting some sensitivity to the amount of training data.
On the other hand, traditional machine learning methods displayed a broader range of performance. PLS-DA consistently underperformed, with accuracies at most 0.71, which may indicate limitations in capturing the complex relationships within the UV-Vis data. With increasing training data, SVM and MLP improved, achieving accuracies of 0.88 and 0.97, respectively, at k=0.8. However, these methods generally required more data to reach high accuracy, reflecting their dependence on large datasets to learn from complex patterns effectively. RF also performs well, matching SIMCA and LDA with a match of 1.0 at k=0.8. This suggests that RF, with its ensemble learning approach, can also effectively handle the classification of herbs from titled family based on UV-Vis data.
Overall, while traditional machine learning methods like MLP and RF are powerful tools, their performance often improves with larger datasets and they may struggle with smaller, more nuanced differences between classes. In contrast, class-based methods like SIMCA are inherently designed to model class-specific features, making them more suitable for this type of problem where detailed discrimination is critical. This study underscores the effectiveness of class-based approaches in accurately classifying herbs using UV-Vis spectral data. Among different discriminative techniques, the class-based methods, particularly SIMCA, provided more consistent high performance across all values, highlighting their suitability for tasks requiring precise class distinction.
The best results obtained through the SIMCA approximation warrant further analysis to better understand the method's functionality. For this purpose, three distinct sets were used. The first set included single measurements from various samples, with each sample contributing three measurements. Elements from all analyzed samples were included in different combinations to ensure representativeness. Consequently, the training set contained 31 elements, while the corresponding test set contained 62 elements. Each training set (Training Set 1, Training Set 2, and Training Set 3) was constructed using each sample's first, second, and third elements, respectively. This approach resulted in three distinct training sets, each representing approximately one-third of the total data (k=1/3). The SIMCA results with this division of samples are illustrated in Figure 6; the partial accuracies for particular herbs are outlined in Table S2 in the Supporting Info. Each point on the graph represents a single data sample, with colors indicating different herbs, as detailed in the description. In SIMCA, an observation is assigned to one class (herb), multiple classes, or none (Figure 6c). As explained later in this section, this specific feature may enhance the model's effectiveness.
SIMCA operates under the assumption that a Principal Component (PC) representation of the input data can capture systematic information related to resemblances among specific classes. Prior to constructing the classification model, PCA analysis is performed separately for each class. The crucial step is the selection of the number of PCA components corresponding to each plant to build trustworthy models that are neither overfitted nor underfitted. The results obtained in the section 2.3.1 are valuable for this purpose. Sage has the highest sample volume, while thyme has the lowest. Volume differences might raise concerns about the validity of conclusions. However, the analysis of Figures 5a and 5b reveals a substantial distance between the PCA subspaces corresponding to both plants, observed in both UV-Vis and ATR-FTIR analyses. This significant distance suggests that even a considerable increase in the thyme population would not decisively impact the separation between the two subspaces, thus not affecting the discrimination process. This hypothesis is supported by the minimum number of thyme components (1 for UV-Vis and 2 for ATR-FTIR) needed to achieve 100% performance for this herb. Given the significant distance between the subspaces corresponding to lavender and thyme, an easy separation of the spectra of these herbs is expected, accompanied by a simultaneous mixing of the others. A quick inspection of Figure 6 and Table S2 confirms this expectation. Indeed, lavender and thyme are well separated from the rest, with only a small number of PC components needed, specifically one for thyme. The situation becomes more intricate for oregano. Figures 5 and S3 reveal that the subspace covering the first 3 PCA components corresponding to oregano significantly intersects with those for basil and sage. Therefore, higher-order components must also be considered for a more accurate characterization.
As mentioned above, SIMCA's class-oriented nature can also be used to further improve performance. In Figure 6a, two oregano samples are erroneously attributed to basil, and in graphs 6b and 6c, some are also misclassified as sage. However, achieving 100% accuracy in identifying oregano is possible in each case by categorizing points that 'belong' simultaneously to oregano and another species. Adhering to this rule ensures 100% oregano classification performance for all training sets, as each of them is categorized into the oregano subspace. However, this is not the case for sage. As mentioned earlier, results for sage exhibit the largest scatter. Indeed, as observed in Figure 5a, using three PCA components may not provide satisfactory results. Including two additional components improves the performance but is still not as outstanding as for thyme and lavender. For each training set, samples of different plants are also attributed to sage. Specifically, in Figure 6a, two points belonging to basil are misclassified as sage. In Figure 6b, one oregano sample is also erroneously identified as sage. In Figure 6c, two points attributed to basil and four to oregano are credited as sage.
Additionally, one sage sample is misclassified as none in Figure 6c. Consequently, the overall performance is less than 100%. For sets 2 (Figure 6b) and 3 (Figure 6c), this overall performance value can be raised to 100% by applying the same procedure as for oregano, i.e., classifying samples that simultaneously belong to basil (oregano) and another plant (in this case, sage) as basil (oregano). However, this corrective approach is not feasible for training set 1 (Figure 6a), where two samples of sage are misclassified as basil and two samples of basil are misclassified as sage. Regardless of the training set choice, two samples are ambiguously credited to basil and sage. Achieving 100% accurate identification is only possible for sets 2 and 3, where the ambiguously assigned points are attributed to basil. It is impossible for set 1, where indistinctness appears for basil and sage – two points of each are simultaneously assigned to both herbs, preventing 100% accuracy. For all training sets, some spectra belonging to oregano and basil are incorrectly classified as sage, leading to a decrease in the accuracy of their identification.
In conclusion, the SIMCA method proves highly effective in classifying UV-Vis spectra of the herbs from the title family even for small k values less than 0.4, achieving 100% accuracy for thyme, lavender, and oregano. For basil and sage, the performance consistently exceeds 90%. In practical applications, this signifies the ability to unambiguously extract three spectra from a mixture of five.
2.3.4. ATR-FTIR Discriminant Analysis
Table 2 compares the performance of the methodologies discussed in the previous section for ATR-FTIR spectra. As for the UV-VIS, SIMCA seems to be the top-performing method, achieving perfect accuracy at k=0.8. This result emphasizes SIMCA's robustness across different spectral domains, showcasing its ability to discern subtle chemical variations in herb spectra. LDA also performed well in the IR range, achieving a peak accuracy of 0.86 at k=0.8, although it did not reach the scores observed in the UV-Vis data. Traditional machine learning methods also) exhibited strong performances, with RF achieving an accuracy of 0.95 and MLP reaching 0.92 at k=0.8. Interestingly, SVM showed notable improvement in the IR analysis, reaching an accuracy of 0.95, suggesting that SVM may be more sensitive to the spectral features captured in the IR range compared to UV-Vis. However, PLS-DA continued to be the least effective, with a maximum accuracy of only 0.81, consistent with its lower performance across both spectral ranges. The consistency of SIMCA's high performance across UV-Vis and IR spectra underscores its suitability for tasks requiring the differentiation of complex and subtle spectral signatures. The results also highlight the importance of method selection tailored to the specific spectral characteristics of the dataset, particularly in applications like herb classification where precision is crucial. This comparative analysis further solidifies the advantage of class-based methodologies over traditional ML approaches in handling spectral data for the herbs from the title family, making them the preferred choice for accurate and reliable classification.
As discussed in Section 2.3.1, the PCA subspaces corresponding to the ATR-FTIR spectra of individual herbs interpenetrate less than for UV-Vis. Additionally, the number of components carrying significant variance information is higher here, suggesting the effectiveness of discriminant models with more dimensions than in the case of UV-Vis. Similar to UV-Vis, three training and test sets were distinguished. The results are shown in Figure 7 and Table S3 in the Supporting Info. Analogously to UV-Vis, the subspace of thyme spectra is well disjointed from the others, and two components are sufficient for its unambiguous separation. Such good separation is likely due to the small number of thyme spectra. However, an analysis of Figures 6 and S3 reveals a different position of the corresponding subspace.
While more data for calibration could complicate the picture, the pronounced differences would still maintain the model's performance. The same is valid for basil, which distinctly separates the PCA subspaces corresponding to both types of spectra. For UV-Vis, even four or more components are sufficient to correctly classify this plant, which could easily be confused with sage. As for UV-Vis, the sage spectra pose the most complexity. Utilizing a 5-dimensional space to fully capture their variability, this number of components was used to construct the SIMCA model, moderating the risk of overfitting and resulting randomness. The complexity of the sage subspace, similar to UV-Vis, leads to the categorization of two plants (lavender and oregano) simultaneously as sage, both correctly and incorrectly. However, their membership can be quickly established by acknowledging that points belonging to sage and lavender are classified as lavender. Similarly, points classified as sage and oregano are recognized as oregano. This straightforward procedure results in 100% accuracy for basil and lavender. Notably, while UV-Vis showed an overlap between basil and oregano on sage, the basil subspace is well separated in ATR-FTIR, introducing a difficulty for lavender. However, this does not hamper achieving 100% model performance.
3. Discussion
Numerous studies on spectroscopy and chemometrics-based herbal discrimination can be found in the literature. Our results are consistent with our previous findings, where UV-Vis and ATR-FTIR techniques were employed to discriminate between mint subspecies [4]. In that study, a two-step SIMCA->PLS-DA procedure was proposed, achieving an efficiency of up to 80% for both UV-Vis and ATR-FTIR methods in differentiating three types of mints. Given the more significant differences between particular species compared to subspecies of the same plant, the obtained yield in the current study (about 90%) is significantly higher, as anticipated. Notably, the statistical analysis procedure has been simplified to a single step.
Despite the observed slightly weaker performance of UV-Vis, the overall good discrimination results obtained with this technique support the efficacy of this methodology. Intriguingly, UV-Vis allows for the excellent and accurate separation of thyme, requiring only one PCA component. This contrasts with the general observation of slightly weaker performance, which may suggest that UV-Vis exhibits variations in effectiveness depending on the herb in question. While the present study indicates a nuanced performance, the broader applicability of UV-Vis in plant discrimination contexts remains well-documented in the literature.
Parez et al. [50] conducted a study on chromatographic and spectroscopic profiles to discriminate and classify soothing herbs in various herbal products, including chamomile, lavender, passion flower, and valerian, in different forms such as dried plants, drops, tablets, and capsules. Their approach involved building PCA models based on chromatograms and UV-Vis spectra, combining them into a single matrix, and using it to construct PCA and PLS-DA models. Similarly, the model crafted in this study demonstrated an ability to differentiate among the three herb classes, achieving a performance level of approximately 90%. This outcome aligns with the results obtained through SIMCA in our research. While the specific methodologies may differ, the consistent achievement of around 90% accuracy in discriminant analysis of plants or their derivatives is a common finding in various studies. For instance, similar accuracy levels have been reported in distinguishing turmeric varieties using UV-Vis [34], detecting efforts to adulterate sage with myrtle (FT-IR) [1], and identifying patchouli oil adulteration (FT-IR)[51] among others [50,52,53,54,55,56].
Comparable studies were reported by Dankowska et al. [14,57]. Mint and sage, members of the same plant family as the herbs in our study, were subjected to identification and classification using UV-Vis/NIR spectra and various discriminant analyses, including LDA, QDA, RDA, SKNN, and SVM, efficiencies of around 90% were attained. It's worth mentioning that their approach involved utilizing 80% of the samples for the training set (k=0.8), a larger proportion than the one successfully employed in our analysis. This discrepancy hints at the potential advantages of PCA-based discriminative methods, particularly in multiclass classification.
The weaker performance of the PLS-DA method observed for the title plants is interesting. In the literature, many examples of discrimination of various herb species in which this method is successfully applied; interesting examples are collected in the review [9], yet most issues considered are binary, i.e., only two different plants/plant products are distinguished. These examples and many others indicate that PLS-DA is well-suited for single-class modeling due to its focus on maximizing the variance related to the target class, making it practical for identifying and characterizing a single class. However, this methodology is less effective for multiclass problems, as it may oversimplify class relationships.
4. Materials and Methods
4.1. Samples
This study analyzed dried leaves from seven samples of origanum, three samples of lavender, three samples of thyme, eleven samples of sage, and seven samples of basil. Dr. Anna Kiełtyka–Dadasiewicz from the University of Life Sciences in Lublin, Poland, generously provided the dried plant material. These plants, collected in June of 2018 from the Garden of Cosmetic Plant and Raw Material Collection at the Research and Science Innovation Center in Wola Zadybska (51° 44'49" N 21° 50'38" E) near Lublin, Poland, were cultivated in loess soil. The above-ground parts of the plants were harvested, and after cutting, they were dried in a forced-air laboratory dryer at 30-32°C, with only the leaves prepared for testing.
4.2. Statistical Analysis
The acquired spectra underwent comprehensive statistical analysis using R software, Version 4.1.0. Several specialized packages were employed for distinct tasks: the mdatools package [52] played a crucial role in data preprocessing (except for rcpm used for Probabilistic Quotient Normalization (PQN); SIMCA, PLS-DA and visualization. Also, pca3d package facilitated the Principal Component Analysis (PCA), whereas rgl contributed to 3D PCA visualization. Other discrimination methodologies were implemented using the following R packages: MASS [58] for LDA, e1071 [59] for SVM,); RSNSS [60] for MLP, and RandomForest [61] for RF. Additionally, we leveraged in-house developed R scripts tailored to efficiently manage the spectroscopic data.
4.3. UV-VIS Spectra Measurement
For the UV-VIS analysis n-hexane extracts of powdered raw leaves were prepared in the following way: 1 g of fine ground plant material was weighed into a 16 ml vial. Next 12 ml of hexane was added and stirred vigorously for 30 min. Then the extract was removed to another vial and extraction was repeated with the new portion of solvent. The procedure was repeated three times. Subsequently, the extracts were combined and filtered through a paper filter. The resulting filtrate was concentrated to a volume of approximately 1.5 ml by evaporation of the solvent and then quantitatively transferred to a 2 ml vial.
For the UV-VIS analysis, n-hexane extracts of powdered raw leaves were prepared as follows: 1 g of finely ground plant material was weighed into a 16 ml vial. Subsequently, 12 ml of hexane was added, and the mixture was vigorously stirred for 30 minutes. The extract was then transferred to another vial, and the extraction process was repeated with a fresh portion of solvent. This procedure was carried out three times. The resulting extracts were combined, and filtered through a paper filter, and the filtrate was concentrated to a volume of approximately 1.5 ml through solvent evaporation. The concentrated extract was then quantitatively transferred to a 2 ml vial for further analysis.
4.4. FTIR-ATR Spectra Measurement
For the FTIR-ATR analysis, powdered parts of the plants were directly placed onto the diamond crystal of the Nicolet 6700 spectrometer. The diamond crystal was cleaned after each measurement to ensure optimal spectra quality. All spectra were collected in absorbance mode within the range of 400-4000 cm-1. Each sample was subjected to three separate measurements, and a total of 16 scans were averaged for each spectrum.
5. Conclusions
The prevalence of powdered spices, herbs, and teas presents a significant challenge for ingredient identification based on morphological features, complicating the accurate assessment of authentic ingredients and opening avenues for substituting genuine components with more cost-effective alternatives. The supply chain for raw materials in the food and pharmaceutical industry is intricate and lengthy, with vulnerabilities to adulteration at various stages such as production, delivery, or packaging. Food authentication procedures are crucial for verifying if a product aligns with its label description, complies with regulations, and meets legal standards. Intentional adulteration or misrepresentation of raw materials may pose risks to the health and safety of consumers.
Adopting rapid and non-destructive analysis methods for plant raw materials is essential throughout the supply chain, prompting the exploration of efficient analytical tools. In our study, we focused on material derived from five herbs of the Lamiaceae family, cultivated in Eastern Poland. We aimed to develop an economical, non-destructive, and low-solvent methodology suitable for rapidly assessing dried plant material. UV-VIS and ATR-FTIR spectra of the five herbs investigated were recorded to do this. Despite facing challenges in differentiating individual samples based solely on their analysis, a detailed examination of both spectra identified specific wavenumbers and wavelength regions known as the 'fingerprint area.' This area was determined to be 310-440 nm for UV-Vis, while it was identified as 1000-1300 cm-1 for ATR-FTIR. Various discriminative techniques were used to distinguish the studied herbs, including class-based methods and traditional machine-learning models. Among these, SIMCA emerged as the most effective and efficient. The method consistently delivered reliable performance across different training sets, highlighting its robustness in discrimination. This methodology is notable for its speed, non-destructiveness, and minimal reagent need. The study emphasizes the effectiveness of combining FT-IR spectroscopy and UV-Vis spectrophotometry with SIMCA, providing a simple yet powerful tool for analyzing herbs and distinguishing between five plant species from the Lamiaceae family.
Supplementary Materials
The following supporting information can be downloaded at the website of this paper posted on Preprints.org, Figures S1, S2: The raw/averaged UV-VIS/ATR-FTIR spectra by species; Figures S3, S4: PCA score plots for the ATR-FTIR and UV-Vis spectra Table S1: List of the investigated plants.
Author Contributions
“Conceptualization, J.K.; methodology, K.K-A., J.K., A.R.; software, K.K-A., A.R.; formal analysis, J.K.; investigation, K.K-A., A.R.; data curation, K.K-A.; writing—original draft preparation, K.K-A., A.R., J.K.; writing—review and editing, K.K-A., A.R. visualization, A.R.; supervision, J.K.; project administration, K.K-A.;. All authors have read and agreed to the published version of the manuscript.”
Data Availability Statement
We encourage all authors of articles published in MDPI journals to share their research data. In this section, please provide details regarding where data supporting reported results can be found, including links to publicly archived datasets analyzed or generated during the study. Where no new data were created, or where data is unavailable due to privacy or ethical restrictions, a statement is still required. Suggested Data Availability Statements are available in section “MDPI Research Data Policies” at https://www.mdpi.com/ethics.
Acknowledgments
The authors would like to thank the Computational Center of the University of Bialystok (Grant GO-008) for providing access to the computational resources.
Conflicts of Interest
The authors declare no conflict of interest.”
References
- Galvin-King, P.; Haughey, S.A.; Elliott, C.T. Herb and spice fraud; the drivers, challenges and detection. Food Control 2018, 88, 85–97. [Google Scholar] [CrossRef]
- Wielogorska, E.; Chevallier, O.; Black, C.; Galvin-King, P.; Delêtre, M.; Kelleher, C.T.; Haughey, S.A.; Elliott, C.T. Development of a comprehensive analytical platform for the detection and quantitation of food fraud using a biomarker approach. The oregano adulteration case study. Food Chemistry 2018, 239, 32–39. [Google Scholar] [CrossRef]
- Kucharska-Ambrożej, K.; Karpinska, J. The application of spectroscopic techniques in combination with chemometrics for detection adulteration of some herbs and spices. Microchemical Journal 2020, 153, 104278. [Google Scholar] [CrossRef]
- Kucharska-Ambrożej, K.; Martyna, A.; Karpińska, J.; Kiełtyka-Dadasiewicz, A.; Kubat-Sikorska, A. Quality control of mint species based on UV-VIS and FTIR spectral data supported by chemometric tools. Food Control 2021, 129, 108228. [Google Scholar] [CrossRef]
- Gudi, G.; Krähmer, A.; Krüger, H.; Schulz, H. Attenuated total reflectance–Fourier transform infrared spectroscopy on intact dried leaves of sage (Salvia officinalis L.): accelerated chemotaxonomic discrimination and analysis of essential oil composition. Journal of agricultural and food chemistry 2015, 63, 8743–8750. [Google Scholar] [CrossRef]
- Javaid, M.; Haleem, A.; Singh, R.P.; Suman, R.; Gonzalez, E.S. Understanding the adoption of Industry 4.0 technologies in improving environmental sustainability. Sustainable Operations and Computers 2022, 3, 203–217. [Google Scholar] [CrossRef]
- Ingrid, M.E.; Dana, O.; Bastiaan, J.V. Current challenges in the detection and analysis of falsified medicines. Journal of Pharmaceutical and Biomedical Analysis 2021, 197, 113948. [Google Scholar]
- Gan, F.; Ye, R. New approach on similarity analysis of chromatographic fingerprint of herbal medicine. Journal of Chromatography A 2006, 1104, 100–105. [Google Scholar] [CrossRef]
- Li, Y.; Shen, Y.; Yao, C.-l.; Guo, D.-a. Quality assessment of herbal medicines based on chemical fingerprints combined with chemometrics approach: A review. Journal of Pharmaceutical and Biomedical Analysis 2020, 185, 113215. [Google Scholar] [CrossRef] [PubMed]
- Bahadur, S.; Taj, S.; Ahmad, M.; Zafar, M.; Gul, S.; Shuaib, M.; Butt, M.A.; Hanif, U.; Nizamani, M.M.; Hussain, F.; et al. Authentication of the therapeutic Lamiaceae taxa by using pollen traits observed under scanning electron microscopy. Microscopy Research and Technique 2022, 85, 2026–2044. [Google Scholar] [CrossRef]
- Black, C.; Haughey, S.A.; Chevallier, O.P.; Galvin-King, P.; Elliott, C.T. A comprehensive strategy to detect the fraudulent adulteration of herbs: The oregano approach. Food Chemistry 2016, 210, 551–557. [Google Scholar] [CrossRef]
- Figuérédo, G.; Cabassu, P.; Chalchat, J.-C.; Pasquier, B. Studies of Mediterranean oregano populations. VIII—Chemical composition of essential oils of oreganos of various origins. Flavour and Fragrance Journal 2006, 21, 134–139. [Google Scholar] [CrossRef]
- Gad, H.A.; El-Ahmady, S.H.; Abou-Shoer, M.I.; Al-Azizi, M.M. A Modern Approach to the Authentication and Quality Assessment of Thyme Using UV Spectroscopy and Chemometric Analysis. Phytochemical Analysis 2013, 24, 520–526. [Google Scholar] [CrossRef] [PubMed]
- Dankowska, A.; Majsnerowicz, A.; Kowalewski, W.; Włodarska, K. The application of visible and near-infrared spectroscopy combined with chemometrics in classification of dried herbs. Sustainability 2022, 14, 6416. [Google Scholar] [CrossRef]
- Fan, Y.; Bai, X.; Chen, H.; Yang, X.; Yang, J.; She, Y.; Fu, H. A novel simultaneous quantitative method for differential volatile components in herbs based on combined near-infrared and mid-infrared spectroscopy. Food Chemistry 2023, 407, 135096. [Google Scholar] [CrossRef]
- Elfiky, A.M.; Shawky, E.; Khattab, A.R.; Ibrahim, R.S. Integration of NIR spectroscopy and chemometrics for authentication and quantitation of adulteration in sweet marjoram (Origanum majorana L.). Microchemical Journal 2022, 183, 108125. [Google Scholar] [CrossRef]
- McVey, C.; McGrath, T.F.; Haughey, S.A.; Elliott, C.T. A rapid food chain approach for authenticity screening: The development, validation and transferability of a chemometric model using two handheld near infrared spectroscopy (NIRS) devices. Talanta 2021, 222, 121533. [Google Scholar] [CrossRef] [PubMed]
- Abdulkarem, A.H.A.K.H.; Lebnane, H.A.H.M.I. Chemotaxonomy and spectral analysis (GC/MS and FT-IR) of essential oil composition of two Ocimum basilicum L. varieties and their morphological characterization. Jordan Journal of Chemistry (JJC) 2017, 12, 147–160. [Google Scholar]
- Al-Asmari, A.K.; Athar, M.T.; Al-Faraidy, A.A.; Almuhaiza, M.S. Chemical composition of essential oil of Thymus vulgaris collected from Saudi Arabian market. Asian Pacific Journal of Tropical Biomedicine 2017, 7, 147–150. [Google Scholar] [CrossRef]
- Casale, M.; Oliveri, P.; Casolino, C.; Sinelli, N.; Zunin, P.; Armanino, C.; Forina, M.; Lanteri, S. Characterisation of PDO olive oil Chianti Classico by non-selective (UV–visible, NIR and MIR spectroscopy) and selective (fatty acid composition) analytical techniques. Analytica chimica acta 2012, 712, 56–63. [Google Scholar] [CrossRef]
- Rohaeti, E.; Rafi, M.; Syafitri, U.D.; Heryanto, R. Fourier transform infrared spectroscopy combined with chemometrics for discrimination of Curcuma longa, Curcuma xanthorrhiza and Zingiber cassumunar. Spectrochimica acta. Part A, Molecular and biomolecular spectroscopy 2015, 137, 1244–1249. [Google Scholar] [CrossRef] [PubMed]
- Ying, C.; Jinfang, H.; Yeap, Z.; Xue, Z.; Shuisheng, W.; Ng, C.; Yam, M. Rapid authentication and identification of different types of A. roxburghii by Tri-step FT-IR spectroscopy. Spectrochimica Acta Part A: Molecular and Biomolecular Spectroscopy 2018, 199. [Google Scholar]
- Beale, D.J.; Morrison, P.D.; Karpe, A.V.; Dunn, M.S. Chemometric Analysis of Lavender Essential Oils Using Targeted and Untargeted GC-MS Acquired Data for the Rapid Identification and Characterization of Oil Quality. Molecules 2017, 22, 1339. [Google Scholar] [CrossRef] [PubMed]
- Economou, G.; Tarantilis, P.; Panagopoulos, G.; Kotoulas, V.; Polysiou, M.; Karamanos, A. Variability in essential oil content and composition of Origanum hirtum L., Origanum onites L., Coridothymus capitatus (L.) and Satureja thymbra L. populations from the Greek island Ikaria. Industrial Crops and Products 2011, 33. [Google Scholar] [CrossRef]
- Ercioglu, E.; Velioglu, H.M.; Boyaci, I.H. Determination of terpenoid contents of aromatic plants using NIRS. Talanta 2018, 178, 716–721. [Google Scholar] [CrossRef] [PubMed]
- Govindaraghavan, S.; Sucher, N.J. Quality assessment of medicinal herbs and their extracts: Criteria and prerequisites for consistent safety and efficacy of herbal medicines. Epilepsy Behav 2015, 52, 363–371. [Google Scholar] [CrossRef] [PubMed]
- Joshi, A.; Prakash, O.; Pant, A.K.; Kumar, R.; Szczepaniak, L.; Kucharska-Ambrożej, K. Methyl eugenol, 1, 8-cineole and nerolidol rich essential oils with their biological activities from three melaleuca species growing in Tarai region of North India. Brazilian Archives of Biology and Technology 2022, 64. [Google Scholar] [CrossRef]
- Lee, S.-J.; Umano, K.; Shibamoto, T.; Lee, K.-G. Identification of volatile components in basil (Ocimum basilicum L.) and thyme leaves (Thymus vulgaris L.) and their antioxidant properties. Food chemistry 2005, 91, 131–137. [Google Scholar] [CrossRef]
- Nezhadali, A.; Nabavi, M.; Rajabian, M.; Akbarpour, M.; Pourali, P.; Amini, F. Chemical variation of leaf essential oil at different stages of plant growth and in vitro antibacterial activity of Thymus vulgaris Lamiaceae, from Iran. Beni-Suef University Journal of Basic and Applied Sciences 2014, 3, 87–92. [Google Scholar] [CrossRef]
- Sánchez, A.M.; Carmona, M.; Zalacain, A.; Carot, J.M.; Jabaloyes, J.M.; Alonso, G.L. Rapid Determination of Crocetin Esters and Picrocrocin from Saffron Spice (Crocus sativus L.) Using UV–Visible Spectrophotometry for Quality Control. Journal of Agricultural and Food Chemistry 2008, 56, 3167–3175. [Google Scholar] [CrossRef]
- Suhandy, D.; Yulia, M. Peaberry coffee discrimination using UV-visible spectroscopy combined with SIMCA and PLS-DA. International Journal of Food Properties 2017, 20, S331–S339. [Google Scholar] [CrossRef]
- Coelho de Oliveira, H.; Elias da Cunha Filho, J.C.; Rocha, J.C.; Fernández Núñez, E.G. Rapid monitoring of beer-quality attributes based on UV-Vis spectral data. International Journal of Food Properties 2017, 20, 1686–1699. [Google Scholar] [CrossRef]
- Pages-Rebull, J.; Pérez-Ràfols, C.; Serrano, N.; del Valle, M.; Díaz-Cruz, J.M. Classification and authentication of spices and aromatic herbs by means of HPLC-UV and chemometrics. Food Bioscience 2023, 52, 102401. [Google Scholar] [CrossRef]
- Rafi, M.; Jannah, R.; Heryanto, R.; Kautsar, A.; Septaningsih, D.A. UV-Vis spectroscopy and chemometrics as a tool for identification and discrimination of four Curcuma species. International Food Research Journal 2018, 25, 643–648. [Google Scholar]
- Bunghez, F.; Socaciu, C.; Zagrean, F.; Pop, R.; Ranga, F.; Florina, R. Characterisation of an aromatic plant-based formula using UV-Vis Spectroscopy, LC-ESI(+)QTOF-MS and HPLCDAD analysis. Bulletin of University of Agricultural Sciences and Veterinary Medicine Cluj-Napoca: Food Science and Technology 2013, 70. [Google Scholar]
- Bevilacqua, M.; Bucci, R.; Magrì, A.D.; Magrì, A.L.; Marini, F. Tracing the origin of extra virgin olive oils by infrared spectroscopy and chemometrics: A case study. Analytica Chimica Acta 2012, 717, 39–51. [Google Scholar] [CrossRef] [PubMed]
- Vasas, M.; Tang, F.; Hatzakis, E. Application of NMR and Chemometrics for the Profiling and Classification of Ale and Lager American Craft Beer. Foods 2021, 10, 807. [Google Scholar] [CrossRef]
- Zeaiter, M.; Roger, J.-M.; Bellon-Maurel, V. Robustness of models developed by multivariate calibration. Part II: The influence of pre-processing methods. TrAC Trends in Analytical Chemistry 2005, 24, 437–445. [Google Scholar] [CrossRef]
- Dieterle, F.; Ross, A.; Schlotterbeck, G.; Senn, H. Probabilistic Quotient Normalization as Robust Method to Account for Dilution of Complex Biological Mixtures. Application in 1H NMR Metabonomics. Analytical Chemistry 2006, 78, 4281–4290. [Google Scholar] [CrossRef]
- Correia, G.D.S.; Takis, P.G.; Sands, C.J.; Kowalka, A.M.; Tan, T.; Turtle, L.; Ho, A.; Semple, M.G.; Openshaw, P.J.M.; Baillie, J.K.; et al. 1H NMR Signals from Urine Excreted Protein Are a Source of Bias in Probabilistic Quotient Normalization. Analytical Chemistry 2022, 94, 6919–6923. [Google Scholar] [CrossRef]
- Sommer, A.A.; Arega, F.B.; Vodovotz, Y. Assessment of Fish Oil Oxidation Using Low-Field Proton Nuclear Magnetic Resonance Spectroscopy. ACS Food Science & Technology 2023, 3, 1476–1483. [Google Scholar]
- Luypaert, J.; Heuerding, S.; Vander Heyden, Y.; Massart, D. The effect of preprocessing methods in reducing interfering variability from near-infrared measurements of creams. Journal of pharmaceutical and biomedical analysis 2004, 36, 495–503. [Google Scholar] [CrossRef] [PubMed]
- Wold, S. , Sjöström,M in: BR Kowalski (Ed. ). Chemometrics: Theory and Application, Am. In Proceedings of the Chem. Sot. Symp. Ser; 1977. [Google Scholar]
- Vitale, R.; Cocchi, M.; Biancolillo, A.; Ruckebusch, C.; Marini, F. Class modelling by Soft Independent Modelling of Class Analogy: why, when, how? A tutorial. Analytica Chimica Acta 2023, 1270, 341304. [Google Scholar] [CrossRef]
- Avohou, T.H.; Sacré, P.-Y.; Hamla, S.; Lebrun, P.; Hubert, P.; Ziemons, É. Optimizing the soft independent modeling of class analogy (SIMCA) using statistical prediction regions. Analytica Chimica Acta 2022, 1229, 340339. [Google Scholar] [CrossRef]
- Lee, L.C.; Liong, C.-Y.; Jemain, A.A. Partial least squares-discriminant analysis (PLS-DA) for classification of high-dimensional (HD) data: a review of contemporary practice strategies and knowledge gaps. Analyst 2018, 143, 3526–3539. [Google Scholar] [CrossRef] [PubMed]
- Xu, Y.; Zomer, S.; Brereton, R.G. Support Vector Machines: A Recent Method for Classification in Chemometrics. Critical Reviews in Analytical Chemistry 2006, 36, 177–188. [Google Scholar] [CrossRef]
- FISHER, R.A. THE USE OF MULTIPLE MEASUREMENTS IN TAXONOMIC PROBLEMS. Annals of Eugenics 1936, 7, 179–188. [Google Scholar] [CrossRef]
- Wang, P.; Fan, E.; Wang, P. Comparative analysis of image classification algorithms based on traditional machine learning and deep learning. Pattern Recognition Letters 2021, 141, 61–67. [Google Scholar] [CrossRef]
- Pérez-Ràfols, C.; Serrano, N.; Díaz-Cruz, J.M. Authentication of soothing herbs by UV–vis spectroscopic and chromatographic data fusion strategy. Chemometrics and Intelligent Laboratory Systems 2023, 235, 104783. [Google Scholar] [CrossRef]
- Fahmi, Z.; Mudasir, M.; Rohman, A. Attenuated Total Reflectance-FTIR Spectra Combined with Multivariate Calibration and Discrimination Analysis for Analysis of Patchouli Oil Adulteration. Indonesian Journal of Chemistry 2019, 20, 1–8. [Google Scholar] [CrossRef]
- Oliveira, M.M.; Cruz-Tirado, J.; Barbin, D.F. Nontargeted analytical methods as a powerful tool for the authentication of spices and herbs: A review. Comprehensive Reviews in Food Science and Food Safety 2019, 18, 670–689. [Google Scholar] [CrossRef] [PubMed]
- McGoverin, C.M.; September, D.J.; Geladi, P.; Manley, M. Near infrared and mid-infrared spectroscopy for the quantification of adulterants in ground black pepper. Journal of Near Infrared Spectroscopy 2012, 20, 521–528. [Google Scholar] [CrossRef]
- Pasquini, C. Near infrared spectroscopy: A mature analytical technique with new perspectives–A review. Analytica chimica acta 2018, 1026, 8–36. [Google Scholar] [CrossRef] [PubMed]
- Petrakis, E.A.; Polissiou, M.G. Assessing saffron (Crocus sativus L.) adulteration with plant-derived adulterants by diffuse reflectance infrared Fourier transform spectroscopy coupled with chemometrics. Talanta 2017, 162, 558–566. [Google Scholar] [CrossRef] [PubMed]
- Shah, P.P.; Mello, P. A review of medicinal uses and pharmacological effects of Mentha piperita. 2004.
- Dankowska, A.; Kowalewski, W. Tea types classification with data fusion of UV–Vis, synchronous fluorescence and NIR spectroscopies and chemometric analysis. Spectrochimica Acta Part A: Molecular and Biomolecular Spectroscopy 2019, 211, 195–202. [Google Scholar] [CrossRef] [PubMed]
- Wenables, W.N.; Ripley, B.D. Modern Applied Statistics with S, Fourth edition. Springer, New York. ISBN 0-387-95457-0. 2002.
- Meyer, D.; Dymitriadou, E.; Hornik, K.; Weingssel, A.; leisch, F.; Chang, C.-C.; Lin, C.-C. e1071: Misc Functions of the Department of Statistics, Probability Theory Group (Formerly: E1071), TU Wien. R package version 1.7-14 1999.
- Bergmeir, C.; Benítez, J.M. Neural Networks in R Using the Stuttgart Neural Network Simulator: RSNNS. Journal of Statistical Software 2012, 46, 1–26. [Google Scholar] [CrossRef]
- Liaw, A.; Wiener, M. Classification and Regression by randomForest. R News 2002, 2, 18–22. [Google Scholar]
Figure 1.
The raw UV-VIS spectra of 5 species of plant samples: basil (B–blue), lavender (L–turquoise), oregano (O–green), sage (S–orange) thyme (T–red).
Figure 1.
The raw UV-VIS spectra of 5 species of plant samples: basil (B–blue), lavender (L–turquoise), oregano (O–green), sage (S–orange) thyme (T–red).

Figure 2.
(a) The raw UV-VIS spectra of 5 species of plant samples: basil (B–blue), lavender (L–turquoise), oregano (O–green), sage (S–orange) and thyme (T–red) in the range 310-440 nm (b) Spectra from Figure 2(a) smoothed with the Savitzky-Golay digital filter (c) The PQN–normalized spectra from Figure 2(b) (d) The first derivative of the spectra from Figure 2(c).
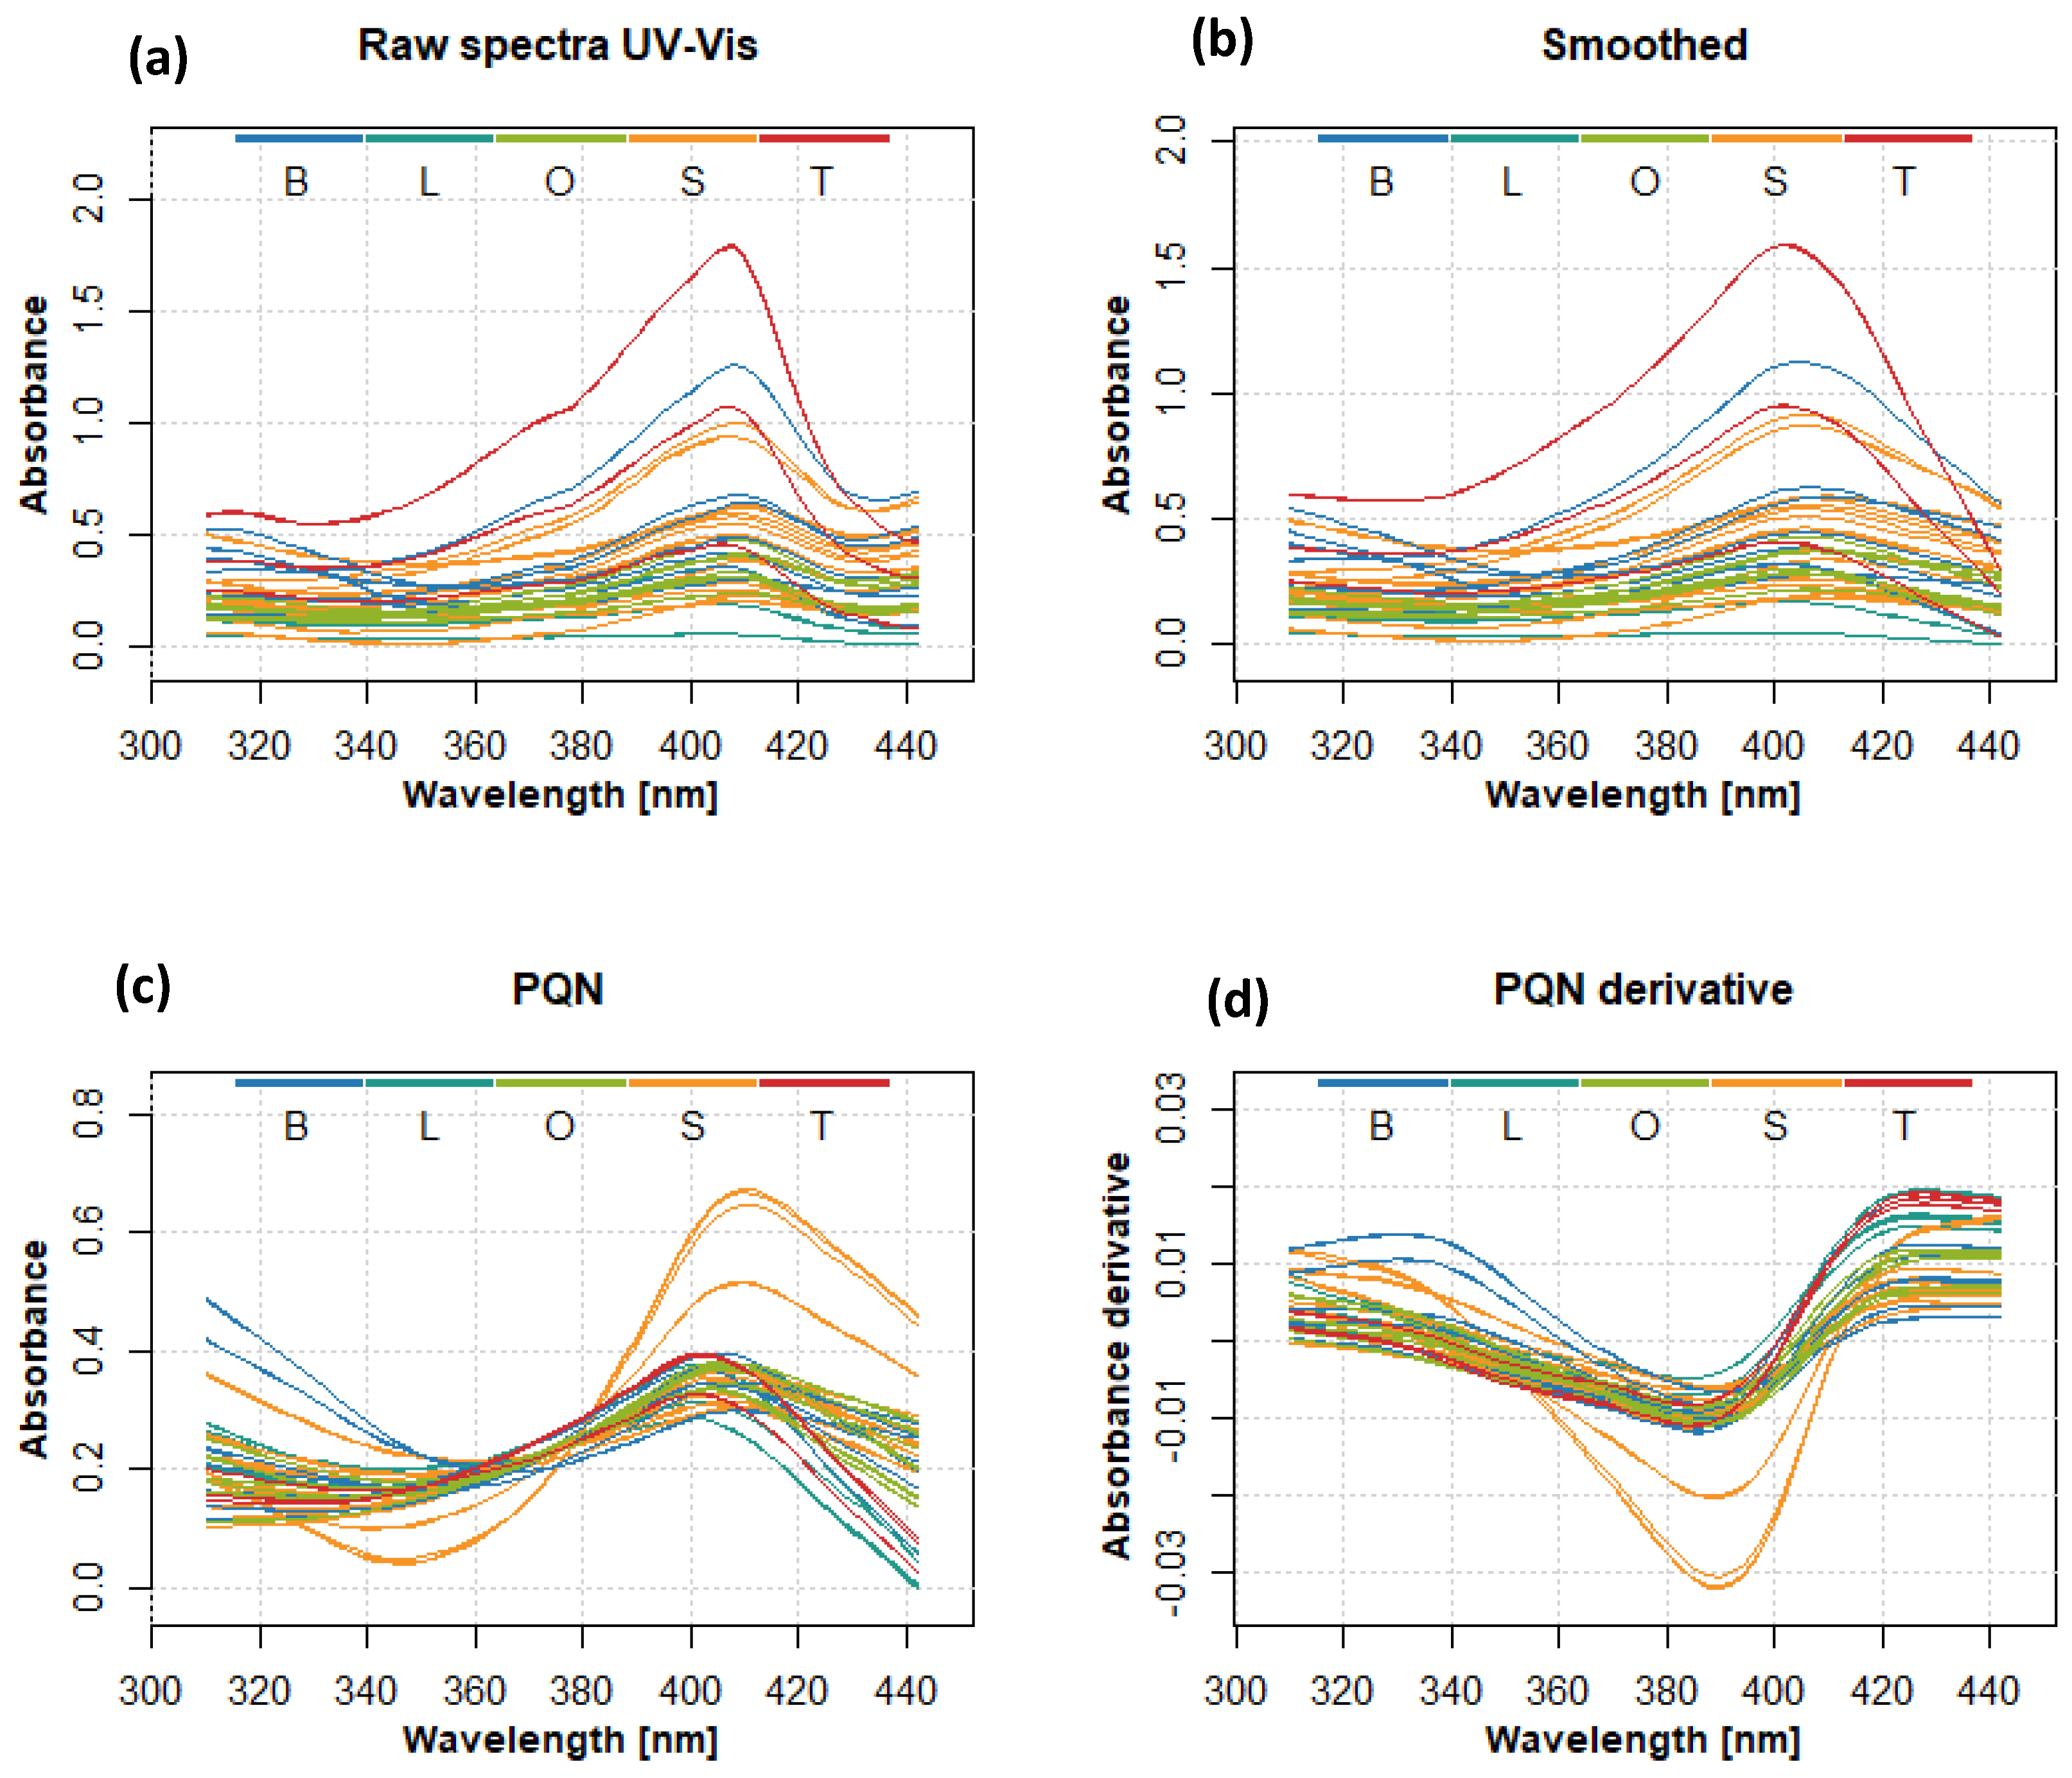
Figure 3.
The raw ATR-FTIR spectra of 5 species of plant samples: basil (B–blue), lavender (L–turquoise), oregano (O–green), sage (S–orange) and thyme (T–red).
Figure 3.
The raw ATR-FTIR spectra of 5 species of plant samples: basil (B–blue), lavender (L–turquoise), oregano (O–green), sage (S–orange) and thyme (T–red).
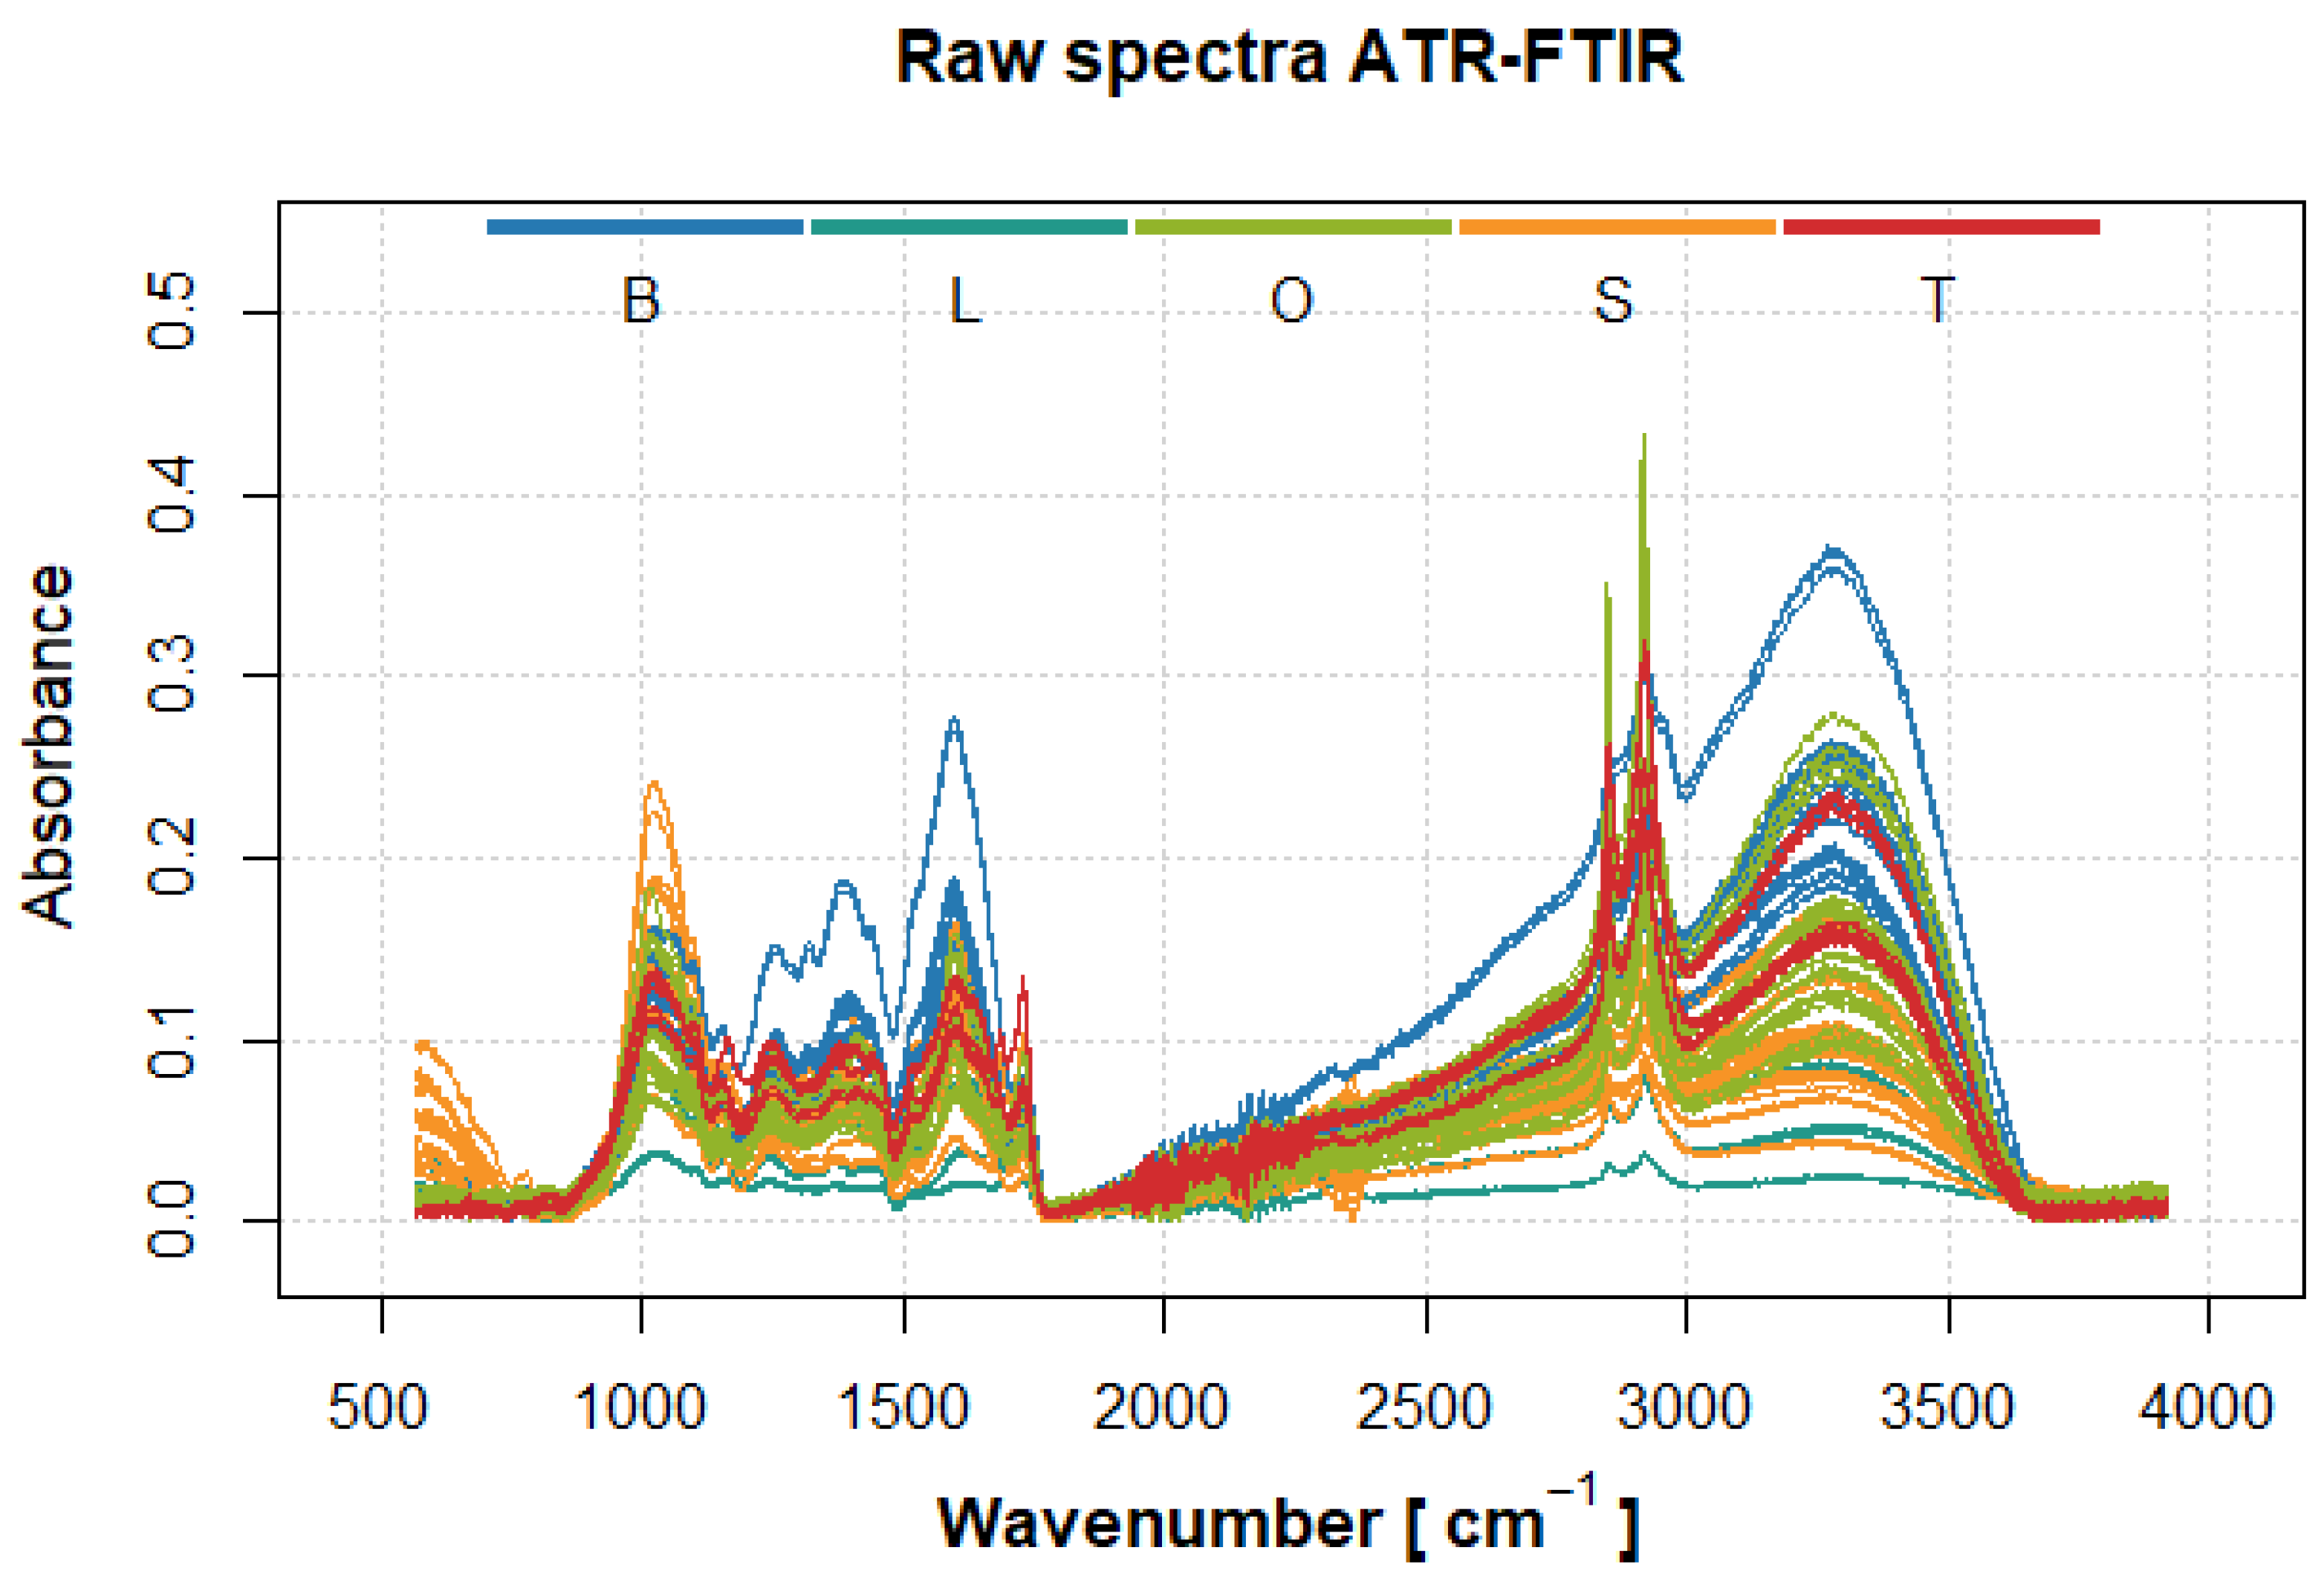
Figure 4.
(a) The raw ATR-FTIR spectra of 5 species of plant samples: basil (B–blue), lavender (L–turquoise), oregano (O–green), sage (S–orange) and thyme (T–red) in the range 1000-1300 cm-1 (b) Spectra from Figure 4(a) smoothed with the Savitzky-Golay digital filter (c) The PQN–normalized spectra from Figure 4(b) (d) The first derivative of the spectrum from Figure 4(c).
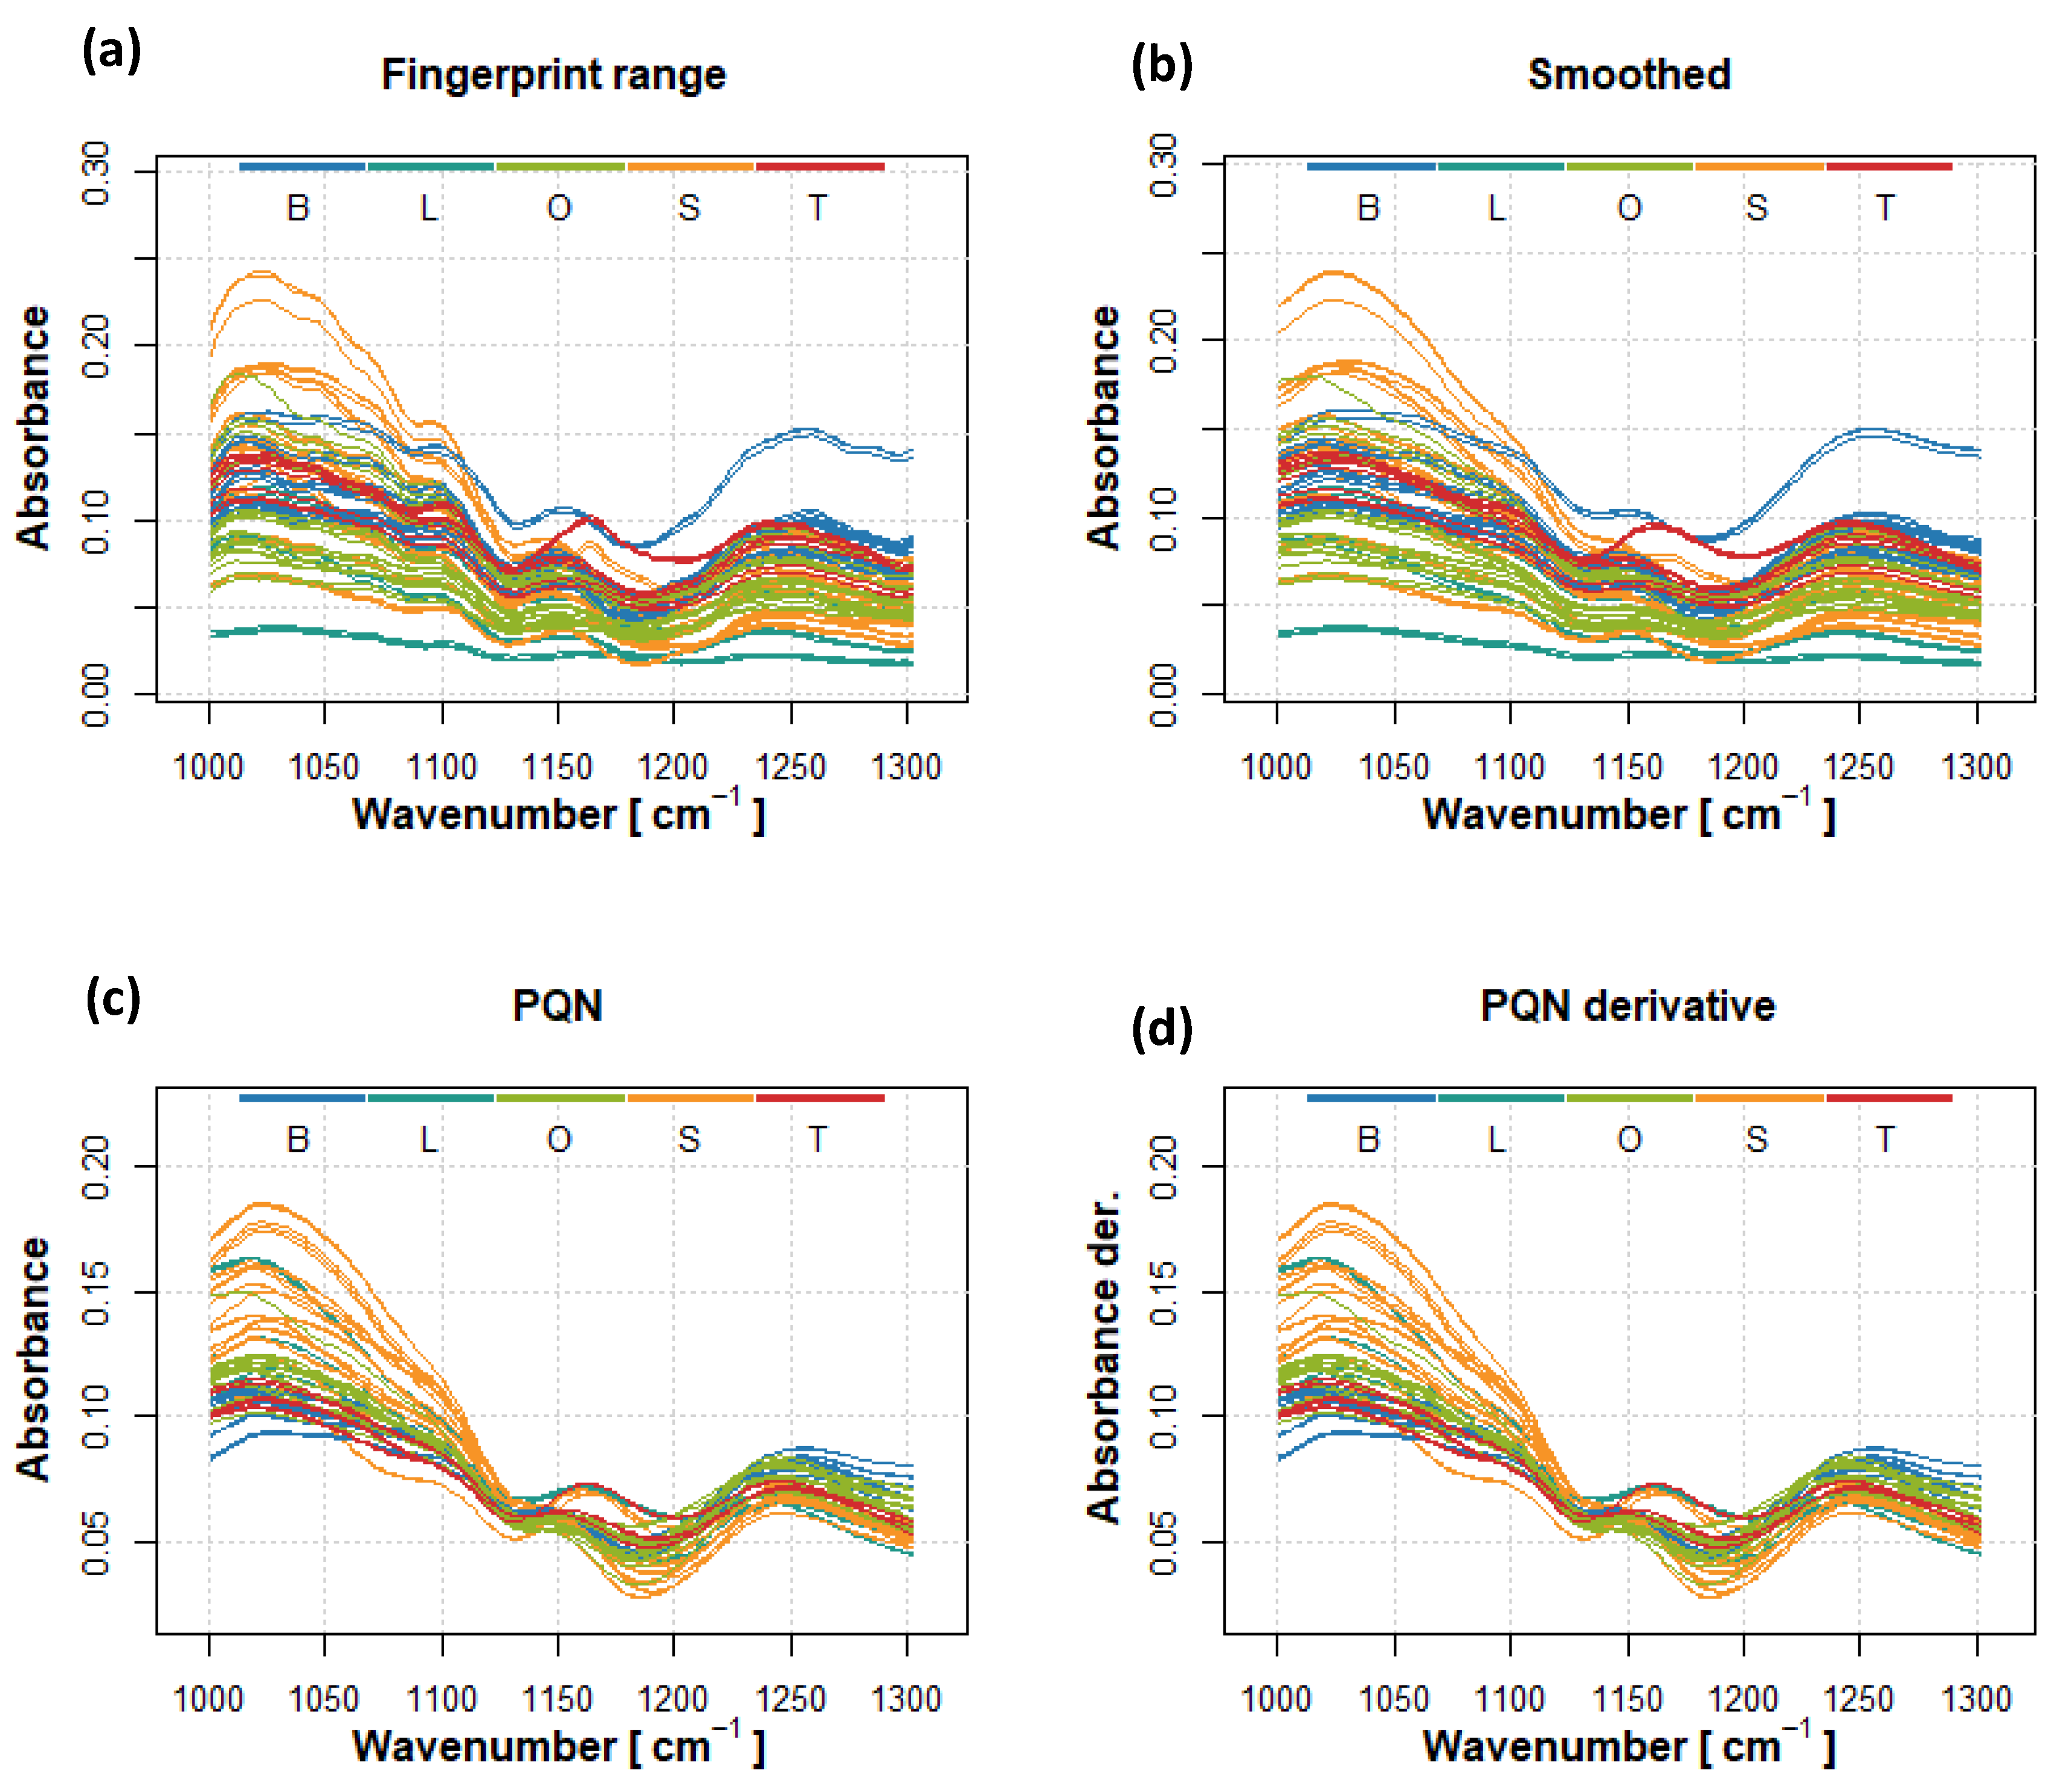
Figure 5.
Score plot of the first three principal components (PCs) resulting from (a) UV-Vis and (b) ATR-FTIR spectra of basil (blue), lavender (turquoise), oregano (green), sage (orange), and thyme (red).
Figure 5.
Score plot of the first three principal components (PCs) resulting from (a) UV-Vis and (b) ATR-FTIR spectra of basil (blue), lavender (turquoise), oregano (green), sage (orange), and thyme (red).
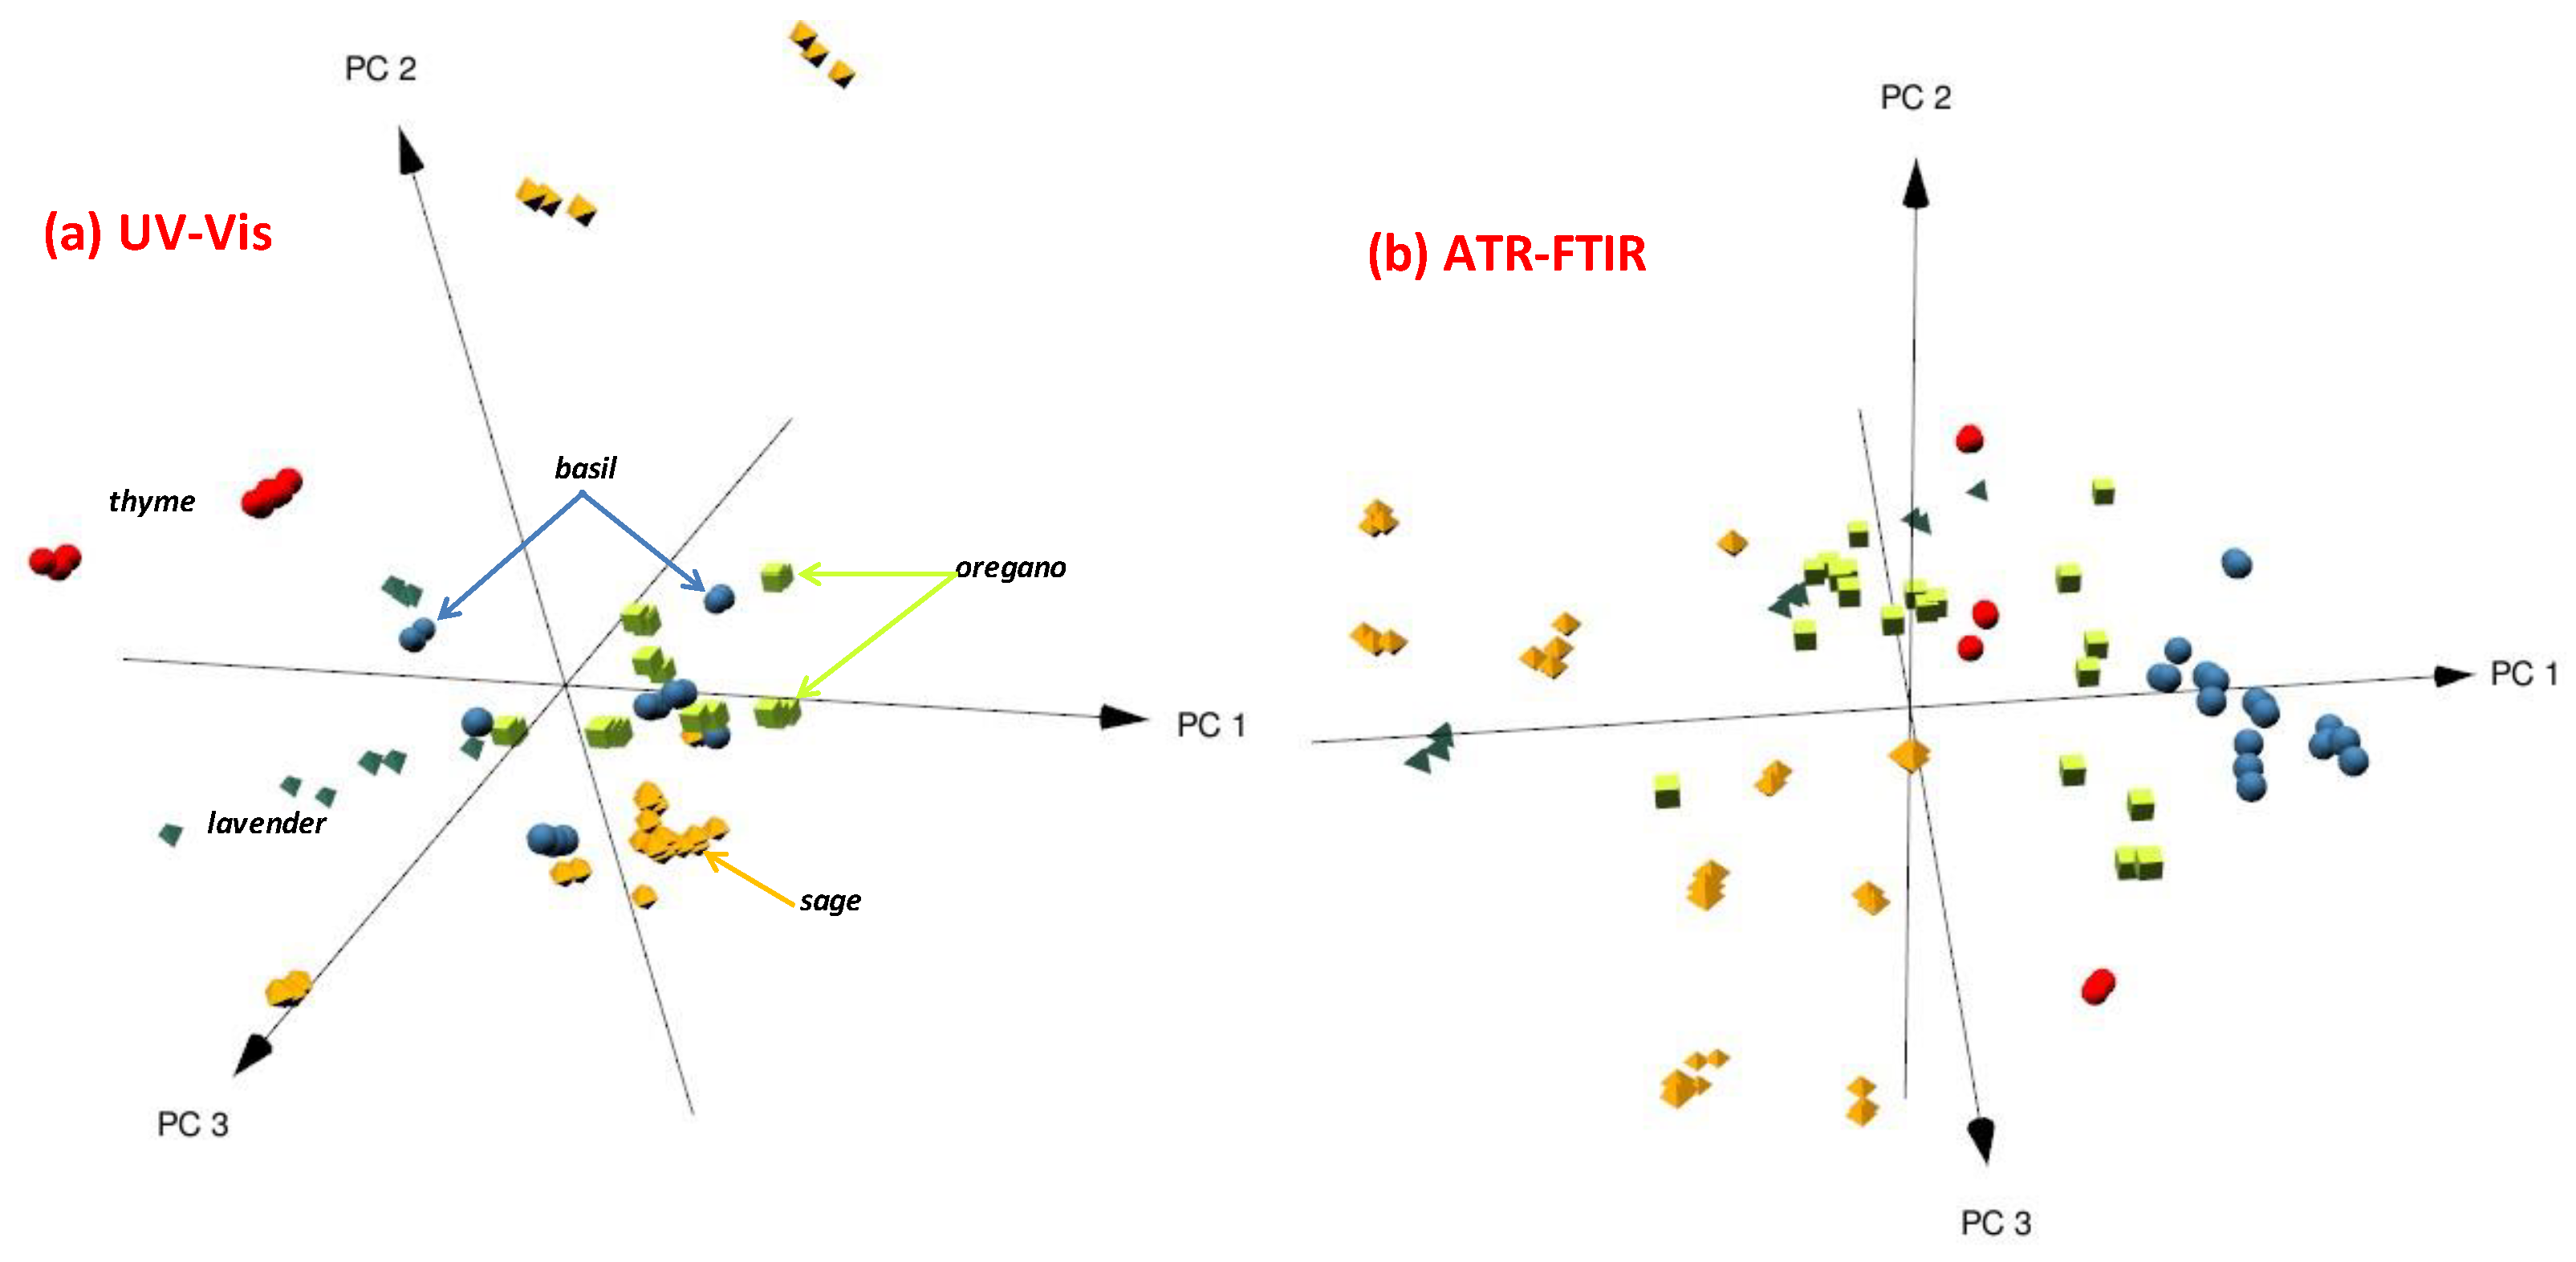
Figure 6.
SIMCA results for the UV-Vis spectra of five herbs: basil (B - blue), lavender (L - turquoise), oregano (O - green), sage (S - orange), and thyme (T - red) with k=0.33.
Figure 6.
SIMCA results for the UV-Vis spectra of five herbs: basil (B - blue), lavender (L - turquoise), oregano (O - green), sage (S - orange), and thyme (T - red) with k=0.33.
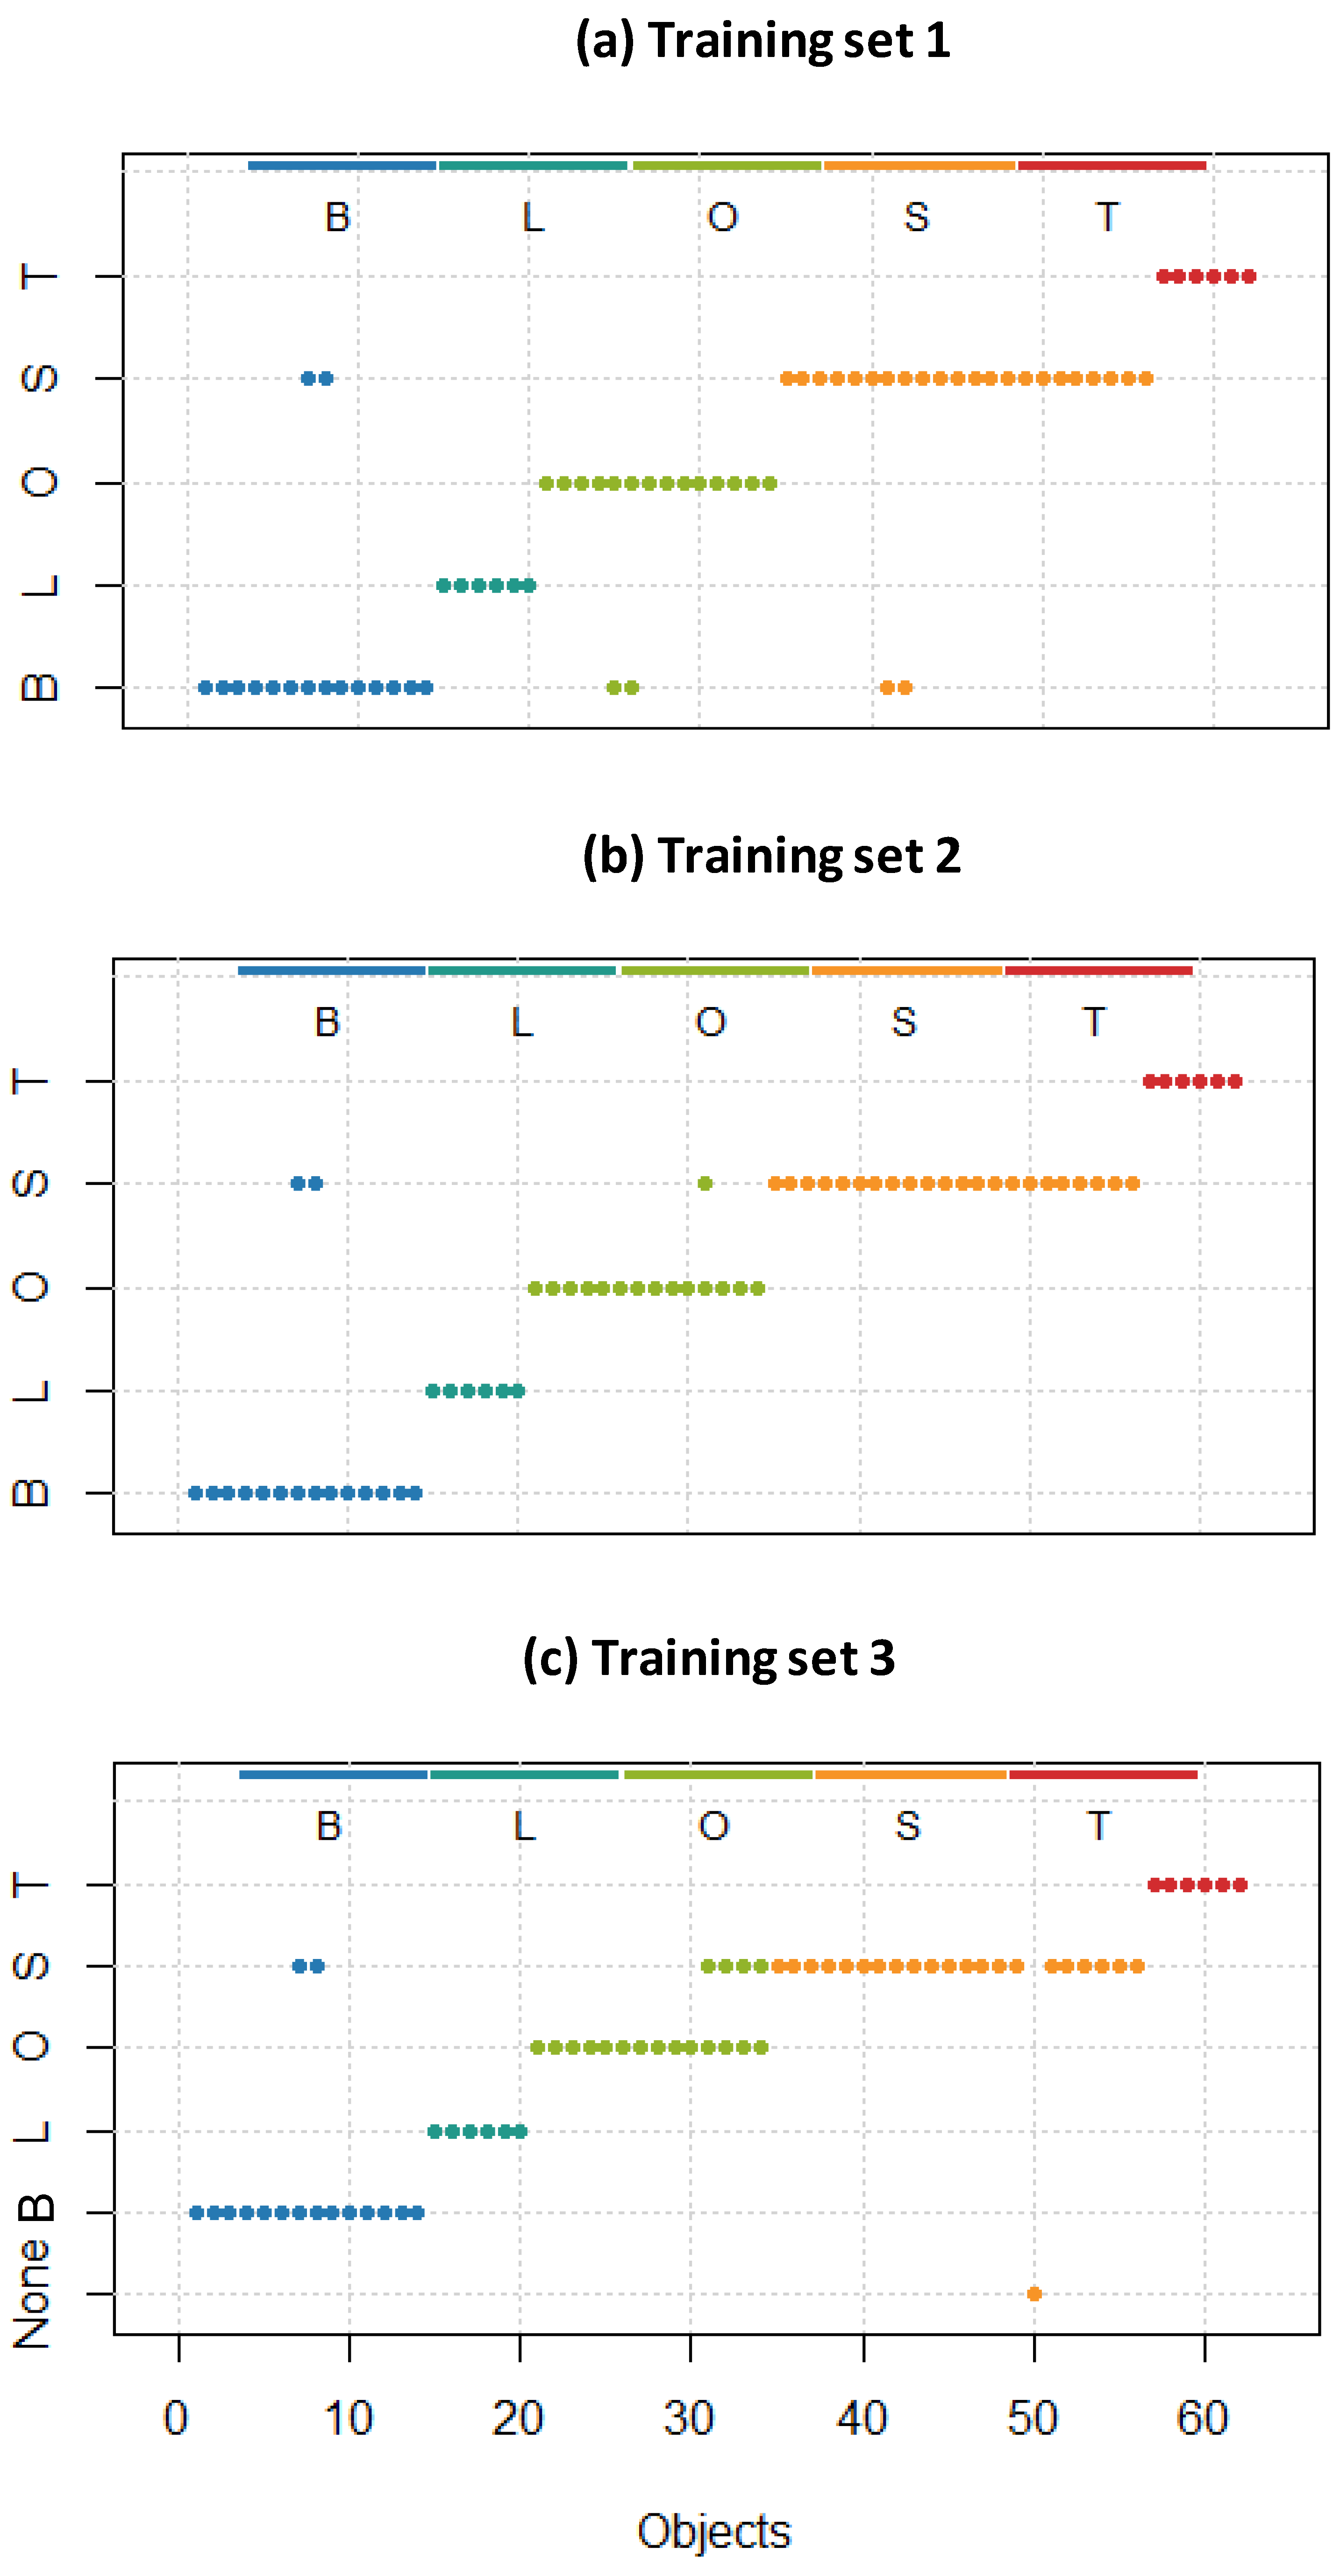
Figure 7.
SIMCA results for the ATR-FTIR spectra of five herbs: basil (B - blue), lavender (L - turquoise), oregano (O - green), sage (S - orange), and thyme (T - red).
Figure 7.
SIMCA results for the ATR-FTIR spectra of five herbs: basil (B - blue), lavender (L - turquoise), oregano (O - green), sage (S - orange), and thyme (T - red).
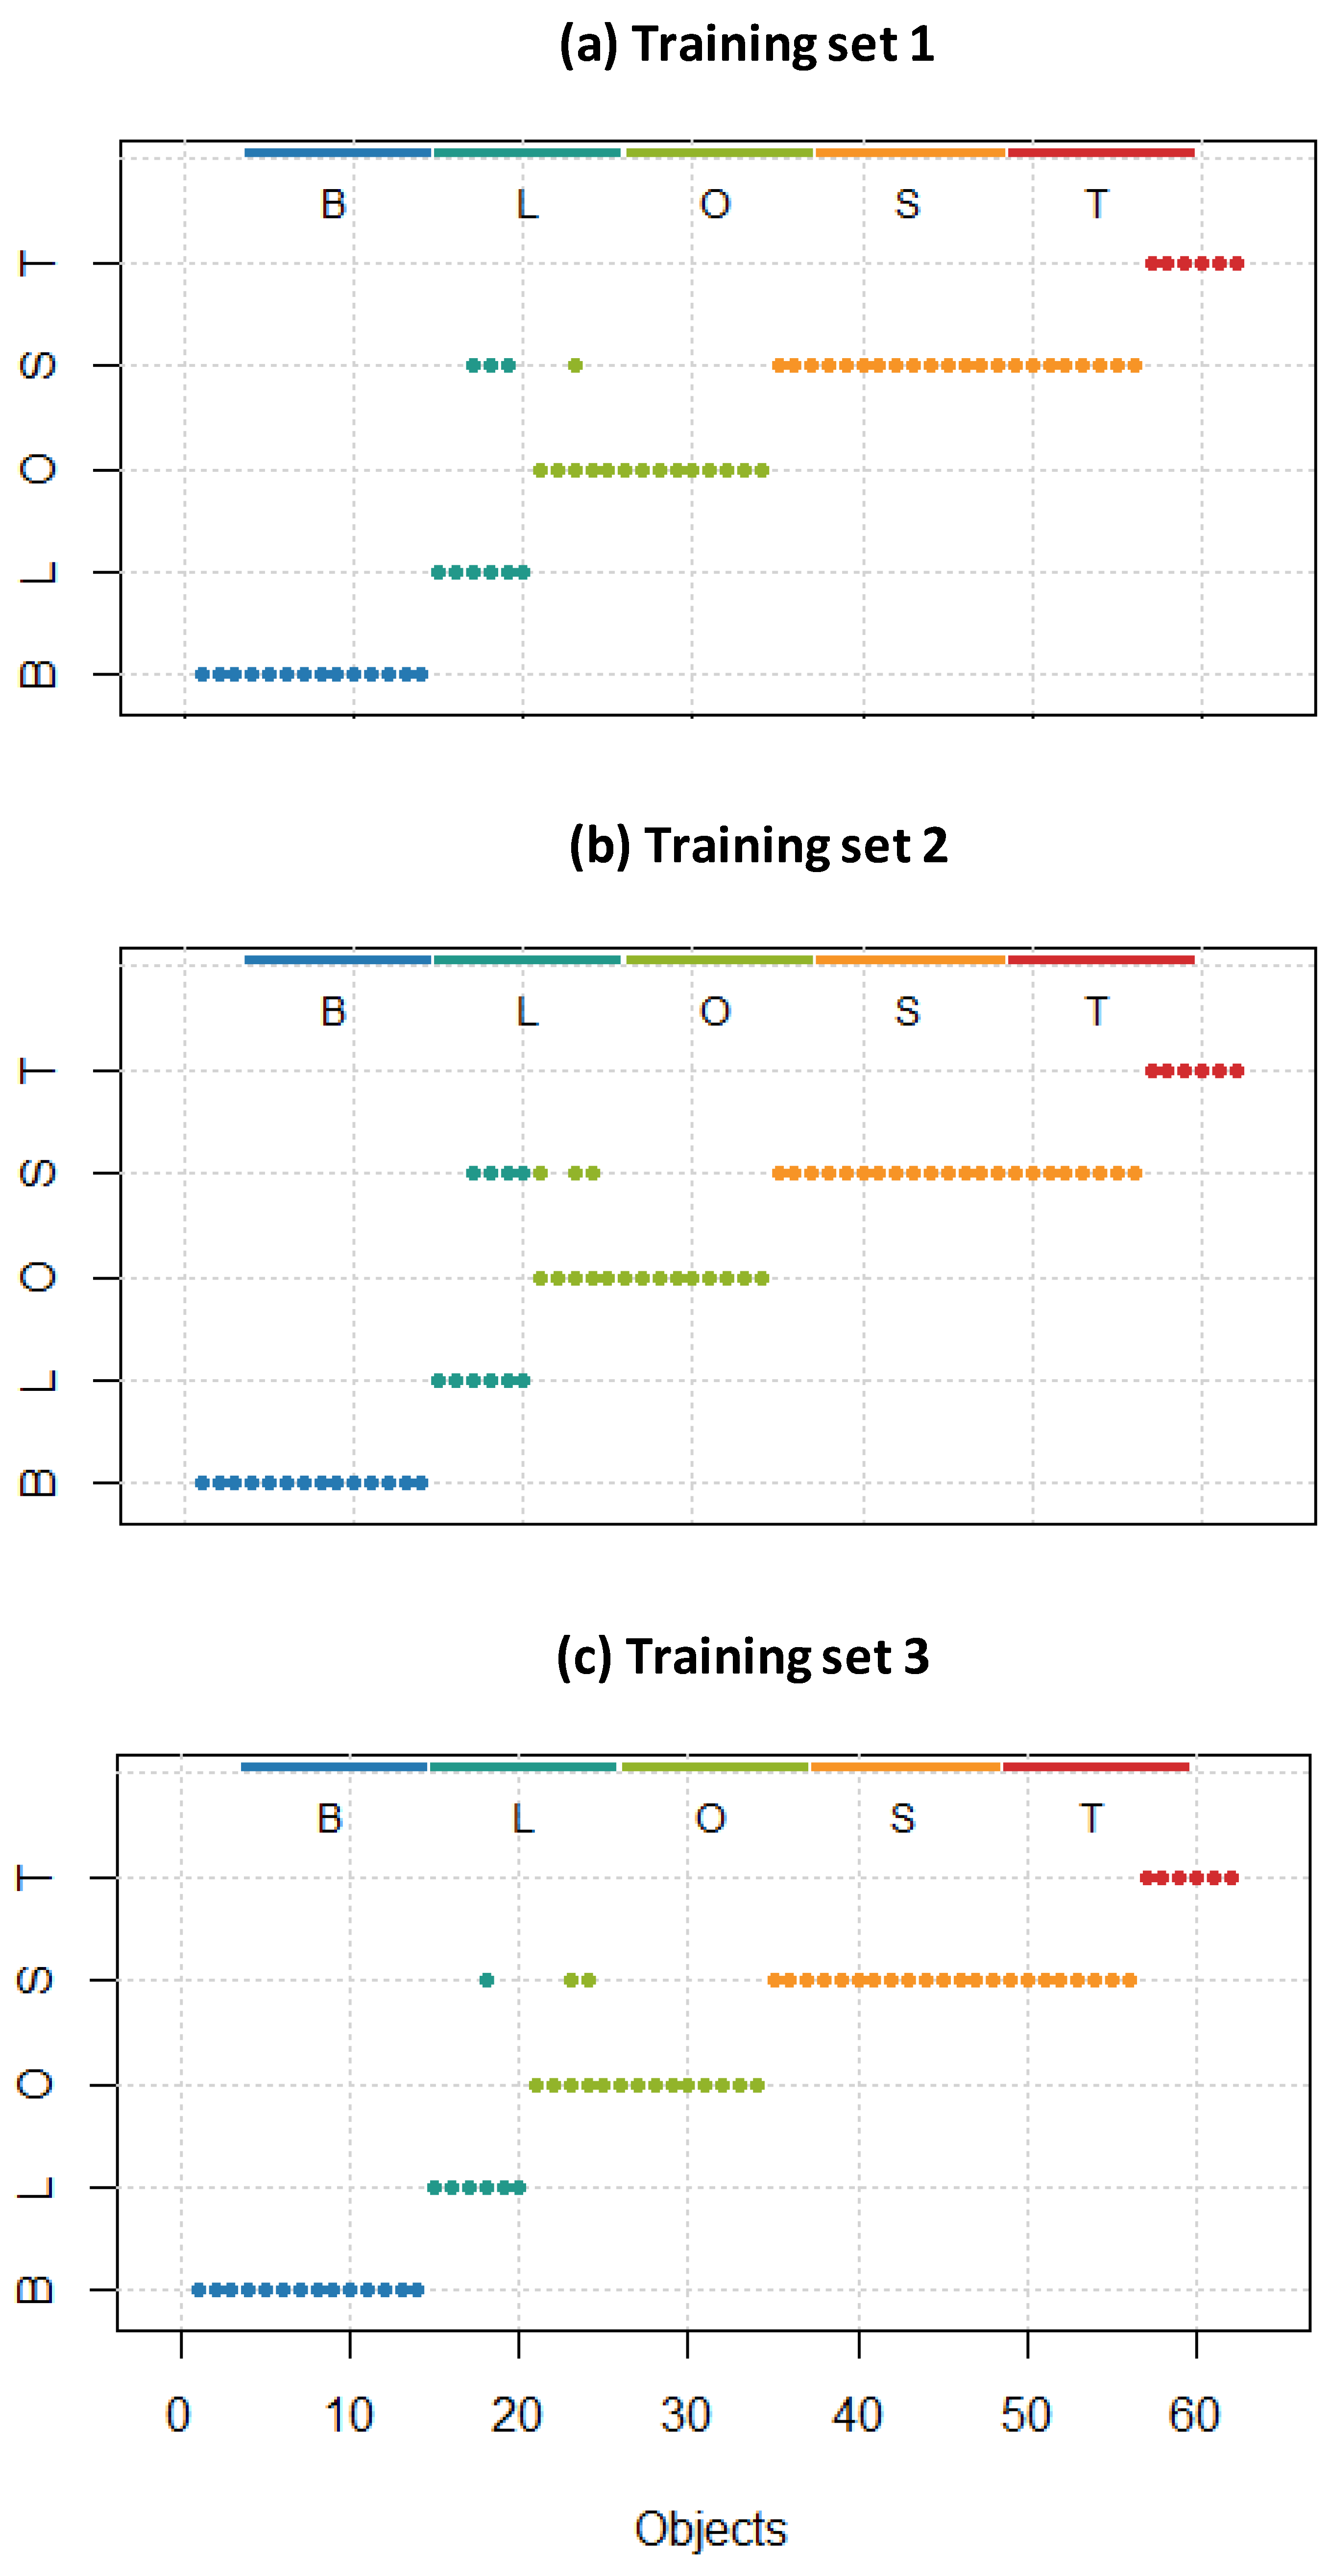

Table 1.
The performance of the different discriminant techniques for different values of the k-factor (UV-VIS).
Table 1.
The performance of the different discriminant techniques for different values of the k-factor (UV-VIS).
| Accuracy with k= | |||||||
| Method | 0.3 | 0.4 | 0.5 | 0.6 | 0.7 | 0.8 | |
| SIMCA | 0.83 | 0.83 | 0.84 | 0.87 | 0.95 | 1.00 | |
| LDA | 0.77 | 0.88 | 0.79 | 0.77 | 0.93 | 1.00 | |
| PLS/DA | 0.51 | 0.54 | 0.59 | 0.63 | 0.66 | 0.71 | |
| SVM | 0.68 | 0.71 | 0.74 | 0.68 | 0.75 | 0.88` | |
| MLP | 0.61 | 0.67 | 0.66 | 0.72 | 0.84 | 0.97 | |
| RF | 0.64 | 0.68 | 0.79 | 0.79 | 0.88 | 1.00 | |
Table 2.
The performance of the different discriminant techniques for different values of the k-factor (ATR-FTIR).
Table 2.
The performance of the different discriminant techniques for different values of the k-factor (ATR-FTIR).
| Accuracy with k= | |||||||
| Method | 0.3 | 0.4 | 0.5 | 0.6 | 0.7 | 0.8 | |
| SIMCA | 0.83 | 0.87 | 0.93 | 0.92 | 0.94 | 1.00 | |
| LDA | 0.67 | 0.77 | 0.79 | 0.81 | 0.82 | 0.86 | |
| PLS/DA | 0.49 | 0.59 | 0.66 | 0.77 | 0.77 | 0.81 | |
| SVM | 0.52 | 0.67 | 0.72 | 0.81 | 0.75 | 0.95 | |
| MLP | 0.58 | 0.61 | 0.69 | 0.77 | 0.86 | 0.92 | |
| RF | 0.67 | 0.69 | 0.81 | 0.92 | 0.86 | 0.95 | |
Disclaimer/Publisher’s Note: The statements, opinions and data contained in all publications are solely those of the individual author(s) and contributor(s) and not of MDPI and/or the editor(s). MDPI and/or the editor(s) disclaim responsibility for any injury to people or property resulting from any ideas, methods, instructions or products referred to in the content. |
© 2024 by the authors. Licensee MDPI, Basel, Switzerland. This article is an open access article distributed under the terms and conditions of the Creative Commons Attribution (CC BY) license (https://creativecommons.org/licenses/by/4.0/).
Copyright: This open access article is published under a Creative Commons CC BY 4.0 license, which permit the free download, distribution, and reuse, provided that the author and preprint are cited in any reuse.


