Submitted:
14 August 2024
Posted:
20 August 2024
You are already at the latest version
Abstract
Selective Laser Melting (SLM) is a complex additive manufacturing process that requires precise control of thermal conditions to ensure the quality and reliability of produced parts. The main challenge lies in accurately predicting the thermal behavior during SLM, which is influenced by rapid heating and cooling cycles, high thermal gradients, and temperature-dependent material properties. This study addresses this challenge by developing a comprehensive thermal model for the SLM process of 316L stainless steel (316L SS) and Ti6Al4V titanium alloy using Finite Element Analysis (FEA) in Abaqus. The model incorporates temperature-dependent material properties and phase transformations to simulate the temperature distribution and thermal history during SLM.
To validate the model, experimental studies were conducted using custom-designed argon chambers and stainless-steel powder. The experimental results showed strong agreement with the simulated melt pool dimensions and thermal histories, confirming the model's accuracy. Key findings include the model's ability to predict the effects of varying processing parameters such as laser power and scanning speed on thermal behavior and melt pool characteristics. This validated model serves as a valuable tool for optimizing SLM processing parameters, enhancing the un-derstanding of thermal phenomena in additive manufacturing, and improving the quality and reliability of manufactured parts.
Due to budget constraints, experimental validation was initially performed only on 316L SS. This approach allowed for the tuning of the finite element model before extending its application to Ti6Al4V. The successful validation with 316L SS provides a solid foundation for applying the model to more challenging materials like Ti6Al4V, ensuring cost-effectiveness and safety in initial experimentation.
The novelty of this research lies in its detailed and validated thermal model, which bridges the gap between experimental and numerical approaches in SLM. By accurately simulating and validating the thermal processes involved in SLM, this study contributes to the advancement of additive manufacturing technologies and offers practical insights for industrial applications.
Keywords:
selective laser melting
; thermal model
; finite element analysis
; 316L SS
; Ti64AI4V
; abaqus
; additive manufacturing
; temperature distribution
; melt pool dynamics
; laser processing parameters
; microstructural evolution
1. Introduction
Understanding and predicting the thermal behaviour during SLM [1,2] is critical for optimising process parameters and ensuring the quality of the final parts. The thermal history influences the manufactured components’ microstructure, mechanical properties, and residual stress distribution. Therefore, accurate thermal models are essential for SLM technology’s advancement and industrial adoption.
Selective Laser Melting (SLM) is an advanced additive manufacturing (AM) technique that fabricates complex high-strength metallic components by selectively melting and fusing metal powder layers using a high-powered laser beam. This process provides significant advantages in terms of design freedom, material efficiency, and the ability to create parts with intricate internal structures that are difficult to achieve through traditional manufacturing methods [1,2]. The SLM process involves rapid heating and cooling cycles, leading to steep thermal gradients and high cooling rates. These thermal phenomena are crucial as they directly influence the fabricated parts’ microstructural evolution and mechanical properties. The interaction between the laser and the powder bed results in complex heat transfer mechanisms, including conduction, convection, and radiation, with conduction being the dominant mode [3,4]. Accurate modelling of these thermal processes is essential for predicting melt pool geometry, solidification patterns, and residual stress formation [5].
Previous studies have highlighted the challenges in modelling the SLM process due to the complex physical phenomena involved, such as powder-liquid-solid transformations, high thermal gradients, and temperature-dependent material properties. Finite Element Analysis (FEA) [6,7] has been widely used to simulate these processes, providing insights into temperature distribution and melt pool dynamics. However, many existing models either lack comprehensive validation or fail to account for the intricate details of the SLM process.
Finite Element Analysis (FEA) is widely used to simulate the thermal and mechanical behaviour during the SLM process. These models help understand the temperature distribution, melt pool dynamics, and the resulting microstructures. Key computational challenges include the accurate representation of material properties, the interaction of the laser with the powder bed, and the transient nature of the process [6]. Advanced FEA models incorporate temperature-dependent material properties and detailed boundary conditions to improve predictive accuracy [7]. Despite advancements in modelling techniques, several challenges remain in accurately simulating the SLM process. One major challenge is capturing the dynamic behaviour of the powder bed during melting and solidification. Typically represented by a Gaussian distribution, the heat source model needs precise calibration to match the actual process conditions [8]. Additionally, the high computational cost associated with simulating the layer-by-layer nature of SLM poses significant challenges, especially for large-scale parts [9,10].
The SLM’s rapid cooling rates lead to unique microstructural features, such as fine grain structures and high dislocation densities. These features contribute to the distinct mechanical properties of SLM parts. For instance, 316L SS, a widely used titanium alloy, exhibits a complex microstructure comprising α and β phases. The phase distribution and morphology are influenced by the thermal history and cooling rates experienced during the SLM process [11]. Accurate thermal models are essential for predicting phase transformations and optimising the mechanical properties of the final parts [12].
Experimental validation is critical for ensuring the reliability of thermal models. This involves comparing simulation results with experimental data, such as melt pool dimensions and thermal histories obtained through in-situ measurements and post-process analyses. Validated models can provide insights into optimising SLM process parameters, thereby improving part quality and reducing the need for extensive experimental trials [13].
Future research should focus on integrating multi-scale models that combine simulations at different scales, from macroscopic thermal and mechanical behaviour to microscopic microstructure evolution. Additionally, incorporating machine learning techniques with traditional modelling methods holds promise for enhancing model accuracy and predictive capabilities [14,15].
This paper presents a comprehensive thermal model developed using Abaqus FEA software, specifically tailored for the Selective Laser Melting (SLM) process of 316L stainless steel (316L SS), a widely used material in the aerospace, biomedical, and automotive industries due to its excellent strength-to-weight ratio and biocompatibility. The model incorporates user-defined subroutines written in Fortran to simulate temperature-dependent material properties and phase transformations, ensuring high accuracy and relevance to real-world SLM conditions.
To validate the model, experiments were conducted using a custom-designed argon chamber and stainless steel powder. The experimental setup involved melting stainless steel powder using a fiber laser system under controlled conditions. The samples were sectioned, polished, and etched to reveal the melt pool dimensions, which were then examined under a high-resolution optical microscope. The captured images were analyzed using specialized image processing software to measure the melt pool dimensions accurately. Multiple measurements across different samples ensured statistical accuracy, with the results compared systematically against the model predictions.
This comparison involved varying key processing parameters, such as laser power and scanning speed, to observe their impact on thermal behavior and melt pool characteristics. The model’s ability to predict the effects of these parameters on thermal behavior and melt pool characteristics was confirmed through strong agreement between the experimental data and simulation results. This validated model serves as a valuable tool for optimizing SLM processing parameters, enhancing the understanding of thermal phenomena in additive manufacturing, and improving the quality and reliability of manufactured parts.
Due to budget constraints, experimental validation was initially performed only on 316L SS. This approach allowed for the tuning of the finite element model before extending its application to Ti6Al4V. The successful validation with 316L SS provides a solid foundation for applying the model to more challenging materials like Ti6Al4V, ensuring cost-effectiveness and safety in initial experimentation.
This study bridges the gap between experimental and numerical approaches in SLM, providing a robust tool for optimizing process parameters and enhancing the understanding of thermal phenomena in additive manufacturing. The insights gained from this research will contribute significantly to the development of more efficient and reliable SLM processes, ultimately advancing the field of additive manufacturing. The novelty of this research lies in its detailed and validated thermal model, which accurately simulates and validates the thermal processes involved in SLM, offering practical insights for industrial applications.
2. Materials and Methods
A Finite Element Model was developed using ABAQUS/CAE 2017 to predict the global temperature fields formulated during the SLM process. User subroutines written in FORTRAN were used to apply the laser heat flux and material properties. The laser is a continuous Gaussian distribution and moves in a uni-directional direction along the x-axis. The model consists of two components: the powder layer and the substrate. A 1.0 x 0.5 mm powder layer of 50 µm thickness was deposited onto a substrate of 250 µm thickness. The powder bed is assumed to be a homogeneous and continuous medium. A mesh size of 0.01 x 0.01 x 0.01 mm was used for the powder layer, while a coarser mesh of 0.05 x 0.05 x 0.05 mm (length x width x thickness) was used for the substrate to reduce computation times. Both components used the 3D solid DC3D8 heat transfer element. The numerical model and mesh structure are shown in Figure 1.
2.1. Governing Equations
The heat equation governs the spatial and temporal distribution of the temperature:
Where ρ is the density, C is the specific heat capacity, k is the thermal conductivity, T is the temperature, t is the time, and Q is the absorbed heat.
During SLM, the heat generated from the laser beam is absorbed and reflected by the metal powders. User subroutine DFLUX was used to model the laser input as a moving heat flux with a Gaussian distribution on top of the powder bed surface. Equation 2 [16] shows the expression used to find the input heat flux q:
where A is the absorption coefficient, P is the laser power, R is the effective laser beam radius, v is the laser beam velocity, x y is the grid node coordinates and x0, y0 are the coordinates of the start focus point. A value of 0.4 was taken for the laser absorptance for 316L SS and 0.3 for TI6AI4V [17] and has been assumed constant throughout the simulation.
2.2. Initial and Boundary Conditions
The initial temperature distribution in the substrate or powder beds can be expressed in Equation (3). In addition to the environment temperature being controlled, the bottom surface of the substrate is often set to a controlled temperature. Therefore, a fixed thermal boundary condition at the substrate can be applied in the model as shown in (4):
where x, y, z is the position, T∞ is the ambient temperature, and Ts is the preheat temperature. Conditions were set at the beginning of the simulation to ensure accurate results. The ambient temperature is uniform and was assumed to be room temperature and was set as T∞ = 293K. In comparison, the substrate temperature is set to Ts = 373K when applied.
The laser beam energy is absorbed on the powder layer surface. Most energy is conducted into nearby powder particles through the melt pool or the build platform. In contrast, some energy is lost to convection and radiation from the surface. Therefore, conductive heat losses have been applied using a surface film condition. As only a small area has been modelled, this condition has been applied to the side surfaces to simulate losses to surrounding powder and to the bottom surface to simulate conductive heat loss to the substrate.
The surface of the powder bed experiences convection and radiation. Both radiation and convection can add to the non-linearity of analysis as these are temperature-dependent, increasing computational costs. Therefore, convection and radiation conditions have been applied to the top surfaces and modelled as a combined boundary equation to reduce computational costs. The Equation below has been implemented with user-subroutine FILM to model convection and radiation.
where ϵp is the powder emissivity, a constant value for emissivity and convection coefficient has been chosen. In this case, 0.3 and 10 W/m2K have been used, respectively. Fluidity has been ignored due to the small melt pool sizes that will be modelled. The bottom of the powder layer has been assumed to be in complete contact with the substrate below and has perfect thermal contact.
2.3. Material Properties
The part undergoes cyclic melting and solidification throughout the SLM process transitioning from solid-liquid-solid. The latent heat of fusion was considered to simulate this phase change. 316L SS has a liquidus temperature of 1710 K and a solidus temperature of 1683 K [9] and a specific latent heat of fusion of 286000 J/kg. The high temperatures encountered result in non-linear values of changes to the values of thermal conductivity, density and specific heat. Ti6Al4V has a liquidus temperature of 1923 K with a solidus temperature of 1878 K [59] and a specific latent heat of fusion of 286 kJ/kg. Ti6Al4V is a dual-phase alloy consisting of a majority of α phase at room temperature. As the temperature increases past the β transus (1268 ± 15 K), there is a slight decrease in thermal conductivity and specific heat. The temperature-dependent thermophysical properties of 316L SS and Ti6Al4V used in the model are listed in Table 1 and Table 2, respectively. Data were obtained from published literature by Mills [16]. Vaporisation of material at boiling point (3560K) is not accounted for in this model. The effective thermal conductivity is significantly different for powders than solid parts due to gas occupying the pores in the loose powder. For powders of around 30 µm, a thermal conductivity of 0.2 W/mK has been reported [18]. The density of metallic powders that are uncompressed powder is in the range of 40-60% [18]. Equation 3 was used to calculate powder density (ρp) to the bulk density (ρs). φ is the phase fraction and was measured as 0.4.
ρp = (1−φ)ρs
The subroutine USDFLD was used to apply a field variable that indicates the material state, with 0 representing powder and 1 representing solid. This approach allows the model to dynamically update the material properties based on the temperature. When the material reaches its melting point, the field variable changes from 0 to 1, signifying the transition from powder to solid state. Once this transition occurs, the model switches from using the thermal properties of the powder to those of the bulk solid material.
Table 1 and Table 2 provide the temperature-dependent properties for 316L stainless steel (316L SS) and Ti6Al4V, respectively. These properties include density, specific heat, thermal conductivity, phase change behavior, and latent heat, which vary significantly between the powder and solid states.
Density:
For 316L SS, the density decreases from 7950 kg/m³ at room temperature to 6765 kg/m³ near the melting point (1873 K). In the case of Ti6Al4V, the density decreases from 4420 kg/m³ at room temperature to approximately 3750 kg/m³ near its melting point (1923 K).
Impact on Simulation: The density affects the material’s thermal inertia, influencing how quickly it heats up and cools down. Lower density in the molten state means the material can heat up more rapidly, which is critical for accurately predicting the melt pool dynamics and ensuring precise control over the melting and solidification process.
Specific Heat:
For 316L SS, specific heat increases from 0.47 J/kg·K at room temperature to approximately 0.83 J/kg·K near the melting point. For Ti6Al4V, it increases from 546 J/kg·K at room temperature to approximately 831 J/kg·K near its melting point.
Impact on Simulation: Specific heat determines the amount of energy required to raise the temperature of the material. Higher specific heat values in the molten state mean that more energy is required to maintain the material in a molten state, which influences the energy input calculations and the temperature distribution within the material during the SLM process.
Thermal Conductivity:
For 316L SS, thermal conductivity increases from 13.4 W/m·K at room temperature to approximately 30.5 W/m·K near the melting point. For Ti6Al4V, it increases from 7.0 W/m·K at room temperature to approximately 30.6 W/m·K near its melting point.
Impact on Simulation: Thermal conductivity affects the rate at which heat is conducted through the material. Higher thermal conductivity in the molten state facilitates more efficient heat transfer, which is crucial for predicting the temperature gradients and cooling rates. Accurate modeling of thermal conductivity ensures realistic simulation of heat dissipation and solidification patterns, which are vital for controlling microstructural evolution and mechanical properties.
Phase Change and Latent Heat:
The latent heat of fusion for 316L SS is approximately 290,000 J/kg, while for Ti6Al4V, it is about 286,000 J/kg. These values represent the energy required for the material to transition from solid to liquid without changing temperature.
Impact on Simulation: The inclusion of phase change and latent heat is essential for accurately modeling the SLM process. During the phase transition, the temperature remains constant despite the continuous input of energy, which is absorbed as latent heat. This effect is crucial for predicting the thermal history and melt pool behavior. The accurate representation of latent heat ensures that the model can simulate the energy absorption during melting and the subsequent release during solidification, which affects the cooling rates and solidification patterns. These factors are vital for determining the microstructural characteristics and mechanical properties of the final part.
By implementing the USDFLD subroutine, the model accurately captures the phase transition and ensures that the thermal properties used in the simulations are representative of the actual material state. This method enhances the accuracy of the thermal predictions and provides a more realistic simulation of the SLM process, contributing to better optimization of process parameters and improved quality of the manufactured parts.
During the SLM process, the rapid heating rates can shift the temperatures at which phase transitions occur. This phenomenon, known as kinetic undercooling or superheating, depends on the heating rate and material properties. Our model uses an adjusted phase change temperature to account for these effects, considering the rapid heating rates typical of SLM.
The data for density, specific heat capacity, and thermal conductivity were obtained from reputable sources, including the work by Mills (2002) and recent studies on the thermophysical properties of these alloys. These temperature-dependent properties were implemented in the thermal model using user-defined subroutines in Abaqus, allowing for dynamic updating of material properties at each time step during the simulation.
In summary, incorporating accurate high-temperature material properties into the thermal model is essential for predicting the temperature distribution and thermal history during the SLM process. By accounting for temperature-dependent changes in density, specific heat capacity, thermal conductivity, and the energy required for phase transitions, our model provides a comprehensive and reliable simulation of the SLM process for 316L SS and Ti6Al4V. This detailed approach ensures that the model can accurately predict the effects of various processing parameters on melt pool dynamics and thermal behaviour.
3. Experimental Studies
This section summarises the experimental work on melting metal powders using the fibre laser system at Queen’s University Belfast (QUB). This work’s primary goal is to validate the developed thermal models. Additionally, an alternative approach to using a Selective Laser Melting (SLM) Additive Manufacturing (AM) machine was investigated, whereby a high-powered laser is employed along with custom-designed fixtures to simulate the SLM environment. This approach offers a cost-effective and rapid validation method with extensive customisation options.
3.1. Experimental Setup
The experiments involved melting stainless steel powder on a single layer and measuring the resulting melt pool dimensions. Throughout the process, the experimental setup was iteratively improved to obtain high-quality samples for validation. Initial trials highlighted the importance of precise control over laser parameters and environmental conditions to achieve reliable and reproducible results.
Laser System and Configuration: Laser melting was achieved using a 200 W automated continuous-wave (CW) fiber laser system (MLS-4030) integrated by MicroLasersystems BV (Driel, The Netherlands) and a fiber laser produced by SPI Lasers UK Ltd (Southampton, UK) with a wavelength of 1064 nm. This laser system is capable of operating at powers ranging from 1.6 to 200 W and scanning speeds from 10 to 200 mm/s. The flexibility in power and speed settings allowed for comprehensive experimentation across a wide range of conditions.
The stand-off distance between the laser lens and the samples was adjustable, enabling modifications to the beam diameter. This adjustability was critical for fine-tuning the laser’s focus and optimizing the energy distribution across the powder bed. The laser’s position and scanning strategy were also adjustable, allowing for bi-directional scanning, which enhanced the consistency of the melt pool formation.
Material and Sample Preparation: Stainless steel 316L powder was used for the experiments due to its widespread application in various industries and its relatively lower cost compared to other materials like Ti6Al4V. The powder was carefully spread into a single, uniform layer on the substrate to ensure consistent interaction with the laser beam. The substrate material and its preparation were also standardized to minimize variability in thermal conductivity and reflectivity.
Iterative Improvements and Observations: During the initial experiments, it was observed that both laser power and scanning speed significantly affect the quality and performance of the produced parts. Specifically, higher laser powers and lower scanning speeds resulted in more extensive melting, which is crucial for achieving full densification of the powder. However, excessive power or too slow a speed could lead to over-melting and defects such as balling and excessive spatter.
Environmental conditions played a crucial role in the quality of the samples. Oxidation was present when the experiments were conducted in air, leading to poor-quality samples with surface contamination. To address this, a custom-designed argon gas chamber was implemented to create an inert atmosphere, preventing oxidation and ensuring cleaner melt pools. This setup involved sealing the chamber and purging it with argon gas to maintain a low-oxygen environment throughout the laser melting process.
Data Collection and Analysis: High-resolution optical microscopy and image analysis were employed to measure the melt pool dimensions accurately. The samples were sectioned, polished, and etched to reveal the microstructural features. Images of the cross-sections were captured at various magnifications to ensure all relevant details were visible. Specialized image processing software was used to analyze the images and extract precise measurements of the melt pool width.
Optimization of Laser Parameters: Based on the experimental observations, the laser parameters were iteratively adjusted to optimize the melting process. The optimal combination of laser power, scanning speed, and beam diameter was identified to achieve consistent and high-quality melt pools. These parameters were then used as a baseline for further experiments and model validation.
The comprehensive experimental setup, with its iterative improvements and precise control over laser and environmental parameters, was crucial for validating the thermal model. The high-quality data obtained from these experiments provided a robust foundation for comparing with the simulated results, ensuring the accuracy and reliability of the thermal predictions.
3.2. Custom-Designed Gas Chamber
A custom-designed gas chamber (Figure 2) was used to conduct in-house experiments with stainless steel powder. This chamber was critical for ensuring precise control of environmental conditions, allowing samples to be processed under an inert Argon atmosphere to prevent oxidation, which is crucial for maintaining the integrity and quality of the melt pools.
Design and Features: The gas chamber was specifically engineered to accommodate the laser melting process while maintaining an inert atmosphere. It was constructed using high-grade materials that can withstand the high temperatures generated during laser melting. The chamber was equipped with multiple access ports for laser entry, gas inlet and outlet, and sample manipulation. These ports were sealed with high-temperature-resistant gaskets to prevent gas leakage and ensure a stable inert environment.
Argon Atmosphere Control: To achieve an Argon atmosphere, the chamber was first purged with Argon gas to displace any residual air. A continuous flow of Argon was maintained throughout the experiments to ensure a consistent low-oxygen environment. The gas flow rate was carefully controlled using precision flow meters and regulators to maintain an optimal balance between gas purity and consumption. The chamber was also equipped with oxygen sensors to monitor and maintain oxygen levels below critical thresholds, ensuring minimal oxidation of the samples.
Experimental Flexibility: The custom-designed chamber allowed for extensive experimentation with varying laser parameters. The ability to adjust laser power and scanning speed within the inert environment enabled the production of a wide range of samples. By systematically varying these parameters, the study could investigate their effects on melt pool geometry and thermal history. This flexibility was essential for identifying the optimal processing conditions for different materials and ensuring reproducibility of results.
Sample Analysis: Samples produced within the gas chamber were subjected to rigorous analysis to assess their melt pool geometry and thermal history. High-resolution optical microscopy was used to examine the samples, revealing detailed microstructural features. Image analysis software quantified the melt pool dimensions, including width, providing critical data for validating the thermal models. The inert atmosphere ensured that the samples were free from oxidation-related defects, resulting in more accurate and reliable measurements.
Impact on Model Validation: The use of the custom-designed gas chamber significantly enhanced the reliability of the experimental data. By preventing oxidation, the chamber ensured that the thermal and microstructural properties of the samples were representative of ideal processing conditions. This accuracy was crucial for validating the finite element thermal models, as it provided a clear baseline for comparing experimental results with simulated predictions. The controlled environment also facilitated the study of subtle variations in processing parameters, leading to a deeper understanding of their impact on the SLM process.
The custom-designed gas chamber was a pivotal component of the experimental setup, enabling high-precision, oxidation-free laser melting experiments. Its design and functionality allowed for the detailed investigation of laser parameters and their effects on melt pool characteristics, providing essential data for the validation and refinement of thermal models in the SLM process.
3.3. Experimental Procedure
To improve sample quality, each test was repeated at least 20 times under the inert Argon atmosphere within the chamber. This rigorous repetition ensured the reliability and consistency of the experimental results. The experiments were conducted with a consistent scanning speed of 20 mm/s, while laser powers were varied between 20 and 60 W. Additionally, the stand-off distance between the laser lens and the sample surface was adjusted between 2 and 10 mm to investigate its effect on the melt pool dimensions.
Primary Experimental Observations:
Laser Power and Scanning Speed:
Higher laser powers resulted in more significant melting and better-defined melt pools. Conversely, lower scanning speeds allowed the laser to dwell longer on the material, enhancing the depth and width of the melt pool. This combination of high power and low scanning speed was found to be optimal for achieving a well-fused and consistent melt pool.
Environmental Conditions:
Samples processed in an ambient air environment showed visible signs of oxidation, such as discoloration and surface defects. In contrast, those processed under the Argon atmosphere exhibited markedly improved quality with fewer defects. The inert atmosphere effectively prevented oxidation, ensuring cleaner melt pools and more accurate thermal behavior.
Stand-Off Distance:
Varying the stand-off distance had a significant impact on the beam diameter and, consequently, the melt pool dimensions. A shorter stand-off distance resulted in a smaller, more focused beam, leading to a narrower and deeper melt pool. Conversely, a longer stand-off distance produced a wider beam, resulting in a broader and shallower melt pool. This parameter proved crucial in fine-tuning the melt pool characteristics to achieve the desired material properties.
The resulting data provided critical insights into the thermal behavior and melt pool characteristics under different processing conditions. These observations validated the accuracy of the thermal models developed in this study, demonstrating that the models could reliably predict the temperature distribution and melt pool dimensions during the SLM process. The validation process underscores the importance of optimizing laser parameters and environmental conditions to achieve high-quality SLM-produced parts.
The experimental validation demonstrates that the developed thermal models can reliably predict the temperature distribution and melt pool dimensions during the SLM process. This validation paves the way for further optimization of SLM processing parameters, ultimately improving the quality and reliability of additive manufacturing. By ensuring the models’ accuracy, this study provides a robust foundation for future research and development in the field of SLM, contributing to the advancement of additive manufacturing technologies.
4. Results
In this study, we validated our thermal model using 316L stainless steel (316L SS) before extending the analysis to Ti6Al4V. The primary reason for this approach was the relative ease and cost-effectiveness of performing experimental tests with 316L SS. Stainless steel 316L SS is widely available and less expensive than titanium alloys like Ti6Al4V. Additionally, working with 316L SS presents fewer safety hazards, making it a more practical choice for initial experimental validation. By first tuning and validating our finite element model with 316L SS, we ensured that the model accurately predicted the temperature distribution and melt pool dimensions under controlled conditions.
Once the model was validated with 316L SS, we applied it to the more complex and expensive Ti6Al4V alloy in the thermal history analysis section. This strategic progression allowed us to leverage the validated model to predict thermal behavior for Ti6Al4V, a more challenging material due to its cost and reactivity. This approach ensures that the model’s robustness and accuracy are established with 316L SS, providing a solid foundation for extending its application to Ti6Al4V.
The goal is to use this model to estimate microstructural analysis for Ti6Al4V in future work, ultimately facilitating a deeper understanding of its thermal and mechanical properties during the SLM process. This sequential validation and application process enhances the model’s reliability and ensures comprehensive thermal analysis across different materials.
By first focusing on 316L SS, we were able to fine-tune our thermal model and confirm its predictive capabilities. This methodical approach not only ensures that the model is reliable but also builds confidence in its applicability to other materials. Applying the validated model to Ti6Al4V, we can predict its thermal behavior more accurately, which is crucial given the alloy’s higher cost and complex reactivity. This progression from a simpler to a more complex material underscores the robustness of our thermal model and its potential for broader applications in the field of additive manufacturing.
Figure 3 displays images of the single-layer samples fabricated at power settings of 30 W, 40 W, and 45 W.
Figure 3(a) - 30 W: The sample processed at 30 W exhibited a thin and brittle structure with visible melt pool lines. Within these lines, unmelted powder was observed, although no balling defects were detected. The limited power resulted in incomplete melting, leading to weak bonding between the powder particles and a fragile sample. The presence of unmelted powder indicates insufficient energy input to achieve full melting, highlighting the need for optimization of laser parameters to ensure complete fusion and robust part formation.
Figure 3(b) - 40 W: The sample processed at 40 W displayed more robust characteristics with distinct melt pool lines. This sample showed significantly fewer balling defects compared to the sample processed at 45 W. The increased power at 40 W provided sufficient energy to achieve a more complete melting of the powder, resulting in stronger bonding between particles and a more coherent structure. However, balling was observed at the edges where the trajectory of the laser beam changed direction. This suggests that while 40 W is more effective in achieving good melt pool formation, further refinement of scanning strategies is necessary to minimize edge defects.
Figure 3(c) - 45 W: The sample processed at 45 W demonstrated an increase in balling defects, particularly at the edges. The higher power setting caused excessive melting, which led to instability in the melt pool and the formation of balling defects, especially at the laser beam’s turning points. Despite the greater power leading to more pronounced melt pool lines, the increased number of defects indicates that 45 W may be too high for optimal processing, emphasizing the importance of balancing power settings to avoid over-melting and ensure high-quality part fabrication.
The progression of power settings from 30 W to 45 W reveals critical insights into the behavior of the melt pool and the quality of the produced parts. The 30 W setting resulted in insufficient melting and a brittle structure, while the 40 W setting achieved a better balance with fewer defects and more robust melt pool lines. However, the 45 W setting introduced excessive melting and increased balling defects, underscoring the need for careful optimization of laser power. These observations highlight the importance of selecting appropriate laser parameters to achieve high-quality SLM parts with minimal defects and optimal mechanical properties.
To further investigate the effects of increased power settings and the reapplication of powder layers on previously melted, single-layer samples, additional experiments were conducted using laser powers ranging from 40 W to 70 W. Initially, the samples were melted using predetermined powers, then rotated 90 degrees, and rescanned with varying laser powers. This approach allowed for a comprehensive analysis of the impact of sequential laser scans on melt pool characteristics and overall part quality.
Figure 4: This figure illustrates the melt pool characteristics for a sample initially processed with a base power of 45 W and subsequently rescanned with a power of 55 W. The melt pool lines are well-defined and exhibit minimal balling defects. The controlled melting achieved at these power settings is crucial for maintaining the structural integrity of the printed part, as excessive remelting can lead to defects such as porosity and material inconsistencies. The clear definition of melt pool lines indicates a favorable printing outcome, suggesting that these parameters are effective for achieving high-quality SLM parts with minimal defects. The distinct melt pool lines also suggest good bonding between layers, which is essential for the mechanical strength and durability of the final part.
Figure 5: This figure shows the results of using a base power of 40 W with a rescan power of 60 W. The rescans demonstrated that increasing the rescan power to 60 W produced a wider melt pool but also caused prior melt pool lines to remelt significantly. This led to excessive melting, balling, and the convergence of melt pool lines. The significant remelting and balling evident in this figure suggest that a higher rescan power can enhance melt pool width but also introduces considerable defects. The balling defects observed indicate instability in the melt pool, which can compromise the surface finish and dimensional accuracy of the printed part.
Detailed Analysis and Implications: The experiments conducted with varying power settings reveal critical insights into the behavior of the melt pool and the quality of the produced parts. Higher laser powers tend to increase the melt pool width enhancing layer bonding but also raising the risk of defects if not carefully controlled. The iterative rescanning process demonstrated that while higher rescan powers can improve melt pool dimensions, they also introduce challenges such as excessive remelting and balling.
Optimization of Parameters: The observations from Figure 4 and Figure 5 underscore the importance of optimizing laser power settings and scanning strategies to ensure high-quality SLM parts. For instance, the combination of a base power of 45 W and a rescan power of 55 W provided a good balance between achieving well-defined melt pools and minimizing defects. This finding suggests that moderate increases in power can be beneficial, but excessive power levels should be avoided to prevent defects.
Environmental Control: Another critical aspect of the experimental setup was the maintenance of an inert atmosphere using a custom-designed gas chamber. The controlled environment prevented oxidation and contamination of the samples, which is essential for achieving accurate and reproducible results. This highlights the significance of environmental control in the SLM process to ensure high-quality part production.
Future Work and Applications: The insights gained from these experiments are not only valuable for the current study but also for future applications and research. The validated thermal models and optimized processing parameters can be applied to other materials and complex geometries, facilitating the advancement of SLM technology. Future work could involve further refinement of scanning strategies, exploration of different material systems, and integration of real-time monitoring techniques to enhance the control and quality of the SLM process.
The detailed investigation of laser power settings and rescanning strategies provides a comprehensive understanding of their impact on melt pool characteristics and part quality. By carefully balancing power settings and optimizing scanning parameters, it is possible to achieve high-quality SLM parts with excellent mechanical properties and minimal defects. This study contributes to the ongoing efforts to improve the reliability and efficiency of additive manufacturing technologies..
The melt pool width was recorded for the experimental measurements discussed above. However, in many instances, samples were brittle or exhibited over-melting, leading to difficulty in accurately measuring the melt pools. Four representative samples were identified and used to validate a simulation model using 316L SS as the material to address this.
First, the model was set up as described in Section 3. The Finite Element Model (FEM) was developed using Abaqus/CAE to simulate the Selective Laser Melting (SLM) process. User subroutines written in Fortran were employed to apply the laser heat flux and material properties dynamically, ensuring that the model accurately reflected the physical behavior during the melting and solidification phases.
Experimental Measurements and Comparison: To validate the model, a series of experiments were conducted with 316L stainless steel (316L SS) powder. The experiments involved melting single layers of powder using varying laser powers to measure the resulting melt pool dimensions. Figure 6 shows the melt pool widths for four samples processed at different power settings.
The experimental measurements indicated that melt pool widths increased gradually with increasing laser power. This trend is crucial for understanding how power settings influence the melt pool’s size and, consequently, the quality and properties of the final part. The error bars in Figure 6 represent the variability in measurements, reflecting the inherent challenges in obtaining consistent results due to factors such as slight differences in powder layer thickness, variations in laser beam focus, and environmental conditions.
Detailed Observations:
1. Power Setting of 40 W:
The sample exhibited a relatively small melt pool width, with an average measurement of 226 µm.
The error bars were narrow, indicating low variability and consistent melting behavior at this power level.
2. Power Setting of 45 W:
An increase in power to 45 W resulted in a wider melt pool, averaging 302 µm.
The error bars were slightly wider, suggesting increased variability possibly due to the onset of more dynamic melting and solidification processes.
3. Power Setting of 60 W:
At 60 W, the melt pool width increased significantly to an average of 459 µm.
The error bars indicated greater variability, reflecting the challenges in maintaining uniform melting at higher power levels.
4. Power Setting of 70 W:
The highest power setting of 70 W produced the widest melt pool, averaging 568 µm.
The error bars were the widest, highlighting the increased difficulty in achieving consistent results due to more pronounced thermal gradients and potential for defects such as balling and spattering.
Analysis and Implications: The increase in melt pool width with higher laser powers demonstrates the model’s ability to predict the thermal behavior of the material under different processing conditions accurately. The variability observed in the measurements underscores the importance of optimizing laser parameters to achieve consistent and high-quality results. By comparing the experimental data with the simulated results, the model’s accuracy in predicting melt pool dimensions was confirmed, with deviations falling within acceptable ranges.
This validation process is crucial for ensuring that the FEM can be reliably used to optimize SLM parameters, such as laser power and scanning speed, to improve part quality and manufacturing efficiency. The ability to predict the effects of different parameters on melt pool characteristics enables more precise control over the SLM process, reducing the need for extensive experimental trials and accelerating the development of optimized manufacturing protocols.
The experimental measurements and the corresponding model predictions provide a comprehensive understanding of how varying laser powers affect melt pool dimensions. This knowledge is instrumental in refining the SLM process, ensuring the production of high-quality parts with desirable mechanical properties and minimal defects.
4.1. Validation
The validation of the thermal model involved a comprehensive series of experiments and simulations to ensure its accuracy in predicting melt pool dimensions under various laser power settings. Initially, the model was set up as described in Section 3. Figure 6 illustrates the melt pool widths for four samples, showing a clear trend of increasing width with higher laser power. The error bars in the figure indicate the deviation from the recorded sample sites, highlighting the variability inherent in experimental measurements.
The experimental setup used for validation included a series of controlled tests where stainless steel powder was melted using a fibre laser system under different power settings. The resulting melt pool widths were meticulously measured and recorded. These experimental measurements were then compared against the predictions made by the thermal model.
The average melt pool widths recorded in the experiments and the corresponding values from the simulations are presented in Table 3. This table also includes the absolute error between the experimental and simulation results. The data shows that the model predictions were remarkably accurate at lower power settings. For instance, at a power setting of 40 W, the model predicted a melt pool width of 240 µm, compared to the experimentally measured width of 226 µm, resulting in an absolute error of 6%. At the higher power setting of 70 W, an absolute percentage error of 14% was observed, which, although more significant, is still within an acceptable range for validating the model’s accuracy.
The melt pool is the localized region of molten material created by the laser during the Selective Laser Melting (SLM) process. It forms as the laser beam heats the metal powder beyond its melting point, causing it to liquefy. As the laser moves along the scan path, the molten material solidifies, creating a fused track of solid metal. The characteristics of the melt pool, including its width, depth, and shape, are critical parameters that influence the microstructure and mechanical properties of the final part.
The melt pool width was experimentally determined using high-resolution optical microscopy and image analysis techniques. The process began with the preparation of samples, where stainless steel 316L SS powder was selectively melted using a fiber laser system under controlled conditions. Several single-track and multi-track samples were produced by varying the laser power and scanning speed to study their effects on the melt pool characteristics.
To analyze the melt pool, the samples were sectioned perpendicular to the laser scanning direction to expose the cross-sections of the melt tracks. These cross-sections were then mounted, polished, and etched using a suitable chemical etchant to reveal the microstructural features clearly. The polished and etched cross-sections were examined under a high-resolution optical microscope, and images of the melt tracks were captured at various magnifications to ensure that all relevant details were visible.
The captured images were then analyzed using specialized image processing software. This software was used to measure the dimensions of the melt pool, specifically focusing on the width at the top surface where the material was melted by the laser. Multiple measurements were taken across different samples and tracks to ensure statistical accuracy and account for any variability. The measured melt pool widths from multiple samples and conditions were averaged to provide a representative value for each set of experimental parameters, and the standard deviation and error bars were calculated to quantify the variability and reliability of the measurements.
Figure 7 demonstrates the validation of the thermal model by comparing the experimentally measured melt pool widths with the simulated values for 316L SS. The close alignment between the experimental data and the model predictions confirms the accuracy of the model in capturing the thermal behavior and melt pool dynamics during the SLM process. This validation is crucial for optimizing the process parameters and ensuring the quality and consistency of the manufactured parts.
The successful thermal model validation with 316L SS enhances our understanding of melt pool behaviour under different power settings and underscores the model’s reliability. This validation is crucial as it paves the way for optimising SLM processing parameters, ensuring high-quality additive manufacturing outcomes. By accurately capturing the thermal dynamics of the SLM process, the model enables more precise control over the manufacturing process, reducing defects and improving the mechanical properties of the final parts.
Moreover, this validated model provides a robust foundation for extending its application to more complex and expensive materials such as Ti6Al4V. By first validating the model with 316L SS, we established a reliable baseline that can be adapted and refined for other materials. The insights gained from this validation process will inform future work aimed at predicting the thermal behaviour and microstructural characteristics of Ti6Al4V, ultimately contributing to more efficient and reliable SLM processes for a broader range of materials.
In conclusion, the validation of the thermal model demonstrates its capability to accurately predict melt pool dimensions and thermal behaviour under varying laser power settings. This capability is essential for optimising the SLM process, enhancing the quality and reliability of additive manufacturing, and extending the model’s applicability to other materials, thereby driving progress in advanced manufacturing.
This section investigated the feasibility of a low-cost alternative to an AM and whether this method could validate given simulations. In the future, a more quantitative analysis should be conducted. Additionally, this experiment was conducted with SS 316L powder to reduce the cost and fire hazards that would be present with Ti6Al4V. As the primary goal of this research is to investigate Ti6Al4V, these experiments should be repeated with that material.
4.1.1. Discussion on Divergence of Experimental and Theoretical Results with Increasing Laser Beam Power
The graph in Figure 8 shows the melt pool width as a function of laser beam power for both experimental and simulation results. As observed, the divergence between the experimental and theoretical results increases with higher laser beam power. This section explores the potential reasons for this divergence, focusing on model limitations and experimental uncertainties.
One primary factor contributing to the divergence is the simplified assumptions in the thermal model. These assumptions, such as assuming homogeneous material composition and uniform thermal properties, help make the complex calculations tractable. However, they may not fully capture the nuances of real-world conditions. These simplifications can lead to discrepancies, particularly at higher power levels where the thermal gradients and material behaviour become more complex.
Another significant limitation is the representation of the heat source. The model uses a Gaussian heat source representation, which may not perfectly replicate the laser beam profile. Variations in the beam intensity distribution and spot size can affect the accuracy of the predicted melt pool dimensions, especially at higher powers where the laser-material interaction is more intense. Additionally, the dynamics of phase changes, including melting and evaporation, are challenging to model accurately. At higher laser powers, the rate of phase transitions increases, potentially leading to non-equilibrium effects that are not fully captured by the model, resulting in more significant deviations between the simulated and experimental melt pool widths.
Furthermore, the model relies on temperature-dependent material properties derived from the literature. These properties can vary significantly in practice, particularly at high temperatures. Any inaccuracies in these properties can lead to errors in the predicted thermal behaviour and melt pool dimensions. Therefore, it is essential to refine these properties to improve model accuracy.
Experimental uncertainties also play a crucial role in the observed divergence. Measurement accuracy is a significant concern, as experimental measurements of melt pool dimensions are subject to various sources of error, including the resolution limits of the imaging equipment and operator variability. The melt pool can become more challenging to measure accurately at higher laser powers due to increased turbulence and spatter. Variations in environmental conditions, such as ambient temperature and gas flow in the argon chamber, can also influence the experimental results. These factors are challenging to control precisely and can contribute to the observed divergence at higher power levels.
The characteristics of the powder bed, such as packing density and particle size distribution, can affect the thermal conductivity and heat transfer within the bed. Any inconsistencies in these characteristics between experiments and simulations can lead to differences in the melt pool dimensions, particularly at higher powers where the heat input is more substantial. Additionally, the calibration and stability of the laser system can impact the experimental results. Any fluctuations in laser power output or beam quality can cause deviations from the expected melt pool dimensions, contributing to the divergence observed in the higher power range.
The increasing divergence between experimental and theoretical results with higher laser beam power is multifaceted from both model limitations and experimental uncertainties. Understanding and addressing these factors is crucial for improving the accuracy and reliability of thermal models for SLM processes. Future work will focus on refining the model to account for non-equilibrium phase change dynamics, improving the representation of the heat source, and enhancing the accuracy of high-temperature material properties. Additionally, efforts will be made to minimise experimental uncertainties through better control of environmental conditions and more precise measurement techniques.
4.2. Thermal History Analysis of Ti6AI4V
The model successfully predicted the temperature distribution and thermal history during the Selective Laser Melting (SLM) process. Single-line, multi-line, and multi-layer scans were investigated to understand the effects of various processing parameters. Abaqus was used to extract the temperature at each node in the model for each time step, allowing for a comprehensive thermal history analysis for different scanning configurations.
Single-Line Tests
Initially, the geometry for single-line tests was conducted. This involved examining a single laser pass’s temperature distribution and melt pool dimensions. Figure 8 shows the temperature contour and melt pool dimensions for a laser power of 100 W and a scanning speed of 1000 mm/s at a specific time spot of 5 ms. The melt pool is distinguished by the grey-coloured region where the temperature exceeds the melting point. In this case, the recorded dimensions were 126 µm in length, 97 µm in width, and 31 µm in depth. As the laser moves along the XY plane, it creates a smooth, continuous path of melted and solidified powder. Upon cooling to ambient temperature, a comet-shaped tail forms due to the higher thermal conductivity of the heated material compared to the powder ahead.
Multi-Line and Multi-Layer Scans
Following the single-line scans, layered geometries were used to test the effect of multiple scan lines. Slight adjustments were made to reduce computational times when modelling layers. This approach provided insights into the cumulative thermal effects and the interaction between adjacent scan lines. By simulating these configurations, we could observe the thermal behaviour and melt pool dynamics over extended areas and successive layers, which is critical for understanding the overall integrity and quality of the final manufactured part.
Temperature Evolution Over Time
The temperature evolution over time was also analysed. Figure 9 shows the temperature change at a distance of 0.25 mm from the starting point at 2.5 ms. The maximum temperature achieved along the top surface of the powder bed was 3261 K, centred within the laser beam. As the laser passes, the temperature rapidly increases from room temperature, causing material transformation and fluctuations around the liquidus and solidus zones as the powder transitions to liquid. The rapid heating and cooling cycles inherent in the SLM process are crucial for determining the microstructure and mechanical properties of the manufactured part.
Insights and Implications
This detailed analysis of temperature distribution and melt pool dynamics under various processing parameters underscores the model’s accuracy in predicting thermal behaviour during the SLM process. Such predictions are crucial for optimising SLM parameters to enhance the quality and reliability of manufactured parts. The model provides a robust tool for understanding how changes in laser power, scanning speed, and other parameters affect the melt pool size, shape, and thermal gradients. This, in turn, allows for fine-tuning the SLM process to achieve desired microstructures and mechanical properties, ultimately improving the efficiency and outcomes of additive manufacturing.
In summary, the thermal model developed and validated in this study offers a comprehensive and accurate prediction of the thermal history and melt pool characteristics during the SLM process. These insights are instrumental in advancing the optimisation of SLM processing parameters, thereby enhancing the quality and reliability of parts manufactured using this technology.
4.3. Effects of Laser Processing Parameters
The effect of varying process parameters on the temperature distribution and melt pool dimensions was investigated by simulating 24 cases. The parameters used in the simulation are shown in Table 4. Precisely, the laser power and scanning speed will be adjusted. A single track was modelled along the XY plane. The temperature distribution and melt pool dimensions are taken at 1 ms.
In Figure 10 the temperature is plotted concerning time and distance along the scanning direction with varying laser powers (100, 150 and 200 W). All other parameters are kept the same as in Table 3, using a velocity of 200 mm/s and beam radius of 50µm.
At a laser power of 100 W, the maximum temperature is just enough to cause melting. The short duration in the melting zone likely results in a lack of fusion between powder particles, leading to potential defects in the final part. As the laser power increases, the maximum temperature achieved also increases, allowing for the remelting of layers. This remelting can reduce thermal gradients within those layers, promoting a more homogenous microstructure and, consequently, more uniform mechanical properties throughout the final part.
In Figure 10(a), the temperature versus time plot does not prominently display the latent heat effect due to the rapid heating rates and high energy input at higher laser powers. These conditions cause the material to transition quickly through the phase change range, minimizing the duration of the latent heat plateau. Additionally, the temporal resolution of the simulation may not capture this brief phase change process effectively.
In Figure 10(b), the spatial temperature distribution at a single time point further obscures the latent heat effect. The instantaneous nature of this temperature snapshot, coupled with the heat conduction away from the laser spot, creates a gradient that overshadows the localized phase change.
High laser power is generally desirable because it promotes the remelting of layers, leading to reduced thermal gradients and improved microstructural homogeneity. However, it is essential to balance the power settings carefully. Excessively high laser power can lead to the vaporization of material or over-melting, which prevents the precise formation of small geometric features and may introduce defects. Therefore, optimizing the laser power is crucial for achieving the desired balance between thorough melting and the preservation of fine details in the manufactured part.
In Figure 11, the temperature is plotted with respect to both time and distance along the scanning direction at varying scanning speeds (100, 200, and 400 mm/s). All other parameters are maintained as specified in Table 3, which includes a laser power of 150 W and a beam radius of 50 µm.
Melting Characteristics: Melting occurs at each of the three selected speeds. From Figure 11(a), it is evident that the duration for which each point remains above the melting temperature decreases as the scanning speed increases. This means that at slower scanning speeds, the material remains in the molten state for a longer period, which enhances the fusion between powder particles. This prolonged exposure to high temperatures at slower speeds allows more time for the heat to penetrate deeply into the material, promoting better bonding and reducing the likelihood of defects such as porosity and lack of fusion. However, this also implies that the slower the scanning speed, the higher the energy input per unit length, which can result in larger and more extensive melt pools.
Temperature Distribution: In Figure 11(b), the temperature distribution along the scanning direction is illustrated. This plot highlights the spatial temperature gradients that occur at different scanning speeds. While the area that remains above the melting point for each scanning speed appears relatively similar, the peak temperatures and thermal gradients differ significantly. At higher scanning speeds, the heat input is concentrated over a shorter duration, leading to steeper temperature gradients. This can result in more localized melting and rapid solidification, which might be beneficial for certain applications where fine microstructural control is desired.
Thermal Gradients and Solidification: Slower scanning speeds produce lower thermal gradients, resulting in more uniform and gradual solidification of the melt pool. This even solidification is critical for achieving a homogeneous microstructure, which is essential for the mechanical properties and overall integrity of the final part. Lower thermal gradients at slower speeds reduce the likelihood of residual stresses and thermal distortions, which can compromise the dimensional accuracy and structural performance of the manufactured component.
However, there are trade-offs associated with slower scanning speeds. While they enhance fusion and reduce defects, they also pose a risk of creating excessively large melt pools. This can be problematic, particularly for parts with intricate geometries or fine features, as the increased melt pool size can blur the precision of these features. Furthermore, the extended duration required to scan at slower speeds increases the overall time taken to fabricate the part. This can affect production efficiency and cost-effectiveness, especially in industrial applications where time and cost are critical factors.
Balancing Speed and Quality: Optimizing the scanning speed is thus a delicate balance between ensuring adequate fusion and maintaining precision and efficiency. Higher scanning speeds, although faster, may not provide sufficient time for complete fusion, potentially leading to defects like porosity or lack of bonding between layers. Conversely, excessively slow speeds, while improving fusion and reducing defects, can lead to over-melting, loss of detail in small features, and longer production times.
In conclusion, Figure 11 demonstrates the significant impact of scanning speed on the thermal behavior and melting characteristics during the SLM process. By carefully selecting the appropriate scanning speed, it is possible to optimize the balance between fusion quality, precision, and manufacturing efficiency. This balance is crucial for producing high-quality parts with the desired mechanical properties and dimensional accuracy, particularly in applications where both performance and efficiency are paramount.
Melt pool dimensions were also investigated for different laser power and scanning speed combinations. All other processing parameters were kept the same, and the melt pool dimensions were recorded at a distance of 0.07 mm along the X-axis. Figure 12 shows the melt pool dimensions with varying laser power (30 - 150 W) for a scanning speed of 200 mm/s. A more considerable laser power correlated with increased length, width and depth in the melt pool. This can be attributed to more energy absorbed within the powder bed.
Figure 13 shows the melt pool dimensions with varying scanning speeds (100 - 600 mm/s). A faster scanning speed decreases the melt pool’s width and depth. As velocity increases, there is less time for the powder bed to absorb the heat from the laser beam. There was little change to the melt pool length as scanning speed increased.
Table 5 shows three process correlation maps created to compare the calculated maximum temperature, melt pool width and depth sizes when using varying laser powers and scanning speeds. These maps allow processing parameters to be compared and optimal values selected depending on set criteria. The conditions set for the following maps were chosen to create melt pools free from defects and allow total melting of the powder layer without vaporisation. Green in the maps indicates that processing parameters are acceptable and can be used for the chosen configuration. In contrast, red means they are outside of the tolerance and will produce either over or under-melting.
The highest temperature occurred at a laser power of 150 W and a scan speed of 50 mm/s and the lowest at a laser power of 30 W and a scan speed of 600 mm/s; as laser power increases, so does the heat input rate, causing higher temperatures. Conversely, with an increasing scanning speed, the heat input rate is reduced per unit length of scan, causing a decrease in temperatures. It should be noted that the computed temperatures are higher than those achieved in fluid flow-based models as the model does not account for thermal convective transport within the molten pool.
By defining custom criteria, optimal processing parameters can be quickly selected. In Figure 5(a), lower scanning speeds and powers are desirable. As speed and power increase, the maximum temperature exceeds the vaporisation point. Two combinations led to zero melting using a laser power of 30 W and high scan speeds. More considerable powers were optimal for melt pool widths and Table 5(b). Low scanning speed should be selected with low powers or high scanning speed with high powers to produce a melt pool within the criteria. The criteria for melt pool width were chosen to ensure that the entire area covered by the laser beam was melted. Secondly, that overlap melting did not occur over two scans, reducing efficiency. In Table 5(c), the criteria were selected for melt pool depth to ensure the powder layer was currently melted. Still, remelting would not occur further than the third layer. Similarly to melt pool width, the depth favours low scanning speeds with low or high scanning speeds and high powers; however, in this case, the tolerances were stricter to ensure complete melting of the current powder layer.
In our study, Table 5 presents the calculated temperatures obtained during the Selective Laser Melting (SLM) process. However, it is essential to note that these temperatures were calculated without considering the evaporation process. The omission of the evaporation process can lead to overestimating the actual temperatures experienced during the SLM process.
The evaporation process plays a significant role in the thermal dynamics of the SLM process, especially at high laser powers. When the laser power is sufficiently high, the temperature of the material surface can reach levels where evaporation occurs. This phase change from liquid to vapour requires considerable energy, known as the latent heat of vaporisation. As the material absorbs this energy, the temperature increase slows down, effectively limiting the maximum temperature that can be achieved on the surface.
In our initial calculations, as presented in Table 5, the temperatures were computed without accounting for the energy consumed by the evaporation process. Consequently, some of the calculated temperatures exceed the actual maximum achievable temperatures, which would be lower in a real-world scenario due to the onset of evaporation.
Accounting for all the criteria together, four combinations of processing parameters are available, i.e. 50 W & 50 mm/s, 50 W & 100 mm/s, 50 W & 200 mm/s and 80 W & 400 mm/s, as shown in Table 6. This image compares the energy densities (i.e. Power / (Scan Speed x Hatch Spacing x Beam Radius)). It can be seen that while the energy densities may be the same, the parameters chosen may not satisfy the requirements enforced. Some conclusions could be drawn on which parameters can not be used by selecting energy densities more significant than 25 Jmm−3 and lower than 500 Jmm−3. However, when choosing optimal parameters, scanning speed and laser power should be investigated individually.
5. Discussion
The results of this study provide a detailed understanding of the thermal behaviour during the Selective Laser Melting (SLM) process of 316L SS stainless steel, offering significant insights that align with and expand upon previous research. Our thermal model, developed using Finite Element Analysis (FEA) in Abaqus, has demonstrated high accuracy in predicting temperature distribution and thermal history, corroborated by experimental solid validation. This section interprets the results, discusses their implications, and suggests future research directions.
5.1. Interpretation of Results
Our findings indicate that the thermal model effectively captures the complex interactions within the SLM process, such as the influence of varying laser power and scanning speeds on melt pool dimensions and thermal behaviour. The model’s ability to accurately predict the thermal history is crucial, as it directly impacts the final parts’ microstructural evolution and mechanical properties. Previous studies have highlighted the challenges of modelling these phenomena due to high thermal gradients and temperature-dependent material properties (Khairallah et al. [1]; Wang et al. [2]). Our study addresses these challenges by incorporating detailed material properties and phase transformations into the model, providing a more comprehensive and accurate simulation of the SLM process.
The experimental validation using a custom-designed argon chamber and stainless-steel powder demonstrated strong agreement between the simulated and experimental results, particularly regarding melt pool dimensions and thermal histories. This agreement reinforces the model’s reliability and underscores its potential for optimising SLM processing parameters. This is in line with the findings of Yang et al. [3] and Ladani et al. [5], who also emphasised the importance of experimental validation in ensuring the accuracy of thermal models for SLM.
Furthermore, the decision to initially validate the model using 316L SS rather than Ti6Al4V was driven by practical considerations. 316L SS is less expensive and presents fewer safety hazards than Ti6Al4V, making it a more feasible option for preliminary validation. The success with 316L SS provides a robust foundation for extending the model to Ti6Al4V, addressing its specific challenges in future work.
5.2. Implications of Findings
The implications of our findings are significant for the broader context of additive manufacturing. The model’s accuracy in predicting the thermal history and melt pool characteristics can improve control over the SLM process, resulting in better quality and reliability of manufactured parts. This is particularly relevant for aerospace and biomedical engineering industries, where 316L SS stainless steel is widely used due to its excellent strength-to-weight ratio and biocompatibility.
Moreover, our results highlight the importance of high laser power and slower scanning speeds in enhancing melt pool homogeneity. This insight can be applied to optimise the microstructural and mechanical properties of SLM-produced parts, reducing defects and improving performance. Such optimisation aligns with the work of Gusarov et al. [6] and Goldak et al. [10], who also emphasised the critical role of processing parameters in determining the quality of SLM parts.
By validating the thermal model with 316L SS, we have demonstrated its potential to be adapted for more complex and expensive materials like Ti6Al4V. This approach ensures that initial experimentation costs are minimised while providing a reliable basis for future work to predict the microstructural characteristics of Ti6Al4V components.
5.3. Discussion on Method Advantages and Disadvantages
This section discusses the advantages and disadvantages of the thermal model developed for the Selective Laser Melting (SLM) process, providing a balanced view of its capabilities and limitations. Understanding these aspects is crucial for appreciating the model’s contributions to the field and identifying areas for future improvement.
5.3.1. Advantages
1. Comprehensive Thermal Modeling: The primary strength of our model lies in its comprehensive approach to thermal modelling. By incorporating temperature-dependent material properties and phase transformations, the model provides a detailed simulation of the temperature distribution and thermal history during the SLM process. This level of detail is essential for predicting the manufactured parts’ microstructural evolution and mechanical properties.
2. High Accuracy: The model has demonstrated high accuracy in predicting melt pool dimensions and thermal behaviour, as evidenced by the strong agreement between the simulated and experimental results. This accuracy is crucial for optimising SLM process parameters, reducing the need for extensive experimental trials, and enhancing the quality and reliability of the produced parts.
3. Flexibility and Adaptability: The model is designed to be flexible and adaptable to different materials and processing conditions. While it has been validated using 316L SS stainless steel, the model can be extended to other materials such as Ti6Al4V. This adaptability ensures that the model remains relevant for a wide range of applications in additive manufacturing.
4. Integration with Experimental Data: Integrating experimental data with the model enhances its reliability and provides a solid foundation for further refinement. Using custom-designed argon chambers and precise measurement techniques ensures that the experimental data is of high quality, thereby improving the model’s predictive capabilities.
5.3.2. Disadvantages
1. Simplified Assumptions: Despite its comprehensive nature, the model relies on several simplified assumptions to make the complex calculations feasible. For instance, it assumes homogeneous material composition and uniform thermal properties, which may not fully capture the nuances of real-world conditions. These simplifications can lead to discrepancies, particularly at higher power levels where the thermal gradients and material behaviour become more complex.
2. Limitations in Heat Source Representation: The model uses a Gaussian heat source representation, which may not perfectly replicate the laser beam profile. Variations in beam intensity distribution and spot size can affect the accuracy of the predicted melt pool dimensions, especially at higher powers where the laser-material interaction is more intense.
3. Challenges in Phase Change Dynamics: Accurately modelling the dynamics of phase changes, including melting and evaporation, remains challenging. At higher laser powers, the rate of phase transitions increases, potentially leading to non-equilibrium effects that the model does not fully capture. This can result in more significant deviations between the simulated and experimental melt pool widths.
4. High-Temperature Material Properties: The model relies on temperature-dependent material properties derived from literature, which can vary significantly in practice, particularly at high temperatures. Any inaccuracies in these properties can lead to errors in the predicted thermal behaviour and melt pool dimensions. Refining these properties is essential for improving model accuracy.
5. Experimental Uncertainties: Experimental measurements are subject to various sources of error, including resolution limits of the imaging equipment and operator variability. The melt pool can become more difficult to measure accurately at higher laser powers due to increased turbulence and spatter. These experimental uncertainties can contribute to the observed divergence between experimental and theoretical results.
The thermal model developed for the SLM process offers several significant advantages, including comprehensive thermal modelling, high accuracy, flexibility, and integration with experimental data. However, it also has limitations, such as simplified assumptions, challenges in heat source representation, phase change dynamics, and high-temperature material properties. Understanding these advantages and disadvantages is crucial for appreciating the model’s contributions and identifying areas for future improvement. Future work will focus on refining the model to address these limitations, enhancing its predictive capabilities, and minimising experimental uncertainties.
5.4. Future Research Directions
While our study has provided a robust foundation for understanding and optimising the SLM process, several areas for future research could further enhance the predictive capabilities and applicability of the thermal model:
Microstructure Evolution Models: Integrating the thermal model with microstructure evolution models would allow for more accurate grain structure and phase distribution predictions, providing deeper insights into the material transformations during SLM.
Multi-Scale Modeling: Developing multi-scale models that link macroscopic thermal behaviour with microscopic material transformations can offer a more comprehensive understanding of the SLM process, from heat transfer to microstructural changes.
Machine Learning Integration: Incorporating machine learning techniques with traditional modelling methods holds promise for enhancing model accuracy and predictive capabilities, enabling real-time process control and optimisation.
Material-Specific Models: Extending the model to other materials, particularly titanium alloys like Ti6Al4V, can broaden its applicability and address material-specific challenges, promoting wider industrial adoption of SLM technology.
Advanced Experimental Techniques: Employing advanced experimental techniques, such as in-situ thermal imaging and high-resolution microscopy, can provide more detailed validation data, further refining the model’s accuracy.
The evaporation process: The actual maximum temperatures during the SLM process would be lower due to the energy absorbed by the evaporation phase change. Future iterations of the model will incorporate the evaporation process to enhance the accuracy of temperature predictions, providing a more realistic representation of the thermal behaviour during SLM. This improvement will be crucial for optimising processing parameters and ensuring the quality and reliability of the manufactured parts.
5.5. Novelty
The novelty of this research lies in the development and comprehensive validation of a detailed thermal model for the SLM process, specifically tailored for 316L stainless steel and Ti6Al4V. Unlike previous models, this study incorporates temperature-dependent material properties and phase transformations, ensuring high accuracy and relevance to real-world SLM conditions. The inclusion of a custom-designed argon chamber for experimental validation is another innovative aspect, enabling precise control over environmental conditions and preventing oxidation, which is crucial for maintaining sample integrity. The strategic progression from validating the model with 316L SS to extending it to Ti6Al4V represents a methodological advancement, allowing cost-effective and safe initial experimentation. This dual-material approach not only enhances the model’s robustness but also paves the way for its application to a broader range of materials, addressing the specific challenges associated with each. The insights gained from this study provide a robust foundation for optimizing SLM processing parameters and improving the quality and reliability of additive manufacturing.
5.6. Academic Impact
The academic impact of this study is significant, as it bridges the gap between experimental and numerical approaches in SLM. The validated thermal model serves as a valuable tool for predicting the effects of varying processing parameters, such as laser power and scanning speed, on thermal behavior and melt pool characteristics. This predictive capability is crucial for optimizing SLM processes, reducing the need for extensive experimental trials, and accelerating the development of optimized manufacturing protocols. The study’s findings contribute to a deeper understanding of thermal phenomena in additive manufacturing, which is essential for advancing the field. Furthermore, the research methodology, which includes the use of custom-designed experimental setups and advanced FEA simulations, sets a new standard for future studies in the domain. By demonstrating the model’s accuracy and applicability to different materials, this study opens new avenues for research, particularly in developing multi-scale models and integrating machine learning techniques to enhance predictive capabilities. The potential applications of this research extend to various industries, including aerospace and biomedical engineering, where the precise control of thermal processes is critical for ensuring the quality and performance of manufactured components.
The insights gained from this research can significantly impact various areas within additive manufacturing and beyond:
1. Manufacturing Optimisation: Providing a powerful tool for manufacturers to optimise SLM process parameters, reducing costs and improving the quality of metal parts.
2. Aerospace and Biomedical Industries: Enhancing the reliability and performance of critical components in aerospace and biomedical applications, where 316L SS is widely used.
3. Custom Manufacturing: Enabling the production of complex, high-performance parts with tailored properties for specialised applications, promoting innovation in design and manufacturing.
4. Sustainability: Reducing material waste and energy consumption in metal additive manufacturing processes, contributing to more sustainable manufacturing practices.
In conclusion, the developed thermal model significantly advances the understanding and optimisation of the SLM process for 316L SS. By addressing the outlined future work, this research can further elevate the precision and efficiency of additive manufacturing technologies, ultimately driving progress across multiple industries. The groundwork laid with 316L SS paves the way for future applications to Ti6Al4V, enhancing the model’s robustness and broadening its impact.
References
- Saad A. Khairallah et al. "Laser powder-bed fusion additive manufacturing: Physics of complex melt flow and formation mechanisms of pores, spatter, and denudation zones". In: Acta Materialia 108 (2016), pp. 36–45. [CrossRef]
- XC Wang et al. "Direct selective laser sintering of hard metal powders: experimental study and simulation". In: The International Journal of Advanced Manufacturing Technology 19.5 (2002), pp. 351–357. [CrossRef]
- Zerong Yang et al. "Modeling laser beam absorption of metal alloys at high temperatures for selective laser melting". In: Advanced Engineering Materials 23.9 (2021), p. 2100137. [CrossRef]
- RM German. "A quantitative theory for supersolidus liquid phase sintering". In: Powder Metallurgy 34.2 (1991), pp. 101–107. [CrossRef]
- Leila Ladani et al. "Effective liquid conductivity for improved simulation of thermal transport in laser beam melting powder bed technology". In: Additive Manufacturing 14 (2017), pp. 13–23. [CrossRef]
- A.V. Gusarov et al. "Heat transfer modelling and stability analysis of selective laser melting". In: Applied Surface Science 254.4 (2007), pp. 975–979. [CrossRef]
- Daniel Rosenthal. "Mathematical theory of heat distribution during welding and cutting". In: Welding journal 20 (1941), pp. 220–234.
- AC Nunes. "An extended Rosenthal weld model". In: Welding journal 62.6 (1983), pp. 165s–170s.
- K Dai and L Shaw. "Thermal and mechanical finite element modeling of laser forming from metal and ceramic powders". In: Acta Materialia 52.1 (2004), pp. 69–80. [CrossRef]
- John Goldak, Aditya Chakravarti, and Malcolm Bibby. "A new finite element model for welding heat sources". In: Metallurgical transactions B 15.2 (1984), pp. 299–305. [CrossRef]
- Wayne King et al. "Overview of modelling and simulation of metal powder bed fusion process at Lawrence Livermore National Laboratory". In: Materials Science and Technology 31.8 (2015), pp. 957–968. [CrossRef]
- Lin Wang. "Particle scale modelling of powder spreading in powder bed fusion additive manufacturing". PhD thesis. Monash University, 2020.
- S Weber et al. "Parameters on support structure design for metal additive manufacturing". In: Proceedings of the Design Society: DESIGN Conference. Vol. 1. Cambridge University Press. 2020, pp. 1145–1154. [CrossRef]
- S.L. Sing et al. "3D printing of metals in rapid prototyping of biomaterials: Techniques in additive manufacturing". In: Rapid Prototyping of Biomaterials (Second Edition). Ed. by Roger Narayan. Woodhead Publishing Series in Biomaterials. Woodhead Publishing, 2020, pp. 17–40. [CrossRef]
- J-P Kruth et al. "Binding mechanisms in selective laser sintering and selective laser melting". In: Rapid prototyping journal (2005). [CrossRef]
- Kenneth C Mills. Recommended values of thermophysical properties for selected commercial alloys. Woodhead Publishing, 2002. [CrossRef]
- A.V. Gusarov et al. "Heat transfer modelling and stability analysis of selective laser melting". In: Applied Surface Science 254.4 (2007). Laser synthesis and processing of advanced materials, pp. 975–979. ISSN: 0169-4332. URL: https://www.sciencedirect.com/science/article/pii/ S0169433207011907. [CrossRef]
- Meng, W., Zhang, W., Zhang, W. et al. Additive fabrication of 316L/Inconel625/Ti6Al4V functionally graded materials by laser synchronous preheating. Int J Adv Manuf Technol 104, 2525–2538 (2019). [CrossRef]
Figure 1.
3D FE model schematic of geometry and mesh.
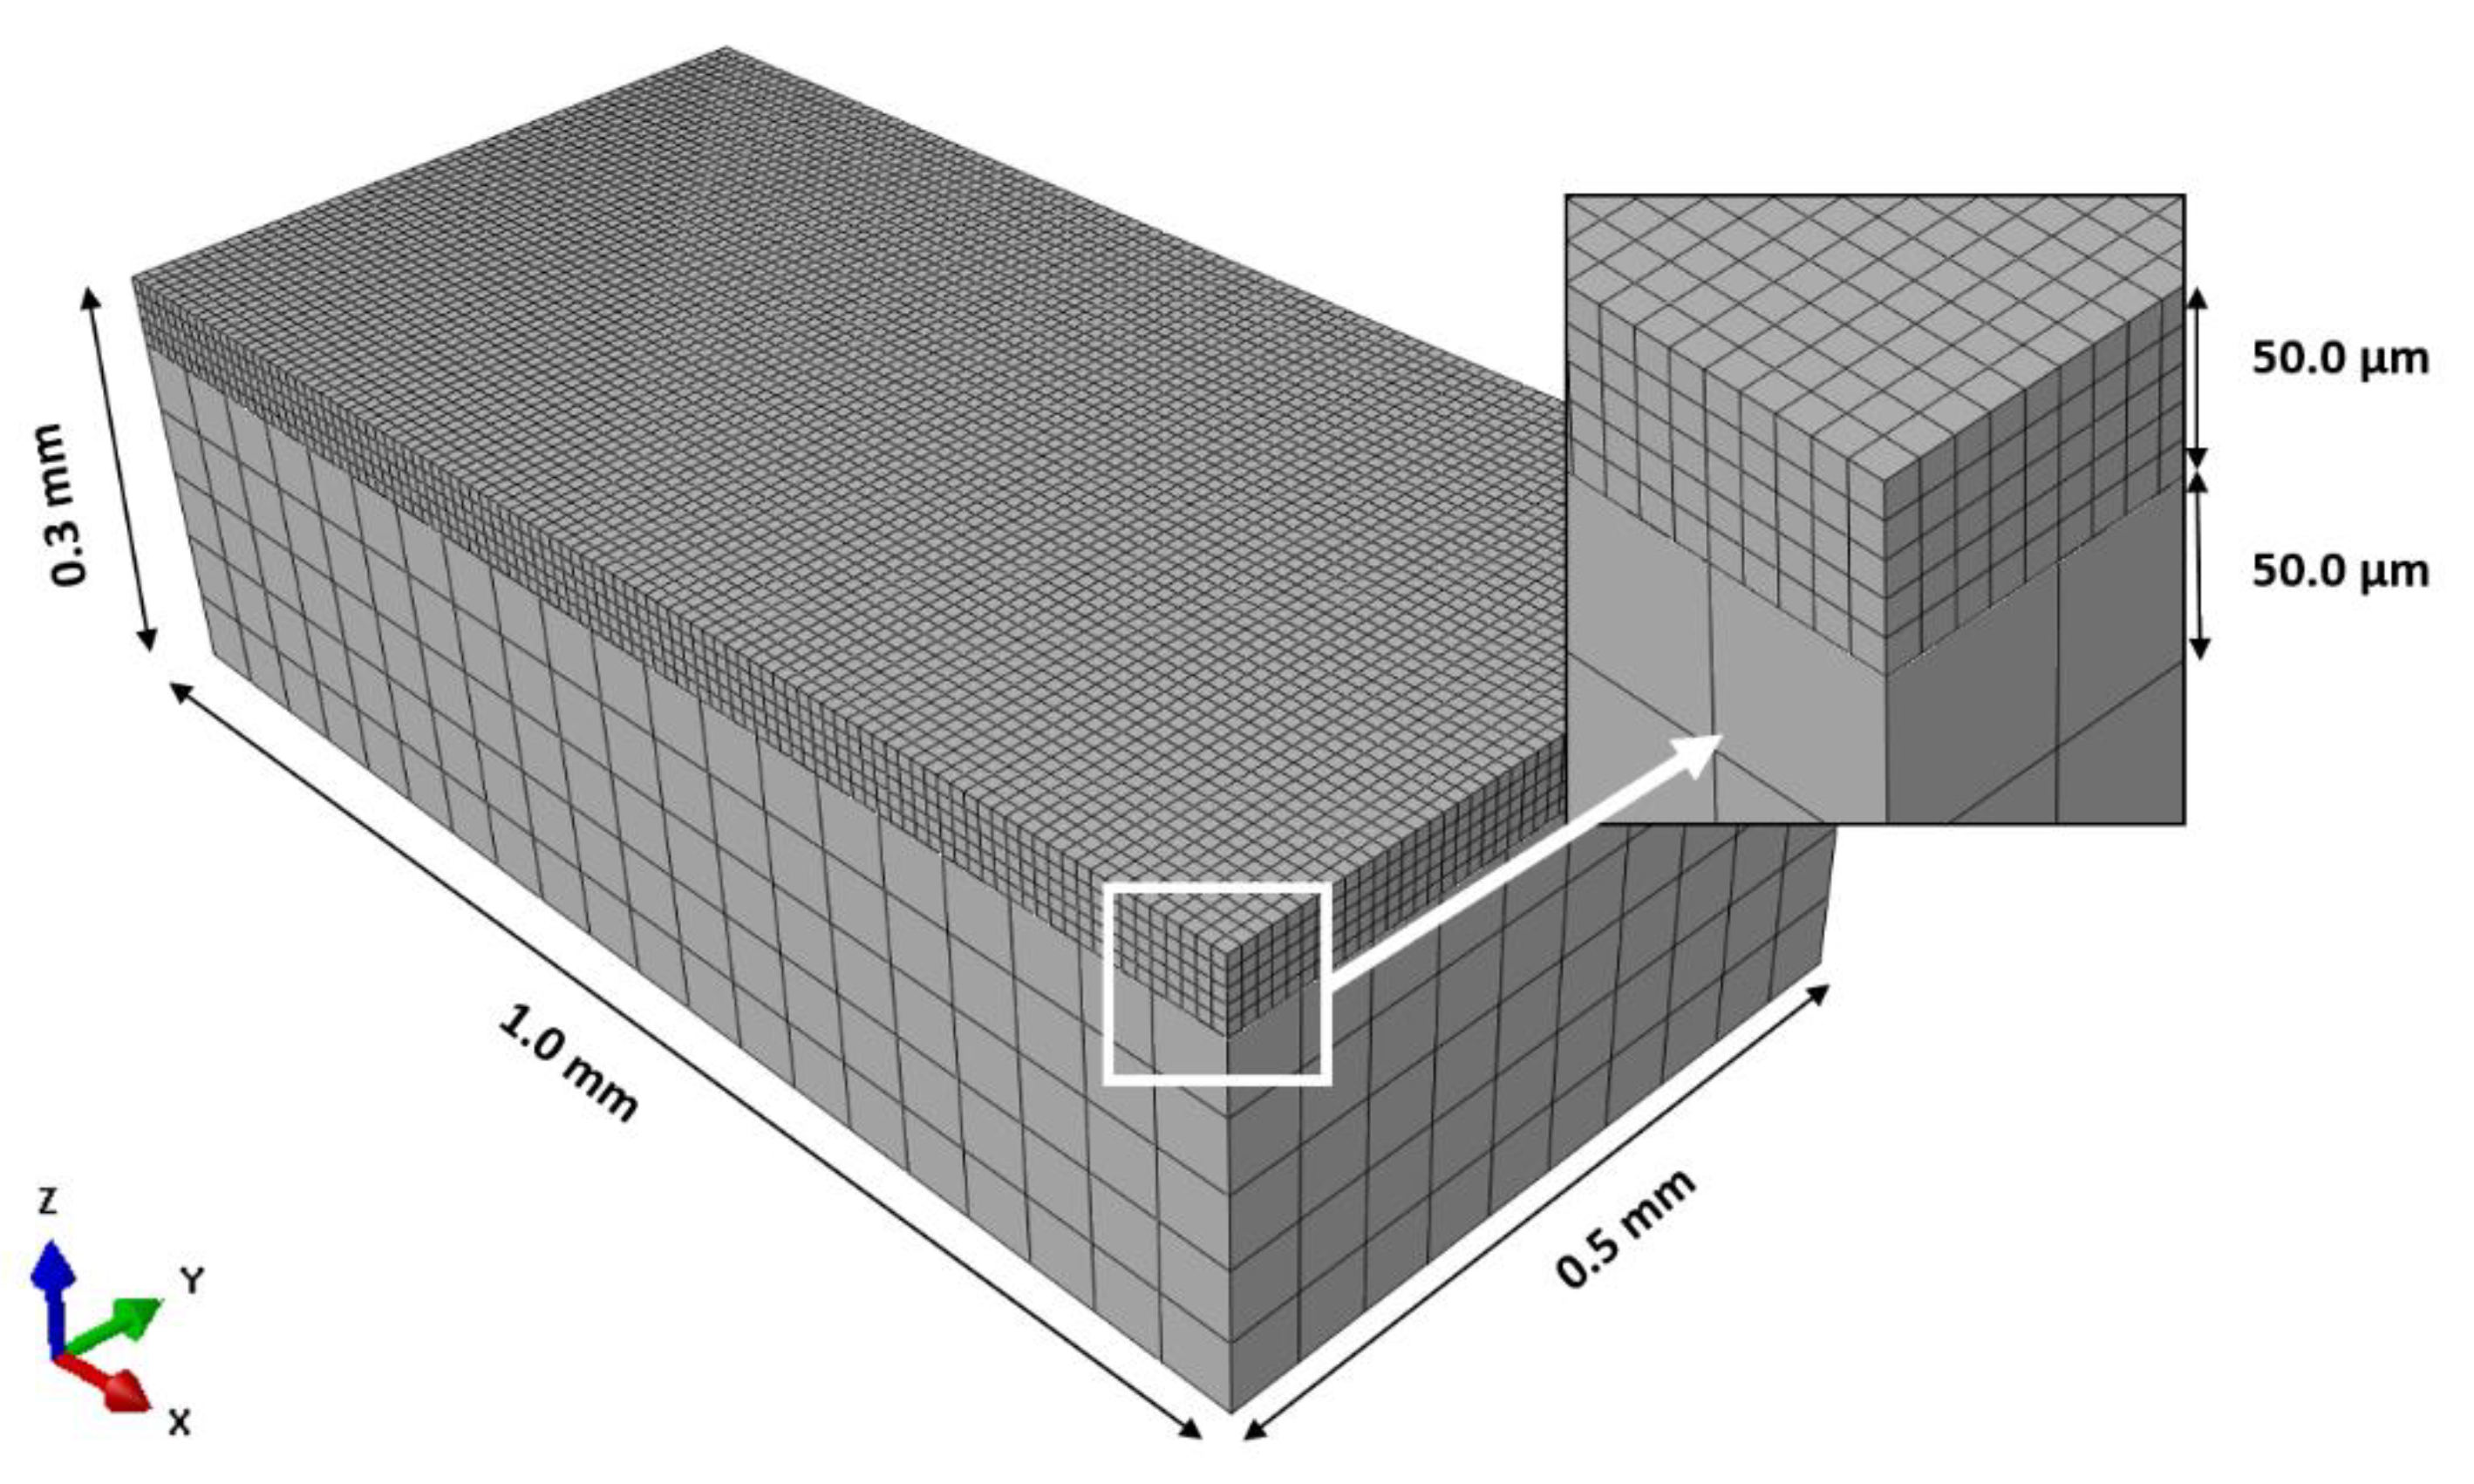
Figure 2.
A custom-designed gas chamber.
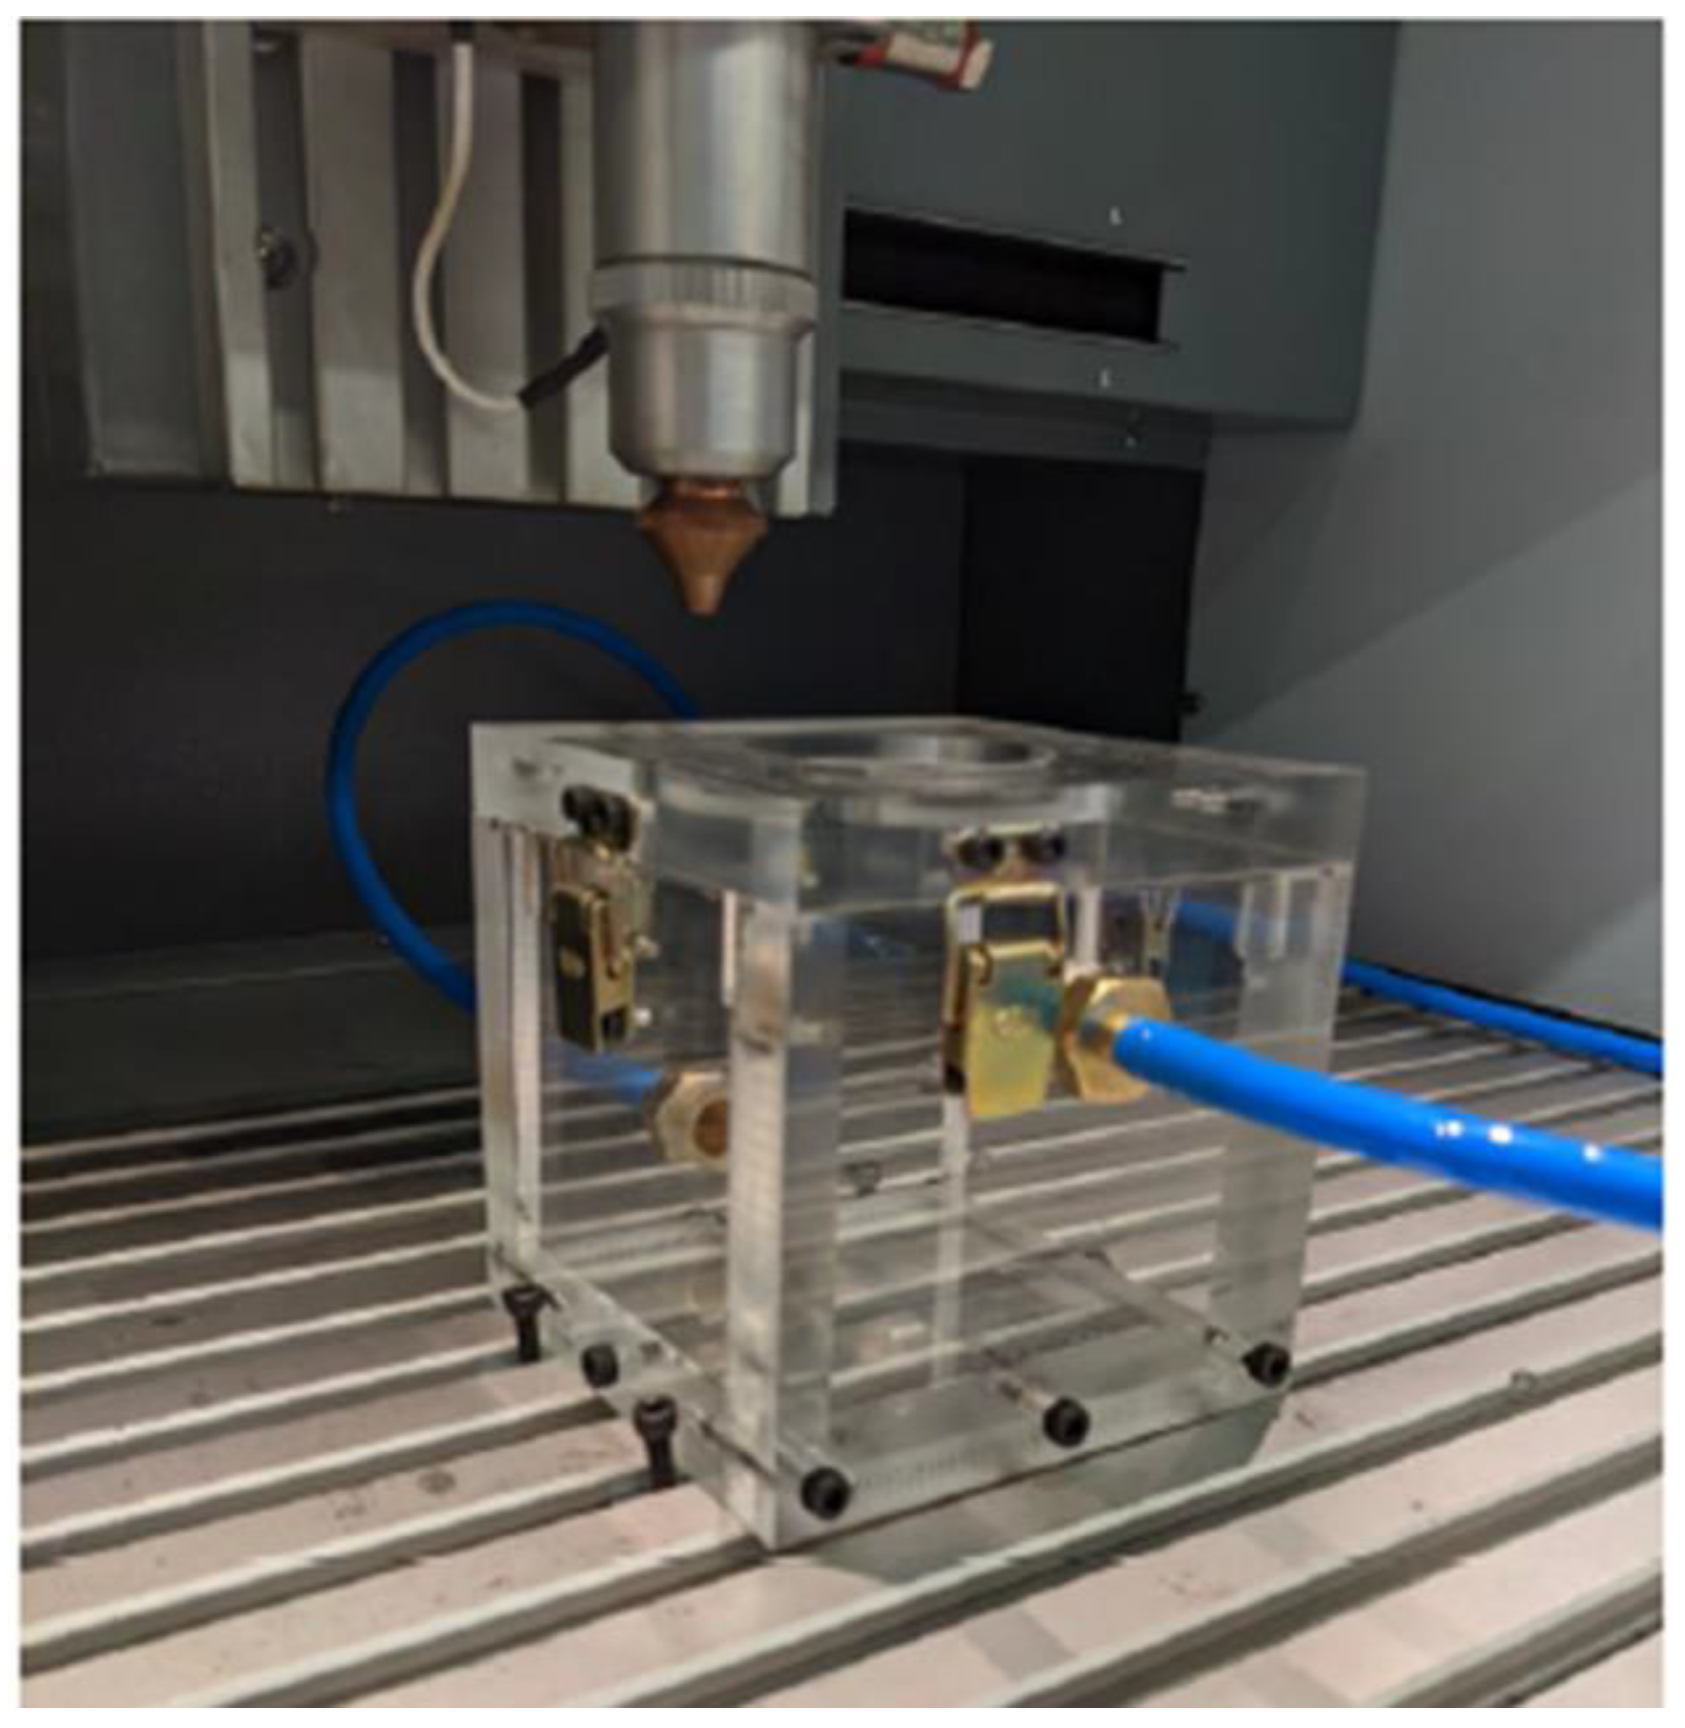
Figure 3.
Melt pool imaging at 30 W, 40 W, and 45 W.
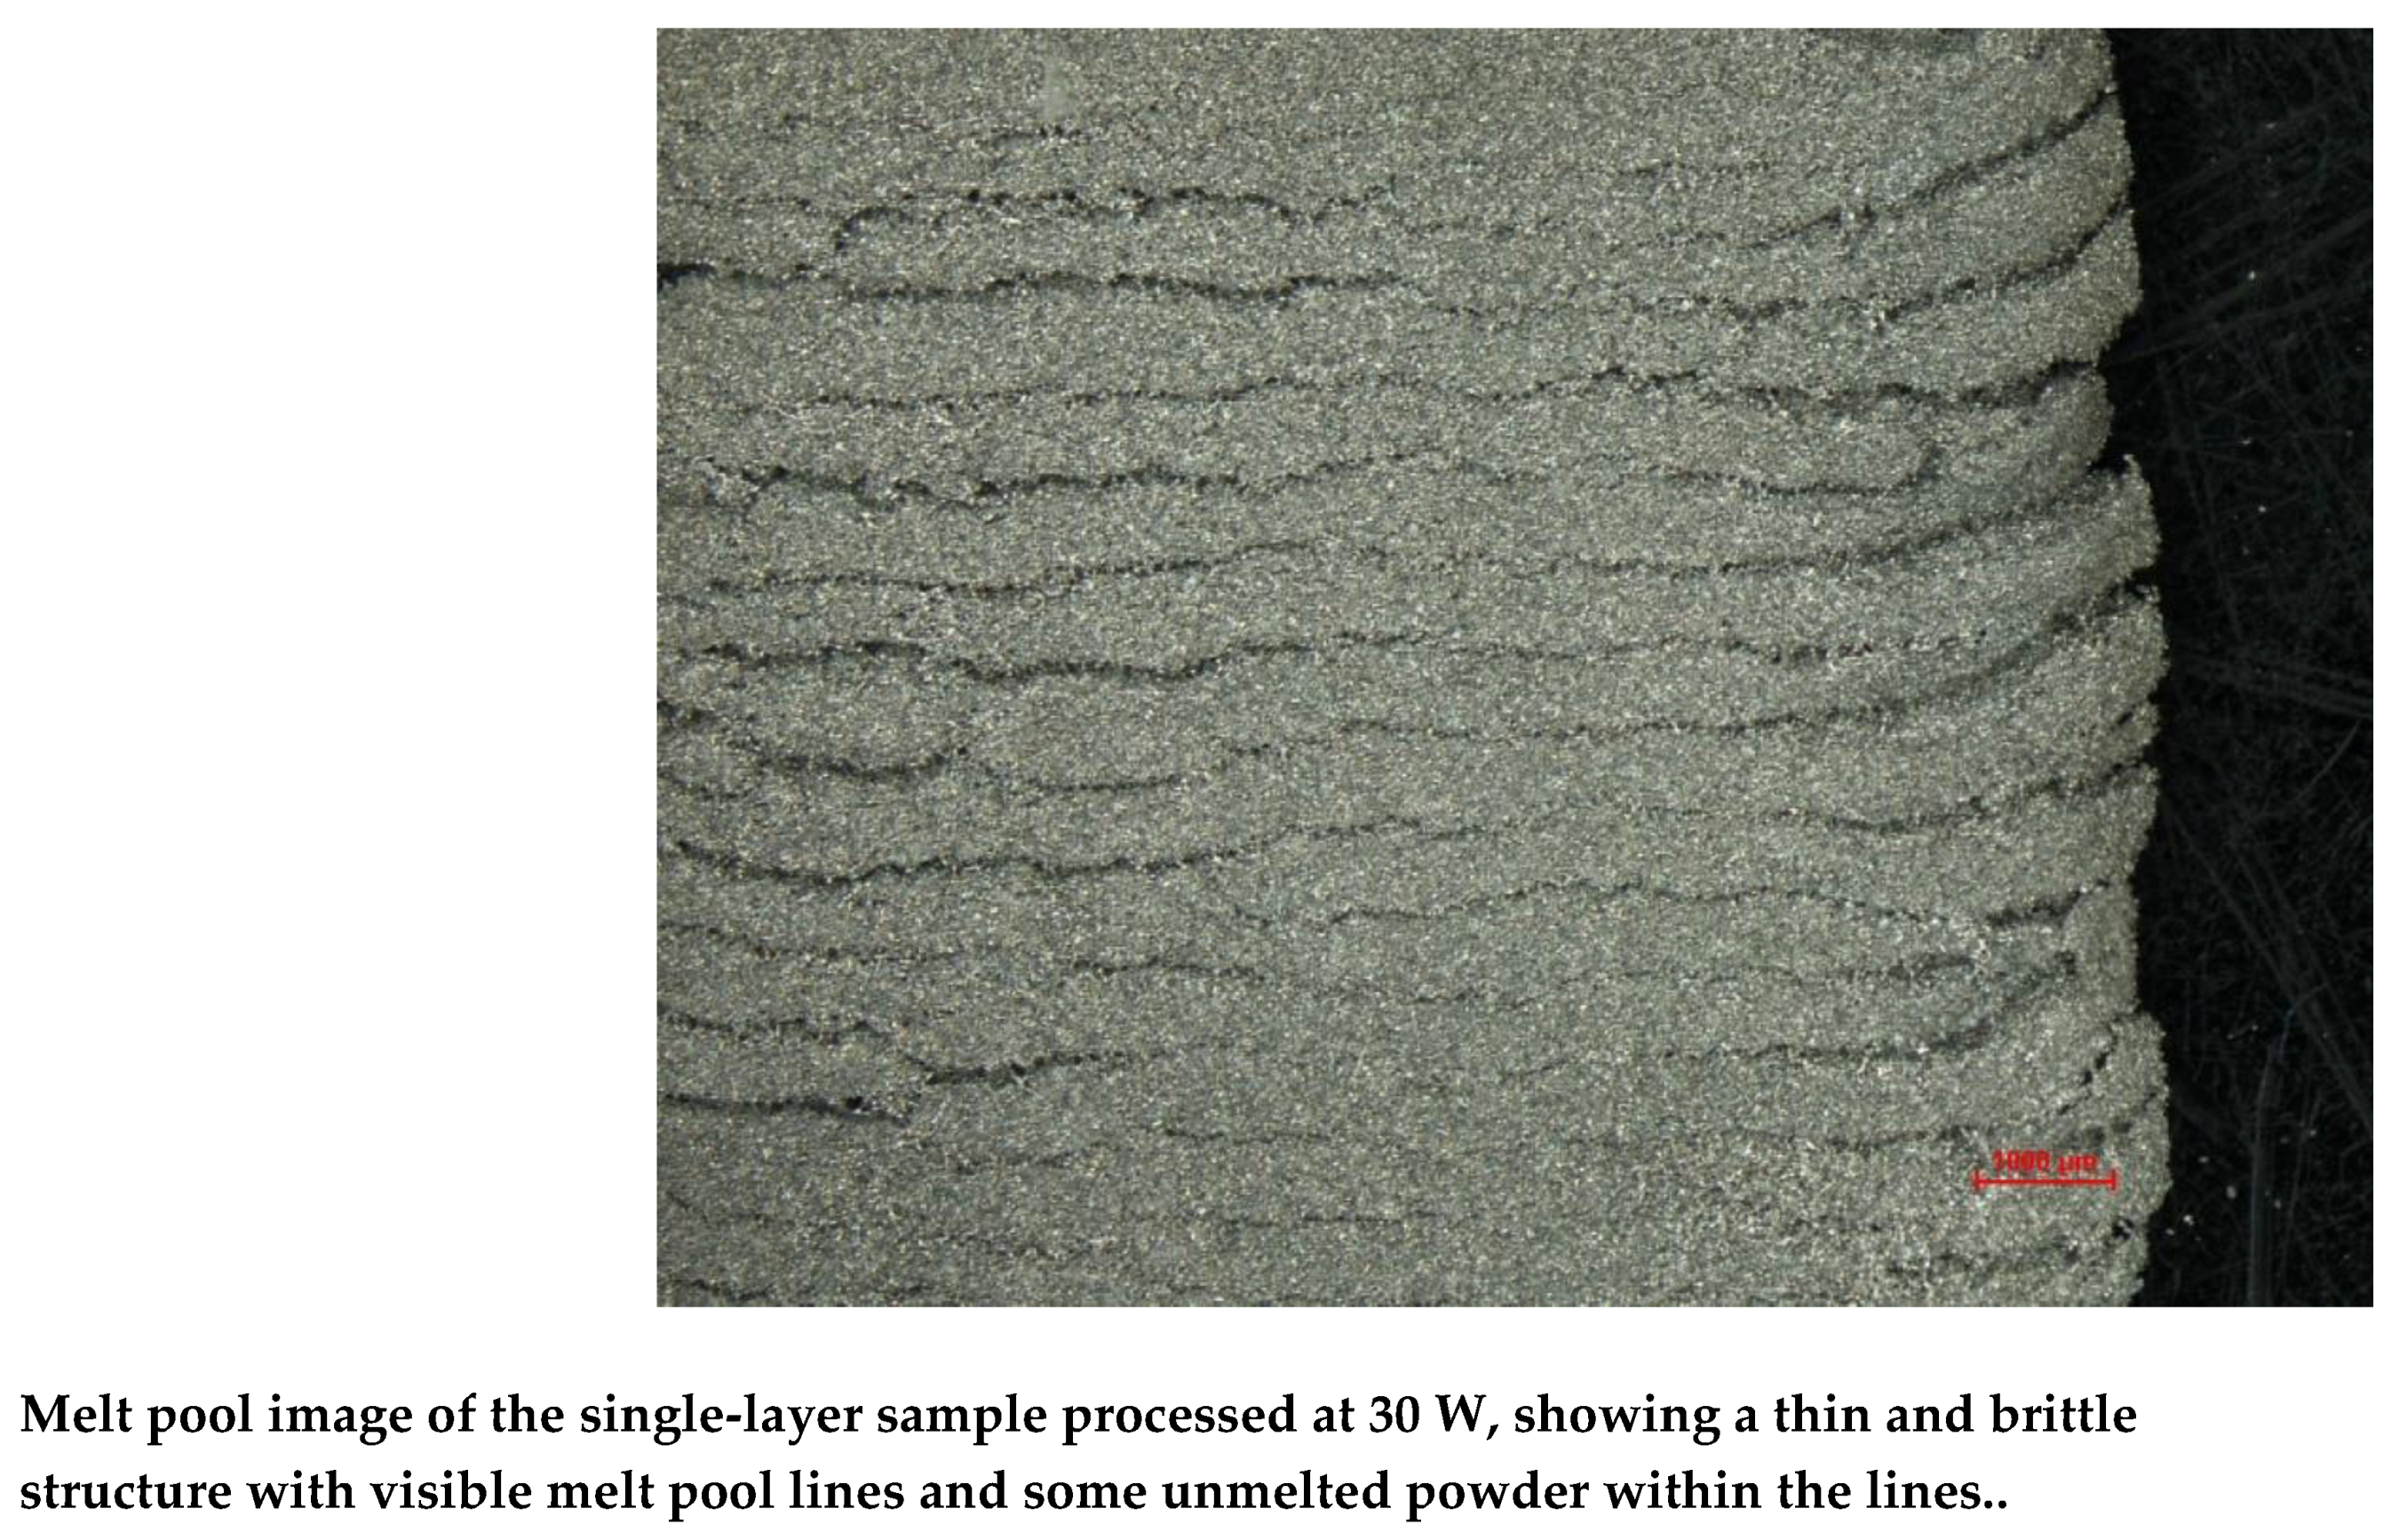
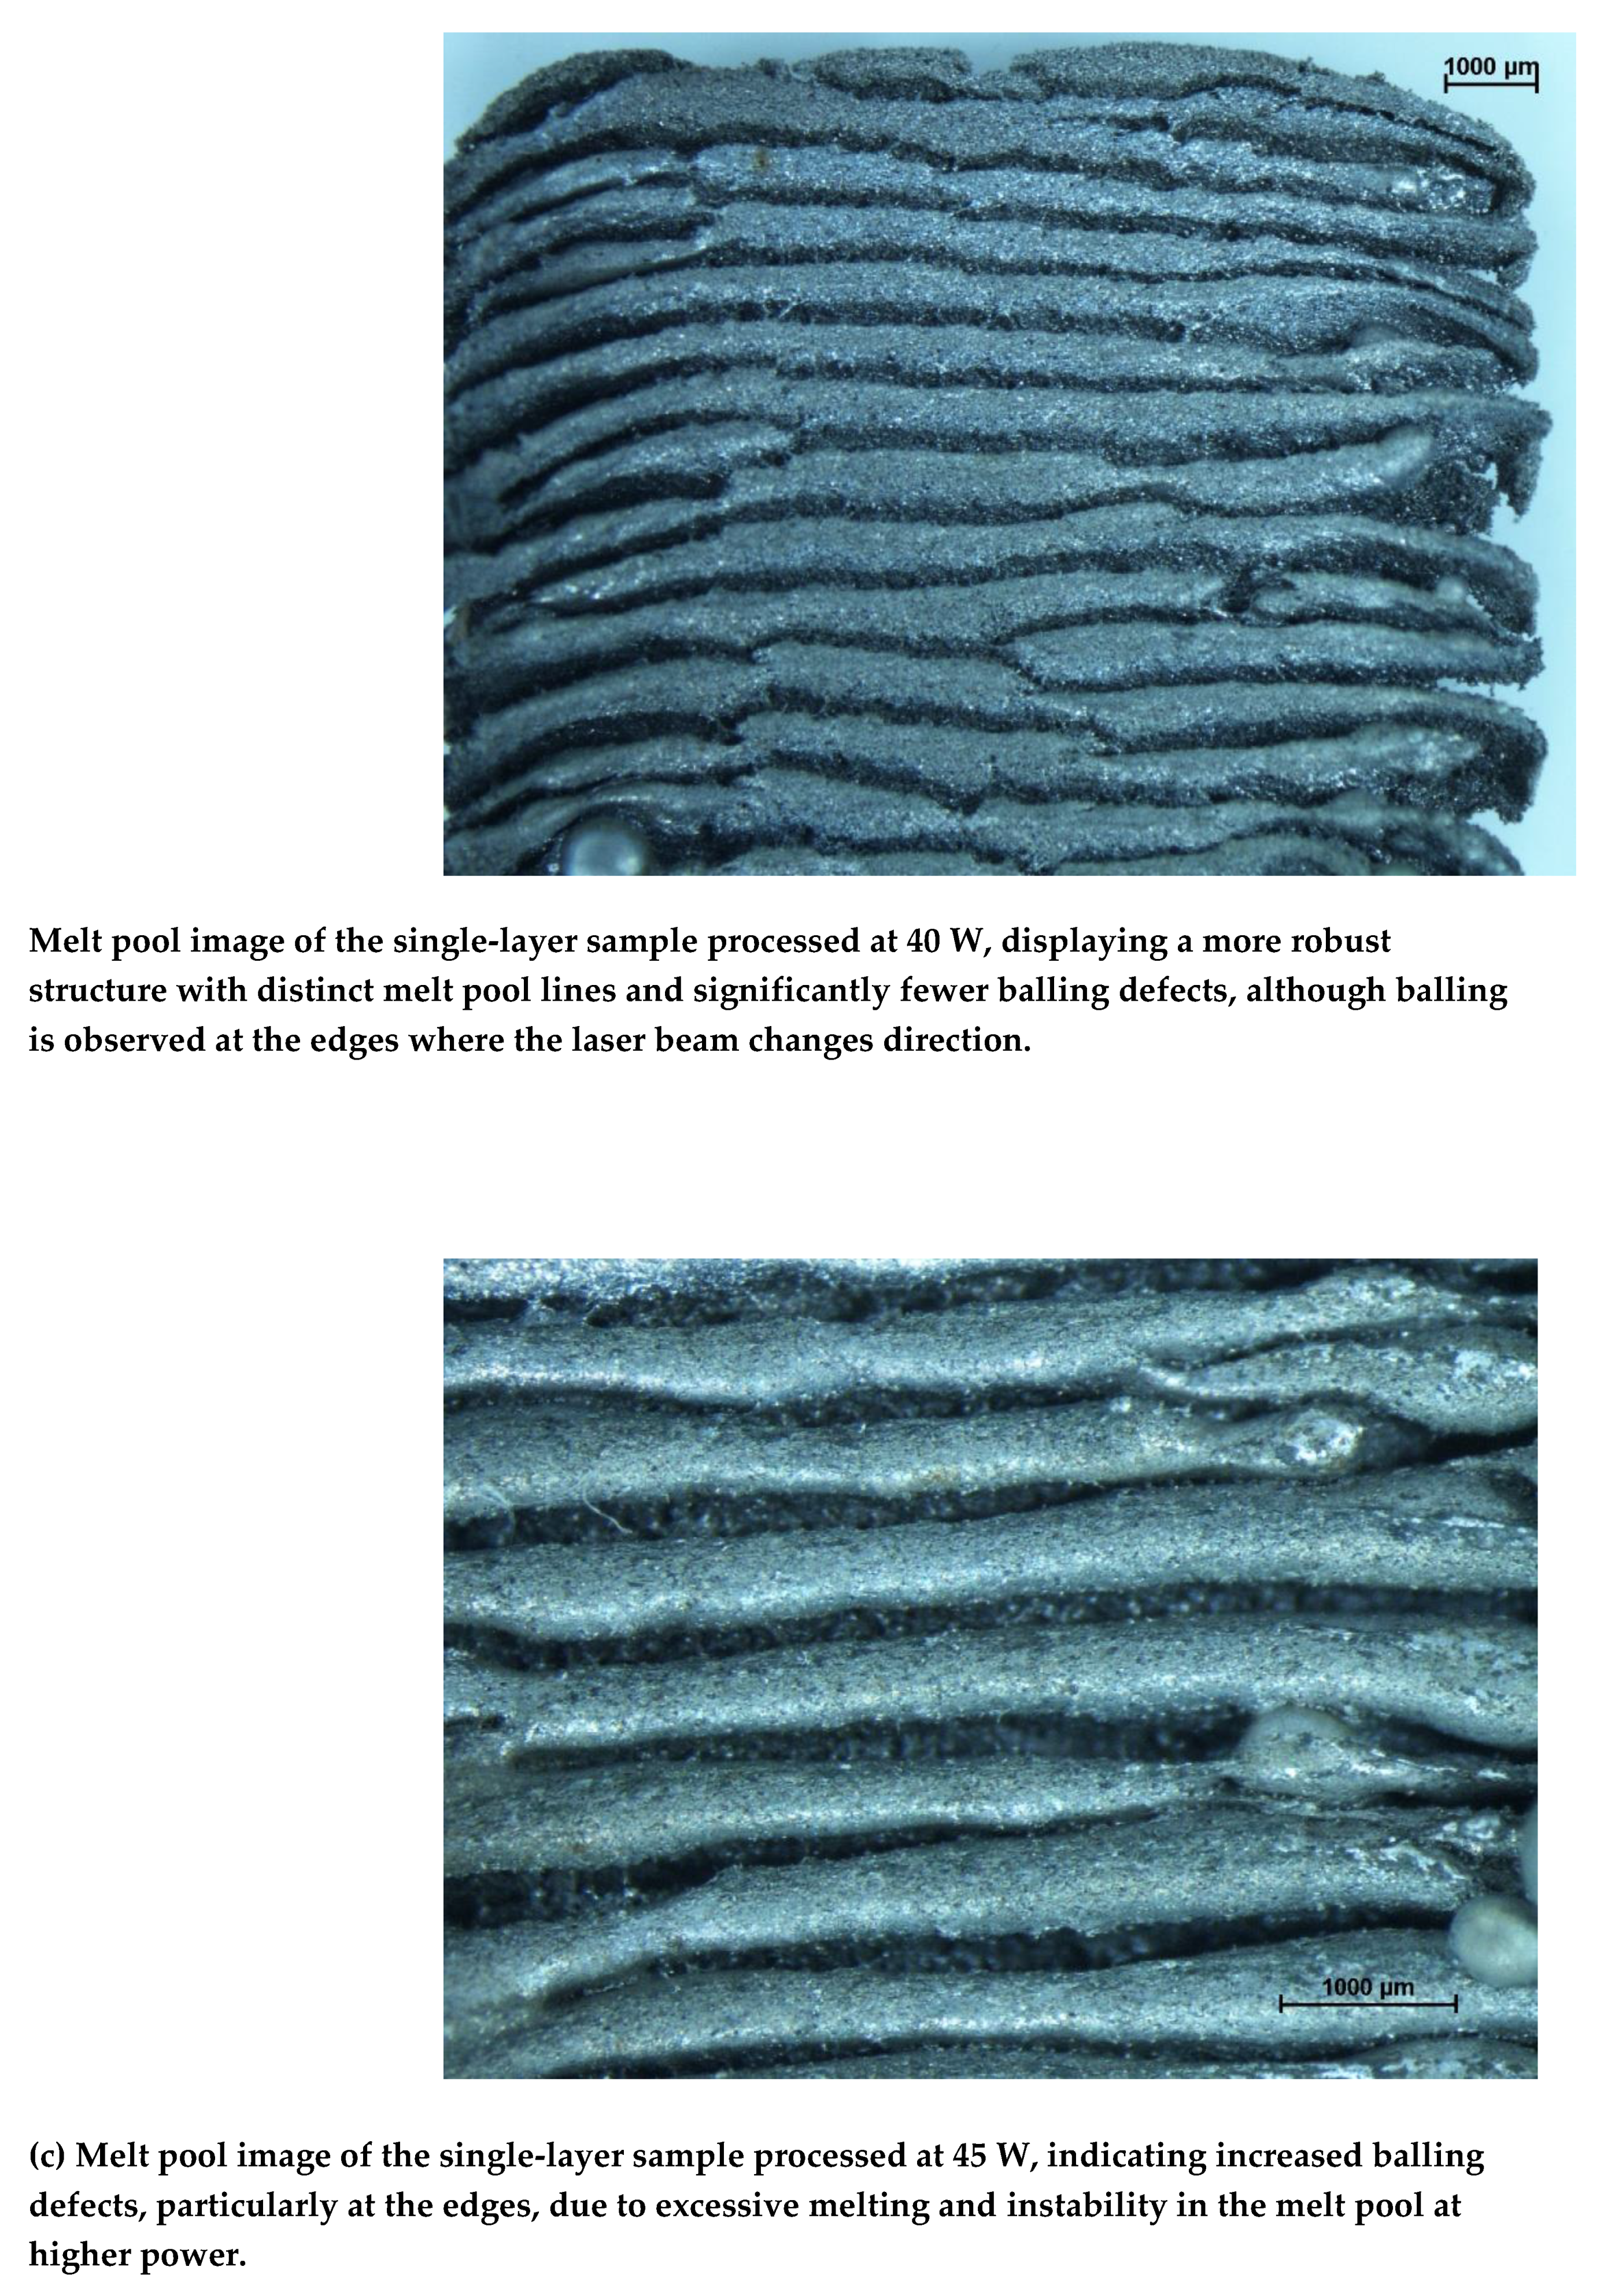
Figure 4.
45 W / 90 @ 55 W.
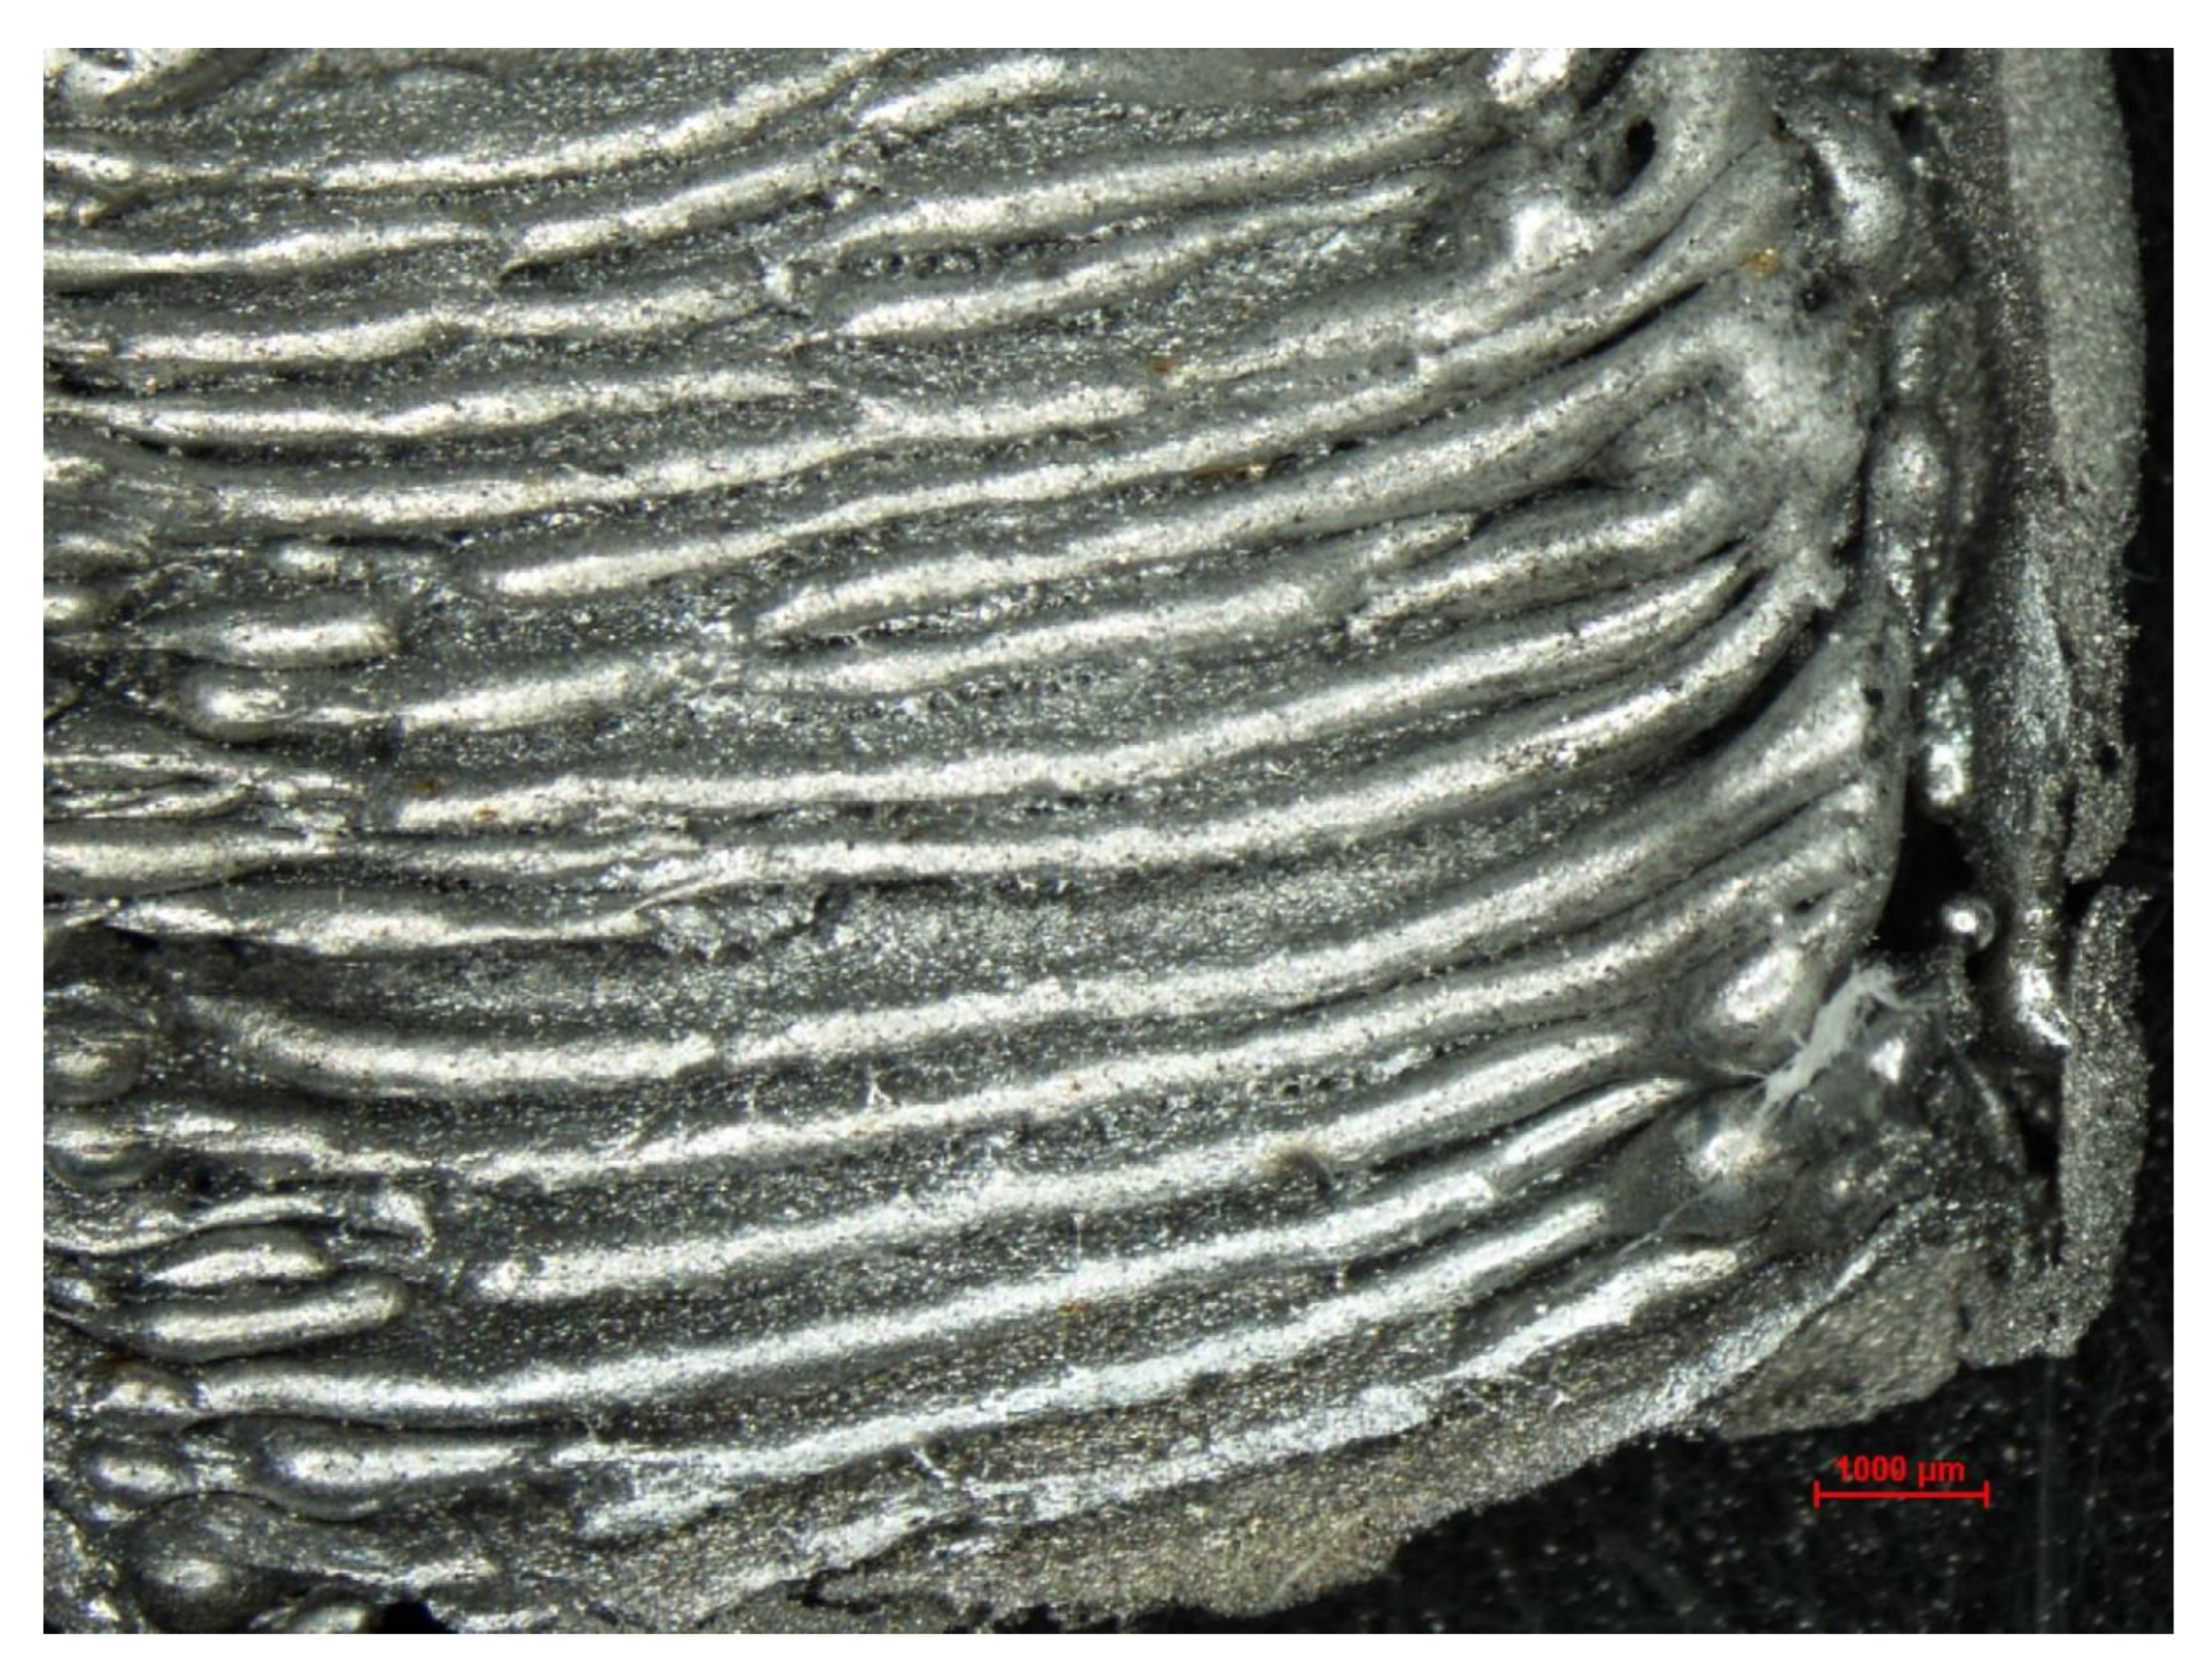
Figure 5.
40 W / 90 @ 60 W.
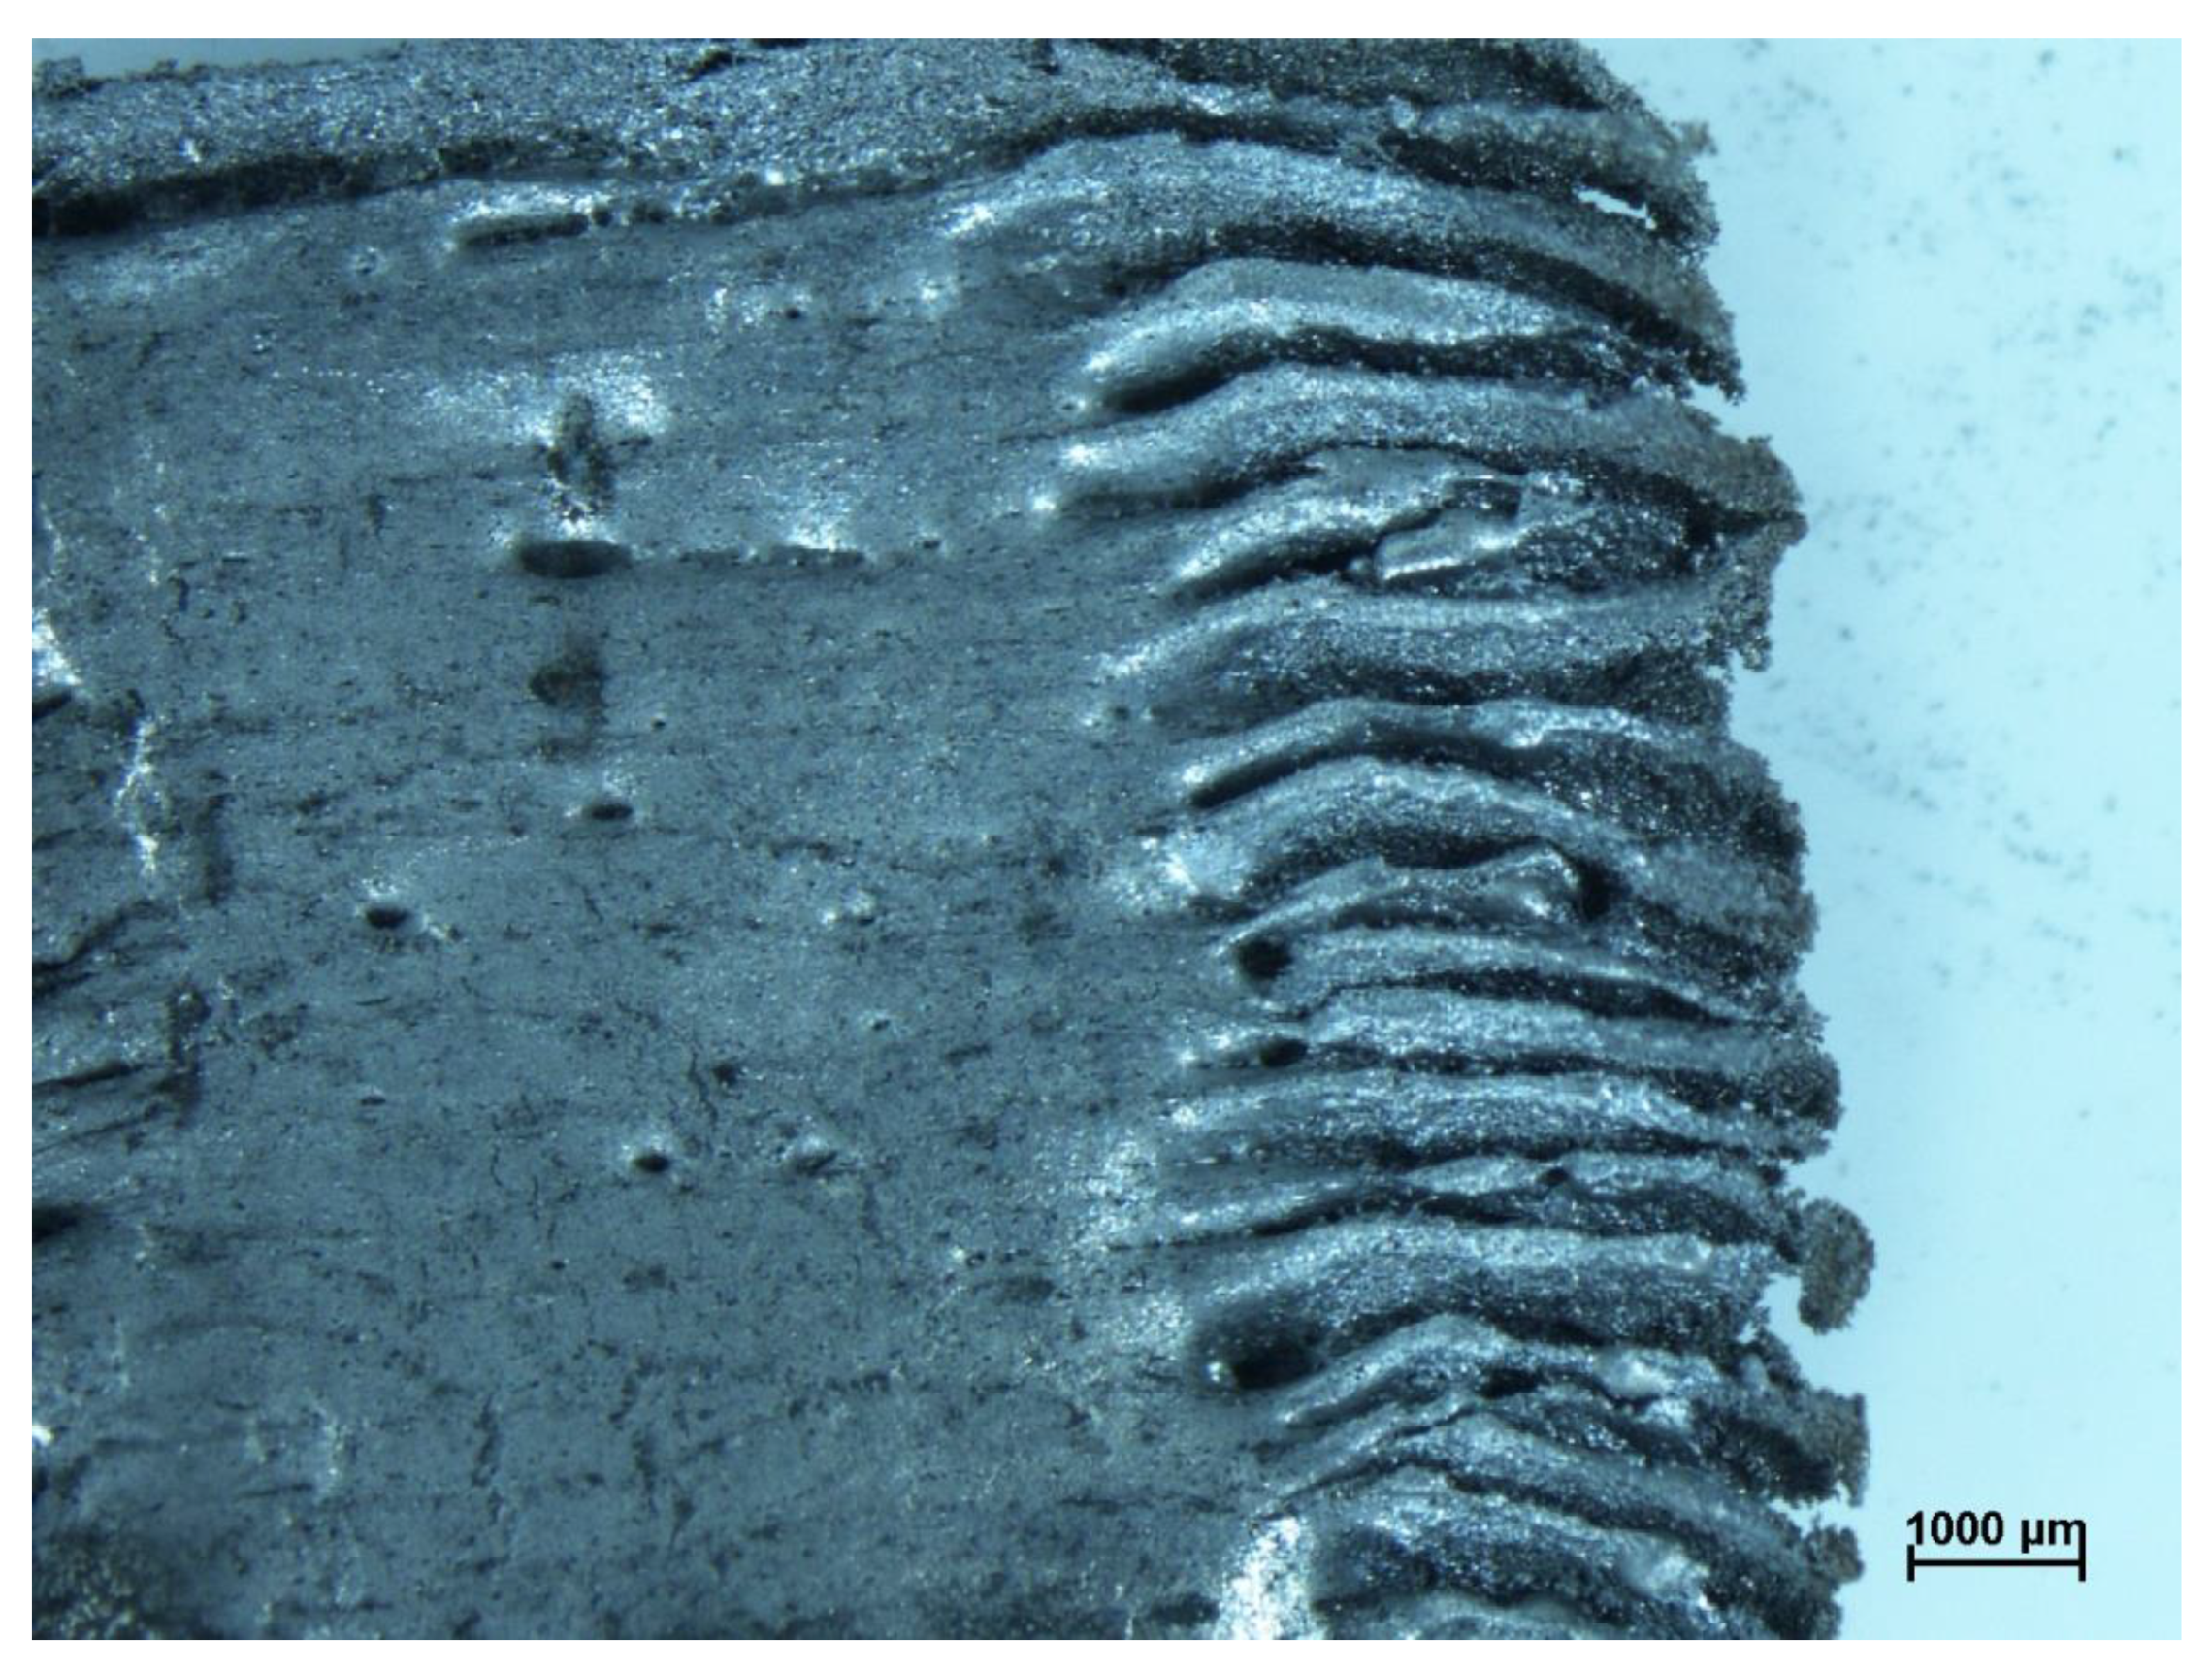
Figure 6.
316L SS experimental measurements.
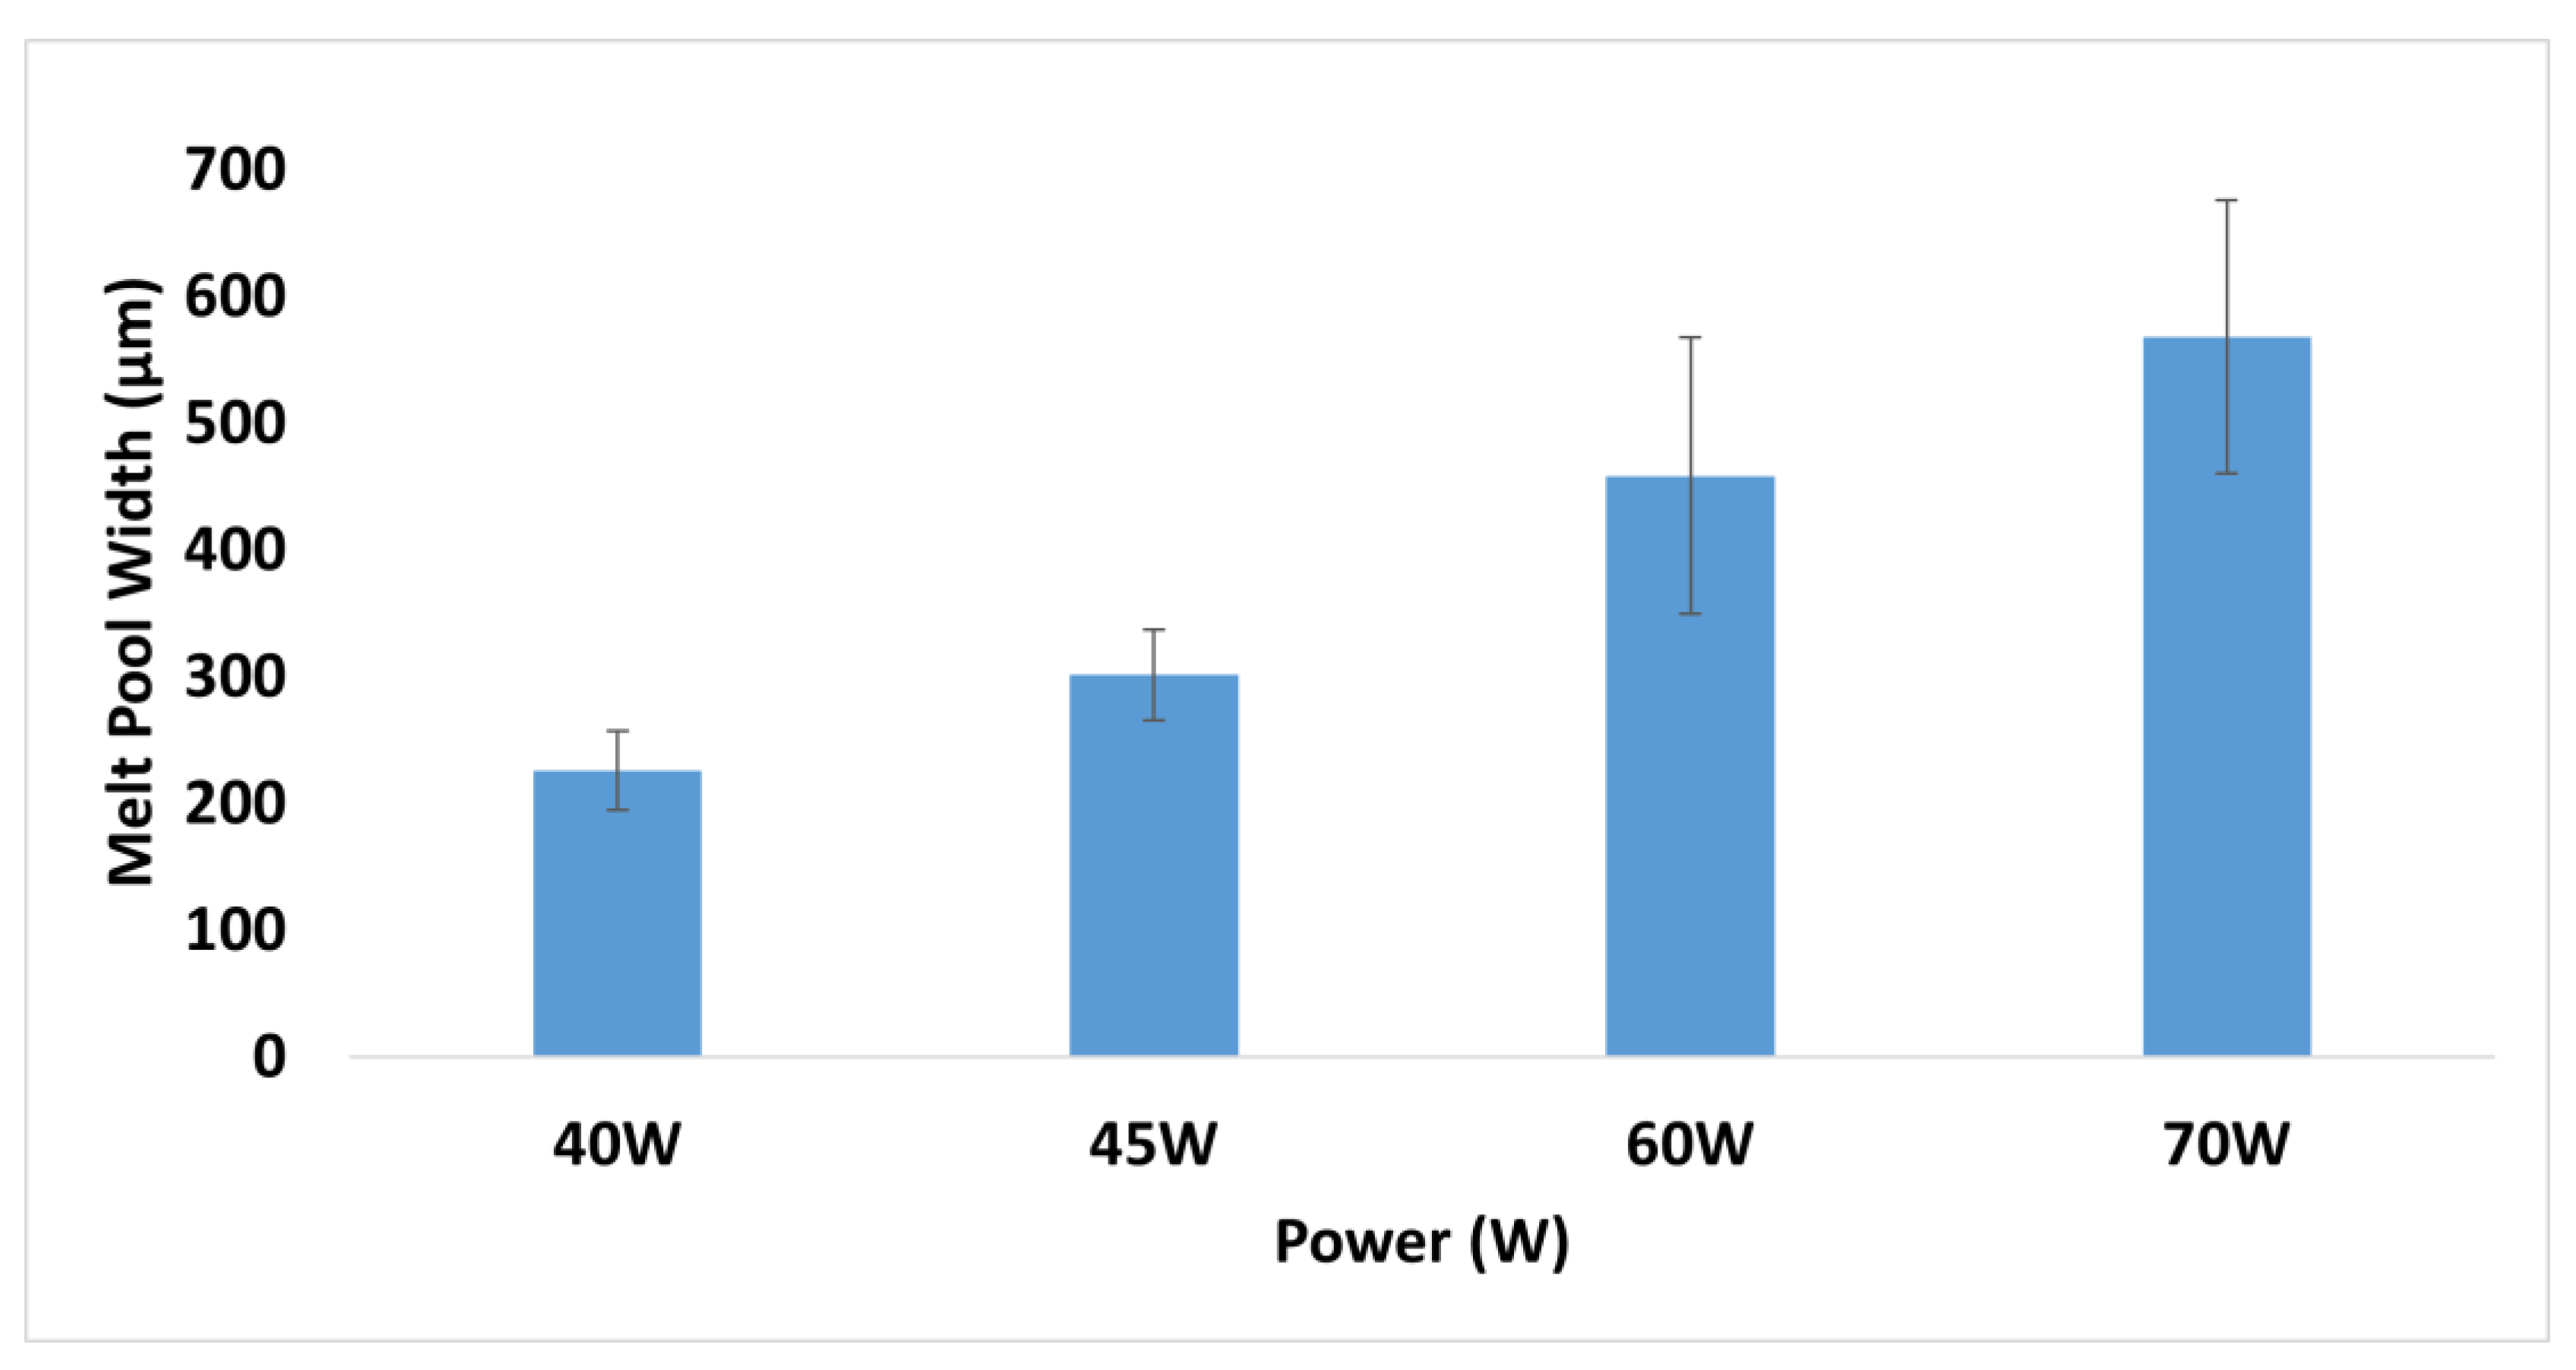
Figure 7.
Comparison of experimentally measured and simulated melt pool widths for 316L SS at various laser power settings. The melt pool width was determined using high-resolution optical microscopy and image analysis of cross-sectional samples.
Figure 7.
Comparison of experimentally measured and simulated melt pool widths for 316L SS at various laser power settings. The melt pool width was determined using high-resolution optical microscopy and image analysis of cross-sectional samples.
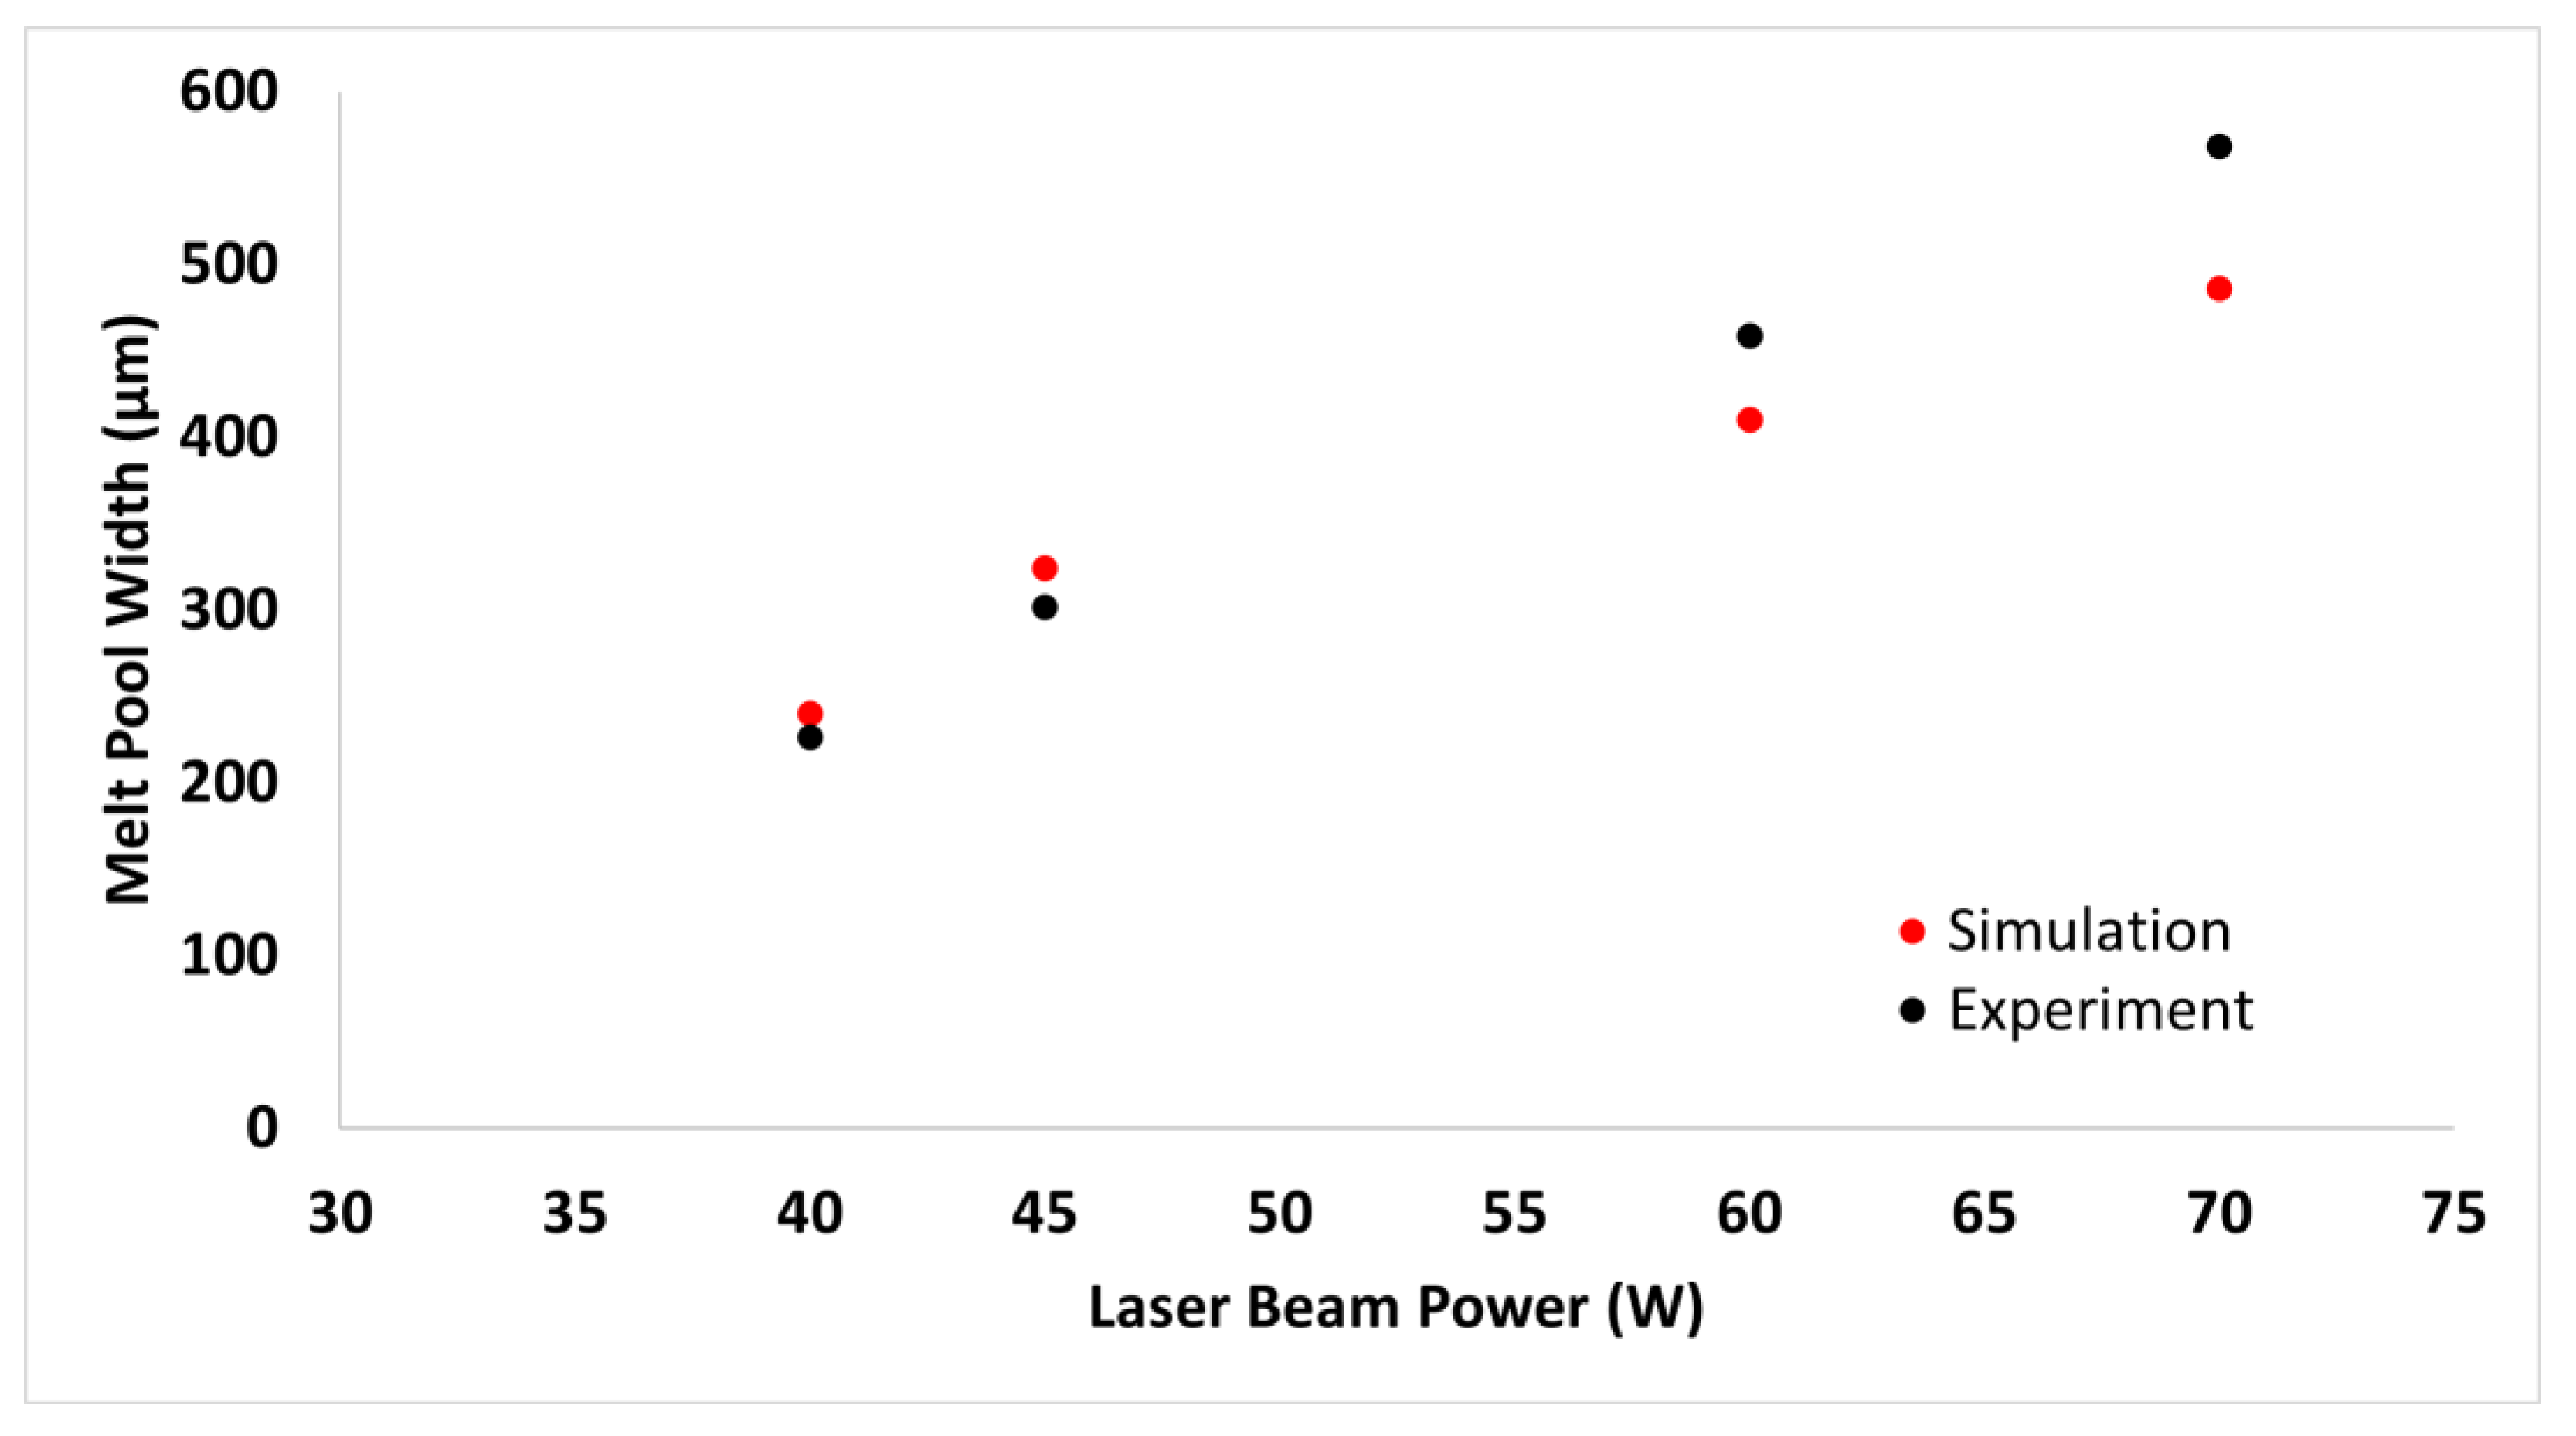
Figure 8.
Temperature contour and melt pool dimensions for Laser Power = 100 W, Scanning Speed = 1000 mm/s.
Figure 8.
Temperature contour and melt pool dimensions for Laser Power = 100 W, Scanning Speed = 1000 mm/s.
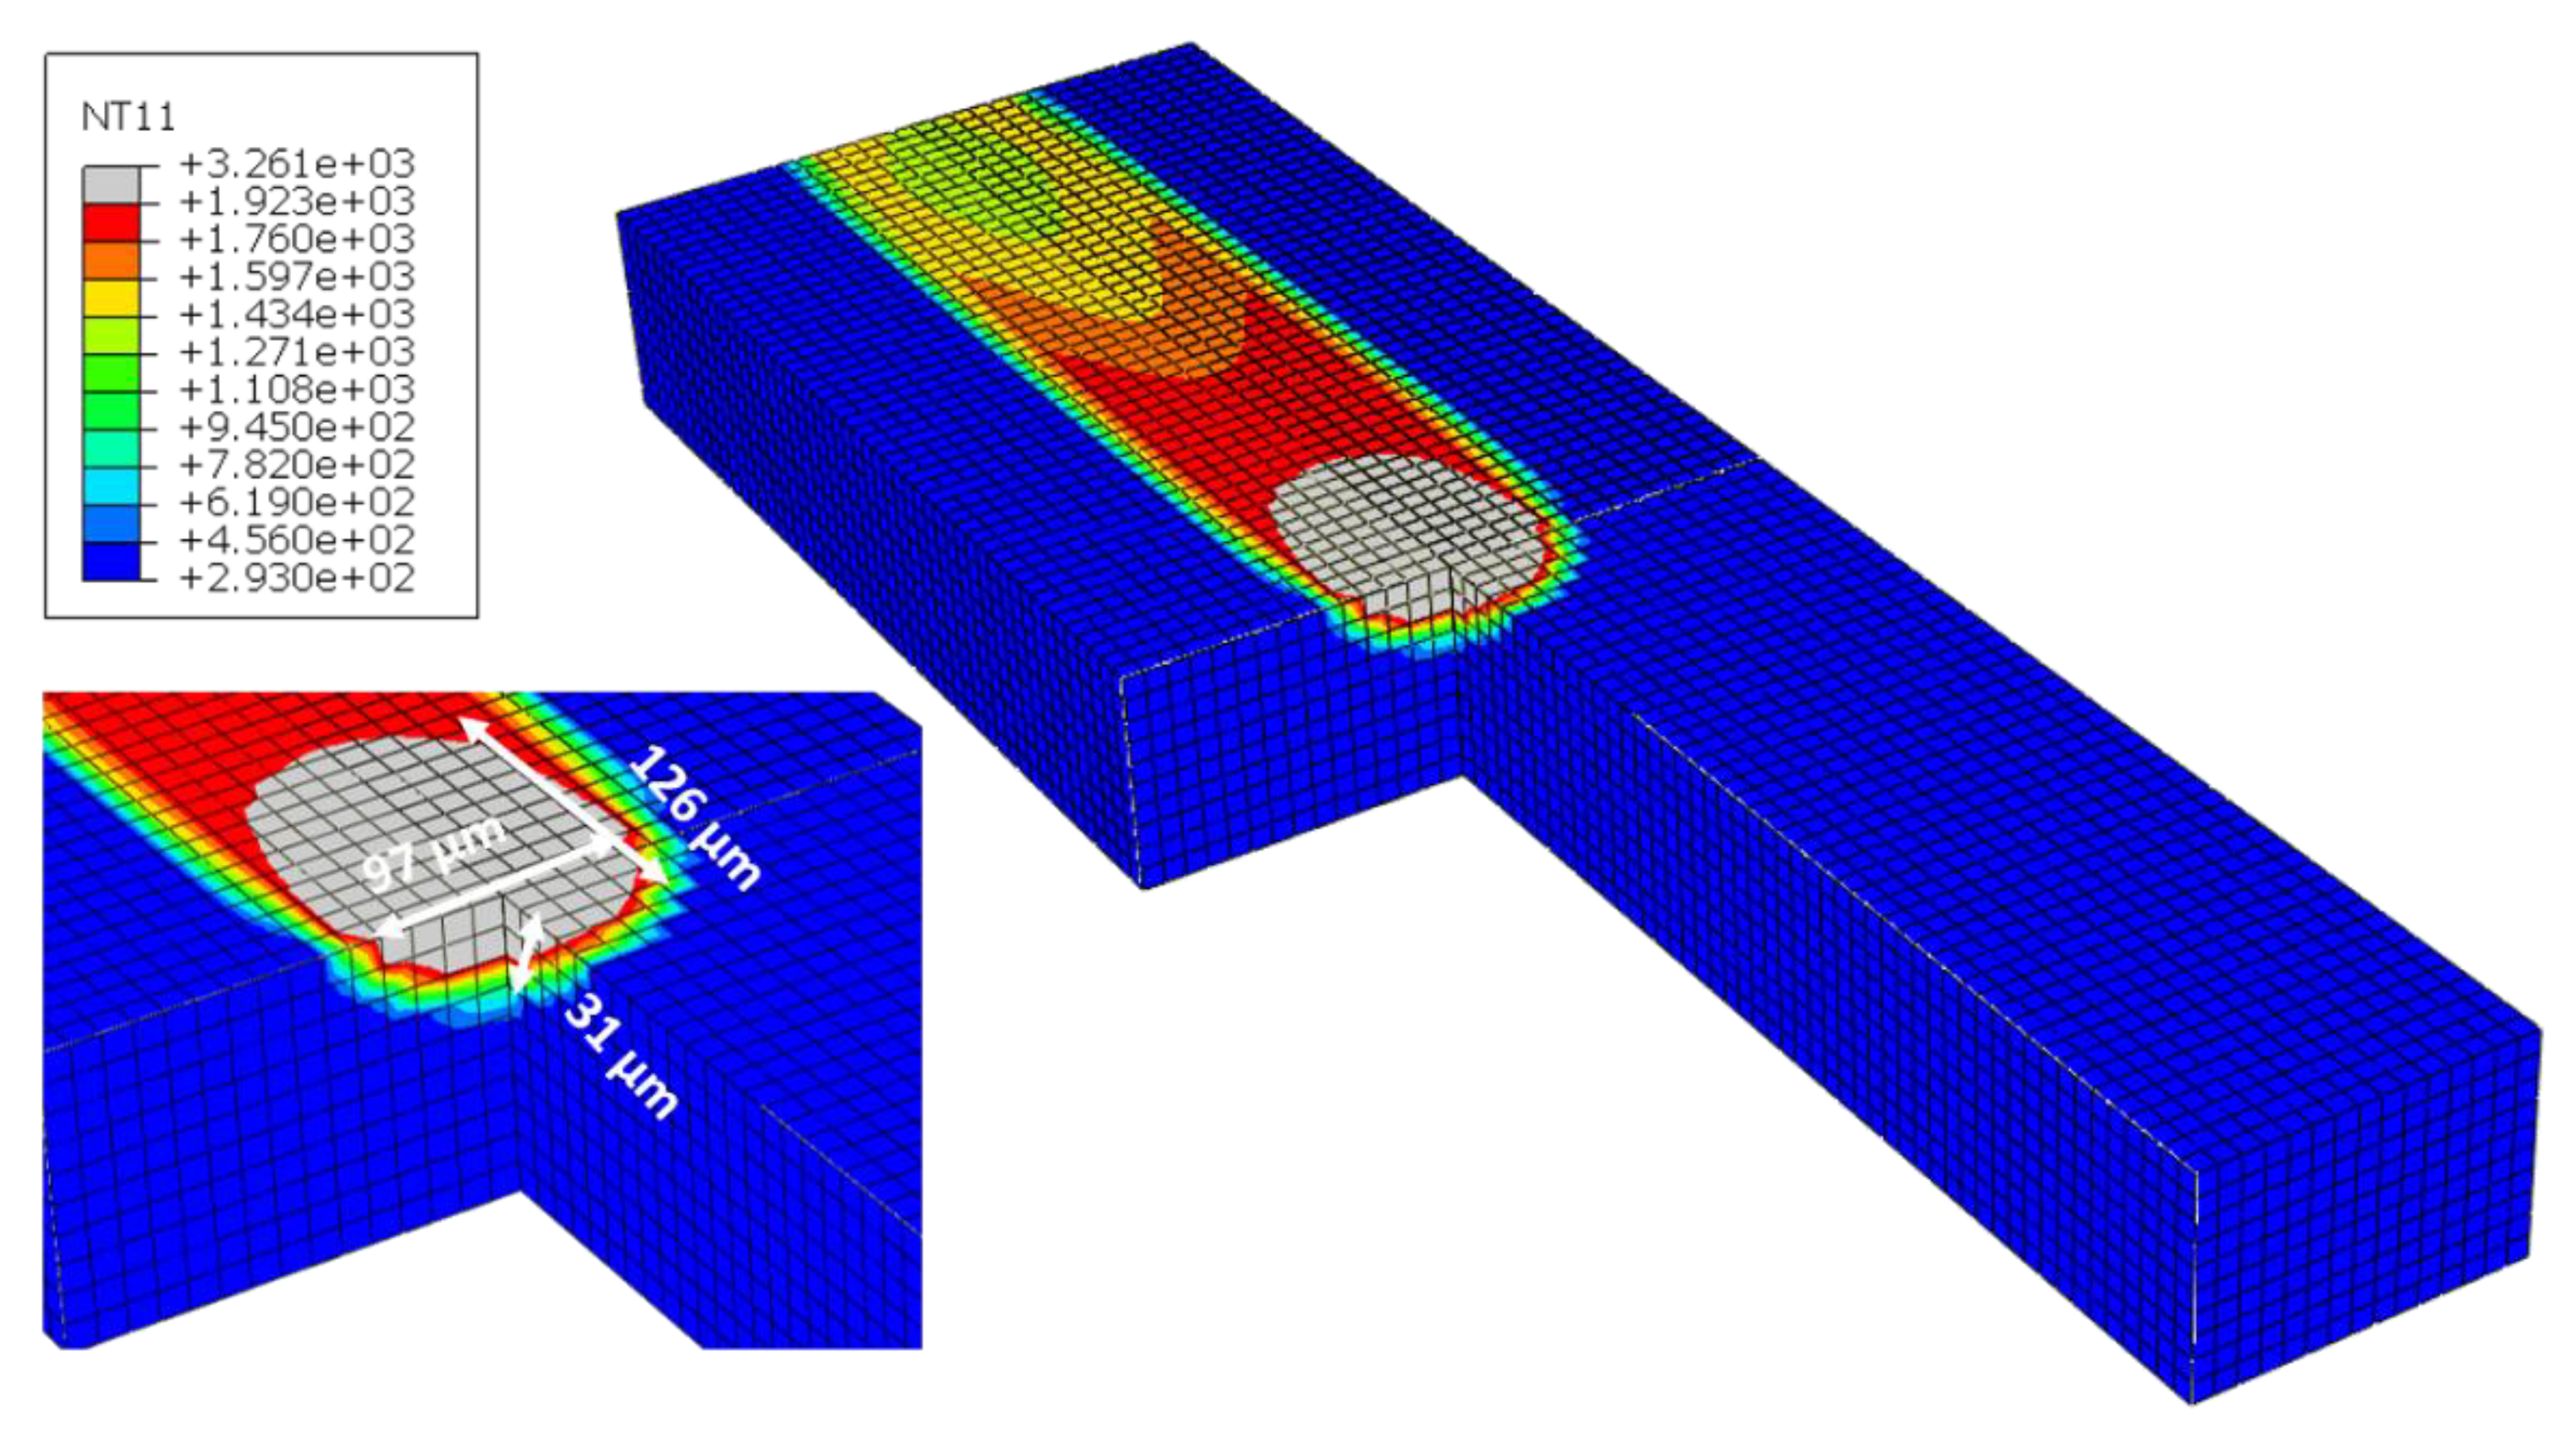
Figure 9.
Ti6AI4V thermal history for Laser Power = 100 W, Scanning speed = 1000 mm/s. Liquidus and solidus lines have been marked.
Figure 9.
Ti6AI4V thermal history for Laser Power = 100 W, Scanning speed = 1000 mm/s. Liquidus and solidus lines have been marked.
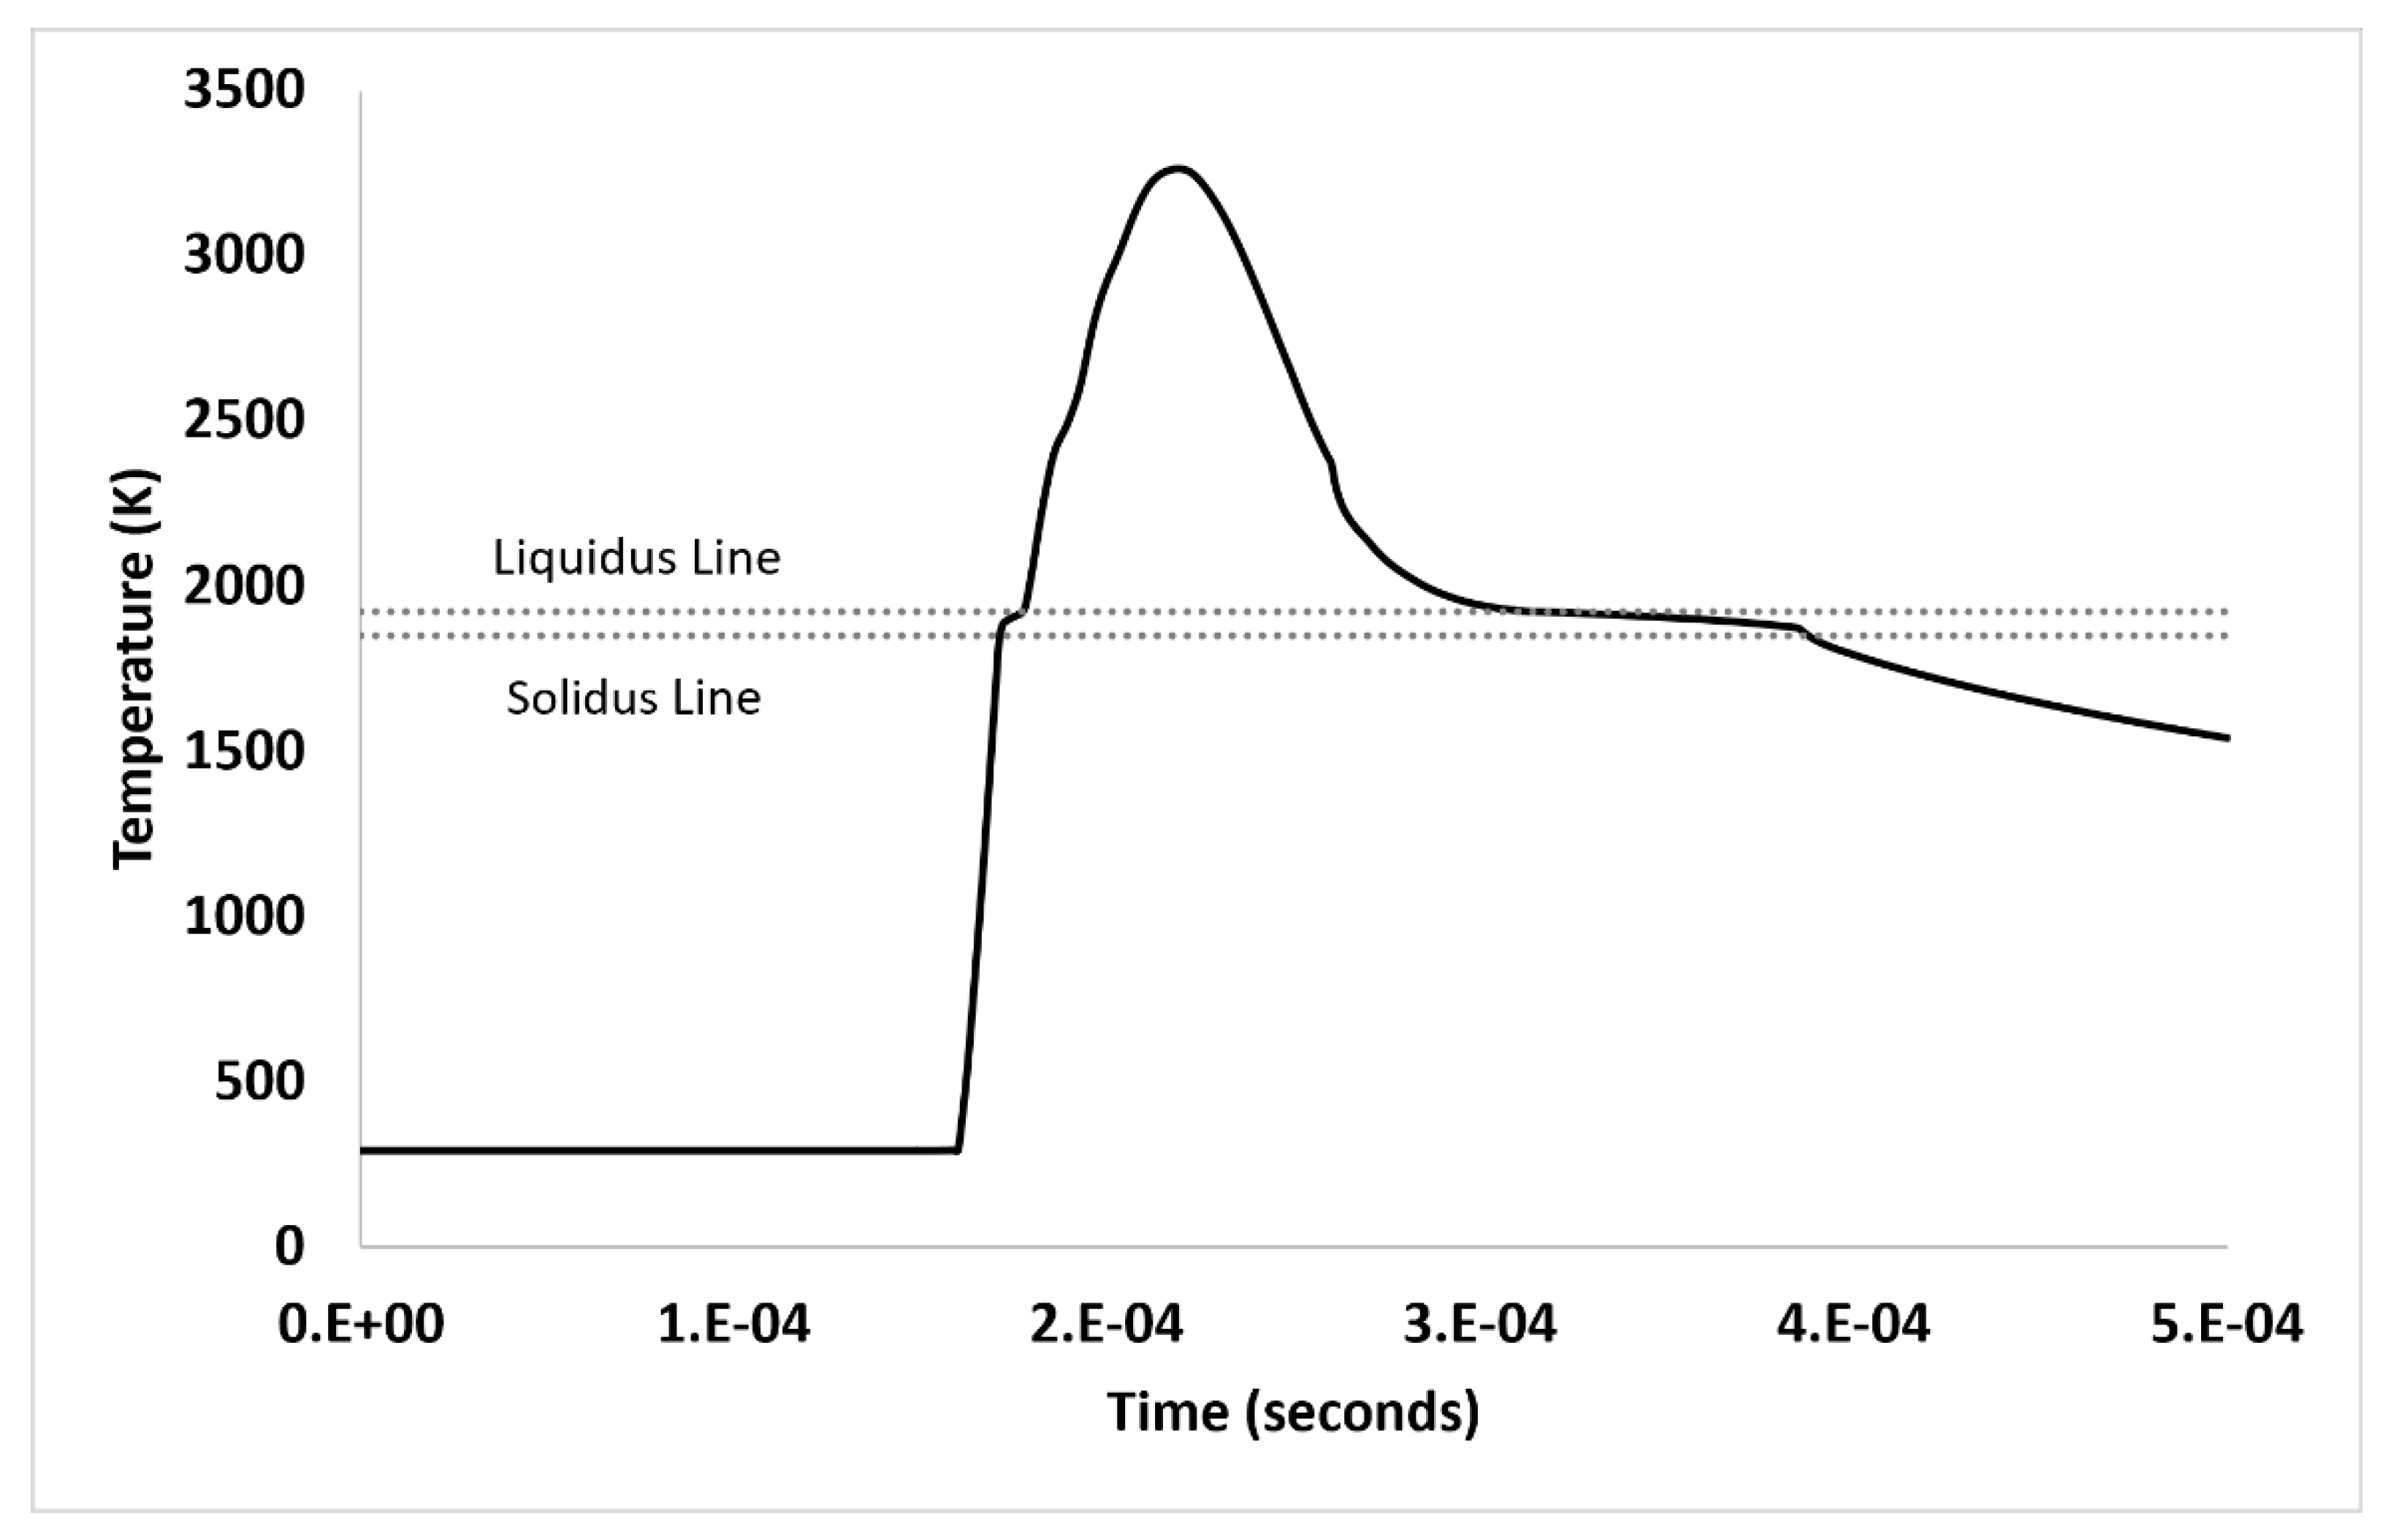
Figure 10.
Temperature distribution for different laser powers (100 W, 150 W, and 200 W) showing (a) Temperature versus time and (b) Temperature versus distance along the scanning direction at t=1t = 1t=1 ms.
Figure 10.
Temperature distribution for different laser powers (100 W, 150 W, and 200 W) showing (a) Temperature versus time and (b) Temperature versus distance along the scanning direction at t=1t = 1t=1 ms.
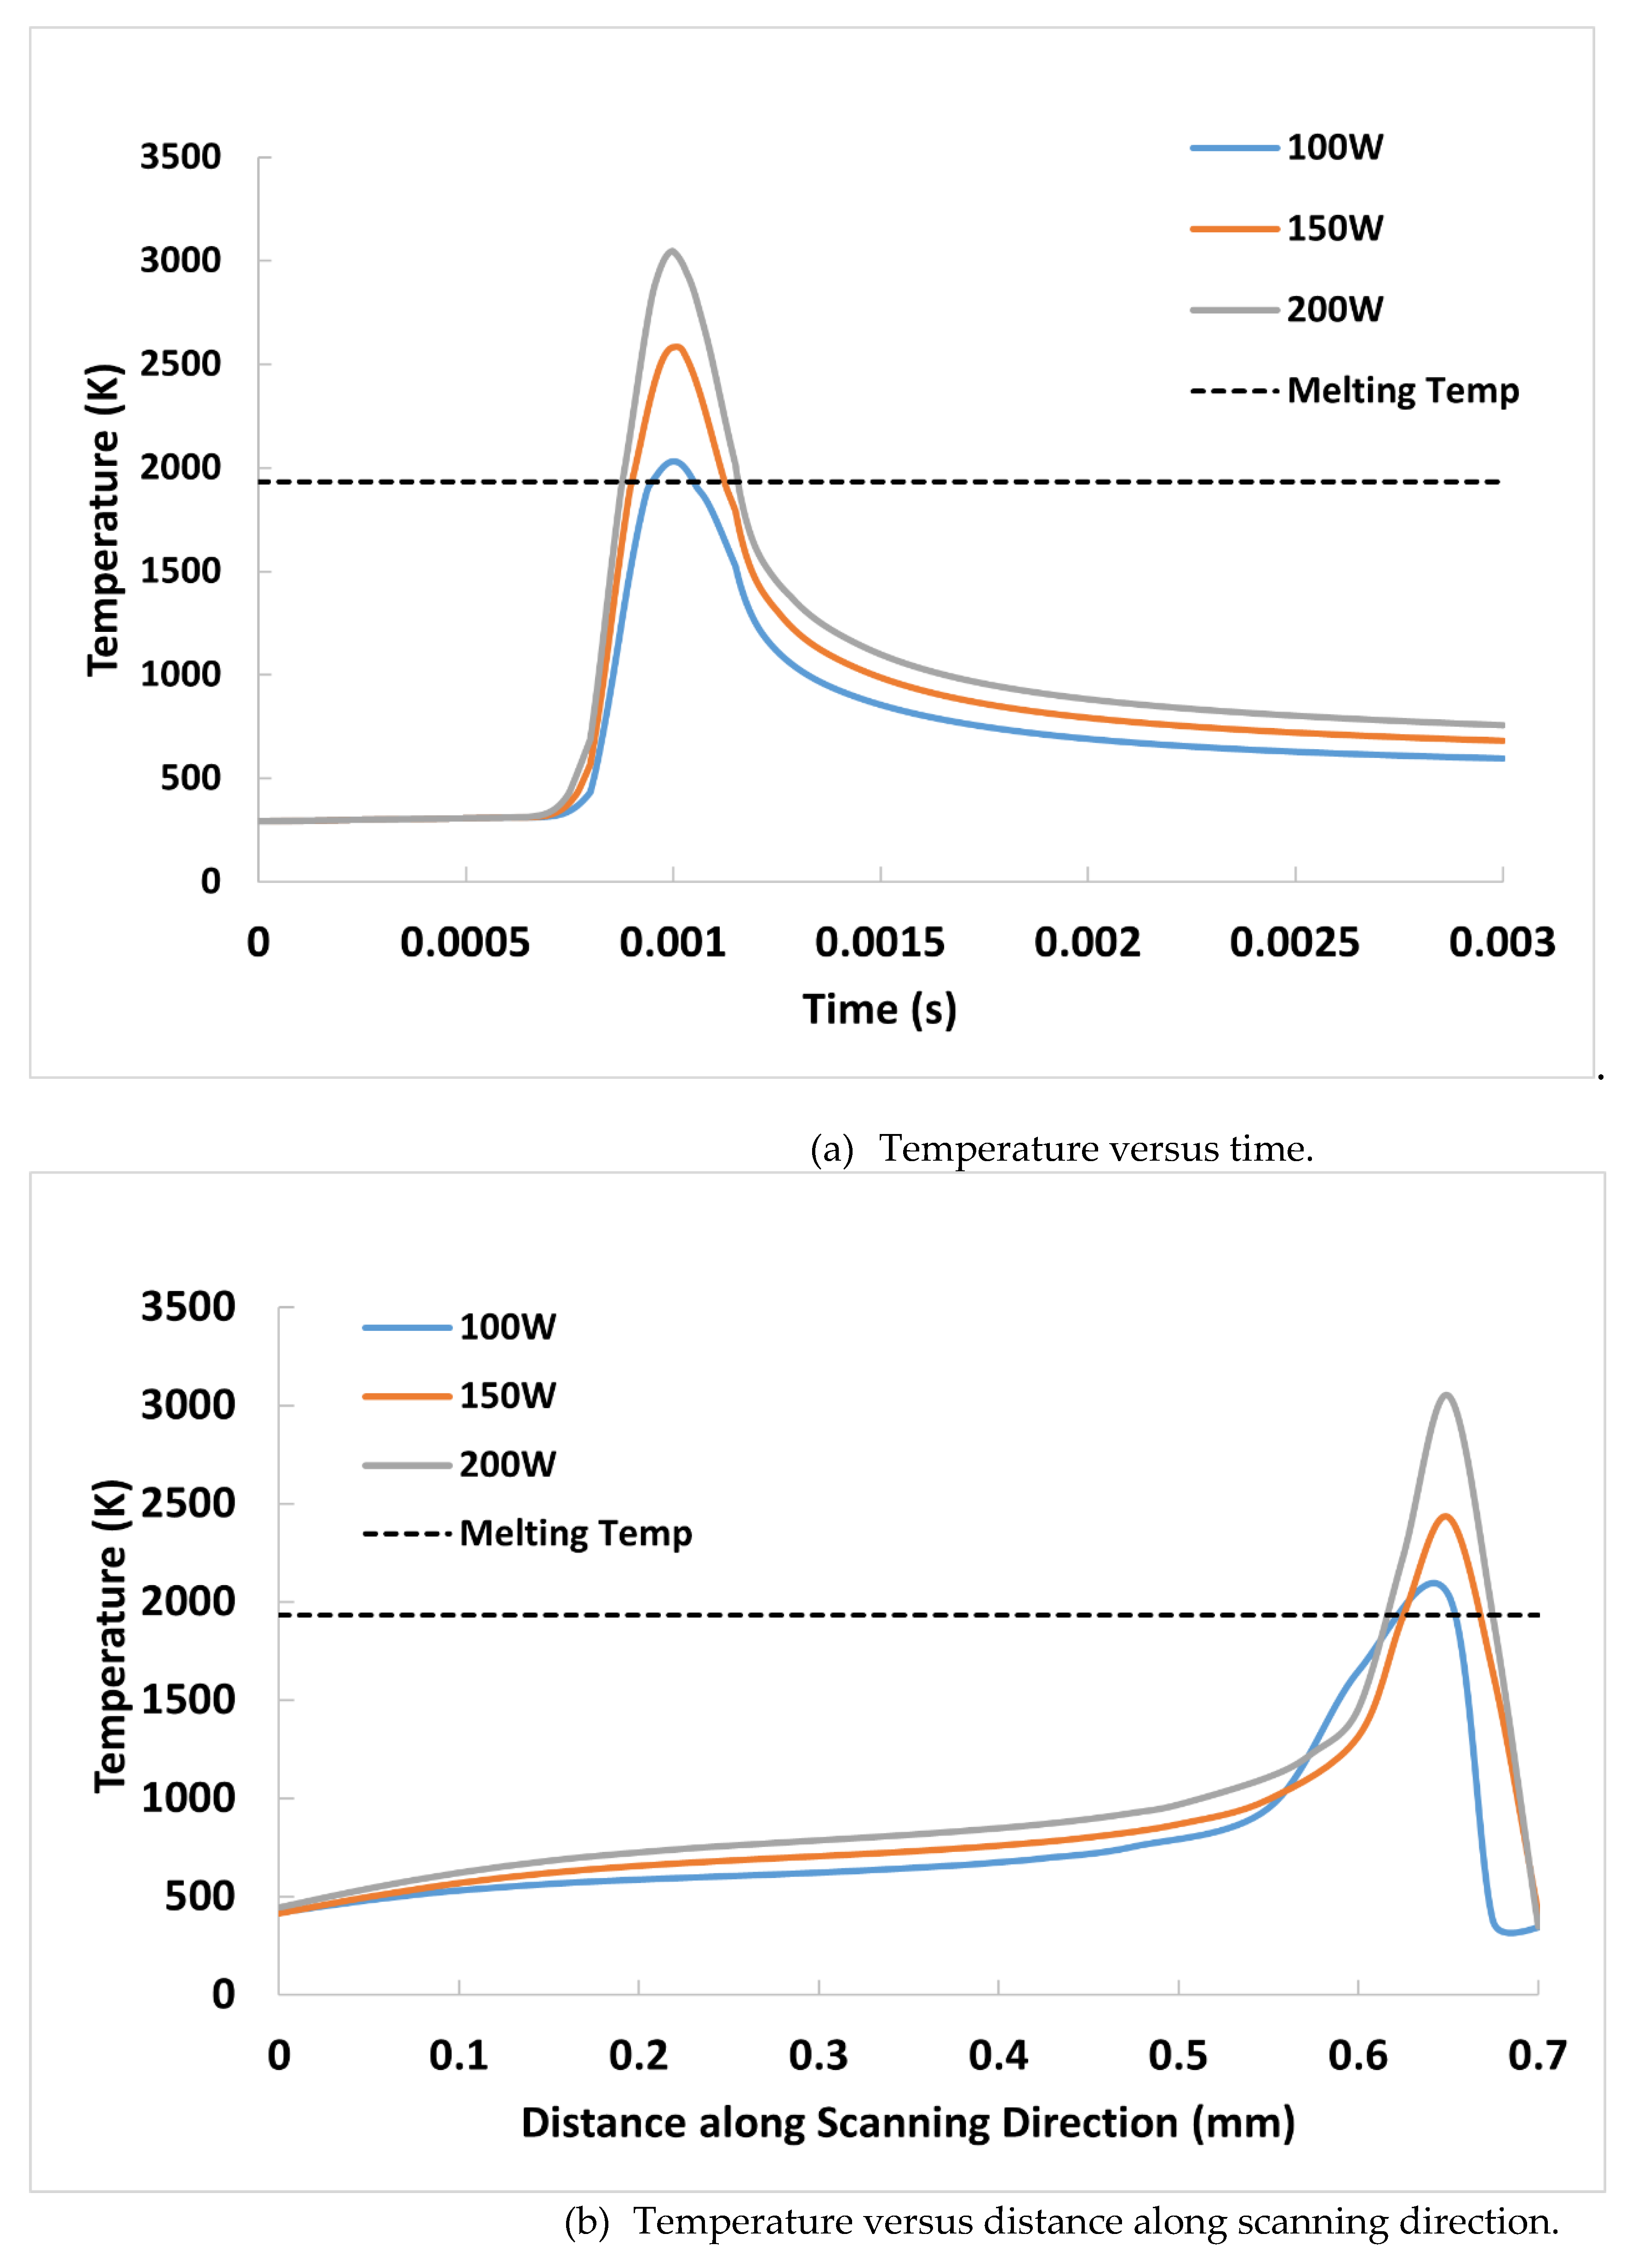
Figure 11.
Temperature distribution at t=1t = 1t=1 ms for different laser speeds. (a) Temperature versus time, showing how different scanning speeds affect the duration above the melting point. (b) Temperature versus distance along the scanning direction, illustrating the spatial temperature gradients for different scanning speeds.
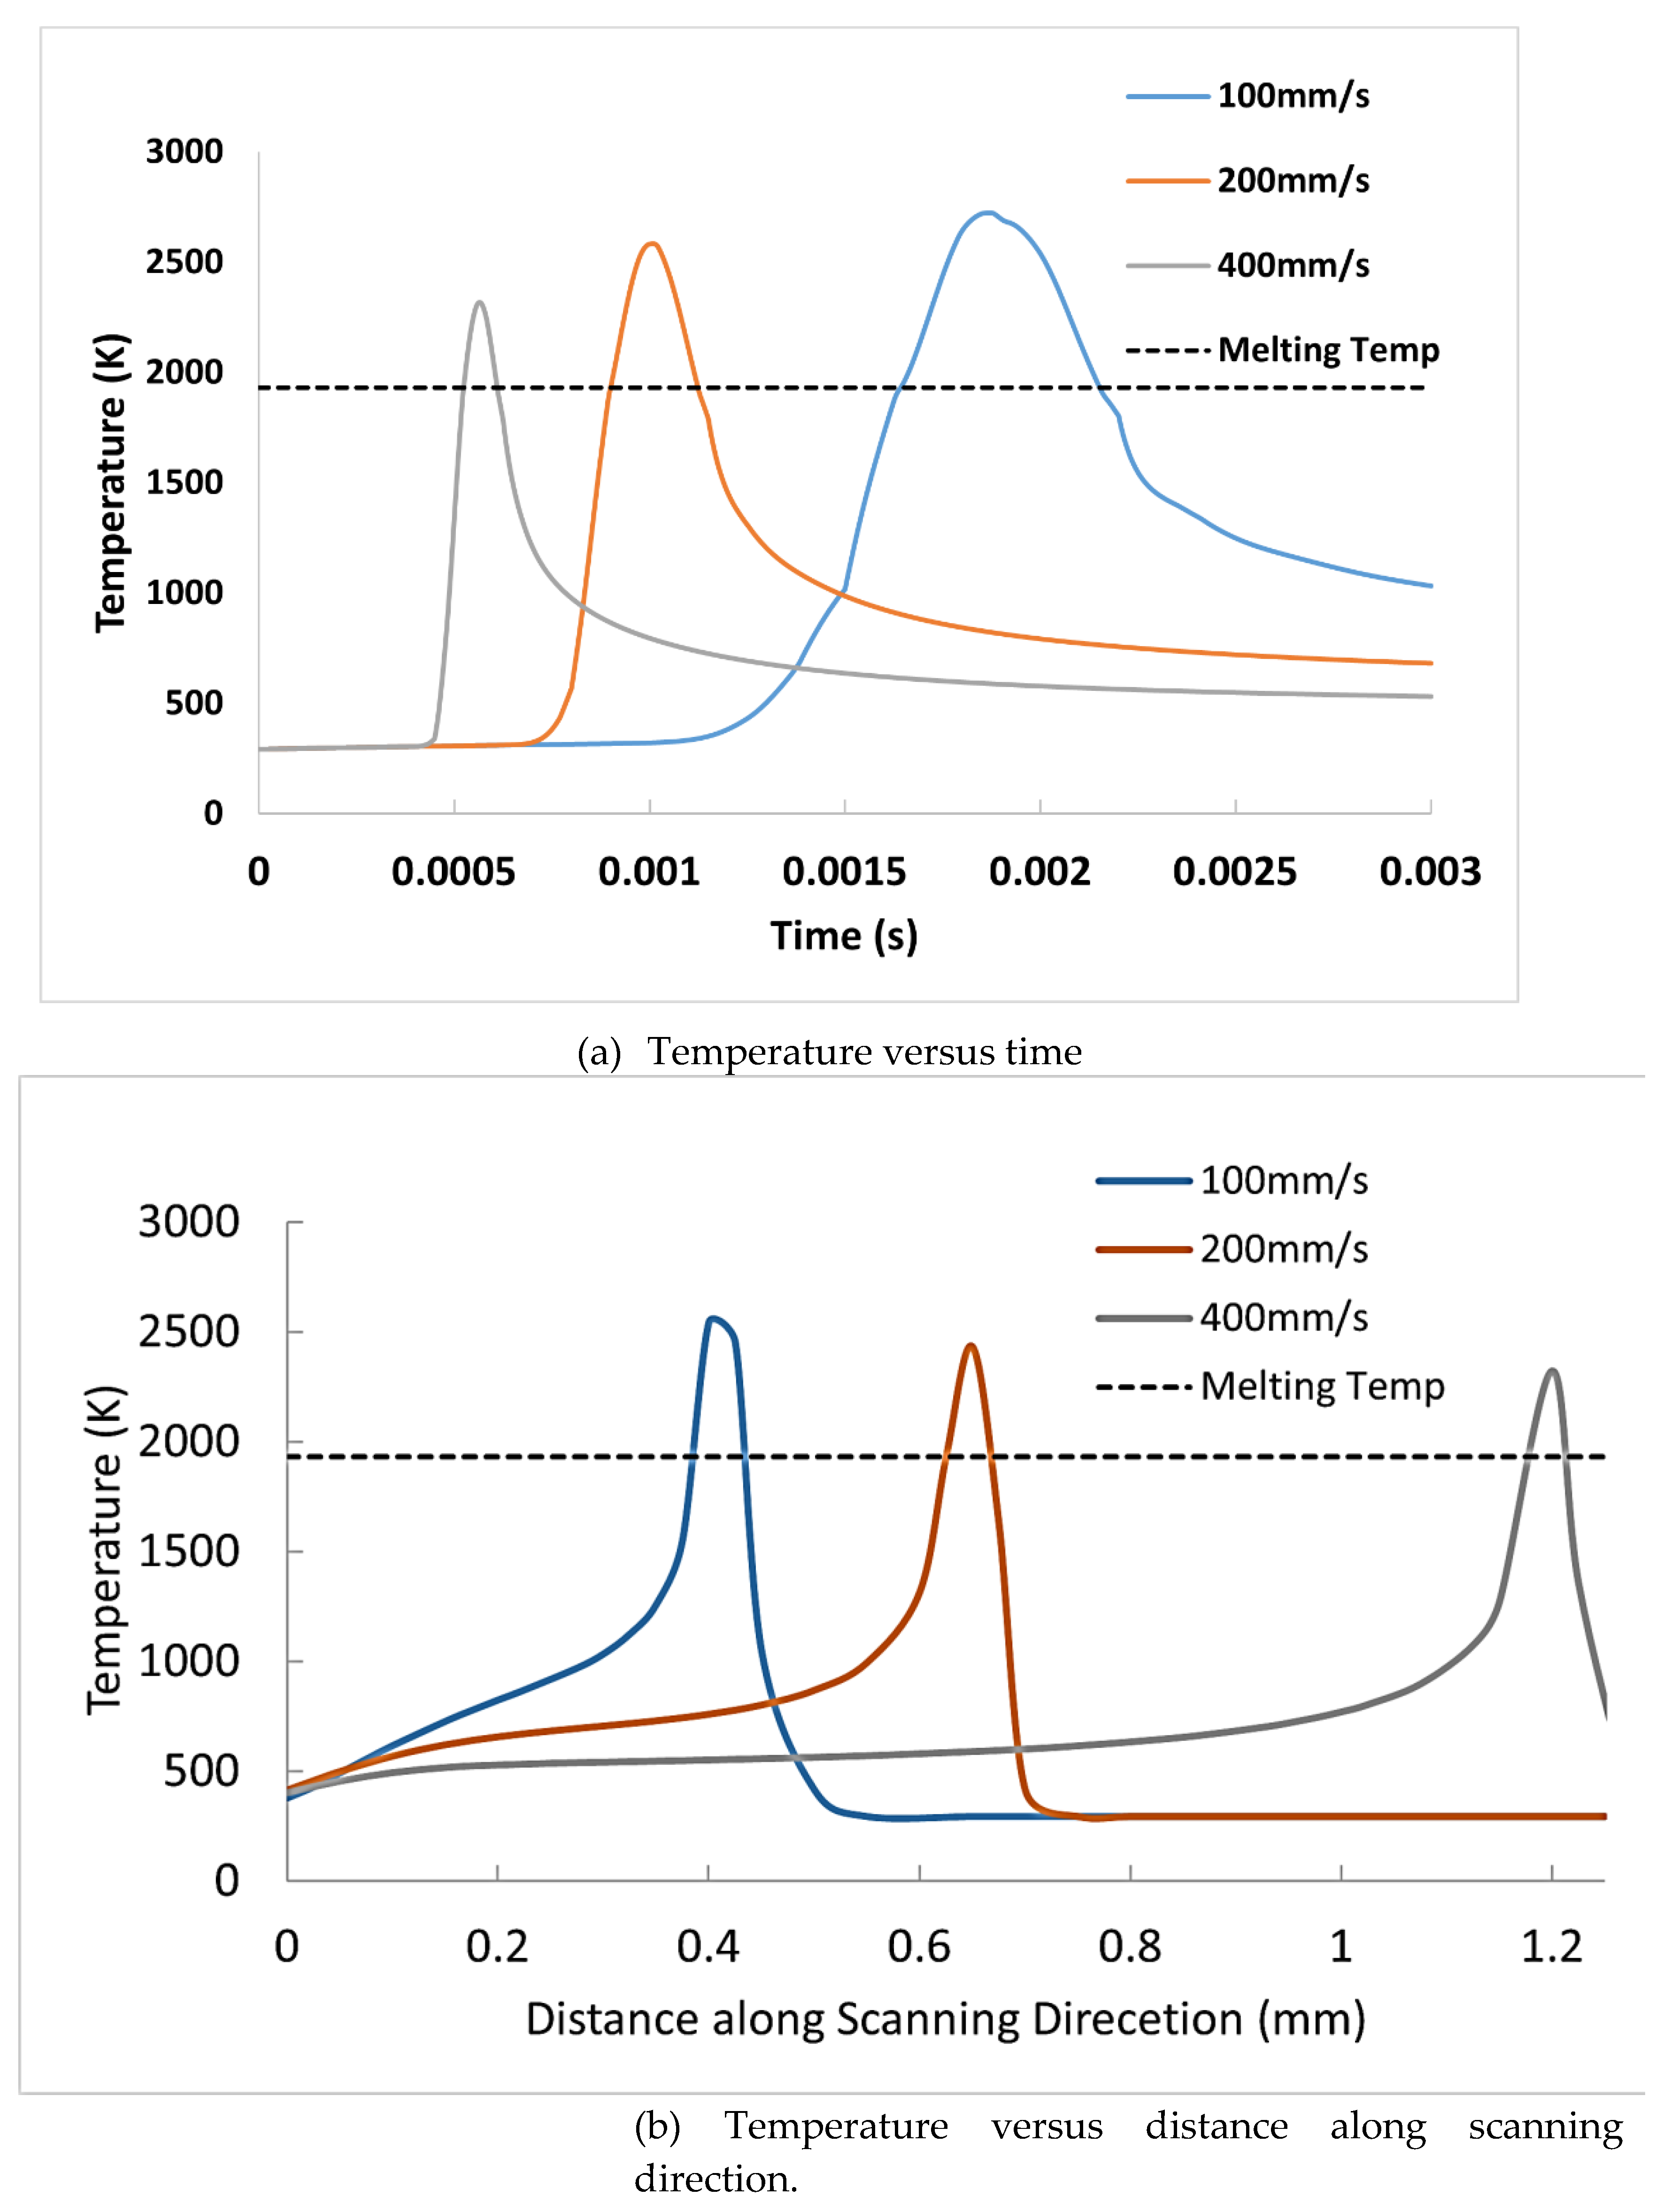
Figure 12.
Calculated melt pool dimensions with varying powers.
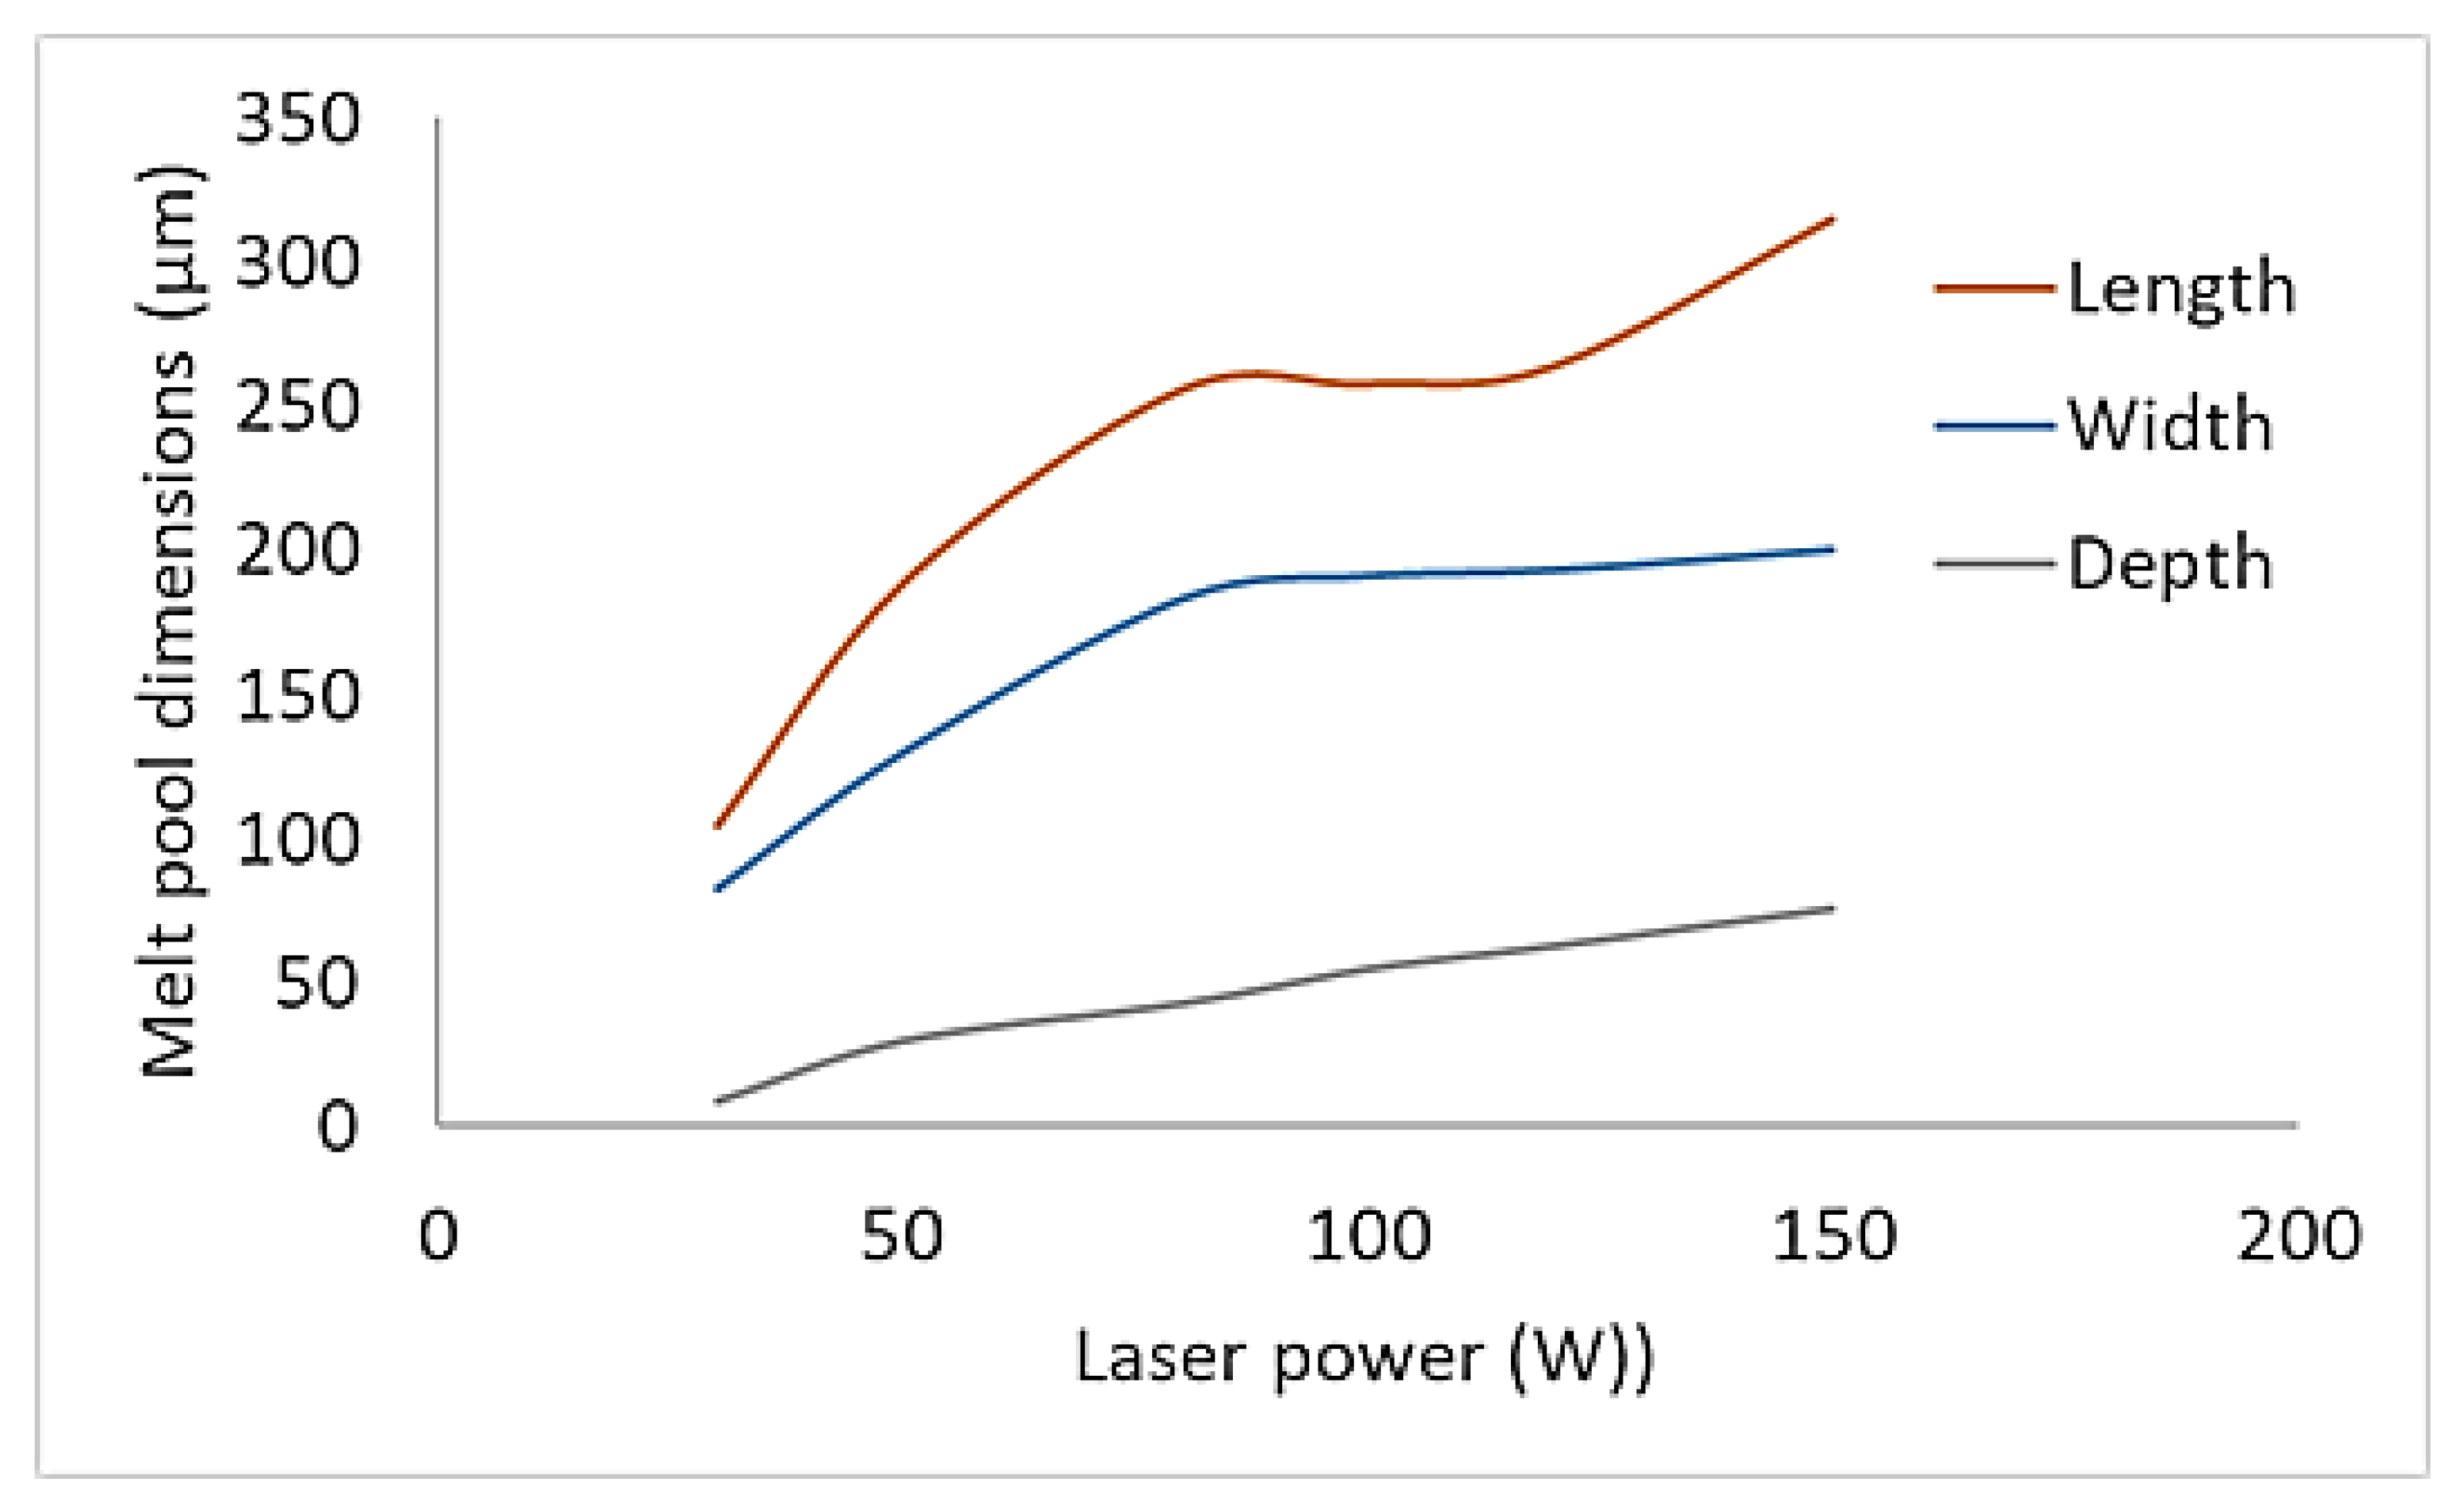
Figure 13.
Calculated melt pool dimensions with varying scanning velocities.


Table 1.
316L SS solid alloy thermo-physical properties with increasing temperatures.
| Temperature (K) | Density (kg·m^-3) | Specific Heat (J·kg^-1·K^-1) | Conductivity (W·m^-1·K^-1) |
|---|---|---|---|
| 298 | 7950 | 0.47 | 13.4 |
| 373 | 7921 | 0.49 | 15.5 |
| 473 | 7880 | 0.52 | 17.6 |
| 573 | 7833 | 0.54 | 19.4 |
| 673 | 7785 | 0.56 | 21.8 |
| 773 | 7735 | 0.57 | 23.4 |
| 873 | 7681 | 0.59 | 24.5 |
| 973 | 7628 | 0.6 | 25.1 |
| 1073 | 7575 | 0.63 | 26.2 |
| 1173 | 7520 | 0.64 | 27.3 |
| 1273 | 7465 | 0.66 | 29.3 |
| 1373 | 7411 | 0.67 | 29.3 |
| 1473 | 7361 | 0.7 | 30.9 |
| 1573 | 7311 | 0.71 | 31.1 |
| 1658 | 7269 | 0.72 | 29.0 |
| 1723 | 7236 | 0.73 | 28.5 |
| 1773 | 6881 | 0.83 | 29.5 |
| 1873 | 6765 | 0.83 | 30.5 |
Table 2.
Ti6AI4V solid alloy thermo-physical properties with increasing temperatures.
| Temperature (K) | Density (kgm⁻³) | Specific Heat (Jkg⁻¹K⁻¹) | Conductivity (Wm⁻¹K⁻¹) |
|---|---|---|---|
| 298.0 | 4420.0 | 546.0 | 7.0 |
| 373.0 | 4406.0 | 562.0 | 7.45 |
| 473.0 | 4395.0 | 584.0 | 8.75 |
| 573.0 | 4381.0 | 606.0 | 10.15 |
| 673.0 | 4366.0 | 629.0 | 11.35 |
| 773.0 | 4350.0 | 651.0 | 12.6 |
| 873.0 | 4324.0 | 673.0 | 14.2 |
| 973.0 | 4309.0 | 694.0 | 15.5 |
| 1073.0 | 4294.0 | 714.0 | 17.8 |
| 1173.0 | 4279.0 | 733.0 | 20.2 |
| 1268.0 | 4267.0 | 650.0 | 21.0 |
| 1373.0 | 4252.0 | 678.0 | 22.9 |
| 1473.0 | 4240.0 | 696.0 | 23.7 |
| 1573.0 | 4225.0 | 714.0 | 24.6 |
| 1673.0 | 4205.0 | 732.0 | 25.8 |
| 1773.0 | 4180.0 | 750.0 | 27.0 |
| 1873.0 | 4199.0 | 759.0 | 28.2 |
| 1923.0 | 3920.0 | 775.0 | 30.0 |
| 1923.0 | 3886.0 | 813.0 | 30.6 |
| 2073.0 | 3818.0 | 831.0 | 83.5 |
| 2173.0 | 3750.0 | 831.0 | 83.5 |
Table 3.
316L SS Model Validation Data.
| Power (W) | Melt Pool Width (µm) - Simulation | Melt Pool Width (µm) - Experiment | Absolute Error |
|---|---|---|---|
| 40 | 240 | 226 | 6% |
| 45 | 324 | 302 | 7% |
| 60 | 410 | 459 | 11% |
| 70 | 486 | 568 | 14% |
Table 4.
Simulation Parameters.
| Parameter | Value |
|---|---|
| Power (W) | 30 - 200 |
| Velocity (mm/s) | 50 - 600 |
| Beam Radius (mm) | 0.1 |
| Ambient Temperature (K) | 293 |
| Absorptivity | 0.3 |
Table 5.
Process maps showing combinations of processing parameters impact on (A) Max Temperature, (B) Melt Pool Widths and (C) Melt Pool Depths.
Table 5.
Process maps showing combinations of processing parameters impact on (A) Max Temperature, (B) Melt Pool Widths and (C) Melt Pool Depths.
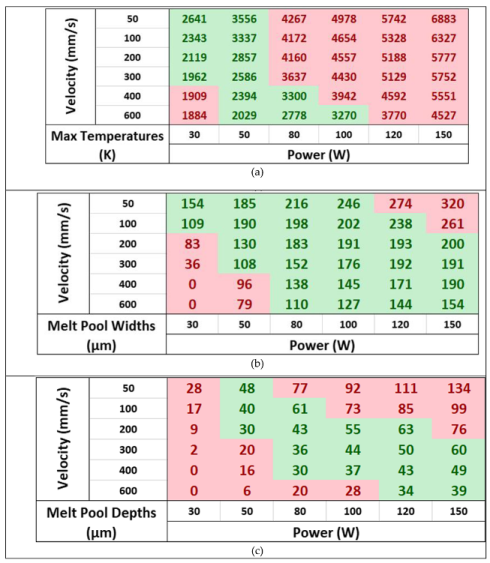
Table 6.
Energy density for varying processing parameters. Areas highlighted Red = 0 criteria met, Orange = 1 criteria met, Yellow = 2 criteria met, Green = all requirements met.
Table 6.
Energy density for varying processing parameters. Areas highlighted Red = 0 criteria met, Orange = 1 criteria met, Yellow = 2 criteria met, Green = all requirements met.
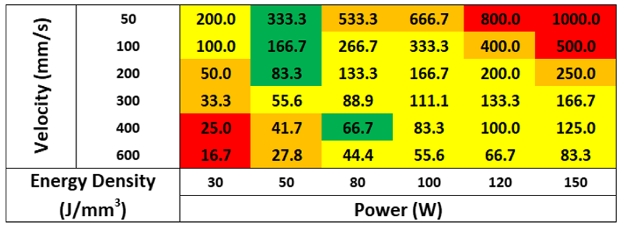
Disclaimer/Publisher’s Note: The statements, opinions and data contained in all publications are solely those of the individual author(s) and contributor(s) and not of MDPI and/or the editor(s). MDPI and/or the editor(s) disclaim responsibility for any injury to people or property resulting from any ideas, methods, instructions or products referred to in the content. |
© 2024 by the authors. Licensee MDPI, Basel, Switzerland. This article is an open access article distributed under the terms and conditions of the Creative Commons Attribution (CC BY) license (http://creativecommons.org/licenses/by/4.0/).
Copyright: This open access article is published under a Creative Commons CC BY 4.0 license, which permit the free download, distribution, and reuse, provided that the author and preprint are cited in any reuse.


