
Submitted:
13 August 2024
Posted:
14 August 2024
You are already at the latest version
Abstract
Inflammatory bowel diseases (IBD) involve chronic inflammation of the gastrointestinal tract, where effector CD4+ T-cells play a central role. Thereby, the recruitment of T-cells into the colonic mucosa represents a key process in IBD. We recently found that CCR9 and DRD5 might form a heteromeric complex on the T-cell surface. The increase of CCL25 production and the reduction in dopamine levels associated with colonic inflammation represent a dual signal stimulating the CCR9:DRD5 heteromer, which promotes the recruitment of CD4+ T-cells into the colonic lamina propria. Here, we aimed to analysing the molecular requirements involved in the heteromer assembly as well as to determining the underlying cellular mechanisms involved in the colonic tropism given by the stimulation of the CCR9:DRD5 complex. The results show that dual stimulation of the CCR9:DRD5 heteromer potentiates the phosphorylation of the myosin light chain 2 (MLC2) and the migration speed in confined microchannels. Accordingly, disrupting the CCR9:DRD5 assembly induced a sharp reduction in the pMLC2 in vitro, decreased the migratory speed in confined microchannels and dampened the recruitment of CD4+ T-cells into the inflamed colonic mucosa. Furthermore, in silico analysis confirmed that the interface of interaction of CCR9:DRD5 is formed by the transmembrane segments 5 and 6 from each protomer. Our findings demonstrated that the CCR9:DRD5 heteromeric complex plays a fundamental role in the migration of CD4+ T-cells into the colonic mucosa upon inflammation. Thereby, disassembling the formation of the CCR9:DRD5 represents an important therapeutic opportunity to treat IBD.
Keywords:
Dopamine
; chemokines
; T cell migration
1. Introduction
Inflammatory bowel diseases (IBD) form a group of chronic remittent inflammatory disorders of the gastrointestinal tract, among which Crohn’s disease (CD) and ulcerative colitis (UC) are the most common. The overall IBD prevalence is 0.5-0.9% of the general population, which has been increasing during the last decade [1]. Evidence from animal models and IBD patients has indicated that effector CD4+ T-cells, including the subsets Th1 and Th17, play a central role in this chronic inflammation [2]. Thereby, the recruitment of T-cells into the colonic mucosa represents a key process in IBD.
The C-C chemokine receptor 9 (CCR9) constitutes a key homing molecule that leads the recruitment of T-cells into the small intestine mucosa under homeostatic conditions [3]. Indeed, CCR9 plays an important role in oral tolerance by recruiting regulatory T-cells (Treg) into the small intestine lamina propria [4]. Nevertheless, the production of the endogenous CCR9 agonist, CCL25, is highly enhanced in the colonic mucosa upon inflammation, inducing the infiltration of CCR9+ inflammatory T-cells in the colonic lamina propria [5]. Thus, whereas CCR9 drives the trafficking of T-cells into the small intestine in the absence of inflammation, this molecule favours the infiltration of inflammatory lymphocytes into the colonic mucosa upon inflammation.
Importantly, the colonic mucosa represents one of the major sources of dopamine, a key regulator of inflammation [6,7]. Under homeostatic conditions, dopamine is found at high concentrations in the colonic mucosa [8,9,10], which might stimulate low-affinity dopamine receptors, including DRD1 and DRD2. The stimulation of both DRD1 and DRD2 has been associated with anti-inflammatory down-stream effects [11,12,13,14,15], thereby favouring immune tolerance. However, colonic dopamine levels are strongly decreased upon intestinal inflammation in IBD patients as well as in animal models [9,10]. This change in the concentration of colonic dopamine involves a switch in the dopamine receptors stimulated, favouring the selective stimulation of high-affinity dopamine receptors, including DRD3 and DRD5 [7,16]. Indeed, the DRD3-signalling on T-cells promotes the Th1 and Th17 function [17], while dampening the suppressive activity of Treg [18], thus favouring gut inflammation. Moreover, DRD5 stimulation potentiates the immunogenic profile of dendritic cells and favours Th17 responses [19,20,21], thereby contributing to inflammation too.
We recently found that CCR9 and DRD5 might form an heteromeric complex on the T-cell surface, which might sense both dopamine and CCL25 at the same time [22]. Of note, similar to other heteromeric receptors described [23], the down-stream signalling pathways triggered by the stimulation of the CCR9:DRD5 complex are different of those signalling pathways triggered by the non-assembled DRD5 and CCR9, thereby the heteromeric receptor represents an independent receptor triggering an unique biological effect different of that effects induced by the isolated forms of DRD5 and CCR9 [22]. This heteromeric complex is acquired by effector CD4+ T-cells as part of the gut tropism profile. Accordingly, the increase of CCL25 production and the reduction in dopamine levels associated with the colonic inflammation represent a dual signal stimulating the CCR9:DRD5 heteromer, which promotes the recruitment of CD4+ T-cells into the colonic lamina propria [22]. In this study, we aimed to analyse the molecular requirements involved in the heteromer assembly as well as to determining the underlying cellular mechanisms involved in the colonic tropism given by the stimulation of the CCR9:DRD5 complex.
2. Results
2.1. The Dual Stimulation of the CCR9:DRD5 Heteromer on Primary CD4+ T-Cells Increases Their Migratory Rate in Confined Microenvironments
The migratory ability of leukocytes in 3D tissues is highly related to the migratory speed in confined microchannels [24,25]. To evaluate whether the gut tropism given by the CCR9:DRD5 heteromer to CD4+ T-cells is associated with a higher migratory ability induced by the dual stimulation of this heteromer, we conducted in vitro migration assays using confined microchannels. To this end, we first determined the migratory speed of primary CD4+ T-cells in 3 μm width microchannels in response to increasing concentrations of CCL25. The results show that 50 ng/mL CCL25 already induced a significant increase in the migratory speed compared to the base migratory speed (Figure 1A). Next, we determined how was the migratory speed affected when dual stimulation of the heteromer was exerted. The results showed that either dopamine or the DRD5 agonist SKF81297 potentiated the migratory speed of primary CD4+ T-cells (Figure 1B). To address whether the speed potentiation observed in CD4+ T-cells when stimulated with CCR9 and DRD5 agonist was actually triggered by the CCR9:DRD5 heteromer, and not due to the individual stimulation of CCR9 and DRD5, we treated T-cells with a peptide able to disassemble the heteromeric receptor (TM6D) or with a control peptide (TM1D). The results show that, indeed, the speed potentiation exerted by CCL25 and SKF81297 was abrogated when the heteromer was disassembled (by TM6D), but not in the control situation (in the presence of TM1D) (Figure 1B). Thereby, these results represent causal evidence indicating that the dual simulation of the CCR9:DRD5 heteromer on CD4+ T-cells potentiates the migratory speed in confined microchannels.
2.2. The Dual Stimulation of the Heteromeric CCR9:DRD5 Complex Triggers the Activation of the Myosin II in Primary CD4+ T-Cells
Myosin IIA has been described to play a key role in optimizing the motility rate of T-cells in 3D confined microenvironments in vivo and in vitro [24]. To evaluate whether the signalling triggered by the CCR9:DRD5 heteromer is related to the activation of Myosin IIA, we next evaluated the phosphorylation of myosin light chain 2 (pMLC2) in CD4+ T-cells under the dual stimulation of CCR9 and DRD5. Indeed, the stimulation of T-cells with CCL25 and SKF81927 induced a high degree of phosphorylation of this protein (Figure 2A-B). Importantly, the pre-treatment of T-cells with the TM6C peptide, which disrupted the assembly of CCR9 with DRD5, strongly reduced the extent of pMLC2. Conversely, the pre-treatment of CD4+ T-cells with the peptide TM7C, which is irrelevant for CCR9:DRD5 assembly, did not affect the degree of pMLC2 induced by CCL25 and SKF81927 (Figure 2A-B). Thus, these results indicate that the dual stimulation of the CCR9:DRD5 heteromer triggers the activation of myosin IIA, which is essential for optimizing the migration of T-cells in vivo.
2.3. The CCR9:DRD5 Heteromer Plays a Critical Role in the Recruitment of CD4+ T-Cells into the Colonic Mucosa upon Inflammation
Our previous study revealed a higher degree of lymphocytes expressing the CCR9:DRD5 in the inflamed colonic mucosa compared with a healthy mucosa in human and animal models [22]. Due to the important role of the CCR9:DRD5 in triggering the activation of myosin IIA (Figure 2) and optimising the migratory ability of T-cells in confined microenvironments (Figure 1), we hypothesized that disassembling the CCR9:DRD5 heteromer should impair the recruitment of T-cells into the colonic mucosa upon inflammation in vivo. To address this possibility, we determined the infiltration rate of T-cells expressing the CCR9:DRD5 heteromer into the inflamed colonic mucosa when the heteromer formation was disrupted by the TM6C peptide compared with a control peptide that does not affect the heteromer assembly (TM7C). Accordingly, after imprinting gut tropism in CD4+ T-cells, they were treated with the experimental peptides (TM6C, TM7C, or vehicle) and then i.v. transferred into Drd5-/- recipient mice undergoing DSS-induced colitis. Three days later, the extent of heteromer+ cells was quantified in the colonic mucosa by in situ PLA assay. The results show a lower extent of heteromer+ T-cells reaching the colonic mucosa when the CCR9:DRD5 assembly was disrupted (using the TM6C peptide). However, the treatment of T-cells with a non-disrupting peptide (TM7C) did not affect the degree of heteromer+ T-cells reaching the colonic mucosa compared to T-cells treated with the vehicle (DMSO) (Figure 3). Of note, we confirmed that these peptides (see table S1) stayed in T-cells stably in the time (Figure S1), did not kill the cells [22], and did not affect CCR9 expression (Figure S2) at the concentration used (4 μM). Thereby, together these results indicate that the assembled CCR9:DRD5 complex is required on CD4+ T-cells to lead to the infiltration of these cells into the colonic mucosa upon inflammation.
2.4. Analysing the Individual Contribution of Transmembrane Segments Involved in the Interface of the CCR9:DRD5 Heteromer to the Molecular Interaction
Afterwards, we studied the molecular interaction of CCR9 and DRD5 in silico. To explore a mechanistic model for the interaction between CCR9 and DRD5, we performed a series of non-equilibrium dynamic simulations to pull away specific TM segments of one protein from the other interacting protein. We measured the distance between the proteins and the force exerted during the simulations. Because the pulling force was applied in the form of an umbrella potential, the separation was not immediate. During the initial phase of the simulation, the force accumulated as it was opposed by the binding force between the intact protein and the TM being pulled away. At a certain point, the pulling force surpassed the intermolecular force, breaking the interactions between the proteins. We refer to this moment as the transition point, after which the TM was pulled away from the other protein linearly, following the rate defined in the simulation (5 nm/ns). The simulation continued until the force reached the defined value (1,000 kJ/mol·nm²) and maintained a pseudo-equilibrium. To compare the behaviour of each TM being pulled away, we measured three parameters: the change in distance before the transition point, the time when the transition point was reached out, and the maximum force exerted near the transition point (Figure S3).
When DRD5 TMs were pulled away from the intact CCR9, TM5D and TM6D were more difficult to separate than the control TM1D, which is not experimentally involved in the interaction [22]. For TM5D and TM6D, the transition point was reached at later times, and the maximum force exerted was higher than the force needed to separate TM1D (Figure 4B-C). The change in distance before the transition point did not show a clear result, likely due to the instability of the binding of TM1D to CCR9, resulting in noisy data (Figure 4A). While unspecific interactions might explain this variability, it is evident that the interactions between TM5D/TM6D and CCR9 are stronger than those involving TM1D at the moment of transition.
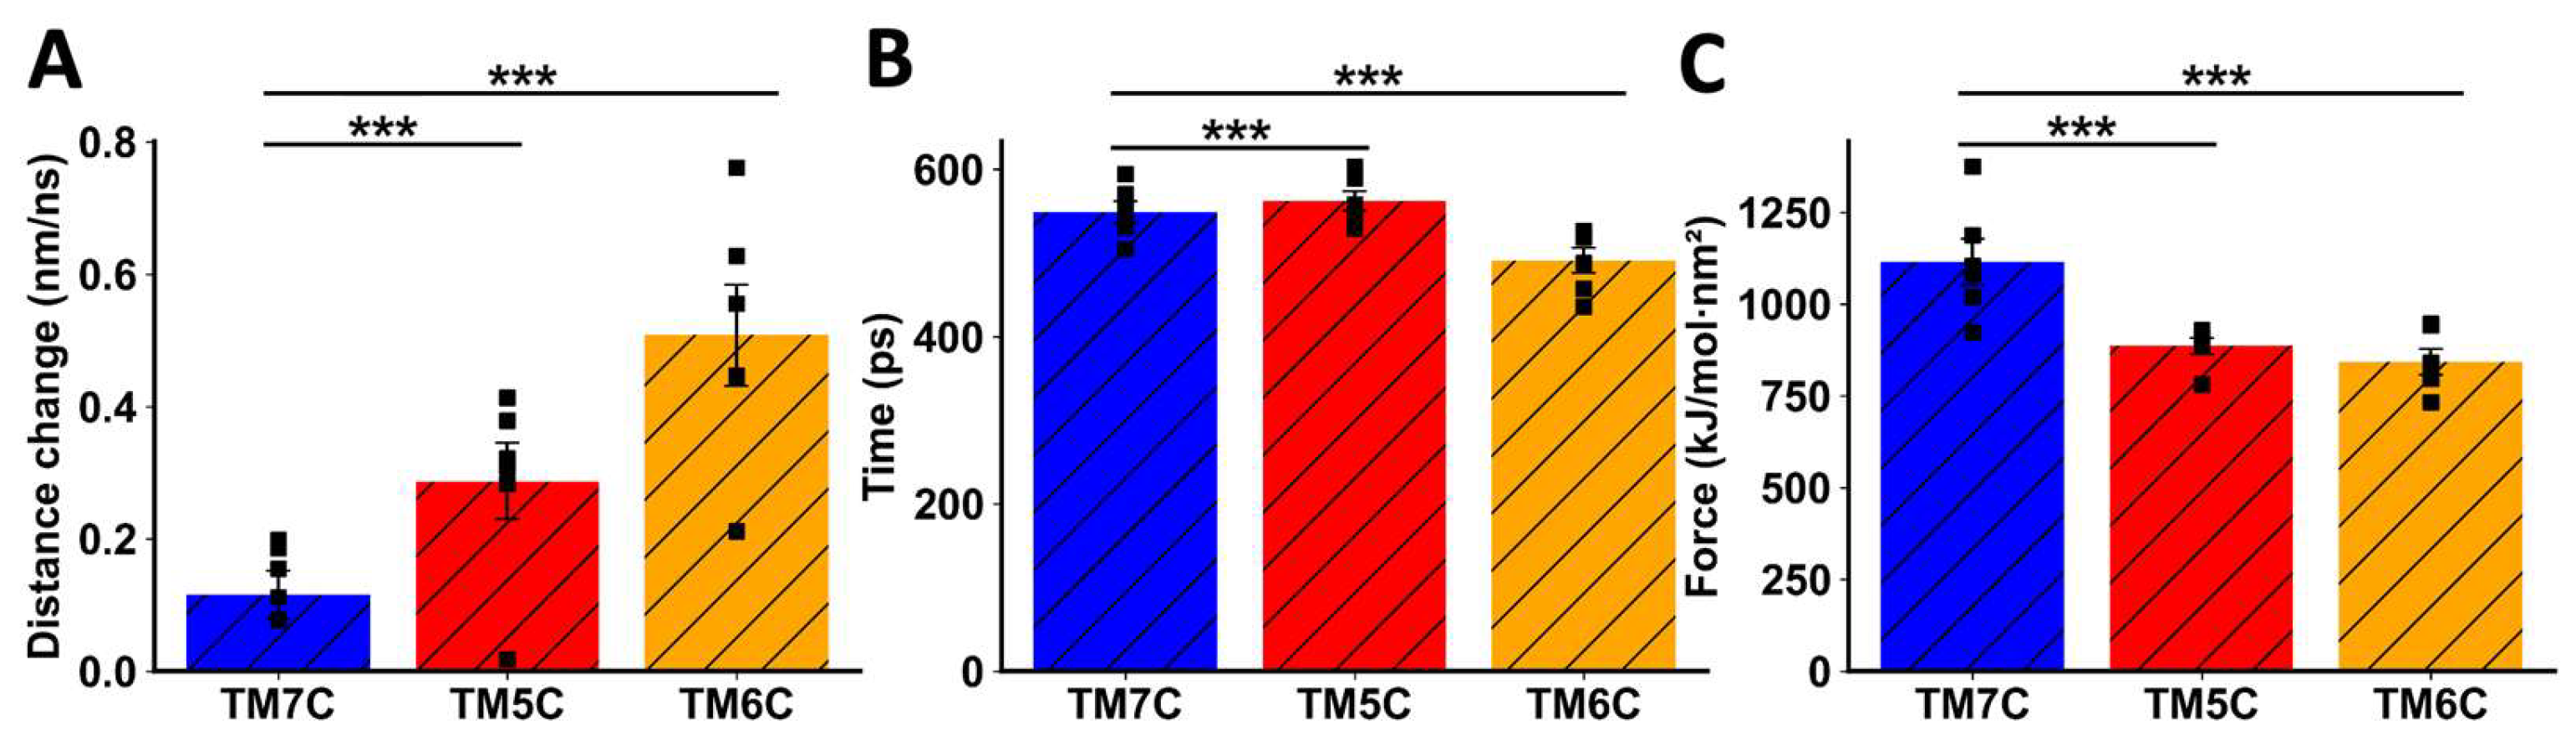
When TMs from CCR9 were pulled away from DRD5, we also observed a clear difference between TM5C and TM6C and the control TM7C. The change in distance before transition was much greater for TM7C (Figure 5A), indicating weaker interactions. The transition point for TM7C was reached almost 100 ps earlier than for the other TMs (Figure 5B). Additionally, the maximum force exerted was higher for TM5C and TM6C compared to TM7C (Figure 5C). Altogether, these results obtained by in silico analysis suggest that TM5 and TM6 from CCR9 and DRD5 are involved in the interacting surface of the CCR9:DRD5 heteromer.
3. Discussion
It has been described that the acto-myosin cytoskeleton mediates force generation and protrusion during motility which is exerted by actin polymerization and class II myosin contraction of the actin network [26,27,28]. Non-muscle myosin IIA has been shown to play a critical role in regulating optimal T-cell ameboid motility [29]. This protein is the only class II myosin expressed in mouse T cells and is regulated during lymphocyte arrest induced by TCR stimulation [30]. Moreover, myosin IIA activity also plays an important role in inducing uropodal detachment from highly adhesive surfaces such as ICAM-1 coated substrates [31,32]. Of note, the dynamics of myosin II are regulated by the phosphorylation of MLC2 [33]. Importantly, we observed here that the dual stimulation of the CCR9:DRD5 heteromeric complex triggers the phosphorylation of MLC2. Thereby, our results indicate that the CCR9:DRD5 heteromer is a key regulator of the migratory ability of T-cells.
CCR9 and DRD5 are GPCRs. Originally it was thought that GPCRs work as monomeric molecules, nevertheless, it is currently accepted that these receptors are generally found as homo- or hetero-oligomers [34]. Evidence has shown that heteromerization is selective: a particular GPCR can form heteromers just with some GPCR partners but not with others. Thus, during the past decade an increasing number of studies, performed mainly in the nervous system, reported heteromerization between different couples of GPCRs to form oligomers [35]. Compared with GPCRs homomers, the assembly of GPCRs heteromers leads to changes in the identity and affinity for agonist recognition, in the signalling coupled, and in the trafficking of participating receptors, thus strongly affecting their physiological function. An interesting example is the heteromer formed by the adenosine receptor A2A (A2AR) and the DRD2, which can bind two different ligands. In this case, the binding of A2AR agonists to the A2AR:DRD2 heteromer induces a conformational change resulting in a reduction of DRD2 affinity for dopamine or DRD2-agonists and in a change in the coupling of DRD2 from Gi/o- to β-arrestin2-MAPK mediated signalling [23]. Thus, this and many other examples in the literature illustrate how GPCRs heteromers involve complex interactions at the level of signalling and ligand affinity which can induce a final physiological outcome quantitatively and qualitatively different from those exerted by the corresponding protomers forming homomers.
With regard to the participation of DRD5 in the formation of heteromers, only DRD5:DRD1 [36] and DRD5:DRD2 [37,38] heteromers have been described so far. DRD5:DRD1 heteromer is present in the kidney where, by coupling to the Gq-PLC-IP3 pathway, it plays a regulatory role in renal sodium transport [36]. On the other hand, DRD5:DRD2 heteromer stimulation involves the activation of the Gq-PLC-IP3 pathway in the nucleus accumbens, probably regulating the acetylcholine release [37,38]. We recently described that DRD5 might form a heteromeric complex with CCR9, but not with CXCR4 [22]. We found that this heteromeric complex is acquired by CD4+ T-cells as part of the intestinal tropism profile, which allows these cells to be recruited into the colonic lamina propria upon inflammation [22].
CCR9 and α4β7 have been previously described to be essential for the recruitment of T-cells upon colon inflammation [5,39]. For this reason, these homing molecules have taken the attention as molecular targets for the development of treatments for both CD and UC. Indeed, several drugs and humanized antibodies designed to break the CCR9-CCL25 and α4β7-MadCAM-1 interactions have been developed as therapeutic approaches for CD and UC [40,41]. However, these treatments attenuate the trafficking not only of effector T cells, but also of Treg. Indeed, these molecules are necessary for the recruitment of Treg to the small intestine upon homeostatic conditions, a mechanism that involves the generation of oral tolerance [4]. Conversely, the CCR9:DRD5 heteromer seems to be exclusively involved in the infiltration of CD4+ T-cells in the colonic mucosa upon inflammation, and not in homeostatic conditions, as Drd5-/- mice do not develop issues associated with food allergy [22].
Regarding the molecular characterisation of the interacting interphase of the CCR9:DRD5 heteromer, our in silico approach used here indicates that TM5 and TM6 from CCR9 and DRD5 are involved in the interacting surface of the CCR9:DRD5 heteromer. These results agree with our previous results obtained with a battery of peptides analogue to the TM segments from CCR9 and DRD5 where the disruption of the CCR9:DRD5 assembly was determined using a bimolecular complementation assay [22].
Importantly, our results show that disrupting the CCR9:DRD5 assembly induced a sharp reduction in the pMLC2 in vitro and a marked inhibition in the recruitment of CD4+ T-cells into the colonic mucosa in mice undergoing inflammatory colitis. Thereby, disassembling the formation of the CCR9:DRD5 represents an important therapeutic opportunity to treat IBD. These findings encourage the design of non-digestible drugs (i.e., small molecules) for targeting the assembly of this heteromeric complex as treatment of IBD.
4. Materials and Methods
4.1. Mice
Wild-type C57BL/6 (WT; Drd5+/+) mice were obtained from The Jackson Laboratory. C57BL/6 Drd5-/- mice were kindly donated by Dr. David Sibley [42]. Mice from 6 to 10 wk were used in all experiments. All procedures performed in animals were approved by and complied with regulations of the Institutional Animal Care and Use Committee at Fundación Ciencia & Vida.
4.2. Reagents
Monoclonal antibodies (mAbs) for flow cytometry: anti-α4β7 (clone DATK32) conjugated to PE and anti-CCR9 (clone CW.1.2) conjugated to AlloPC or to AlloPC-Cy7 were obtained from eBioscience (San Diego, CA, USA). Anti-CD4 (clone GK1.5) conjugated to AlloPC and AlloPC-Cy7; anti-CD25 (clone PC61) conjugated to Fluorescein isothiocyanate (FITC); anti-CD44 (clone IM7) conjugated to PE; anti-CD62L (clone MEL14) conjugated to AlloPC-Cy7; and anti-TCR β chain (clone H57-597) conjugated with PerCP/Cy5.5 were purchased from Biolegends (San Diego, CA, USA). mAbs for Cell Culture: the followings mAbs low in endotoxins and azide free were purchased from Biolegend: anti-CD28 (clone 37.51) and anti-CD3ε (clone 145-2C11). The rabbit anti-phospho Ser19 MLC2 mAb (pMLC2; clone 3671) was obtained from Cell Signaling Technology (Beverly, MA). Carrier-Free CCL25 was purchased from Biolegend. IL-2 was obtained from PreproTech (Rocky Hill, NJ, USA). Zombie Aqua (ZAq) Fixable Viability dye detectable by flow cytometry was purchased from Biolegend. Retinoic acid (RA) was purchased from Sigma-Aldrich (San Luis, MO, USA). Fetal Bovine Serum (FBS) was obtained from Life Technologies (Carlsbad, CA, USA). The peptide analogues to transmembrane (TM) segments derived from CCR9 and DRD5 (Table S1) were synthesized by GenScript (Piscataway, NJ, USA). Anti-CD3/anti-CD28 conjugated dynabeads were purchased from Thermo Scientific. Bovine Serum Albumin (BSA) was purchased to Rockland (Limerick, PA, USA). Dextran Sodium Sulphate (DSS) was obtained from TdB Labs (Uppsala, Sweden). All tissue culture related reagents were bought from Life Technologies. SKF81297 was obtained from Tocris (Bristol, UK).
4.3. Flow Cytometry Analysis of CD4+ T-Cell Phenotypes
Cells were stained with ZAq Fixable Viability kit, followed by fluorochrome-conjugated mAbs specific to cell-surface markers in PBS containing 2% FBS for 30 min. Surface markers analysed included α4β7, CCR9, CD3, CD4, CD25, CD44, CD62L, and TCRβ. Afterwards, cells were fixed with 1% paraformaldehyde in phosphate-buffered saline (PBS, Na2HPO4 8.1 µM, KH2PO4 1.47 µM, NaCl 64.2 mM, KCl 2.68 mM, pH 7.4) for 15 min at room temperature, washed twice with PBS, and analysed in a flow cytometer. To analyse the phosphorylation of MLC2, after the immunostaining of surface markers, cells were fixed and permeabilised using the Foxp3 Fix/Perm buffer (Bioleged) instead fixing with paraformaldehyde. Cells were then incubated with the rabbit anti-pMLC2 mAb (1:100) at 4ºC for 1 h, followed by incubation with FITC-conjugated anti-rabbit IgG Abs (Santa Cruz Biotechnology, Santa Cruz, USA) at 4ºC for 1 h. Non-specific rabbit Ig followed by the secondary FITC-conjugated anti-rabbit IgG Ab were used as controls. Data were collected with a Canto II (BD) and results were analysed with FACSDiva (BD) and FlowJo software (Tree Star, Ashlan, OR, USA).
4.4. Imprinting Gut Tropism in CD4+ T-Cells Ex Vivo
Naïve (CD3+ CD4+ CD44- CD62L+) T-cells were isolated from the spleen of WT (Drd5+/+) mice by cell sorting using a FACS Aria II (BD), obtaining purities over 98%. Gut tropism was imprinted by activation of T-cells in the presence of RA and IL-2 as described before [43]. Briefly, naïve T-cells were resuspended (106 cells/ml) in RPMI1640 medium containing 10% FBS, 2 mM L-glutamine, 1% Penicillin/Streptomycin, MEM Non-Essential Amino Acids 1X and Sodium Pyruvate 1X, gentamicin 50 µg/ml and β-mercaptoethanol 1 µg/mL. Cells were activated with anti-CD3/CD28 coated dynabeads at a beads:cells ratio of 1:1 in the presence of 100 nM all-trans RA and 1000 U/mL recombinant mouse IL-2 for 5 days. Viability and gut tropism were routinely confirmed after 5 d of culture by staining with ZAq Fixable Viability kit and CCR9 and α4β7 immunostaining followed by flow cytometry analysis.
4.5. T-Cell Migration in Microchannels
Naïve CD4+ T-cells were isolated from the spleen of WT mice and incubated in conditions to induce gut-tropism (see above). CCR9+ cells were purified from CD4+ T-cells bearing gut tropism using a cell-sorter. Lymphocytes were incubated with or without TM analogue peptides (4 μM) for 4h and then the median speed of cells was determined in microchannels as described before [44]. Briefly, 5 μL of cells suspension (107 cells/mL) was loaded into a fibronectin (10µg/ml)-coated chip of poly-dimethylsiloxane containing several 3 μm-diameter micro-channels. After 30 min of incubation at 37ºC, 90% humidity and 5% CO2, 2 mL of complete culture medium containing IL-2 (100 U/ml), CCL25 (0 - 200 ng/mL) and dopamine (0 - 1 μM) or SKF81297 (0 - 1 μM) were added. Afterwards, cell phase contrast images were recorded during 10 h with 8 min time-lapses using an automated microscope (Nikon ECLIPSE TE1000-E, and Olympus X71, with a Marzhauser motorized stage and an HQ2 Roper camera) equipped with an environmental chamber to control temperature (37ºC), humidity (90%) and CO2 (Life Imaging Services). The analysis of migration parameters was performed using an ImageJ Fiji-based script.
4.6. Dextran Sodium Sulphate-Induced Acute Inflammatory Colitis
Drd5-/- mice were treated with 1.75% DSS in the drinking water for six days. Three days after the beginning of DSS treatment, mice received an i.v. injection of Drd5+/+ CD4+ T-cells (6x10⁶ total cells per mouse). Seventy-two hours later, mice were sacrificed and colonic tissue was collected for further analysis.
4.7. In Situ Proximity Ligation Assay
Colonic sections of mice undergoing inflammatory colitis were used to analyse the CCR9:DRD5 heteromer in situ by proximity ligation assay (PLA). Tissue sections were fixed in 4% paraformaldehyde for 15 min, washed with PBS containing 20 mM glycine to quench the aldehyde groups and permeabilized with the same buffer containing 0.05% Triton X-100 for 15 min. Primary antibodies recognising CCR9 (rabbit anti-CCR9; 1:100 dilution; purchased from Invitrogen) and DRD5 (mouse mAb anti-DRD5; 1:100 dilution; purchased from Invitrogen) were used with the Duolink In Situ Red Starter Kit Mouse/Rabbit (Sigma-Aldrich) according to the manufacturer instructions. Nuclei were stained with Hoechst (1:200 dilution; purchased from Sigma-Aldrich). Coverslips were mounted using mowiol solution. Samples were observed in a Leica SP2 confocal microscope (Leica Microsystems, Mannheim, Germany) equipped with an apochromatic 63X oil-immersion objective (N.A. 1.4), and 405 nm and 561 nm laser lines. For each field of view a stack of two channels (one per staining) and 3 to 4 Z stacks with a step size of 1 µm were acquired. Quantification of cells containing one or more red spots versus total cells (blue nucleus) was determined using the ImageJ software (from the National Institute of Health, Bethesda, MD).
4.8. Protein Modeling
The sequence of murine proteins were extracted from Uniprot (Q8BLD9 for DRD5; Q9WUT7 for CCR9). Structures were obtained from modeling, using Modeller v10 [45]. For murine CCR9, the human CCR9 structure was used as template (5LWE [46]) which allowed to model the segment 32-344. Since extracellular loop 2 (ECL2) was not resolved in the template structure, then it was modelled using human proteins CXCR4 (3ODU [47]) and CCR5 (4MBS [48]) as templates for this loop. For murine DRD5, several Meleagris gallopavo β1 adrenergic receptor structures were used as templates (2Y00 [49]; 2VT4 [50]; 5A8E [51]; and 4BVN [52]) which allowed to model the segment 30-369 (including missing loops ECL2 and intracellular loop 3, ICL3).
4.9. Heterodimer Modeling
Previous results had shown that TM5 and TM6 of both G protein-coupled receptors (GPCRs) were involved in the interaction surface. Structural alignment with the experimental structure of μ-opioid receptor dimer (4DKL [53]) was used to identify possible interacting residues between DRD5 and CCR9, because this dimer also interacts through their TM5 and TM6. The selected residues were used to feed the HADDOCK2.2 server [54], as experimental restraints, and then 10,000 heterodimer models were obtained. Using HADDOCK filters and visual inspection a final DRD5-CCR9 dimer model was chosen.
4.10. Equilibrium Simulation
The DRD5:CCR9 complex was uploaded to CHARMM-GUI server [55] to embed it in a POPC bilayer and a 17 x 17 x 14 nm box of solvent (TIP3P water and 150 mM NaCl). Recommended CHARMM-GUI protocol was used to relax the system using molecular dynamics. The program GROMACS 2022 [56] was used and the CHARMM36 forcefield [57] to describe the system. Roughly, it consists in adding a position restraint for specific atoms, and then gradually reducing these restrictions until they become zero. In all simulations, a timestep of 2 femtosecond was used and PME was used to calculate long-range electrostatic interactions. In the final steps of equilibration, an NPT ensemble was used, at 310.15 K and 1 atm of temperature and pressure, respectively. Finally, a production simulation was performed without any restriction, for 500 ns at NPT ensemble.
4.11. Non-Equilibrium Simulation
The final structure from the production simulation served as a template for building several new structures, where one protein remained intact and the other was trimmed to include only one TM segment. Six structures were constructed: CCR9–TM1D, CCR9–TM5D, CCR9–TM6D, DRD5–TM5C, DRD5–TM6C, and DRD5–TM7C. TM5C/D and TM6C/D form the interface of the heterodimer, while TM1D and TM7C were used as controls. Please note that sequences for TM segments used for in silico analyses are the same sequences for peptides shown in table S1 but without the TAT peptide (shown in red) and without changing cysteines with serines (shown in green). These new protein systems were re-embedded in a similar bilayer and solvent box as before, in order to accommodate lipids surrounding the TM segments, creating a new 14 x 23 x 14 nm box using the InflateGRO methodology [58]. Non-equilibrium pulling simulations were performed using GROMACS 2022 with an umbrella pulling protocol. The TM segment was pulled away from its protein partner, which was held in place with position restraints on the main chain atoms. The simulation ran for 750,000 steps with a pull rate of 5 nm/ns and a force constant of 1,000 kJ/mol·nm².
4.12. Statistical Analysis
Comparison between multiple groups was analysed using 1- or 2-way ANOVA with peptide treatment or ligand treatment as the independent factor. When ANOVA showed significant differences, pair-wise comparison between means was tested by Tukey’s or by Sidak’s post-hoc test. P value ≤ 0.05 was considered significant. Analyses were performed with GraphPad Prism 9 software.
5. Conclusions
In this study we demonstrated that the CCR9:DRD5 heteromeric complex plays a relevant role in the migration of CD4+ T-cells into the colonic mucosa upon inflammation. The mechanistic analyses show that dual stimulation of this heteromeric complex triggers the phosphorylation of MLC2, which is essential for acquiring an optimal migration in confined microenvironments.
6. Patents
R.P., F.O-B., and J.C. are named inventors on a pending patent application describing the therapeutic use of novel peptides that decrease the homing of CD4+ T-cells with gut-tropism by blocking the assembly of dopamine receptor D5 and C-C chemokine receptor 9. This is intended as a treatment for inflammatory bowel diseases, and which could be construed as a potential conflict of interest.
Supplementary Materials
The following supporting information can be downloaded at: www.mdpi.com/xxx/s1, Table S1: Peptides analogue to transmembrane segments of CCR9 and DRD5; Figure S1: Analysis of binding of peptides analogues to TM segments from CCR9 to CD4+ T-cells with gut tropism; Figure S2: Peptides analogues to TM segments from CCR9 do not affect CCR9 expression on CD4+ T-cells with gut tropism; Figure S3: Analysis of the interaction of individual TM segments with the whole partner-protein by an umbrella pulling protocol.
Author Contributions
Conceptualization, R.P.; methodology, J.C., F.O-B., F.V., S.E.G-M., and P.V..; software, F.V., S.E.G-M., and T.P-A..; validation, J.C., F.O-B., F.V., and S.E.G-M.; formal analysis, R.P., F.V., and S.E.G-M.; investigation, J.C., F.O-B., F.V., S.E.G-M., and P.V.; resources, P.V., and T.P-A.; data curation, J.C., F.O-B., F.V., and S.E.G-M.; writing—original draft preparation, R.P.; writing—review and editing, F.O-B., and R.P.; project administration, R.P..; funding acquisition, S.E.G-M., and R.P. All authors have read and agreed to the published version of the manuscript.
Funding
This work was supported by “Financiamiento Basal para Centros Científicos y Tecnológicos de Excelencia” Centro Ciencia & Vida [FB210008] (to Fundación Ciencia & Vida) and by grants [FONDECYT-1210013] (to R.P.), and [FONDECYT-3200937] (to S.E.G-M.) from “Agencia Nacional de Investigación y Desarrollo de Chile”.
Institutional Review Board Statement
The animal study protocol was approved by the Institutional Review Board of Fundación Ciencia & Vida (protocol code P016/2017 approved at April 26th, 2017).
Informed Consent Statement
Not applicable.
Data Availability Statement
The raw data supporting the conclusions of this article will be made available by the authors on request.
Acknowledgments
We thank Dr. Sebastián Valenzuela and Dr. Micaela Ricca for their valuable veterinary assistance in our animal facility. We also thank María José Fuenzalida for her technical assistance in cell sorting and flow cytometry.
Conflicts of Interest
The authors declare no conflicts of interest.
References
- Molodecky, N. A.; Soon, I. S.; Rabi, D. M.; Ghali, W. A.; Ferris, M.; Chernoff, G.; Benchimol, E. I.; Panaccione, R.; Ghosh, S.; Barkema, H. W.; Kaplan, G. G. Increasing incidence and prevalence of the inflammatory bowel diseases with time, based on systematic review. Gastroenterology 2012, 142, 46–54 e42, quiz e30. [Google Scholar] [CrossRef] [PubMed]
- Olsen, T.; Rismo, R.; Cui, G.; Goll, R.; Christiansen, I.; Florholmen, J. TH1 and TH17 interactions in untreated inflamed mucosa of inflammatory bowel disease, and their potential to mediate the inflammation. Cytokine 2011, 56, 633–640. [Google Scholar] [CrossRef] [PubMed]
- Mora, J. R.; Bono, M. R.; Manjunath, N.; Weninger, W.; Cavanagh, L. L.; Rosemblatt, M.; Von Andrian, U. H. Selective imprinting of gut-homing T cells by Peyer’s patch dendritic cells. Nature 2003, 424, 88–93. [Google Scholar] [CrossRef] [PubMed]
- Cassani, B.; Villablanca, E. J.; Quintana, F. J.; Love, P. E.; Lacy-Hulbert, A.; Blaner, W. S.; Sparwasser, T.; Snapper, S. B.; Weiner, H. L.; Mora, J. R. Gut-tropic T cells that express integrin alpha4beta7 and CCR9 are required for induction of oral immune tolerance in mice. Gastroenterology 2011, 141, 2109–2118. [Google Scholar] [CrossRef]
- Trivedi, P. J.; Bruns, T.; Ward, S.; Mai, M.; Schmidt, C.; Hirschfield, G. M.; Weston, C. J.; Adams, D. H. Intestinal CCL25 expression is increased in colitis and correlates with inflammatory activity. J Autoimmun 2016, 68, 98–104. [Google Scholar] [CrossRef]
- Pacheco, R.; Contreras, F.; Zouali, M. The dopaminergic system in autoimmune diseases. Frontiers in immunology 2014, 5, 117. [Google Scholar] [CrossRef]
- Vidal, P. M.; Pacheco, R. Targeting the Dopaminergic System in Autoimmunity. Journal of neuroimmune pharmacology : the official journal of the Society on NeuroImmune Pharmacology 2019, 15, 57–73. [Google Scholar] [CrossRef]
- Asano, Y.; Hiramoto, T.; Nishino, R.; Aiba, Y.; Kimura, T.; Yoshihara, K.; Koga, Y.; Sudo, N. Critical role of gut microbiota in the production of biologically active, free catecholamines in the gut lumen of mice. Am J Physiol Gastrointest Liver Physiol 2012, 303, G1288–95. [Google Scholar] [CrossRef]
- Magro, F.; Fraga, S.; Ribeiro, T.; Soares-da-Silva, P. Decreased availability of intestinal dopamine in transmural colitis may relate to inhibitory effects of interferon-gamma upon L-DOPA uptake. Acta Physiol Scand 2004, 180, 379–386. [Google Scholar] [CrossRef]
- Magro, F.; Vieira-Coelho, M. A.; Fraga, S.; Serrao, M. P.; Veloso, F. T.; Ribeiro, T.; Soares-da-Silva, P. Impaired synthesis or cellular storage of norepinephrine, dopamine, and 5-hydroxytryptamine in human inflammatory bowel disease. Dig Dis Sci 2002, 47, 216–224. [Google Scholar] [CrossRef]
- Yan, Y.; Jiang, W.; Liu, L.; Wang, X.; Ding, C.; Tian, Z.; Zhou, R. Dopamine controls systemic inflammation through inhibition of NLRP3 inflammasome. Cell 2015, 160, 62–73. [Google Scholar] [CrossRef]
- Wu, W.; Sun, M.; Zhang, H. P.; Chen, T.; Wu, R.; Liu, C.; Yang, G.; Geng, X. R.; Feng, B. S.; Liu, Z.; Liu, Z.; Yang, P. C. Prolactin mediates psychological stress-induced dysfunction of regulatory T cells to facilitate intestinal inflammation. Gut 2014, 63, 1883–1892. [Google Scholar] [CrossRef] [PubMed]
- Torres-Rosas, R.; Yehia, G.; Pena, G.; Mishra, P.; del Rocio Thompson-Bonilla, M.; Moreno-Eutimio, M. A.; Arriaga-Pizano, L. A.; Isibasi, A.; Ulloa, L. Dopamine mediates vagal modulation of the immune system by electroacupuncture. Nat Med 2014, 20, 291–295. [Google Scholar] [CrossRef]
- Shao, W.; Zhang, S. Z.; Tang, M.; Zhang, X. H.; Zhou, Z.; Yin, Y. Q.; Zhou, Q. B.; Huang, Y. Y.; Liu, Y. J.; Wawrousek, E.; Chen, T.; Li, S. B.; Xu, M.; Zhou, J. N.; Hu, G.; Zhou, J. W. Suppression of neuroinflammation by astrocytic dopamine D2 receptors via alphaB-crystallin. Nature 2013, 494, 90–94. [Google Scholar] [CrossRef]
- Liu, Z.; Zhai, X. R.; Du, Z. S.; Xu, F. F.; Huang, Y.; Wang, X. Q.; Qiu, Y. H.; Peng, Y. P. Dopamine receptor D2 on CD4(+) T cells is protective against neuroinflammation and neurodegeneration in a mouse model of Parkinson’s disease. Brain, behavior, and immunity 2021, 98, 110–121. [Google Scholar] [CrossRef]
- Pacheco, R. Targeting dopamine receptor D3 signalling in inflammation. Oncotarget 2017, 8, 7224–7225. [Google Scholar] [CrossRef]
- Contreras, F.; Prado, C.; Gonzalez, H.; Franz, D.; Osorio-Barrios, F.; Osorio, F.; Ugalde, V.; Lopez, E.; Elgueta, D.; Figueroa, A.; Lladser, A.; Pacheco, R. Dopamine Receptor D3 Signaling on CD4+ T Cells Favors Th1- and Th17-Mediated Immunity. J Immunol 2016, 196, 4143–4149. [Google Scholar] [CrossRef]
- Ugalde, V.; Contreras, F.; Prado, C.; Chovar, O.; Espinoza, A.; Pacheco, R. Dopaminergic signalling limits suppressive activity and gut homing of regulatory T cells upon intestinal inflammation. Mucosal Immunol 2021, 14, 652–666. [Google Scholar] [CrossRef] [PubMed]
- Prado, C.; Bernales, S.; Pacheco, R. Modulation of T-cell mediated immunity by dopamine receptor d5. Endocrine, metabolic & immune disorders drug targets 2013, 13, 184–194. [Google Scholar]
- Prado, C.; Gaiazzi, M.; Gonzalez, H.; Ugalde, V.; Figueroa, A.; Osorio-Barrios, F. J.; Lopez, E.; Lladser, A.; Rasini, E.; Marino, F.; Zaffaroni, M.; Cosentino, M.; Pacheco, R. Dopaminergic Stimulation of Myeloid Antigen-Presenting Cells Attenuates Signal Transducer and Activator of Transcription 3-Activation Favouring the Development of Experimental Autoimmune Encephalomyelitis. Frontiers in immunology 2018, 9, 571. [Google Scholar] [CrossRef]
- Osorio-Barrios, F.; Prado, C.; Contreras, F.; Pacheco, R. Dopamine Receptor D5 Signaling Plays a Dual Role in Experimental Autoimmune Encephalomyelitis Potentiating Th17-Mediated Immunity and Favoring Suppressive Activity of Regulatory T-Cells. Frontiers in cellular neuroscience 2018, 12, 192. [Google Scholar] [CrossRef]
- Osorio-Barrios, F.; Navarro, G.; Campos, J.; Ugalde, V.; Prado, C.; Raich, I.; Contreras, F.; Lopez, E.; Espinoza, A.; Lladser, A.; Franco, R.; Pacheco, R. The Heteromeric Complex Formed by Dopamine Receptor D5 and CCR9 Leads the Gut Homing of CD4(+) T Cells Upon Inflammation. Cell Mol Gastroenterol Hepatol 2021, 12, 489–506. [Google Scholar] [CrossRef] [PubMed]
- Fuxe, K.; Tarakanov, A.; Romero Fernandez, W.; Ferraro, L.; Tanganelli, S.; Filip, M.; Agnati, L. F.; Garriga, P.; Diaz-Cabiale, Z.; Borroto-Escuela, D. O. Diversity and Bias through Receptor-Receptor Interactions in GPCR Heteroreceptor Complexes. Focus on Examples from Dopamine D2 Receptor Heteromerization. Frontiers in endocrinology 2014, 5, 71. [Google Scholar] [CrossRef]
- Jacobelli, J.; Friedman, R. S.; Conti, M. A.; Lennon-Dumenil, A. M.; Piel, M.; Sorensen, C. M.; Adelstein, R. S.; Krummel, M. F. Confinement-optimized three-dimensional T cell amoeboid motility is modulated via myosin IIA-regulated adhesions. Nat Immunol 2010, 11, 953–961. [Google Scholar] [CrossRef]
- Barbier, L.; Saez, P. J.; Attia, R.; Lennon-Dumenil, A. M.; Lavi, I.; Piel, M.; Vargas, P. Myosin II Activity Is Selectively Needed for Migration in Highly Confined Microenvironments in Mature Dendritic Cells. Frontiers in immunology 2019, 10, 747. [Google Scholar] [CrossRef]
- Vicente-Manzanares, M.; Ma, X.; Adelstein, R. S.; Horwitz, A. R. Non-muscle myosin II takes centre stage in cell adhesion and migration. Nat Rev Mol Cell Biol 2009, 10, 778–790. [Google Scholar] [CrossRef]
- Lammermann, T.; Sixt, M. Mechanical modes of ‘amoeboid’ cell migration. Curr Opin Cell Biol 2009, 21, 636–644. [Google Scholar] [CrossRef]
- Pollard, T. D.; Borisy, G. G. Cellular motility driven by assembly and disassembly of actin filaments. Cell 2003, 112, 453–465. [Google Scholar] [CrossRef]
- Krummel, M. F.; Friedman, R. S.; Jacobelli, J. Modes and mechanisms of T cell motility: roles for confinement and Myosin-IIA. Curr Opin Cell Biol 2014, 30, 9–16. [Google Scholar] [CrossRef] [PubMed]
- Jacobelli, J.; Chmura, S. A.; Buxton, D. B.; Davis, M. M.; Krummel, M. F. A single class II myosin modulates T cell motility and stopping, but not synapse formation. Nat Immunol 2004, 5, 531–538. [Google Scholar] [CrossRef] [PubMed]
- Morin, N. A.; Oakes, P. W.; Hyun, Y. M.; Lee, D.; Chin, Y. E.; King, M. R.; Springer, T. A.; Shimaoka, M.; Tang, J. X.; Reichner, J. S.; Kim, M. Nonmuscle myosin heavy chain IIA mediates integrin LFA-1 de-adhesion during T lymphocyte migration. J Exp Med 2008, 205, 195–205. [Google Scholar] [CrossRef] [PubMed]
- Smith, A.; Bracke, M.; Leitinger, B.; Porter, J. C.; Hogg, N. LFA-1-induced T cell migration on ICAM-1 involves regulation of MLCK-mediated attachment and ROCK-dependent detachment. J Cell Sci 2003, (Pt 15) Pt 15, 3123–3133. [Google Scholar] [CrossRef]
- Watanabe, T.; Hosoya, H.; Yonemura, S. Regulation of myosin II dynamics by phosphorylation and dephosphorylation of its light chain in epithelial cells. Mol Biol Cell 2007, 18, 605–616. [Google Scholar] [CrossRef]
- Ng, H. K.; Chow, B. K. Oligomerization of Family B GPCRs: Exploration in Inter-Family Oligomer Formation. Frontiers in endocrinology 2015, 6, 10. [Google Scholar] [CrossRef]
- Gomes, I.; Ayoub, M. A.; Fujita, W.; Jaeger, W. C.; Pfleger, K. D.; Devi, L. A. G Protein-Coupled Receptor Heteromers. Annual review of pharmacology and toxicology 2016, 56, 403–425. [Google Scholar] [CrossRef] [PubMed]
- Gildea, J. J.; Shah, I. T.; Van Sciver, R. E.; Israel, J. A.; Enzensperger, C.; McGrath, H. E.; Jose, P. A.; Felder, R. A. The cooperative roles of the dopamine receptors, D1R and D5R, on the regulation of renal sodium transport. Kidney Int 2014, 86, 118–126. [Google Scholar] [CrossRef] [PubMed]
- O’Dowd, B. F.; Nguyen, T.; Ji, X.; George, S. R. D5 dopamine receptor carboxyl tail involved in D5-D2 heteromer formation. Biochem Biophys Res Commun 2013, 431, 586–589. [Google Scholar] [CrossRef]
- Hasbi, A.; O’Dowd, B. F.; George, S. R. Heteromerization of dopamine D2 receptors with dopamine D1 or D5 receptors generates intracellular calcium signaling by different mechanisms. Current opinion in pharmacology 2010, 10, 93–99. [Google Scholar] [CrossRef]
- Rivera-Nieves, J.; Ho, J.; Bamias, G.; Ivashkina, N.; Ley, K.; Oppermann, M.; Cominelli, F. Antibody blockade of CCL25/CCR9 ameliorates early but not late chronic murine ileitis. Gastroenterology 2006, 131, 1518–1529. [Google Scholar] [CrossRef] [PubMed]
- Biswas, S.; Bryant, R. V.; Travis, S. Interfering with leukocyte trafficking in Crohn’s disease. Best Pract Res Clin Gastroenterol 2019, 38-39, 101617. [Google Scholar] [CrossRef]
- Sands, B. E. Leukocyte Anti-Trafficking Strategies: Current Status and Future Directions. Digestive diseases 2017, 35, 13–20. [Google Scholar] [CrossRef] [PubMed]
- Hollon, T. R.; Bek, M. J.; Lachowicz, J. E.; Ariano, M. A.; Mezey, E.; Ramachandran, R.; Wersinger, S. R.; Soares-da-Silva, P.; Liu, Z. F.; Grinberg, A.; Drago, J.; Young, W. S., 3rd; Westphal, H.; Jose, P. A.; Sibley, D. R. Mice lacking D5 dopamine receptors have increased sympathetic tone and are hypertensive. J Neurosci 2002, 22, 10801–10810. [Google Scholar] [CrossRef] [PubMed]
- Kurmaeva, E.; Boktor, M.; Zhang, S.; Bao, R.; Berney, S.; Ostanin, D. V. Roles of T cell-associated L-selectin and beta7 integrins during induction and regulation of chronic colitis. Inflamm Bowel Dis 2013, 19, 2547–2559. [Google Scholar] [CrossRef] [PubMed]
- Vargas, P.; Terriac, E.; Lennon-Dumenil, A. M.; Piel, M. Study of cell migration in microfabricated channels. J Vis Exp 2014, (84), e51099. [Google Scholar]
- Webb, B.; Sali, A. Comparative Protein Structure Modeling Using MODELLER. Curr Protoc Bioinformatics 2016, 54, 5.6.1–5.6.37. [Google Scholar] [CrossRef] [PubMed]
- Oswald, C.; Rappas, M.; Kean, J.; Dore, A. S.; Errey, J. C.; Bennett, K.; Deflorian, F.; Christopher, J. A.; Jazayeri, A.; Mason, J. S.; Congreve, M.; Cooke, R. M.; Marshall, F. H. Intracellular allosteric antagonism of the CCR9 receptor. Nature 2016, 540, 462–465. [Google Scholar] [CrossRef] [PubMed]
- Wu, B.; Chien, E. Y.; Mol, C. D.; Fenalti, G.; Liu, W.; Katritch, V.; Abagyan, R.; Brooun, A.; Wells, P.; Bi, F. C.; Hamel, D. J.; Kuhn, P.; Handel, T. M.; Cherezov, V.; Stevens, R. C. Structures of the CXCR4 chemokine GPCR with small-molecule and cyclic peptide antagonists. Science 2010, 330, 1066–1071. [Google Scholar] [CrossRef] [PubMed]
- Tan, Q.; Zhu, Y.; Li, J.; Chen, Z.; Han, G. W.; Kufareva, I.; Li, T.; Ma, L.; Fenalti, G.; Li, J.; Zhang, W.; Xie, X.; Yang, H.; Jiang, H.; Cherezov, V.; Liu, H.; Stevens, R. C.; Zhao, Q.; Wu, B. Structure of the CCR5 chemokine receptor-HIV entry inhibitor maraviroc complex. Science 2013, 341, 1387–1390. [Google Scholar] [CrossRef] [PubMed]
- Warne, T.; Moukhametzianov, R.; Baker, J. G.; Nehme, R.; Edwards, P. C.; Leslie, A. G.; Schertler, G. F.; Tate, C. G. The structural basis for agonist and partial agonist action on a beta(1)-adrenergic receptor. Nature 2011, 469, 241–244. [Google Scholar] [CrossRef]
- Warne, T.; Serrano-Vega, M. J.; Baker, J. G.; Moukhametzianov, R.; Edwards, P. C.; Henderson, R.; Leslie, A. G.; Tate, C. G.; Schertler, G. F. Structure of a beta1-adrenergic G-protein-coupled receptor. Nature 2008, 454, 486–491. [Google Scholar] [CrossRef]
- Sato, T.; Baker, J.; Warne, T.; Brown, G. A.; Leslie, A. G.; Congreve, M.; Tate, C. G. Pharmacological Analysis and Structure Determination of 7-Methylcyanopindolol-Bound beta1-Adrenergic Receptor. Mol Pharmacol 2015, 88, 1024–1034. [Google Scholar] [CrossRef]
- Miller-Gallacher, J. L.; Nehme, R.; Warne, T.; Edwards, P. C.; Schertler, G. F.; Leslie, A. G.; Tate, C. G. The 2.1 A resolution structure of cyanopindolol-bound beta1-adrenoceptor identifies an intramembrane Na+ ion that stabilises the ligand-free receptor. PloS one 2014, 9, e92727. [Google Scholar] [CrossRef]
- Manglik, A.; Kruse, A. C.; Kobilka, T. S.; Thian, F. S.; Mathiesen, J. M.; Sunahara, R. K.; Pardo, L.; Weis, W. I.; Kobilka, B. K.; Granier, S. Crystal structure of the micro-opioid receptor bound to a morphinan antagonist. Nature 2012, 485, 321–326. [Google Scholar] [CrossRef] [PubMed]
- de Vries, S. J.; van Dijk, M.; Bonvin, A. M. The HADDOCK web server for data-driven biomolecular docking. Nature protocols 2010, 5, 883–897. [Google Scholar] [CrossRef] [PubMed]
- Feng, S.; Park, S.; Choi, Y. K.; Im, W. CHARMM-GUI Membrane Builder: Past, Current, and Future Developments and Applications. J Chem Theory Comput 2023, 19, 2161–2185. [Google Scholar] [CrossRef]
- Van Der Spoel, D.; Lindahl, E.; Hess, B.; Groenhof, G.; Mark, A. E.; Berendsen, H. J. GROMACS: fast, flexible, and free. J Comput Chem 2005, 26, 1701–1718. [Google Scholar] [CrossRef] [PubMed]
- Best, R. B.; Zhu, X.; Shim, J.; Lopes, P. E.; Mittal, J.; Feig, M.; Mackerell, A. D., Jr. Optimization of the additive CHARMM all-atom protein force field targeting improved sampling of the backbone phi, psi and side-chain chi(1) and chi(2) dihedral angles. J Chem Theory Comput 2012, 8, 3257–3273. [Google Scholar] [CrossRef]
- Schmidt, T. H.; Kandt, C. LAMBADA and InflateGRO2: efficient membrane alignment and insertion of membrane proteins for molecular dynamics simulations. J Chem Inf Model 2012, 52, 2657–2669. [Google Scholar] [CrossRef]
Figure 1.
CCR9:DRD5 heteromer signalling increases the migratory speed of CD4+ T-cells in microchannels. Naïve CD4+ T-cells were isolated from the spleen of wild-type mice (Drd5+/+) and then activated with anti-CD3/anti-CD28 mAbs coated dynabeads in the presence of IL-2 and RA for 5 d to induce gut tropism. Afterward, cells were individually tracked in 3μm-width confined microchannels under different conditions and the migratory speed was determined. (A) Migratory speed in response to increasing concentrations of CCL25 was determined; n = 52 – 163 cells per condition. (B) Migratory speed was determined in the presence of CCL25 (50 ng/mL) alone or with dopamine (1 μM), or with SKF81297 (100 nM) in the absence or in the presence of a TM-peptide irrelevant for CCR9:DRD5 heteromer assembly (TM1D) or of a TM-peptide that disrupt CCR9:DRD5 heteromer assembly (TM6D); n = 83 – 160 cells per condition. (A,B) Data corresponds to the median migratory speed of lymphocytes in μm/min. In the box plots, the bars include 90% of the data points, the horizontal line in the box indicates the median and the box contains 75% of the data points. Data from two independent experiments is shown. *, p<0.05; **, p<0.01; ***, p<0.001; ****, p<0.0001 by one-way ANOVA followed by Tukey’s post-hoc test. ns, non-significant.
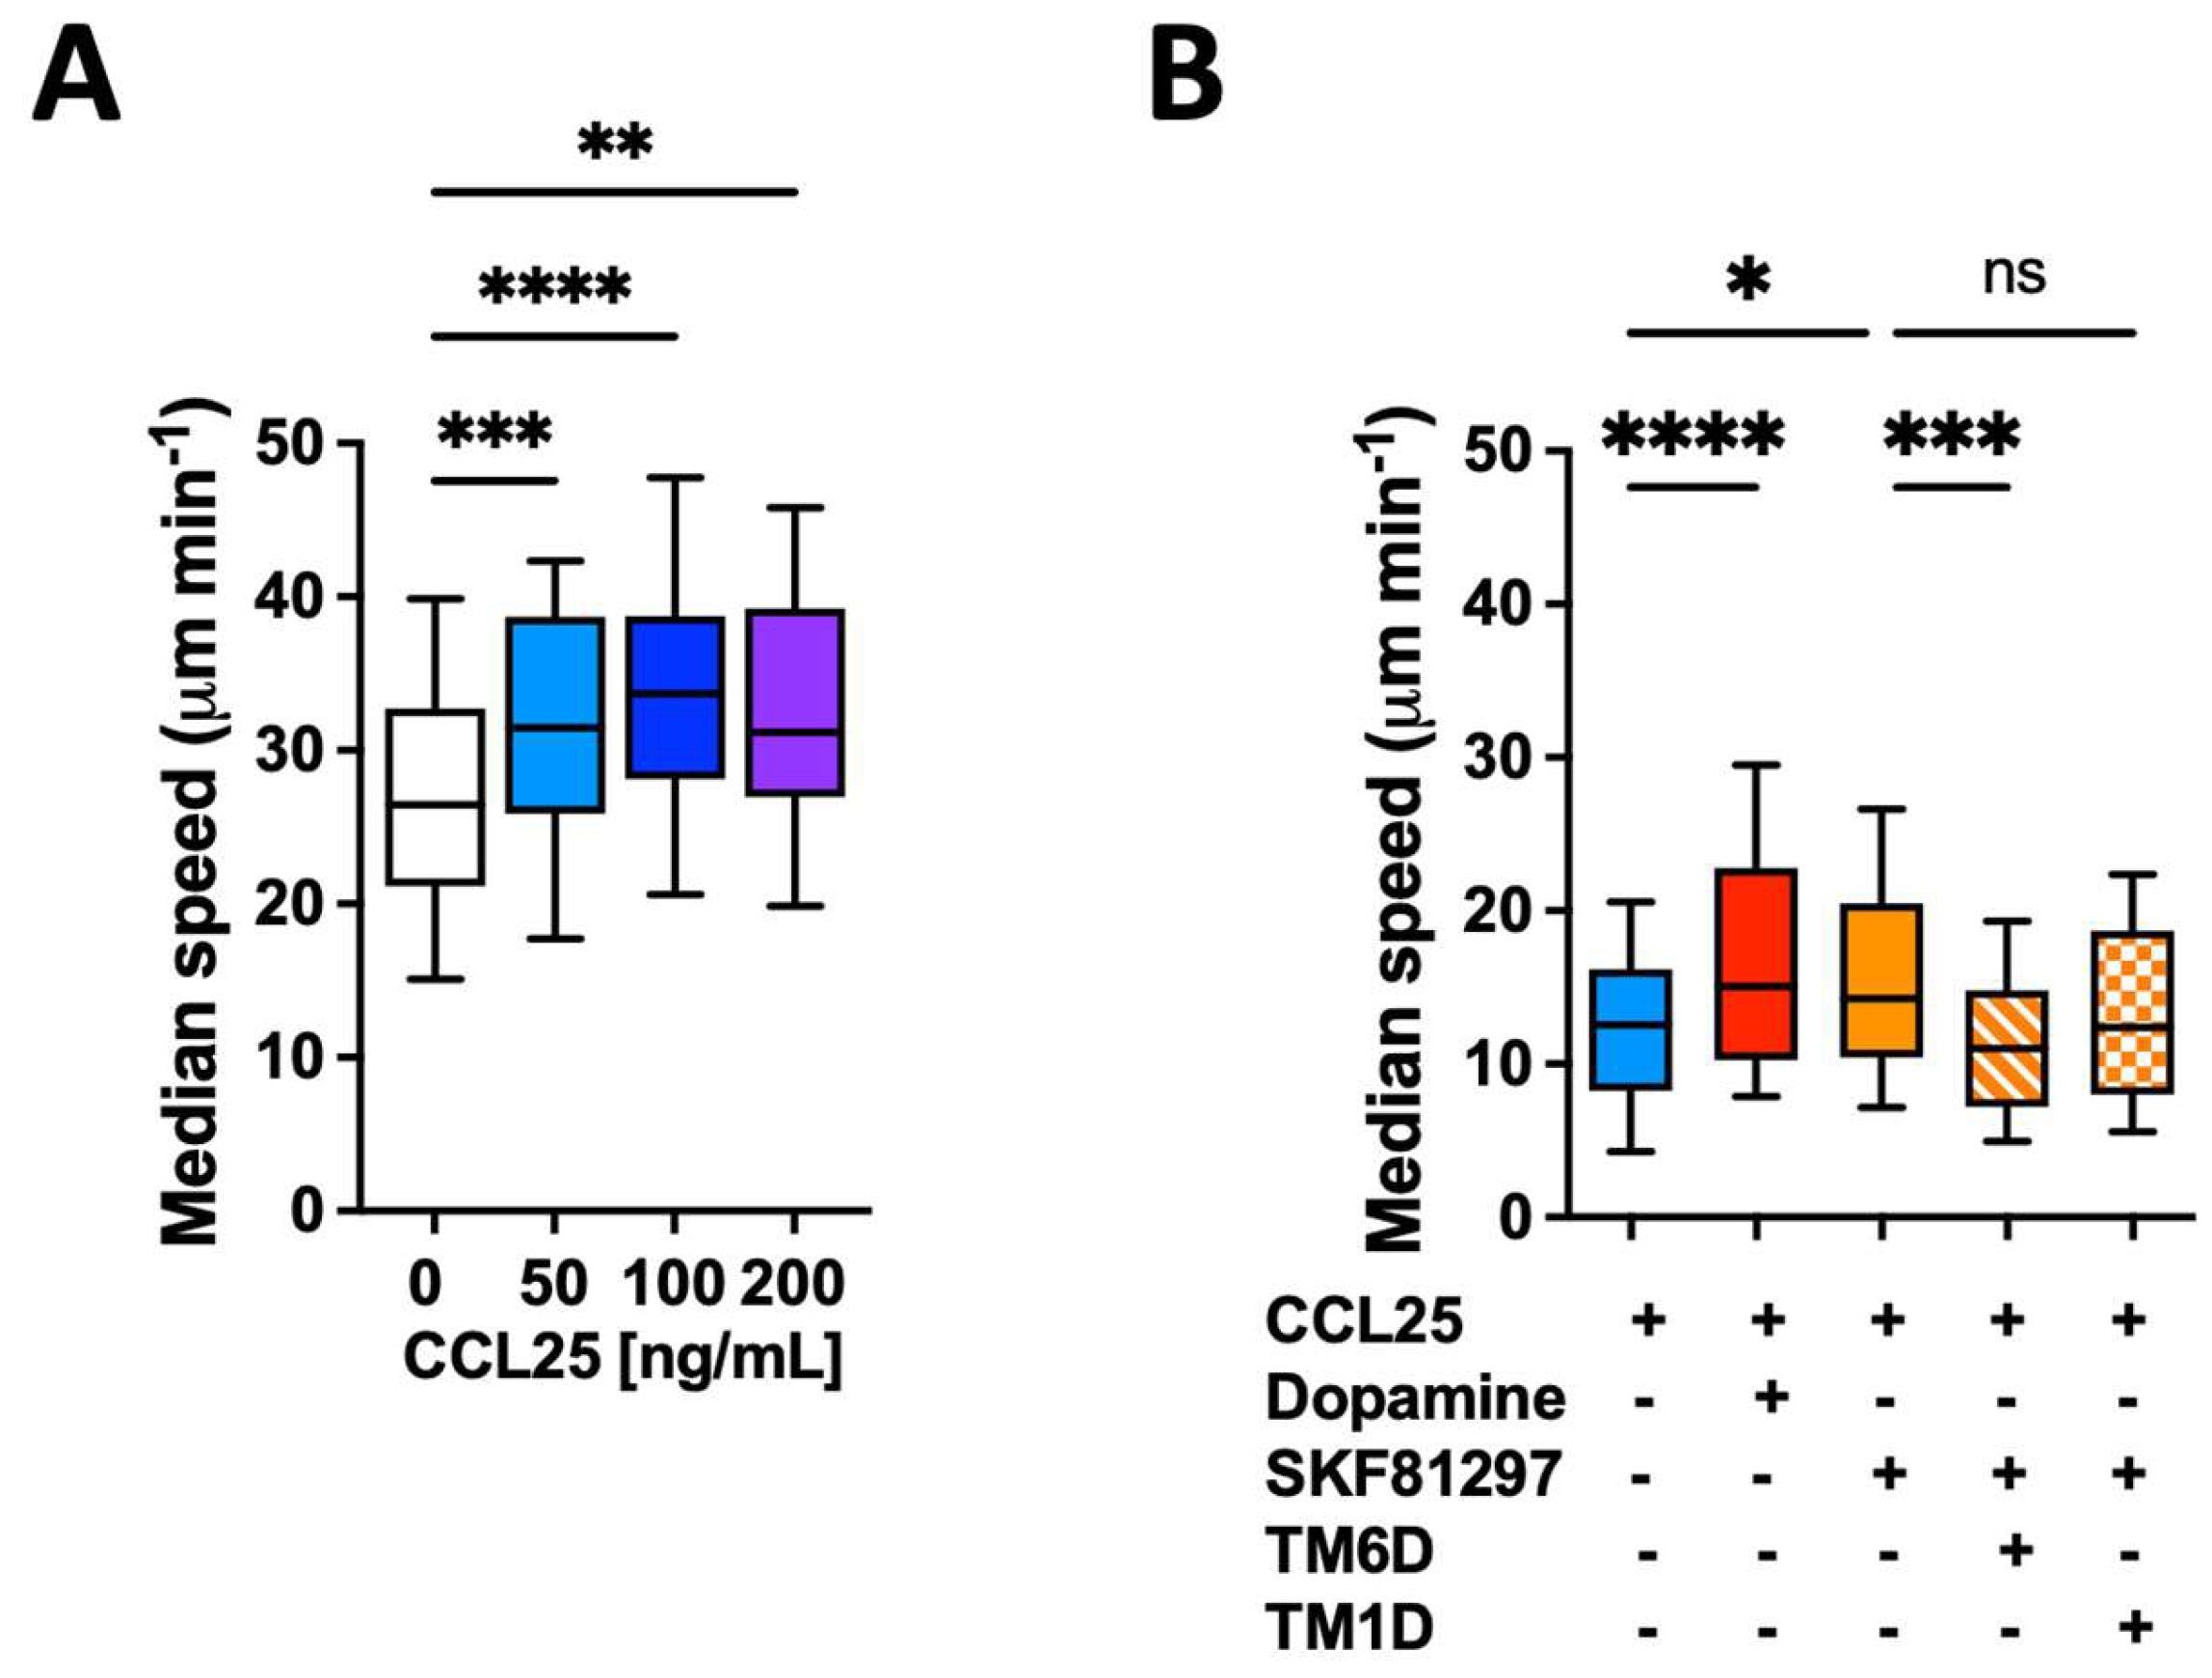
Figure 2.
CCR9:DRD5 heteromer signalling involves the activation of the myosine light chain 2. Naïve CD4+ T-cells were isolated from the spleen of wild-type mice (Drd5+/+) and then activated with anti-CD3/anti-CD28 mAbs coated dynabeads in the presence of IL-2 and RA for 5 d to induce gut tropism. During the last 4 h, cells were non-stimulated (vehicle) or stimulated with CCL25 (300 ng/mL) and SKF81297 (100 nM) in the presence of 4 μM of peptides TM6C or TM7C, or only DMSO as a control. Cell were stained for extracelular expression of CD4 and intracelular phosphorylation of MLC2. (A) Representative histograms showing the fluorescence distribution associated to the immunostaining of pMLC2 in the CD4+ live (ZAq-) population. (B) Quantification of the extent of pMLC2. Values are the mean fluorescence intensity associated to the immunostaining of pMLC2. Data is represented as the mean ± SEM from three independent experiments. **, p<0.01 by two-way ANOVA followed by the Tukey’s multiple comparisons post-hoc test.
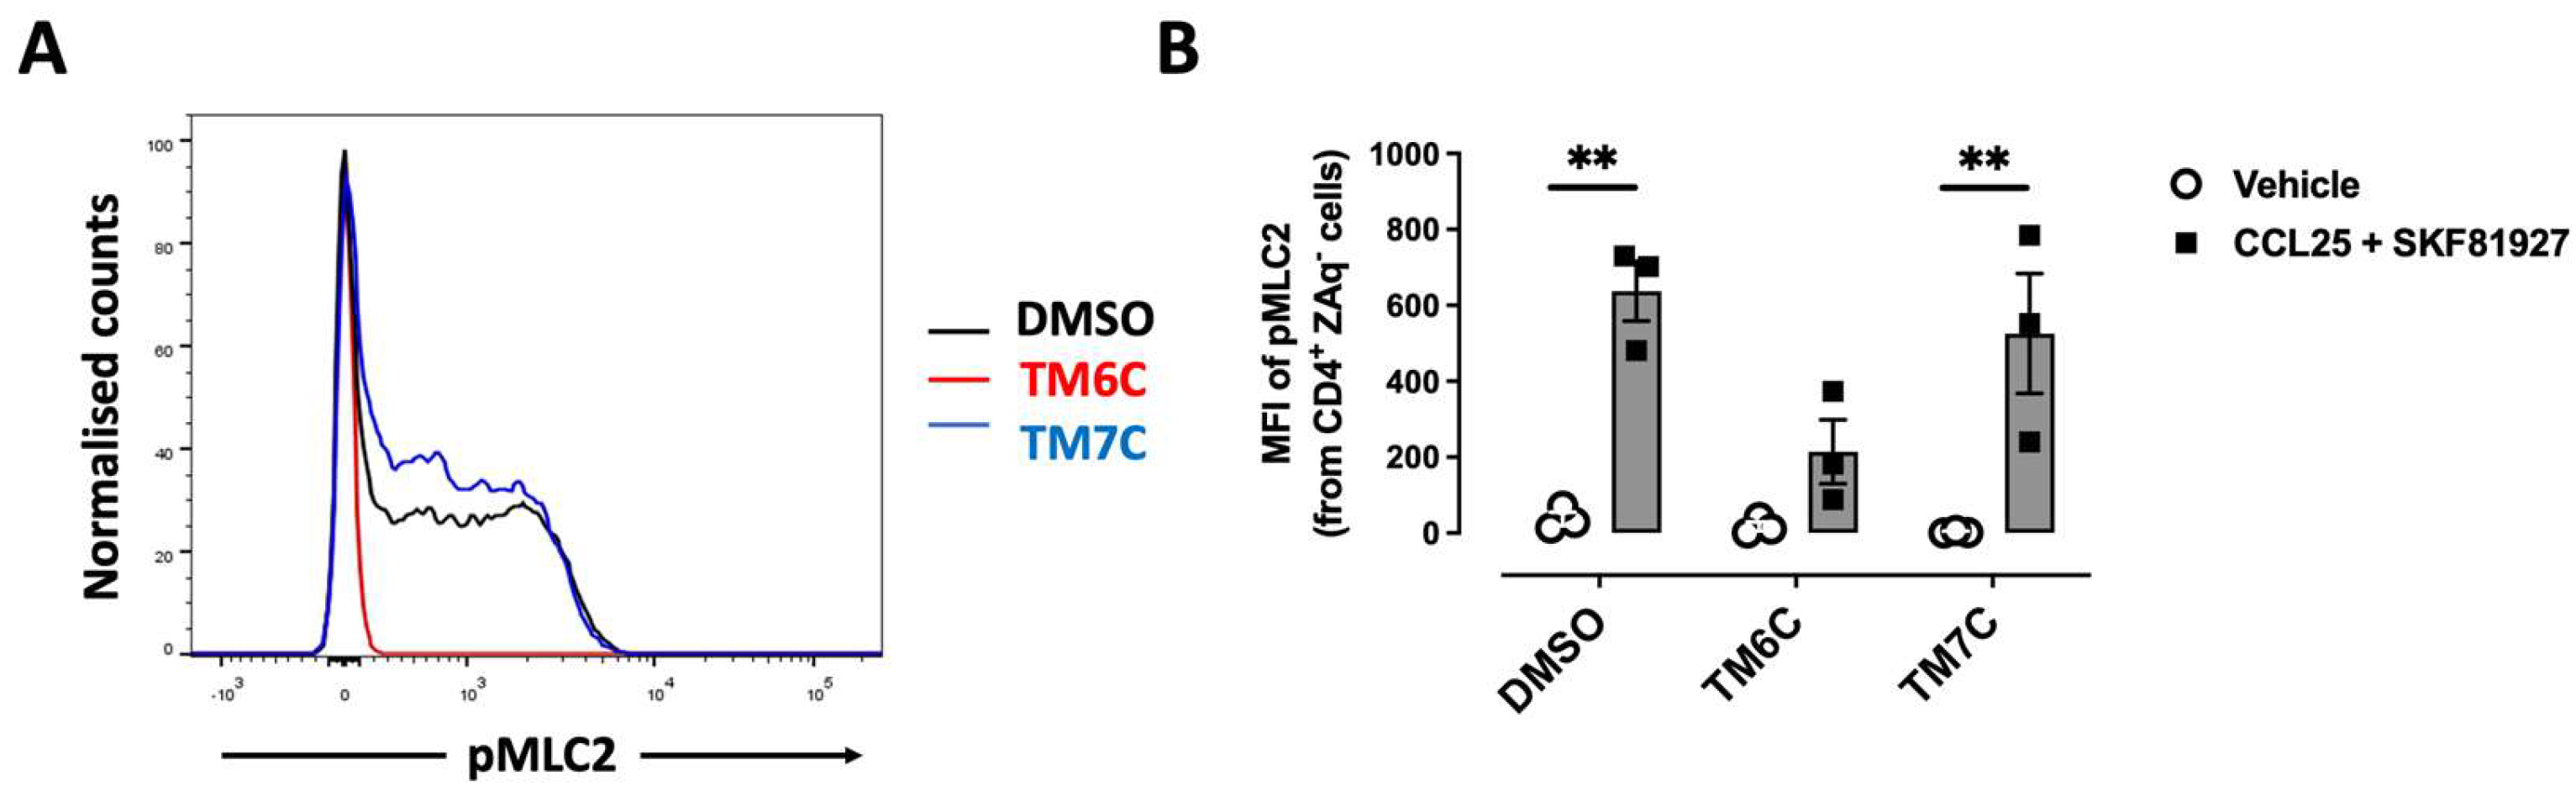
Figure 3.
The disassembling of the CCR9:DRD5 heteromer reduces the recruitment of CD4+ T-cells into the colonic mucosa. Naïve CD4+ T-cells were isolated from the spleen of wild-type mice (Drd5+/+) and then activated with anti-CD3/anti-CD28 mAbs coated dynabeads in the presence of IL-2 and RA for 5 d to induce gut tropism. During the last 4 h, cells were treated with 4 μM of peptides TM6C or TM7C, or only DMSO as a control. Afterwards, cells were i.v. transferred (6 x 10⁶ cells/mouse) into Drd5-/- mice which were previously exposed to 1,75% DSS for 3 d. Mice were exposed to 1,75% DSS for 3 more days, sacrificed, and PLA was conducted on colonic tissue. (A) Representative images obtained from PLA analysis. Arrows show PLA+ cells. Bar, 20 μm. Images with higher magnification are shown in the right-bottom corner. (B) Quantification of PLA+ cells. Values are the number of PLA+ cells per field. Data is represented as the mean ± SEM from three independent experiments. Each symbol represents a different field. *, p<0.05; **, p<0.01 by one-way ANOVA followed by the Sidak’s multiple comparisons post-hoc test.
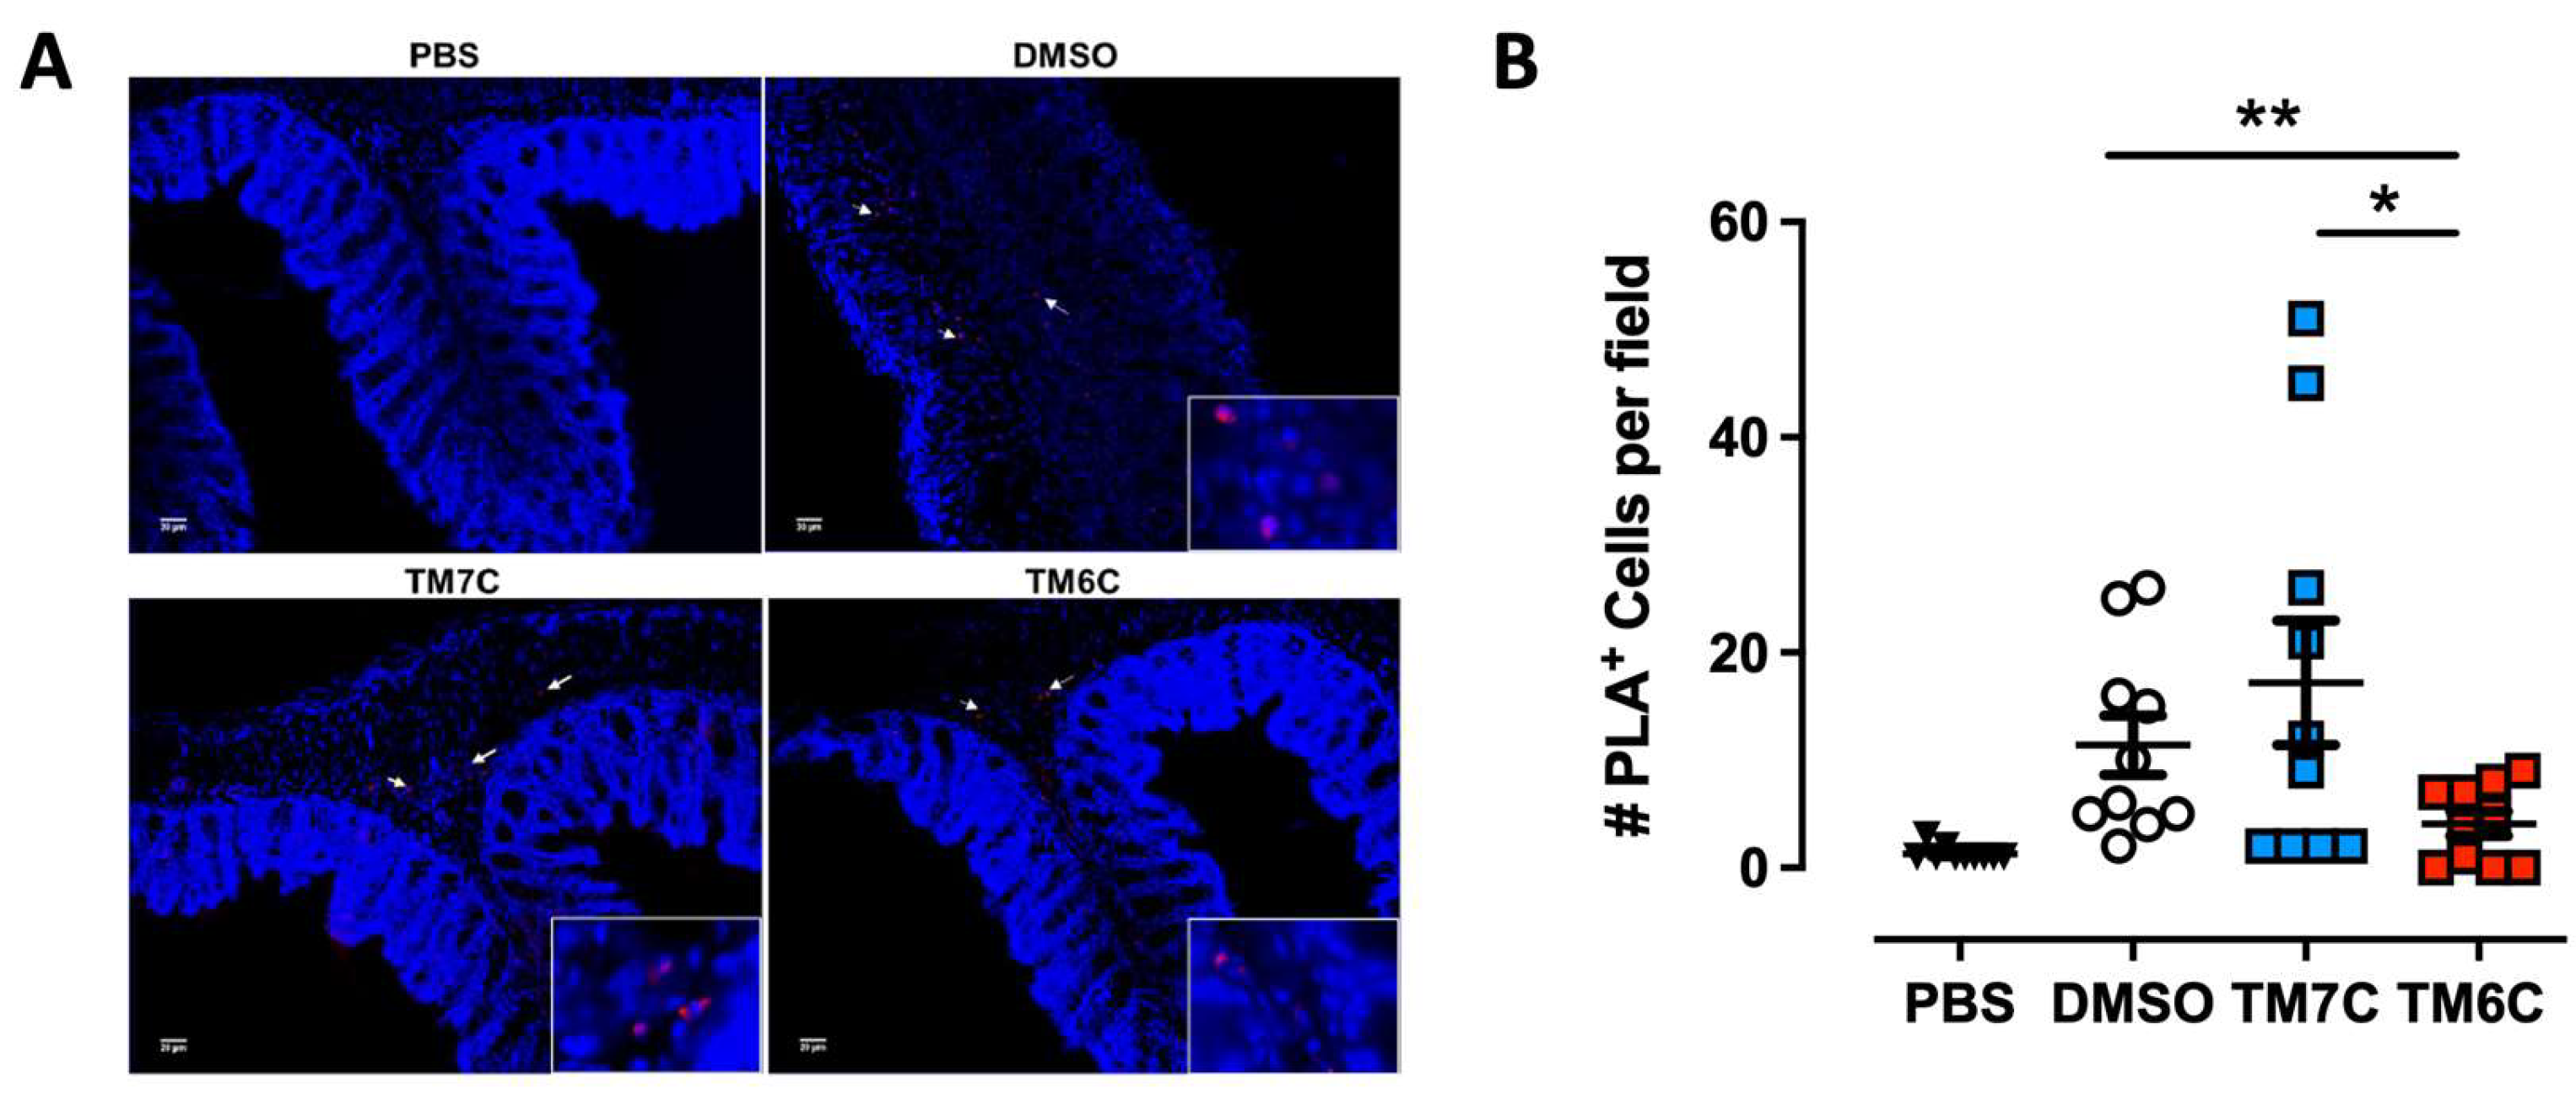
Figure 4.
Analysis of non-equilibrium simulation during the pulling away of DRD5 TMs from the whole CCR9 protein. (A) Distance change during simulation at the first part of the method, before transition point. (B) Simulation time when the transition point is reached. (C) Maximum force reached around transition point. Each symbol represents an individual simulation (n = 6). The mean ± SEM is shown. ***, p<0.001 by one-way ANOVA followed by the Sidak’s multiple comparisons post-hoc test.
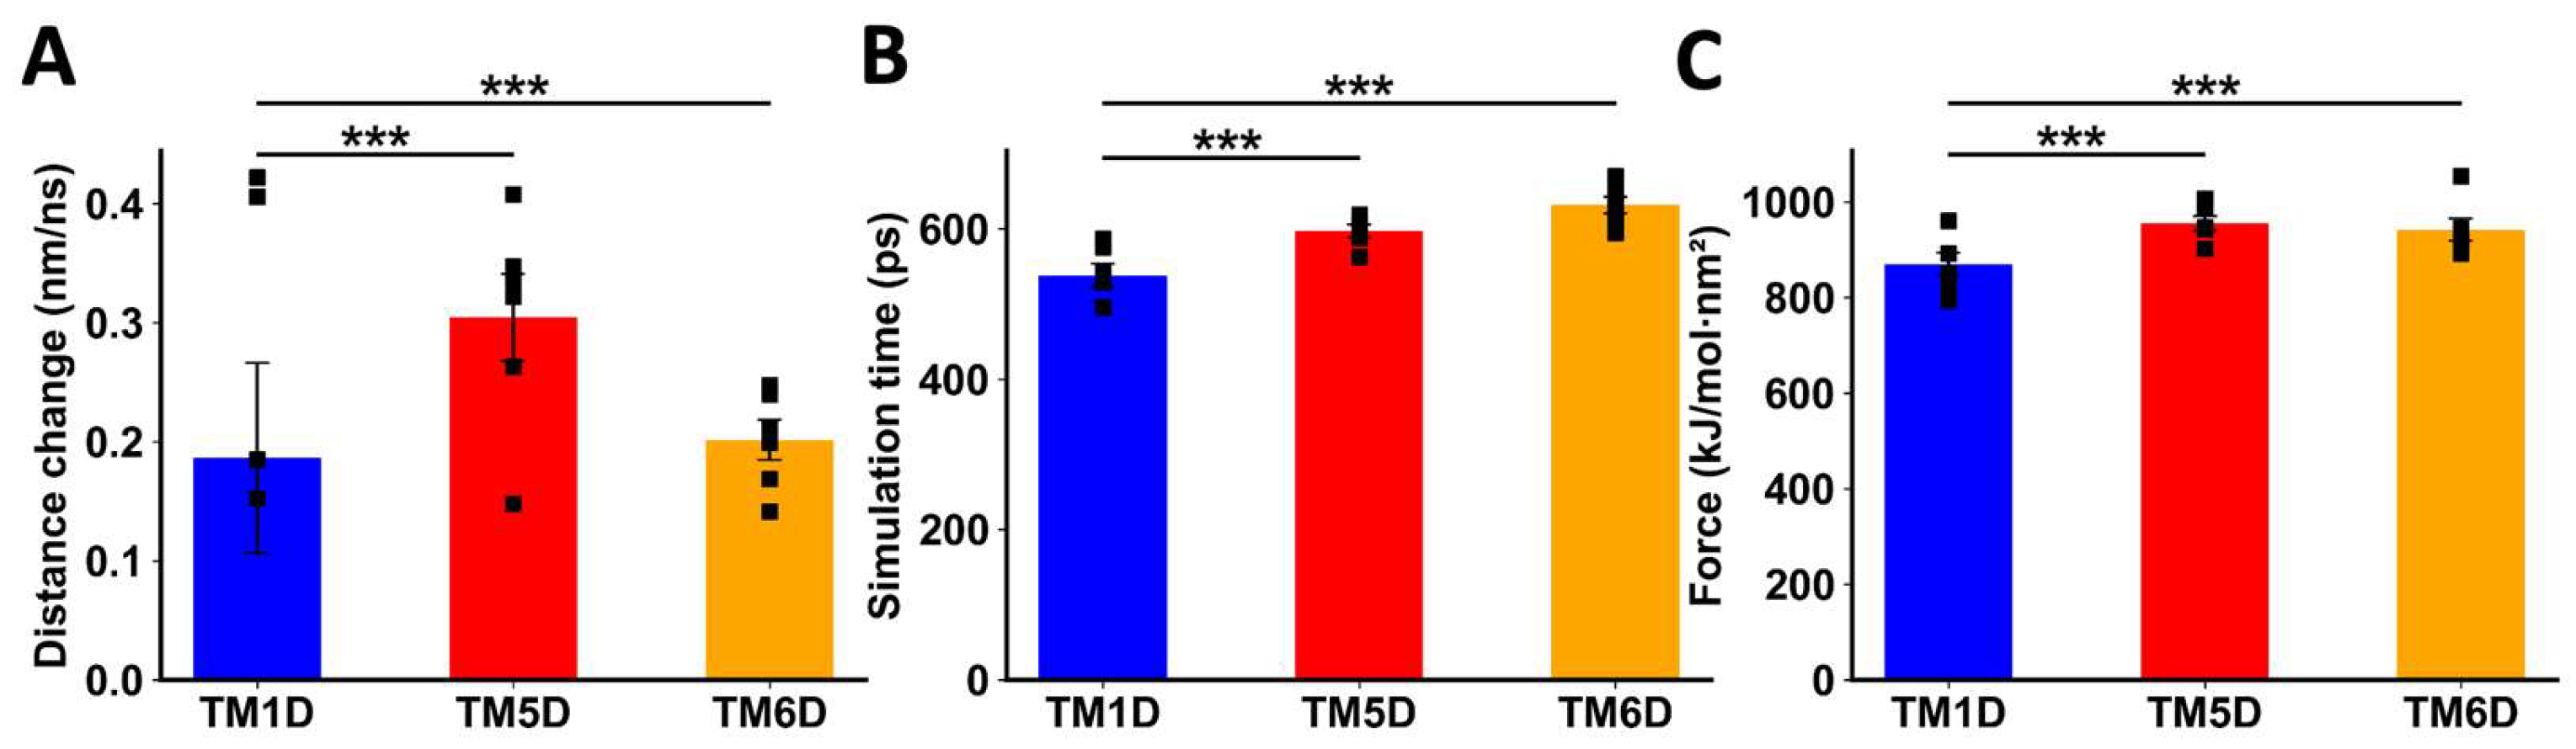
Figure 5.
Analysis of non-equilibrium simulation during the pulling away of CCR9 TMs from the whole DRD5 protein. (A) Distance change during simulation at the first part of the method, before transition point. (B) Simulation time when the transition point is reached. (C) Maximum force reached around transition point. Each symbol represents an individual simulation (n = 6). The mean ± SEM is shown. ***, p<0.001 by one-way ANOVA followed by the Sidak’s multiple comparisons post-hoc test.
Disclaimer/Publisher’s Note: The statements, opinions and data contained in all publications are solely those of the individual author(s) and contributor(s) and not of MDPI and/or the editor(s). MDPI and/or the editor(s) disclaim responsibility for any injury to people or property resulting from any ideas, methods, instructions or products referred to in the content. |
© 2024 by the authors. Licensee MDPI, Basel, Switzerland. This article is an open access article distributed under the terms and conditions of the Creative Commons Attribution (CC BY) license (http://creativecommons.org/licenses/by/4.0/).
Copyright: This open access article is published under a Creative Commons CC BY 4.0 license, which permit the free download, distribution, and reuse, provided that the author and preprint are cited in any reuse.


