Submitted:
12 August 2024
Posted:
12 August 2024
You are already at the latest version
Abstract
Background: Mules are used worldwide for agrarian purposes such as plowing and harvesting crops. In this study, mules were used for plowing and cultivation. While mules are believed to be less susceptible to diseases and fatigue than horses, no scientific investigation has been conducted to support this belief. The objective was to assess effect of work-associated fatigue on hematological and biochemical parameters in working mules in Mexico. Methodology: Six healthy mules 6.5 to 23 years, 3.5 BCS, were studied. Three blood samples/day were taken at the beginning and end of the work season. One sample taken at the beginning of the day, middle, and end (3 hours apart). Biochemical parameters, including the concentrations of albumin, globulin, total protein, glucose, alkaline phosphatase (ALP), aspartate aminotransferase (AST), gamma-glutamyl transferase (GGT), total bilirubin, lactate, creatinine kinase (CK), urea, creatinine, calcium, sodium, potassium, total carbon dioxide (tCO2), and al-bumin-to-globulin ratio, were determined using the veterinary Skyla-VB1 automated analyzer (Lite-On Technology Corporation, Hsinchu-Taiwan), and blood lactate concentration using the handheld Lactate Scout Vet. Results: Significant increases in concentrations AST (P < 0.001), BUN (P < 0.001), calcium (P = 0.002), creatine phosphokinase CPK U/L (P < 0.001), tCO2 (P = 0.006), and urea (P < 0.01), were observed at the end of the work season. However, sodium, potassium, and chloride were significantly decreased at the end of the work season. No treatment or time-by-treatment interaction effect was observed for ALP, creatinine, globulin, or the albu-min-to-globulin ratio. Conclusions: The significant decrease in mineral and electrolytes (Na, K, and Cl) at the end of work season could suggest change in electrolytic balance during the strenuous plowing season. A higher concentration of tCO2 at end of the season is a good indicator of metabolic acid-base disturbances. Results indicate use of mules for plowing fields disrupts the mules' micromineral and electrolyte profiles. Increased CPK levels demonstrate that the workload was excessive. This study furthers our understanding of biochemical responses in mules.
Keywords:
Biochemical parameters
; creatinine
; electrolytes
; fatigue
; mules
; lactate
1. Introduction
Horses, mules, and donkeys are widely used for many activities by the farmers in Mexico [1]. Mules are increasing in value as they are becoming rarer and the ability to hire them for agriculture has been highlighted as an important source of income for many owners in Mexico. Mules are sterile animals produced by crossing a male donkey with a female horse, making them relatively rare and often expensive. They are large, strong, long-lived, and excellent for transport in mountainous areas as well as for pulling wagons. Due to their cost, mules are primarily used for transport operations by contractors and medium-scale farmers. In Mexico, they are also important for plowing [2]. Horses and mules are work on land that is too challenging for oxen [3]. Mules are preferred to horses as draft animals because they can adapt to low-quality feed and do not need to consume as much water. In addition, their hide is thicker and less susceptible to suffering sores caused by saddles or other riding and harnessing equipment [4]. Heavy work, such as plowing, is recognized as stress factor that can disturb the homeostasis of an organism [5]. Physiological, hematological, and biochemical changes associated with physical work have been extensively analyzed in several types of horses [6]. However, little information is available on the effect of heavy physical activity on biochemical variables in working mules. During heavy physical activity such as plowing, some biochemical changes occur in muscle and affect the equilibrium of muscle cells. Increased muscle metabolites and the generated heat by muscle contraction during work create feeling of fatigue. Muscle tissue can be damaged after intense, prolonged work due to both metabolic and mechanical factors. This damage increases the permeability of the muscle membrane and causes rupture of muscle fibers, releasing biomarkers such as creatine kinase (CK), myoglobin, and troponin, which indicate muscle membrane damage [7]. The primary causes of muscle fatigue are acidosis and ATP depletion due to increased consumption or decreased supply. This is indicated by biomarkers such as serum lactate, ammonia, and oxipurines, as well as the overproduction of reactive oxygen species (ROS), which is reflected by lipid peroxidation biomarkers, protein peroxidation biomarkers, and antioxidative capacity biomarkers [8]. The study conducted by Mami et al [6] found that catalase (CAT) activity and plasma total antioxidant capacity (TAC) in the horse increased immediately after the race and then gradually decreased. Immediately after the race, there was a significant increase in the plasma levels of aspartate aminotransferase (AST), which continued until 1 hour after the race. The activity of lactate dehydrogenase (LDH), and CK reached its highest value 1 hour after the race. A recent study in Central Italy [9] found that after a day of fieldwork, working mules showed increased serum sodium, chloride, calcium, urea, and creatinine concentrations. These findings support the notion of decreased body water and renal blood flow in these animals. Examining the biochemical alterations that resulting from physical activity enables researchers to gain a profound comprehension of the adaptations that take place within an animal's body following physical exertion. This understanding facilitates the adoption of appropriate measures to uphold animal welfare and health. Because of the stoic nature and limited information on blood chemistry in mules, conditions such as strenuous field can lead to bodily damage that may go unnoticed until advanced stages develop. The objective of this study was to assess the effect of work-associated fatigue on biochemical parameters in working mules in Mexico during plowing up season.
2. Materials and Methods
Six healthy mules, ranging in age from 6.5 to 23 years with body condition score ranged from 3 to 4 on 5-point score, with mean body weight (± SE) of 417± 29.81 kg. Animals were enrolled in the study before and after work season. The mules were used for plowing fields to prepare the land for planting crops at the beginning of the season and at the end cultivation (Figure 1). The work season started in February and ended in December of 2023. Owner’s consent was given for all animals included in the study. Animals were clinically evaluated before enrollment with particular attention to musculoskeletal injuries, skin lesions, and behavioral alterations. Animals were fed oats and corn stover and provided water ad libitum.
Blood samples were collected directly from each animal at the beginning and end of the plowing work season. At each time point, three blood samples were collected from each animal: one prior to work, a second three hours into work, and a third after an additional three hours of work. Blood samples were collected by jugular venipuncture and were collected in lithium heparin blood collection tubes. Whole-blood sample were analyzed immediately after collection within one hour in the field. Biochemical parameters, including the concentrations of albumin, globulin, total protein, alkaline phosphatase (ALP), aspartate aminotransferase (AST), gamma-glutamyl transferase (GGT), total bilirubin, creatinine phosphokinase (CPK), urea, creatinine, calcium, sodium, potassium, total carbon dioxide (tCO2), and albumin-to-globulin (A/G) ratio, were determined using the skylaTM VB1 Veterinary Clinical Chemistry Automated Analyzer (Lite-On Technology Corporation, Hsinchu-Taiwan) and reagent disc (Equine Panel- Product code 900-150, skylaTM VB1® reagent disc, Hsinchu-Taiwan).
To assess blood lactate concentration, once blood was collected, a whole blood sample (0.2 μL) was immediately analyzed using the handheld Lactate Scout Vet (SensLab GmbH, Leipzig, Germany) with measuring range: 0.5 – 25 mmol/L, and Imprecision: ≤ 0.30 mml/L (at lactate concentration ≤ 7.5 mmol/L); CV ≤ 4% (at lactate concentration > 7.5 mmol/L).
Statistical analyses of selected biochemical parameters were performed using Stata software to assess the effect of working season (pre- and post-working), timepoints within the working season (0, 3, and 6 hours relative to work), and interactions between the working season and time points. The data of biochemical were first checked for normality using histogram frequency graphs. Then, data were analyzed using mixed-effects analysis of variance, with the animal as a random effect and working season, timepoints, and their interactions as a fixed effect. P-value of < 0.05 was considered significant differences.
3. Results
The mean values and standard errors (SE) of studied biochemical parameters were presented in Table 1. The mean (±SE) concentrations of CPK during the pre- and post-working season was 168.66 ± 21.87 U/L, and 353.5 ± 21.87, respectively (Figure 2). Similarly, the levels of AST were significantly greater after work season (355.5 ± 32.59 U/L) in comparison to before work season (311.27 ± 32.59; Table 1). The mean concentration of BUN after work season (20.07 ± 0.56 mg/dL) was greater than before work season (13.44 ± 0.56 mg/dL; Table 1). The calcium (Ca) levels during the pre- and post-working season were 11.02 ± 0.12mg/dL, and 11.62 ± 0.10 mg/dL, respectively. The mean (±SE) concentrations of Na during the pre- and post-working season were 141.55 ± 0.85 mmol/L, and 133.72 ±1.23 mmol/L, respectively (Table 1). The mean (±SE) concentrations of K during the pre- and post-working season was 3.97 ± 0.09 mmol/L, and 3.26 ± 0.15 mmol/L, respectively (Table 1). The mean (±SE) concentrations of Cl during the pre- and post-working season was 106.83 ± 0.75 mmol/L, and 95.55 ± 1.26 mmol/L, respectively (Table 1). The mean (±SE) blood lactate concentrations during the pre- and post-working season were 0.54 ± 0.03 mmol/L, and 0.63 ± 0.03 mmol/L, respectively (Table 1).
Figure 2.
Concentration of Creatine Phosphokinase in working mules at the beginning and the end of working season.
Figure 2.
Concentration of Creatine Phosphokinase in working mules at the beginning and the end of working season.
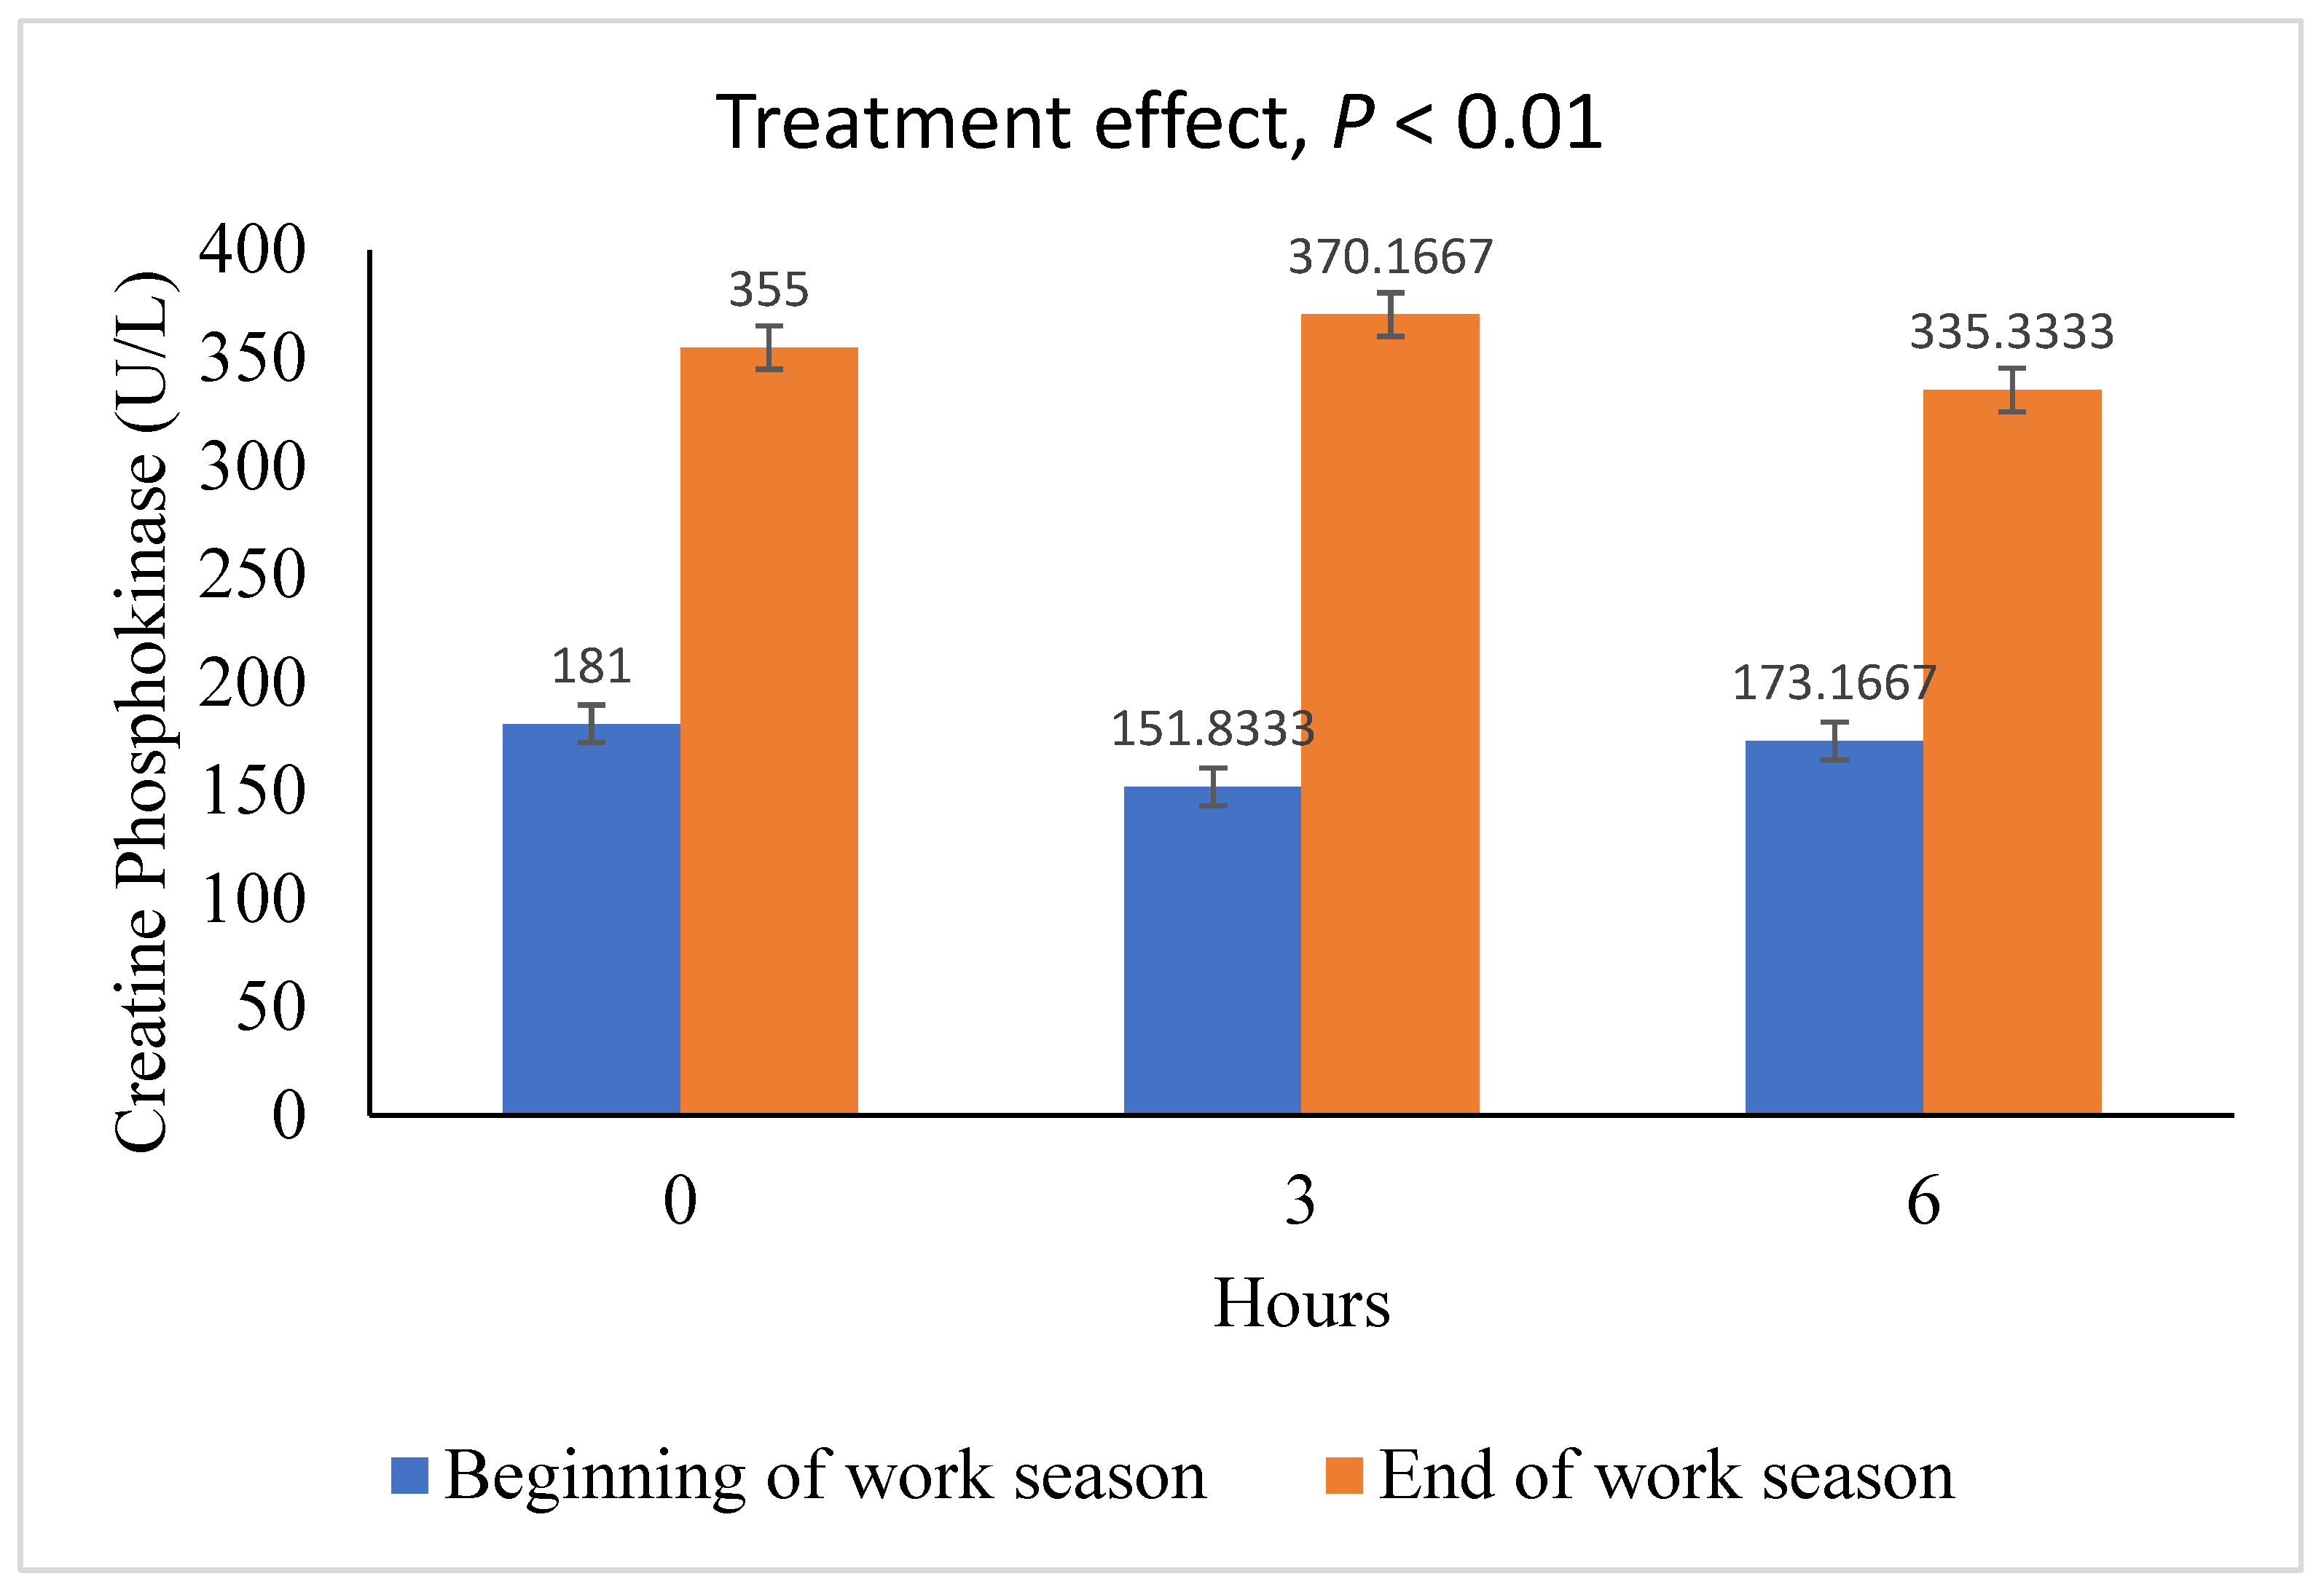
Statistical analysis reveraled a significant effect of plowing working seaseon on mules’ CPK concentrations with significant increase in CPK concentrations (P<0.001) post-working session in comparision to the pre-work seaseon (Table 2).
Our results show that the concetrations of mules’ electrolyte profile including Na (Table 3), K (Table 4), Cl (Table 5) were significantly lower post-work seaseon than pre-work seaseon. Significant interaction between treatment and timepoints (P=0.013) was observed for blood sodium level with lower sodium levels during 3 and 6 hours from the start of work at the end of working season than the beginning of work season. No treatment or time-by-treatment interaction effect was observed for ALP, creatinine, globulin, or the A/G ratio.
In addition, significant increases in the concentrations of some biochemical variables, including AST (P < 0.001; Table S1), BUN (P < 0.001; Table S2), calcium (P = 0.002; Table S3), tCO2 (P = 0.006; Table S3), and urea (P < 0.001; Table S4), were observed after the plowing work season in mules in Mexico in comparison to pre-work session. However, blood glucose levels significantly decreased after the work season compared to before the work season (P<0.001, Table S5). Our results showed that treatment had no significant effect on blood lactate concentrations (P=0.476; Table S6). Interestingly, we observed a significant decrease in blood lactate concentration within 6 hours from the start of work (P=0.04) compared to the blood lactate concentration prior to work (Table S6).
4. Discussion
The results obtained in the present study showed a significant effect of work-associated fatigue on biochemical profile of mules with significant decrease in level of sodium, potassium, and chloride at the end of working session. These results suggest that plowing up the field seems to influence the mules’ micromineral and electrolyte profile. These obtained results agree with results obtained with [9] who found that a significant influence of fieldwork on working mules’ electrolyte profile in Italy. Similarly, Assenza et al [10] who showed a significant effect of maximal exercise on sodium, chloride, magnesium, potassium, calcium, phosphorus, iron, and blood lactate concentrations in horse.
During exercise, some biochemical changes occur in muscle and affect the equilibrium of muscle cells. Increased muscle metabolites and the generated heat by muscle contraction during exercise may decrease not only the force of muscle but also affect the equilibrium of internal environment of other body systems of mules. Prolonged or strenuous exercise results in significant fluid losses and, in addition, extensive losses of ions, predominantly sodium, potassium, and chloride [11]. The principal mechanism of heat loss in the horse during exercise is evaporation, primarily in the form of sweating. A heavily exercised horse can lose as much as 10 to 15 liters of sweat per hour. Therefore, for working mules, it is important to replace these minerals promptly, as ongoing heavy sweat losses without adequate replacement can result in electrolyte imbalances or depletion that contributes to poor work performance [12].
Heavy physical activity could represent a stressful condition capable of disturbing an animal’s homeostasis, inducing alterations in biochemical parameters. According to our results, increase in serum CPK, AST, and BUN have been seen in response to fatigue [6]. These increases are believed to relate either to overt damage or to a change in the muscle fiber membrane causing a transient increase in permeability [13]. Creatine kinase is naturally present in the muscle and in muscle damage, it leaks into the bloodstream. Muscle damages including muscular dystrophy, trauma, severe exercise, and infections can lead to increase of plasma CK [14].
Mami et al. [6] found that immediately after the race, there was a significant increase in the plasma levels of AST of Arabian horses, which continued until 1 hour after the race. Serum levels of skeletal muscle enzymes or proteins including creatine kinase, lactate dehydrogenase, and aspartate aminotransferase (AST), and are markers of the functional status of muscle tissue and used routinely in both pathological and physiological conditions. In our study we found significant increase in in CPK concentrations post-working session and this increase was in above the normal range (CPK normal range: 0-350 U/L). Creatine kinase is naturally present in the muscle and in muscle damage, it leaks into the bloodstream. Aspartate aminotransferase is not specific for muscles, but its significant increase is usually only due to muscle damage [15]. In the study of Larsson et al. [16] there was a significant increase in CK and AST after the race in comparison to before the race. In contrast to our study, CPK did not increase in group of Italian mules used for wood transportation which demonstrating that the this type of workload was well tolerated and not excessive [9].
Similar to our results, the study of Bazzano et al., [9] reported significant increases in the concentrations of BUN, and creatine in mules after the draft work than before the work in Italy. The increase in Bun could be associated with the higher rate of protein breakdown caused by muscular activity during excessive workload.
A significant decrease in blood glucose levels was observed in mules at the end of the working season, similar to finding of Fazio et al. [17], where glucose levels tended to decrease during and after physical activity in horses. This decrease in glucose could be attributed to the greater muscle uptake of blood glucose, which is consistent with activation of the glycolytic pathways during work overload.
Our results showed significant increase of tCO2 at the end of the working session however the increase was within the normal range (20-33 mmol/L). The normal range for tCO2, taken from normal horses across several studies is from 23 to 38 mmol/L. The higher concentration of tCO2 is good indicator for the presence of metabolic acid base disturbances [18].
Our results showed that plowing work sessions had no significant effect on the blood lactate concentrations in mules. At the beginning of the study, mules showed average lactate concentration of 0.54 mmol/L, which is similar to what is reported in horses [10]. Blood lactate levels are commonly measured in horses to estimate the level of exercise fitness in the horse [19]. The study conducted by Assenza et al. [10] showed that a significant increase in blood lactate within 10 minutes and on the day after jumping competition versus resting time. During high-intensity exercise, fatigue occurs because of the engagement of muscle fibers that predominantly rely on anaerobic metabolism. The greater the exercise intensity, the higher the demand for anaerobic energy. As anaerobic metabolism increases, lactate production is directly increase in muscle fibers. Intracellular acidosis due to lactate accumulation has a negative feedback effect on the glycolytic enzymes required for energy production and mitochondrial respiration, resulting in a decline in ATP concentration. Lack of ATP prevents calcium recycling through the sarcoplasmic reticulum, resulting in accumulation of calcium in the sarcoplasm and slowing of the relaxation phase of muscle contraction [20]. Based on our results, it can be concluded that blood lactate may not be a reliable indicator of work-related fatigue in working mules.
Overall, the obtained results shows that mules used for plowing fields disrupt the mules’ micromineral and electrolyte profile. In addition, the increased CPK demonstrating that the workload was excessive. The increased biochemical parameters such as sodium, chloride and BUN at the end of the work session could suggest decrease in body water and decrease in renal blood flow. Therefore, providing electrolyte solutions during and after an event may help maintain hydration and prevent fatigue in working mules. Water intake can also be increased by offering or administering a saline solution both during and after endurance or work type exercise (e.g. plowing a field) [21].
5. Conclusions
Our findings suggest that the use of mules for plowing fields disrupts the mules' micromineral and electrolyte profile. Despite the common belief in the resilience of mules compared to horses, our findings reveal significant biochemical changes at the end of the plowing season. This indicates potential health risks and highlighting the necessity for proper monitoring and care of working mules to ensure their well-being. Appropriate management of animals, including sustainable workload, proper feeding, regular health monitoring, and the use of preventative medicine, is important to ensure the ethical use of animals. This study enhances our understanding of the biochemical responses in mules and adds to our knowledge of the impact of workload on their biochemical parameters, especially considering the limited information available about mule physiology.
Supplementary Materials
The following supporting information can be downloaded at the website of this paper posted on Preprints.org.
Author Contributions
Conceptualization, A.M. and J.M..; methodology, A.M., J.M., E.A..; software, EA.; validation, E.A.., AM and J.M..; formal analysis, E.A..; investigation, A.M. and J.M..; resources, A.M, J.M. and E.A..; data curation, E.A..; writing—original draft preparation, A.M. E.A..; writing—review and editing, A.M, J.M, and E.A..; visualization, A.M. J.M and E.A..; supervision, A.M. and J.M..; project administration, A.M. and J.M .; funding acquisition, A.M.. All authors have read and agreed to the published version of the manuscript.
Funding
This research was funded by the Equitarian Initiative and the T.S. Glide Foundation.
Institutional Review Board Statement
The study was approved by Ethics Committee) of the Equitarian Initiative. Owner consent was obtained from all owners who participated in the study.
Informed Consent Statement
Written informed owner consent was provided and all owners signed the consent.
Data Availability Statement
Data are available upon request.
Acknowledgments
Authors would like to thank APAT and the owners of the mules for participating in the study and the T.S. Glide Foundation and the Equitarian Initiative for funding.
Conflicts of Interest
The authors declare no conflicts of interest.
References
- De Aluja, A.S. The Welfare of Working Equids in Mexico. Applied Animal Behaviour Science 1998, 59, 19–29. [CrossRef]
- Starkey, P. Livestock for Traction and Transport: World Trends, Key Issues and Policy Implications . Animal Production and Health Working Paper, Food and Agricultural Organisation (FAO). 2011. [CrossRef]
- De Aluja, A.S.; Lopez, F. Donkeys in Mexico. Journal of Equine Veterinary Science 1992, 12, 389–392. [CrossRef]
- Mota-Rojas, D.; Braghieri, A.; Álvarez-Macías, A.; Serrapica, F.; Ramírez-Bribiesca, E.; Cruz-Monterrosa, R.; Masucci, F.; Mora-Medina, P.; Napolitano, F. The Use of Draught Animals in Rural Labour. Animals 2021, 11, 2683. [CrossRef]
- Arfuso, F.; Giannetto, C.; Fazio, F.; Panzera, F.; Piccione, G. Training Program Intensity Induces an Acute Phase Response in Clinically Healthy Horses. Journal of Equine Veterinary Science 2020, 88, 102986. [CrossRef]
- Mami, S.; Khaje, G.; Shahriari, A.; Gooraninejad, S. Evaluation of Biological Indicators of Fatigue and Muscle Damage in Arabian Horses After Race. Journal of Equine Veterinary Science 2019, 78, 74–78. [CrossRef]
- Brancaccio, P.; Lippi, G.; Maffulli, N. Biochemical Markers of Muscular Damage. Clinical Chemistry and Laboratory Medicine 2010, 48, 757–767. [CrossRef]
- Boyas, S.; Guével, A. Neuromuscular Fatigue in Healthy Muscle: Underlying Factors and Adaptation Mechanisms. Annals of Physical and Rehabilitation Medicine 2011, 54, 88–108. [CrossRef]
- Bazzano, M.; Arfuso, F.; Bonfili, L.; Eleuteri, A.M.; McLean, A.; Serri, E.; Spaterna, A.; Laus, F. Measuring Biochemical Variables and Serum Amyloid A (SAA) in Working Mules in Central Italy. Animals 2022, 12, 2793. [CrossRef]
- Assenza, A.; Bergero, D.; Congiu, F.; Tosto, F.; Giannetto, C.; Piccione, G. Evaluation of Serum Electrolytes and Blood Lactate Concentration During Repeated Maximal Exercise in Horse. Journal of Equine Veterinary Science 2014, 34, 1175–1180. [CrossRef]
- Foreman, J.; Waldsmith, J.; Lalum, R. Physical, Acid–Base and Electrolyte Changes in Horses Competing in Training, Preliminary and Intermediate Horse Trials. Equine Comp. Exerc. Physiol. 2004, 1, 99–105. [CrossRef]
- Sawka, M.N.; Montain, S.J. Fluid and Electrolyte Supplementation for Exercise Heat Stress. The American Journal of Clinical Nutrition 2000, 72, 564S-572S. [CrossRef]
- Vervuert, I.; Coenen, M.; Zamhöfer, J. Effects of Draught Load Exercise and Training on Calcium Homeostasis in Horses. Animal Physiology Nutrition 2005, 89, 134–139. [CrossRef]
- Baird, M.F.; Graham, S.M.; Baker, J.S.; Bickerstaff, G.F. Creatine-Kinase- and Exercise-Related Muscle Damage Implications for Muscle Performance and Recovery. Journal of Nutrition and Metabolism 2012, 2012, 1–13. [CrossRef]
- Octura, J.E.R.; Lee, K.-J.; Cho, H.-W.; Vega, R.S.A.; Choi, J.; Park, J.-W.; Shin, T.-S.; Cho, S.-K.; Kim, B.-W.; Cho, B.-W. Elevation of Blood Creatine Kinase and Selected Blood Parameters after Exercise in Thoroughbred Racehorses (Equus Caballus L.).
- Larsson, J.; Pilborg, P.H.; Johansen, M.; Christophersen, M.T.; Holte, A.; Roepstorff, L.; Olsen, L.H.; Harrison, A.P. Physiological Parameters of Endurance Horses Pre- Compared to Post-Race, Correlated with Performance: A Two Race Study from Scandinavia. ISRN Veterinary Science 2013, 2013, 1–12. [CrossRef]
- Fazio, F.; Casella, S.; Assenza, A.; Arfuso, F.; Tosto, F.; Piccione, G. Blood Biochemical Changes in Show Jumpers during a Simulated Show Jumping Test. Vet. arhiv 2014.
- Lindinger, M.I. Total Carbon Dioxide in Adult Standardbred and Thoroughbred Horses. Journal of Equine Veterinary Science 2021, 106, 103730. [CrossRef]
- Hauss, A.A.; Stablein, C.K.; Fisher, A.L.; Greene, H.M.; Nout-Lomas, Y.S. Validation of the Lactate Plus Lactate Meter in the Horse and Its Use in a Conditioning Program. Journal of Equine Veterinary Science 2014, 34, 1064–1068. [CrossRef]
- Munsterman, A. Fatigue During High-Intensity Exercise in Horses. In Merck Veterinary Manual; 2024.
- Munsterman, A. Prevention of Fatigue in Horses. In Merck Veterinary Manual; 2024.
Figure 1.
Working mules plowing up the field in Mexico. Mules are primarily used by contractors and medium-scale farmers.
Figure 1.
Working mules plowing up the field in Mexico. Mules are primarily used by contractors and medium-scale farmers.
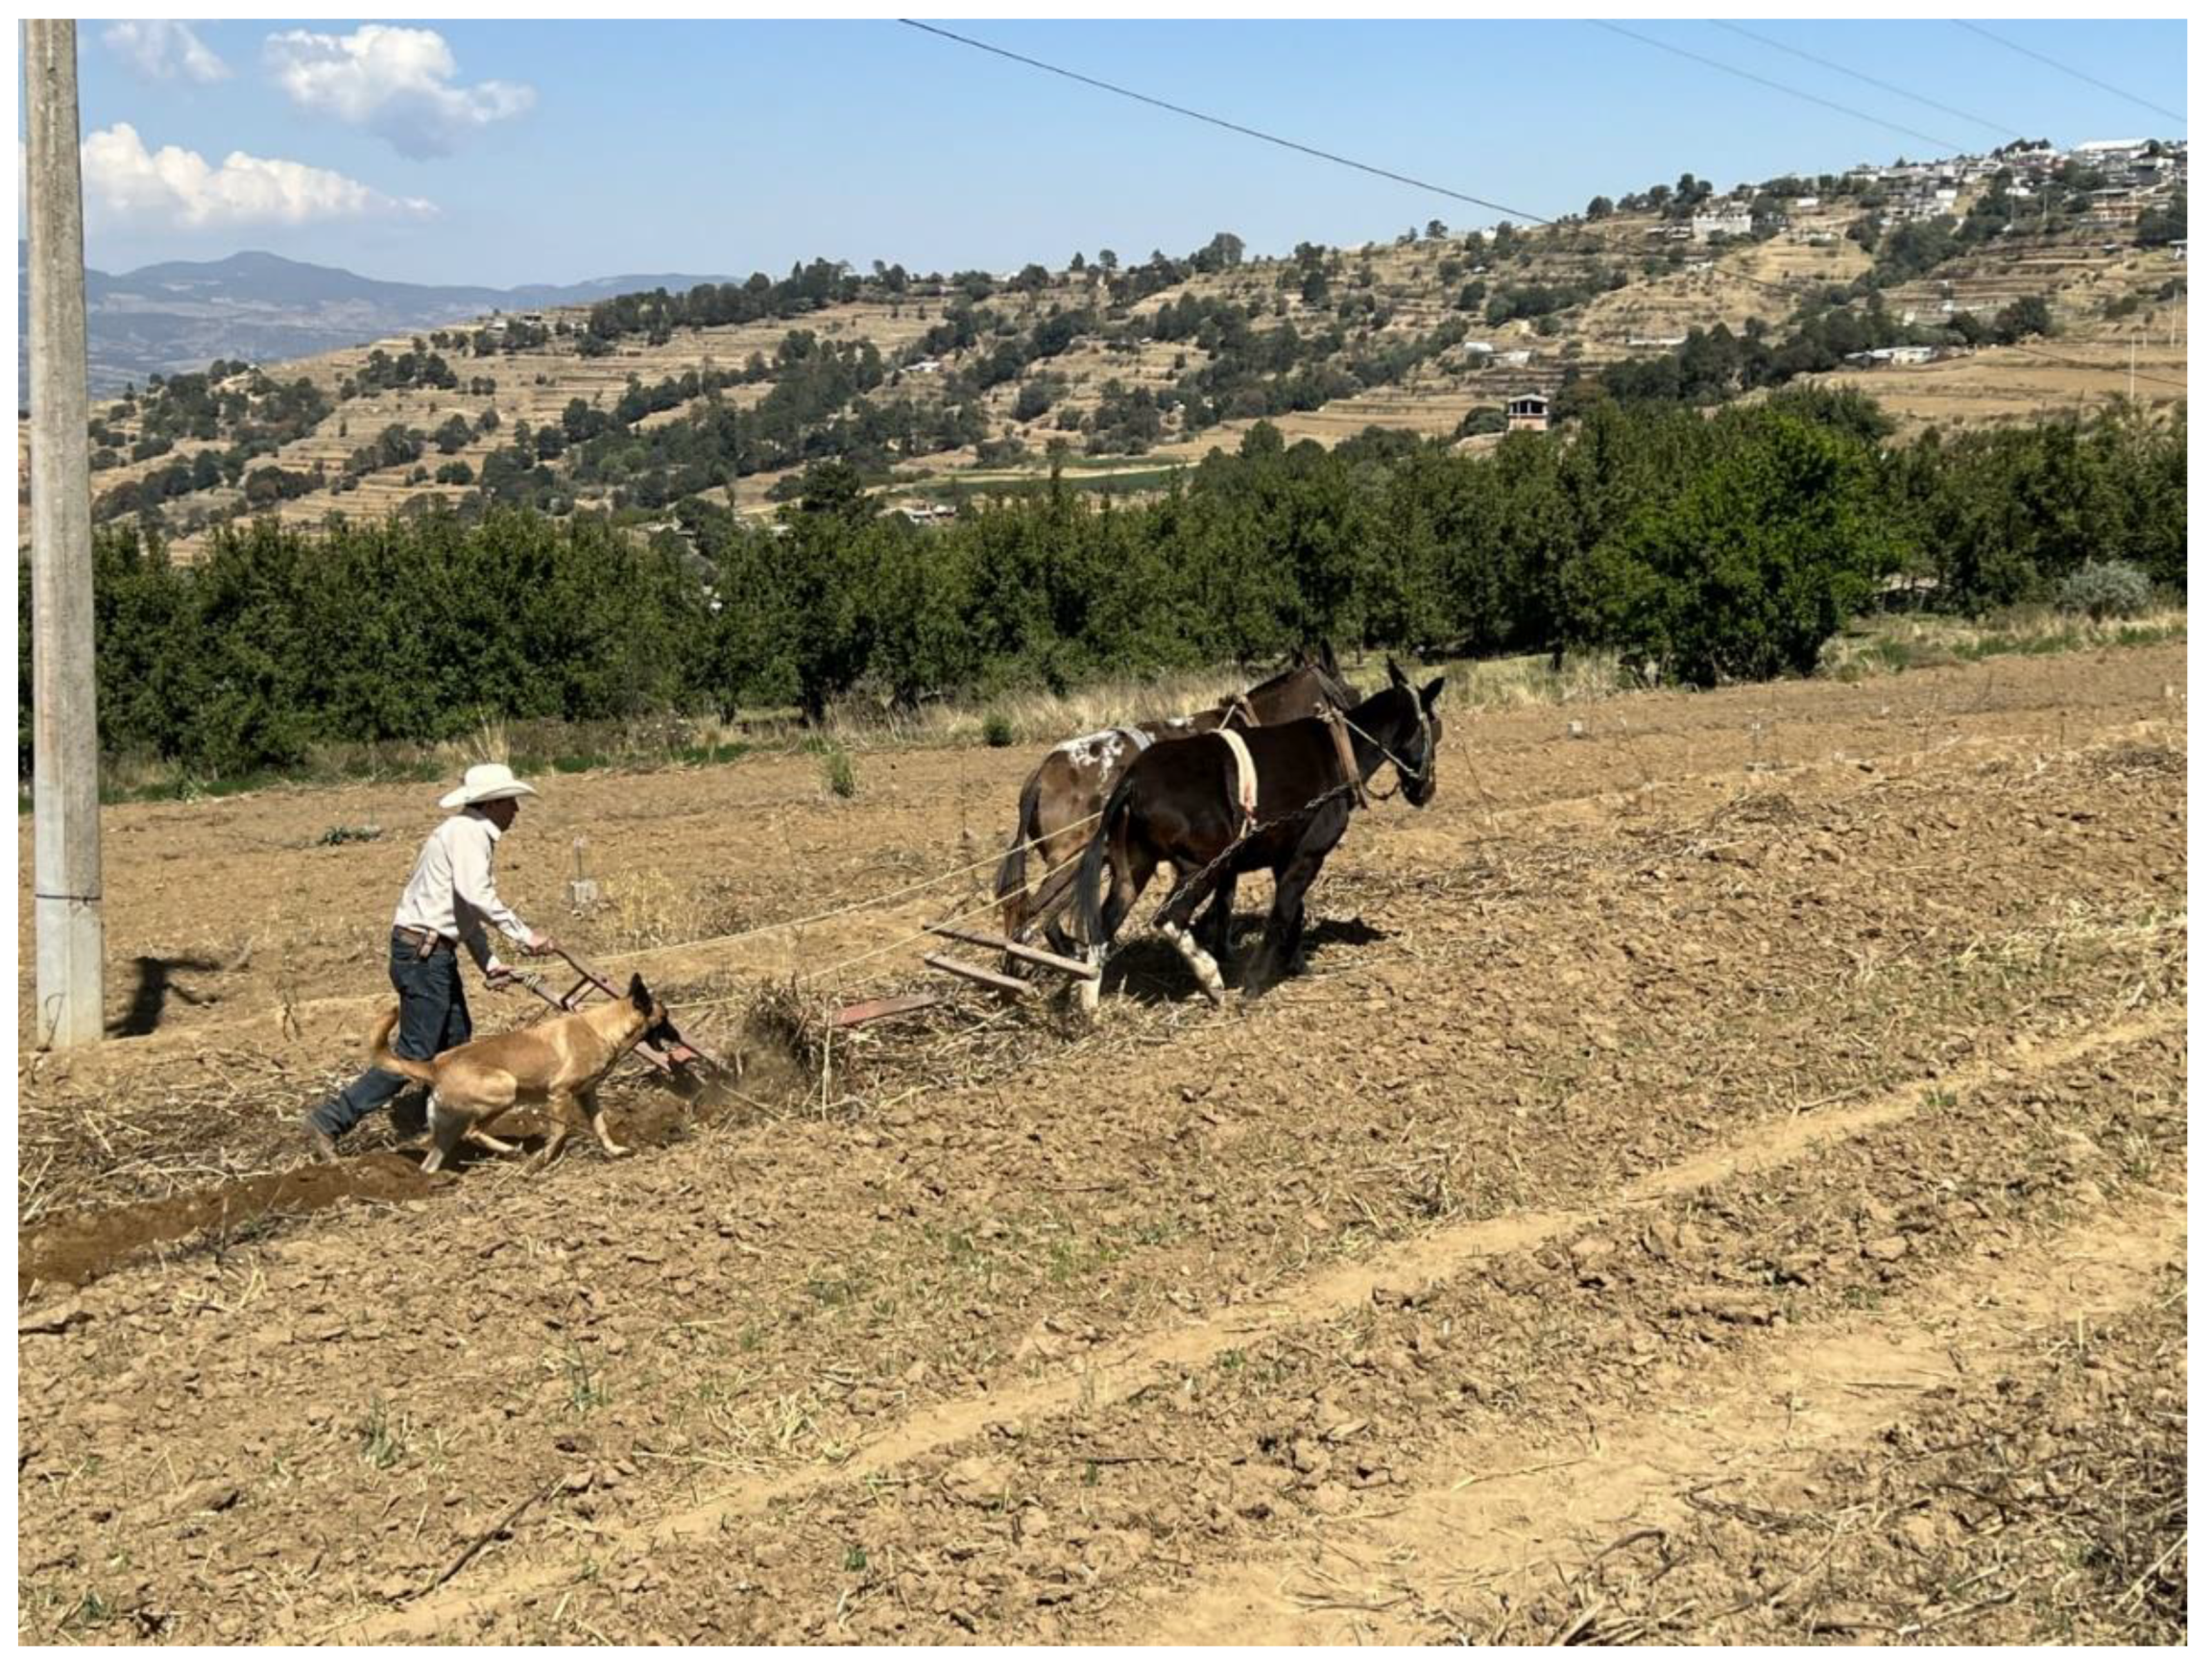

Table 1.
Mean and standard errors (SE) of studied biochemical parameters in mules beginning and after working season at three different time points (0, 3, and 6 hours) and associated test range.
Table 1.
Mean and standard errors (SE) of studied biochemical parameters in mules beginning and after working season at three different time points (0, 3, and 6 hours) and associated test range.
| Beginning of work season | End of work season | |||||||
| Variable1 | Unit | 0 h | 3 h | 6 h | 0 h | 3 h | 6 h | Test Range |
| ALP | U/L | 128.16± 22.18 | 137.66± 21.75 | 134.66 ±21.55 | 140.33 ±24.78 | 143 ± 25.08 | 148 ± 23.76 | 0-326 |
| AST | U/L | 301.16± 36.04 | 318.16± 36.11 | 314.5± 37.17 | 355.33 ± 34.94 | 353.33 ± 37.35 | 357.83 ± 38.04 | 92-610 |
| BUN | mg/dL | 13.08 ± 0.84 | 13.15 ± 0.98 | 14.1 ± 0.85 | 19.83 ± 0.30 | 19.93 ± 0.61 | 20.46 ± 0.88 | 10-30 |
| CREA | mg/dL | 1.45 ± 0.06 | 1.55 ± 0.04 | 1.58 ± 0.05 | 1.38 ± 0.04 | 1.51 ± 0.07 | 1.58 ± 0.09 | 0.70-2.0 |
| GLU | mg/dL | 68.33 ± 2.40 | 64 ± 7.58 | 56.66 ± 5.43 | 33.1 ± 2.47 | 31.76 ± 1.65 | 31.93 ± 1.50 | 63-136 |
| ALB | g/DI | 3.35 ± 0.08 | 3.51 ± 0.11 | 3.43 ± 0.11 | 3.5 ± 0.1 | 3.48 ± 0.14 | 3.51 ± 0.12 | 2.1-4.3 |
| TP | g/dL | 6.63 ± 0.06 | 6.93 ± 0.11 | 6.83 ± 0.06 | 6.76 ± 0.13 | 6.81 ± 0.12 | 6.85 ± 0.13 | 5.6-7.9 |
| TBIL | mg/dL | 1.56 ± 0.10 | 1.81 ± 0.18 | 1.85 ± 0.16 | 1.53 ± 0.11 | 1.6 ± 0.24 | 1.78 ± 0.30 | 0.0-3.5 |
| Ca | mg/dL | 10.85± 0.11 | 11.2 ± 0.24 | 11.03 ±0.28 | 11.65±0.23 | 11.63± 0.17 | 11.6 ± 0.14 | 11.5-14.2 |
| Na | mmol/L | 140.66±1.76 | 142.5± 0.95 | 141.5± 1.76 | 137.66±1.42 | 131.83±2.70 | 131.66± 1.28 | 126-146 |
| K | mmol/L | 4.2 ± 0.06 | 4 ± 0.17 | 3.73 ±0.20 | 3.48 ±0.18 | 3.23 ±0.29 | 3.06 ±0.32 | 2.5-5.2 |
| Cl | mmol/L | 107.5 ± 1.97 | 106.16±0.79 | 106.83 ±1.04 | 97.33±1.31 | 96.66±1.90 | 92.66± 2.88 | 94-104 |
| GGT | U/L | 12.5 ± 0.67 | 11.48 ±0.77 | 13.98 ±0.91 | 22.48 ± 4.24 | 18.33 ± 4.17 | 18.82±2.35 | 0-42 |
| CPK | U/L | 181± 27.58 | 151.83±12.89 | 173.16±10.04 | 355 ± 31.41 | 370.16 ± 53.33 | 335.33±41.32 | 0-350 |
| tCo2 | mmol/L | 28.48 ±0.64 | 28.5± 0.35 | 28± 0.75 | 30.63±0.73 | 30.61±1.53 | 30.46±0.99 | 20-33 |
| Glob | g/dL | 3.28± 0.11 | 3.41± 0.14 | 3.4±0.11 | 3.26 ±0.21 | 3.33 ± 0.19 | 3.33±0.19 | |
| Urea | mg/dL | 28 ± 1.80 | 28.13± 2.10 | 30.18±1.84 | 42.45 ± 0.65 | 42.68±1.31 | 43.81.907 | 21.4-64.2 |
| C-Ca | mg/dL | 11.36± 0.09 | 11.6 ± 0.20 | 11.48±0.25 | 12.03±0.18 | 12.03±0.08 | 11.98 ± 0.15 | |
| A/G | % | 1.03± 0.06 | 1.05 ± 0.07 | 1.01±0.07 | 1.1± 0.08 | 1.08± 0.09 | 1.06± 0.09 | |
| B/C | % | 9.11± 0.43 | 8.45 ±0.58 | 8.93±0.53 | 14.38±0.58 | 13.33±0.71 | 13.06±0.49 | |
| Na/K | % | 33.66 ±0.66 | 35.83 ±1.77 | 38.66±2.23 | 40.16±2.24 | 42.66±4.35 | 45.83±5.35 | |
| Lactate | mmol/L | 0.63 ±0.08 | 0.50 ±0.01 | 0.49 ± 0.00 | 0.68 ± 0.08 | 0.58 ± 0.03 | 0.63±0.03 | 0.5 - 25 |
1 ALP: Alkaline phosphatase; AST: Aspartate aminotransferase; BUN: Blood urea nitrogen; CREA: Creatinine; GLU: Glucose; ALB: Albumin; TP: Total protein; TBIL: Total bilirubin; Ca: Calcium; Na: Sodium; K: Potassium; Cl: Chloride; GGT: gamma-glutamyl transferase; CPK: creatine phosphokinase; Glob: globulin blood test; A/G: albumin/globulin ratio; B/C: BUN/creatinine ratio; Na/K: sodium-to-potassium.
Table 2.
Effect of treatment (pre- and post- work), timepoints (0, 3, and 6 hours), and their interaction on the CPK concentrations in working mules.
Table 2.
Effect of treatment (pre- and post- work), timepoints (0, 3, and 6 hours), and their interaction on the CPK concentrations in working mules.
| Effects | Coefficient ± SE | 95% CI | P- values |
| Treatment | |||
| Pre-work season | Referent | ||
| Post-work season | 174 ± 36.06 | 103.30 - 244.69 | <0.001 |
| Timepoint | |||
| 0 hour | Referent | ||
| 3 hours | -29.16 ± 36.06 | -99.86 - 41.52 | 0.419 |
| 6 hours | -7.83 ± 36.06 | -78.52 ± 62.86 | 0.828 |
| Treatment × Timepoint | |||
| Post-work season at 0 h | Referent | ||
| Post-work season at 3 h | 44.33 ± 51.01 | -55.64 ± 144.31 | 0.385 |
| Post-work season at 6 h | -11.83 ± 51.01 | -111.81 ± 88.14 | 0.817 |
Table 3.
Effect of treatment (pre- and post- work), timepoints (0, 3, and 6 hours), and their interaction on blood sodium (Na) concentrations in working mules.
Table 3.
Effect of treatment (pre- and post- work), timepoints (0, 3, and 6 hours), and their interaction on blood sodium (Na) concentrations in working mules.
| Effects | Coefficient ± SE | 95% CI | P- values |
| Treatment | |||
| Pre-work season | Referent | ||
| Post-work season | -3 ± 2.17 | -7.27 - 1.27 | 0.169 |
| Timepoint | |||
| 0 hour | Referent | ||
| 3 hours | 1.83 ± 2.17 | -2.43 - 6.10 | 0.400 |
| 6 hours | 0.83 ± 2.17 | -3.43 - 5.10 | 0.702 |
| Treatment × Timepoint | |||
| Post-work season at 0 h | Referent | ||
| Post-work season at 3 h | -7.66 ± 3.082 | -13.70; -1.62 | 0.013 |
| Post-work season at 6 h | -6.83 ± 3.082 | -12.87; -0.79 | 0.027 |
Table 4.
Effect of treatment (pre- and post- work), timepoints (0, 3, and 6 hours), and their interaction on blood potassium (K) concentrations in working mules.
Table 4.
Effect of treatment (pre- and post- work), timepoints (0, 3, and 6 hours), and their interaction on blood potassium (K) concentrations in working mules.
| Effects | Coefficient ± SE | 95% CI | P- values |
| Treatment | |||
| Pre-work season | Referent | ||
| Post-work season | -0.71 ± 0.28 | -1.27; -0.16 | 0.011 |
| Timepoint | |||
| 0 hour | Referent | ||
| 3 hours | -0.2 ± 0.28 | -0.75; 0.35 | 0.481 |
| 6 hours | -0.46 ± 0.28 | -1.02; 0.08 | 0.100 |
| Treatment × Timepoint | |||
| Post-work season at 0 h | Referent | ||
| Post-work season at 3 h | -0.05 ± 0.40 | -0.83; 0.73 | 0.901 |
| Post-work season at 6 h | 0.05 ± 0.40 | -0.73; 0.83 | 0.901 |
Table 5.
Effect of treatment (pre- and post- work), timepoints (0, 3, and 6 hours), and their interaction on blood chloride (Cl) concentrations in working mules.
Table 5.
Effect of treatment (pre- and post- work), timepoints (0, 3, and 6 hours), and their interaction on blood chloride (Cl) concentrations in working mules.
| Effects | Coefficient ± SE | 95% CI | P- values |
| Treatment | |||
| Pre-work season | Referent | ||
| Post-work season | -10.16 ± 1.84 | -13.77; -6.55 | <0.001 |
| Timepoint | |||
| 0 hour | Referent | ||
| 3 hours | -1.33 ± 1.84 | -4.94; 2.27 | 0.469 |
| 6 hours | -0.66 ± 1.84 | -4.27; 2.943 | 0.717 |
| Treatment × Timepoint | |||
| Post-work season at 0 h | Referent | ||
| Post-work season at 3 h | 0.66 ± 2.60 | -4.43; 5.77 | 0.798 |
| Post-work season at 6 h | -4 ± 2.60 | -9.10; 1.11 | 0.125 |
Disclaimer/Publisher’s Note: The statements, opinions and data contained in all publications are solely those of the individual author(s) and contributor(s) and not of MDPI and/or the editor(s). MDPI and/or the editor(s) disclaim responsibility for any injury to people or property resulting from any ideas, methods, instructions or products referred to in the content. |
© 2024 by the authors. Licensee MDPI, Basel, Switzerland. This article is an open access article distributed under the terms and conditions of the Creative Commons Attribution (CC BY) license (http://creativecommons.org/licenses/by/4.0/).
Copyright: This open access article is published under a Creative Commons CC BY 4.0 license, which permit the free download, distribution, and reuse, provided that the author and preprint are cited in any reuse.


