
Submitted:
09 August 2024
Posted:
12 August 2024
You are already at the latest version
Abstract
The aim of this study was to investigate and effect of application of different conditions of freeze-drying on the kinetics of process and the sorption properties of dried apples. Slices of apple were frozen and subjected to freezing-drying process with different combination of a shelf temperature (-20, 10, 20, 30°C) and pressure (37, 63, 103, 165 Pa). During the freeze-drying, the temperature in the centre of material was recorded. The moisture content in dried material and changes of water content dried apples stored at humidity of 75.3% were obtained. The Midilli et al. model was used to describe drying kinetics of the freeze-drying with good fit. Drying time decreased from 660 (variant with a constant shelf temperature of 30°C, pressure 63 Pa) to 1305 minutes (variant with temperatures −20: 10: 20: 30°C, pressure 63 Pa). For this reason, the most favourable experimental parameters were: temperature of 30°C and pressure of 63 Pa. However, application of these parameters caused higher absorption of water vapour during storage. Therefore, the selection of freeze-drying parameters should also be related to the expected properties of the final product.
Keywords:
lyophilization
; freeze-drying
; process conditions
; drying rate
; apple
; temperature and pressure ramp
1. Introduction
The freeze-drying process is a process in which the free water contained in the product must remain frozen throughout its duration [1]. The frozen state prevents the structure from flowing and deforming, thanks to which, in the case of freeze-dried material, there is no drying shrinkage and the material’s structure is preserved, practically unchanged compared to fresh material [2,3].
The freeze-drying process consists of three phases: freezing, the first drying period (sublimation phase) and the second drying period – (desorption phase) [4,5,6]. In the primary (sublimation) period, the product temperature depends on the material properties, shelf temperature, chamber pressure of the freeze dryer, sublimation rate, and container system. Therefore, it is difficult to optimize the freeze-drying. The philosophy of primary drying is to select the optimal temperature for a given raw material, quickly bring the product to the assumed product temperature, and keep the product temperature more or less constant throughout the primary drying period [1,7].
On the other hand, it should be kept below the critical temperature (Tc) for a given material, at which the structure of the material collapses during freeze-drying [7,8]. The sublimation phase ends when there is no more water in the material in the form of ice. The temperature of the material during this period must therefore remain below the triple point - 0°C in the case of pure water, and below a cryoscopic temperature in the case of solutions [7].
The second phase of freeze-drying is desorption drying. During this phase, water desorption occurs. This period occurs mainly after the end of sublimation, but it begins even at the beginning of the sublimation period in places (regions) from which the ice has been removed. This is because, that during the entire process, there are two regions in the dried material: one from which water has sublimated, and the other in which water is frozen and its content is equal to the water content in the frozen product [9].
During desorption, non-freezing water is removed. After primary drying, an amorphous product still contains a fair amount of residual water (5–20% on a dried solid basis), depending on the formulation and structure [2,6]. Dried products in the food industry can be divided into two groups: plant or animal raw materials with a preserved cellular structure and processed products without a cellular structure. The final water content in freeze-dried juices, suspensions, or pulps may be lower than 1%. However, the final moisture content of freeze-dried cellular materials is between 0.5 and 3% [10].
Cellular structure is extremely important in freeze-drying because the presence of the cell membrane resists the movement of heat and mass [11]. The cell membrane holds the cell fluid, whether it is frozen or liquid. Therefore, during freeze-drying of plant or animal tissues, it is difficult to notice whether the cell fluid has thawed or not [2,3]. The appearance of free water causes the material to flow, cell deformation, and ultimately shrinkage.
To avoid thawing of the product during freeze-drying, it is important to select the appropriate parameters of the freeze-drying process (Figure 1). The parameters that can be controlled in the freeze-drying process are [12]:
- working pressure,
- the flow of supplied heat (in the case of contact heating - shelf temperature),
- safety pressure.
The working pressure in the freeze dryer chamber is related to the material temperature through the thermodynamic equilibrium curve: evaporation temperature versus ambient pressure (Table 1) [12]. Therefore, the temperature of the material during the period of intensive sublimation depends on the value of the set pressure. For example, at a pressure of 63 Pa, the material during intensive evaporation, the frozen product maintains a temperature of -25°C. Theoretically, the pressure in the chamber freeze dryer should be below 610 Pa (water triple point parameter). For plant and animal cellular material, the pressure in the chamber should be within the range of 63 to 124 Pa [13]. This is related to the composition of cell juice and osmotic pressure resulting from the presence of simple sugars and minerals as osmotically active substances influencing the freezing temperature [14,15].
Lowering the pressure lowers the evaporation temperature and vice versa. Such a dependence occurs only in conditions when the resistance to mass transport inside the material is lower than the resistance to water vapor penetration from the surface of the material to the surroundings, similar to the first period of convective drying.
The temperature during primary drying must be maintained within certain limits, depending on the type of material, its chemical composition, and in particular on the glass transition temperature. To prevent melting or collapse of the structure, the product temperature should be several degrees lower than the glass transition temperature [16]. It should also correspond to the temperature at which 100% of free water is frozen. For fruit, it is -25 to -30°C. On average, in fruits, free water constitutes about 96% of the total water [6]. In apples, non-freezing water constitutes about 3.7% of the total water content [17].
The temperature in the desorption drying phase may be increased, but for apples at the end of desorption drying it should not exceed the temperature of +38°C, i.e. the glass transition temperature for an apple containing 0.5% water concerning to the dry substance [17].
By lowering the working pressure in the freeze-drier chamber, the ability to sublimate is significantly reduced because the temperature difference between the condenser and the vapor above the evaporation surface, which is the driving force, decreases [1,18].
For sublimation to occur, it is necessary to provide heat for phase transfer. The heat source may be a shelf (contact heating), infrared radiation, or microwave heating. In the case of contact heating (most often used), the appropriate shelf temperature should be set to ensure the necessary heat flux [1]. The temperature of the material is the result of the temperature of the dry and ice regions. Therefore, it can only increase as a result of the completion of the sublimation process, not as a result of providing too high a heat flux. Since, as a result of reducing the amount of ice inside the material, the amount of vapor produced is limited, it is advisable that the amount of heat supplied decreases during the process, which is used in industrial solutions [12].
Safety pressure protects against excessive heat flow and thus against the melting of ice. Once it is reached, the heating is turned off, which limits the amount of heat supplied and protects the material against undesirable temperature increases. Its value is usually set at a level that ensures an acceptable increase in the temperature of the frozen material (usually by 2 to 5 °C compared to the temperature resulting from the working pressure) [7].
The condenser temperature results from the design of the freeze dryer and is not an adjustable value. Usually, it is a temperature of -50 to -60°C, in solutions for the pharmaceutical industry it reaches a value of −90°C [12].
Analyzing the works presented in the literature, most authors do not justify the freeze-drying parameters used, and often even omit them (Table 2). In some cases, these parameters seem unreasonable. Examples of freeze-drying parameters used for drying fruit and vegetables are presented in Table 2.
Gianfrancesco et al. [19] used variable heating shelf temperature. They concluded that the product temperature should be maintained below the collapse temperature during the primary drying step. During the desorption step, the temperature should be gradually increased following the glass transition line to accelerate dehydration.
Taking into account the need to adjust the freeze-drying parameters to a given stage of the freeze-drying process [19], a thesis was put forward that the course of the freeze-drying process and the quality of the dried product can be influenced by linear or step changes in the process parameters (working pressure and shelf temperature). Based on our own experience and a review of the literature (Table 2), algorithms for temperature and pressure changes were proposed to find the variant best suited to changes in the amount of ice and water content that occur in the material during drying, for a specific material.

Table 2.
Some examples of controlling freeze-drying parameters
| Material | Sample preparation | Freeze-drying parameters | Ref. | ||
| Apple | slices 4 and 8 mm | T (condenser) = −48°C IR lamp (T = lack of data), Pressure = 13.3 Pa Material temperature control: no |
[20] | ||
| Apple | slices 5 mm | T shelf variable during the process: 20_45_55_50°C, T (condenser) = −40° Pressure= 100 Pa, Time 15 h Material temperature control: yes |
[21] | ||
| Apple | rectangular size 17 x 17 x 10 mm | T= 70°C°C and Pressure = 40-45 Pa (sublimation) T=90°C, Pressure = 30–35 Pa (desorption) Material temperature control: no |
[22] | ||
| Apple puree gel | cylinder with d= 13.5 mm, height of 13. 7 mm | T (shelf) = 20°C Pressure = 63 Pa, Time =24 h Material temperature control: no |
[23] | ||
| Banana | cylindrical shape with a d= 20 mm and thickness from 10 to 20 mm | Temperature of IR radiator range of 50–70°C Pressure =0.5 Pa Time =6 h Material temperature control: no |
[24] | ||
| Blackberries | Juice with carrier agents | T = –84°C (shelf or condenser T- not reported) Pressure: 4 Pa, Time: 48 h Material temperature control: no |
[25] | ||
| Carrot | 3-4 mm slices | T (shelf) = 30°C, T (condenser) = –60°C Pressure = 6 Pa, Time =n/a Material temperature control: no |
[26] | ||
| Carrot | cylinders of 4.5 mm diameter and 7. mm thickness | T (shelf) = 25°C Pressure = 60 Pa, Time =24 h Material temperature control: no |
[27] | ||
| Carrot and horseradish |
0.5 cm slices | Primary drying: T (shelf) = –35°C, Pressure = 50 Pa Secondary drying: Pressure = 4 Pa, T rising continually to +18°C Material temperature control: no |
[28] | ||
| Guava and papaya | 1x1x1 cm cubes | T (shelf) = 10°C Pressure = less than 613.2 Pa, Time =24h Material temperature control: no |
[29] | ||
| Model instant powder solution |
model spheres (d= 2 cm) with sucrose coating | Isotherm at T = (−7)°C (12 h) Isotherm at T =(−3)°C (12 h) Isothermal drying at T=−27°C ( 5 h) T ramp from −27°C to 20°C at 1°C/min T ramp from −70°C to 20°C at 4°C/h Isotherm at T =−60°C for 20 h T ramp from −60°C to 20°C at 4°C/h T ramp from(−60°C to −40°C at 0.5°C/h T ramp from −40°C to 20°C at 1.25°C/h Pressure 20 Pa Material temperature control: no |
[19] | ||
| Pineapple, cherry, guava, papaya, and mango | pulp, thickness of 1 cm | T = –30°C (shelf or condenser T-not reported), Pressure= 130 Pa, Time 12 h Material temperature control: yes |
[30] | ||
| Pumpkin, green bell pepper | samples of 2 x 2 cm | T = between–47 and –50°C (shelf or condenser T- not reported), Pressure= 0.67 Pa, Time 38 h Material temperature control: no |
[31] | ||
| Snack with apple or chokeberry pomace | 14 × 10 × 2.5 cm | T (shelf) = 30°C, Pressure = 63 Pa Time =48 h |
[32] | ||
| Strawberry | slices 5 or 10 mm, or whole fruits | T shelf (30, 40, 50, 60 and 70°C) T (condenser) = −92°C Vacuum level of less than 5 ml Time: 12 h in the case of slices and 24 and 48 h in the case of whole fruits Material temperature control: yes |
[33] | ||
| Vegetable soups | cylindrical container d= 20 cm, height=2 cm | T (shelf) = 20°C, T (condenser) = −55°C Pressure = 63 Pa, Time =24 h Material temperature control: no |
[34] | ||
The paper aimed to evaluate effect of application of different conditions of freeze-drying on the kinetics of lyophilisation and the sorption properties of dried apples.
2. Materials and Methods
2.1. Material
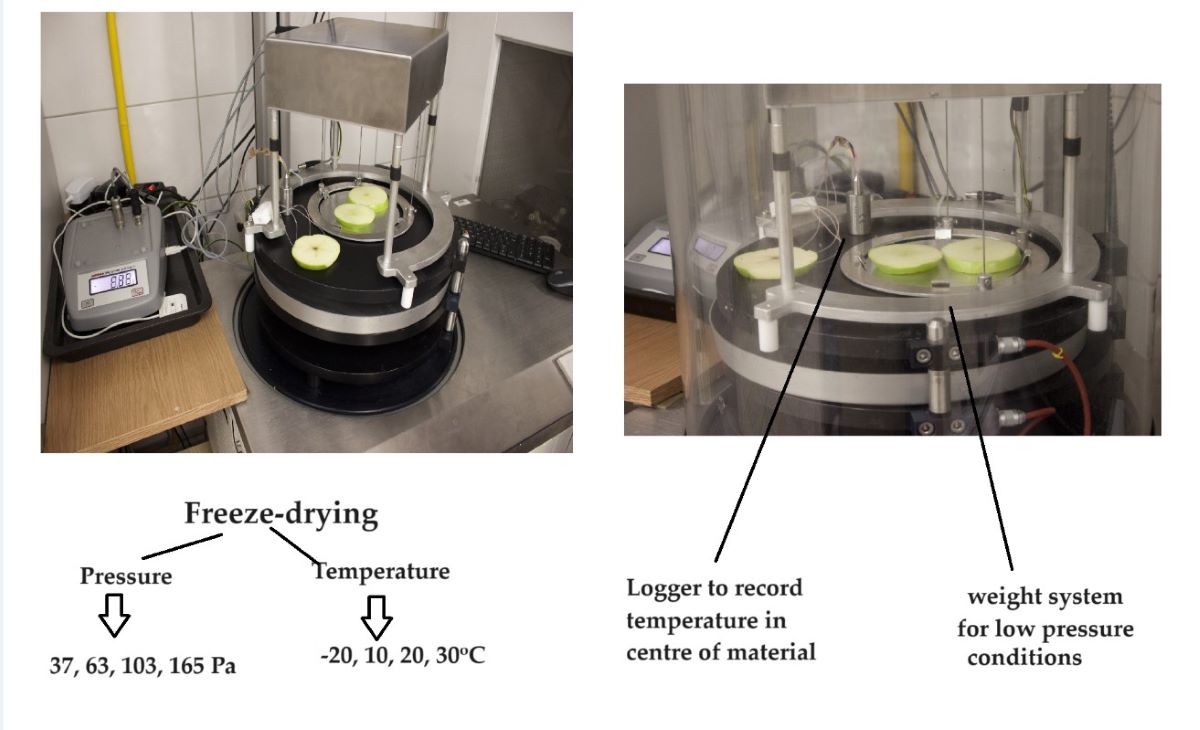
The Granny Smith apples were purchased at the local market and used in the investigations. This variety of apples was selected due to its year-round availability. The fruits were stored at refrigeration conditions in a temperature of 5 °C.
Whole fruits were cut into slices with a thickness of 10 mm using the Robot Coupe CL50 slicer (Vincennes, France). The outer slices of apples were not used, only the samples with a diameter of approximately 70 mm were subjected to freezing.
2.2. Freezing of Samples
The slices of apples were frozen to a temperature of -40 °C for 2 hours using a convention freezer with a forced air circulation (Irinox HC 51/20, Corbanese, Italy). Additionally, thermocouples with a wireless logger (TrackSense®, Ellab, Hilleroed, Denmark) were placed inside some slices of material (before freezing) to record the temperature at 2-minute intervals during the freeze-drying process.
2.3. Freeze-Drying of Apple Slices
The freeze-drying process was carried out using a Gamma 1-16 freeze-dryer (Martin Christ Gefriertrocknungsanlagen GmbH, Osterode am Harz, Germany). The temperature and pressure of the process were controlled by the software of the freeze-dryer. Different conditions of process (pressure and shelf temperature) were applied. Table 3 describes, the procedure of parameter changes during the freeze-drying. The variants 1-6 were characterised by different shelf temperatures with constant pressure of 63 Pa (Table 3a). Variants 7-10 showed the condition of the process with different ranges of pressure and temperature (Table 3b).
After the freeze-drying, the results of temperature measurement were downloaded from a TrackSense logger with the application of software ValSuite Basic 2.4.5 (Ellab, Hilleroed, Denmark). The profiles of temperature changes in the centre of the material during freeze-drying were plotted.
2.4. Kinetics of the Freeze-Drying at Different Process Parameters
During the freeze-drying, the weight loss of the apples was measured and recorded online with the application of a weight system (model SWL025, Mensor, Warsaw, Poland). The measurement was carried out according to the procedure described by Nowak and Jakubczyk [15].
The recorded weight loss during the freeze-drying was used to calculate the moisture ratio MR (dimensionless).
where: u - water content at the time, uo - initial water content, ue - equilibrium water content, (g water / g d.m.).
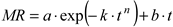
The drying curves were created to present the changes in moisture ratio over time. Regression analysis was carried out with the application of Table Curve v. 5.01 program (Systat Software Inc., Palo Alto, CA, USA). The Midilli et al. model (2) was used to describe drying curves for different conditions of the freeze-drying process. The parameters of fit were calculated: the determination coefficient (R2) and the root mean square error- RMSE.
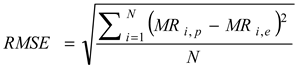 where: a, k, n, b- parameters of Midilli et al. equation, t- time of drying (min), MR i,p -the predicted moisture ratio, MR i,e - the experimental moisture ratio, N- number of experimental data.
Based on the data obtained with the Midilli et al. model, Table Curve v. 5.01 program (Systat Software Inc., Palo Alto, CA, USA) was applied to calculate the drying rates as the first derivate dMR∙dt-1. The curves describing the changes of drying rate (min-1) versus drying time (min) were plotted.
The moisture content of freeze-dried apples (%) was investigated according to the procedure described by Nowak and Jakubczyk [15].
Based on the drying curves and profiles of temperature changes in material during freeze-drying, drying times required to reach inside of material temperature of −2°C and −10°C were determined. Additionally, the water content (g water g-1 dry matter) in dried material at these times was obtained. Also, the final drying time was noted (when water content reached equilibrium, approximately 0.05 g water / g d.m.).
2.5. Water Sorption Kinetics
The water sorption kinetics was carried out according to the protocol described by Jakubczyk et al. [35]. The slice of apple was weighed every 2 minutes during the storage in a chamber with a relative humidity of 75.3% ate temperature of 25°C. The data were recorded during 24 hours of sorption process using the PW-Win software (Radwag, Warsaw, Poland). The water sorption kinetics curves were plotted as water uptake by material (g water/ g d.m.) during sorption time.
2.6. Statistical Analysis
One-way ANOVA analysis and Tukey’s Honest Significant Difference method (The Statistica v 13.3 StatSoft Inc., Tulsa, OK, USA) were applied to evaluate the statistical difference between obtained data for different conditions of the freeze-drying process.
3. Results and Discussion
3.1. Freeze-Drying Kinetics of Apple Slices at Different Conditions of the Process
The freeze-drying kinetics of apple slices at different process conditions were described by Midilli et al. model. This model was selected based on results of the our previous experiments with freeze-drying of apples with PEF treatment [15]. Also, other investigations of the freeze-drying process of different fruits [36,37] showed that Midilli et al. model coincided very closely with experimental data. The model with very high value of determination coefficient R2 and a very low value of the root mean square error RMSE can be used for the explanation of the drying characteristics [36,38]. Table 4 shows the constants of Midilli et al. model and statistical parameters describing the goodness of fit. As can be observed, all samples showed values of R2 higher than 0.999, and very low values of RMSE ranged from 0.0020 to 0.0053. Benlloch-Tinoco et al. [36] applied also this model to describe the kinetics of freeze-drying, microwave, or hot-pre-dried kiwifruit puree and obtained RMSE value between 0.0011 and 0.0061. Also, Igual et al. [37] reported the low RMSE values (0.0025-0.0062) of this kinetics model for grapefruit freeze-dried formulations, which is in the agreement with our results.
In kinetics models k constant can be linked with drying rate but n parameter is mainly affected by initial water content or drying pre-treatment [36,39,40]. The higher values of k can indicate the higher drying rate and the shorter time of the process [40]. The highest values of k 1.9 and 1.6 were obtained for variants t:30, p_63_103; (8) and t:30, p:63; (4), respectively (Table 4). In both variants of freeze-drying the temperature of shelf was the same (30°C), but the applied pressure was different. Results presented in Table 5 also showed that the shortest times of the process were recorded for these two samples. Additionally, the course of drying curves indicated that the application of these conditions of the process (temperature 30°C, pressure 63 Pa or pressure ramp of 63-103Pa) accelerated the dehydration process (Figure 2a,b). The highest n parameter was obtained for variant t:−25_10_30, p:63_165_103; (10) with shelf temperature increase from -25 to 30°C and pressure changes in the sequence of 63_165_103 Pa during freeze-drying. The highest value of n parameter was related to the lowest value of k constant of model (Table 4). The decrease of k may compensate for an increase in n parameter. It may lead to a similar course of drying kinetics for different values of constants. However, both constants can be affected by different process variables [37,41].
Figure 2a presents the experimental drying curves obtained during freeze-drying of apples at constant pressure and different temperatures. The variants t:10, p:63; (1) and t:10_30, p:63; (2) had a similar course of drying curves. However, an increase of temperature from 10 to 30 during the first 10 hours of drying for variant (2) caused the shortening of drying time from 930 to 855 minutes. Application of the shelf temperature of 30°C during the entire process accelerated lyophilisation and the drying time was 660 minutes. Gradual increase of the shelf temperature from −25 to 30°C at different time intervals resulted in extending the drying time by up to 2-fold for variant t:−25_10_20_30, p:63; (6). Egas-Astudillo et a. [42] observed during freeze-drying of grapefruit puree with or without the addition of biopolymers that an increase of a shelf temperature from 20 to 40°C reduced drying time up to 57.5%. A two-fold shortening of drying time was also observed for the freeze-drying of mulberry fruits due to an increase of the heating plate from 30 to 70°C [43].
Variants (9) and (10) were obtained at similar steps in temperature changes but at different pressure conditions (Figure 2b). Application of more pressure intervals with higher pressure caused an increase of drying time from 820 minutes (variant 9) to 945 minutes (variant 10). Variations in chamber pressure from 0 to 26.6 Pa had little or no effect on drying time and rate during the secondary drying of the solution of mannitol and moxalactam [44]. A similar course of drying curves was observed for material dried at different conditions of pressure and temperature (Variants: t:10_30,p:63_103_37;(7) and t:−25_10_30,p:63_103;(9). It may indicate that a similar course of the drying process can be obtained by modifying the values of pressure and temperature parameters at different intervals.
The drying time was different for applied variants of process but the final moisture content in dried material differed slightly and was in the range between 2.74 to 3.55% (Table 5).
Figure 3 presents the changes in drying rate during time of freeze-drying process of apples. Drying rate curves were obtained by the differentiation of the Midilli et al. model. The highest drying rate was observed for variant t:30, p:63; (4) during the first 200 minutes of the process with a maximal value of 0.0028 min-1 (Figure 3a). At the end of the process, the drying rate for this variant was reduced by 4 times. Application of ramp increase of temperature from 10 to 30°C (variant t:10_30, p:63; (2)) caused the decrease of maximum and final drying rate to 0.0019 min-1 and 0.0004 min-1, respectively. Also, the more steps in changes of shelf temperature (slower increase of temperature) between -25 and 30°C (variants 5 and 6) reduced slightly drying rate, especially after 400 minutes of drying. However, materials obtained with the same intervals of shelf temperature increase -25: 10: 30°C (variants 3 and 5) but with different durations of some temperature ramps showed different course of drying rate curve (Figure 3a). The slower drying rate was observed for variant 3 during the first 3 hours of the process (when shelf temperature increased from -25⁰C to -10⁰C during 4 hours) than for variant 5 (when the same range of temperatures was obtained during 1 hour). After this stage of drying, the faster changes of shelf temperatures from 10 to 30°C for variant 3 led to higher drying rate than observed for variant 5. Additionally, the almost constant drying rate was obtained for variant 3 for drying time between 145 and 290 minutes which was not observed for variants with constant pressure (Figure 3a). It may be concluded that the rate of changes in shelf temperature can be also crucial in the intensification of the freeze-drying process. In case of changes of pressure and shelf temperature, a variant with the highest shelf temperature and two steps in pressure change t:30, p:63_103; (8) had the highest drying rate at maximum (0.0028 min-1) (Figure 3b). More changes in pressure 63:165:103 Pa for variant 10 caused a decrease of drying rate in comparison to variant 9 with pressure changes 63_103 Pa (during the first 400 minutes). Variant 9 was longer dried at lower pressure than variant 10 which increased the drying rate (Figure 3b). This is in agreement with investigation at which the lowering of pressure from 0.5 to 0.1 mbar caused the increase of drying rate from 5.47 to 8.40 g/h for strawberries [45].
3.2. Effect of Changes in the Set Freeze-Drying Parameters on the Material Temperature
3.2.1. Effect of Changes in the Set Shelf Temperature
The assumption of this part of the experiment was to select the most favorable shelf temperature profile, which, on the one hand, allowed for a shorter freeze-drying time, and on the other hand, ensured that the water in the material was kept in an ice state. Usually, at the beginning of the process, the evaporation surface is equal to the external surface of the material. During evaporation, intercellular spaces are exposed, which increases the evaporation surface and increases the sublimation rate (Figure 3). This justifies the proposal to increase the shelf temperature during the sublimation period (primary drying). Haseley [12] recommended to increase the shelf temperature during the desorption period. This is justified by the intensification of the desorption process. However, an increase in temperature, often associated with a decrease in pressure, can lead to the removal of bound water. This water often acts as a stabilizer of the protein structure and its removal can cause the deactivation of proteins. Therefore, when selecting the freeze-drying parameters, the properties of the material subjected to freeze-drying should be considered.
Figure 4 shows the changes in the material temperature during sublimation and desorption experiments conducted at a constant or variable shelf temperature and at a constant pressure of 63 Pa. When the set shelf temperature was 10°C (t:10, p:63 (1); Figure 4, blue line), the material temperature changed within the range of -25 to -22°C during the first 10 hours of the process. After this time, almost 87% of water was removed from the material.
Figure 5 shows changes of moisture ratio and temperature of the material during the freeze-drying for the variant t:10_30, p:63; (2). The drying times required to reach a temperature of −2°C (the cryoscopic temperature for apple [12]) and −10 °C (the temperature at which 85% of water from the apple is removed[12]) were determined (Table 6). Additionally, the moisture content in material obtained at these freeze-drying times is presented in Table 6. When the cryoscopic temperature was reached after 812 minutes of the process, the material contained 0.10 g water/g d.m. (98.2% of the water removed) (Table 6). This means that practically all free water and partly adsorbed water were removed from the material during this period. The amount of supplied heat was used entirely for sublimation and desorption, not for heating the material. The final temperature of the material was close to 20°C, which resulted from the fact that the freeze dryer was at ambient temperature, so a certain heat flow to heat the material was taken from the environment. It should also be remembered that the temperature in the freeze dryer chamber, which is at ambient temperature, is a few degrees lower than the temperature outside the freeze dryer. This is an additional source of heat. Therefore, too slow a sublimation process does not allow maintaining a low temperature of the material.
When the set shelf temperature was 30°C (t:30, p:63 (4); Figure 4, grey line), the material temperature increased within the first 1 hour to nearly -20°C. Within the first 458 minutes of the process, the material reached cryoscopic temperature. There was still about 13% water left in the material (0.7 water/g d.m.) (Table 6). This amount is within the limits of the amount of adsorbed water, which means that some of the ice did not melt. When the set shelf temperature increased from 10 to 30°C within 10 hours (t:10_30, p:63 (2); Figure 4, red line), the material temperature changed within the range of −25 to −22°C, within the first 7 hours of the process 71% of the water was removed from the material. At the time of reaching the cryoscopic temperature (after 664 minutes of the process) the water content in the material was about 0.4 g water/g d.m. (about 93% of water removed) (Table 6). These values also indicate that water evaporated from the frozen state. The linear increase in shelf temperature from 10 to 30°C within 10 h shortened the sublimation time (compared to the process t:10, p:63 (1) by about 20%, without disturbing the sublimation process. When the initial shelf temperature was −25°C, and it was programmed to increase to 10°C within the initial 5 hours of the process (t:-25_10_30, p:63 (3), Figure 4, brown line), the material temperature increased faster than in the case of processes (1) and (2) (markings in Table 3). This means that the amount of heat supplied to the material was too low. The cooling effect caused by sublimation was too weak, so the material temperature increased. The temperature of -2°C was reached after 670 minutes of the process. There was still about 11% of the initial amount of water in the material (0.624 g water/g d.m.) (Table 6).
In the case of variant t: −25_10_30, p:63 (5), the temperature profile used in the t: −25_10_30, p:63 (3) experiment was modified. The time to reach the shelf temperature of 10°C was shortened, then it was maintained at a constant level for 5 hours, after which the temperature was ramped up to 30°C and maintained at a constant level for the next 10 h of the process (Table 3). The changes in the material temperature in this experiment are shown by the green line in Figure 4. The applied modifications did not cause any beneficial changes in the course of the process. Although the cryoscopic temperature was achieved after a similar time (638 minutes), a smaller part of the water was removed from the material – about 80%. The water content of 1.211 water/g d.m. suggests that some free, unadsorbed water was present in the material, which may indicate the melting of the material (Table 6). In variant 6 (t: −25_10_20_30; Figure 4, pink line), in which the heat supply was slowed down in the first hour of the process, the material temperature increased to -20°C, which is higher than the equilibrium temperature corresponding to a pressure of 63 Pa. The temperature of −2°C was reached after 744 minutes. The water content in the material was 0.891 g water/g d.m. (Table 6). It was relatively high, although it was within the limits specified for the end of freeze-drying [6].
The course of the curve with the material temperature changes shows a good reaction to changes in the shelf temperature in the desorption process and the possibility of influencing the final water content. After 19 h of the process, after reaching the shelf temperature of 20°C, the water content stabilized at 0.10 g water/g d.m. (Figure 4, Table 6) The increase in shelf temperature increased the material temperature, which reduced the water content in the material to 0.04 g water/g d.m. (Table 6). This shows the possibility of controlling the final water content in the freeze-dried material.
3.2.2. Effect of Changes in the Set Pressure
The variable pressure was programmed for four selected variants of shelf temperature profiles. The effect of pressure changes is shown in Figure 6.
In the experiment shown in Figure 6a, instead of a constant pressure of 63 Pa, a pressure of 103 Pa was set in the sublimation period and a pressure of 37 Pa in the desorption period. The increase in pressure, following the theory (Table 1), caused the material temperature to increase to −20°C. The material reached cryoscopic temperature after 554 minutes of the process but with a higher water content of 0.874 g water/g d.m. (Table 6). The decrease of the pressure in the desorption period increased the rate of water removal from the material but did not affect the final water content in the material. Increasing the pressure to 103 Pa, in the experiment, in which the shelf temperature was 30°C, practically did not affect the course of the temperature change curve (Figure 6B). The cryoscopic temperature was reached after 404 minutes of the process, and the water content in the material, after this time, was about 20% higher compared to the variant t:30, p:63; (4) (Table 6). However, the course of the temperature change curve showed a decrease in the material temperature as a consequence of the increase in pressure. This was caused by a decrease in the temperature of the water vapour generated, and thus an increase in the temperature difference between the water vapour and the condenser. This increased the amount of heat used for sublimation [1]. The pressure modification practically did not affect the final water content and the final time of freeze-drying (Table 5).
The increase of ramp pressure from 63 to 103 Pa during the first 6 hours of the process (variant t:−25_10_30, p:63_103; (9)) resulted in a decrease in the material temperature to below −20°C (Figure 6C). After 684 minutes, the cryoscopic temperature was reached, with a very low water content of 0.258 g water/g d.m., which was almost 5 times lower compared to the corresponding variant conducted at a constant pressure of 63 Pa (Table 6). In the next variant (10), the pressure was increased to 165 Pa, which corresponds to the equilibrium temperature of −15°C (Figure 6d). In this case, the material temperature increased during the sublimation period, compared to the corresponding variant without pressure changes, by about 6-8 °C. The amount of water removed in the period until the cryoscopic point was reached (after 696 minutes) was nearly 89% of the initial amount of water, which was a similar value compared to the corresponding variant conducted at a constant pressure of 63 Pa (Table 6).
3.3. Sorption Kinetics of Freeze-Dried Apples
Figure 7 presents the changes in water content during the storage of dried apples at a constant environment humidity of 75.3%. The initial water content of the dried apples was similar, and after 24 hours of sorption, the moisture content of the materials changed significantly, but to a different extent.
The highest water uptake 0.337 g water/g d.m. during water sorption was observed for variant t:−25_10_30, p:63; (3). Also, variants t:10_30, p:63; (2) and t:30, p:63; (4) showed high hygroscopicity. The lowest water content (0.159 g water/g d.m.) after storage was obtained for variants t:−25_10_20_30, p:63; (6) and t:10_30, p:63_103_37; (7). Sample 8 had a slightly higher water content of 0.178 g water/g d.m. An increase of final shelf temperature from 10 (variant 1) to 30°C (variant 2-5) led to an intensification of the sorption process. However, many steps of temperature changes-for variant t:−25_10_20_30, p:63; (6) reduced water absorption. Ohori and Yamashita [46] observed that freeze-drying of amorphous-based cake with trehalose at fast ramp cycles of temperature led to the formation of uniform porous microstructure with lower shrinkage than for variants dried at slow ramp cycles. The increase in temperature of the process promoted a porosity increase of the freeze-drying of grapefruit puree [42]. It can be assumed that lower shelf temperature and slower heating with many temperature intervals could have contributed to the formation of porous open structure more susceptible to water sorption. In case of continuous changes in shelf temperature and pressure (variant 7-10), results were not consistent. The combination of temperature and pressure parameters for variants 6, 7, and 8 resulted in lower water absorption during the process. This may indicate greater material shrinkage and lower porosity.
3.4. Critical Evaluation of Applied Parameters during Freeze-Drying
The effect of freeze-drying can be assessed by various parameters. Most often, the total freeze-drying time is assessed as the basic parameter determining the energy consumption of the process. In the experiments performed, the total process time varied greatly: from 660 to 1305 minutes (Figure 8). For this reason, the most favorable experimental parameters were t:30, p:63; (4).
The most of water was removed in primary drying using the parameters t:10, p:63; (1), t:10_30, p:63; (2) and t:−25_10_30, p:63_103; (9). The water content in the material at the moment of obtaining the cryoscopic temperature was 0.100, 0.394, and 0.258 g water/g d.m., respectively. Also, during these processes, the lowest water content was found when the material reached a temperature of −10°C (Table 6). In these processes, the desorption drying time was the shortest and accounted for 12.5 to 22% of the total freeze-drying time (Figure 8). Therefore, when assessing the process, the above parameters should be recommended as the most favorable ones.
When assessing the final water content, it should be stated that the obtained values ranged from 0.028 to 0.037 g water/g d.m., with the highest value obtained in experiment t:10, p:63; (1) (Table 5), i.e., when during the desorption period, the heat was taken from the environment and not supplied by the heating shelf.
Due to their sorption properties, the least hygroscopic were the lyophilisates from experiments t: −25_10_20_30, p:63; (6), t:10_30, p:63_103_37; (7),t:30,p_63_103; (8). The other materials had almost twice the water absorption capacity (Figure 7).
The final recommendation must therefore refer to the assumed priority goal of the process.
4. Conclusions
The tests and analyses carried out showed how important the selection of appropriate process parameters (pressure in the freeze-dryer chamber and the amount of heat supplied) is for the proper operation of freeze-drying. It is very important to provide a sufficiently large amount of heat in the first hour of the sublimation process. During this period, the equilibrium sublimation temperature corresponding to the given pressure is established. To maintain a sufficiently low temperature of the material, a sufficiently large amount of heat necessary for sublimation must be provided. Too low a shelf temperature may limit sublimation and, consequently, increase the temperature of the material resulting from heat exchange with the environment. At the same time, it may cause the ice in the material to partially melt. The freeze-drying process is very sensitive to the values of set parameters, especially temperature. The change of the parameters significantly affects the process, including the freeze-drying speed, process time, and sorption properties of the obtained material. Therefore, the selection of freeze-drying parameters should also be related to the expected properties of the freeze-dried product, e.g. whether the material should hydrate quickly or whether it is important to limit its sorption properties. It has also been shown that a controlled increase in pressure during the sublimation period can increase its intensity. By increasing the adsorption drying temperature, the final water content in the material was reduced. Therefore, when freeze-drying material is sensitive to high dehydration, desorption drying should be carried out at an appropriately low temperature
Author Contributions
Conceptualisation. D.N.; Methodology. E.J and D.N.; Investigation. D.N.; Formal analysis. E.J.; Writing—original draft preparation. E.J. and D.N.; Writing—review and editing. E.J. and D.N. All author has read and agreed to the published version of the manuscript.
Funding
This research received no external funding.
Data Availability Statement
The data generated or analysed during this study are available from the corresponding author on reasonable request.
Acknowledgments
The authors thank student Ilona Bogusz for her help with preliminary drying studies.
Conflicts of Interest
The authors declare no conflicts of interest.
References
- Nowak, D.; Jakubczyk, E. The freeze-drying of foods-the characteristic of the process course and the effect of its parameters on the physical properties of food materials. Foods 2020, 9. [Google Scholar] [CrossRef]
- Feng, S.H.; Bi, J.F.; Laaksonen, T.; Laurén, P.; Yi, J.Y. Texture of freeze-dried intact and restructured fruits: Formation mechanisms and control technologies. Trends Food Sci. 2024, 143, 17. [Google Scholar] [CrossRef]
- Nowak, D.; Piechucka, P.; Witrowa-Rajchert, D.; Wiktor, A. Impact of material structure on the course of freezing and freeze-drying and on the properties of dried substance, as exemplified by celery. J Food Eng. 2016, 180, 22–28. [Google Scholar] [CrossRef]
- Waghmare, R.B.; Perumal, A.B.; Moses, J.A.; Anandharamakrishnan, C. 3.05 - Recent Developments in Freeze Drying of Foods: A comprehensive review. In Innovative Food Processing Technologies, Knoerzer, K., Muthukumarappan, K., Eds.; Elsevier: Amsterdam, Netherlands, 2021; Volume 3, pp. 82–99. [Google Scholar]
- Morais, A.R.; Alencar, É.N.; Xavier Júnior, F.H.; Oliveira, C.M.; Marcelino, H.R.; Barratt, G.; Fessi, H.; Egito, E.S.T.; Elaissari, A. Freeze-drying of emulsified systems: A review. Int. J. Pharm. 2016, 503, 102–114. [Google Scholar] [CrossRef]
- Assegehegn, G.; Brito-de la Fuente, E.; Franco, J.M.; Gallegos, C. The Importance of Understanding the Freezing Step and Its Impact on Freeze-Drying Process Performance. J. Pharm. Sci. 2019, 108, 1378–1395. [Google Scholar] [CrossRef]
- Tang, X.L.; Pikal, M.J. Design of freeze-drying processes for pharmaceuticals: Practical advice. Pharm. Res. 2004, 21, 191–200. [Google Scholar] [CrossRef]
- Assegehegn, G.; Brito-de la Fuente, E.; Franco, J.M.; Gallegos, C. Freeze-drying: A relevant unit operation in the manufacture of foods, nutritional products, and pharmaceuticals. Adv. Food Nutr. Res. 2020, 93, 1–58. [Google Scholar] [CrossRef] [PubMed]
- Pikal, M.J. Lyophilization. In Encyclopedia of Pharmaceutical Technology, Swarbrick, J., Boylan, J., Eds.; Marcel Dekker: New York, USA, 2002; pp. 1299–1326. [Google Scholar]
- Merivaara, A.; Zini, J.; Koivunotko, E.; Valkonen, S.; Korhonen, O.; Fernandes, F.M.; Yliperttula, M. Preservation of biomaterials and cells by freeze-drying: Change of paradigm. JCR 2021, 336, 480–498. [Google Scholar] [CrossRef]
- Mercado, J.A.; Matas, A.J.; Posé, S. Fruit and vegetable texture: Role of their cell walls. In Reference Module in Food Science, Kırtıl, E., Öztop, H.M., Eds.; Elsevier Science,: Oxford, UK, 2019. [Google Scholar]
- Haseley, P.; Oetjen, G.W. Freeze-Drying; Wiley-VCH: Veinheim, Germany, 2018; p. 421. [Google Scholar]
- Genin, N.; Rene, F. Influence of freezing rate and the ripeness state of fresh courgette on the quality of freeze-dried products and freeze-drying time. Journal of Food Engineering 1996, 29, 201–209. [Google Scholar] [CrossRef]
- Nowak, D. The innovative measurement system of the kinetic of freeze-drying and sorption properties of dried products as a tool for controlling and assessing the course of freeze-drying Warsaw University of Life Sciences Press Warsaw, Poland 2017.
- Nowak, D.; Jakubczyk, E. Effect of pulsed electric field pre-treatment and the freezing methods on the kinetics of the freeze-drying process of apple and its selected physical properties. Foods 2022, 11, 2407. [Google Scholar] [CrossRef]
- Bhandari, B.R.; Howes, T. Implication of glass transition for the drying and stability of dried foods. J. Food Eng. 1999, 40, 71–79. [Google Scholar] [CrossRef]
- Tolstorebrov, I.; Eikevik, T.M.; Petrova, I.; Shokina, Y.; Bantle, M. Description of atmospheric freeze-drying process of organic apples using thermo-physical properties. In Proceedings of the 21st International Drying Symposium (IDS), Valencia, SPAIN, 2018, Sep 11-14; pp. 1703–1710.
- Hua, T.C.; Liu, B.L.; Zhang, H. Freeze-Drying of Pharmaceutical and Food Products. In Freeze-Drying of Pharmaceutical and Food Products; Woodhead Publishing Series in Food Science Technology and Nutrition; Elsevier Science Bv: Amsterdam, 2010; Volume 198, pp. 1–257. [Google Scholar]
- Gianfrancesco, A.; Smarrito-Menozzi, C.; Niederreiter, G.; Palzer, S. Developing supra-molecular structures during freeze-drying of food. Dry. Technol. 2012, 30, 1160–1166. [Google Scholar] [CrossRef]
- Reyes, A.; Mahn, A.; Huenulaf, P. Drying of apple slices in atmospheric and vacuum freeze dryer. Dry. Technol. 2011, 29, 1076–1089. [Google Scholar] [CrossRef]
- Huang, L.L.; Zhang, M.; Mujumdar, A.S.; Sun, D.F.; Tan, G.W.; Tang, S. Studies on decreasing energy consumption for a freeze-drying process of apple slices. Dry. Technol. 2009, 27, 938–946. [Google Scholar] [CrossRef]
- Wu, Y.; Guo, Y.M.; Zhang, D.G. Study of the effect of high-pulsed electric field treatment on vacuum freeze-drying of apples. Dry. Technol. 2011, 29, 1714–1720. [Google Scholar] [CrossRef]
- Jakubczyk, E.; Kamińska-Dwórznicka, A.; Ostrowska-Ligęza, E.; Górska, A.; Wirkowska-Wojdyła, M.; Mańko-Jurkowska, D.; Górska, A.; Bryś, J. Application of different compositions of apple puree gels and drying methods to fabricate snacks of modified structure, storage stability and hygroscopicity. Appl. Sci. 2021, 11, 10286. [Google Scholar] [CrossRef]
- Bera, M.; Chakraborty, R.; Bhattacharya, P. Optimization of intensification of freeze-drying rate of banana: Combined applications of IR radiation and cryogenic freezing. Sep. Sci. Technol. 2012, 48, 346–358. [Google Scholar] [CrossRef]
- Franceschinis, L.; Salvatori, D.M.; Sosa, N.; Schebor, C. Physical and functional properties of blackberry freeze- and spray-dried powders. Dry. Technol. 2014, 32, 197–207. [Google Scholar] [CrossRef]
- Regier, M.; Mayer-Miebach, E.; Behsnilian, D.; Neff, E.; Schuchmann, H.P. Influences of drying and storage of lycopene-rich carrots on the carotenoid content. Dry Technol. 2005, 23, 989–998. [Google Scholar] [CrossRef]
- Lyu, Y.; Bi, J.F.; Chen, Q.Q.; Wu, X.Y.; Li, X.; Qiao, Y.N. Quality improvement of freeze-dried carrots as affected by sugar-osmotic and hot-air pre-treatments. J Food Proc. Pres. 2022, 46. [Google Scholar] [CrossRef]
- Sikolya, L.; Tamás, A. Experimental study of root crops produced using hot air and freeze dehydration. Nonconventional Technologies Review, 2014; XVIII/, 13–17. [Google Scholar]
- Hawlader, M.N.A.; Perera, C.; Tian, M.; Yeo, K.L. Drying of guava and papaya: Impact of different drying methods. Dry Technol. 2006, 24, 77–87. [Google Scholar] [CrossRef]
- Marques, L.G.; Silveira, A.M.; Freire, J.T. Freeze-drying characteristics of tropical fruits. Dry. Technol. 2006, 24, 457–463. [Google Scholar] [CrossRef]
- Guiné, R.P.F.; Barroca, M.J. Effect of drying treatments on texture and color of vegetables (pumpkin and green pepper). Food Bioproducts Proc. 2012, 90, 58–63. [Google Scholar] [CrossRef]
- Ciurzyńska, A.; Popkowicz, P.; Galus, S.; Janowicz, M. Innovative freeze-dried snacks with sodium alginate and fruit pomace (only apple or only chokeberry) obtained within the framework of sustainable production. Molecules 2022, 27, 3095. [Google Scholar] [CrossRef] [PubMed]
- Shishehgarha, F.; Makhlouf, J.; Ratti, C. Freeze-drying characteristics of strawberries. Dry. Technol. 2002, 20, 131–145. [Google Scholar] [CrossRef]
- Jakubczyk, E.; Jaskulska, A. The effect of freeze-drying on the properties of Polish vegetable soups. Appl. Sci. 2021, 11, 654. [Google Scholar] [CrossRef]
- Jakubczyk, E.; Ostrowska-Ligęza, E.; Gondek, E. Moisture sorption characteristics and glass transition temperature of apple puree powder. Int. J Food Sci. Technol. 2010, 45, 2515–2523. [Google Scholar] [CrossRef]
- Benlloch-Tinoco, M.; Moraga, G.; Camacho, M.D.; Martínez-Navarrete, N. Combined drying technologies for high-quality kiwifruit powder production. Food Bioproc. Technol. 2013, 6, 3544–3553. [Google Scholar] [CrossRef]
- Igual, M.; Cebadera, L.; Cámara, R.M.; Agudelo, C.; Martínez-Navarrete, N.; Cámara, M. Novel ingredients based on grapefruit freeze-dried formulations: Nutritional and bioactive value. Foods 2019, 8, 506. [Google Scholar] [CrossRef]
- Calín-Sánchez, Á.; Kharaghani, A.; Lech, K.; Figiel, A.; Carbonell-Barrachina, Á.A.; Tsotsas, E. Drying kinetics and microstructural and sensory properties of black chokeberry (Aronia melanocarpa) as affected by drying method. Food Bioproc. Technol. 2015, 8, 63–74. [Google Scholar] [CrossRef]
- Simal, S.; Femenia, A.; Garau, M.C.; Rosselló, C. Use of exponential, Page’s and diffusional models to simulate the drying kinetics of kiwi fruit. J. Food Eng. 2005, 66, 323–328. [Google Scholar] [CrossRef]
- Karathanos, V.T.; Belessiotis, V.G. Application of a thin-layer equation to drying data of fresh and semi-dried fruits. J. Agri. Eng. Res. 1999, 74, 355–361. [Google Scholar] [CrossRef]
- Azzouz, S.; Guizani, A.; Jomaa, W.; Belghith, A. Moisture diffusivity and drying kinetic equation of convective drying of grapes. J. Food Eng. 2002, 55, 323–330. [Google Scholar] [CrossRef]
- Egas-Astudillo, L.A.; Martínez-Navarrete, N.; Camacho, M.M. Impact of biopolymers added to a grapefruit puree and freeze-drying shelf temperature on process time reduction and product quality. Food and Bioproducts Processing 2020, 120, 143–150. [Google Scholar] [CrossRef]
- Krzykowski, A.; Dziki, D.; Rudy, S.; Polak, R.; Biernacka, B.; Gawlik-Dziki, U.; Janiszewska-Turak, E. Effect of air-drying and freeze-drying temperature on the process kinetics and physicochemical characteristics of white mulberry fruits (Morus alba L.). Processes 2023, 11, 750. [Google Scholar] [CrossRef]
- Pikal, M.J.; Shah, S.; Roy, M.L.; Putman, R. The secondary drying stage of freeze drying: drying kinetics as a function of temperature and chamber pressure. Int. J. Pharm. 1990, 60, 203–207. [Google Scholar] [CrossRef]
- Hasbullah, R.; Putra, N.S. Study on the vacuum pressure and drying time of freeze-drying method to maintain the quality of strawberry (Fragaria virginiana). J. Teknik Pertanian Lampung 2022, 11. [Google Scholar] [CrossRef]
- Ohori, R.; Yamashita, C. Effects of temperature ramp rate during the primary drying process on the properties of amorphous-based lyophilized cake, Part 1: Cake characterization, collapse temperature and drying behavior. J. Drug Deliv. Sci.Technol. 2017, 39, 131–139. [Google Scholar] [CrossRef]
Figure 1.
Parameters of the freeze-drying process. Source: own study.
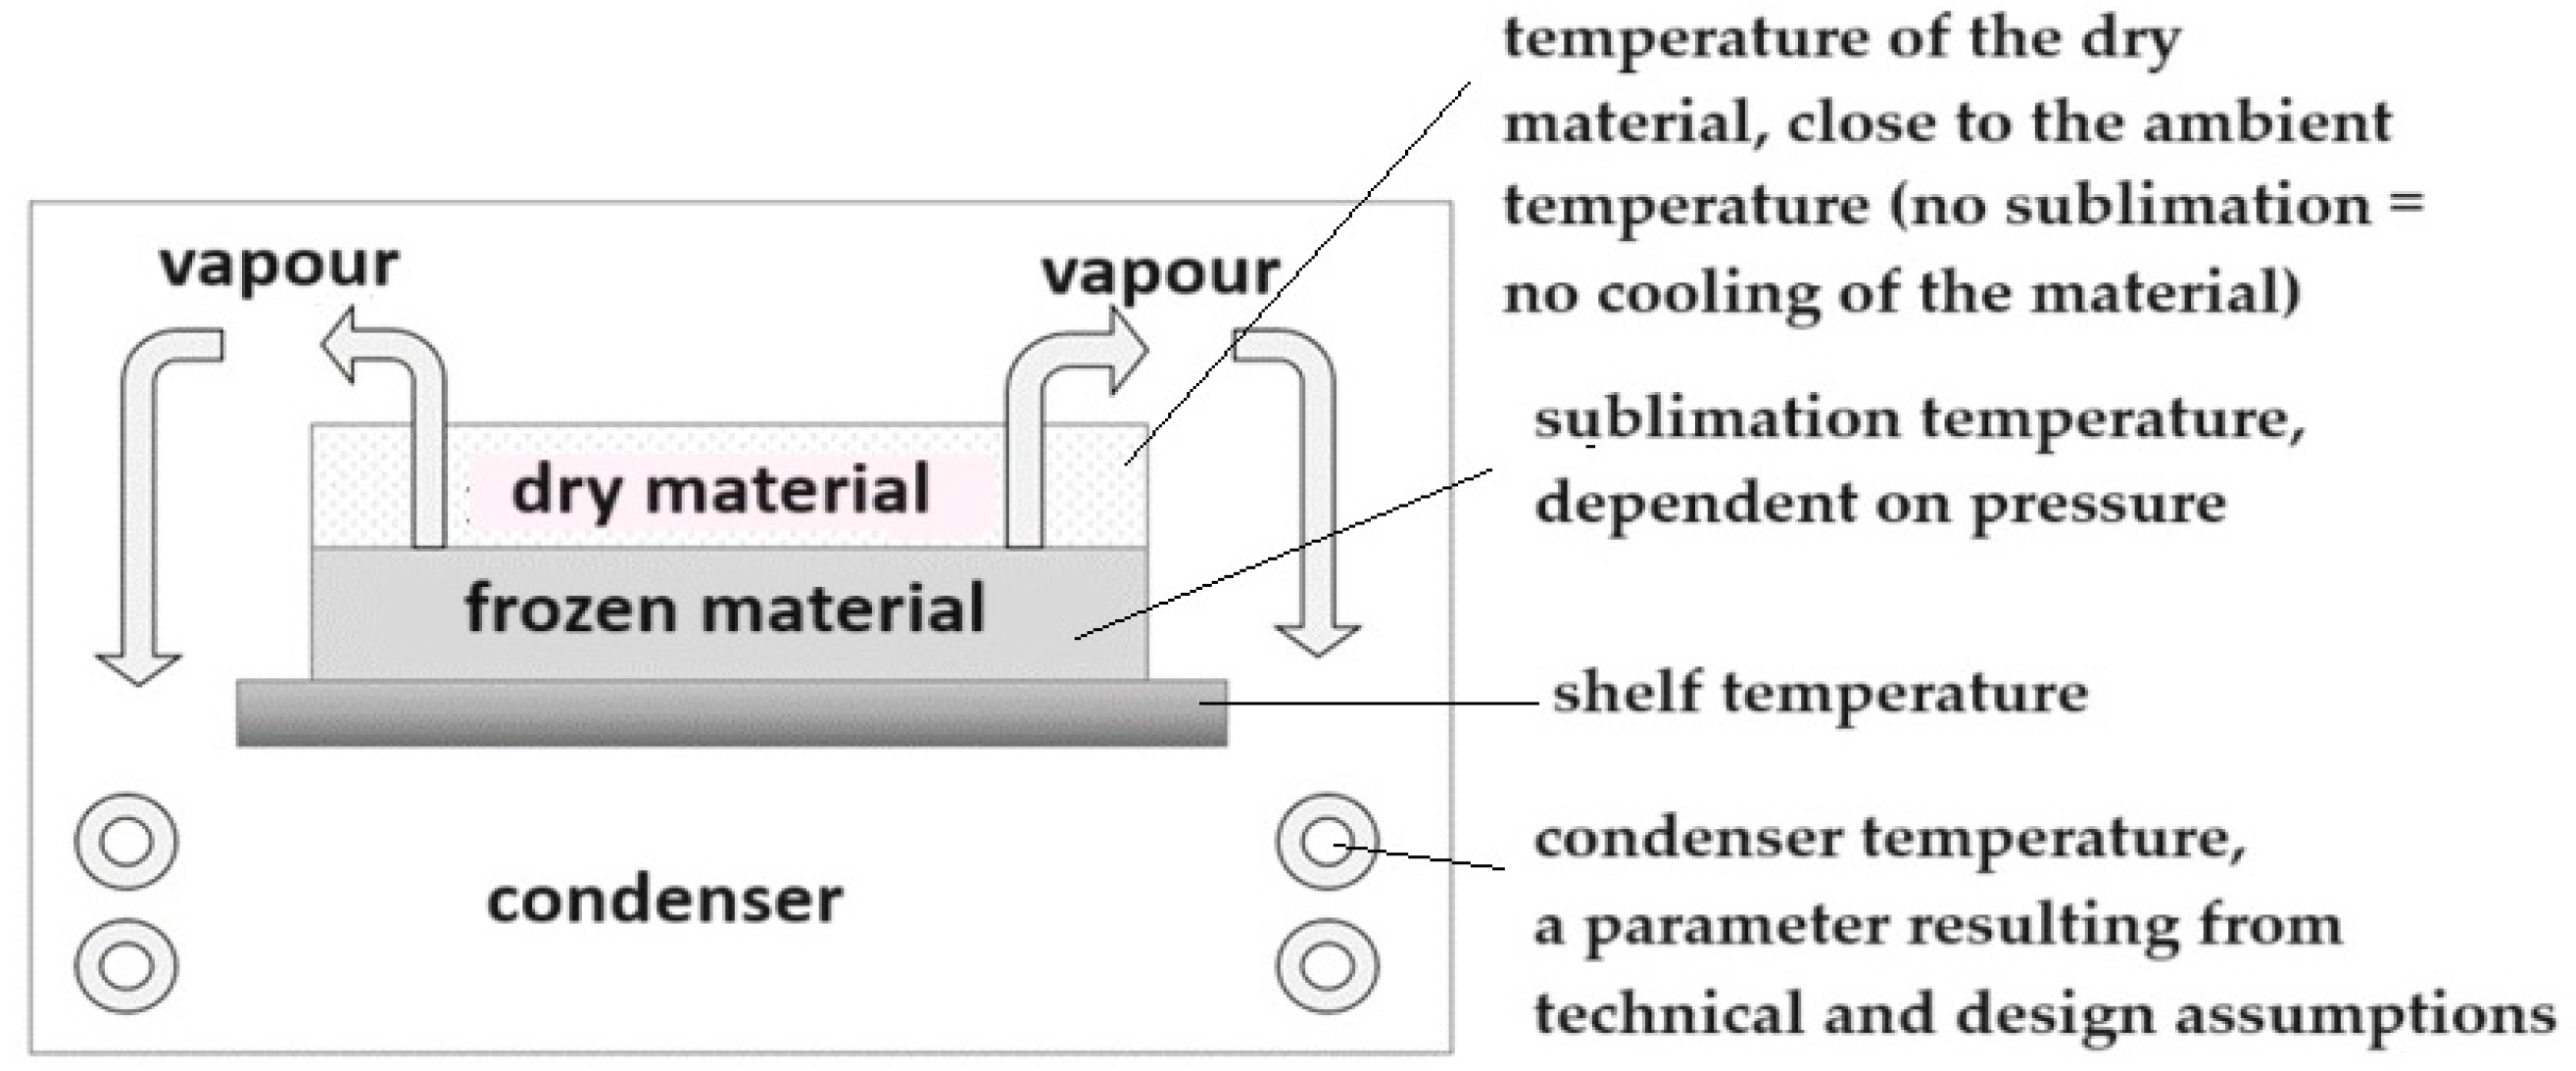
Figure 2.
Drying curves (Time -Moisture Ratio, MR): a) at different temperatures and constant pressure, b) at different pressure and temperature conditions during freeze-drying.
Figure 2.
Drying curves (Time -Moisture Ratio, MR): a) at different temperatures and constant pressure, b) at different pressure and temperature conditions during freeze-drying.
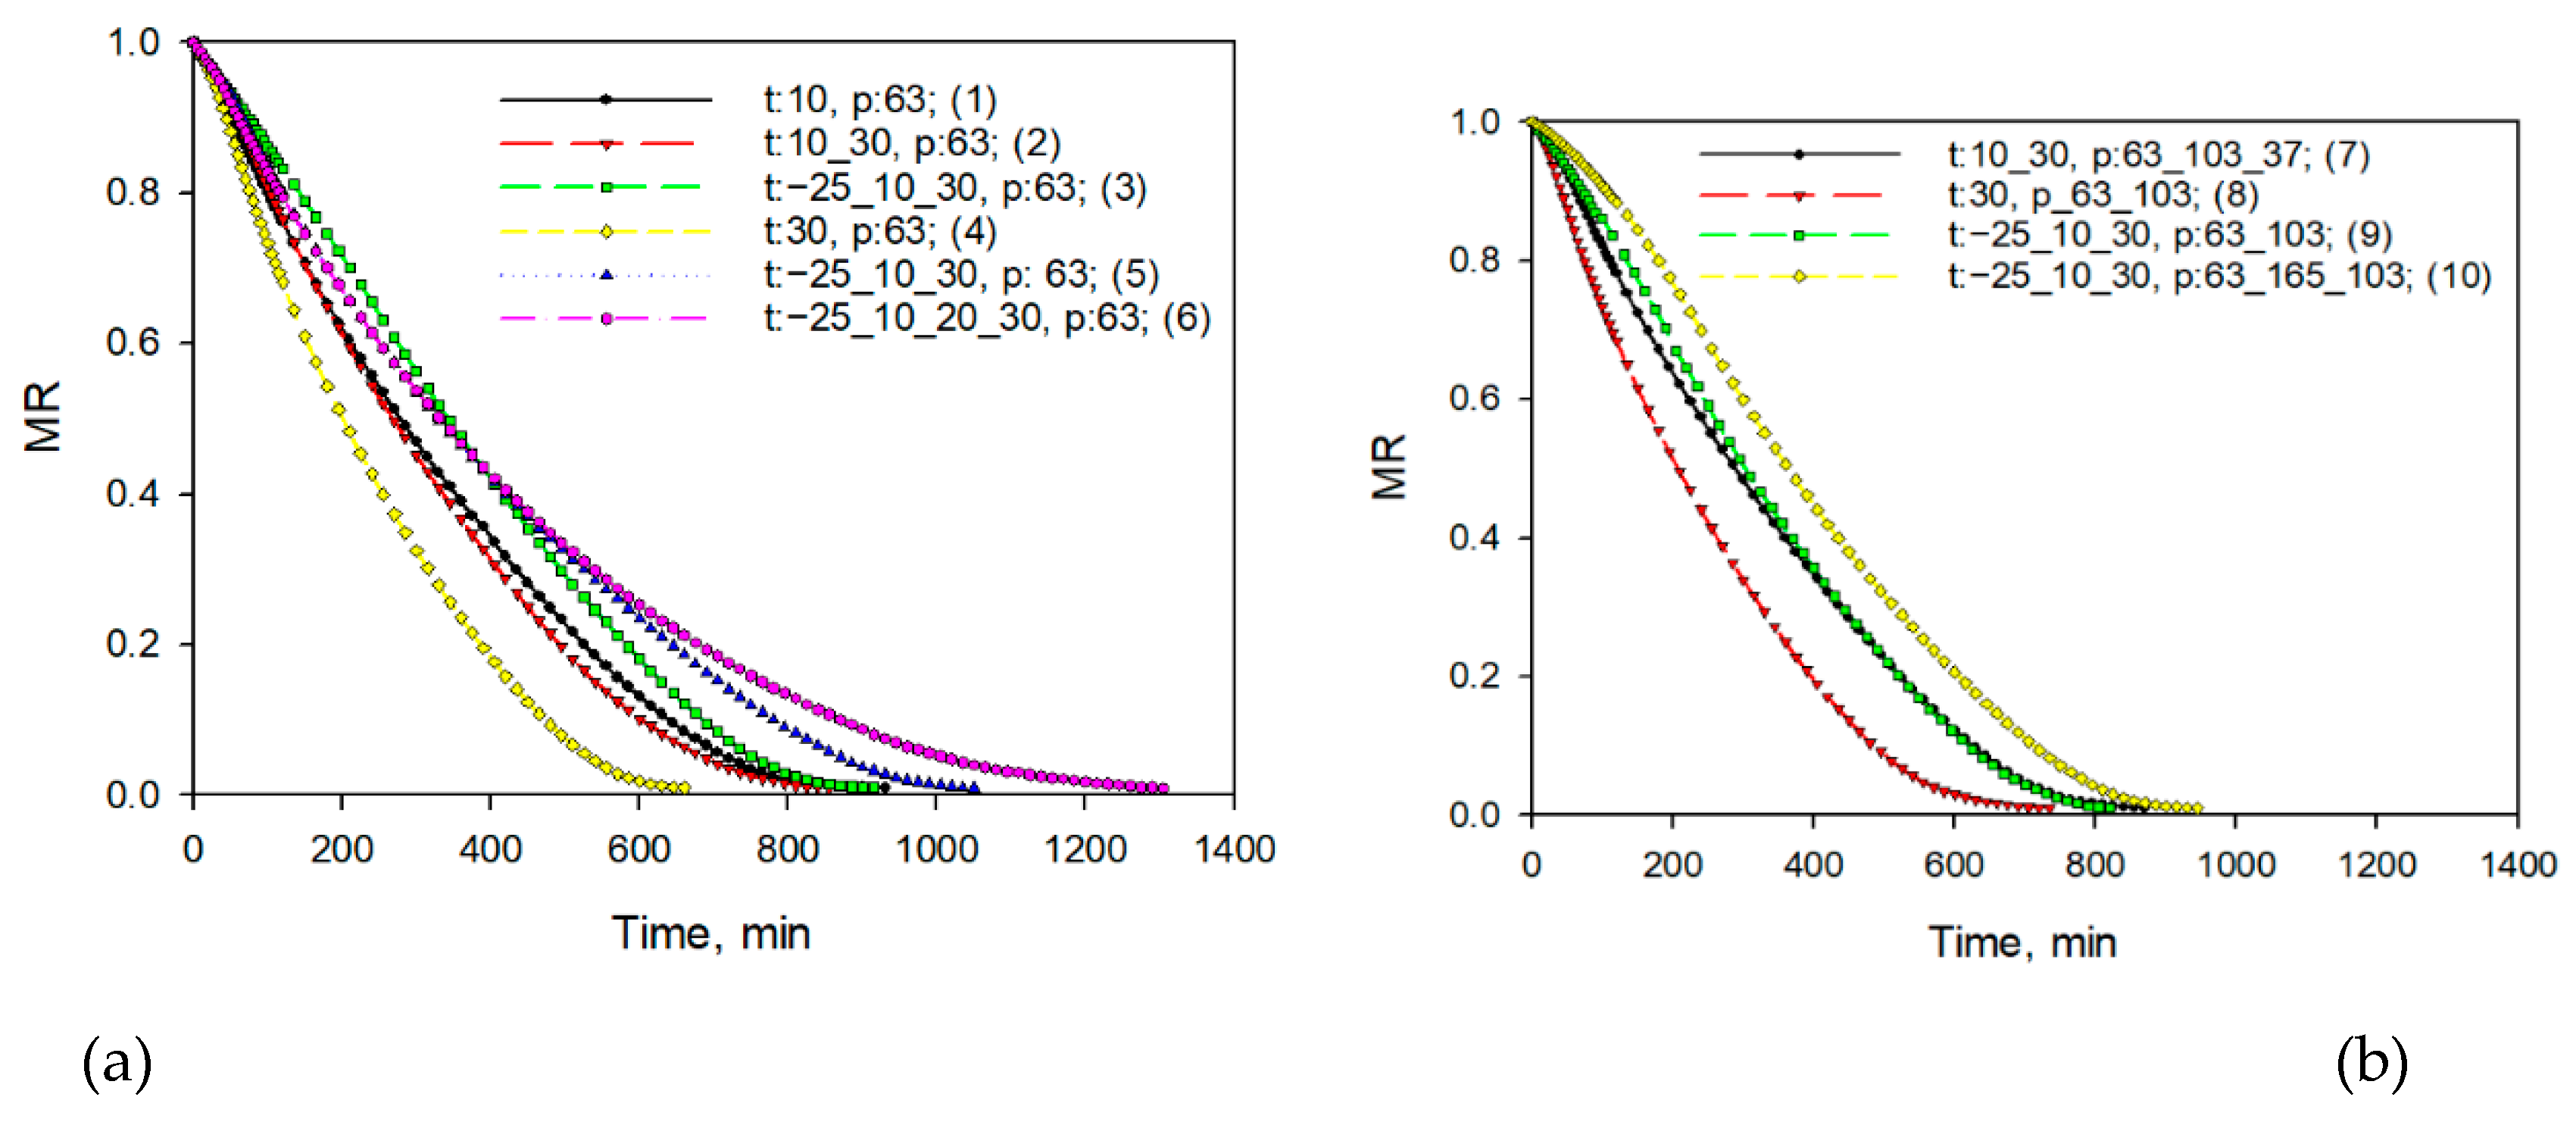
Figure 3.
Curves of drying rate (Time-drying rate, dMR·dt-1) at different temperatures and constant pressure, b) at different pressure and temperature conditions during freeze-drying.
Figure 3.
Curves of drying rate (Time-drying rate, dMR·dt-1) at different temperatures and constant pressure, b) at different pressure and temperature conditions during freeze-drying.
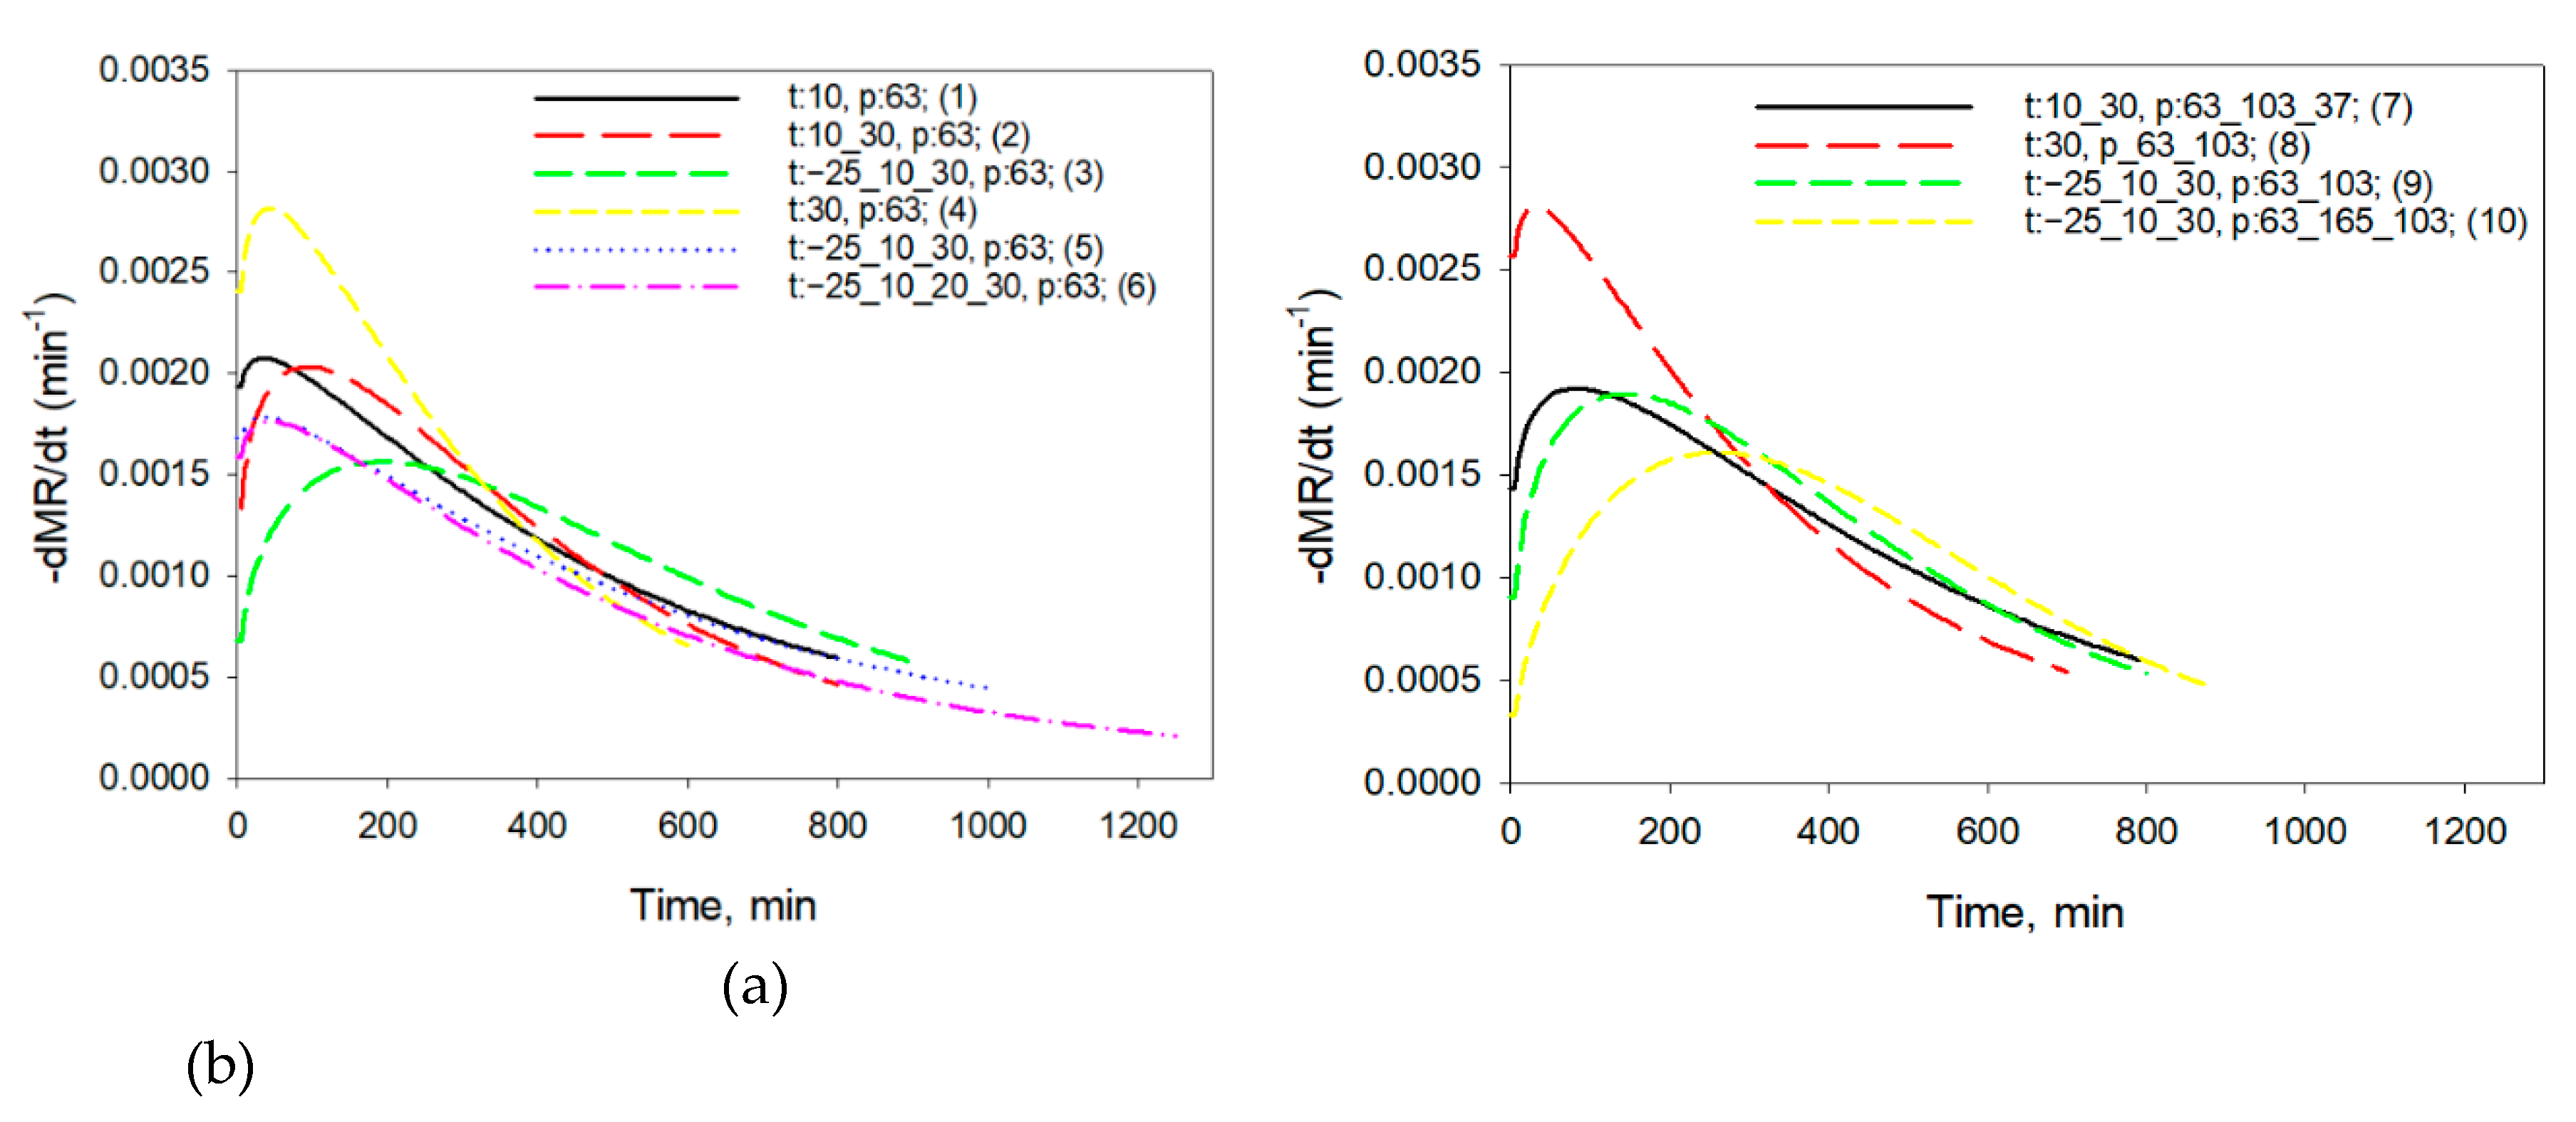
Figure 4.
Effect of changes in the set shelf temperature on the material temperature; dotted/dashed lines -set parameters of pressure and temperature, solid lines- measured temperature during freeze-drying of apple (in the centre of the variant).
Figure 4.
Effect of changes in the set shelf temperature on the material temperature; dotted/dashed lines -set parameters of pressure and temperature, solid lines- measured temperature during freeze-drying of apple (in the centre of the variant).
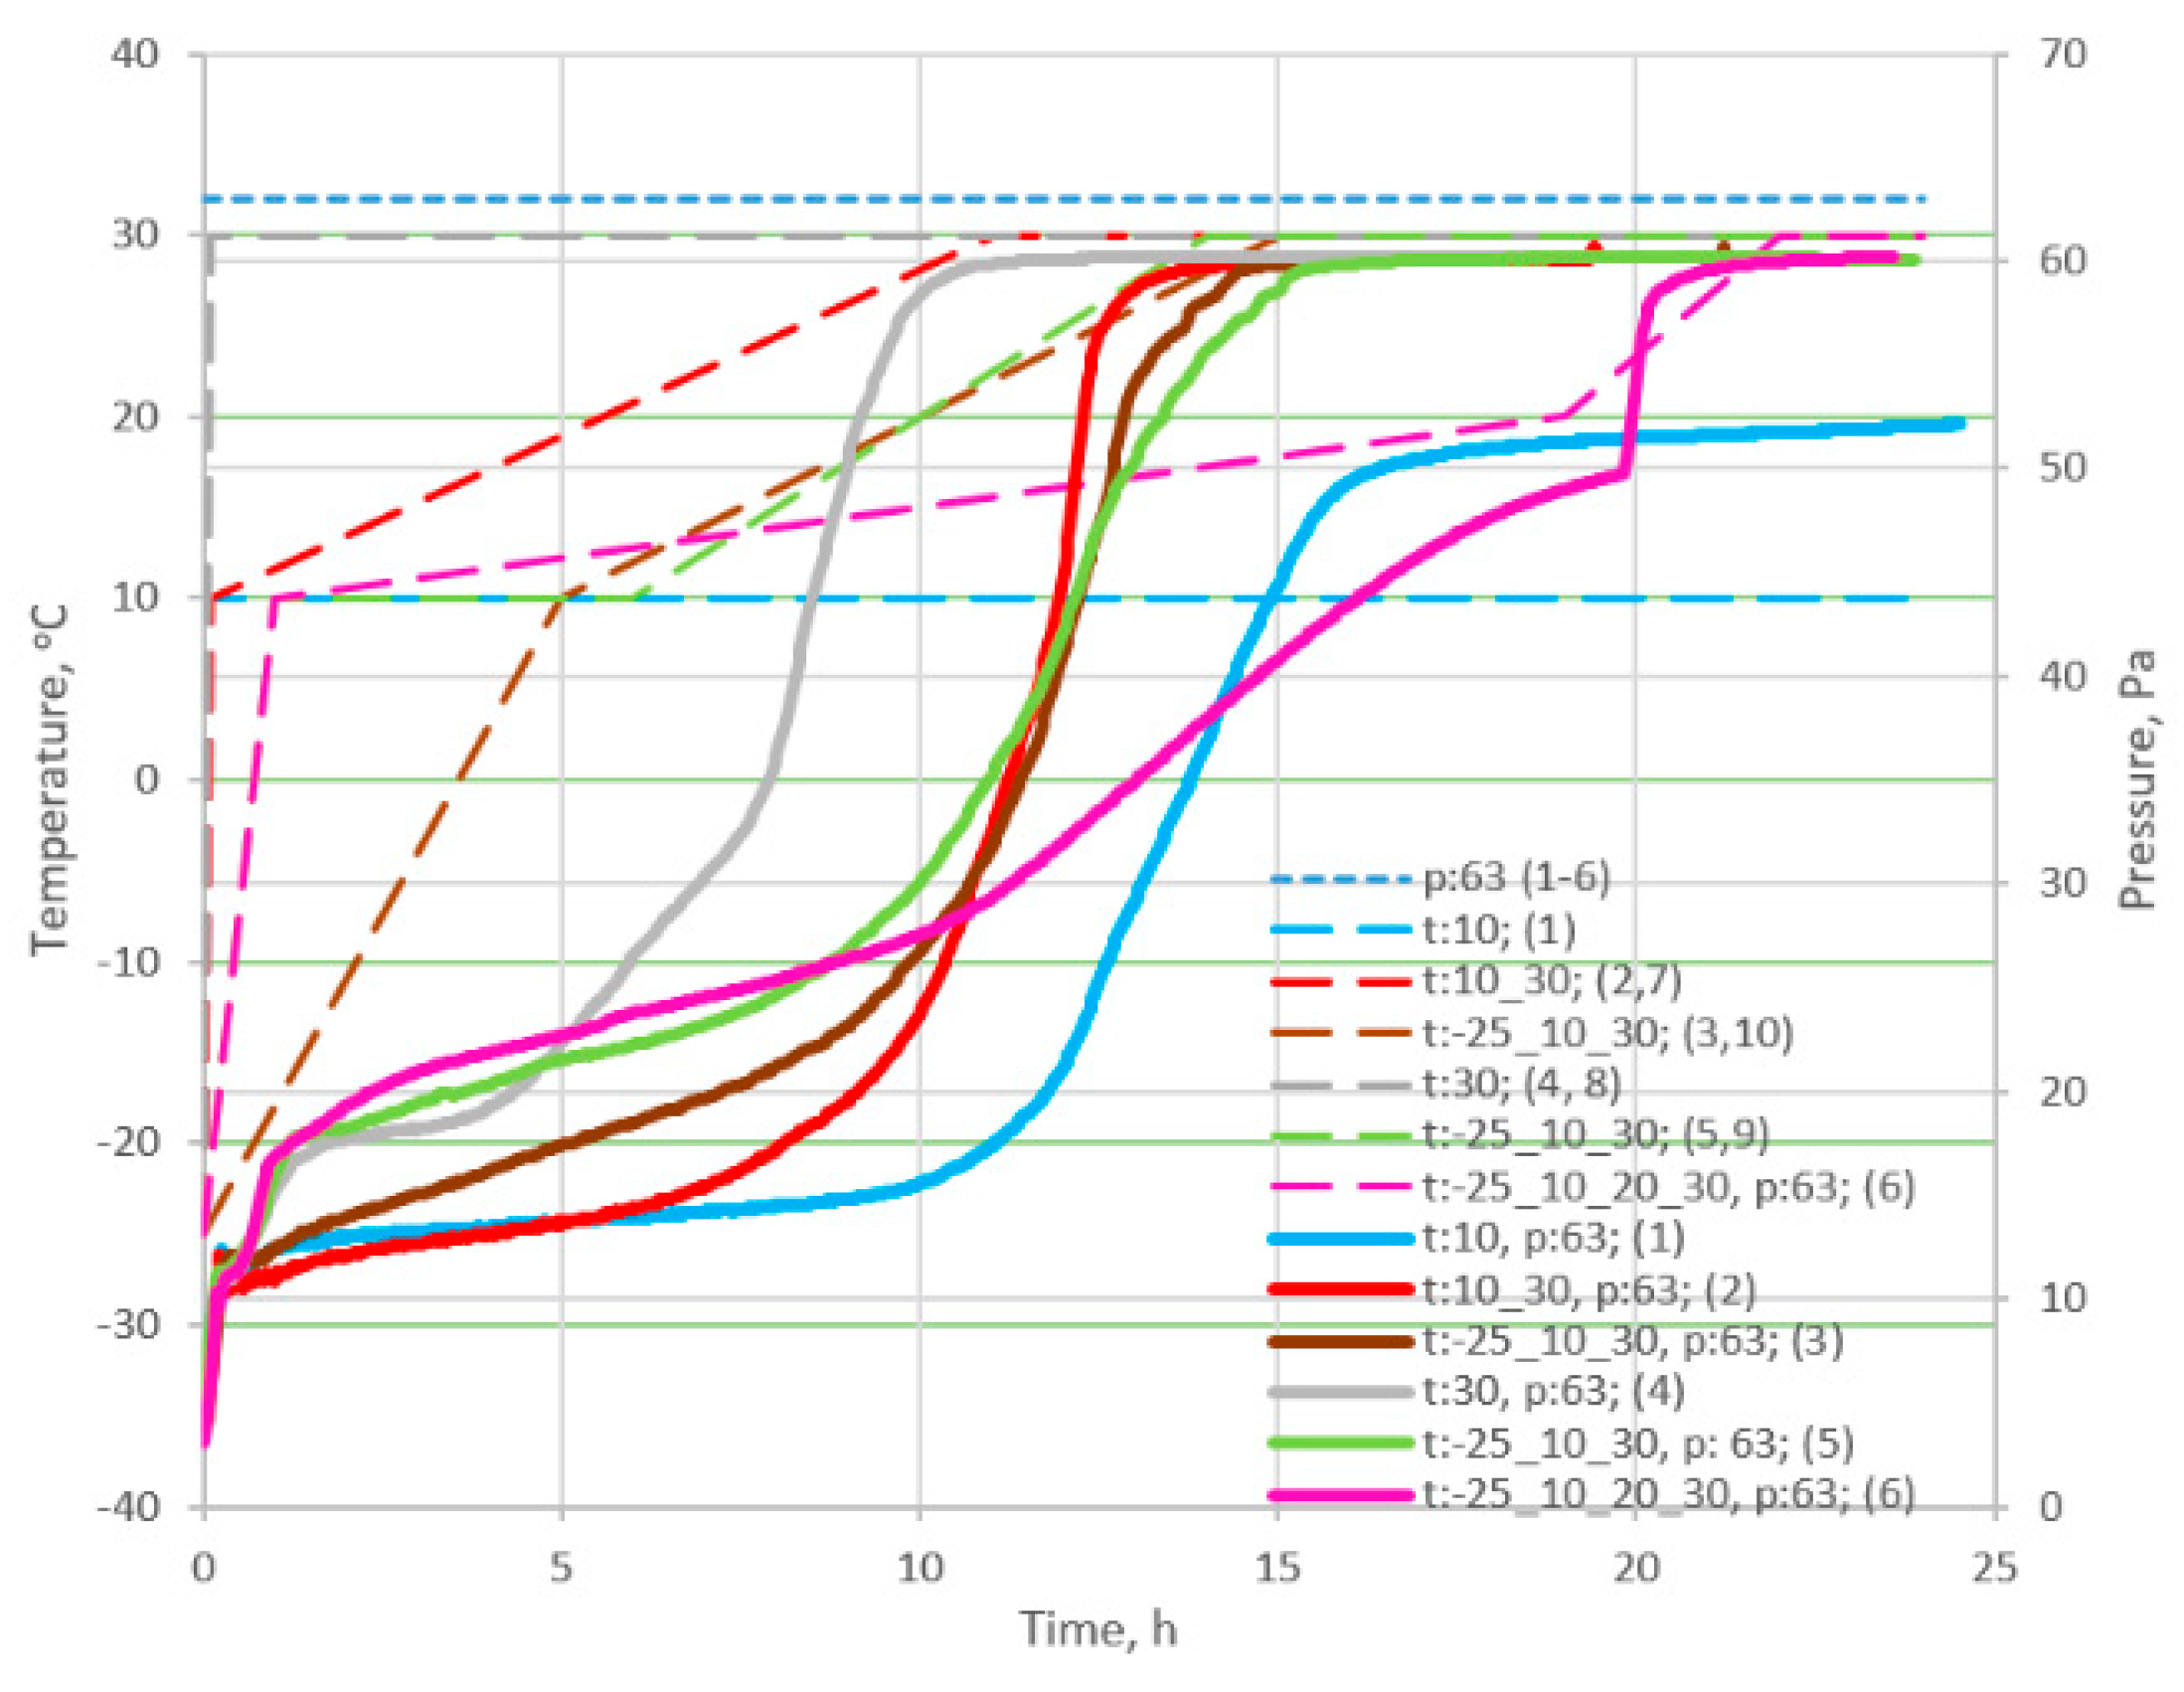
Figure 5.
Changes of temperature inside the materials and moisture ratio during freeze-drying at conditions: t:10-30, p:63;(2) determination of MR and drying time for temperature −2 and −10°C.
Figure 5.
Changes of temperature inside the materials and moisture ratio during freeze-drying at conditions: t:10-30, p:63;(2) determination of MR and drying time for temperature −2 and −10°C.
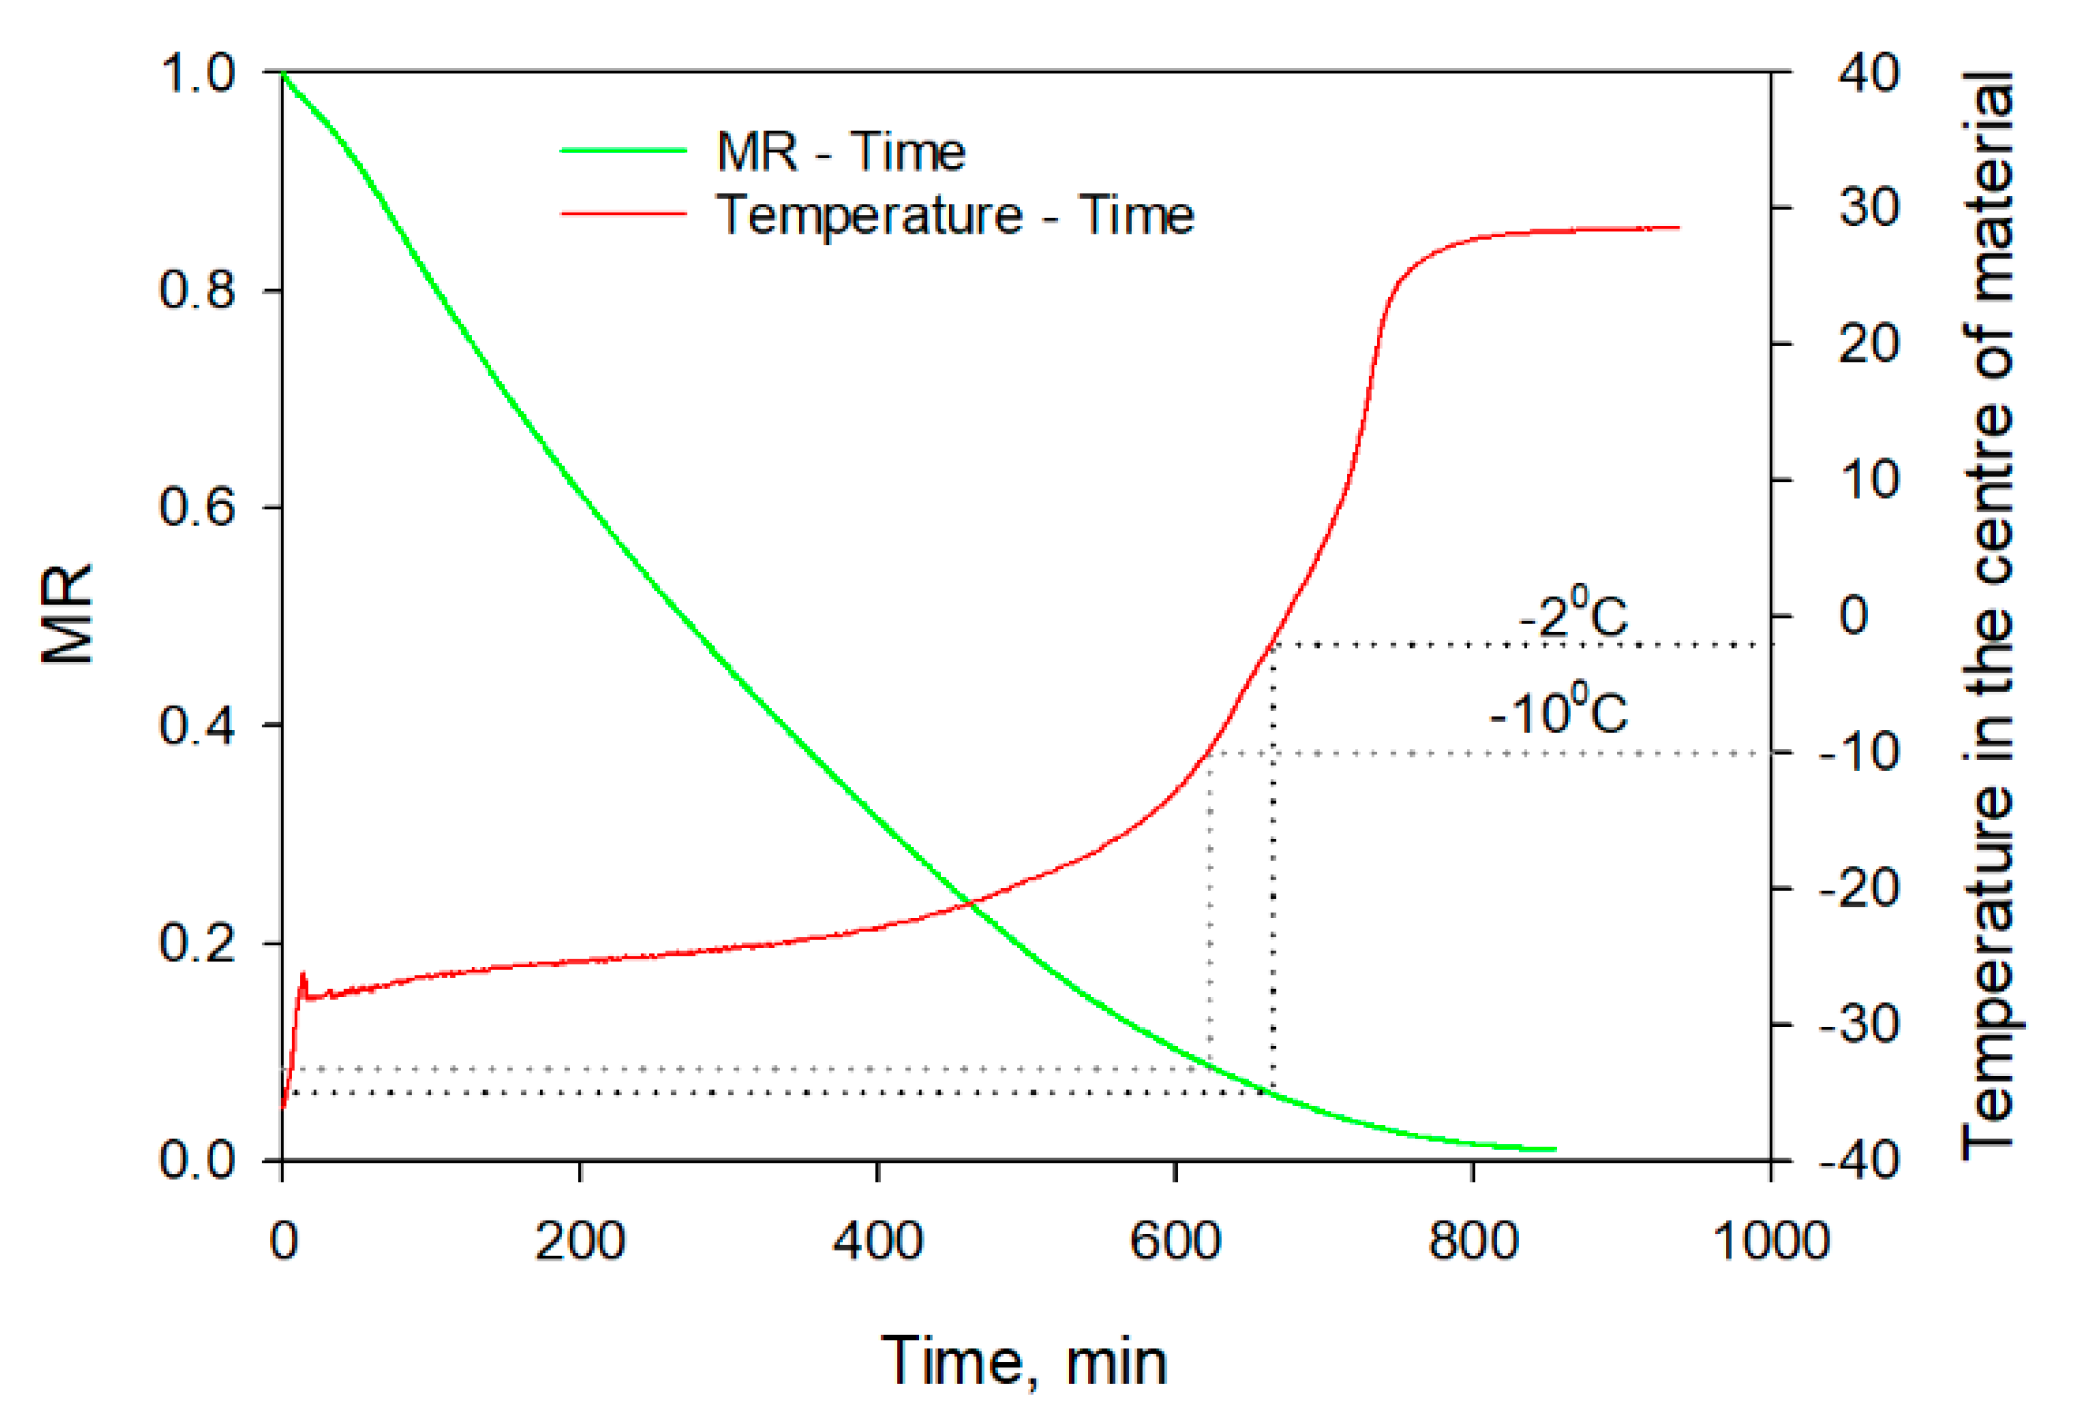
Figure 6.
Effect of pressure modification on material temperature during the freeze-drying process.
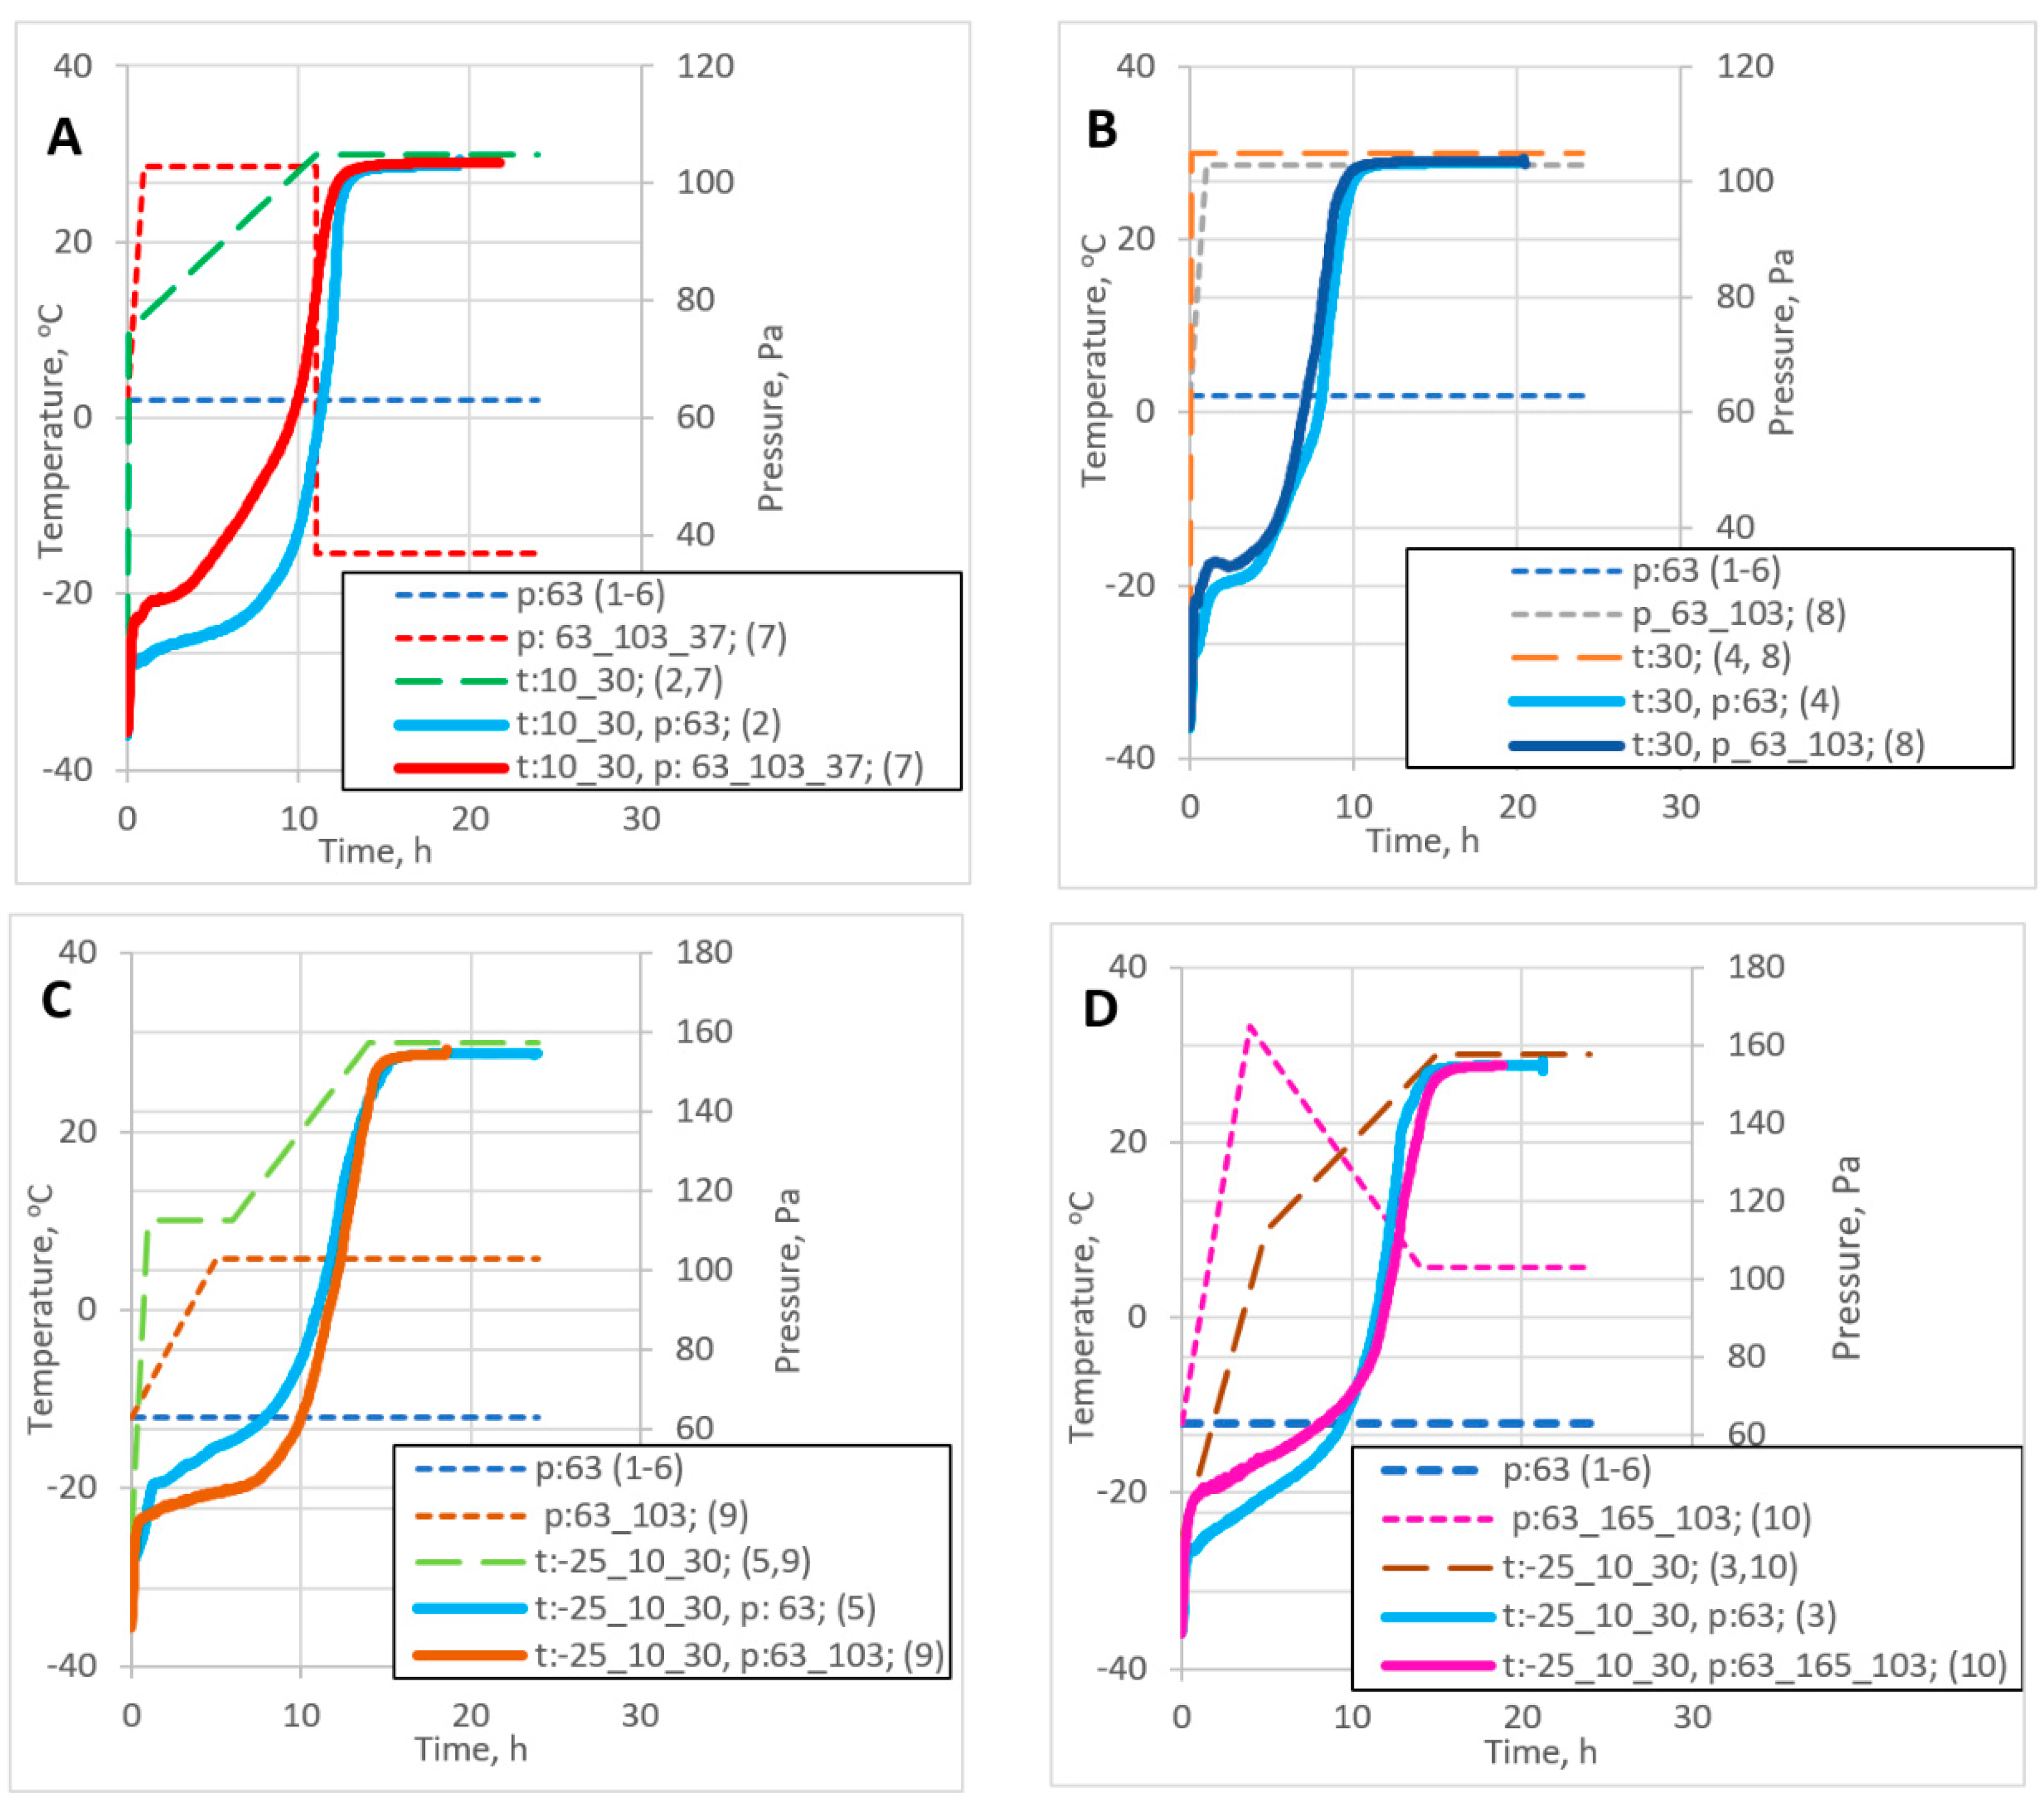
Figure 7.
Water sorption kinetics of the freeze-dried apples.
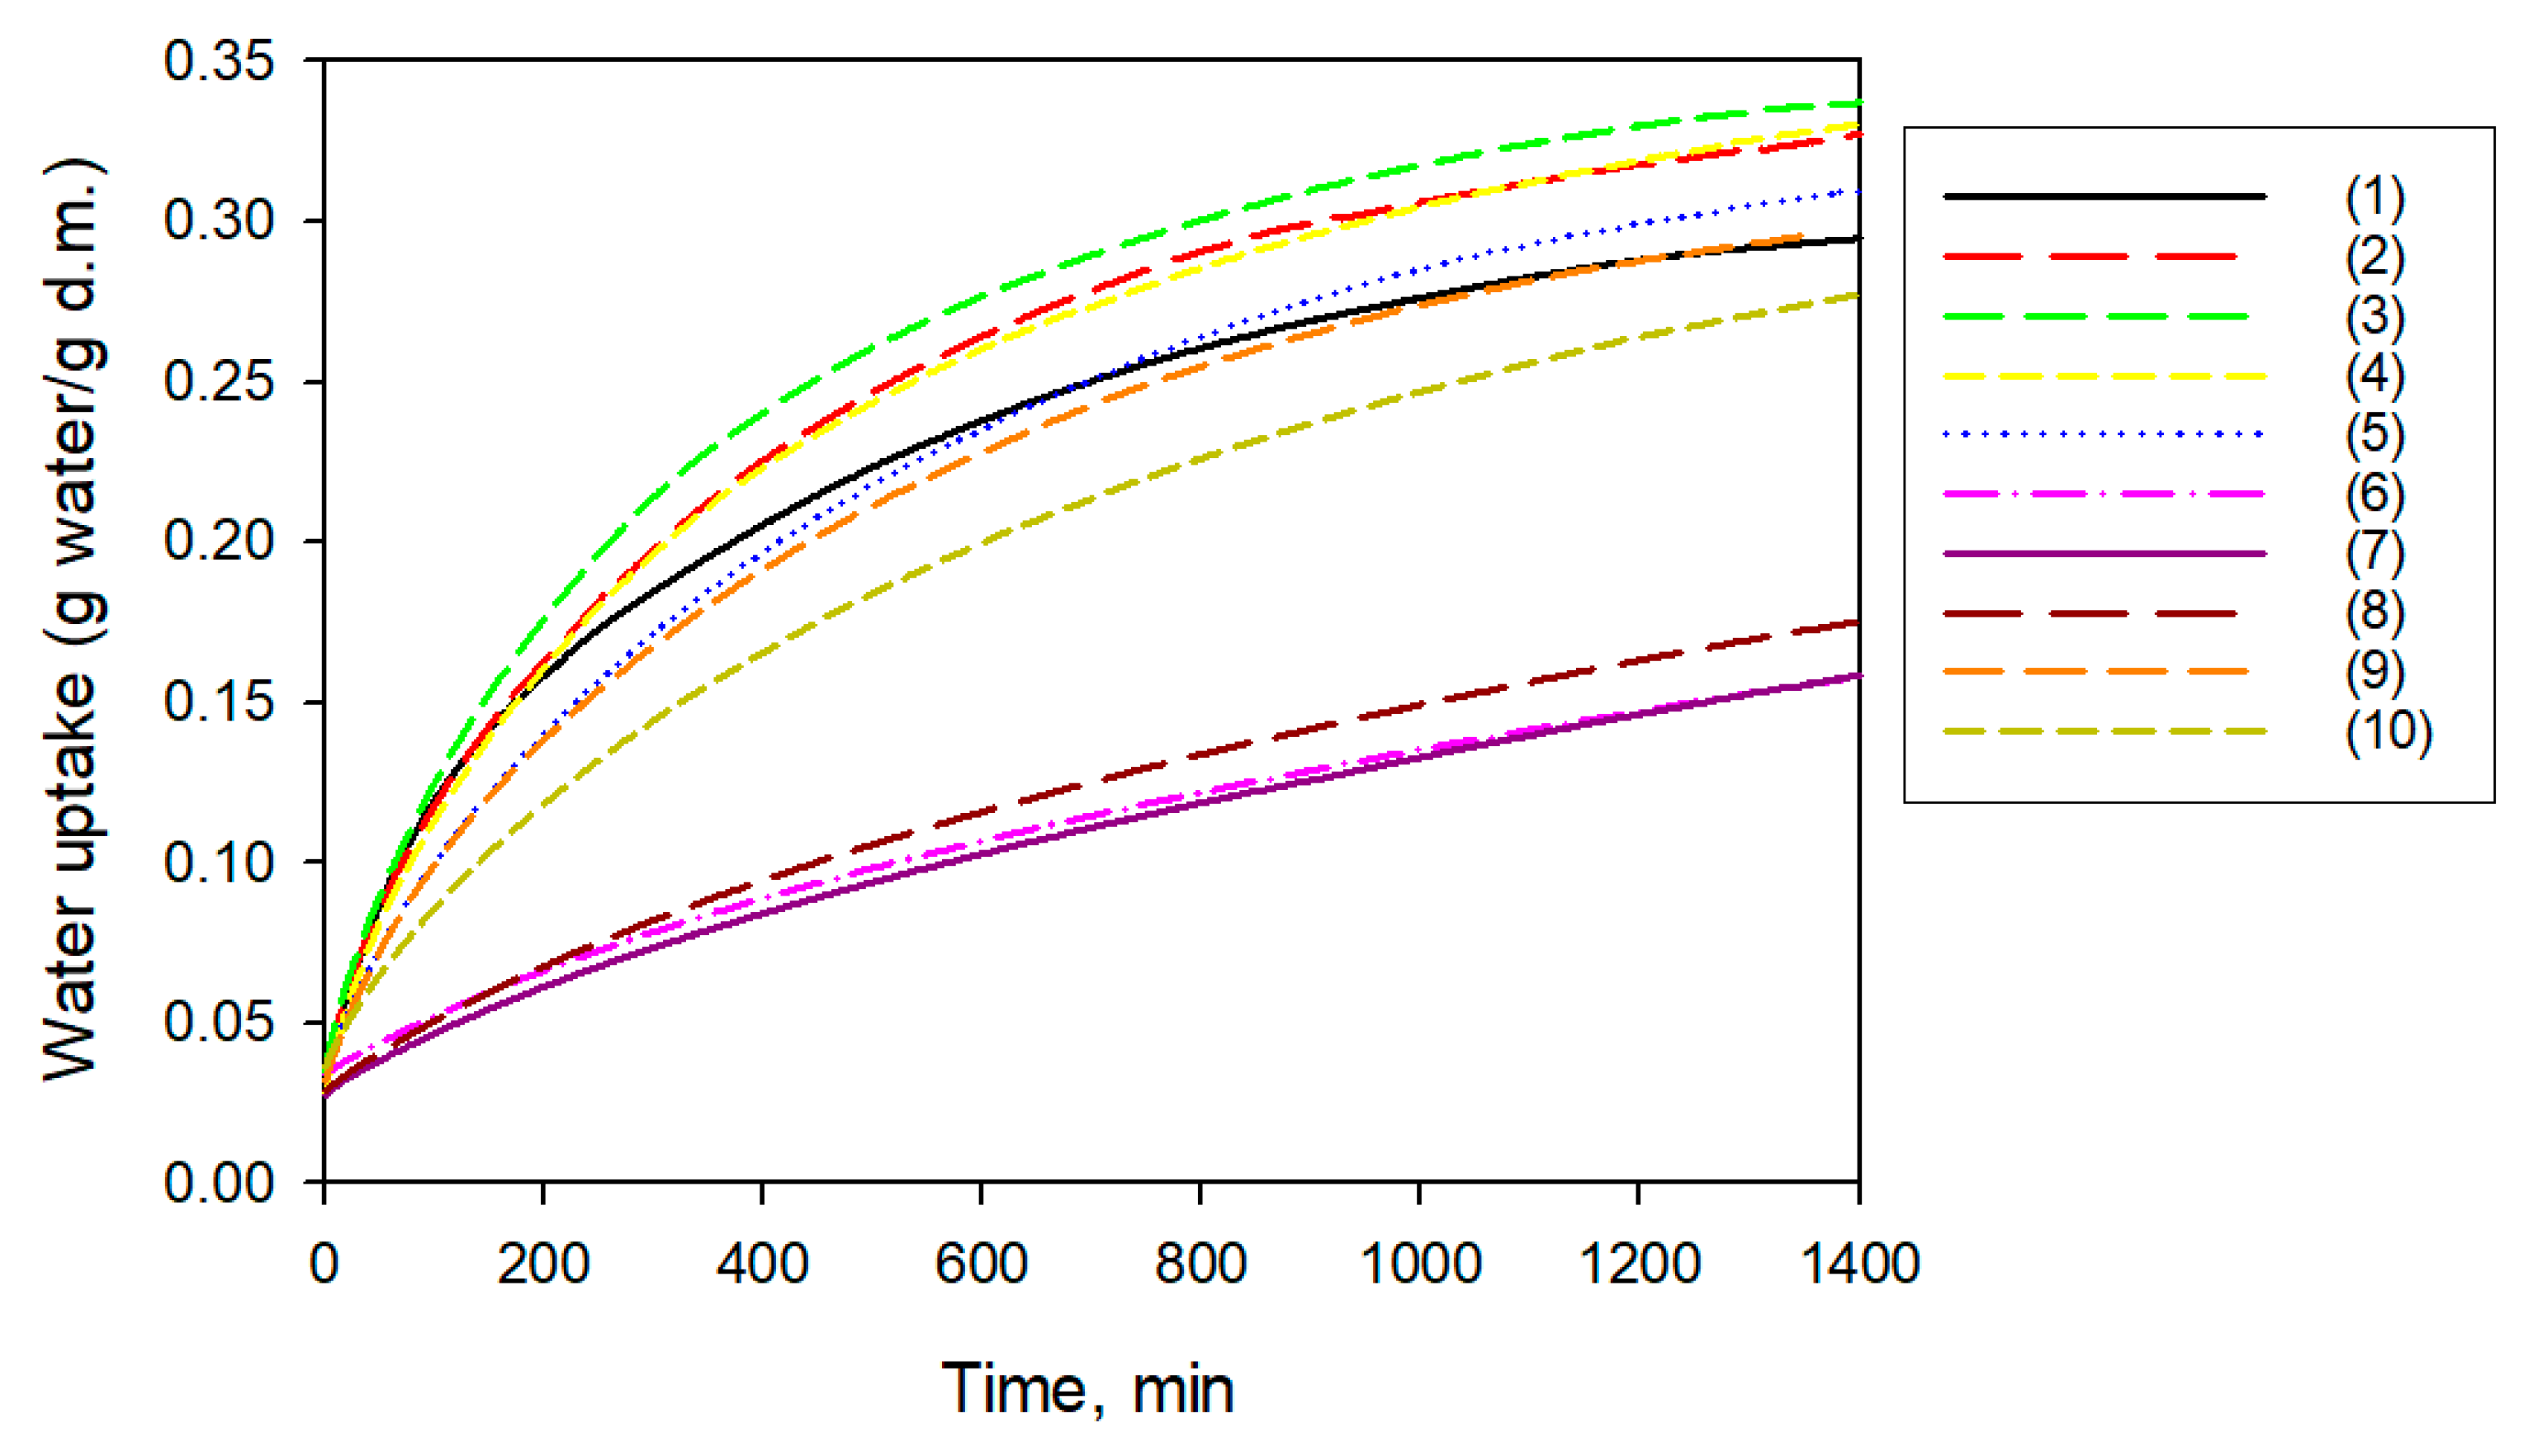
Figure 8.
Primary and secondary drying time: a) periods in minutes; b) cumulative graph- percentage to whole drying time.
Figure 8.
Primary and secondary drying time: a) periods in minutes; b) cumulative graph- percentage to whole drying time.
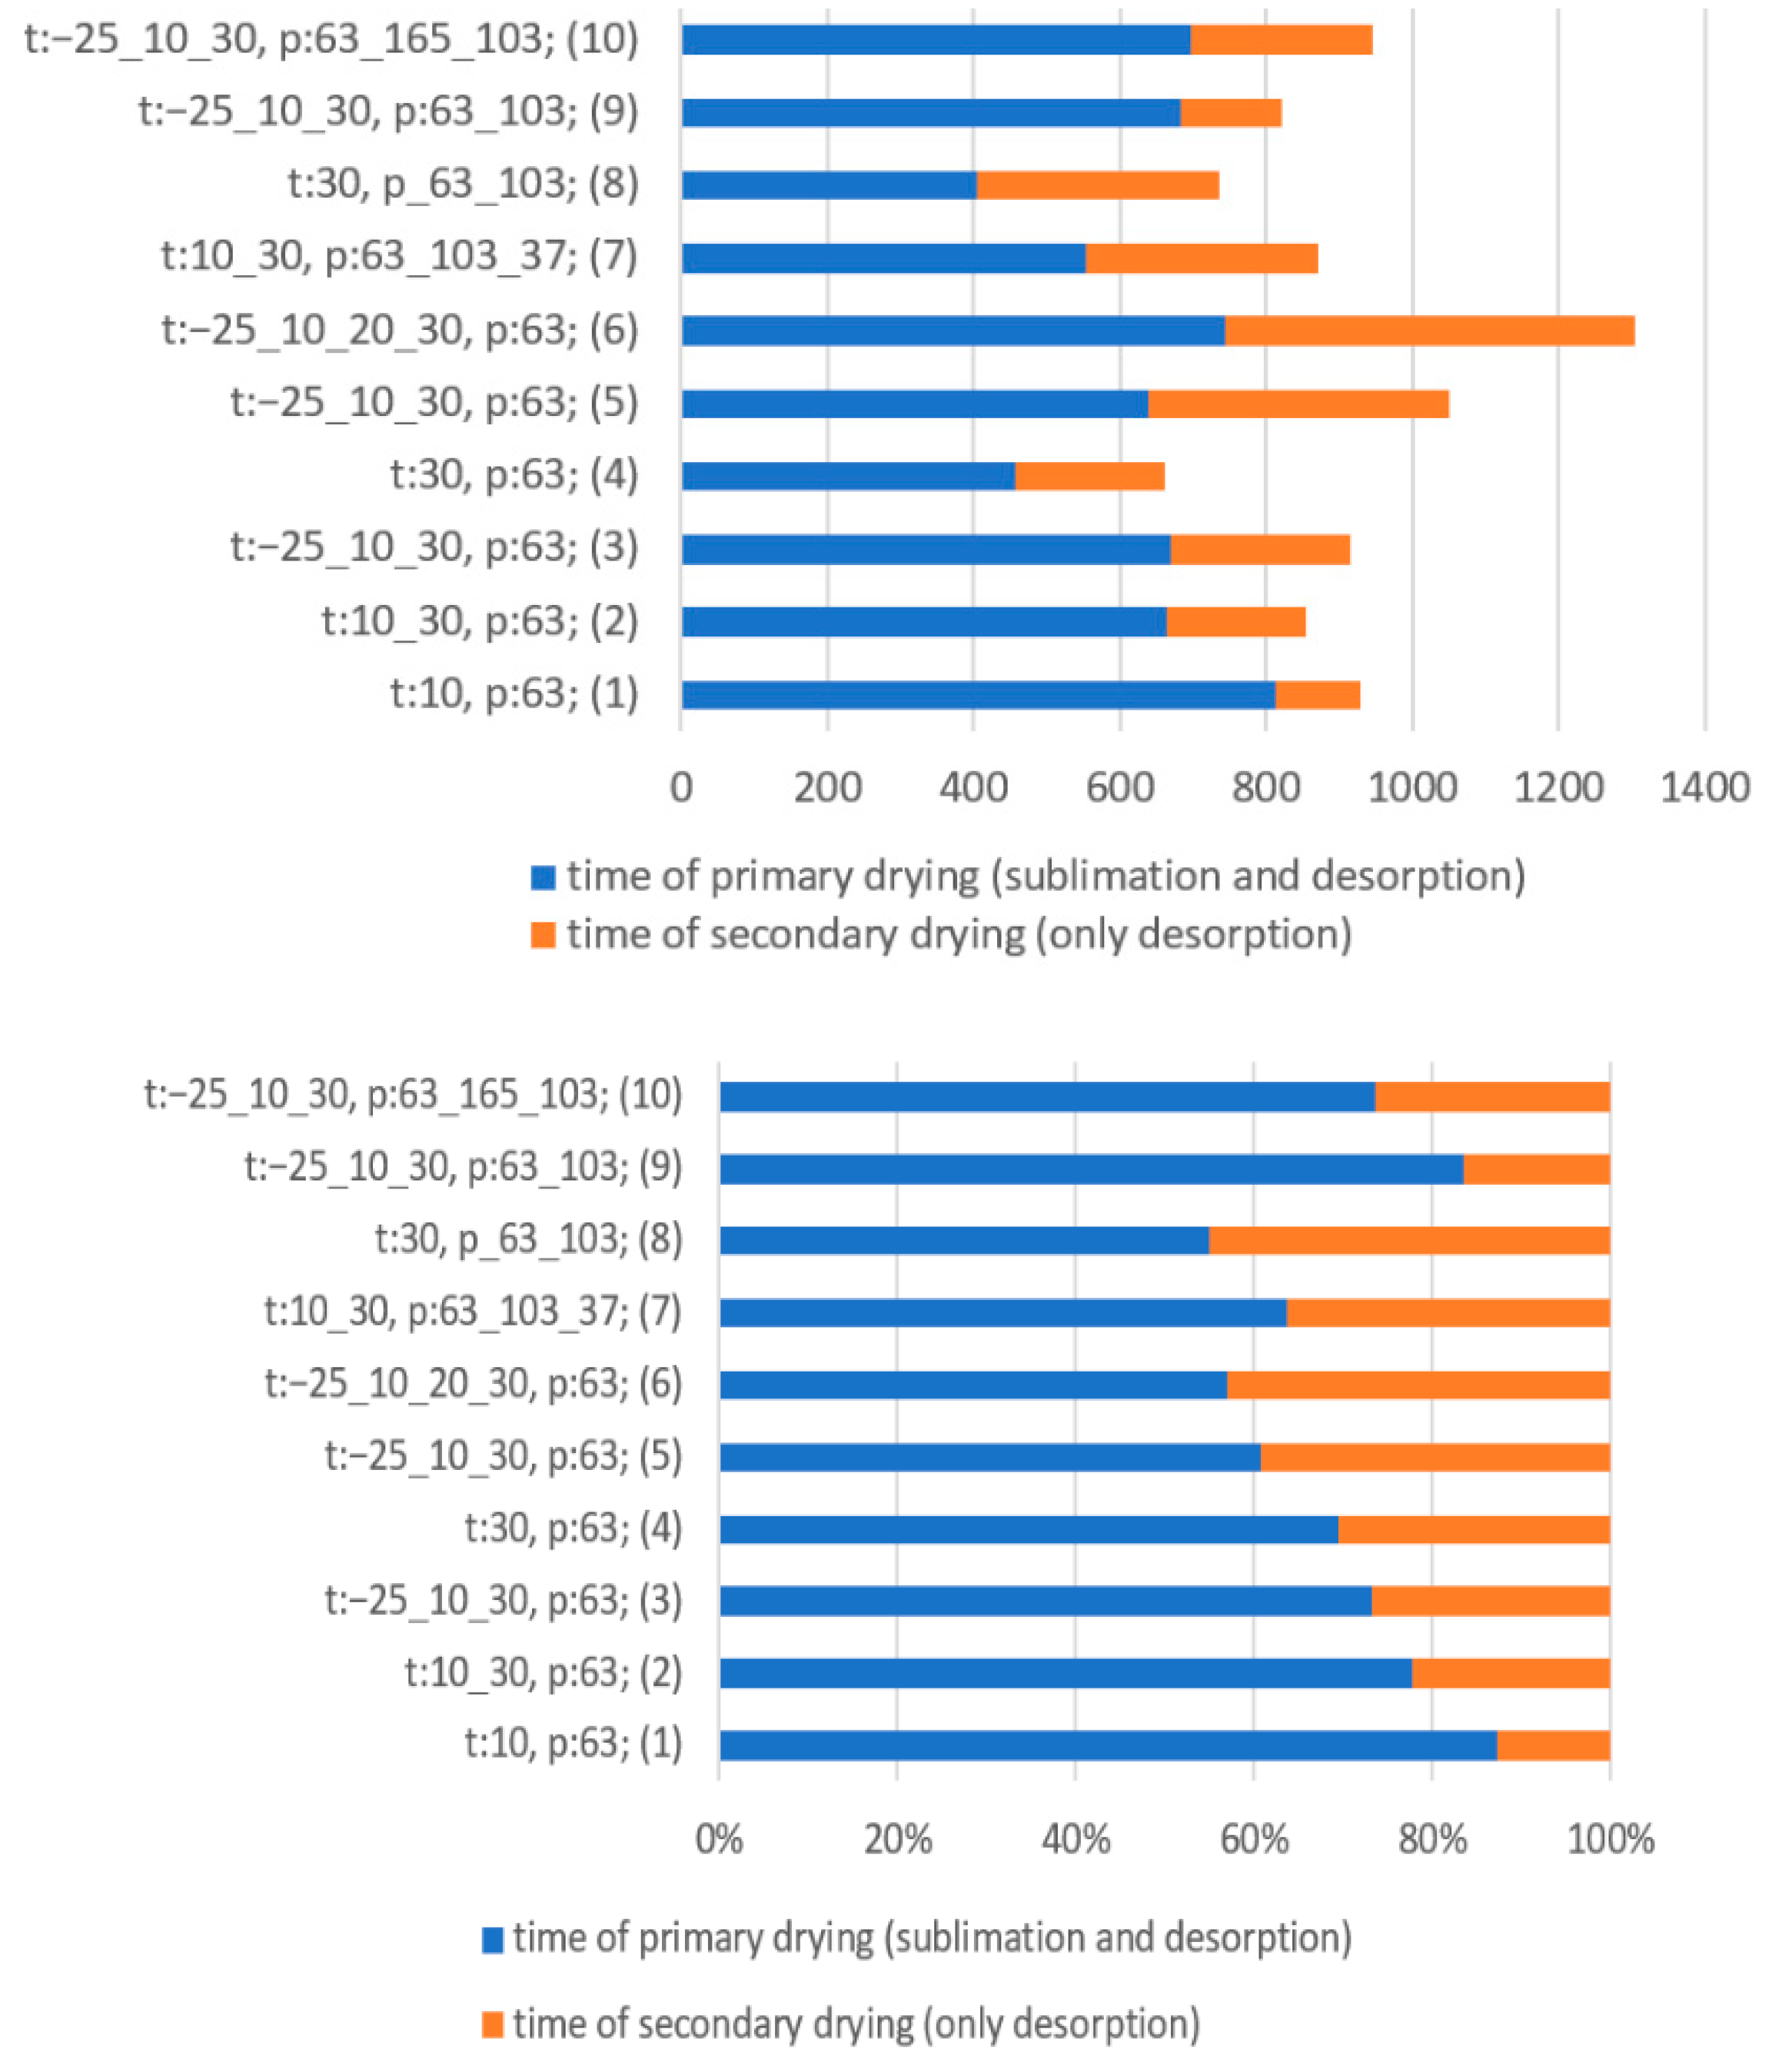
Table 1.
Dependence of evaporation temperature on pressure as a basis for selecting the pressure in the freeze dryer chamber for a given material; Based on [12].
Table 1.
Dependence of evaporation temperature on pressure as a basis for selecting the pressure in the freeze dryer chamber for a given material; Based on [12].
| Temperature, °C | Pressure, Pa | Temperature,°C | Pressure, Pa |
| 0 | 610.0 | -40 | 12.4 |
| -4 | 437.0 | -44 | 8.1 |
| -8 | 310.0 | -48 | 5.0 |
| -12 | 217.0 | -52 | 3.0 |
| -16 | 151.0 | -60 | 1.06 |
| -20 | 124.0 | -64 | 0.61 |
| -24 | 70.0 | -68 | 0.34 |
| -28 | 46.7 | -72 | 0.18 |
| -32 | 30.7 | -76 | 0.10 |
| -36 | 20.2 | -80 | 0.05 |
Table 3a.
Applied parameters during freeze-drying (effect of temperature).
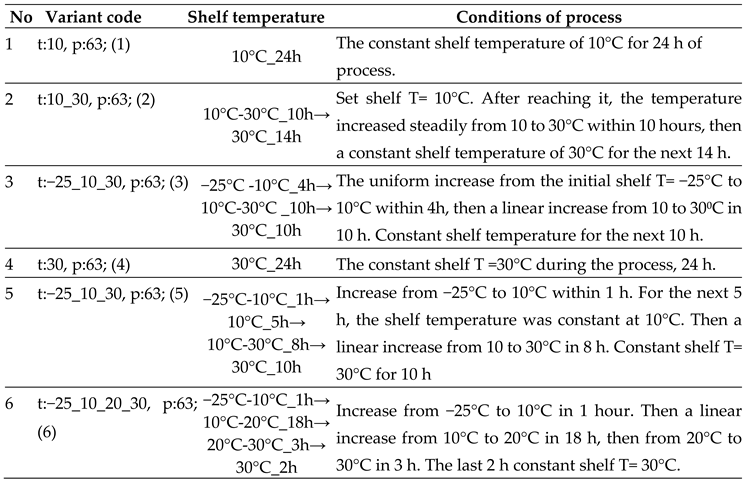 |
Table 3b.
Applied parameters during freeze-drying (effect of pressure, temperature).
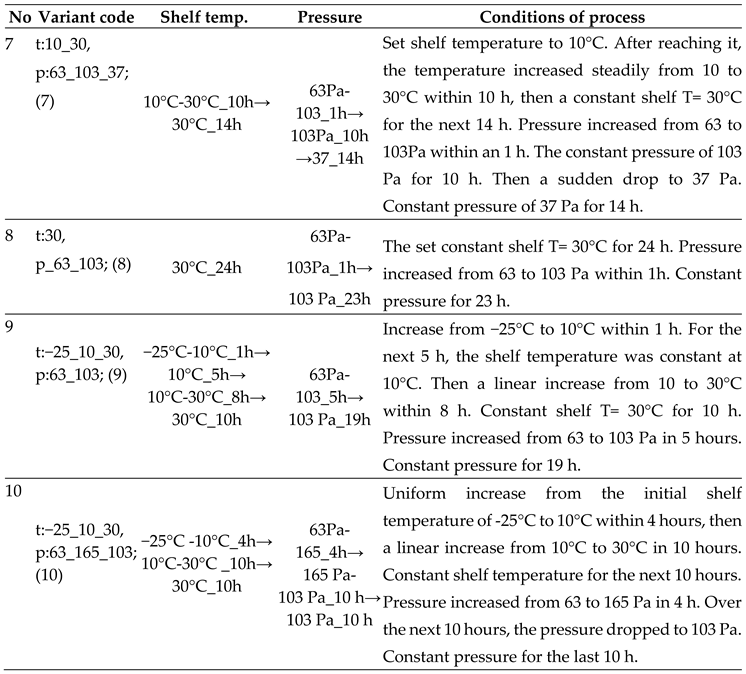 |
Table 4.
The parameters and goodness of fit of Midilli et al. model for freeze-drying of apples slices at different process conditions.
Table 4.
The parameters and goodness of fit of Midilli et al. model for freeze-drying of apples slices at different process conditions.
| Variants | a | 10−5 x b | 10−3 x k | n | R2 | RMSE |
| t:10, p:63; (1) | 1.005 (0.002)* | −190.0 (0.9) | 1.4 (0.1) | 1.069 (0.012) | 0.9994 | 0.0043 |
| t:10_30, p:63; (2) | 0.996 (0.002) | −12.7 (0.7) | 0.7 (0.0) | 1.214 (0.011) | 0.9995 | 0.0044 |
| t:−25_10_30, p:63; (3) | 0.984 (0.002) | −18.0 (0.9) | 0.2 (0.0) | 1.350 (0.014) | 0.9992 | 0.0042 |
| t:30, p:63; (4) | 1.009 (0.003) | −18.0 (1.0) | 1.6 (0.1) | 1.125 (0.013) | 0.9995 | 0.0044 |
| t:−25_10_30, p:63; (5) | 1.010 (0.002) | −15.0 (0.6) | 1.3 (0.0) | 1.059 (0.010) | 0.9994 | 0.0044 |
| t:−25_10_20_30, p:63; (6) | 1.002 (0.001) | −5.7 (0.2) | 1.2 (0.0) | 1.080 (0.005) | 0.9991 | 0.0010 |
| t:10_30, p:63_103_37; (7) | 1.007 (0.002) | −19.0 (1.0) | 0.8 (0.0) | 1.160 (0.015) | 0.9997 | 0.0051 |
| t:30, p_63_103; (8) | 1.009 (0.003) | −19.5 (1.3) | 1.9 (0.1) | 1.089 (0.015) | 0.9991 | 0.0053 |
| t:−25_10_30, p:63_103; (9) | 0.998 (0.002) | −14.1 (0.7) | 0.3 (0.0) | 1.330 (0.012) | 0.9991 | 0.0045 |
| t:−25_10_30, p:63_165_103; (10) | 0.996 (0.001) | −9.8 (0.4) | 0.06 (0.0) | 1.560 (0.008) | 0.9993 | 0.0010 |
* Standard error values are in brackets.
Table 6.
Drying time and water content in freeze-dried apples after reaching a temperature of −10 and −2°C in centre of material.
Table 6.
Drying time and water content in freeze-dried apples after reaching a temperature of −10 and −2°C in centre of material.
| Drying time, min | Water content, g water/ g d.m.−. | |||
|---|---|---|---|---|
| Variants | at−10°C in a centre of material |
at−2°C in a centre of material |
at−10°C in a centre of material |
at−2°C in a centre of material |
| t:10, p:63; (1) | 756 | 812 | 0.195 | 0.100 |
| t:10_30, p:63; (2) | 620 | 664 | 0.550 | 0.394 |
| t:−25_10_30, p:63; (3) | 590 | 670 | 1.101 | 0.620 |
| t:30, p:63; (4) | 356 | 458 | 1.401 | 0.701 |
| t:−25_10_30, p:63; (5) | 524 | 638 | 1.809 | 1.211 |
| t:−25_10_20_30, p:63; (6) | 530 | 744 | 1.661 | 0.891 |
| t:10_30, p:63_103_37; (7) | 420 | 554 | 1.681 | 0.874 |
| t:30, p_63_103; (8) | 346 | 404 | 1.428 | 0.998 |
| t:−25_10_30, p:63_103; (9) | 624 | 684 | 0.477 | 0.258 |
| t:−25_10_30, p:63_165_103; (10) | 566 | 696 | 1.232 | 0.594 |
Table 5.
Final drying time and moisture content in freeze-dried apples.
| Variants | Drying time, min | Moisture content, % |
| t:10, p:63; (1) | 930 ± 4a* | 3.46 ± 0.02a |
| t:10_30, p:63; (2) | 855 ± 3b | 3.26 ± 0.06b |
| t:−25_10_30, p:63; (3) | 915 ± 3c | 3.26 ± 0.02b |
| t:30, p:63; (4) | 660 ± 2d | 2.74 ± 0.01c |
| t:−25_10_30, p:63; (5) | 1050 ± 5e | 3.31± 0.08b |
| t:−25_10_20_30, p:63; (6) | 1305 ± 3f | 3.29± 0.21ab |
| t:10_30, p:63_103_37; (7) | 870 ± 4g | 2.74 ± 0.03c |
| t:30, p_63_103; (8) | 735 ± 3h | 2.77 ± 0.08c |
| t:−25_10_30, p:63_103; (9) | 820 ± 4i | 3.13 ± 0.08b |
| t:−25_10_30, p:63_165_103; (10) | 945 ± 3j | 3.55 ± 0.18a |
*data presented as mean ±standard deviation, the different letters in column indicate the the significant difference between the parameters, p ≤ 0.05.
Disclaimer/Publisher’s Note: The statements, opinions and data contained in all publications are solely those of the individual author(s) and contributor(s) and not of MDPI and/or the editor(s). MDPI and/or the editor(s) disclaim responsibility for any injury to people or property resulting from any ideas, methods, instructions or products referred to in the content. |
© 2024 by the authors. Licensee MDPI, Basel, Switzerland. This article is an open access article distributed under the terms and conditions of the Creative Commons Attribution (CC BY) license (http://creativecommons.org/licenses/by/4.0/).
Copyright: This open access article is published under a Creative Commons CC BY 4.0 license, which permit the free download, distribution, and reuse, provided that the author and preprint are cited in any reuse.


