
Submitted:
07 August 2024
Posted:
08 August 2024
You are already at the latest version
Abstract
In diabetic foot injury prevention, no studies relate physical activity with the inflammatory response of the plantar tissues, evaluated by thermography and pressure distribution. These measurements are easy to be implemented in diabetic foot follow-up. The objective of this study was to analyze whether the plantar skin response, evaluated with thermography, after physical activity in healthy or diabetic patients, is a foot ulcer prognostic tool and to asses if there is a correlation between exercise intensity, plantar pressure and plantar thermographic response. A systematic review was carried out following Preferred Reporting Items for Systematic Reviews and Meta-Analyses (PRISMA) format in the PubMed, Scopus and Web of Science databases, with no year limit during the second quarter of 2024. A total of 14 studies have been included in this review. The use of infrared thermography for early inflammatory tissue detection, plantar pressures and the monitoring of controlled physical activity, make possible to monitor changes that allow the identification of patients at risk of developing foot ulcers.
Keywords:
weight-bearing activity
; diabetic foot
; plantar pressure
; plantar temperature and plantar thermography
1. Introduction
One of the main complications of diabetes mellitus (DM) is the development of peripheral neuropathy (PN). Patients with DM and PN are more susceptible to developing plantar ulcers because they cannot perceive pain and be a trigger for lower extremities amputation [1,2,3]. According to Brand [4], three factors determine the possibility of actual breakdown probability and ulceration of the plantar soft tissue when there is a loss of painful sensation:
- Diabetic neuropathy and its complications in the sole of the foot.
- The magnitude of the forces reaching the foot.
- The distance walked that triggers a state of tissue inflammation.
Nowadays, foot pressure is still considered an important risk factor for the appearance of foot complications. However, this is a poor tool by itself to predict ulcer apparition because predictive values cannot be determined [5,6]. The poor specificity and sensitivity that these studies show for maximum pressures as pathological suggest that pressure cannot be the only factor associated with the development of plantar ulcers. In addition to plantar pressures, shear forces also play an important role in the development of diabetic foot lesions. They can predict higher shear pressure zones and increase plantar temperature accelerating tissue breakdown and leading to ulceration. Therefore, a significant correlation is established between shear forces and temperature increase [4,6,7]. Taking into account that inflammation is the first process for skin wound appearance and, above all, in the absence of pain, early identification of inflammation areas can help prevent diabetic foot ulcers. The use of thermography, as a tool for the analysis of load patterns on the soles, leads to a better understanding of the biomechanical factors of diabetic foot ulcers, for which thermal cameras are used to identify inflammation foot areas and critical points before the appearance of any injury [8,9,10]. Physical activity reduces diabetic foot ulcer risks. Therefore, people with diabetes mellitus should be encouraged to exercise. The optimal intensity of such activity remains unclear and controversial [11]. Hall et al. [12] show that there are significant temperature increases after walking for a short time and distance. They report that six minutes of walking increases 5ºC foot temperature. Burnfield et al. [13] show that walking speeds faster ones result in higher plantar pressures. No studies link both risk factors after analyzing physical activity in diabetic patients. So, it is necessary to assess physical activity (based on the temperature and pressure increase response in diabetic patients) [11]. The main objectives of this study are: 1. to analyze if plantar skin response after physical activity in diabetic patients is a prognostic tool of ulcer apparition 2. To asses if there is a correlation between exercise intensity, plantar pressure and plantar thermographic response.
2. Materials and Methods
Protocol and identification of the problem
This systematic review was conducted according to the guidelines of the Preferred Reporting Items for Systematic Reviews and Meta-Analyses (PRISMA) 2020 statement: An updated guideline for the publication of systematic reviews [14]. A systematic literature search has been carried out in order to analyze the scientific evidence on the relationship between plantar pressure and temperature as predictors and daily physical activity as a prognostic tool for plantar ulcers in diabetic subjects. Population, intervention, comparison and outcomes (PICO) strategies were defined for data research, as depicted in Table 1.
Research question
Is thermographic plantar cutaneous response a prognostic tool to avoid foot ulcers after physical activity in diabetic patients? Literature search strategy. The databases used were PubMed, Scopus and Web of Science (WOS). The Medical Subject Headings (MeSH) descriptors used were: physical activity, exercise, diabetic foot, plantar pressure, plantar temperature and plantar thermography, Table 2, being combined using the Boolean operators “AND” and “OR”. The search strategy used was performed in databases during the third quarter of 2023. Three search strategies were used for all databases: 1. (Physical activity) AND (Diabetic foot) AND (Plantar pressure) AND (plantar temperature) OR (Plantar thermography), 2. (Exercise) AND (Diabetic foot) AND (Plantar pressure) AND (Plantar temperature) OR (plantar thermography) and 3. ((Physical activity) OR (exercise) OR (activ*) OR (exerc*)) AND (Diabetic foot) AND ((Plantar pressure) OR (press*)) AND ((Plantar temperature) OR (plantar thermography) OR (temp*) OR (thermo*)). Eligibility and selection criteria: the population to be studied consisted of diabetic and healthy adult patients, without distinction of sex and regardless of the type of diabetes, with or without diabetic neuropathy. Studies in Spanish or English language were accepted. All randomized and non-randomized clinical trials (RCTs), prospective and retrospective studies that referred to the use of plantar pressures and plantar temperature and/or plantar thermography as a tool for the early foot ulcer detection or injury were included, as well as those that referred to physical activity, regardless of the year of publication. Articles that analyzed thermographic response of items like socks or foot insoles were excluded.
Data collection
A Word document table was created to extract data from studies. The main data extracted were: author name, year of publication, the purpose of study, number and type of included participants, methodology, intervention and outcomes.
Assessment of study methodology and quality
PEDro scale was used, it is a validated scale developed through a Delhi consensus by Verhagen et al. [15].
3. Results
Search strategies identified a total of 894 references. After screening, a total of 14studies were included in the review, as shown in Figure 1. Of the 14 selected articles, 12 (85.71%) are descriptive observational studies, while the remaining two (14.28%) are randomized clinical trials. Of the 12 descriptive observational studies, eight are cohort studies (66.66%), one is a cross-sectional study (8.33%), and three are case-control articles (25%).
The studies included were evaluated with the PEDro scale, and the quality of the analyzed studies is GOOD (Average 6.7 points). Two articles had a rating of 9 points (14.28%), another four articles had a rating of 7 points (35.71%), another six articles had a rating of 6 points (42.85%) and the rest 5 points (7.14%). Studies with a score between 9- 10 have an excellent methodology, between 6-8 have a good methodological quality, between 4-5 have a fair quality, and below 4 points have poor methodological quality [16,17]. Despite the relative heterogeneity of analyzed studies, there have been a certain number of consistent quality criteria in all of them: eleven studies meet the random-ness criteria in the selected sample and only in three articles was the sample selected for convenience, which could limit the external validity of results. However, all articles comply with the items on statistical information, which would overcome the bias of convenience sampling and support external validity because results of the study can be applied to the interest population. All studies met item 9 “results were presented for all subjects who received treatment or were allocated to control group, or where this could not be done, data for at least one key outcome were analyzed by 'intention to treat”. Only 2 studies fulfilled item 3 “Allocation was concealed” and no study fulfilled criterion 6 “All therapists who administered therapy were blinded” (Table 3).
Table 4 shows the characteristics of the eight studies included in this review. These were classified by authors and year of publication, the aim of studies, methodology, participants, intervention and results.
4. Discussion
This review aimed to use foot ulcers as a prognostic tool to analyze the response of plantar tissue to daily physical activity while considering different plantar pressure and temperature variables in healthy and diabetic patients. The results from different studies showed that the amount and type of activities analyzed to date were heterogeneous [18,25] and so accumulated load in plantar tissues differed greatly among individuals. All the research we considered [18,25] agreed that plantar pressure and temperature increase during walking and other weight-bearing actions. This activity can be studied by thermography, which may help to evaluate skin degradation and prevent injuries in plantar tissues. Maluf et al. found that the maximum pressures recorded during walking were weakly associated with the pressures recorded in the same participant during other daily activities [18]. This finding suggests that foot pressure during walking may inaccurately reflect loads on plantar tissues during other activities of daily life. According to these authors, the magnitude and distribution of pressures in healthy individuals vary with different types of activity and walking speeds, which may explain why patients at risk of skin ulceration could not be identified based on a predetermined pressure threshold during ambulation and other physical activities. Reddy et al. registered the foot temperature in two different participant age groups (30–40 years and 162 over 40 years) while walking on a treadmill for 45 minutes. They observed that walking cadence caused a progressive temperature increase (5°C over the first 23 minutes at a cadence of 80, 100, and 120 steps/minute) but after 45 minutes of walking, the final temperature did not vary when compared with the baseline [19]. This result was consistent with the findings of a subsequent study by Li et al., although most of the participants in the latter work were older (M = 70 years) and the increase in temperature observed after walking 30 minutes at 3 km/h was also lower (4°C) [20]. Nonetheless, both these studies suggest that there was a significant stabilization or plateau effect on foot temperature during walking. The concept of a foot temperature plateau seems intuitive given the physiological mechanisms that support heat generation, including muscle contractions, frictional forces, or viscoelastic heating, as well as factors that control heat loss such as radiation, conduction, and evaporation. However, further investigation would be required to confirm and explore this idea. Regardless, blood flow can either increase or dissipate temperature in different contexts. In this line, Nemati et al. developed a model to describe heat transfer in shod feet that could predict the temperature of the sole of the foot, especially at the level of the plantar arch and metatarsal area [21]. These authors also considered the heat loss caused by sweating during walking and running, measuring a maximum increase in the temperature of the sole of the foot after 30 minutes of 6°C, 8°C, and 11.5°C for speeds of 3, 6, and 9 km/h, respectively. The mean age of the participants in this latter work was 23.8 years, and like previous studies [19,20], the increase in temperature during walking and running was greater in younger participants. Nemati et al. [21] showed that cooling of the plantar arch and metatarsal area as a thermoregulatory mechanism—through sweating—was minimal at a speed of 3 km/h but appeared in the plantar arch area after 15 minutes at 9 km/h and at 20 minutes at 6 km/h, although sweat in the metatarsal are was negligible at all these speeds. Thus, based on all the above, it can be deduced that sweating plays a fundamental role in the thermal regulation of the plantar arch but is insignificant in the metatarsal area. Niemann et al. [22] concluded that plantar temperature decreased significantly during prolonged standing periods which could cause plantar injuries, especially in individuals that work in an upright position. These authors observed a pronounced temperature decrease in the maximum pressure areas (fifth metatarsal head and big toe) after alternating 6 periods of prolonged standing (5, 10, 20, 5, 10, 191 and 20 minutes) with sitting periods (5 minutes each) in healthy and diabetic participants. Pressure sensor recordings revealed that during longer standing periods there was intermittent pressure as the result of discomfort in healthy individuals but not in patients with diabetes and polyneuropathy. Given the relevance of the blood supply to tissues, it can be imagined that patients with diabetes may experience critical tissue ischemia when exposed to their own body weight for prolonged periods of time because they do not seem to experience foot discomfort in the same way as healthy volunteers [22]. Indeed, in the study by Carbonell et al. thermographic images were taken in both diabetic patients and a healthy control group before and after walking 100 m barefoot on a treadmill at a self-selected speed [23]. The temperature of the feet of the diabetic individuals decreased more than in healthy individuals at all the regions of interest (ROIs) analyzed (left and right big toe, forefoot, midfoot, and rearfoot), with the rearfoot and forefoot presenting the greatest temperature differences between the groups (−1.0°C), although not significantly so. In turn, in their study using infrared images to analyze feet in a military training environment, DiBenedetto et al. explained that any sudden increase in weight-bearing activities (such as walks or long runs) caused greater emission of heat in the areas that received the highest amount of pressure during the gait cycle, as reflected in thermographic imaging [24]. These authors determined normal foot parameters by dividing them into four regions: the toes, heel, forefoot, and rarefoot, observing that the temperature difference in the whole thermographic foot image was 1.1°C. In contrast, the normal differences between the hottest and coldest foot areas were 3°C to 5°C, with changes greater than 6°C suggesting the presence of a pathology. Interestingly, these data coincide with those from Reddy et al., where plantar temperature increased by 5°C during walking [19], with DiBenedetto et al. adding a temperature threshold of 6°C at which point a foot injury would be detected [24]. These authors showed that the warmest areas were shown in injured feet and at the greatest pressure points, despite the absence of a feeling of discomfort in these patients [24]. Of note, when stress fractures were suspected but the radiological findings were negative, thermography was still sensitive to this pathology. Indeed, correlations between stress fracture, thermography, and gammagraphy were positive in 66% of cases. Thus, this situation reflects the need to evaluate thermograms qualitatively and quantitatively to relate their results with clinical findings. Vasomotor changes in foot injuries are not only associated with hyperthermia but can also be related to hypothermia. This was also studied by DiBenedetto et al. in 1,000 military recruits during basic training, with this phenomenon being referred to as a reflex sympathetic dystrophy [25]. The authors pointed out that qualitative thermogram interpretation showed a high sensitivity for anomaly recognition but a low specificity in diagnosis terms. They also found that it is difficult to distinguish temperature changes caused by bone or soft tissue injuries and to draw conclusions about the severity of said lesions [24]. This is because hot areas simply signify a greater vascular response to injury but this is not always limited to the location of the lesion. Compared to bone injuries, soft tissue injuries often cause even hotter areas to appear on thermograms. This may be because of the bone depth compared to more superficially located and more readily injured soft tissues. Hence, thermography can be a good complement to understanding foot stress pathophysiology, although it must be accompanied by detailed clinical examinations and complementary tests because there are no consistent criteria to help establish a foot diagnosis when using thermograms. Importantly, as Reddy et al. showed, increased plantar temperature and vertical foot pressure are moderately correlated [19]. These authors suggested a relationship between foot load, foot pressure, and plantar temperature changes could exist in terms of shear forces. In turn, Yavuz et al. used a thermal infrared camera and a custom-made shear force plate to study a possible association between plantar tensions and increased foot sole temperature after exercise [26]. After patients walked for 10 minutes, pressure, stress, and shear data were recorded and moreover, thermograms were performed before and after exercise. This led to the identification of a moderate linear relationship between shear forces and maximum post-exercise plantar temperature (r = 0.78, p = 0.0002). It is thought that increased plantar temperature resulting from physical activity depends more on shear rather than triaxle plantar stresses, although thermal cameras are not reliable for predicting shear stress forces. However, in contrast to the findings by Yavuz et al. [26], the results from Priego Quesada et al. highlighted an inverse relationship between foot eversion and thermal symmetry immediately after running, with the medial ROIs showing higher temperatures than the lateral ROIs (p < 0.05) 246 [27]. In the same line, Catalá-Vilaplana et al. analysed how using unstable versus stable shoes affects the temperature of the sole of the foot after walking for 10 minutes at 1.44 m/s with each shoe type (with two hours of rest between each test) [28]. These authors only found significant differences in the results for the midfoot area (p = 0.004, ES = 1.2). One possible explanation for this outcome could be that the side of the foot experiencing less contact time during the stance phase may be exposed to greater friction with the footwear. This would result in a greater temperature increase [27] that would also remain more constant in unstable shoes because of the change in plantar distribution they create [28]. Similarly, Cuaderes et al. studied diabetic patients who either performed weight-bearing activities at a moderate intensity (athletes) or who did not perform these activities (non-athletes) [29]. This work found significant differences in pressure, temperature, and the plantar surface skin temperature gradient between these cohorts. This was especially true among athletes where the temperature gradient was higher in the first metatarsal head of these participants than in those who did not exercise (athletes: M = 1.66, SD = 1.31 vs. non-athletes M = 1.20, SD = 1.20, p = 0.02). These authors only found one significant linear relationship: between plantar pressure and weight-bearing activity in athletes in the second metatarsal head (r = 0.237, p = 0.02) and the third metatarsal head (r = 0.264, 262 p = 0.01) of the right foot in both cases. In the same vein, Perren et al. performed pressure tests in healthy and diabetic participants with and without complications (peripheral arterial disease or neuropathy) who walked for 15 minutes on a motorised treadmill [30]. One minute after stopping walking, thermograms of the hallux, medial, central, and lateral part of the forefoot and heel were recorded. There was a positive correlation between temperature and plantar pressure in the ROIs of the hallux, second to fifth metatarsal head and heel in diabetic patients with complications, while this relationship was only seen in the fifth metatarsal head in the healthy and diabetic participants without complications (p < 0.05). There was also a positive correlation for all the ROIs in the group with diabetes (both with and without complications) and only for the second to fifth metatarsal head in the group of healthy participants (p < 0.05). This work demonstrated that there was a positive correlation between pressure and temperature: as pressure increased, temperature also increased. There was a tendency for pressure areas to warm up in healthy individuals, including those with uncomplicated diabetes, and this correlation was stronger in diabetic patients with complications [30]. Similarly, Cuaderes et al. observed higher plantar pressures in sportswomen [29] while Jimenez et al. observed higher plantar temperatures in women versus men for all foot ROIs (forefoot: 12.3 vs. 9.8°C, p = 0.004; midfoot: 9.3 vs. 8.0°C, p = 0.047; and rearfoot: 10.7 vs. 8.7°C, p = 0.003) [21]. Therefore, these data indicate that sportswomen presented higher plantar pressures and temperatures than sportsmen. Jimenez et al. went on to study the relationship between pressure and plantar foot temperature and/or shoe sole type in athletes [31]. The participants were recreational runners simulating regular training on a treadmill for 30 minutes at a 1% incline (after a 6-minute warm-up). The highest plantar pressure values were recorded for the forefoot (p < 0.001), although these authors did not distinguish specific ROIs as in previous studies. Nonetheless, there were no differences between the forefoot and midfoot for plantar temperature, although lower values were found in the hindfoot (p < 0.001). Thus, as also concluded by Reddy et al. [19], plantar temperature did not seem to be related to plantar pressure. Finally, it is important to recognize that there were several limitations to this review that must be considered when interpreting the results. One of its main restraints was the low number of manuscripts included because we limited them to studies that included the key words “plantar pressure” and/or “plantar temperature” and “physical activity”. Nevertheless, the quality analysis we performed allowed us to establish relationships with implications that will be important in clinical practice. These findings can help predict skin deterioration in diabetic patients with peripheral neuropathy and allow the recommendation of personalized physical activity regimens to each patient according to the physiological responses of the soles of their feet. Another limitation was that the studies we analyzed were mostly cross-sectional and so future descriptive studies should take a surveillance perspective in order to reveal more information about the use of physical activity as a prognostic tool for assessing diabetic foot ulcers.
5. Conclusions
The results of this systematic review reveal that the magnitude and distribution of pressures in healthy and diabetic subjects vary between different types of activity, just as load patterns are modified by walking speed. Similarly, foot temperature increases by 5ºC when walking, and a temperature threshold of 6ºC may be useful to detect or foresee a foot injury. For all these reasons, thermographic evaluation of plantar temperature and pressure changes during exercise may help to prevent plantar lesions.
Author Contributions
MP.R.D. participated in the conception and design of the study, completed the literature research, was involved in the analysis and interpretation of the results and drafted the article. I.J.-R. and M.I.-R. participated in the conception and the design of the study, were involved in the analysis and interpretation of the results and reviewed the article critically for important intellectual content. M.M. and M.A. reviewed the article critically for important intellectual content and gave final approval of the version to be published. All authors have read and agreed to the published version of the manuscript.
Funding
This research received no external funding.
Institutional Review Board Statement
Not applicable.
Informed Consent Statement
Not applicable.
Data Availability Statement
Data are contained within the article.
Conflicts of Interest
The authors declare no conflicts of interest.
References
- Boulton AJ, Vileikyte L, Ragnarson-Tennvall, G & Apelqvist J. The global burden of diabetic foot disease. Lancet. 2005, 366(9498): 1719-1724. [CrossRef]
- Kumari MJSJ, Jagdish, S. How to prevent amputation in diabetic patients. Int J Nurs Educ. 2014, 6: 40-44.
- Volmer-Thole M, Lobmann R. Neuropathy and diabetic foot syndrome. Int. J. Mol. Sci. 2016, 17 (6): 917. [CrossRef]
- Brand PW. Tenderizing the foot. Foot & Ankle International. 2003, 24(6):457-461. [CrossRef]
- Lavery LA, Armstrong DG, Wunderlich RP, Tredwell J Boulton, AJ. Predictive value of foot pressure assessment as part of a population-based diabetes disease management program. Diabetes Care. 2003, 26 (4): 1069-1073. [CrossRef]
- Yavuz M. American Society of Biomechanics Clinical Biomechanics Award 2012: plantar shear stress distributions in diabetic patients with and without neuropathy. Clinical Biomechanics. 2014, 29 (2): 223-229. [CrossRef]
- Yavuz M, Botek G, Davis BL. Plantar shear stress distributions: Comparing actual and predicted frictional forces at the foot–ground interface. Journal of Biomechanics. 2007; 40 (13): 3045-3049. [CrossRef]
- Macdonald A, Petrova N, Ainarkar S, Allen J, Plassmann P, Whittam A, Bevans, J, Ring F, Kluwe B, Simpson R, Rogers L, Machin G & Edmonds M. Thermal symmetry of healthy feet: a precursor to a thermal study of diabetic feet prior to skin breakdown. Physiological measurement. 2016, 38 (1): 33-44. [CrossRef]
- Hernández-Contreras D, Peregrina-Barreto H, Rangel-Magdaleno J, González-Bernal JA, & Altamirano-Robles L. A quantitative index for classification of plantar thermal changes in the diabetic foot. Infrared Physics & Technology. 2017, 81: 242-249. [CrossRef]
- Armstrong DG, Holtz-Neiderer K, Wendel C, Mohler MJ, Kimbriel HR, & Lavery LA. Skin temperature monitoring reduces the risk for diabetic foot ulceration in high-risk patients. Am J Med. 2007, 120 (12): 1042-1046. [CrossRef]
- Lung, CW, Wu, FL, Liao, F., Pu, F., Fan, Y., and Jan, YK. Emerging technologies for the prevention and management of diabetic foot ulcers. J Tissue Viability. 2020, 29 (2), 61-68. [CrossRef]
- Hall, M, Shurr, DG, Zimmerman, MB, & Saltzman, CL. Plantar foot surface temperatures with use of insoles. The Iowa orthopedic journal. 2004; 24,72-75. PMC1888418 341.
- Burnfield JM, Few CD, Mohamed OS, & Perry J. The influence of walking speed and footwear on plantar pressures in older adults. Clin Biomech (Bristol, Avon). 2004, 19 (1): 78-84. [CrossRef]
- Page, MJ, McKenzie, JE, Bossuyt, PM, Boutron, I., Hoffmann, TC, Mulrow, CD ... and Moher, D. PRISMA 2020 statement: an updated guide for the publication of systematic reviews. Spanish Journal of Cardiology. 2021, 74 (9), 790-799. [CrossRef]
- Verhagen, AP, De Vet, HC, De Bie, RA, Kessels, AG, Boers, M, Bouter, LM, & Knipschild, PG. The Deplphilist: a criteria list for quality assessment of randomized clinical trials for conducting systematic reviews developed by Delphi consensus. Journal of clinical epidemiology. 1998; 51 (12), 1235-1241. [CrossRef]
- Albanese, E.; Bütikofer, L.; Armijo-Olivo, S.; Ha, C.; Egger, M. Construct validity of the Physiotherapy Evidence Database (PEDro) quality scale for randomized trials: Item response theory and factor analyses. Res. Synth. Methods. 2020, 11, 227–236. [CrossRef]
- Escala PEDro—PEDro. Available online: https://pedro.org.au/spanish/resources/pedro-scale/ (accessed on).
- Maluf, KS, Morley Jr, RE, Richter, EJ, Klaesner, JW, & Mueller, MJ. Monitoring in-shoe plantar pressures, temperature, and humidity: reliability and validity of measures from a portable device. Archives of physical medicine and rehabilitation. 2001, 82 (8), 1119-1127. [CrossRef]
- Reddy, PN, Cooper, G., Weightman, A., Hodson-Tole, E., & Reeves, ND. Walking cadence affects rate of plantar foot temperature change but not final temperature in younger and older adults. Gait & Posture. 2017, 52, 272-279. [CrossRef]
- Li, P. L., Yick, K. L., Yip, J., & Ng, S. P. Influence of Upper Footwear Material Properties on Foot Skin Temperature, Humidity and Perceived Comfort of Older Individuals. International Journal of Environmental Research and Public Health. 2022, 19(17), 10861.
- Nemati, H., & Naemi, R. An Analytical Model to Predict Foot Sole Temperature: Implications to Insole Design for Physical Activity in Sport and Exercise. Applied Sciences. 2022, 12(13), 370 6806.
- Niemann, U., Spiliopoulou, M., Malanowski, J., Kellersmann, J., Szczepanski, T., Klose, S., Dedonaki, E., Walter, I., Ming, A., and Mertens, P.R. Plantar temperatures in stance position: comparative study with healthy volunteers and diabetes patients diagnosed with sensoric neuropathy. EBioMedicine. 2020, 54, 102712. [CrossRef]
- Carbonell, L., Quesada, J. I. P., Retorta, P., Benimeli, M., De Anda, R. M. C. O., Palmer, R. S., ... & Macián-Romero, C. Thermographic quantitative variables for diabetic foot assessment: preliminary results. Computer Methods in Biomechanics and Biomedical Engineering: Imaging & Visualization. 2018, 7(5-6):1-7. [CrossRef]
- Di Benedetto, M., Huston, CW, Sharp, MW, and Jones, B. Regional hypothermia in response to minor injury. American journal of physical medicine & rehabilitation. 1996, 75 (4), 270-277.
- Di Benedetto, M., Yoshida, M., Sharp, M., & Jones, B. Foot evaluation by infrared imaging. Military medicine.2002, 167 (5), 384-392. [CrossRef]
- Yavuz M, Brem RW, Davis BL, Patel J, Osbourne A, Matassini MR, Wood DA, and Nwokolo IO. Temperature as a predictive tool for planting triaxial loading. Journal of Biomechanics. 2014, 47 (15), 3767-3770. [CrossRef]
- Priego Quesada, J. I. P., Gil-Calvo, M., Jimenez-Perez, I., Lucas-Cuevas, Á. G., & Pérez-Soriano,P. Relationship between foot eversion and thermographic foot skin temperature after running. Applied optics. 2017, 56(19), 5559-5565.
- Catalá-Vilaplana, I., García-Domínguez, E., Aparicio, I., Ortega-Benavent, N., Marzano Felisatti, J. M., & Sanchis-Sanchis, R. Effect of unstable sports footwear on acceleration impacts and plantar surface temperature during walking: a pilot study. Retos. 2023, 49, 1004-1010.
- Cuaderes, E., DeShea, L., & Lamb, W.L. Weight-Bearing Exercise and Foot Health in Native Americans. Care Management Journals. 2014, 15 (4), 184-195. DOI: 395 10.1891/15210987.15.4.184.
- Perren, S., Formosa, C., Camilleri, L., Chockalingam, N., & Gatt, A. The Thermo-Pressure Concept: A New Model in Diabetic Foot Risk Stratification. Applied Sciences. 2021, 11(16), 7473.
- Jimenez, I., Gil, M., Salvador, R., de Anda, RMCO, Pérez, P., and Priego, JI. Footwear outsole temperature may be more related to plantar pressure during a prolonged run than foot temperature. Physiological Measurement. 2021, 42 (7), 074004. [CrossRef]
Figure 1.
PRISMA study selection flowchart.
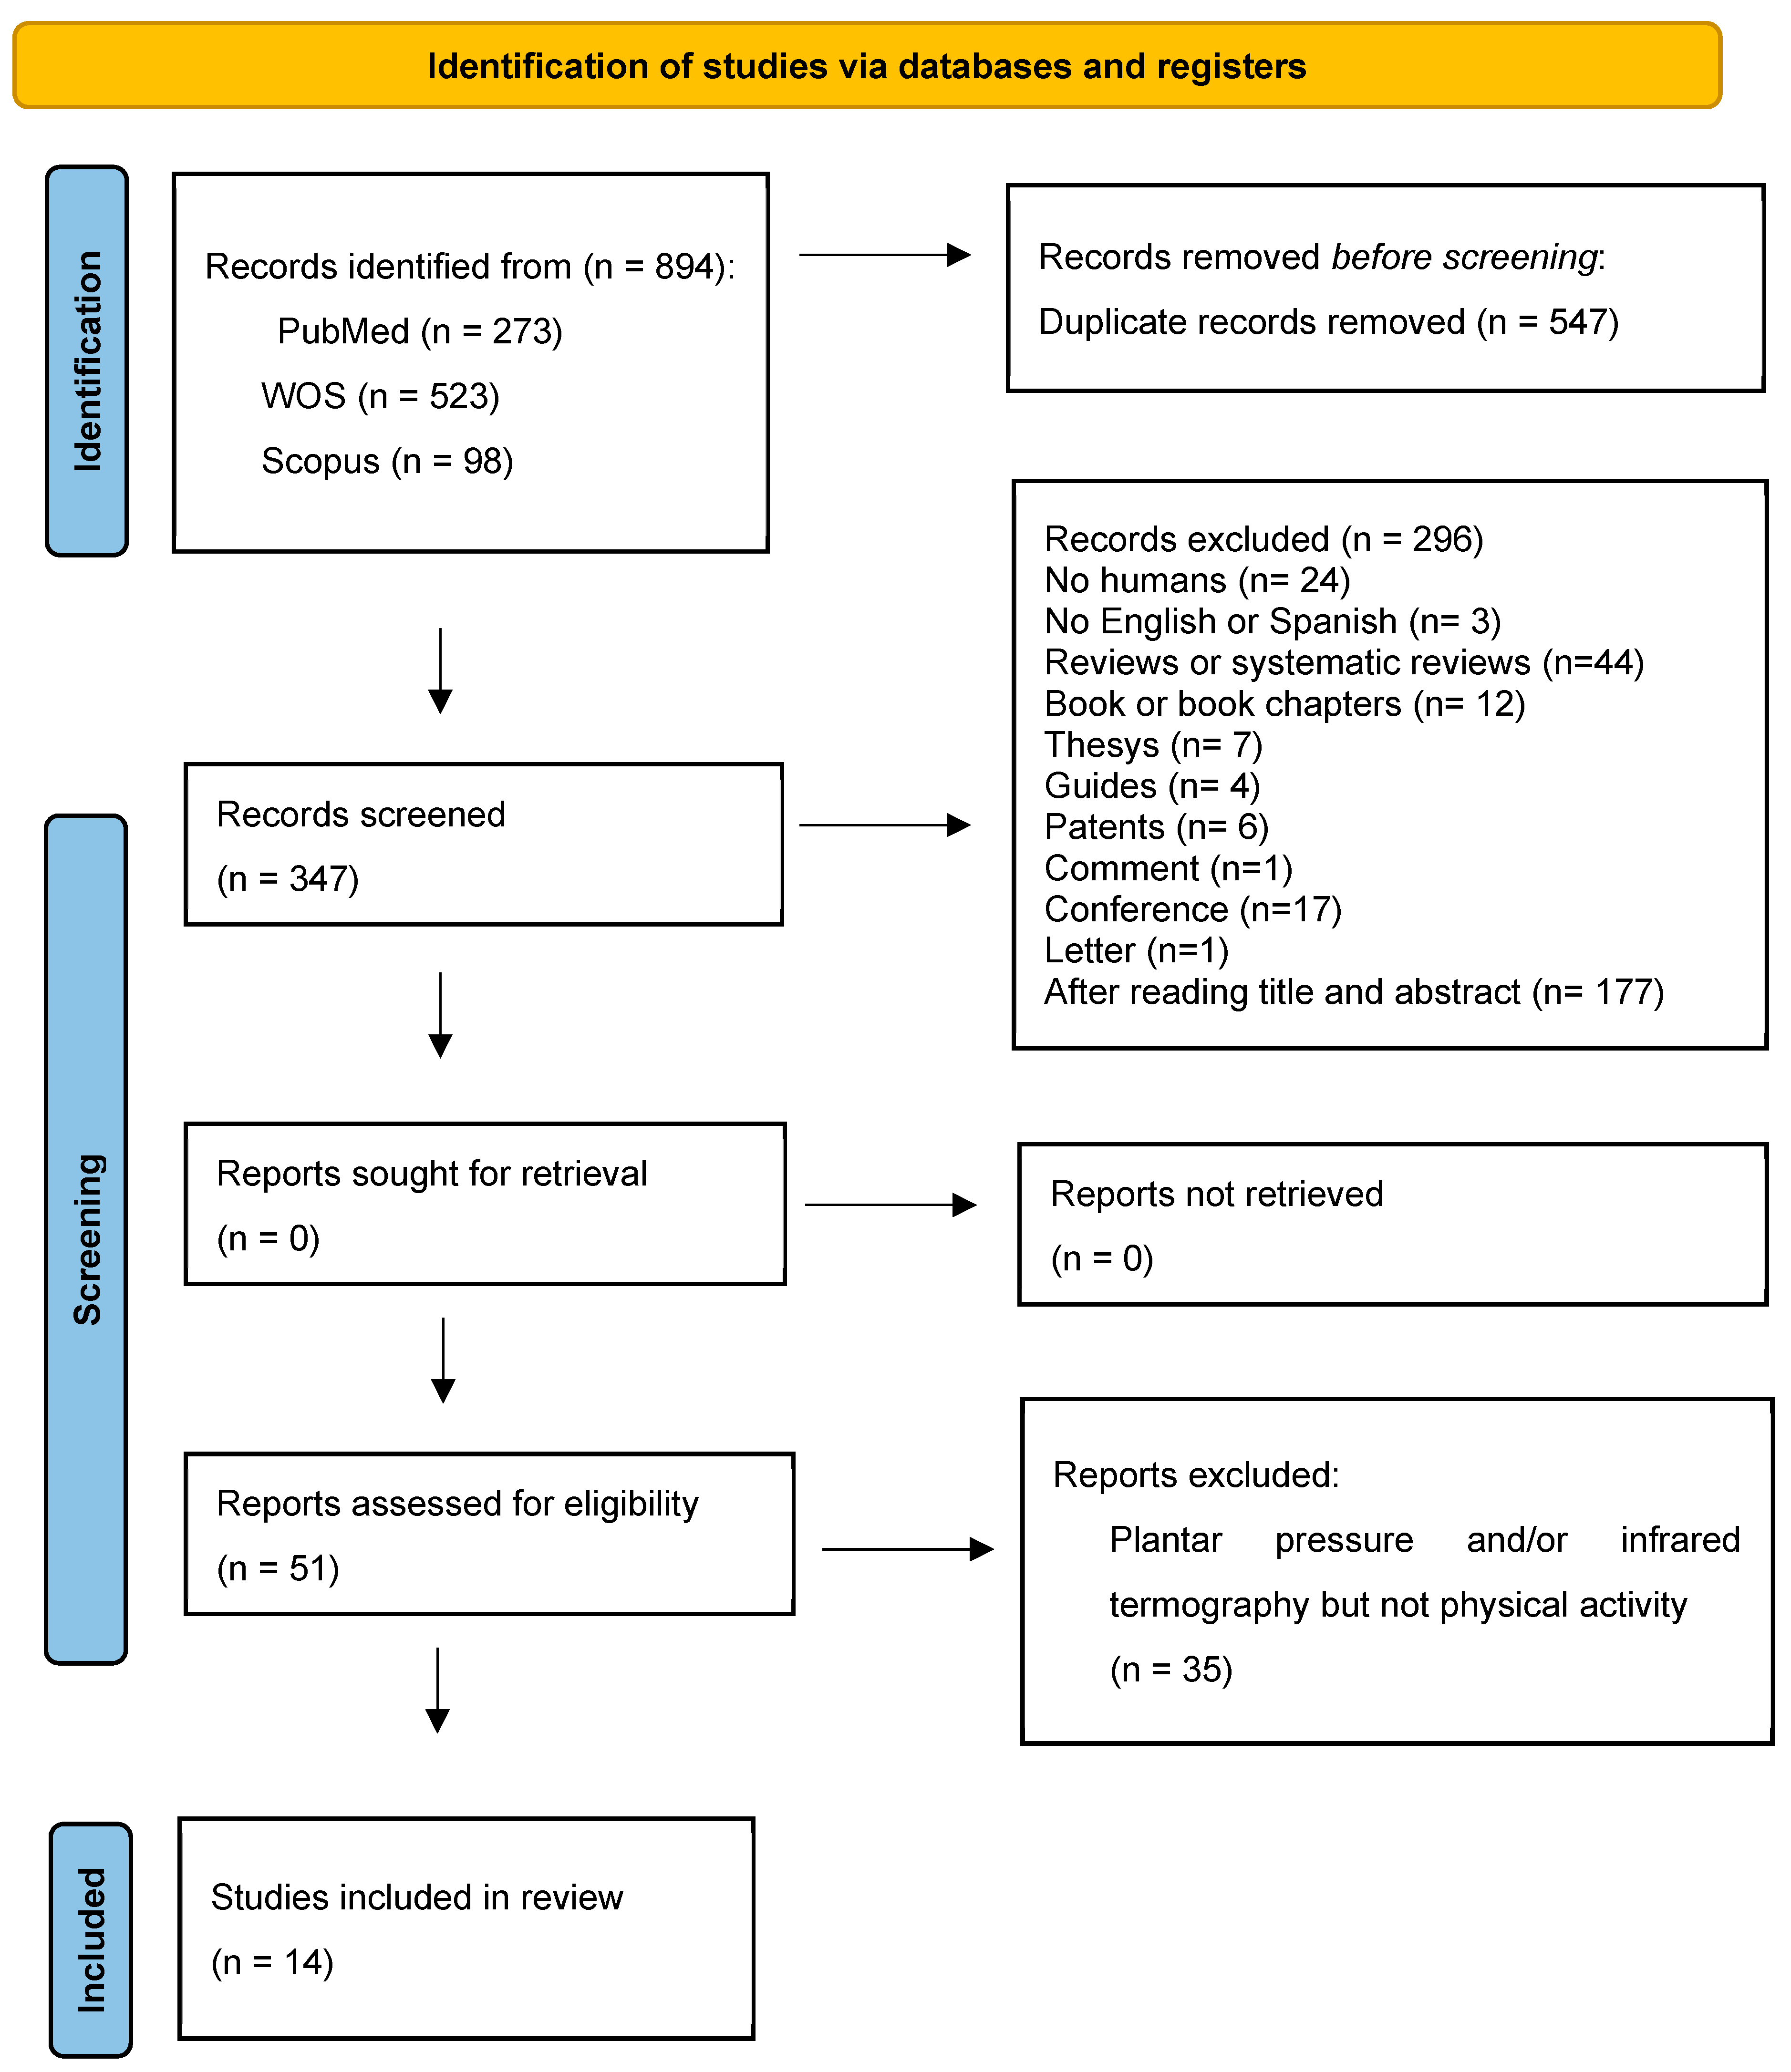

Table 1.
PICO research questions.
| PICO Format | |
| P (patient) | Healthy or diabetic subjects |
| I (intervention) | Measure plantar pressure and temperature and physical activity |
| C (control) | Healthy or diabetic patients |
| O (outcomes) | Changes in plantar temperature and pressure cause different plantar skin reactions during daily physical activity. |
Table 2.
Search terms.
| MeSH | Terms |
|---|---|
| Physical activity | Exercise |
| Diabetic foot | Diabetic foot |
| Plantar pressure | Plantar pressure |
| Plantar temperature | Plantar temperature |
| Plantar thermography | Plantar thermography |
Table 3.
Articles’ methodology quality scores according to the PEDro scale. “✓” Meet requeriment and “✗” do not meet requeriment.
Table 3.
Articles’ methodology quality scores according to the PEDro scale. “✓” Meet requeriment and “✗” do not meet requeriment.
| Inclusion and source | Random assignment | Hidden assignment | Baseline comparability | Blinded subjects | Blinded therapists | Blinded raters | Results above 85% | Analysis by “intention to treat” | Statiscal comparisons between groups | Measurement and variability data | Score | |
|---|---|---|---|---|---|---|---|---|---|---|---|---|
| Maluf et al. 2001 [18] | ✓ | ✕ | ✕ | ✓ | ✕ | ✕ | ✕ | ✓ | ✓ | ✓ | ✓ | 5 |
| Reddy et al. 2017 [19] | ✓ | ✓ | ✕ | ✓ | ✕ | ✕ | ✕ | ✓ | ✓ | ✓ | ✓ | 6 |
| Li et al. 2022 [20] | ✓ | ✓ | ✕ | ✓ | ✕ | ✕ | ✕ | ✓ | ✓ | ✓ | ✓ | 7 |
| Nemati et al. 2022 [21] | ✓ | ✓ | ✕ | ✓ | ✕ | ✕ | ✕ | ✓ | ✓ | ✓ | ✓ | 7 |
| Niemann et al. 2020[22] | ✓ | ✓ | ✕ | ✓ | ✕ | ✕ | ✕ | ✓ | ✓ | ✓ | ✓ | 6 |
| Cabonell et al. 2019 [23] | ✓ | ✓ | ✕ | ✓ | ✕ | ✕ | ✕ | ✓ | ✓ | ✓ | ✓ | 7 |
| Di Benetto et al. 1996 [24] | ✓ | ✓ | ✓ | ✓ | ✓ | ✕ | ✓ | ✓ | ✓ | ✓ | ✓ | 9 |
| Di Benedetto et al. 2002 [25] | ✓ | ✓ | ✓ | ✓ | ✓ | ✕ | ✓ | ✓ | ✓ | ✓ | ✓ | 9 |
| Yavuz et al. 2014 [26] | ✓ | ✓ | ✕ | ✓ | ✕ | ✕ | ✓ | ✓ | ✓ | ✓ | ✓ | 7 |
| Priego Quesada et al 2017 [27] | ✓ | ✓ | ✕ | ✓ | ✕ | ✕ | ✕ | ✓ | ✓ | ✓ | ✓ | 7 |
| CataláVilaplana et al. 2023 [28] | ✓ | ✓ | ✕ | ✓ | ✕ | ✕ | ✕ | ✓ | ✓ | ✓ | ✓ | 7 |
| Cuaderes et al. 2014 [29] | ✓ | ✕ | ✕ | ✓ | ✕ | ✕ | ✕ | ✓ | ✓ | ✓ | ✓ | 5 |
| Perren et al. 2021 [30] | ✓ | ✓ | ✕ | ✓ | ✕ | ✕ | ✕ | ✓ | ✓ | ✓ | ✓ | 7 |
| Jimenez et al. 2021 [31] | ✓ | ✓ | ✕ | ✓ | ✕ | ✕ | ✕ | ✓ | ✓ | ✓ | ✓ | 6 |
Table 4.
Description of articles included in the systematic review.
| Author (year) | Aim | Participants/Methodology | Intervention | Results |
|---|---|---|---|---|
| Maluf et al. [18] (2001) |
To validate a portable electronic device used to observe plantar pressures and temperatures, as well as the humidity of the foot inside shoes during prolonged activity. | 4 healthy participants wearing a shoe containing sensors for pressure, humidity and temperature. Inner level walkaway for pressure data; uncontrolled outdoor environment for step count data; closed environmental control chamber for humidity and temperature data. |
Data was collected during the following activities: sitting down and getting up from a chair, bending down to pick up a 6kg object from a shelf at a height above the shoulders, going downstairs, walking on a level concrete surface, hip strategy walks and a pivot walk | The combination of increased pressure, temperature and moisture inside the shoe could contribute to plantar tissue injury. Activity-related variations in foot pressure may help explain why the researchers were unable to identify people at risk of ulceration based on a predetermined pressure threshold. It is likely that the cumulative stress on the plantar tissues varied greatly between individuals, given the differences in the amount and type of activity they performed throughout the day. The environmental conditions within the shoe may modulate the response of the plantar tissues to mechanical stress. |
| Reddy et al. [19] (2017) | To examine the relationship between foot temperature and walking cadence and how this affects the vertical pressures exerted on the foot. | 18 healthy volunteers in 2 age groups (30-40 years and over 40 years). Personalised insoles in canvas shoes (mod. 246033 Slazenger) with temperature sensors (TMP35) directly in contact with the foot+ sock+ pressure system (F-Scan. Model 3000E. Telk scan Inc.) |
Temperature, pressure and acceleration data were recorded with the patient sitting for 10 minutes, standing for 15 minutes, walking for 45 minutes on a monitored treadmill (Ergo ELG 70, Woodway GmBH) and then sitting again for 20 minutes. Studies at 3 different cadences (80, 100 and 120 stpes/minute). |
Foot temperature increased 5ºC with walking in both age groups and was greater with increased walking cadence. The walking speed was found to be proportional to the increase in temperature; however, the final temperatures recorded after walking did not differ. A maximum plateau value was observed, above which the temperature of the foot did not rise. There was an inversely proportional correlation between foot temperature during walking and before exercise which was stronger in the older group. In both age groups, the increase in temperature did not correlate with the time integrals of the normal pressure exerted by the foot. |
| Li et al. [20] (2022) | To examine the effects of shoe upper materials on foot relative humidity and temperature in older individuals. To examine the influence of the thermal environment of footwear while engaged in sitting activities. |
40 older people (25 female/ 15 male) walked and sat in 4 conditions: barefoot (group A), leather trainer shoes with an ethyl vinyl acetate sole (groups B), mesh trainer shoes with ethyl vinyl acetate sole (group C) and closed-toe trainer shoes with rubber sole (group D). Skin temperature was recorded with an infrared camera (FLIR T420bx, Systems, Inc., Wilsonville, OR, USA). |
After foot conditioning for 30 minutes while sitting, the participants performed 2 tests: 20 minutes in a sitting test and 30 minutes walking on a treadmill at 3mk/h. The average recovery time between these 2 tests was 15-30 minutes. Thermal images of the feet were taken both before and after each test. Three assessment scales measuring thermal comfort and perceived humidity were performed. |
Foot temperature increased during sitting with the greatest difference between the barefoot condition and the 3 shoes conditions being on the back of the toes (2,8ºC, 1,2ºC and 1,8ºC respectively) and on the heel (3,1ºC and 2,5ºC respectively). Compared to barefoot condition temperatures were higher for all the shoes conditions while walking with the highest temperature being registered in group D. The greatest difference between the barefoot and the 3 shoes condition was on the back of the toes (2.3ºC, 1.4ºC and 2.4ºC respectively). On the foot sole the temperature was higher for all shoe conditions at all the ROIs, except for group C. The greatest difference in average temperature between groups A and B (2.4ºC) was in the toes. Compared to the barefoot condition, groups C and D showed the greatest differences in the plantar arch (2ºC and 2.5ºC, respectively) While sitting, the relative humidity of the foot increased by the greatest amount on the foot sole in shod conditions (B and D) and on the back of the foot for shod condition B. During walking, the relative humidity tended to decrease with shoes, especially in condition C, in planar arch. On the back of the foot, it increased in B condition. Thus, foot sweating increased more in group B compared to C and D, both while walking and sitting. |
| Nemati et al. [21] (2022) | To develop a temperature-prediction model in the metatarsal area and plantar arch. To evaluate the accuracy of the model when predicting the temperature of the sole of the foot. |
Seven healthy adult males wearing running shoes without socks. Foot temperature was measured at several points every minute using thermocouples. |
Participants rested for 10 minutes and then ran for 30 minutes at 3, 6 and 9km/h respectively. | The maximum increase in plantar temperature was 6ºC, 8ºC and 11.5ºC for speeds of 3, 6 and 9 km/h, respectively. Cooling of the foot through seating as thermoregulatory mechanism was minimal at 3 km/h and appeared after 15 minutes in the plantar arch area at 9km/h and after 20 minutes at 6km/h. Sweating played a fundamental role in the thermal regulation of the plantar arch but was insignificant in the metatarsal area. |
| Niemann et al. [22] (2020) | To analyse the differences in plantar temperature changes during prolonged standing between healthy volunteers and diabetic patients with polyneuropathy. | 31 healthy volunteers and 30 diabetic with polyneuropathy volunteers. Insole with 8 pressure (TTForce A01) and temperature (NTC 805) sensors in shoes for diabetics. The environmental temperature inside the shoe was also recorded without contact with the foot. |
Pressure and temperature data were recorded during 6 episodes of standing lasting 5, 10 and 20 minutes each and separated by 5-minutes periods of sitting. | The reduction in plantar temperature was significantly greater in the standing position compared to the seated position in both healthy and diabetic patients with polyneuropathy. However, the magnitude of the reduction in peak temperature did not differ between the two groups, reaching -1°C for a period of 20 minutes and decreasing further by a smaller magnitude throughout the test. Healthy volunteers felt discomfort in their feet during prolonged standing which forced them to carry out brief episodes of pressure relief. This was not the case in patients with diabetes and polyneuropathy. Transiently decreased plantar temperatures can cause injuries during prolonged episodes of standing. |
| Carbonell et al. [23] (2019) | To evaluate thermographic images after thermal and mechanical stress. | Thermal images of the feet of two groups of participants (diabetic patients and healthy controls) were recorded with a thermal imaging camera (FLIR E-60, Flir Systems Inc., Wilsonville, OR, USA) at a distance of one metre. The regions of interest (ROIs) evaluated were: big toe, forefoot, midfoot and rearfoot. |
Thermographic images were obtained before and after a 100 metres barefoot walk on a treadmill at a self-selected pace. Subsequently, a thermal stress (gel refrigerated at 0ºC) was applied to the soles of the feet, followed by thermographic video analysis of the basal thermal recovery rate over 10-minute period. |
A greater decrease in temperature was observed in all ROIs in the diabetic patients after mechanical stress when compared to the control group. The rearfoot and the forefoot presented the greatest temperature differences between the groups (-1ºC). The recovery of 90% of basal temperature after thermal stress was slower in diabetic patients. |
| Di Benedetto et al. [24] (1996) | To study regional hypothermia as a response to minor injuries. | 1000 new male army recruits aged 17 to 21 years, divided into four groups. Group 1 with unilateral stress fractures and regional hypothermia, group 2 with unilateral stress fractures without regional hypothermia, group 3 with bilateral stress fractures without hypothermia and group 4 (controls) without musculoskeletal discomfort. AGEMA 870 thermographs were performed. |
Infrared images were taken before and after training. If there was pain and suspected stress fracture a bone scan was performed. | The sensitivity of the thermograms for detect anomalies was high, but their specificity for basic diagnosis was low. Pain or injury to the lower extremities could cause an acute hypothermic response. Hypothermia was not observed in recruits in the absence of significant pain. Therapeutic or self-imposed immobilisation could lead to hypothermia. |
| Di Benedetto et al. [25] (2002) | Use thermography as a diagnostic tool in cases of stress fractures during military physical training. | New male army recruits aged 18 to 22 years, divided into 3 groups of 30 soldiers each one. Group 1 (stress fractured), group 2 (neuromuscular system problems, no fracture) and group 3 (controls). AGEMA 870 thermographs were performed using CATSE software. |
Infrared images were taken and plantar thermographs were analysed before start a basic training and were repeated whenever a subject presented a neuromusculoskeletal complaints. If a stress fracture was suspected a bone scan was performed. |
Temperature was on average 6°C higher for metatarsal stress fractures. Hot spots were observed even in the absence of negligible discomfort. Furthermore these hot spots did not reappear on subsequent thermograms as the feet became accustomed to new stress. The incidence of stress fractures, especially in the metatarsals, appeared in the third week as the intensity and training duration increased. The hot spots disappeared as the injuries healed. A correlation of 66% was observed between pain, bone scan results and the findings of thermograms. Soft tissue injuries appeared in areas that were warmer than those of the bone injuries. |
| Yavuz et al. [26] (2014) | To analyse the relationship between plantar triaxial loading and post-excersice plantar temperature increase. | 13 Healthy volunteers. Infrared camera (TiR2FT, Fluke Corporation, Everett, WA) used without contact. Custom made pressure shear plate. |
Participants walked on the shear plate at self-selected speeds using the two-stpes method while shear stress data were collected. They then walked barefoot on a treadmill at 3.2km/h for 10 minutes before returning to the shear plate to collect post-exercise shear stress data. Data from 4 trials were used in most cases. Pre- and post-exercise temperature data were recorded. |
The following variables were calculated: maximum shear stress (PSS), maximum resultant stress (PRS) and maximum temperature increase (AT). There was a moderate linear relationship between PSS and AT. The post-exercise correlation between PSR and AT was strong (p=0.002). However, the location of the peak AT was unable to successfully predict the location of PSS in 23% of the volunteers. No statistically significant correlation was observed between AT and PRS. Furthermore, in 39% of subjects, AT coincided with the peak observed in the study. |
| Priego Quesada et al. [27] (2017) | To determine the relationship between the temperature of the sole of the foot (through infrared thermography) and foot eversion during running (through motion analysis). | 22 runners (17 men and 5 women) performed a pre-test and a main test on different days (1 week apart). Pre-test: 5-minute maximal effort run on a 400m track to determine their maximal aerobic speed (MAS). Main test: running on a treadmill with 1% incline (Technogym SpA, Gambettola, Italy). Participants warmed up for 10 minutes at 60% of their MAS and then run for 20 minutes at 80% of their MAS. Foot temperature was measured with a thermal imaging camera (FLIR E-60, Flir Systems Inc., Wilsonville, Oregon, USA) before and after the test and foot eversion was recorded throughout the test. ROIs: the rearfoot (defining length as 31% of the entire plantar surface of the foot), the medial and lateral ROIs (defined as 50% of the maximum foot width). |
Thermal images were taken of each participant at 3 time points: before, immediately after and 10 minutes after the running test. During running the participants wore only their running shoes (with no socks). |
There was a weak negative relationship between contact-time eversion values and rearfoot thermal symmetry measured immediately after running and a weak positive relationship with rearfoot thermal asymmetry at the final temperature. The maximum eversion values in the stance phase showed a weak negative relationship with foot thermal symmetry measured immediately after running and a weak positive relationship with foot thermal asymmetry at the final temperature. |
| Catalá-Vilaplana et al. [28] (2023) | To analyse how different types of sports footwear (traditional stable shoes vs. unstable shoes) affect the acceleration impacts on the tibia and forehead, as well as the variation in plantar surface temperature. | 6 athletes (4 female and 2 male) assessed on 2 days, 1 week apart. On the first day anthropometric variables (height and body weight) were recorded and the foot typology was characterised using the Foot Posture Index. On the second day, the treadmill walking test was conducted under two footwear conditions: stable shoes (Adidas Galaxy Elite Noir) and unstable shoes (Skechers Shape Ups.) Two triaxial accelerometers with a frequency of 420 Hz were used, one on the distal tibia of the dominant leg and another on the forehead (MMA7261QT, Freescale Semiconductor©, Munich, Germany). The surface temperature of the feet’s soles was measured with a thermal imaging camera (FLIR E60bx, Wilsonville, Oregon, USA). ROIs evaluated: forefoot, midfoot and rearfoot. |
Participants walked for 10 minutes with each type of footwear at a speed of 1.44 m/s, with a 2-hour period of rest between each test. The spatiotemporal and acceleration variables were obtained from the three 8-second recordings taking at minutes 2, 5 and 9 of each test. Thermal records were recorded at 3 different time points: pretest, post (immediately after the test) and post 5 (5 minutes after finishing the test). |
No statically significant differences were identified in any of the accelerometry variables. Significant differences were found in the thermographic images between the pretest and post5 time points, specifically in the midfoot area. |
| Cuaderes et al. [29] (2014) | To assess diabetic sensory neuropathy and the plantar characteristics of pressure and temperature, among others, in adults after performing moderate-intensity weight-bearing activities. | A convenience sample (n=148 diabetics; 57 female and 36 male Athletes and 28 female and 27 male non-athletes). Data on plantar skin hardness (using a hand-held durometer), pressure in the sports shoes (scan in-shoe pressure) and plantar temperature (using an infrared dermal thermometer) were recorded. |
The volunteers walked 9.14 m at self-selected speed. Temperature and plantar pressure data were recorded after the test. | Athletes, especially women, had higher plantar pressure. The data indicated that the values were higher, particularly in the right midfoot locations (exercisers 1.79±0.65; non-exercisers 1.61±0.51, p = 0.03) and the region of the fourth and fifth toes of the left foot (exercisers 2.41±1.51; non-exercisers 1.93±1.13, p = 0.02). A comparison of the mean values for the two groups revealed that the left fourth metatarsal head exhibited a lower mean for the exercisers (2.64±0.90) than for the non-exercisers (3.04±1.47). A greater temperature gradient was observed in the plantar surface of the first metatarsal head in the athletes (exercisers 1.66±1.31 and non-exercisers 1.20±1.20, p = 0.02). The only significant linear relationship between weight-bearing physical activity and plantar pressure was identified at the second metatarsal of the right head (r = .237, p = .02) and at the third metatarsal of the head (r = .264, p = .01). |
| Perren et al. [30] (2021) | To ascertain whether there was a correlation between pressure and the temperature in different regions of the foot in different categories of participants after 15-minute’s walk. | 4 groups of 12 individuals (a total of 42 males and 6 females) as follows: healthy patients (Group A), patients with diabetes (Group B), diabetics with peripheral arterial disease (Group C) and diabetics with neuropathy (Group D). A Tekscan high resolution (HR) treadmill (Tekscan, Boston, MA, USA) was employed to collect plantar pressure data. ROIs were evaluated: the hallux, 1st metatarsophalangeal joint (MPJ), 2nd-4th MPJ, 5th MPJ and heel. Thermal imaging was conducted using a thermal camera (T630C FLIR, Wilsonville, OR, USA). ROIs evaluated: hallux, medial, central and lateral forefoot and heel. |
The results from 3 pressure test were recorded for each participant while they were walking at their preferred speed. Subsequently, the participants lay in a supine position on the examination table for a period of 15 minutes. After they walked for 15 minutes on a treadmill. One minute after stopping walking, thermograms were obtained of the plantar surface of the feet. |
In the initial statistical test the 4 groups were divided into 2 merged groups: a healthy cohort (groups A and B) and a complication cohort (groups C and D). In the groups with complication, there was a positive correlation between temperature and pressure in the hallux 2nd -5th MPJs, and heel ROIs. This correlation was exclusive to the 5th MPJ in the healthy group. In the second statistical test, the 2 groups were divided into healthy cohort (group A) and a diabetes cohort (groups B, C and D). There was a positive correlation between temperature and pressure for all the ROIs in the diabetes group, whereas in the healthy group, this correlation was evident only for the 2nd-5th MPJs. In individuals without complications (groups A and B) there was a tendency for pressure areas to become warmer, although this was less significant than in individuals with complications (groups C and D). |
| Jiménez et al. [31] (2021) | To determine correlation between plantar pressures during prolonged running and plantar temperature, either in the sole of the foot or the sole of the shoe. | 30 recreational runners (15 males and 15 females) were recruited to perform a 30-minute running test on a treadmill (Excite Run 900, Technogym Spa, Gambetta, Italy). Thermpgraphic images were obtained of the sole of the feet and the sole of the shoes using an infrared camera (Flir E60bx, Flir Systems Inc., Oregon. USA) at two time points: 1 minute before the test and immediately after. Dynamic plantar pressure was measured at 200 Hz after the test using an F-Scan® in-shoe pressure measurement system (v.50, Tekscan Inc., Massachusetts, USA). |
Participants ran on a treadmill for a total of 6 minutes, followed by 30 minutes of treadmill running with a 1% slope to simulate the duration and intensity of regular training. Two thermographic images were taken of the soles of the dominant feet and soles of the sports shoes in a sitting position. The first image was taken one minute before the 30-minutes test and the second one minute afterwards. Dynamic plantar pressure was measured at the end of the trial. |
A moderate correlation was observed between plantar pressure and plantar temperature, both in the soles of the feet and in the soles of the shoes, especially in the forefoot regions. The correlation between plantar pressure and plantar temperature was greater in the soles of the shoes than in the soles of the feet. The temperature of the shoe soles was observed to be lower in the female participants than the male participants after running. |
Disclaimer/Publisher’s Note: The statements, opinions and data contained in all publications are solely those of the individual author(s) and contributor(s) and not of MDPI and/or the editor(s). MDPI and/or the editor(s) disclaim responsibility for any injury to people or property resulting from any ideas, methods, instructions or products referred to in the content. |
© 2024 by the authors. Licensee MDPI, Basel, Switzerland. This article is an open access article distributed under the terms and conditions of the Creative Commons Attribution (CC BY) license (http://creativecommons.org/licenses/by/4.0/).
Copyright: This open access article is published under a Creative Commons CC BY 4.0 license, which permit the free download, distribution, and reuse, provided that the author and preprint are cited in any reuse.


