Submitted:
06 August 2024
Posted:
06 August 2024
You are already at the latest version
Abstract
Neuroblastoma (NB) is a solid tumor occurring in infancy and childhood, whose high-risk form has currently a survival rate < 50 %, despite aggressive treatments. Additionally, drugs-induced secondary tumorigenesis and the emergency of drug resistance worsen the already worrying scenario, calling for an urgent development of new extra-genomic treatments. Quaternary phosphonium salts (QPSs) possess both antimicrobial and anticancer effects. Triphenyl phosphonium salts (TPPs) are mitochondria-targeting compounds, exerting anticancer effects, impairing mitochondria functions and damaging DNA, at the same time. TPP-based bola-amphiphiles, previously proven to self-assemble nanoparticles (NPs) in water and successfully assayed as possible antibacterials, were never tested as suitable antitumor agents. Here, aiming at the development of new antitumor devices to counteract resistant forms of NB, the anticancer effects of a TPP-based amphiphile molecule have been investigated for the first time. To this end, we considered the water-soluble sterically hindered quaternary phosphonium salt (BPPB) encompassing two triphenyl phosphonium groups linked by a C12 alkyl chain, thus embodying both the characteristics of mitochondria-targeting compounds and those of bola-amphiphiles. The anticancer effects of BPPB were assessed against HTLA-230 human stage-IV NB cells and their counterpart resistant to etoposide (ETO), doxorubicin (DOX) and to many other therapeutics (HTLA-ER). Determined IC50 values were very low on both cell populations, already after 24 hours of treatment, when cells viability did not significantly differ from that observed for the longest exposure timing. Moreover, to investigate a putative future inclusion of BPPB in a chemotherapeutic cocktail for NB, its cytotoxic effects were assessed against mammalian cell lines. These included monkey kidney cells (Cos-7), human hepatic cells (HepG2), a lung-derived fibroblast cell line (MRC-5) and red blood cells. From appreciable to very high selectivity indices have been determined after 24 hours treatments, an exposure time after which both NB cell populations tested appeared already fully exterminated.
Keywords:
high-risk neuroblastoma (NB)
; IV-stage NB
; HTLA-230 NB cells
; HTLA-ER NB cells
; quaternary phosphonium salt
; triphenyl phosphonium groups
; mitochondrial targets
; bola-amphiphiles
; nanosized vesicles
; cytotoxicity studies
; hemolytic toxicity
1. Introduction
1.1. Neuroblastoma (NB)
Neuroblastoma (NB) is one of the most common solid tumors occurring in infancy and childhood, while it is extremely rare in adults [1]. Precisely, 90% of NB occurs in children under the age of 10, most cases being diagnosed before five years of age [2]. NB causes 15 % of all pediatric cancer deaths worldwide [3]. Usually, survival rates at younger ages are better than at older ones [4]. NB is described as a heterogeneous developmental tumor, which can be caused by varying and different genes or alleles [5]. NB arises from the embryonic sympathoadrenal cells of the neural crest [5]. NB makes part of the so-called enigmatic tumors [6], due to its unique and unpredictable clinical outcomes [4]. NB can evolve in spontaneous regression or tumor maturation to benign ganglioneuroma, but it can also rapidly progress to life-threatening diseases and aggressive forms of cancer, refractory to therapy [6,7]. In infants under 18 months of age, the disease often regresses spontaneously without therapy, whereas children over 5 years old with unfavorable histology tend to have poor outcomes [8]. Other cancers, such as lung tumors, are associated with environmental factors (asbestos and malignant mesothelioma), lifestyle behaviors and smoking [9]. On the contrary, although certain exposures have been related to its onset in children [7], NB seems more closely associated with genetic and/or molecular characteristics [8]. NB can be classified as a low, and intermediate risk disease, for which survival rates can range from 85 to 90 % [10], as well as a high-risk disease (HR-NB) [4]. Unfortunately, about half of NB patients are diagnosed with HR-NB, having a survival rate of 40-50 %, despite aggressive treatments [3]. In the1980s, it was established that the onset of HR-NB with consequent low patient survival is strictly associated to MYCN gene amplification. From then on, several other genetic abnormalities have been identified in HR-NB, including gains of whole chromosomes and large-scale chromosomal imbalances [11]. Four stages (S1-S4), plus an additional special fourth stage (S4s) are recognized in the developmental of NB, being S4 and S4s the metastatic ones. However, stage S4s encompasses tumors with metastases confined to the skin, liver, and bone marrow, arising in children younger than 18 months of age [8]. While stages S1, S2, S3 and S4s of NB are characterized by favorable histology that allows a survival rate in the range 85-90 % [11], the metastatic stage S4 (NBS4) is often fatal, despite aggressive therapy. Collectively, a survival rate in the range 40-50 % is accounted for patients with NBS4 [12], due to the unfavorable histology of NBS4 [1], as previously reported for HR-NB. Treatments for NB generally consist of induction, consolidation, and maintenance therapy. Particularly, HR-NB is initially treated with multi-agent chemotherapy, surgery, and radiotherapy [4]. The consolidation therapy consists of high-dose chemotherapy, and autologous stem cell transplant (ASCT), often followed by further radiotherapy. Isotretinoin is instead commonly adopted as maintenance therapy [13]. Recently, the treatment of NB has included the anti-G2-immunotherapy, by using monoclonal antibodies, such as dinutuximab or naxitamab, in combination with cytokines (GM-CSF and IL-2) and therapeutic agents [13]. Unfortunately, a retrospective study on this therapy, has evidenced that ASCT did not provide survival benefit when anti-GD2 immunotherapy was used after induction chemotherapy [13]. Despite the addition of monoclonal antibodies, the survival rate for NBS4 remained of 40-50 % [14], thus indicating that other molecular targets are urgently needed to efficiently treat NBS4. In fact, even if outcomes for patients with HR-NB have markedly improved over the past 2 decades, the available current therapies for HR-NB patients remain suboptimal [6]. In addition, to find other possible target therapies for the treatment of NBS4 patients, the future medicinal chemistry research on NB should consider and adopt a multi-target drug approach, rather than a multi-drug-one-target one, to gain improved efficacy and less drug-drug interactions [4].
1.2. Possible Extra-Genomic Therapeutic Approaches
The chemotherapy of malignant neoplasms, including high-risk neuroblastoma (HR-NB), often leads to drug-induced secondary tumorigenesis, due to nuclear DNA damage caused by traditional genotoxic chemotherapeutic agents. Furthermore, such diseases are commonly worsened by the emergency of drug resistance, due to adaptive genetic mechanisms of cancer cells, including drug inactivation, altered drug targets, adaptive responses, and dysfunctional apoptosis [15].
In this regard, the use of a combinatorial treatment approach could delay the onset of resistance and improve patient outcomes. Anyway, undesired drug-drug interactions could negatively affect the therapy effects [4]. Therefore, the search for compounds with an extra-genomic mechanism of antitumor action is of paramount importance in order to avoid possible recurrence of cancer.
Recently, oxidative therapies (OTs), working via reactive oxygen species (ROS) induction by different methods [16,17], have been reviewed and reported as effective and alternative extra-genomic treatments for curing severe skin infections sustained by pathogens, including biofilm-producing microorganisms [18], without tendency to develop resistance [17]. Similarly, high levels of oxidative stress (OS) caused by ROS induction, have been reported as a novel type of anticancer therapy, also capable to modulate the antitumor immune response, without prompting resistance [19]. Specifically, photodynamic therapy (PDT) is a promising method of tumor ablation and function-preserving oncological intervention, based on ROS induction by proper light-activated photosensitizers in presence of oxygen [17]. It is described as minimally invasive, repeatable, with low side effects and no cumulative toxicity [20]. The combination of PDT with immune stimulation has been reported as a possible key to overcome the melanoma resistance and to obtain better, sustainable clinical results [20]. Additionally, Watanabe et al., have demonstrated that PDT based on 5-aminolevulinic acid as photosensitizer agent, could be a new diagnostic, therapeutic, and surgical aid for neuroblastoma, triggering persistent apoptotic cell death [21].
Treatments involving ROS induced by PDT as antitumor agents are already clinically approved and have been widely employed against various tumors onto which irradiation can be applied directly, such as lung, esophageal, gastric, breast, head and neck, bladder, and prostate carcinomas [22]. Anyway, some unavoidable disadvantages, including limited light penetration depth, poor tumor selectivity, as well as oxygen dependence, largely limit PDT therapeutic efficiency for solid tumors treatment, as HR-NB, objective of the present study [22]. Moreover, further in deep clinical investigations are mandatory to assess on the possible toxic effects of extensive ROS administration to mammalian cells, biosafety and target specificity [23,24].
So, the discovery of new anticancer molecules, acting via extra-genomic mechanisms, remains urgent. Within this context, mitochondria are the most promising target for an effective anticancer therapy, due to their key role in energy production, apoptosis induction, and ROS generation [1]. Recent studies have shown that several cancer cells, including those metastatic, therapy-resistant, and cancer stem cells, are reliant on mitochondrial respiration, and upregulate oxidative phosphorylation (OXPHOS) activity to maintain tumorigenesis [25]. Mitochondria are crucial for tumor proliferation, survival, metastasis and the development of resistance to chemotherapy and radiotherapy. Recent studies report that elevated heme synthesis and uptake lead to an intensification of mitochondrial respiration and ATP generation, thus promoting tumorigenic functions in non-small cell lung cancer (NSCLC) cells and thus rendering mitochondria a vulnerable target for cancer therapy [25]. Very interesting, these intracellular organelles possess their own DNA, independent and not associated with the mutable genetic mechanisms of cells [26]. Therefore, mitochondria-targeting compounds, able to accumulate inside this organelle and to impair its functions, would succeed in bypassing the genetic mechanisms underlying tumor recurrence and resistance, thus being active also in resistive cells. It has been reported, that the triphenyl phosphonium (TPP) moiety is the most widely used mitochondria-targeting carrier [27]. Mono and bis TPP salts, due to the “soft” cationic nature of their headgroup(s), characterized by an extended delocalization of the positive charge on the phenyl rings, have a strong ability to interact and cross cell membranes, especially the negatively hyper-polarized ones, as those of tumor cells [28]. Once targeted the cancer cytoplasmic membrane, TTP salts can damage the phospholipid bilayer, causing depolarization, permeabilization and thus facilitating their entrance into the cell [29]. When inside the cancer cell, TPP-based compounds target mitochondria, interact and cross their even more negatively charged than the plasma membrane double (outer and inner) membranes, thus causing their depolarization and/or destruction, as well [30]. Mitochondria are the only intercellular organelles with a negative charge inside. The ΔΨm between the matrix and the intermembrane space is around 180 mV [31]. Mitochondria use this potential as a proton-motive force to drive ATP synthesis, and ΔΨm is a key parameter that indicates the bioenergetic competence of mitochondria [32]. On the other hand, such ΔΨm is exploited for mitochondrial targeting by TPP salts and other cationic molecules that are primarily attracted to the mitochondria via an electrostatic force and then can amass inside them by a 100-to-1000-fold accumulation [31].
The consequent inhibitory activity on the mitochondria functions determines mitochondrial toxicity, permanent damage of the organelle, thus causing programmed death of cancer cells, by signal induction of cell death processes (apoptosis, necroptosis or autophagy) [15,29,30]. Due to the strong difference in the negative electric membrane potentials of both cytoplasmic and mitochondrial membranes between tumor and normal cells, these compounds can selectively accumulate in the mitochondria of cancer cells, rather than in those of normal cells [33], thus resulting in low levels of cytotoxicity [28].
Bola-amphiphiles (BAs) are a particular class of cationic surfactants featuring one or more hydrophobic chains connecting two identical or different hydrophilic headgroups, endowed with nonpareil colloidal properties [29]. They exhibit unique hierarchically self-assembled structures, characterized by high polymorphism, thus being attractive for applications in various fields, including drug delivery, gene delivery, electronics, medical imaging, etc. [34]. Bis-triphenyl phosphonium (BTPP)-based bola-amphiphiles (BTPP-BAs), due to the presence of TPP groups, have been reported to be mitochondria-targeting compounds, with high ability in crossing the mitochondrial membranes and accumulating inside them [29]. A series of BTPP-BAs, featuring chains of 12, 16, 20 and 30 methylene units, have been studied for their colloidal properties evidencing their capability to form nanosized vesicles and aggregates in water solution [29]. It has been reported that BTPP-BAs can exert potent antibacterial properties and low toxicity on eukaryotic cells, by mechanisms like those above described for non-bola amphiphiles TPP-based salts on cancer cells [35]. Anyway, in the case of BTPP-BAs, it seems that their colloidal properties may also play a central role in their mitochondrial toxicity [29], suggesting an enhancement of antitumor effects with respect to traditional TPP salts. In this regard, we recently have reported the potent broad-spectrum antibacterial activity of a BTPP-BA molecule (BPPB) [35], which was remarkably more active than a mono triphenyl phosphonium salt previously prepared [36]. Alkyl triphenyl phosphonium salts [36,37,38,39], pegylated bis-triphenyl phosphonium salts [40] and BTPP-BAs [35,41,42] have been successfully tested as antibacterial agents. On the contrary, while conventional alkyl TPP-based salts have been extensively studied also as anticancer molecules [43,44,45,46], as for our knowledge, while several reports exist on the several other applications of BAs, such as efficacious drug delivery systems loaded with antitumor therapeutics, no article subsists on their use as per se anticancer agents [34].
1.3. The Present Study
Here, in the search for alternative molecules to counteract resistant forms of NB, the anticancer effects of a BTPP-BA bis-cationic molecule (BPPB) have been investigated for the first time. Particularly, knowing that membrane-active cationic molecules effective as antibacterial agents are also often effective as antitumor agents, due to the similar membrane negative constituents and composition of the two types of cells [47], we selected for this study, the water-soluble sterically hindered quaternary phosphonium bola-amphiphile (BPPB) showed in Figure 1, featuring two triphenyl phosphonium groups linked by a C12 alkyl chain.
In fact, its broad-spectrum antibacterial effects on several MDR bacterial species by a membrane-active, not specific and extra-genomic mechanism have been recently reported [35]. Additionally, BPPB demonstrated to be very potent and selective for bacteria, while respectful of eukaryotic cells, including human hepatic and monkey kidney cell lines, thus being very promising to be clinically developed in the future. Particularly, it displayed selectivity indices > 10 for all Gram-positive isolated tested (22) and for clinically relevant Gram-negative superbugs such as those of E. coli species [35]. Then, aiming at extra-genetic anticancer effects mainly based on mitochondrial impairments, the selected bis-triphenyl phosphonium molecule, appeared to be the best candidate for our scope, bearing both the mitochondria-targeting TPP groups and the peculiar colloidal properties of bola amphiphiles reported to play a central role in their mitochondrial toxicity. Being our interest to find new molecules effective also in case of multidrug resistance, BPPB was assayed on sensitive NB cells (HTLA-230) and on HTLA-ER NB cells, whose resistance to etoposide (ETO), doxorubicin (DOX), carboplatin, cis-platin, vincristine etc., has been reported [48]. The excellent results observed on both cell populations stimulated us to assess the effects of BPPB administration towards different not-NB mammalian cells, envisaging its development as novel agent suitable for a clinical application. To this end, human hepatic, monkey kidney, stromal lung cells and red blood cells were used, to have a complete overview of the possible toxic effects that BPPB could have on the main organs responsible for the disposal and circulation of drugs (liver, kidney, and blood) and on the extracellular matrix in lungs.
2. Materials and Methods
2.1. Chemicals and Instruments
2.2. BPPB Cytotoxicity Evaluation on NB Cells
2.2.1. Cell Culture Conditions
HTLA-230 human stage-IV NB cells were kindly provided by Dr. L. Raffaghello (G. Gaslini Institute, Genoa, Italy). The HTLA-ER cells were selected by treating HTLA-230 parental cells for six months with increasing concentration of etoposide, as previously reported [49]. Both cell populations were maintained in RPMI 1640 medium (Euroclone Spa, Pavia, Italy) supplemented with 10% Fetal Bovine Serum (FBS, Euroclone Spa, Pavia, Italy), 1% L-Glutamine (Euroclone Spa, Pavia, Italy) and 1% Penicillin/Streptomicin (Euroclone Spa, Pavia, Italy) and grown in standard conditions (37 ◦C humidified incubator with 5% CO2).
2.2.2. Treatments
To determine the cytotoxic effects of BPPB, time- and dose-dependent experiments were carried out. Cells were first treated for 24, 48 and 72 h, with increasing concentrations (0.5–50 µM) of the compound. In a subsequent series of the experiments, cells were treated for 24, 48 and 72 h with increasing concentration of BPPB in the range 0.5–2 µM. The stock solutions of these compounds were prepared in 40,000-fold diluted DMSO, and pilot experiments demonstrated that the final DMSO concentrations did not change any of the cell responses analyzed. Cell cultures were carefully monitored before and during the experiments to ensure optimal cell density. Notably, samples were discarded if the cell confluence reached > 90%.
2.2.3. Cell Viability Assay
Cell viability was determined by using the CellTiter 96® AQueous One Solution Cell Proliferation Assay (Promega, Madison, WI, USA), as previously described [50,51]. Briefly, cells (10,000 cells/well) were seeded into 96-well plates (Corning Incorporated, Corning, NY, USA) and then treated. Next, cells were incubated with 20 µL of CellTiter, and the absorbance at 490 nm was recorded using a microplate reader (EL-808, BIO-TEK Instruments Inc., Winooski, VT, USA). IC50 was evaluated by GraphPad Prism 5.4.2 Software (GraphPad Software, Boston, MA, USA).
2.2.4. Statistical Analyses
Results have been expressed as means ± S.D. of at least four independent experiments in which six different wells were analyzed every time for each experimental condition. Statistical significance of differences was determined by two-way analysis of variances (ANOVA) followed by Tukey’s multi-comparisons test using GraphPad Prism 8.0 (GraphPad Software v8.0, San Diego, CA, USA).; p < 0.05 was considered statistically significant. Asterisks or other indicators (see Figures captions) indicate the following p-value ranges: p > 0.05 no symbols, * = p < 0.05, ** = p < 0.01, *** = p < 0.001, **** = p < 0.0001.
2.3. BPPB Cytotoxicity Evaluation on Human Lung Fibroblasts MRC-5
2.3.1. Cell Seeding Procedures and Treatments
Human MRC-5 lung fibroblast cells were used (ICLC-IRCCS San Martino, Genoa, Italy); cells were expanded in DMEM/F12 50%-50% (Dulbecco’s Modified Eagle Medium/Ham’s F12 50/50 Mix; Corning; cat. n. 10-090-CV; ThermoFisher –Scientific Italia, Segrate (MI)), supplemented with 10% fetal bovine serum (GIBCO-Invitrogen, GIBCO-ThermoFisher Life Science, Segrate (MI), cat. 10270-098) and 2 mM glutamine (Euro-Clone; Pero (MI), Italy; cat n. EC B3000D) at 37°C under 5% CO2 aeration. After expansion cells were washed three times with sterile phosphate buffered solution (PBS; VWR, Milano Italy, cat.n. 392-0442), detached with 0.25% Trypsin solution (Corning; cat-25-050-CI), collected in complete medium and centrifuged at 400 × g for 12 minutes. The supernatant was discarded, and cells were suspended in PBS, counted and centrifuged again as aforementioned. Cells were then re-suspended in complete medium, seeded into 24-well plates (20.000 cells/well) and let adhere to the plate for the next 24 hours. Subsequently, non-adherent cells and plating medium were discarded and fresh standard medium or treatment medium were added. Treatment media contained BPPB at different concentrations (0.5, 1.0, 5.0, 25.0, 50.0, 75.0 and 100.0 μM); triplicate wells for each concentration were tested simultaneously, as well as controls. Medium was changed every day. Cells were photographed and assayed for viability prior to treatment (time 0; T0) and after 24, 48 and 72 hours subsequently (T24, T48 and T72). Bright field images of each well/treatment were acquired using a Nikon Digital Sigh DS-5Mc camera mounted on an inverted Olympus CKX-41 microscope (4 ×, 10 × and 20 × enlargements).
2.3.2. Viability Test
The effects of BPPB on cell viability was assessed by the Presto BlueTM assay (Invitrogen Presto Blue TM Cell Viability Reagent, cat n. A13262, ThermoFisher, Monza, Italy), as suggested by the manufacturer. Briefly, at the indicated time points, cells were washed twice with PBS and incubated in the dark a 37°C for 4 hrs with fresh complete medium supplemented with 10% Presto Blue TM. Aliquots of the Presto Blue TM-containing medium were incubated in the same conditions to be used as reaction blanks. Supernatants and blanks were then collected and analyzed using a Spectra MR multi-plate reader spectrophotometer (Dynex Technologies; Chantilly, VA, U.S.A.) at 570 and 600 nm. Results were calculated as the average of treatment replicas (triplicates) ± S.D., normalizing each 570 nm-reading to its corresponding value at 600 nm, subtracting the average blank value, and normalizing results at each time point to the initial reading at T0.
2.4. Concentration-Dependent Cytotoxicity Experiments on Other Mammalian Cells
2.4.1. MTT Cytotoxicity Assay on Cos-7 and HepG2 Cells
To assess the cytotoxicity properties of BPPB, the MTT (3-(4,5-dimethylthiazol-2-yl)-2,5-diphenyltetrazolium bromide) cell proliferation assay [52] (Abcam, Cat#ab2011091) was performed, following manufacturer’s protocol, as previously reported [35,36]. This time the increasing concentrations of BPPB were in the range 0.4-85.3 µM. The cell survival rate, expressed as cell viability percentage (%), was evaluated based on the experimental outputs of treated groups vs. the untreated groups (CTR) and was calculated as follows: cell viability (%) = (OD treated cells − OD blank)/(OD untreated cells − OD blank) × 100%.
2.4.2. LDH Cytotoxicity Assay on Cos-7 and HepG2 Cells
2.4.4. Statistics
Graphs and statistics were generated by GraphPad Prism (Version 9, license code GP9-2314983-RATL-05225; 225 Franklin Street. Fl. 26, Boston, MA, USA 02110; RRID:SCR_002798).
2.5. Hemolytic Toxicity of BPPB Using Red Blood Cells (RBCs)
2.5.1. Hemolysis
Hemolytic ratio was evaluated, as recently reported with slight changes [54], in EDTA-blood samples from four healthy donors from the San Martino Hospital Transfusion Centre. In detail, red blood cells (RBCs) were isolated by diluting 0.2 mL of blood with 0.4 mL of phosphate-buffered saline (PBS) and centrifuged for 5 min at 10,000 g. The pellet, consisting of RBC, was washed 5 times with 1.0 mL PBS and finally resuspended with 2.0 mL PBS. The assay was carried out on 0.1 mL of resuspended RBCs added to 0.1 mL of H2O (positive control), 0.1 mL of PBS (negative control) or 0.1 mL of the different concentrations (0.1-50 µM) of the compound to be tested (BPPB). The samples were incubated for 60 min at 37°C and at the end they were centrifuged for 5 min at 10,000 g. Finally, 0.1 mL of supernatant was transferred to a transparent 96-well plate and measured by a spectrophotometer (Dynex Technologies; Chantilly, VA, U.S.A.) at 595 nm. The hemolytic ratio was calculated using the formula:
Hemolytic ratio (%) = (OD TEST - OD NEGATIVE CONTROL)/ (OD POSITIVE CONTROL - OD NEGATIVE CONTROL) × 100
3. Results and Discussion
3.1. 1,1-(1,12-dodecanediyl)bis[1,1,1]-triphenylphosphonium di-Bromide (BPPB)
Aiming at developing new antitumor agents effective against high-risk nuroblastoma (HR-NB), the alkyl triphenilphosphonium derivative displaying two triphenyl cationic moieties linked to each other by a C12 alkyl chain (BPPB, Figure 1), was synthetized according to Scheme 1, performing the procedure recently described [35].
As reported, molecules possessing the TPP group can exert antibacterial and antitumor effects due to their easy crossing and damaging of bacterial and eukariotic malignant cells membranes. In the case of tumour cells, upon selective electrostatic interaction with the negatively charged constituents of their cytoplasmic membrane, such compounds enter the cancer cell and target mitochondria, into which they accumulate, impairing essential functions for cell survival and causing cell death [29,55,56]. In this regard, despite bola-amphiphilic structures have never been tested as anticancer agents, we were confident that the two TPP groups could drive accumulation of BPPB into cancer cells mitochondria. Once inside these organelles, BPPB could disrupt the mitochondrial membrane potential, essential for the production of ATP exerting mitochondrial toxicity, and causing programmed death of recipient cancer cells by induction of specific processes (apoptosis, necroptosis or autophagy) [15,29,30]. In addition, the peculiar bola-amphiphilic structure, conferring BPPB nonpareil colloidal properties and the capacity to self-assemble in water solution in nanosized spherical vesicles and to generate nanoaggregates, could further increase its mitochondrial toxicity, as reported by Ceccacci et al [29].
3.1.1. BPPB Characterization
Associated with a numbered structure of BPPB (Figure S1 in Supplementary Materials), the list of peaks from ATR-FTIR, 1H, 13C and 31P NMR spectra, as well as results from FIA-MS-(ESI) and elemental analyses have been included in Section S1 of Supplementary Materials. Other useful information on BPPB characteristics, significant images and biological effects previously assessed have been included in the following Table 1 [35].
3.2. Concentration-and Time-Dependent Cytotoxic Effects of BPPB on Neuroblastoma (NB) Cells
We evaluated the cytotoxicity of BPPB on HTLA-230, an ETO-sensitive NB cell line and HTLA-ER, the counterpart resistant to several chemotherapeutics currently clinically used including etoposide (ETO), doxorubicin (DOX), carboplatin, cis-platin, vincristine [48]. The two cell populations were exposed to BPPB in an explorative concentration range of 0.5–50 µM for 24, 48 and 72 hours, to detect the lower range of cytotoxic concentrations. The concentration = 0 µM, i.e. cells not treated, was assumed as the control (Ctr).
3.2.1. Concentration-and Time-Dependent Cytotoxic Effects of BPPB on NB Cells
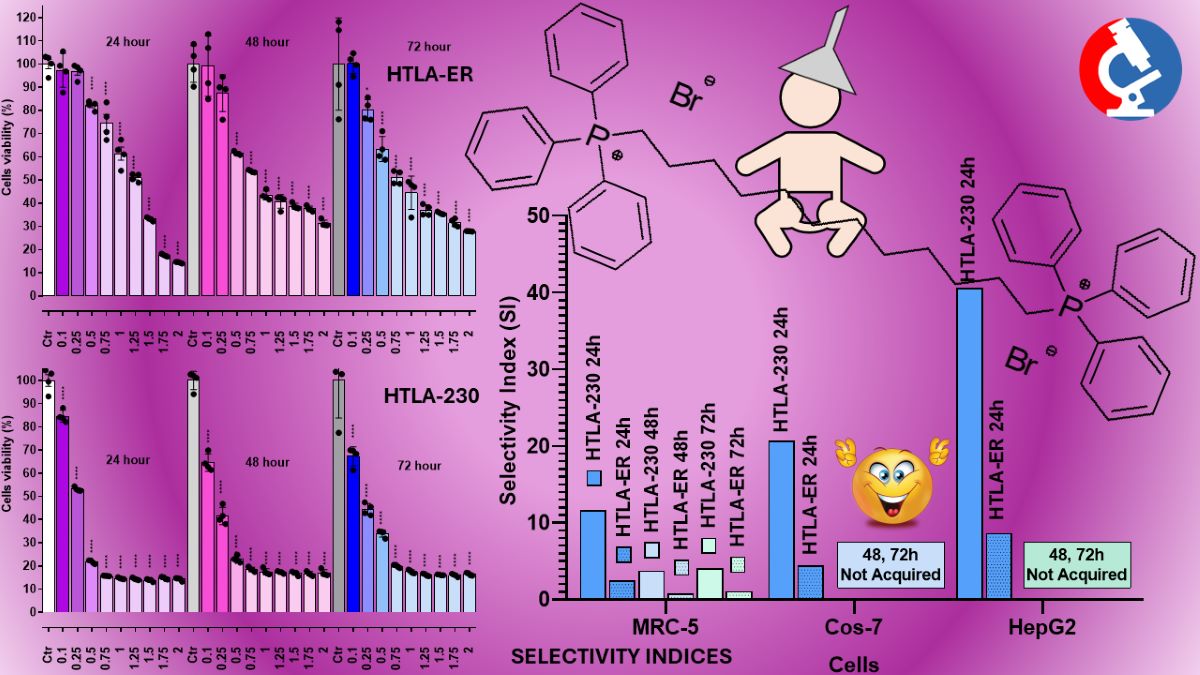
As reported in Figure 2 (HTLA-230 cells) and Figure 3 (HTLA-ER cells), BPPB exerted mainly dose-dependent cytotoxic effects, while its toxicity was less dependent on the time of exposure. Anyway, for concentrations ≥ 5 µM (HTLA-230) and ≥ 10-15 µM (HTLA-ER), cell viability was very low in both populations and practically constant for all other concentrations of BPPB tested. Particularly, while at concentrations = 0.5 µM, the percentage of viable HTLA-230 cells was already under 50%, and an effect of exposure time was observed (viable cells were 46.0 % after 24 hours, 41.6 % after 48 hours and 21.7 % after 72 hours of exposure), at concentrations ≥ 5 µM, viable cells were constantly in the range 16-18%.
In the case of HTLA-ER NB cells, cell viability at BPPB concentrations = 0.5 µM was strongly affected by the time of exposure. Particularly, while after 24 hours of treatment cell viability was not significantly different from that of controls, it resulted significantly reduced both after 48 hours (54.1%) and 72 hours of exposure (62.0 %), evidencing a higher tolerance of these cells respect to HTLA-230. For concentrations ≥ 5 µM, the time-exposure effect was minimal, and although at BPPB concentration = 5-10 µM, a slight dose-dependent effect was observed at all time of exposure, a plateau in the viability of cells was detected for all other concentrations tested with very low percentages of viable cells (7-8%), even lower than those observed on sensitive HTLA-230. Collectively, these early experiments evidenced that for concentrations ≥ 5 µM, NB cells were completely eradicated. On these results, we calculated the IC50 of BPPB on both cell lines, using GraphPad Prism software (version 8.0.1) and fitting data with non-linear regression models. Particularly, we first converted the bar graphs in Figure 2 and Figure 3 in dispersion graphs (Figure S2 and Figure S3, Section S2, Supplementary Materials); then, upon conversion of µM concentrations (x) in Log10 (x), and using a non-linear model which considered the Log 10 (BPPB concentrations) vs. the normalized response, we derived the IC50 values of BPPB for both cell populations at 24, 48 and 72 hours of treatment reported in Table 2.
To refine data reported in Table 2, we restricted the range of concentrations to be investigated and those over 2 µM were not further considered. In this new series of experiments, both NB cell populations were exposed to increasing concentrations (0.1–2 µM) of BPPB for 24, 48 and 72 h and the effect of these treatments on cell viability was evaluated and reported in Figure 4 and Figure 5.
As depicted in Figure 4, in the case of HTLA-230 NB cells, a significant reduction in cell viability was observed for concentrations ≥ 0.1 µM at all time-points. For concentrations = 0.25 µM, an effect of the duration of exposure was observable between 24 and 48 hours, with cells viability of 53.1 and 41.6% respectively. On the contrary, for concentrations ≥ 0.5 µM, cell viability was lower after 24 hours of treatment with respect to treatments for 48 and 72 hours (22-15% vs. 23-17% vs 34-18%). HTLA-ER NB cells demonstrated more tolerance to BPPB than HTLA-230 ones, and a significant reduction in viability (p < 0.0001) was observed for concentrations ≥ 0.5 µM. Anyway, while a decreasing cell survival, dependent on both concentrations and times of treatment, was detected in the range of 0.5-1.25 µM, a scenario like that above-described for HTLA-230 NB cells was observed for higher concentrations, evidencing a diminished cell viability after 24 hours of treatment with respect to treatments for 48 and 72 hours (33-14% vs. 39-31% vs 36-28%). Collectively, these new observations suggested a substantial reduction in the values of IC50 previously reported. Upon conversion of the bar graphs in Figure 4 and Figure 5, in dispersion graphs (Figure S4 and Figure S5, Section S2, Supplementary Materials), and by applying the same method above described to generate the plots available in Figure S6 and Figure S7, we calculated and reported in Table 3 the new IC50 values.
Data reported in Table 3 evidence that, as expected, refined IC50 values were significantly lower than those calculated from data of earlier experiments. Additionally, although very low IC50 values were achieved also on HTLA-ER NB cells (0.8-1.1 µM), these cells were more tolerant to BPPB than their HTLA-230 counterparts, with a very small dependance on time of exposure (1.1 vs 0.9 vs. 0.8 after 24, 48, 72 hours treatment). On the contrary, HTLA-230 NB cells demonstrated very low (0.2 µM) IC50 values, fully independent on the time of treatment. Collectively, very low IC50 concentrations (0.2-1.1 µM) were sufficient to fully exterminate both cell populations after only a 24-hour treatment. Despite the design, synthesis and formulation of novel compounds, polymers and dendrimers, in most cases nano-dimensioned, finalized to treat resistant forms of cancer, including HR-NB, has represented one of our most important challenges for years, this is the first time that we observe values of IC50 so low on NB cells, and with no need of using particular and/or additional formulation techniques. Against NB and using HTLA-230 and HTLA-ER NB cells as in this study, we have prepared and essayed nanosized copolymers (namely P5 and P7) in 2021, observing IC50 = 4.3 µM (P5) and 5.1 µM (P7) against HTLA-230 and 2.2 µM (P5) 4.1 µM (P7) against HTLA-ER [57]. More recently (2023), we have essayed an imidazo-pyrazole derivative against both cell populations finding modest antiproliferative effects [58]. Anyhow, being more active than etoposide against HTLA-ER already after 24 hours of exposure, we have formulated it as nanoparticles (NPs), using palmitic acid and P5 of the previous work [57], thus increasing significantly its anticancer effects especially after 72 hours of exposure (8.62 µM on HTLA-230 and 13.55 µM on HTLA-ER) [58]. In 2020, we also prepared a fifth-generation polyester-based dendrimer with a propanediol core and bearing 64 peripheral hydroxyls (namely 4) and used it to encapsulate etoposide (ETO), with the scope of reducing its degradability, and/or improving its solubility and antiproliferative effects on HTLA-230 NB cells [50]. Unexpectedly, we found that 4 possessed intrinsic even if modest, antitumor effect, when administered alone at the low concentration of 0.169 µM. Anyway, it was capable to reduce HTLA-230 cells viability only by 40%. More interesting, it revealed to be an excellent delivery system for ETO, and when HTLA-230 NB cells were treated with etoposide-enriched 4 for 72 hours, their viability was reduced by 65% with respect to untreated cells and by 30% with respect to cells treated with the same amount of free ETO as that released by dendrimer [50]. Other attempts to further improve the anticancer effects of 4 by its covalent bound with gallic acid (GA), or by entrapping GA in its cavities, only enhanced its cytoprotective effects thus being a promising adjuvant treatment in the early stage of NB or for its prevention [51]. Our best achievement was obtained in 2022, when copolymer P7 of our previous work [57] was used to formulate a pyrazole derivative previously reported to have moderate antibacterial properties in nanoparticles (CB1H-P7 NPs) which had demonstrated significantly enhanced antibacterial effects [59]. In this case, IMR-32 and SHSY 5Y cell lines were used as cell models of NB, while HaCaT human keratinocytes were selected to test CB1H-P7 cytotoxicity. Notably, the IC50 and SI values for CB1H-P7 NPs were 0.43–0.47 µM (dependent on time of treatment) and 2.9–3.3 against IMR-32 cells, and 0.47–0.54 µM and 2.7–2.8 against SHSY 5Y cells. Comparing these results with those obtained using fenretinide (4-HPR), which has been reported as an antitumor compound under a phase III clinical trial, effective also against tumors unresponsive to retinoic acid treatments, on the same cells, CB1H-P7 NPs resulted 1.6-14.5-fold more potent than 4-HPR, acting both through apoptosis, as 4-HPR does, and through necrosis [60]. On this scenario of excellent results, on HTLA-230 with no pattern of resistance as IMR-32 and SHSY 5Y NB cells, the results obtained with BPPB were even more excellent, being BPPB 2-2.5-fold more potent than CB1H-P7 NPs.
3.3. Evaluation of the Effects of BPPB on Different Not Tumoral Cells and Red Blood Cells
The assessment of cytotoxicity towards not tumoral mammalian cells is an essential step to predict if new compounds under investigation could be worthy of development as novel agents for clinical application or can serve as a template platform for the development of more active and less toxic derivatives by chemical transformations. As reported, the cytotoxicity of QPSs, among which BPPB, could depend on their physicochemical characteristics, such as length of the alkyl chains, presence of aromatic ring(s), on which the P+ cation can delocalize [29,35], type of counter anion, possible colloidal properties, capability or not to form nano aggregates [61]. Additionally, QPSs cytotoxicity could also depend on the specific cell type under investigation [61]. Concerning this latter aspect, cancer cells present differences from not tumoral mammalian cells, including immortalized ones. The presence of lipids with a net anionic charge on the cancer cell surface in place of zwitterionic lipids neutral at physiological pH, displayed onto normal cells, translates into a significant disparity in membrane electrostatic charges, resulting in the targeted tropism of cationic molecules toward the more negatively charged tumor cells [47]. Additionally, cholesterol present in larger extent in the membranes of normal cells with respect to cancer ones, could provide selective protection to the first ones, thus reducing the possible cytotoxicity of a novel cationic compound upon exposure [47]. Anyway, mainly depending on the concentration, time of exposure and the specific structural properties of QPSs, cytotoxicity still manifests also in normal mammalian cells [61]. On these grounds we investigated the BPPB toxic effects on mammalian cell lines, including not immortalized human MRC-5 lung fibroblasts, as well as immortalized human hepatic HepG2 cells and monkey kidney Cos-7 cells. Additionally, its hemolytic toxicity was also assessed on red blood cells (RBC).
3.3.1. Evaluation of the Concentration- and Time-Dependent Effects of BPPB on Human Lung Fibroblasts MRC-5
MRC-5 cells are a not-immortalized human lung fibroblast cell line derived from embryonic tissue, commonly used in biomedical research [62]. Human stromal MRC-5 cells were seeded in complete medium into 24-well multi-well plates (20.000 cells/well) and allowed to adhere for 24 hours. To evaluate seeding uniformity, all wells were photographed before treatments (time zero, T0) at both low (4 ×) and medium (10 ×) magnification (Figure 6). Cells were then treated with different BPPB concentrations in the range of 0.5-100.0 μM. Three wells were assessed for each concentration tested, as well as for controls (CTRL; untreated cells).
At the indicated times of 24, 48 and 72 hours, all wells, (CTRL and BPPB-treated ones) and those treated with BPPB 0.5-100 µM, were photographed again before carrying out the cell viability assessment (images available in Section S2, Figure S8-S10, Supplementary Materials); cells viability was evaluated by the Presto Blue assay (a vital dye that provides color proportionality to the mitochondrial activity, i.e. to the number of metabolically active cells) and measuring the absorbance (Abs) at 570/600 nm. Measurements were performed in duplicate per each well and in triplicate for each concentration tested, at all selected time points. Results were expressed as mean of independent experiments ± S.D. They were reported in Figure S11 (Supplementary Materials), both as dispersion graph of the measured absorbance (Abs) vs. times of treatment (A) and as bar graph of BPPB concentrations (0-100 µM) vs. cell viability (%) (B). The following Figure 7 shows the bar graph resulting by plotting the BPPB concentrations in the range 0-5 µM vs. cell viability (%) measured after 24, 48 and 72 hours. Appearance (Figure S8-S10) and viability (Figure S11) of the control cells keeps in line with a normal trend, which depicts a slight physiological decline of cell survival within the first 24 hours after plating and a prompt recovery of cell growth afterwards. The morphology of control cells (CTRL) remained unchanged even when the cells were examined at higher magnifications (Figure S8-S10, 20 ×). Increasing concentrations of BPPB caused cell morphology alterations, starting with rounding, appearance of vacuoles and blebs, and detachment from the plate. Any BPPB concentration equal to or higher than 25 μM was sufficient to cause detachment and death of all plated cells within 24 hours (Figure S11, panel A). Consequently, no images of the effects of 50, 75 and 100 μM BPPB were shown for 48 hours of treatment (Figure S9), while in Figure S10 (72 hours of treatment), only the images of the effects of BPPB up to 5 μM have been reported. In fact, for 48-72 hours of exposure, the effects on morphology and viability observed at 24 hours for BPPB concentration > 25 µM, were evidenced also at lower BPPB concentrations (1.0 μM - 5.0 μM BPPB). Particularly, at time-points of 48 and 72 hours the percentage of viable cells at 1.0 μM BPPB was significantly lowered to 26.81% and 30.63% respectively, with respect to the seeded cells at T0 (100.0%; Figure S11, Panels B-C), whereas it dropped to even lower values of 2.78% and 3.04% respectively, at 5.0 μM BPPB.
These data strongly suggests that BPPB exposure could trigger the apoptotic onset in treated cells, possibly impairing the mitochondrial functionality and/or efficiency, due to its reported tropism for mitochondria because of the presence of TPP group in its structure [29,35]. Interestingly, it must be noted that removal of BPBB from the culture medium allowed recovery post-treatment of the surviving cells and reprise of normal growth.
The following Figure 7 reports the viability of CTRL cells putatively treated with BPPB but at time zero (T0) (100%), their viability after 24, 48 and 72 hours without BPPB administration and cell viability after 24, 48 and 72 hours of treatment with increasing concentration of BPPB. Concentrations > 5 µM were not reported in Figure 7 because cell viability was insignificant and close to 0, as above indicated.
In Figure 7, the fluctuation in the viability of untreated controls is clearly visible. Viable cells decreased from 100% to 92% after 24 hours and to 85% after 48 hours, while promptly recovered growth up to 138% after 72 hours. Raising concentrations of BPPB caused an increasing reduction in cell viability strongly dependent on time of treatments. While at the highest concentration showed of 5 µM (Figure 7), cell viability was 38% after 24 hours of exposure, it was only of 3% and constant for higher times of treatment (48-72 hours), thus establishing that for prolonged treatments with BPPB at concentrations > 0.5 µM are inadvisable.
To have data directly comparable with those obtained on NB cells, upon conversion of the bar graphs in Figure S11B and Figure 7, in dispersion graphs, and by applying the same procedure reported in the previous Sections, the IC50 values of BPPB were calculated in the range of concentrations 0-100 and 0-5 µM respectively without observing significant differences. Figure S12A and S12B in Supplementary Materials (Section S2) reports the plots of BPPB concentrations (0-100 and 0-5 µM) vs. cell viability (%) after 24, 48, 72 hours treatment, while Figure S12C and S12D shows their transformed plots and nonlinear models used to obtain the IC50 values of BPPB on MRC-5 cells. IC50 values of BPPB on MRC-5 cells when administered at concentrations in the range 0.5-5 µM have been presented in the following Table 4.
Considering the results obtained at 24 hours, given that NB cells viability was already very low and did not change significantly for longer times of treatment, the IC50 values were remarkably higher than those measured on both HTLA-230 (13.9 times) and HTLA-ER NB (2.5 times) cells.
3.3.2. Assessment of the BPPB Concentration-Dependent Effects on Cos-7 and HepG2 Cells by MTT and LDH Essays
In this study, the cytotoxicity profile of BPPB, was assessed in both immortalized human liver cells (HepG2) cells [63,64,65,66]as in our previous works [35,36] and in transformed African green monkey kidney fibroblast cells (Cos-7) as reported in a recent paper [35]. Specifically, we evaluated the cytotoxicity of BPPB by carrying out both the MTT proliferation essay and the lactate dehydrogenase (LHD) cytotoxicity essay which measures the LDH activity as an indicator of cell death. Both cell lines were exposed for 24 hours to increasing concentrations of BPPB (0.4-85.3 µM). Growth inhibition/death were determined by the MTT test, while cell cytotoxicity was determined by LDH assay, with respect to untreated control cells. Results have been reported as bar graphs in Figure 8 and as dispersion graphs in Figures S13 and S14 in Supplementary Materials (Section S2).
Particularly, in the case of the MTT test (Figure 8a,b), bar graphs show the cell viability (%) of untreated Cos-7 (a) and HepG2 (b) control cells (CTRL), and after exposure to increasing concentrations of BPPB for 24h, while in Figure 8c,d, we have plotted the quantification of cell damage (expressed as optical density (OD) units of absorbance)) of CTRL Cos-7 (c) and HepG2 (d) cells, and after exposure to increasing concentrations of BPPB for 24h.
According to the results shown in Figure 8a,b, in the MTT test, BPPB demonstrated concentration-dependent effects towards both cell lines. Anyway, for concentrations = 8.5 µM, while on HepG2 cells BPPB exerted effects like those observed at 4.3 µM and cell viability was higher than 50% and similar (64.5% vs. 62.9%) at both concentrations, cell viability of Cos-7 decreased under 30% (27.45%) respect that observed at 4.3 µM (64.2%). Collectively, the MTT test evidenced that cell viability was affected by BPPB exposure in to a major extent in Cos-7 cells than in HepG2 ones; a safety profile was detected at concentrations ≤ 4.3 µM towards Cos-7 and ≤ 8.5 µM towards HepG2 cells, which is, however, a scenario more satisfactory than that reported by Nunes et al, for the best performing antibacterial compounds they recently synthesized [61]. From LDH test results (Figure 13b and 13c) a slightly different scenario was evidenced in which, while a dose-dependent effect was observed at concentrations ≥ 8.5 µM on Cos-7 cells and similar cell damage was observed for concentrations ≤ 4.3 µM, on HepG2 cells a dose-dependent effect was observed at concentrations ≤ 8.5 µM and similar cell damage was observed for concentrations ≥ 42.6 µM. Nonetheless, as observed in MTT test, for concentrations = 8.5 µM, while on HepG2 cells, BPPB caused damage like that observed at 4.3 µM and the optical density due to LDH release was similar (OD = 0.71 vs. 0.79) at both concentrations, that measured on Cos-7 cells remarkably increased (OD = 0.80) respect that observed at 4.3 µM (OD = 0.30), thus evidencing remarkably higher cell damage. Collectively, also the LDH test evidenced that a safety profile exists at concentrations ≤ 4.3 µM towards Cos-7 and ≤ 8.5 µM towards HepG2 cells. For a more precise evaluation of the effects of BPPB on Cos-7 and HepG2 cells here considered and for comparing them with those found on NB cells (targets to be eliminated), and on stromal cells previously considered (by-stander cells of the microenvironment to leave unaffected), as models of the different cell types co-existing in a putative target tumoral tissue, we calculated the IC50 of BPPB on both cell lines. The transformed plot of Log10 BPPB concentrations vs. cell viability (%) and the nonlinear models are shown in Figure S16 in Supplementary Materials. The calculated IC50 values were 4.91 ± 0.81 µM and 9.64 ± 1.31 µM on Cos-7 and HepG2 cells respectively (Table 5), thus confirming the significantly dissimilar cytotoxicity of BPPB on the different cells, being the MRC-5 stromal cells the less, the Cos-7 the intermediate and the HepG2 the more tolerant ones. These findings confirmed that the toxicity of a new compound strongly depends on the type of cell line used [61].
The lower toxicity of BPPB found toward human hepatic cells with respect to monkey kidney ones (and not the contrary) is a very promising result, which could pave the way for the future clinical development of BPPB and its possible derivatives. Additionally, since it is believed that the HepG2 cell line retains most of the metabolic functions of normal hepatocytes, and it is commonly used to study the toxic effects of heavy metals, nanoparticles, and drugs in vitro [67], we retained more retained more reliable for our scopes the cytotoxicity results obtained on human HepG2 than those obtained on monkey Cos-7 cells.
3.3.3. Hemolytic Toxicity of BPPB on Red Blood Cells (RBC)
The hemolytic ratio percentage (%) caused by BPPB has been assessed as recently reported with slight changes [54]. Particularly, EDTA-blood samples from four healthy donors were exposed to increasing concentrations of BPPB (0.1-50 µM). The results have been expressed as the mean of the four independent determination ± S.D. and are shown in Figure 9.
As observable, hemolysis was statistically significant with respect to control (CTRL) only for concentrations ≥ 10 µM but limited to 25.1% for BPPB = 10 µM. A concentration of BPPB = 20 µM was necessary to determine a hemolysis over 50% (50.8%). The following Figure 10 shows a comparison between cancer cell viability and viability of RBCs when exposed to the same concentrations of BPPB. For both HTLA-230 and HTLA-ER NB cells the minimal treatment duration of 24 hours was considered.
A dispersion graph showing the comparison between the viability of the same cell populations when exposed to all concentrations tested for single experiments has been included in the Supplementary Materials (Figure S16). Confirming the evidence already demonstrated by Figure 10, both populations of NB cells were fully exterminated (viability = 18.2% for HTLA-230 and = 14.3% for HTLA-ER) when hemolysis was inexistent and RBCs viability was still 98.4%. The dispersion graph of BPPB concentrations vs RBCs viability (green trace in Figure S16) was converted as previously described in the dispersion graph of Log10 BPPB concentrations vs. RBCs viability (green trace with indicators and error bars in Figure S17). Then, the plot of nonlinear fit of Log10 concentrations of BPPB vs. normalized response (green trace without indicators in Figure S17) was obtained and used to calculate the IC50 (intended as the concentration of BPPB needed to cause 50% hemolysis) which was 14.92 ± 10.80 µM. Before using the IC50 values obtained on all cancer and normal cells here considered to assess the selectivity of BPPB for NB cells in relation to its toxicity towards normal cells, we have utilized these data to make a bar graph comparing them which is available in Supplementary Materials (Section S2, Figure S18).
3.4. Selectivity Indices
The selectivity index (SI) was calculated to evaluate the toxicity of BPPB against not tumoral cells and to predict its therapeutic potential. High SI values result from large differences between the cytotoxicity against cancer (NB, in our case) and not tumoral cells (MRC-5, Cos-7, HepG2 and RBC) and indicate that cancer cells will be killed at a higher rate than normal ones [68]. Particularly, the SI values of BPPB were calculated in relation to all not tumoral cell (NTC) populations considered and all time of treatments available using the formula (1):
SI = IC50 for NTC/IC50 for NB
According to literature and a recent article by Krzywik et al., a SI > 1.0 can be considered favorable for the development of a new molecule as chemotherapeutic [68].
3.4.1. Selectivity Indices Towards MRC-5, Cos-7 and HepG2 Cells
The SIs of BPPB toward NB cells in relation to its toxicity on MRC-5, Cos-7 and HepG2 cells have in reported in Table 6 and in Figure 11.
As evidenced in Table 6 and Figure 11, after 24 hours of treatment, time at which BPPB has already exerted its maximum of toxicity and cell viability did not change further for longer time of exposure, SIs >> 2 were found in relation to both HTLA-230 and resistant HTLA-ER NB cells. Particularly, the lowest SI = 2.5 was determined on MRC-5 cells, followed by Cos-7 (SI = 4.42) and HepG2 cells (SI = 8.68) if multidrug resistant HTLA-ER NB cells are considered. Very higher SI values all > 10 up to 40.7 were instead found when HTLA-230 cells were considered. Exclusively for MRC-5, the less tolerant to BPPB, it was possible calculate the SI values for longer periods of exposure. Nevertheless, these additional data are of limited importance since the viability of NB cells of both populations tested, remain unchanged after 24 hours of treatment. SI values ≈ 1, reported as a promising value by Krzywik et al. [68], were found also after 48 and 72 hours of exposition for MDR HTLA-ER NB cells, while higher values of 3.77 and 4.01 were found at 48 and 72 hours of exposition when sensitive HTLA-230 NB cells were considered. Collectively, at least in vitro, BPPB was safe for all cell tested and, in a future clinical administration, it may possibly be safe for organs such as kidney and liver for treatments lasting 24 hours. The determined SI values, which provide also indications concerning the susceptibility/tolerance of not tumoral cells towards a novel compound were strongly dependent on the type of cells used. The high susceptibility of MRC-5 human lung fibroblasts with respect to HepG2 ones may be due to a smaller arsenal of detoxifying enzymes possessed by these cells with respect to hepatocytes. In fact, while liver and hepatocytes are a highly specialized organ and cells that play a pivotal role in the detoxification of numerous substances, the detoxifying capacity of fibroblasts (as MRC-5 cells) is indeed less with respect to hepatocytes. While hepatocytes are responsible for many functions, including detoxification, have remarkable proliferation capabilities and play a crucial role in liver homeostasis, repair, and regeneration [69], fibroblasts are more involved in the wound healing process and the deposition of extracellular matrix during liver fibrosis [70]. All these reasons explain the greater tolerance of HepG2 cells compared to both human fibroblast MRC-5 and monkey kidney Cos-7 cells towards exogenous compounds such as our BPPB. Furthermore, the fact that unlike Cos-7 and HepG2, MRC-5 cells are not immortalized makes them even more susceptible to the toxic action of BPPB. Krzywik et al reported the SIs of several synthesized colchicine derivatives towards several cancer cell lines with respect to their cytotoxicity on murine embryonic fibroblast cells [68]. Particularly, they reported SI values in the range 1.5–4.0, 3.0-4.8, 5.6–7.8, 6.5–9.1, 6.6 and 9.8 depending on both the structural characteristics of tested compounds and on type of cancer cells [68]. Despite some of the reported SIs well supported the future development of their compounds for clinical applications, their safest compound (SI = 9.8) displayed an SI value 4.1-, 2.1- and 1.2-fold lower than those of BPPB on HepG2, Cos-7 and MRC-5 cells, when its anticancer effects on HTLA-230 at 24 hours of treatment were considered.
3.4.2. Selectivity Indices Towards RBCs
The SIs of BPPB toward NB cells in relation to its hemolytic toxicity on RBCs have been reported in Table 7 and in Figure 12.
Very high SIs (> 74) were observed for HTLA-230 NB cells. Anyway, also for MDR HTLA-ER NB cells a SI value >> 10 was observed thus establishing the BPPB developed here can be considered safe for RBCs and promising for a future development for clinical use.
4. Conclusions
In this study, a bola-amphiphile molecule (BPPB) synthesized by a simple, low-cost and one-step reaction, has been assayed for the first time as antitumor agent. It bears two identical triphenyl phosphonium (TPP) groups linked by a C12 alkyl chain conferring to BPPB nonpareil colloidal properties, allowing self-assembling in nanovesicles of 49 nm. Particularly, BPPB demonstrated very potent antiproliferative effects against neuroblastoma (NB) cells, including both sensitive HTLA-230 NB cells (IC50 = 0.2 µM) and multidrug resistant HTLA-ER NB cells (IC50 = 1.1 µM), which have developed tolerance to ETO, DOX, carboplatin, cisplatin, vincristine and other clinically used drugs. In this regard, upon further necessary investigations, BPPB could be useful to treat HR-NB cells on which available therapies are no longer functioning. Although its mechanism of action needs to be validated with further studies, which will be the topic of our next work, according to what reported in literature, we can speculate that the TPP groups of BPPB could act first as cytoplasmic membrane disruptors, thus priming cells death. Then, TTP may redirect BPPB inside mitochondria where, upon accumulation by 100-1000 times, it could trigger the various mechanisms of programmed death and apoptosis, impairing mitochondrial functions, causing oxidative stress (OS), mitochondrial toxicity and inhibiting cellular respiration. Following these events, cell health would result irreversibly compromised, turning out in extensive death, by an extra-genomic mechanism, which can hardly determine the emergence of resistance. The anticancer activities of BPPB have been compared with those, already very good, of other compounds previously reported on NB cells, establishing a striking superiority of BPPB in all cases. In addition, aiming at developing a new anticancer agent potentially suitable for future clinical application, its pharmacological effects on not tumoral cell lines, including cells of organs responsible for the detoxification of drugs such as liver and kidney, and red blood cells (RBC), have been evaluated. Notably, the cytotoxicity of BPPB was investigated in vitro onto human lung fibroblasts (MRC-5) by the Presto Blue TM viability test and onto red blood cells (RBC) carrying out a reported protocol to evaluate the hemolytic ratio percentage, for the first time. Results from these new investigations and those obtained on immortalized liver cells HepG2 and monkey kidney cells Cos-7 by carrying out MTT and LHD essays, established that BPPB could display at least in vitro, a safe behavior on all cells here considered and especially towards RBCs. Specifically, after 24 hours treatment, both NB cell populations were fully exterminated (14-18% of viable cells) at concentrations that left more than 98% of red blood cells alive. Additionally, considering specifically the results obtained on HepG2 cells, which are a better in vitro model for the human organ responsible for drug detoxification, very high selectivity indices (SIs) were obtained against both HTLA-230 (SI = 40.6) and HTLA-ER (SI = 8.7). Additionally, this study confirmed that hindered bola-amphiphiles TPP-based nanovesicles have high and selective biological effects as often observed for several cationic nanomaterials. Collectively, BPPB could therefore represent a novel potent template molecule to develop new clinically applicable anticancer agents for counteracting high-risk neuroblastoma. Future improvements in the anticancer effects of BPPB, while further reducing its cytotoxic profiles, could derive by varying the length of the alkyl chain that acts as a linker between the two cationic heads, and therefore by the liposomal formulation of the most promising compounds using themselves as cationic lipids.
Supplementary Materials
The following supporting information can be downloaded at the website of this paper posted on Preprints.org. Section S1: Figure S1. Chemical structure of the BPPB with atoms numbering for NMR peaks assignation. Characterization data of BPPB. Section S2. Biological Results. Figure S2. Cell viability (%) of HTLA-230 vs increasing BPPB concentrations (0.5-50 µM) after 24 hours (blue line), 48 hours (pink line) and 72 hours (green line) of exposure. Concentration = 0.0 µM corresponded to the control. Figure S3. Cell viability (%) of HTLA-ER vs increasing BPPB concentrations (0.5-50 µM) after 24 hours (blue line), 48 hours (pink line) and 72 hours (green line) of exposure. Concentration = 0.0 µM corresponded to the control. Figure S4. Cell viability (%) of HTLA-230 vs increasing BPPB concentrations (0.1-2 µM) after 24 hours (blue line) 48 hours (pink line) and 72 hours (green line) of exposure. Concentration = 0.0 µM corresponded to the control. Figure S5. Cell viability (%) of HTLA-ER vs increasing BPPB concentrations (0.1-2 µM) after 24 hours (blue line) 48 hours (pink line) and 72 hours (green line) of exposure. Concentration = 0.0 µM corresponded to the control. Figure S6. Plot of Log concentration of BPPB vs. cell viability (%) of HTLA-230 after 24, 48, and 72 hours of exposure (blue, pink and green traces with indicators and error bars) and plot of nonlinear fit of Log concentrations of BPPB vs. normalized response after 24, 48, and 72 hours of exposure (blue, pink and green traces without indicators). Figure S7. Plot of Log concentration of BPPB vs. cell viability (%) of HTLA-ER after 24, 48, and 72 hours of exposure (blue, pink and green traces with indicators and error bars) and plot of nonlinear fit of Log concentrations of BPPB vs. normalized response after 24, 48, and 72 hours of exposure (blue, pink and green traces without indicators). Figure S8. Bright filed images of triplicate wells (A, B and C as in Figure 6 in the main text) of MRC-5 cultured cells 24 hours post-treatment (T24) at low (4 ×), medium (10 ×) and high (20 ×) enlargements. For 10 × and 20 × enlargements only one representative image is depicted. Yellow arrows: clusters of detached cells in suspension; red arrows: putative apoptotic cells. In 20 × images: white arrows: vacuoles; light blue arrows: rounded cells; blue arrows: detached cells. White dimensional bars correspond to 62.5, 25.0, 12.5 μm for 4 ×, 10 × and 20 × enlargements, respectively. Figure S9. Bright filed images of triplicate wells (A, B and C, as in Figure 6 in the main text) of MRC-5 cultured cells 48 hours post-treatment (T48) at low (4 ×), medium (10 ×) and high (20 ×) enlargements. Iconography as for Figure S8. Figure S10. Bright filed images of triplicate wells (A, B and C, as in Figure 6 in the main text) of MRC-5 cultured cells 72 hours post-treatment (T72) at low (4 ×), medium (10 ×) and high (20 ×) enlargements. Iconography as for Figure S8. Figure S11. Proliferation curves of MRC-5 cells upon different treatments and time points expressed as mean ± S.D. All curves referring to the highest BPPB concentrations (50.0, 75.0 or 100.0 μM; not shown) are superimposable to 25 μM data (red line). Error bars depict S.D. for each time point/concentration tested (N = 3, in duplicate) (A). Histogram depicts the average percentages of viable cells upon BPPB exposure at each concentration/time point tested, with respect to the initially seeded cells, ± S.D. For T0, N = 24 (B). Table shows numerical data depicted in Figure S8B (C). Whenever indicated, **: 0.001 < p < 0.01; ***: p < 0.001 (Significance was determined by the single-factor ANOVA and Tukey post-hoc tests). Figure S12. Cell viability (%) of MRC-5 cells vs increasing BPPB concentrations (0.5-100 µM (A) and 0.5-5 µM (B)) after 24 hours (blue line) 48 hours (pink line) and 72 hours (light blue line) of exposure. Concentration = 0.0 µM corresponded to the controls. Correspondent plots of Log concentration of BPPB (0.5-100 µM (C) and 0.5-5 µM (D)) vs. cell viability (%) of MRC-5 cells after 24, 48, and 72 hours of exposure (blue, pink and light blue traces with indicators and error bars) and plots of nonlinear fit of Log concentrations of BPPB vs. normalized response at 24, 48, and 72 hours of exposure (blue, pink and light blue traces without indicators). Figure S13. Cell viability (%) of Cos-7 (blue trace) and HepG2 (green trace) cells vs increasing BPPB concentrations (0.4-85.3 µM) after 24 hours of exposure. Concentration = 0.0 µM corresponded to the control. Figure S14. Cytotoxicity (LDH release OD) on Cos-7 (blue trace) and HepG2 (green trace) cells vs increasing BPPB concentrations (0.4-85.3 µM) after 24 hours of exposure. Concentration = 0.0 µM corresponded to the control. Figure S15. Plot of Log concentration of BPPB vs. cell viability (%) (blue and green traces with indicators and error bars) and plot of nonlinear fit of Log concentrations of BPPB vs. normalized response (blue and green traces without indicators). Figure S16. Cell viability (%) of RBCs (green trace), HTLA-230 (blue trace) and HTLA-ER cells (light blue trace) vs increasing BPPB concentrations (0.1-50 µM) after 24 hours (NB cells) or time of experiment of exposure. Concentration = 0.0 µM corresponded to the control. Figure S17. Plot of Log concentration of BPPB vs. RBCs viability (%) (green traces with indicators and error bars) and plot of nonlinear fit of Log concentrations of BPPB vs. normalized response (green traces without indicators). Figure S18. Bar graph comparing the IC50 values of BPPB on cancer cells (HTLA-230 and HTLA-ER) and normal ones (MRC-5, HepG2, Cos-7 and RBCs).
Author Contributions
Conceptualization, S.A., B.M., P.G., C.D., G.Z. and M.M.S. Methodology, software, validation, formal analysis, investigation, resources, data curation, writing—original draft preparation, visualization, supervision, and project administration, S.A. Moreover, P.G., M.M.S. and C.T. carried out the biological experiments on not tumoral cells and red blood cells. B.M. and C.D. carried out the biological experiments on NB tumoral cells. G.Z. performed DLS analyses. Writing—review and editing, S.A., P.G., and G.Z. All authors have read and agreed to the published version of the manuscript.
Funding
This research received no external funding.
Institutional Review Board Statement
Not applicable.
Informed Consent Statement
Not applicable.
Conflicts of Interest
The authors declare no conflict of interest.
References
- Cullinane, C.J.; Burchill, S.A.; Squire, J.A.; O’leary, J.J.; Lewis, I.J. Molecular Biology and Pathology of Paediatric Cancer; Oxford University PressNew York, NY, 2003; ISBN 9780192630797.
- Wilson, L.M.K.; Draper, G.J. Neuroblastoma, Its Natural History and Prognosis: A Study of 487 Cases. BMJ 1974, 3, 301–307. [Google Scholar] [CrossRef] [PubMed]
- Paraboschi, I.; Privitera, L.; Kramer-Marek, G.; Anderson, J.; Giuliani, S. Novel Treatments and Technologies Applied to the Cure of Neuroblastoma. Children 2021, 8, 482. [Google Scholar] [CrossRef]
- Gerges, A.; Canning, U. Neuroblastoma and Its Target Therapies: A Medicinal Chemistry Review. ChemMedChem 2024, 19. [Google Scholar] [CrossRef] [PubMed]
- Ahmad, M.H.; Ghosh, B.; Rizvi, M.A.; Ali, M.; Kaur, L.; Mondal, A.C. Neural Crest Cells Development and Neuroblastoma Progression: Role of Wnt Signaling. J Cell Physiol 2023, 238, 306–328. [Google Scholar] [CrossRef]
- Speleman, F.; Park, J.R.; Henderson, T.O. Neuroblastoma: A Tough Nut to Crack. American Society of Clinical Oncology Educational Book 2016, e548–e557. [Google Scholar] [CrossRef] [PubMed]
- Shimada, H.; Ikegaki, N. Neuroblastoma Pathology and Classification for Precision Prognosis and Therapy Stratification. In Neuroblastoma; Elsevier, 2019; pp. 1–22.
- Molecular Basis and Clinical Features of Neuroblastoma. JMA J 2021, 4. [CrossRef]
- Klebe, S.; Leigh, J.; Henderson, D.W.; Nurminen, M. Asbestos, Smoking and Lung Cancer: An Update. Int J Environ Res Public Health 2019, 17, 258. [Google Scholar] [CrossRef] [PubMed]
- Strother, D.R.; London, W.B.; Schmidt, M. Lou; Brodeur, G.M.; Shimada, H.; Thorner, P.; Collins, M.H.; Tagge, E.; Adkins, S.; Reynolds, C.P.; et al. Outcome After Surgery Alone or With Restricted Use of Chemotherapy for Patients With Low-Risk Neuroblastoma: Results of Children’s Oncology Group Study P9641. Journal of Clinical Oncology 2012, 30, 1842–1848. [Google Scholar] [CrossRef] [PubMed]
- Inomistova, M.; Khranovska, N.; Skachkova, O. Role of Genetic and Epigenetic Alterations in Pathogenesis of Neuroblastoma. In Neuroblastoma; Elsevier, 2019; pp. 23–41.
- Matthay, K.K.; Maris, J.M.; Schleiermacher, G.; Nakagawara, A.; Mackall, C.L.; Diller, L.; Weiss, W.A. Neuroblastoma. Nat Rev Dis Primers 2016, 2, 16078. [Google Scholar] [CrossRef]
- Mora, J.; Castañeda, A.; Flores, M.A.; Santa-María, V.; Garraus, M.; Gorostegui, M.; Simao, M.; Perez-Jaume, S.; Mañe, S. The Role of Autologous Stem-Cell Transplantation in High-Risk Neuroblastoma Consolidated by Anti-GD2 Immunotherapy. Results of Two Consecutive Studies. Front Pharmacol 2020, 11. [Google Scholar] [CrossRef]
- Bhoopathi, P.; Mannangatti, P.; Emdad, L.; Das, S.K.; Fisher, P.B. The Quest to Develop an Effective Therapy for Neuroblastoma. J Cell Physiol 2021, 236, 7775–7791. [Google Scholar] [CrossRef] [PubMed]
- Brusnakov, M.; Golovchenko, O.; Velihina, Y.; Liavynets, O.; Zhirnov, V.; Brovarets, V. Evaluation of Anticancer Activity of 1,3-Oxazol-4-ylphosphonium Salts in Vitro. ChemMedChem 2022, 17. [Google Scholar] [CrossRef] [PubMed]
- Dryden, M. Reactive Oxygen Species: A Novel Antimicrobial. Int J Antimicrob Agents 2018, 51, 299–303. [Google Scholar] [CrossRef] [PubMed]
- Alfei, S.; Schito, G.C.; Schito, A.M.; Zuccari, G. ..Reactive Oxygen Species (ROS)-Mediated Antibacterial Oxidative Therapies: Available Methods to Generate ROS and a Novel Option Proposal. IJMS, 2024; 2024051628. [Google Scholar]
- Dryden, M. Reactive Oxygen Therapy: A Novel Therapy in Soft Tissue Infection. Curr Opin Infect Dis 2017, 30, 143–149. [Google Scholar] [CrossRef] [PubMed]
- Van Loenhout, J.; Peeters, M.; Bogaerts, A.; Smits, E.; Deben, C. Oxidative Stress-Inducing Anticancer Therapies: Taking a Closer Look at Their Immunomodulating Effects. Antioxidants 2020, 9, 1188. [Google Scholar] [CrossRef] [PubMed]
- Baldea, I.; Giurgiu, L.; Teacoe, I.D.; Olteanu, D.E.; Olteanu, F.C.; Clichici, S.; Filip, G.A. Photodynamic Therapy in Melanoma - Where Do We Stand? Curr Med Chem 2019, 25, 5540–5563. [Google Scholar] [CrossRef] [PubMed]
- Watanabe, T.; Nishio, Y.; Yamamoto, Y.; Shimizu, T.; Li, X.-K.; Okita, H.; Kuroda, T. Photodynamic Therapy with 5-Aminolevulinic Acid: A New Diagnostic, Therapeutic, and Surgical Aid for Neuroblastoma. J Pediatr Surg 2022, 57, 1281–1285. [Google Scholar] [CrossRef] [PubMed]
- Tanaka, M.; Kataoka, H.; Mabuchi, M.; Sakuma, S.; Takahashi, S.; Tujii, R.; Akashi, H.; Ohi, H.; Yano, S.; Morita, A.; et al. Anticancer Effects of Novel Photodynamic Therapy with Glycoconjugated Chlorin for Gastric and Colon Cancer. Anticancer Res 2011, 31, 763–769. [Google Scholar] [PubMed]
- Jiang, W.; Liang, M.; Lei, Q.; Li, G.; Wu, S. The Current Status of Photodynamic Therapy in Cancer Treatment. Cancers (Basel) 2023, 15, 585. [Google Scholar] [CrossRef]
- Sai, D.L.; Lee, J.; Nguyen, D.L.; Kim, Y.-P. Tailoring Photosensitive ROS for Advanced Photodynamic Therapy. Exp Mol Med 2021, 53, 495–504. [Google Scholar] [CrossRef]
- Ghosh, P.; Vidal, C.; Dey, S.; Zhang, L. Mitochondria Targeting as an Effective Strategy for Cancer Therapy. Int J Mol Sci 2020, 21, 3363. [Google Scholar] [CrossRef] [PubMed]
- Principle of Biology; 11 November.; 2021.
- Kulkarni, C.A.; Fink, B.D.; Gibbs, B.E.; Chheda, P.R.; Wu, M.; Sivitz, W.I.; Kerns, R.J. A Novel Triphenylphosphonium Carrier to Target Mitochondria without Uncoupling Oxidative Phosphorylation. J Med Chem 2021, 64, 662–676. [Google Scholar] [CrossRef] [PubMed]
- Cheng, X.; Feng, D.; Lv, J.; Cui, X.; Wang, Y.; Wang, Q.; Zhang, L. Application Prospects of Triphenylphosphine-Based Mitochondria-Targeted Cancer Therapy. Cancers (Basel) 2023, 15, 666. [Google Scholar] [CrossRef] [PubMed]
- Ceccacci, F.; Sennato, S.; Rossi, E.; Proroga, R.; Sarti, S.; Diociaiuti, M.; Casciardi, S.; Mussi, V.; Ciogli, A.; Bordi, F.; et al. Aggregation Behaviour of Triphenylphosphonium Bolaamphiphiles. J Colloid Interface Sci 2018, 531, 451–462. [Google Scholar] [CrossRef] [PubMed]
- Severina, I.I.; Vyssokikh, M.Yu.; Pustovidko, A. V.; Simonyan, R.A.; Rokitskaya, T.I.; Skulachev, V.P. Effects of Lipophilic Dications on Planar Bilayer Phospholipid Membrane and Mitochondria. Biochimica et Biophysica Acta (BBA) - Bioenergetics 2007, 1767, 1164–1168. [Google Scholar] [CrossRef] [PubMed]
- Zinovkin, R.A.; Zamyatnin, A.A. Mitochondria-Targeted Drugs. Curr Mol Pharmacol 2019, 12, 202–214. [Google Scholar] [CrossRef] [PubMed]
- Adam-Vizi, V.; Chinopoulos, C. Bioenergetics and the Formation of Mitochondrial Reactive Oxygen Species. Trends Pharmacol Sci 2006, 27, 639–645. [Google Scholar] [CrossRef] [PubMed]
- Bachowska, B.; Kazmierczak-Baranska, J.; Cieslak, M.; Nawrot, B.; Szczęsna, D.; Skalik, J.; Bałczewski, P. High Cytotoxic Activity of Phosphonium Salts and Their Complementary Selectivity towards HeLa and K562 Cancer Cells: Identification of Tri- n -butyl- n -hexadecylphosphonium Bromide as a Highly Potent Anti-HeLa Phosphonium Salt. ChemistryOpen 2012, 1, 33–38. [Google Scholar] [CrossRef] [PubMed]
- Nuraje, N.; Bai, H.; Su, K. Bolaamphiphilic Molecules: Assembly and Applications. Prog Polym Sci 2013, 38, 302–343. [Google Scholar] [CrossRef]
- Silvana Alfei; Guendalina Zuccari; Francesca Bacchetti; Carola Torazza; Marco Milanese; Carlo Siciliano; Constantinos M. Athanassopoulos; Gabriella Piatti; Anna Maria Schito Synthesized Bis-Triphenyl Phosphonium-Based Nano Vesicles Have Potent and Selective Antibacterial Effects on Several Clinically Relevant Superbugs. Preprint, 2024; 2024070891. [CrossRef]
- Bacchetti, F.; Schito, A.M.; Milanese, M.; Castellaro, S.; Alfei, S. Anti Gram-Positive Bacteria Activity of Synthetic Quaternary Ammonium Lipid and Its Precursor Phosphonium Salt. Int J Mol Sci 2024, 25, 2761. [Google Scholar] [CrossRef]
- Ermolaev, V. V.; Arkhipova, D.M.; Miluykov, V.A.; Lyubina, A.P.; Amerhanova, S.K.; Kulik, N. V.; Voloshina, A.D.; Ananikov, V.P. Sterically Hindered Quaternary Phosphonium Salts (QPSs): Antimicrobial Activity and Hemolytic and Cytotoxic Properties. Int J Mol Sci 2021, 23, 86. [Google Scholar] [CrossRef]
- Lukáč, M.; Pisárčik, M.; Garajová, M.; Mrva, M.; Dušeková, A.; Vrták, A.; Horáková, R.; Horváth, B.; Devínsky, F. Synthesis, Surface Activity, and Biological Activities of Phosphonium and Metronidazole Salts. J Surfactants Deterg 2020, 23, 1025–1032. [Google Scholar] [CrossRef]
- Khasiyatullina, N.R.; Mironov, V.F.; Gumerova, S.K.; Voloshina, A.D.; Sapunova, A.S. Versatile Approach to Naphthoquinone Phosphonium Salts and Evaluation of Their Biological Activity. Mendeleev Communications 2019, 29, 435–437. [Google Scholar] [CrossRef]
- Lei, Q.; Lai, X.; Zhang, Y.; Li, Z.; Li, R.; Zhang, W.; Ao, N.; Zhang, H. PEGylated Bis-Quaternary Triphenyl-Phosphonium Tosylate Allows for Balanced Antibacterial Activity and Cytotoxicity. ACS Appl Bio Mater 2020, 3, 6400–6407. [Google Scholar] [CrossRef]
- Yuan, B.; Hu, W.; Lv, S.; Huang, J.; Huang, K. Synthesis of Aliphatic Symmetric Diphosphonium Salts and Bactericidal Activity of Selected Products. Chemistry Journal of Moldova 2017, 12, 81–86. [Google Scholar] [CrossRef]
- Wei, W.; Yuan, B.; Lv, S.; Liao, Q.; Huang, J. Synthesis, Characterization and Performance of a New Type of Alkylene Triphenyl Double Quaternary Phosphonium Salt. Journal of Materials Science and Chemical Engineering 2013, 01, 61–65. [Google Scholar] [CrossRef]
- Bergeron, K.L.; Murphy, E.L.; Majofodun, O.; Muñoz, L.D.; Williams, J.C.; Almeida, K.H. Arylphosphonium Salts Interact with DNA to Modulate Cytotoxicity. Mutation Research/Genetic Toxicology and Environmental Mutagenesis 2009, 673, 141–148. [Google Scholar] [CrossRef] [PubMed]
- Millard, M.; Pathania, D.; Shabaik, Y.; Taheri, L.; Deng, J.; Neamati, N. Preclinical Evaluation of Novel Triphenylphosphonium Salts with Broad-Spectrum Activity. PLoS One 2010, 5, e13131. [Google Scholar] [CrossRef] [PubMed]
- Huang, H.; Wu, H.; Huang, Y.; Zhang, S.; Lam, Y.; Ao, N. Antitumor Activity and Antitumor Mechanism of Triphenylphosphonium Chitosan against Liver Carcinoma. J Mater Res 2018, 33, 2586–2597. [Google Scholar] [CrossRef]
- Arafa, K.K.; Hamzawy, M.A.; Mousa, S.A.; El-Sherbiny, I.M. Mitochondria-Targeted Alginate/Triphenylphosphonium-Grafted-Chitosan for Treatment of Hepatocellular Carcinoma. RSC Adv 2022, 12, 21690–21703. [Google Scholar] [CrossRef]
- Valenti, G.E.; Alfei, S.; Caviglia, D.; Domenicotti, C.; Marengo, B. Antimicrobial Peptides and Cationic Nanoparticles: A Broad-Spectrum Weapon to Fight Multi-Drug Resistance Not Only in Bacteria. Int J Mol Sci 2022, 23, 6108. [Google Scholar] [CrossRef] [PubMed]
- Valenti, G.E.; Roveri, A.; Venerando, R.; Menichini, P.; Monti, P.; Tasso, B.; Traverso, N.; Domenicotti, C.; Marengo, B. PTC596-Induced BMI-1 Inhibition Fights Neuroblastoma Multidrug Resistance by Inducing Ferroptosis. Antioxidants 2023, 13, 3. [Google Scholar] [CrossRef] [PubMed]
- Colla, R.; Izzotti, A.; De Ciucis, C.; Fenoglio, D.; Ravera, S.; Speciale, A.; Ricciarelli, R.; Furfaro, A.L.; Pulliero, A.; Passalacqua, M.; et al. Glutathione-Mediated Antioxidant Response and Aerobic Metabolism: Two Crucial Factors Involved in Determining the Multi-Drug Resistance of High-Risk Neuroblastoma. Oncotarget 2016, 7, 70715–70737. [Google Scholar] [CrossRef] [PubMed]
- Alfei, S.; Marengo, B.; Domenicotti, C. Polyester-Based Dendrimer Nanoparticles Combined with Etoposide Have an Improved Cytotoxic and Pro-Oxidant Effect on Human Neuroblastoma Cells. Antioxidants 2020, 9, 50. [Google Scholar] [CrossRef]
- Alfei, S.; Marengo, B.; Zuccari, G.; Turrini, F.; Domenicotti, C. Dendrimer Nanodevices and Gallic Acid as Novel Strategies to Fight Chemoresistance in Neuroblastoma Cells. Nanomaterials 2020, 10, 1243. [Google Scholar] [CrossRef] [PubMed]
- Berridge, M. V.; Herst, P.M.; Tan, A.S. Tetrazolium Dyes as Tools in Cell Biology: New Insights into Their Cellular Reduction. In; 2005; pp. 127–152.
- Kumar, P.; Nagarajan, A.; Uchil, P.D. Analysis of Cell Viability by the Lactate Dehydrogenase Assay. Cold Spring Harb Protoc 2018, 2018, pdb.prot095497. [Google Scholar] [CrossRef] [PubMed]
- Chandrasekhar, B.; Gor, R.; Ramalingam, S.; Thiagarajan, A.; Sohn, H.; Madhavan, T. Repurposing FDA-Approved Compounds to Target JAK2 for Colon Cancer Treatment. Discover Oncology 2024, 15, 226. [Google Scholar] [CrossRef] [PubMed]
- Zielonka, J.; Joseph, J.; Sikora, A.; Hardy, M.; Ouari, O.; Vasquez-Vivar, J.; Cheng, G.; Lopez, M.; Kalyanaraman, B. Mitochondria-Targeted Triphenylphosphonium-Based Compounds: Syntheses, Mechanisms of Action, and Therapeutic and Diagnostic Applications. Chem Rev 2017, 117, 10043–10120. [Google Scholar] [CrossRef] [PubMed]
- Dhanya, D.; Giuseppe, P.; Rita, C.A.; Annaluisa, M.; Stefania, S.M.; Francesca, G.; Vitale, D. V.; Anna, R.; Claudio, A.; Pasquale, L.; et al. Phosphonium Salt Displays Cytotoxic Effects Against Human Cancer Cell Lines. Anticancer Agents Med Chem 2018, 17. [Google Scholar] [CrossRef] [PubMed]
- Alfei, S.; Marengo, B.; Valenti, G.; Domenicotti, C. Synthesis of Polystyrene-Based Cationic Nanomaterials with Pro-Oxidant Cytotoxic Activity on Etoposide-Resistant Neuroblastoma Cells. Nanomaterials 2021, 11, 977. [Google Scholar] [CrossRef]
- Valenti, G.E.; Marengo, B.; Milanese, M.; Zuccari, G.; Brullo, C.; Domenicotti, C.; Alfei, S. Imidazo-Pyrazole-Loaded Palmitic Acid and Polystyrene-Based Nanoparticles: Synthesis, Characterization and Antiproliferative Activity on Chemo-Resistant Human Neuroblastoma Cells. Int J Mol Sci 2023, 24, 15027. [Google Scholar] [CrossRef] [PubMed]
- Alfei, S.; Zuccari, G.; Caviglia, D.; Brullo, C. Synthesis and Characterization of Pyrazole-Enriched Cationic Nanoparticles as New Promising Antibacterial Agent by Mutual Cooperation. Nanomaterials 2022, 12, 1215. [Google Scholar] [CrossRef] [PubMed]
- Zuccari, G.; Zorzoli, A.; Marimpietri, D.; Brullo, C.; Alfei, S. Pyrazole-Enriched Cationic Nanoparticles Induced Early- and Late-Stage Apoptosis in Neuroblastoma Cells at Sub-Micromolar Concentrations. Pharmaceuticals 2023, 16, 393. [Google Scholar] [CrossRef] [PubMed]
- Nunes, B.; Cagide, F.; Fernandes, C.; Borges, A.; Borges, F.; Simões, M. Efficacy of Novel Quaternary Ammonium and Phosphonium Salts Differing in Cation Type and Alkyl Chain Length against Antibiotic-Resistant Staphylococcus Aureus. Int J Mol Sci 2023, 25, 504. [Google Scholar] [CrossRef] [PubMed]
- Zhang, K.; Na, T.; Wang, L.; Gao, Q.; Yin, W.; Wang, J.; Yuan, B.-Z. Human Diploid MRC-5 Cells Exhibit Several Critical Properties of Human Umbilical Cord-Derived Mesenchymal Stem Cells. Vaccine 2014, 32, 6820–6827. [Google Scholar] [CrossRef] [PubMed]
- Xuan, J.; Chen, S.; Ning, B.; Tolleson, W.H.; Guo, L. Development of HepG2-Derived Cells Expressing Cytochrome P450s for Assessing Metabolism-Associated Drug-Induced Liver Toxicity. Chem Biol Interact 2016, 255, 63–73. [Google Scholar] [CrossRef] [PubMed]
- Donato, M.T.; Tolosa, L.; Gómez-Lechón, M.J. Culture and Functional Characterization of Human Hepatoma HepG2 Cells. Methods Mol Biol 2015, 1250, 77–93. [Google Scholar] [CrossRef] [PubMed]
- Tolosa, L.; Gómez-Lechón, M.J.; López, S.; Guzmán, C.; Castell, J. V; Donato, M.T.; Jover, R. Human Upcyte Hepatocytes: Characterization of the Hepatic Phenotype and Evaluation for Acute and Long-Term Hepatotoxicity Routine Testing. Toxicol Sci 2016, 152, 214–229. [Google Scholar] [CrossRef] [PubMed]
- Martínez-Sena, T.; Moro, E.; Moreno-Torres, M.; Quintás, G.; Hengstler, J.; Castell, J. V. Metabolomics-Based Strategy to Assess Drug Hepatotoxicity and Uncover the Mechanisms of Hepatotoxicity Involved. Arch Toxicol 2023, 97, 1723–1738. [Google Scholar] [CrossRef]
- Arzumanian, V.A.; Kiseleva, O.I.; Poverennaya, E. V. The Curious Case of the HepG2 Cell Line: 40 Years of Expertise. Int J Mol Sci 2021, 22, 13135. [Google Scholar] [CrossRef]
- Krzywik, J.; Mozga, W.; Aminpour, M.; Janczak, J.; Maj, E.; Wietrzyk, J.; Tuszyński, J.A.; Huczyński, A. Synthesis, Antiproliferative Activity and Molecular Docking Studies of Novel Doubly Modified Colchicine Amides and Sulfonamides as Anticancer Agents. Molecules 2020, 25, 1789. [Google Scholar] [CrossRef]
- Pu, W.; Zhou, B. Hepatocyte Generation in Liver Homeostasis, Repair, and Regeneration. Cell Regeneration 2022, 11, 2. [Google Scholar] [CrossRef]
- Hellerbrand, C. Role of Fibroblast Growth Factors and Their Receptors in Liver Fibrosis and Repair. Curr Pathobiol Rep 2015, 3, 235–241. [Google Scholar] [CrossRef]
Figure 1.
Chemical structure of the BPPB.
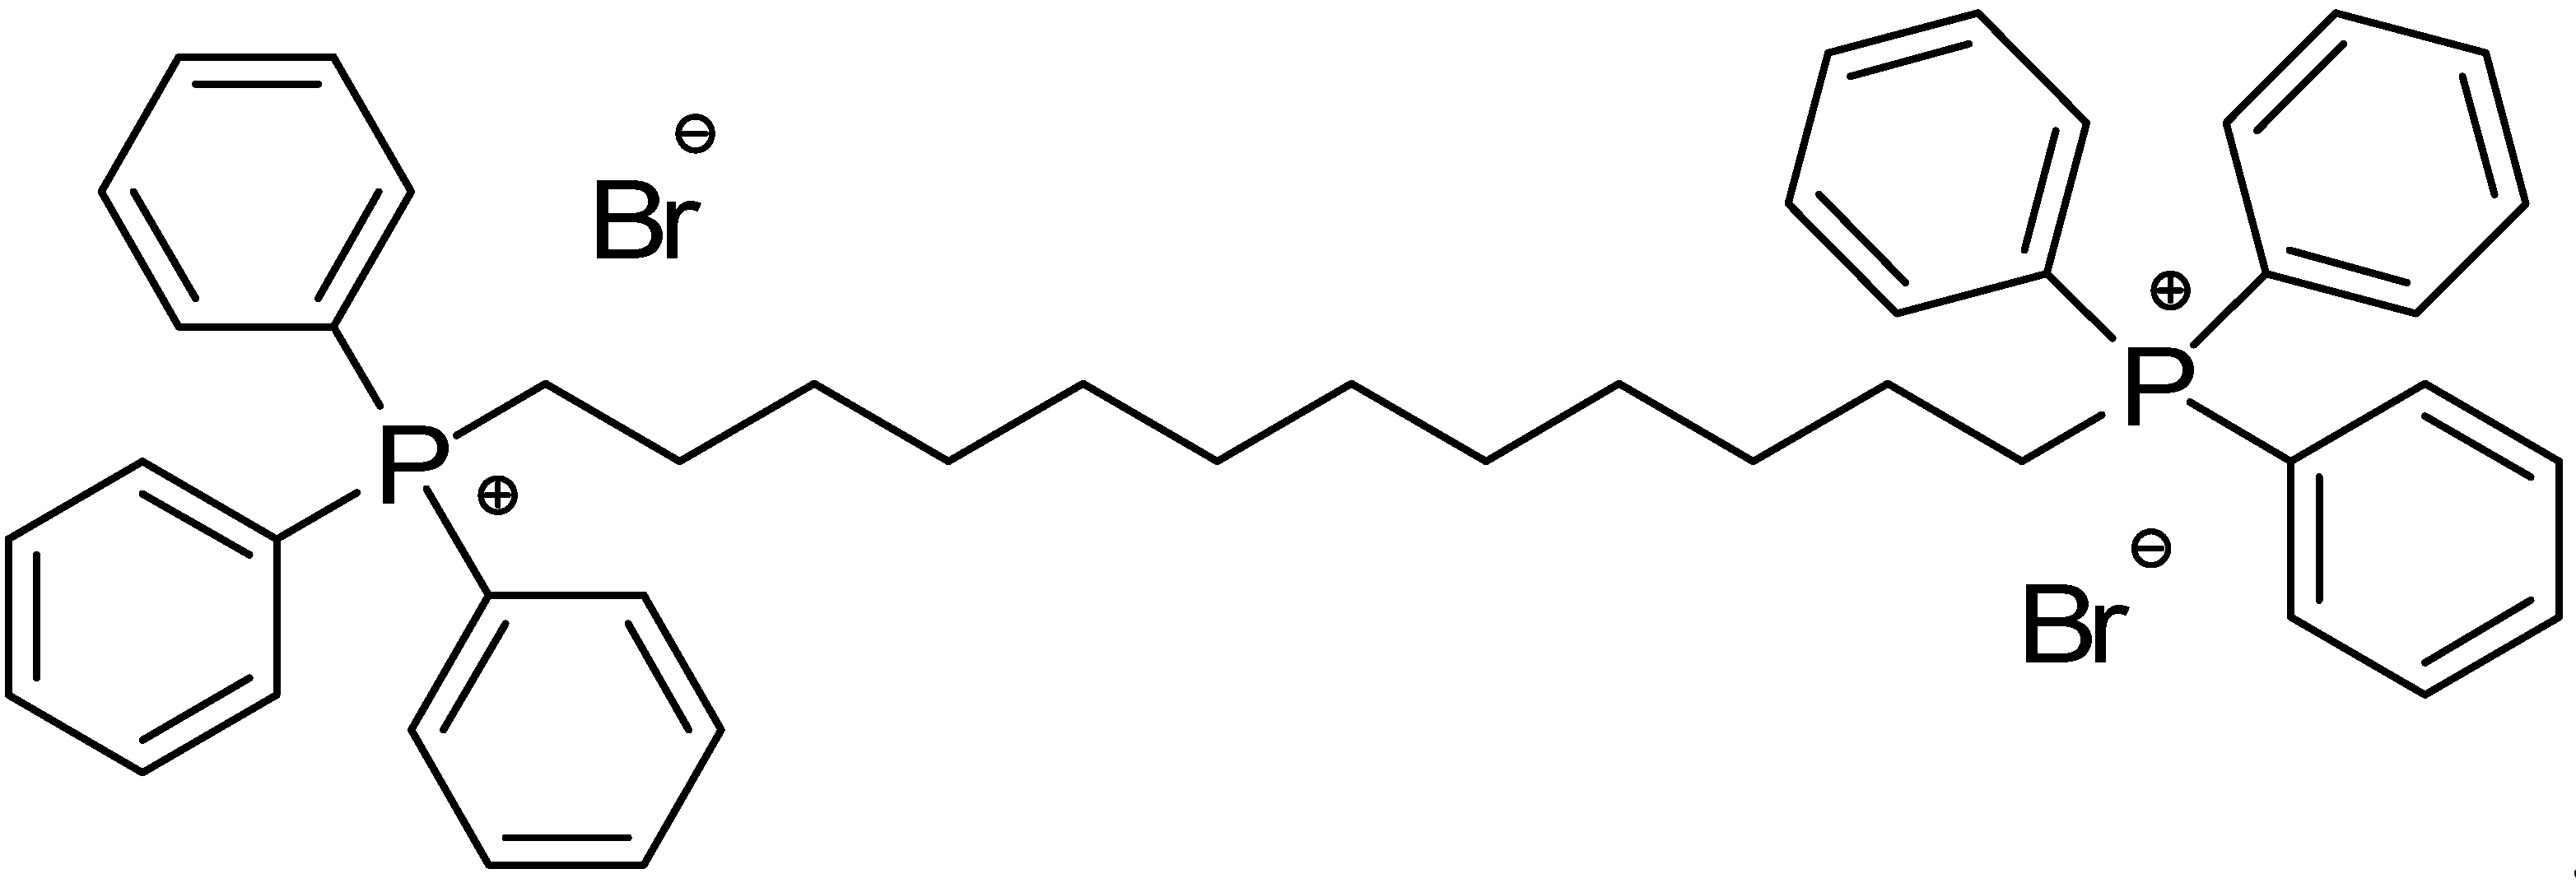
Scheme 1.
Synthetic route to achieve BPPB.
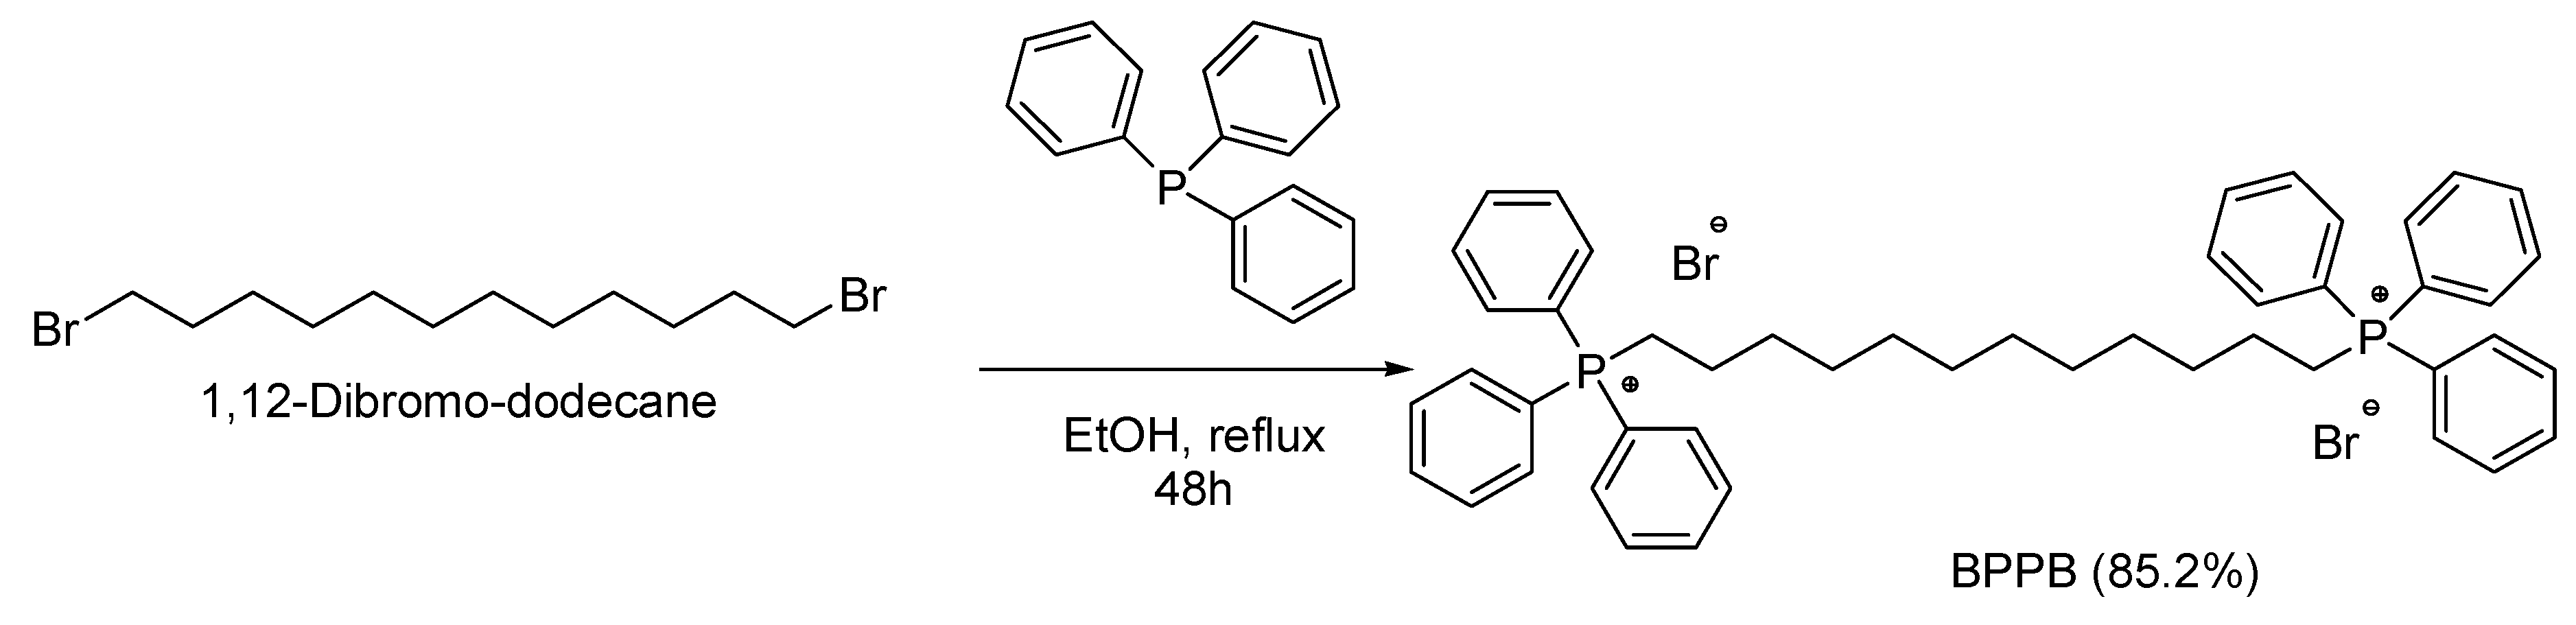
Figure 2.
Cell viability was evaluated in HTLA-230 cells exposed to increasing concentrations of BPPB (0.5–50 µM) for 24, 48 and 72 hours. Bar graphs summarize quantitative data of the means ± S.D. of four independent experiments run in triplicate. Significance refers to control (*), or to 0.5 µM (°). Specifically, p > 0.05 no symbols; **** p < 0.0001 vs. Control (Ctr); °°°° p < 0.0001 vs 0.5 µM (two-way ANOVA followed by Tukey’s multi-comparisons test).
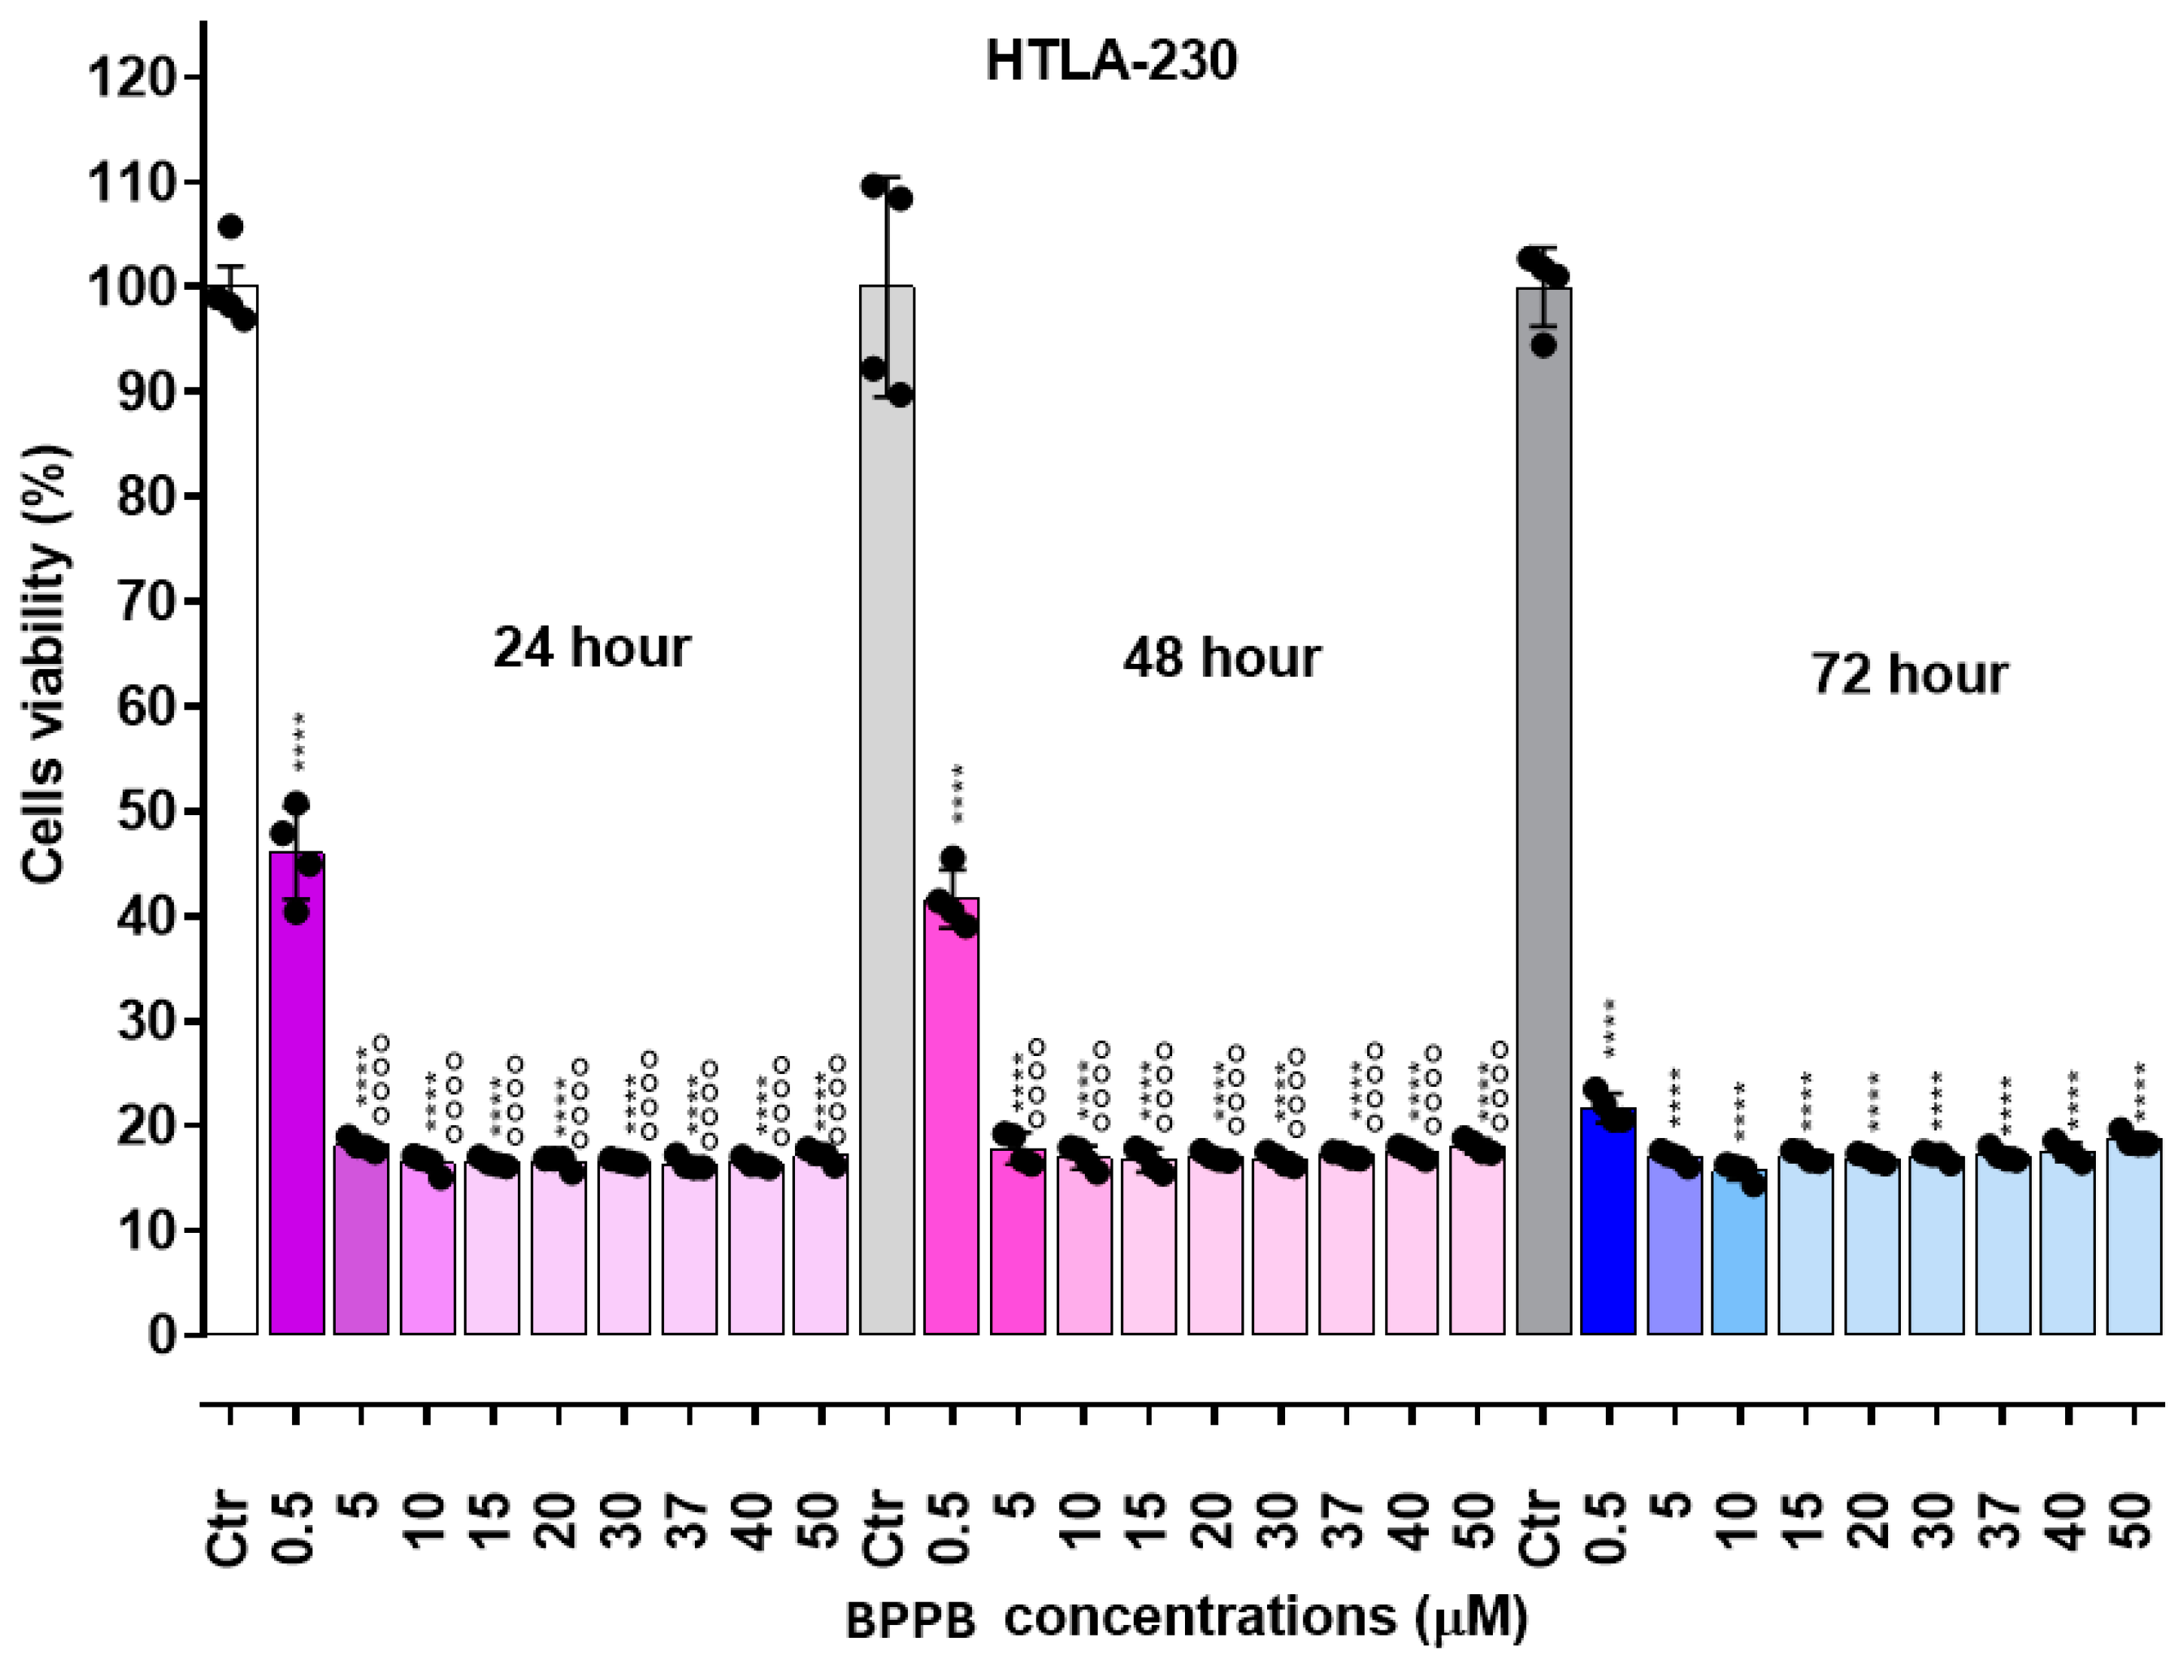
Figure 3.
Cell viability was evaluated in HTLA-ER cells exposed to increasing concentrations of BPPB (0.5–50 µM) for 24, 48 and 72 h. Bar graphs summarize quantitative data of the means ± S.D. of four independent experiments run in triplicate. Significance refers to control (Ctr) (*), to 0.5 µM concentration (°), or to 5 µM concentration (a). Specifically, p > 0.05 no symbols; (a) means p < 0.05, (aa) means p < 0.01, (aaa) means p < 0.001 and (aaaa) means p < 0.0001, **** means p < 0.0001; °°°° means p < 0.0001 (two-way ANOVA followed by Tukey’s multi-comparisons test).
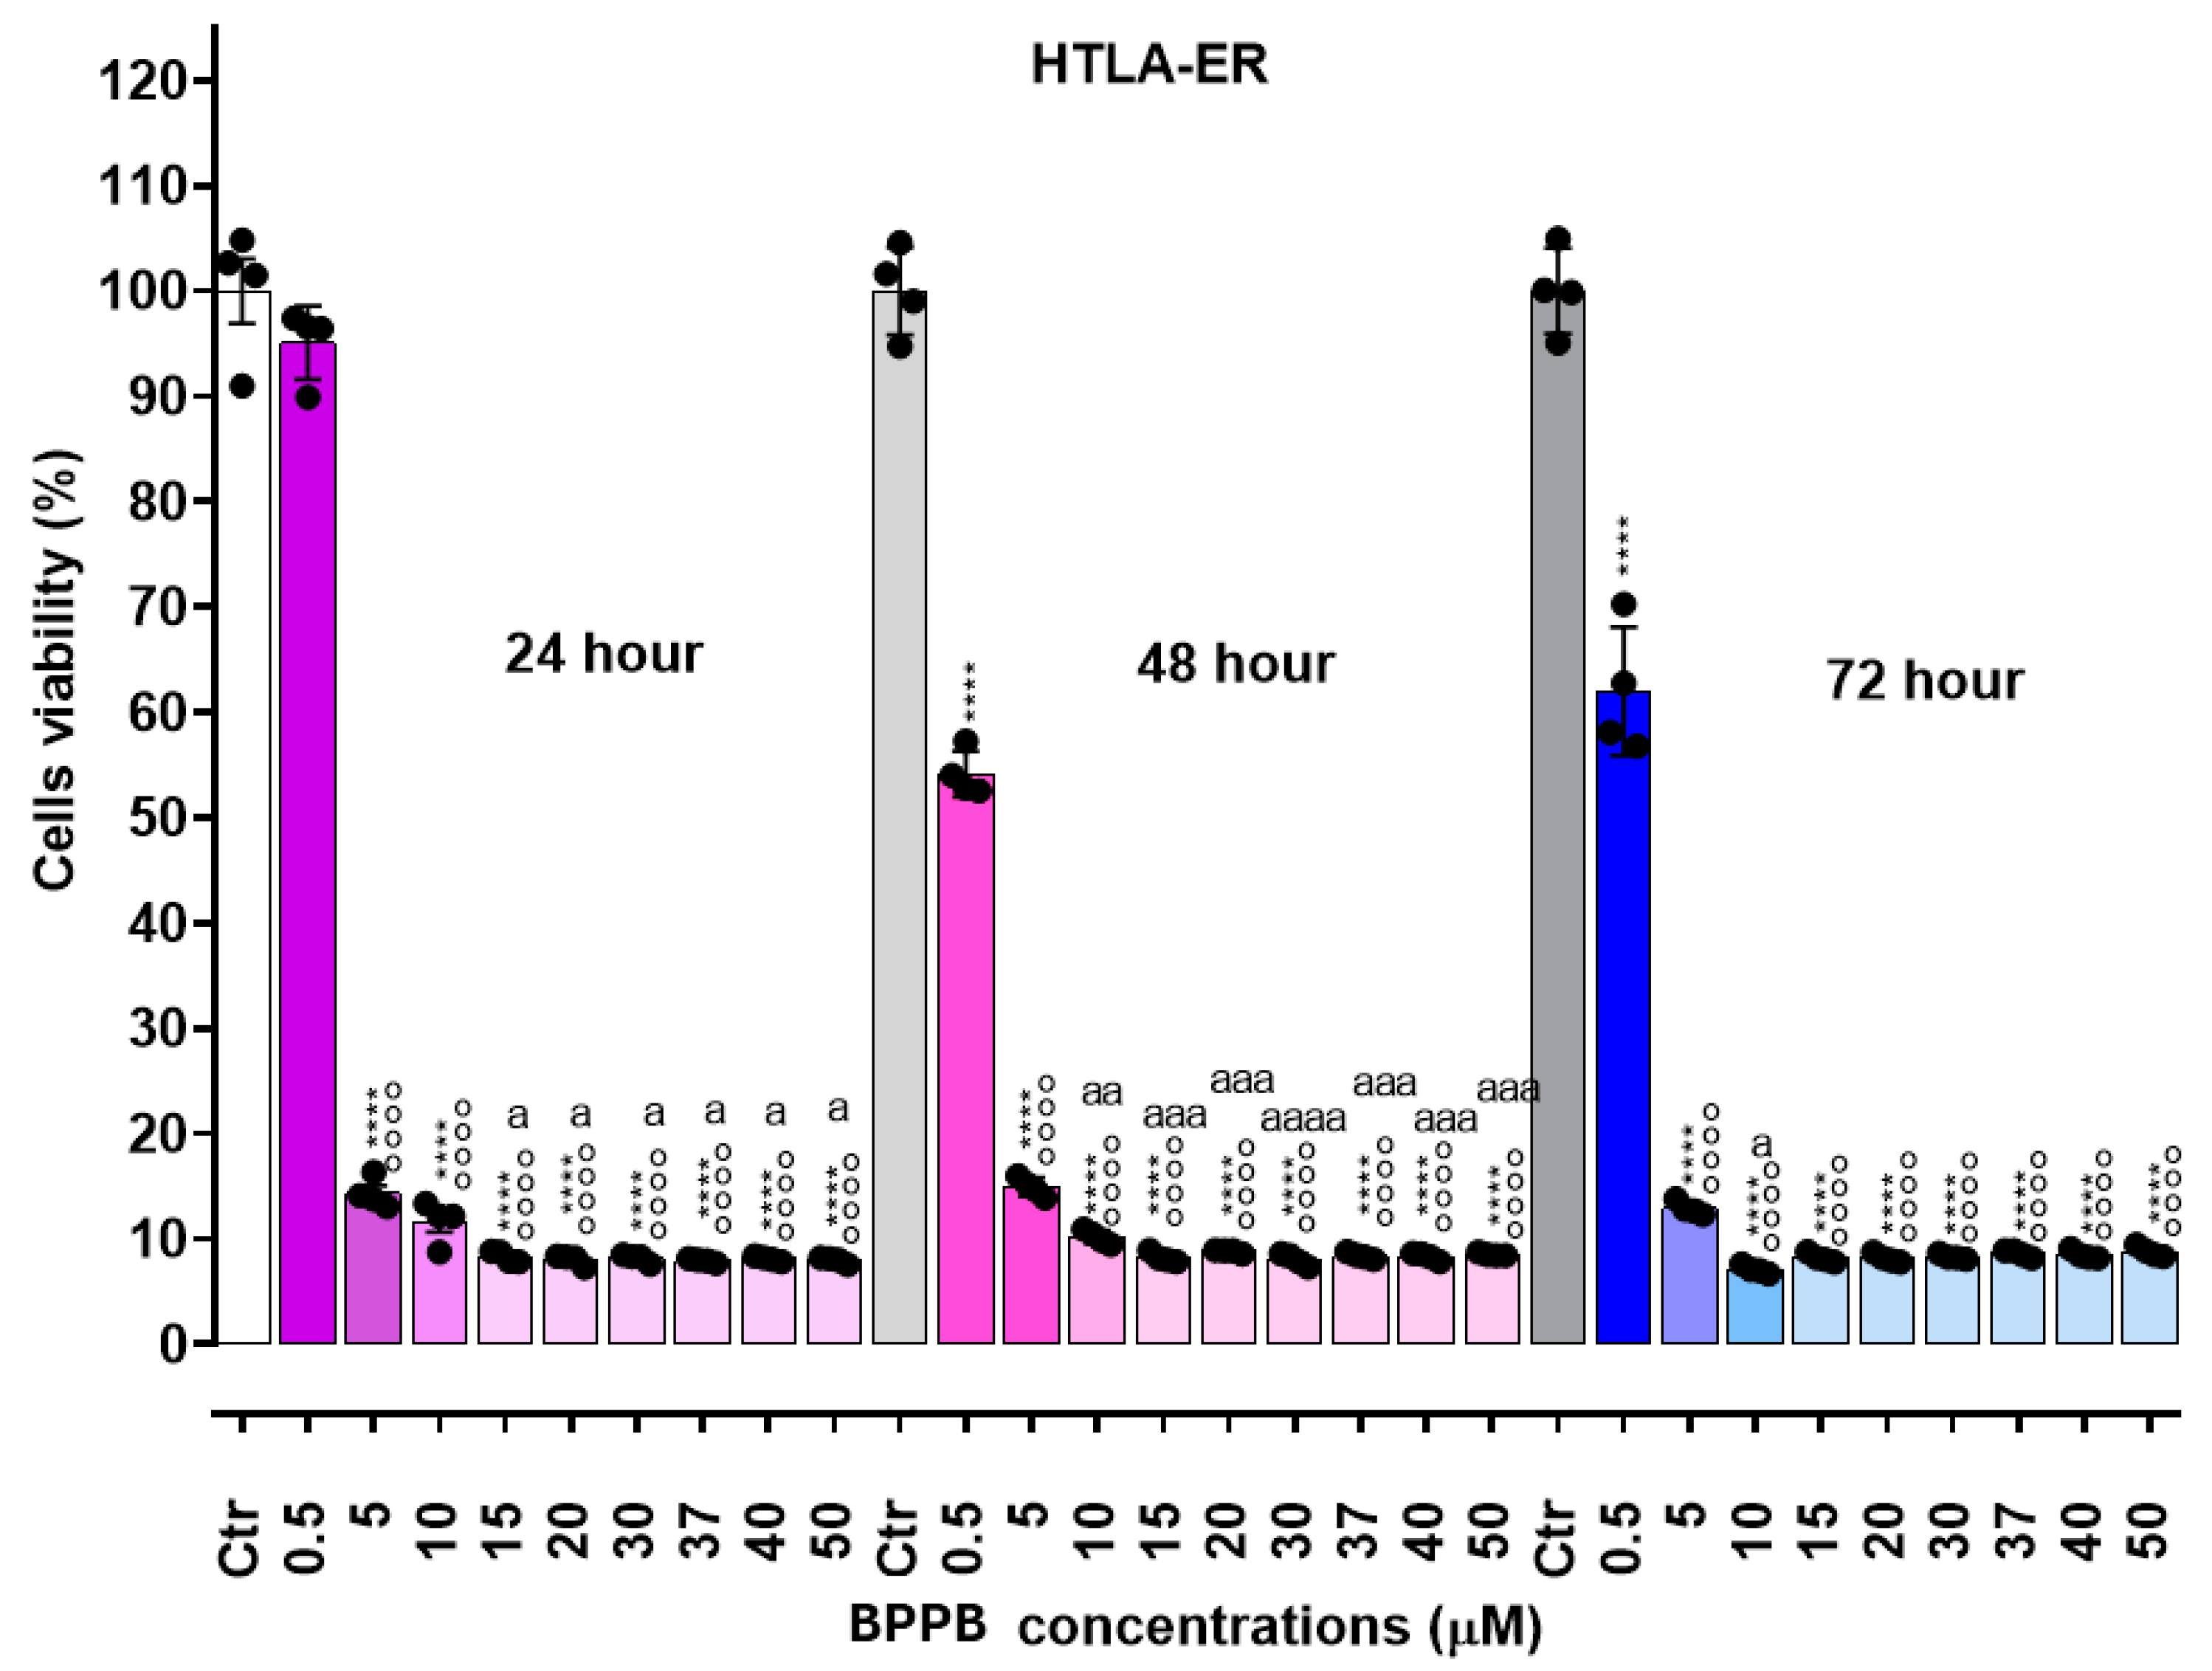
Figure 4.
Cell viability was evaluated in HTLA-230 cells exposed to increasing concentrations of BPPB (0.1–2 µM) for 24, 48 and 72 h. Bar graphs summarize quantitative data of the means ± S.D. of four independent experiments run in triplicate. Significance refers exclusively to control (Ctr). Specifically, p > 0.05 no symbols, while **** means p < 0.0001 (two-way ANOVA followed by Tukey’s multi-comparisons test).
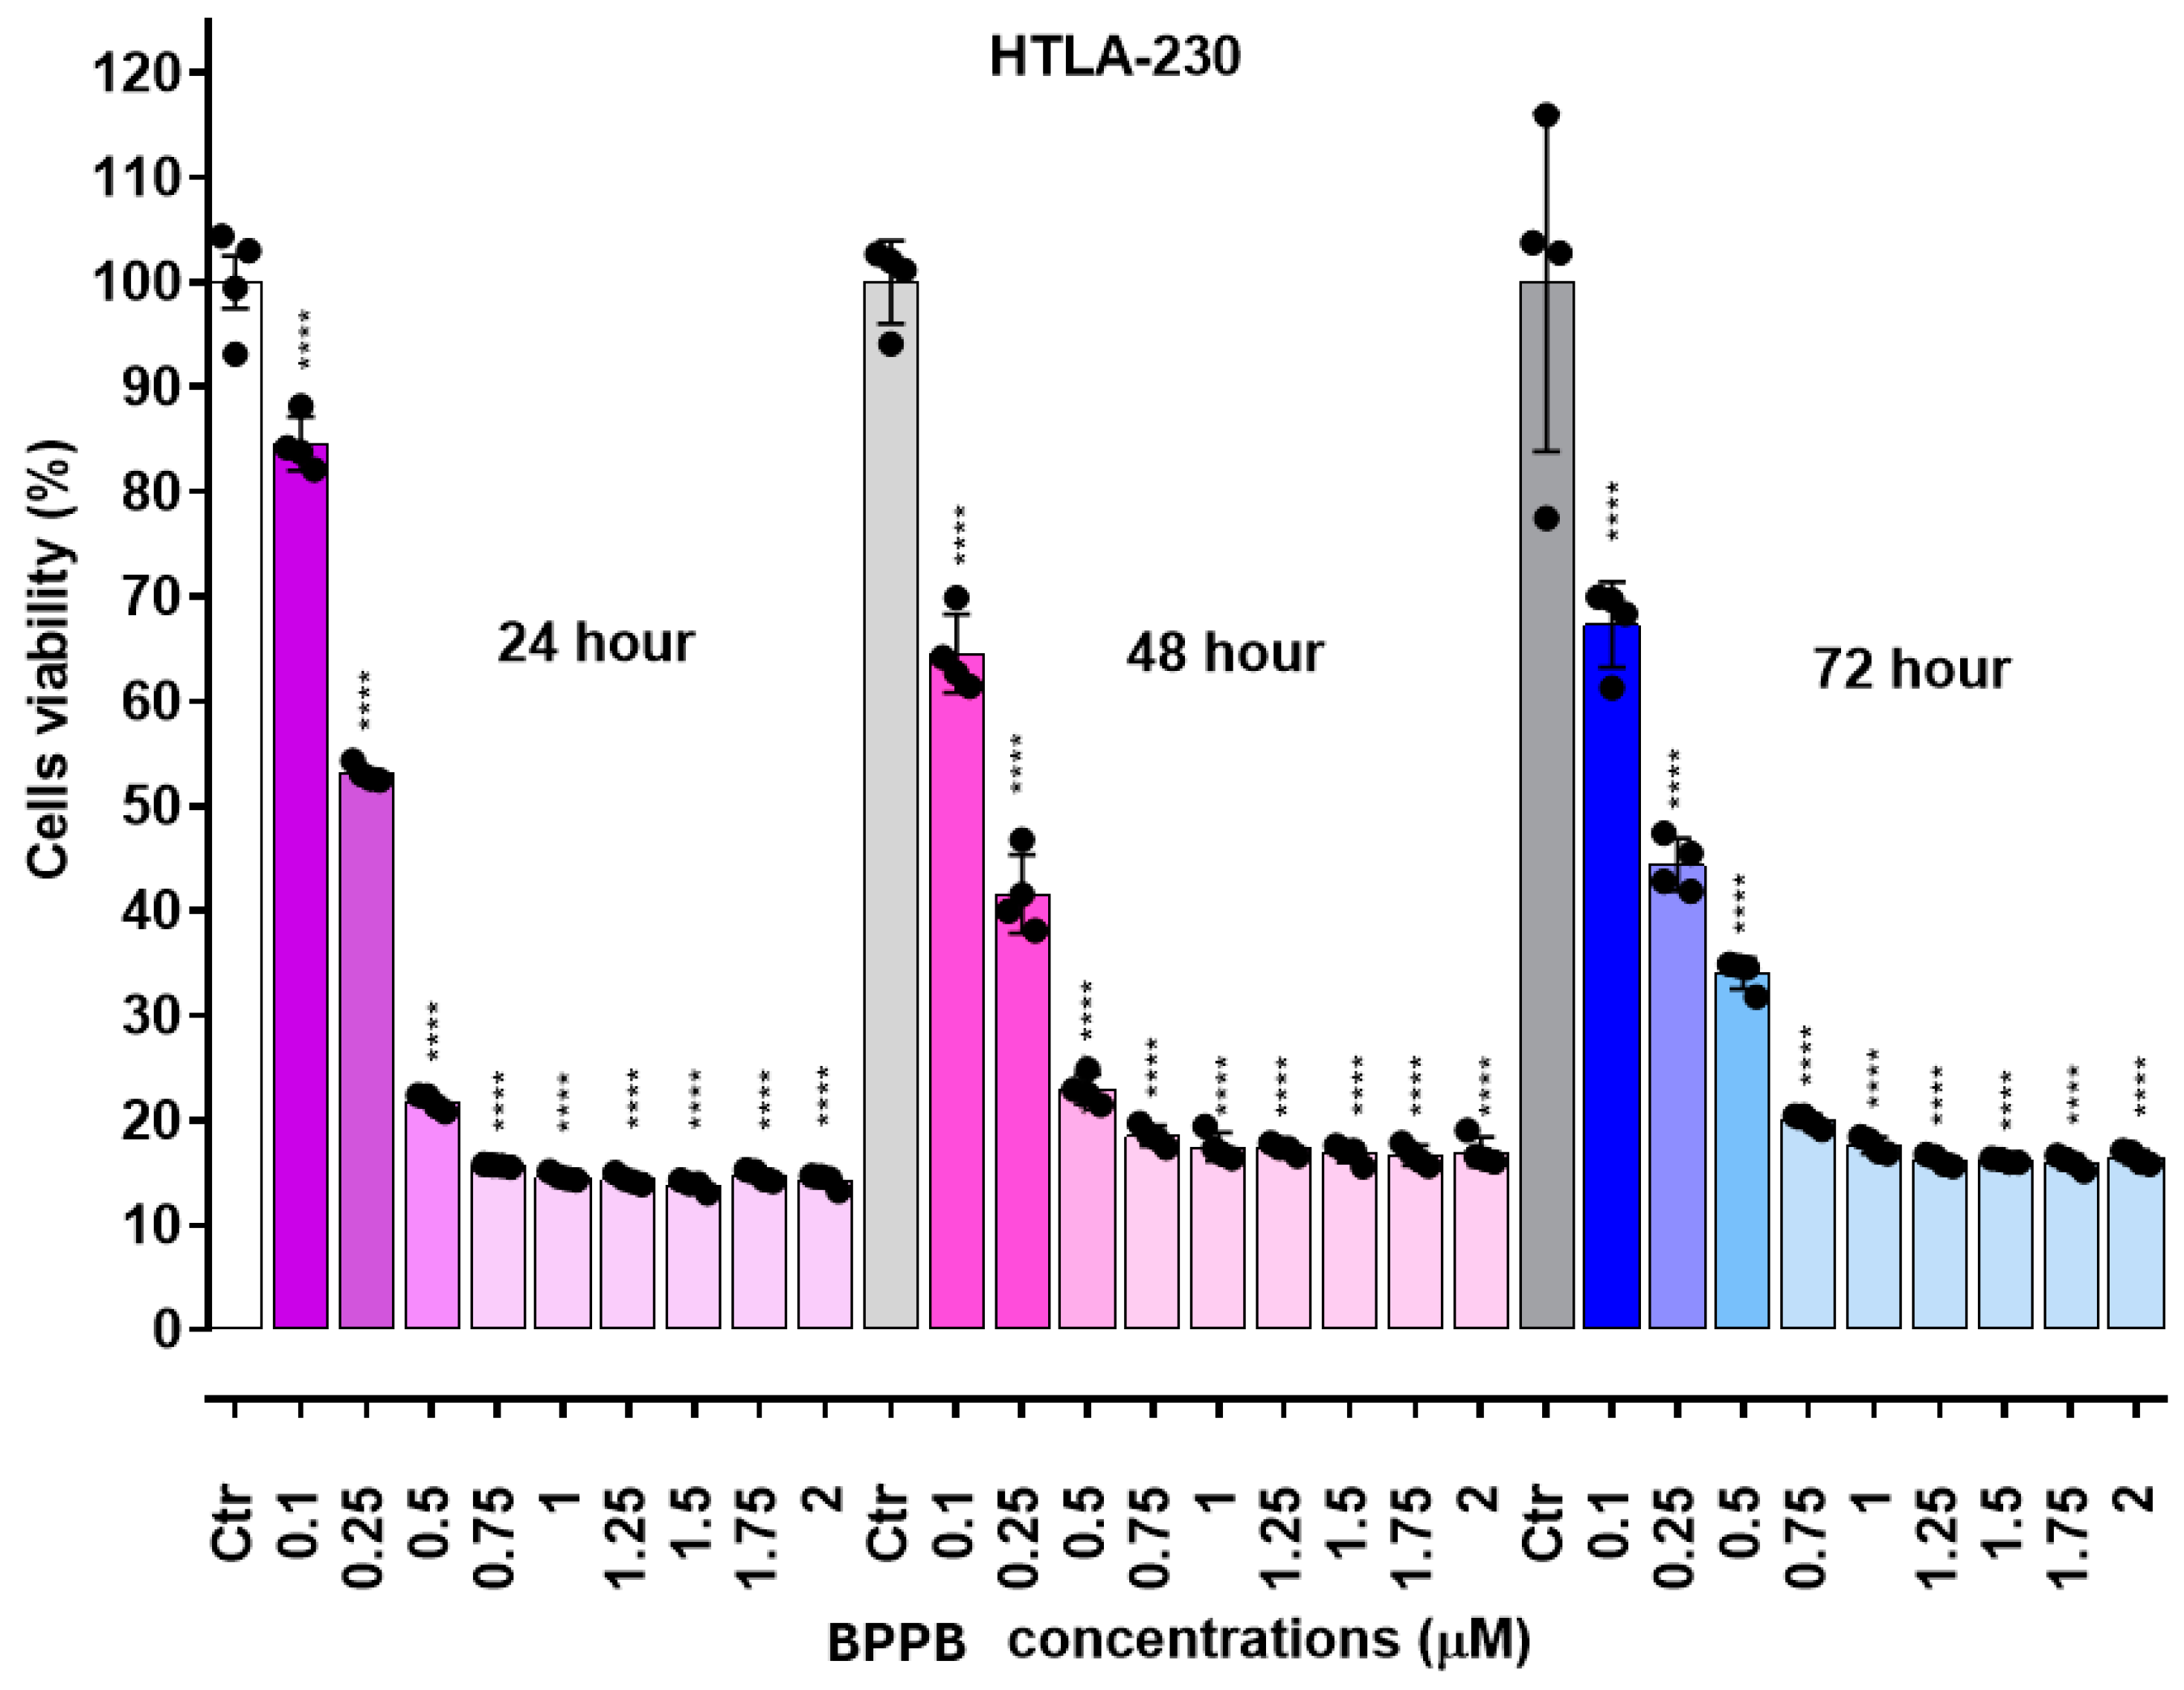
Figure 5.
Cell viability was evaluated in HTLA-ER cells exposed to increasing concentrations of BPPB (0.1–2 µM) for 24, 48 and 72 h. Bar graphs summarize quantitative data of the means ± S.D. of four independent experiments run in triplicate. Significance refers exclusively to control (Ctr). Specifically, p > 0.05 no symbols; * means p < 0.05, and **** means p < 0.0001 (two-way ANOVA followed by Tukey’s multi-comparisons test).
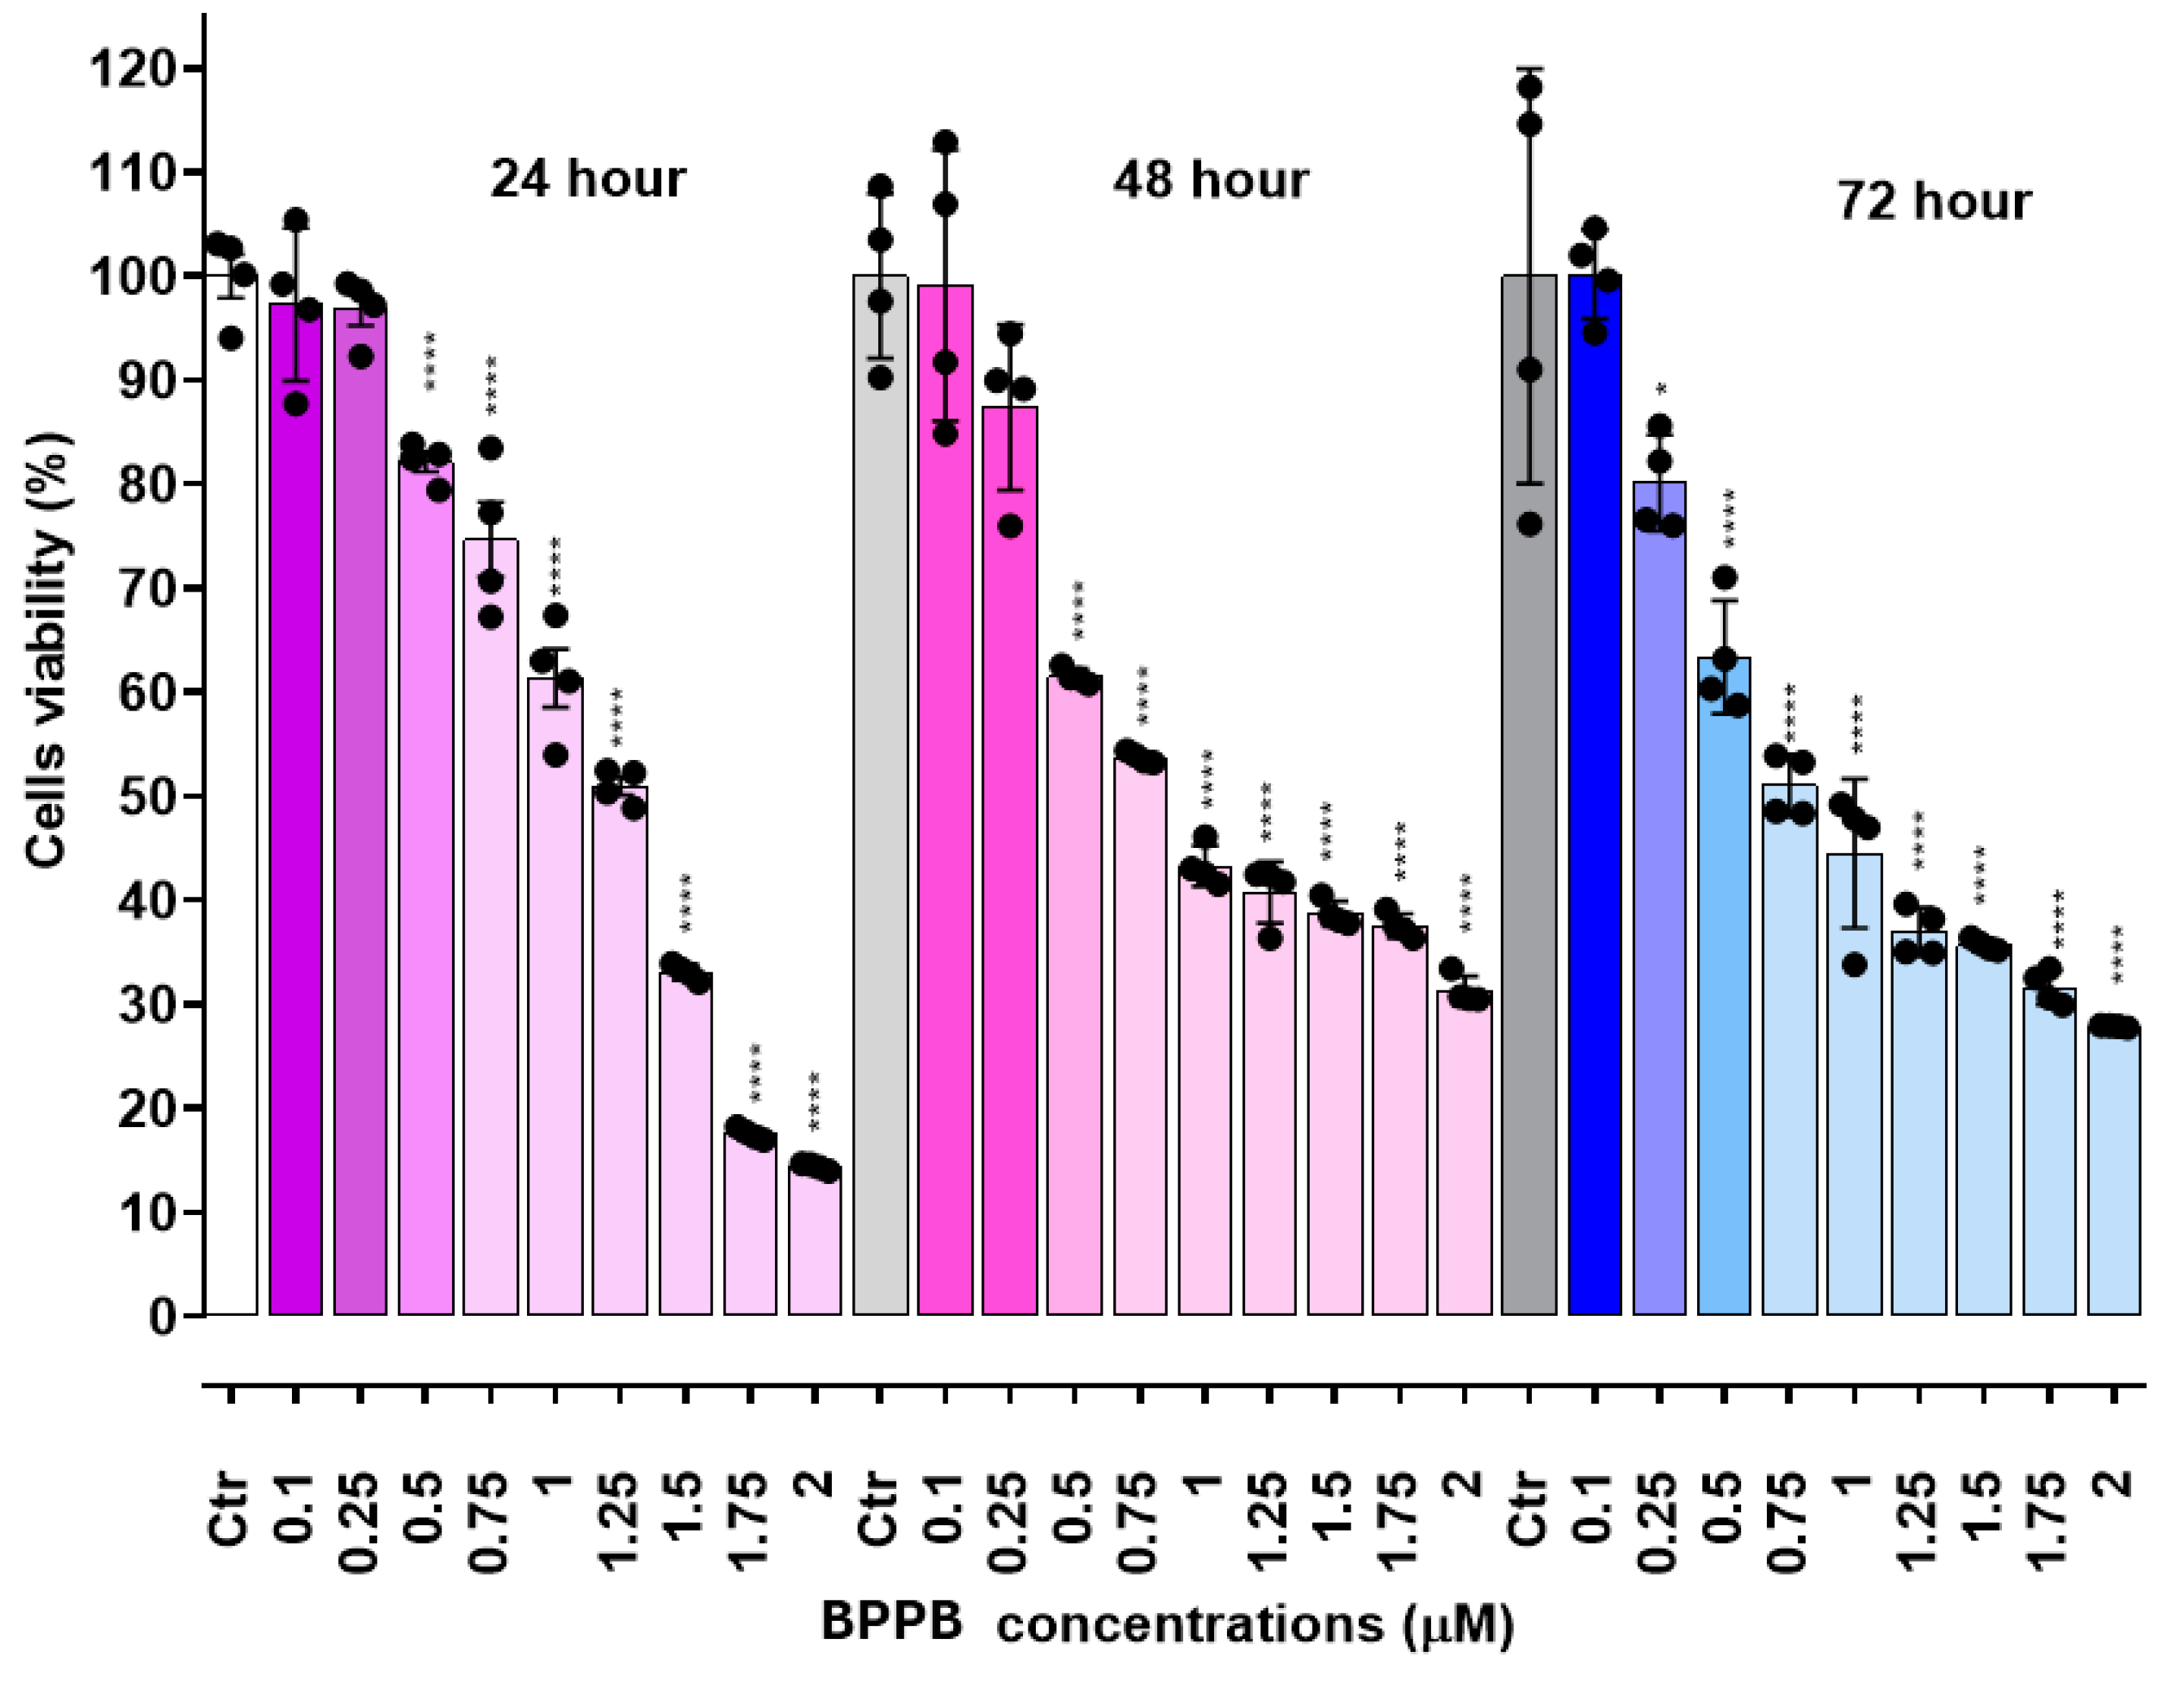
Figure 6.
Representative bright filed images of triplicate wells (A, B and C) of MRC-5 cultured cells at T0 (24 hours post-seeding, before treatments), at low (4 ×) and medium (10 ×) enlargements. White bars correspond to 62.5 and 25.0 μm for 4 × and 10 × enlargements, respectively.
Figure 6.
Representative bright filed images of triplicate wells (A, B and C) of MRC-5 cultured cells at T0 (24 hours post-seeding, before treatments), at low (4 ×) and medium (10 ×) enlargements. White bars correspond to 62.5 and 25.0 μm for 4 × and 10 × enlargements, respectively.
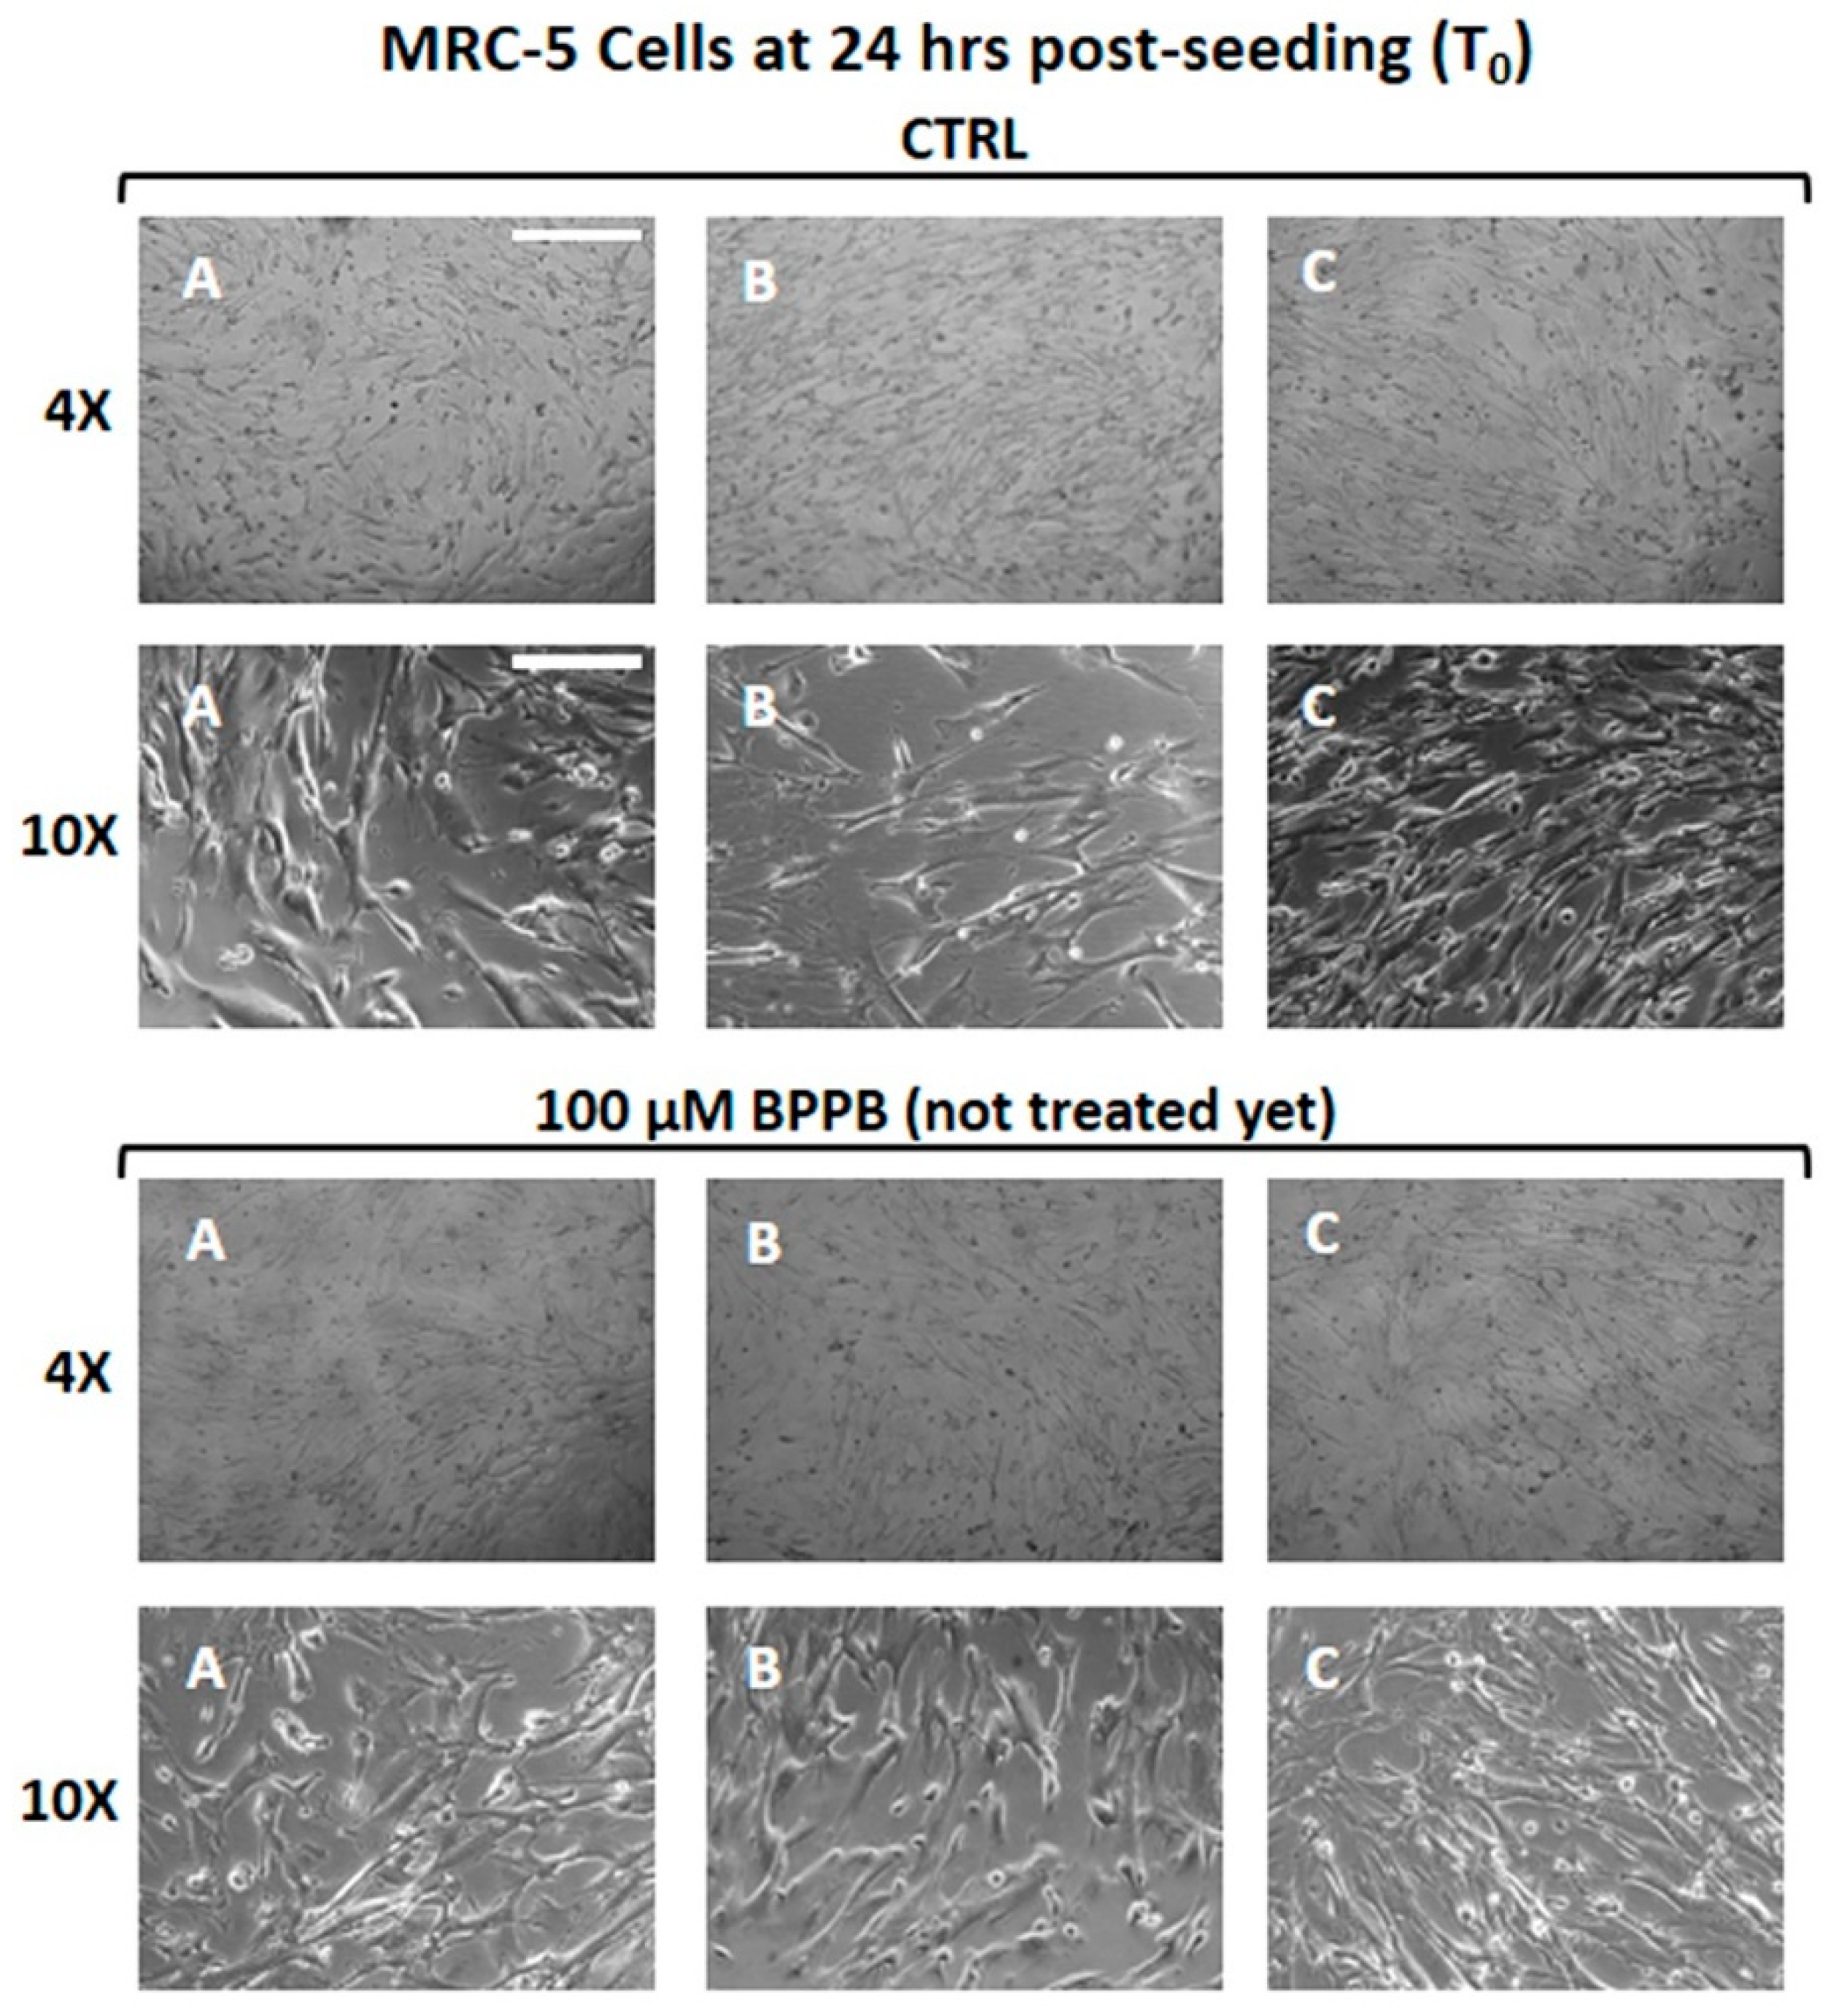
Figure 7.
Cell viability was evaluated in MRC-5 cells exposed to increasing concentrations of BPPB (0.0 (CTRL)–5 µM) for 24, 48 and 72 hours. Bar graphs summarize quantitative data of the means ± S.D. of at least two independent experiments run in triplicate. Significance refers exclusively to control (CTRL), at time zero (T0). Specifically, p > 0.05 no symbols; and ** means 0.001 < p < 0.01, *** p < 0.001 (two-way ANOVA followed by Tukey’s multi-comparisons test).
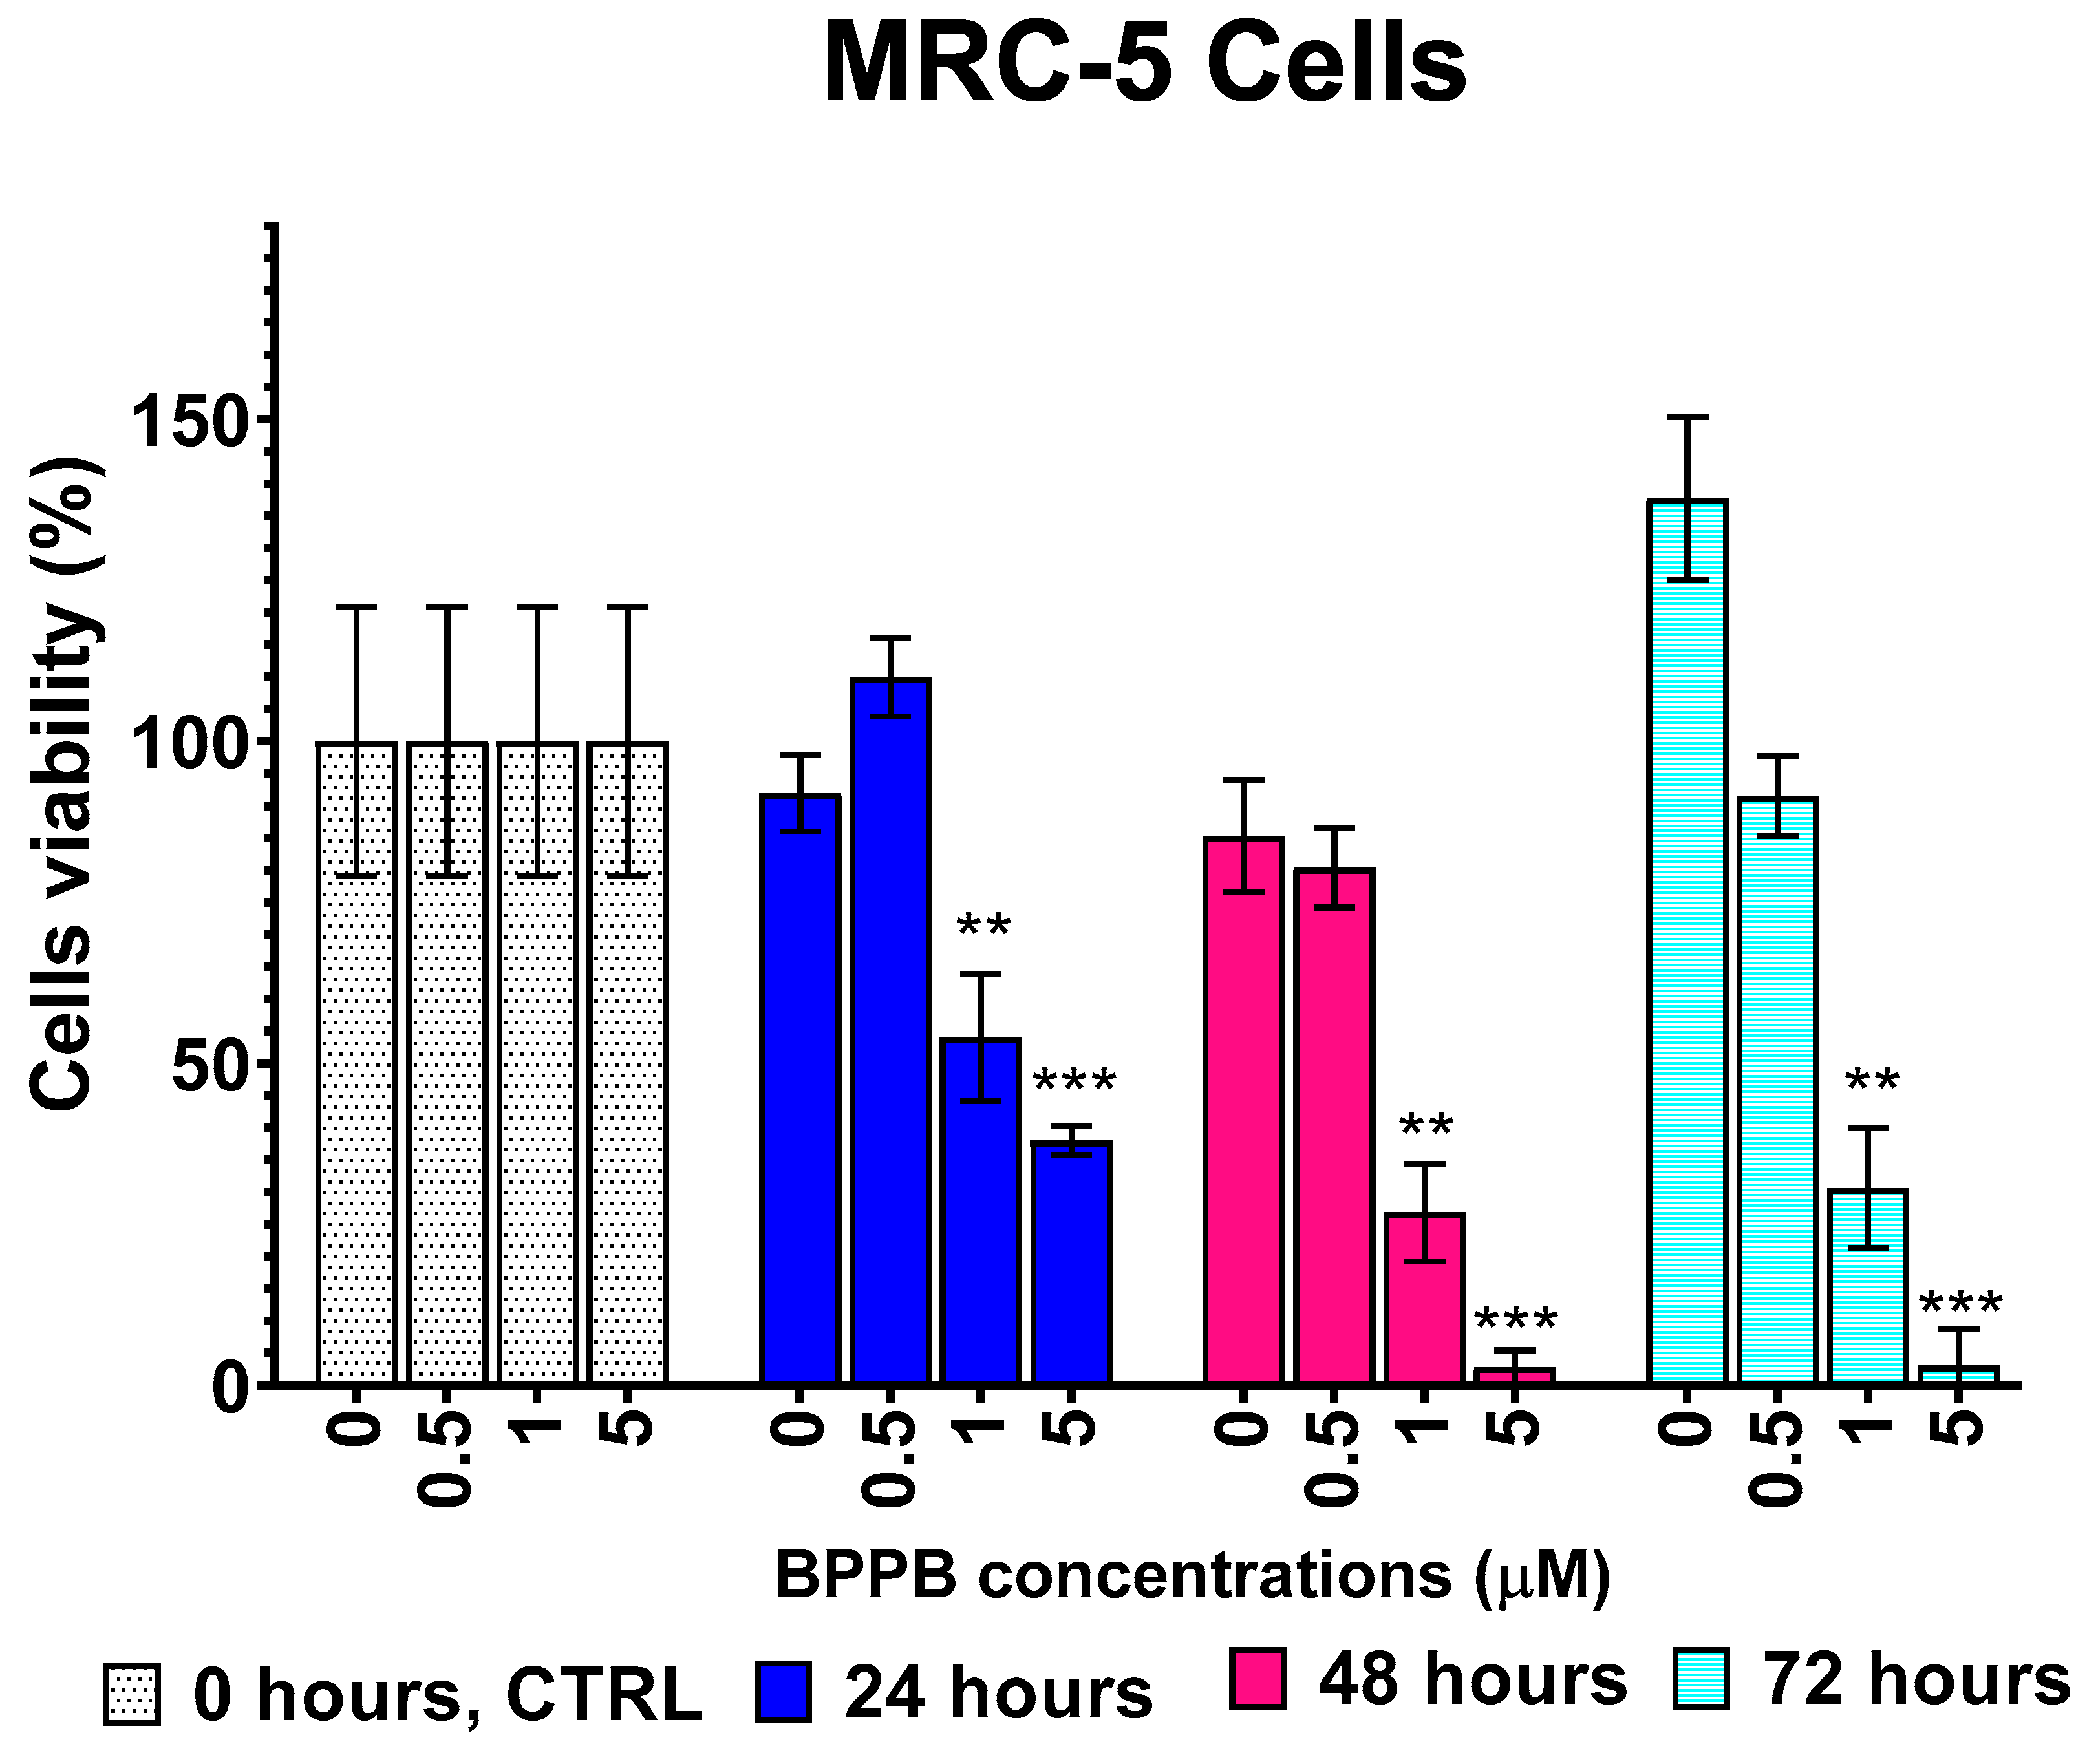
Figure 8.
Growth inhibition and cytotoxic effects of BPPB on Cos-7 and HepG2 cells. Cos-7 and HepG2 cells were seeded on 96-multiwell plates and treated for 24h with different concentrations (0.4-85.3 µM) of BPPB. Growth inhibition was determined by MTT assay (a-b). The bar graph shows the cell viability (%) of untreated Cos-7 (a) and HepG2 (b) control cells (CTRL), and after exposure to increasing concentrations (0.4-85.3 µM) of BPPB for 24h. Data are expressed as the mean ± S.E.M. of the survival percentage obtained from n = 6-14 independent experiments run in triplicate. Significance is indicated as ** p < 0.005 and **** p < 0.0001 vs. CTRL (one-way ANOVA followed by Tukey’s multi-comparisons test). Cell cytotoxicity was determined by LDH assay (c-d). The bar graph shows the quantification of cell damage (expressed as optical density units of absorbance) of Cos-7 (c) and HepG2 (d) cells untreated (CTRL), and after exposure to increasing concentrations (0.4-85.3 µM) of bis-phosphonium bromide for 24h. Data are expressed as the mean ± S.E.M. of the cell cytotoxicity (OD units recorded, in kinetic mode, after 10 minutes of LDH reaction), obtained from n = 6-14 independent experiments run in triplicate. Significance is indicated as **** p < 0.0001 vs. CTRL (one-way ANOVA followed by Tukey’s multi-comparisons test).
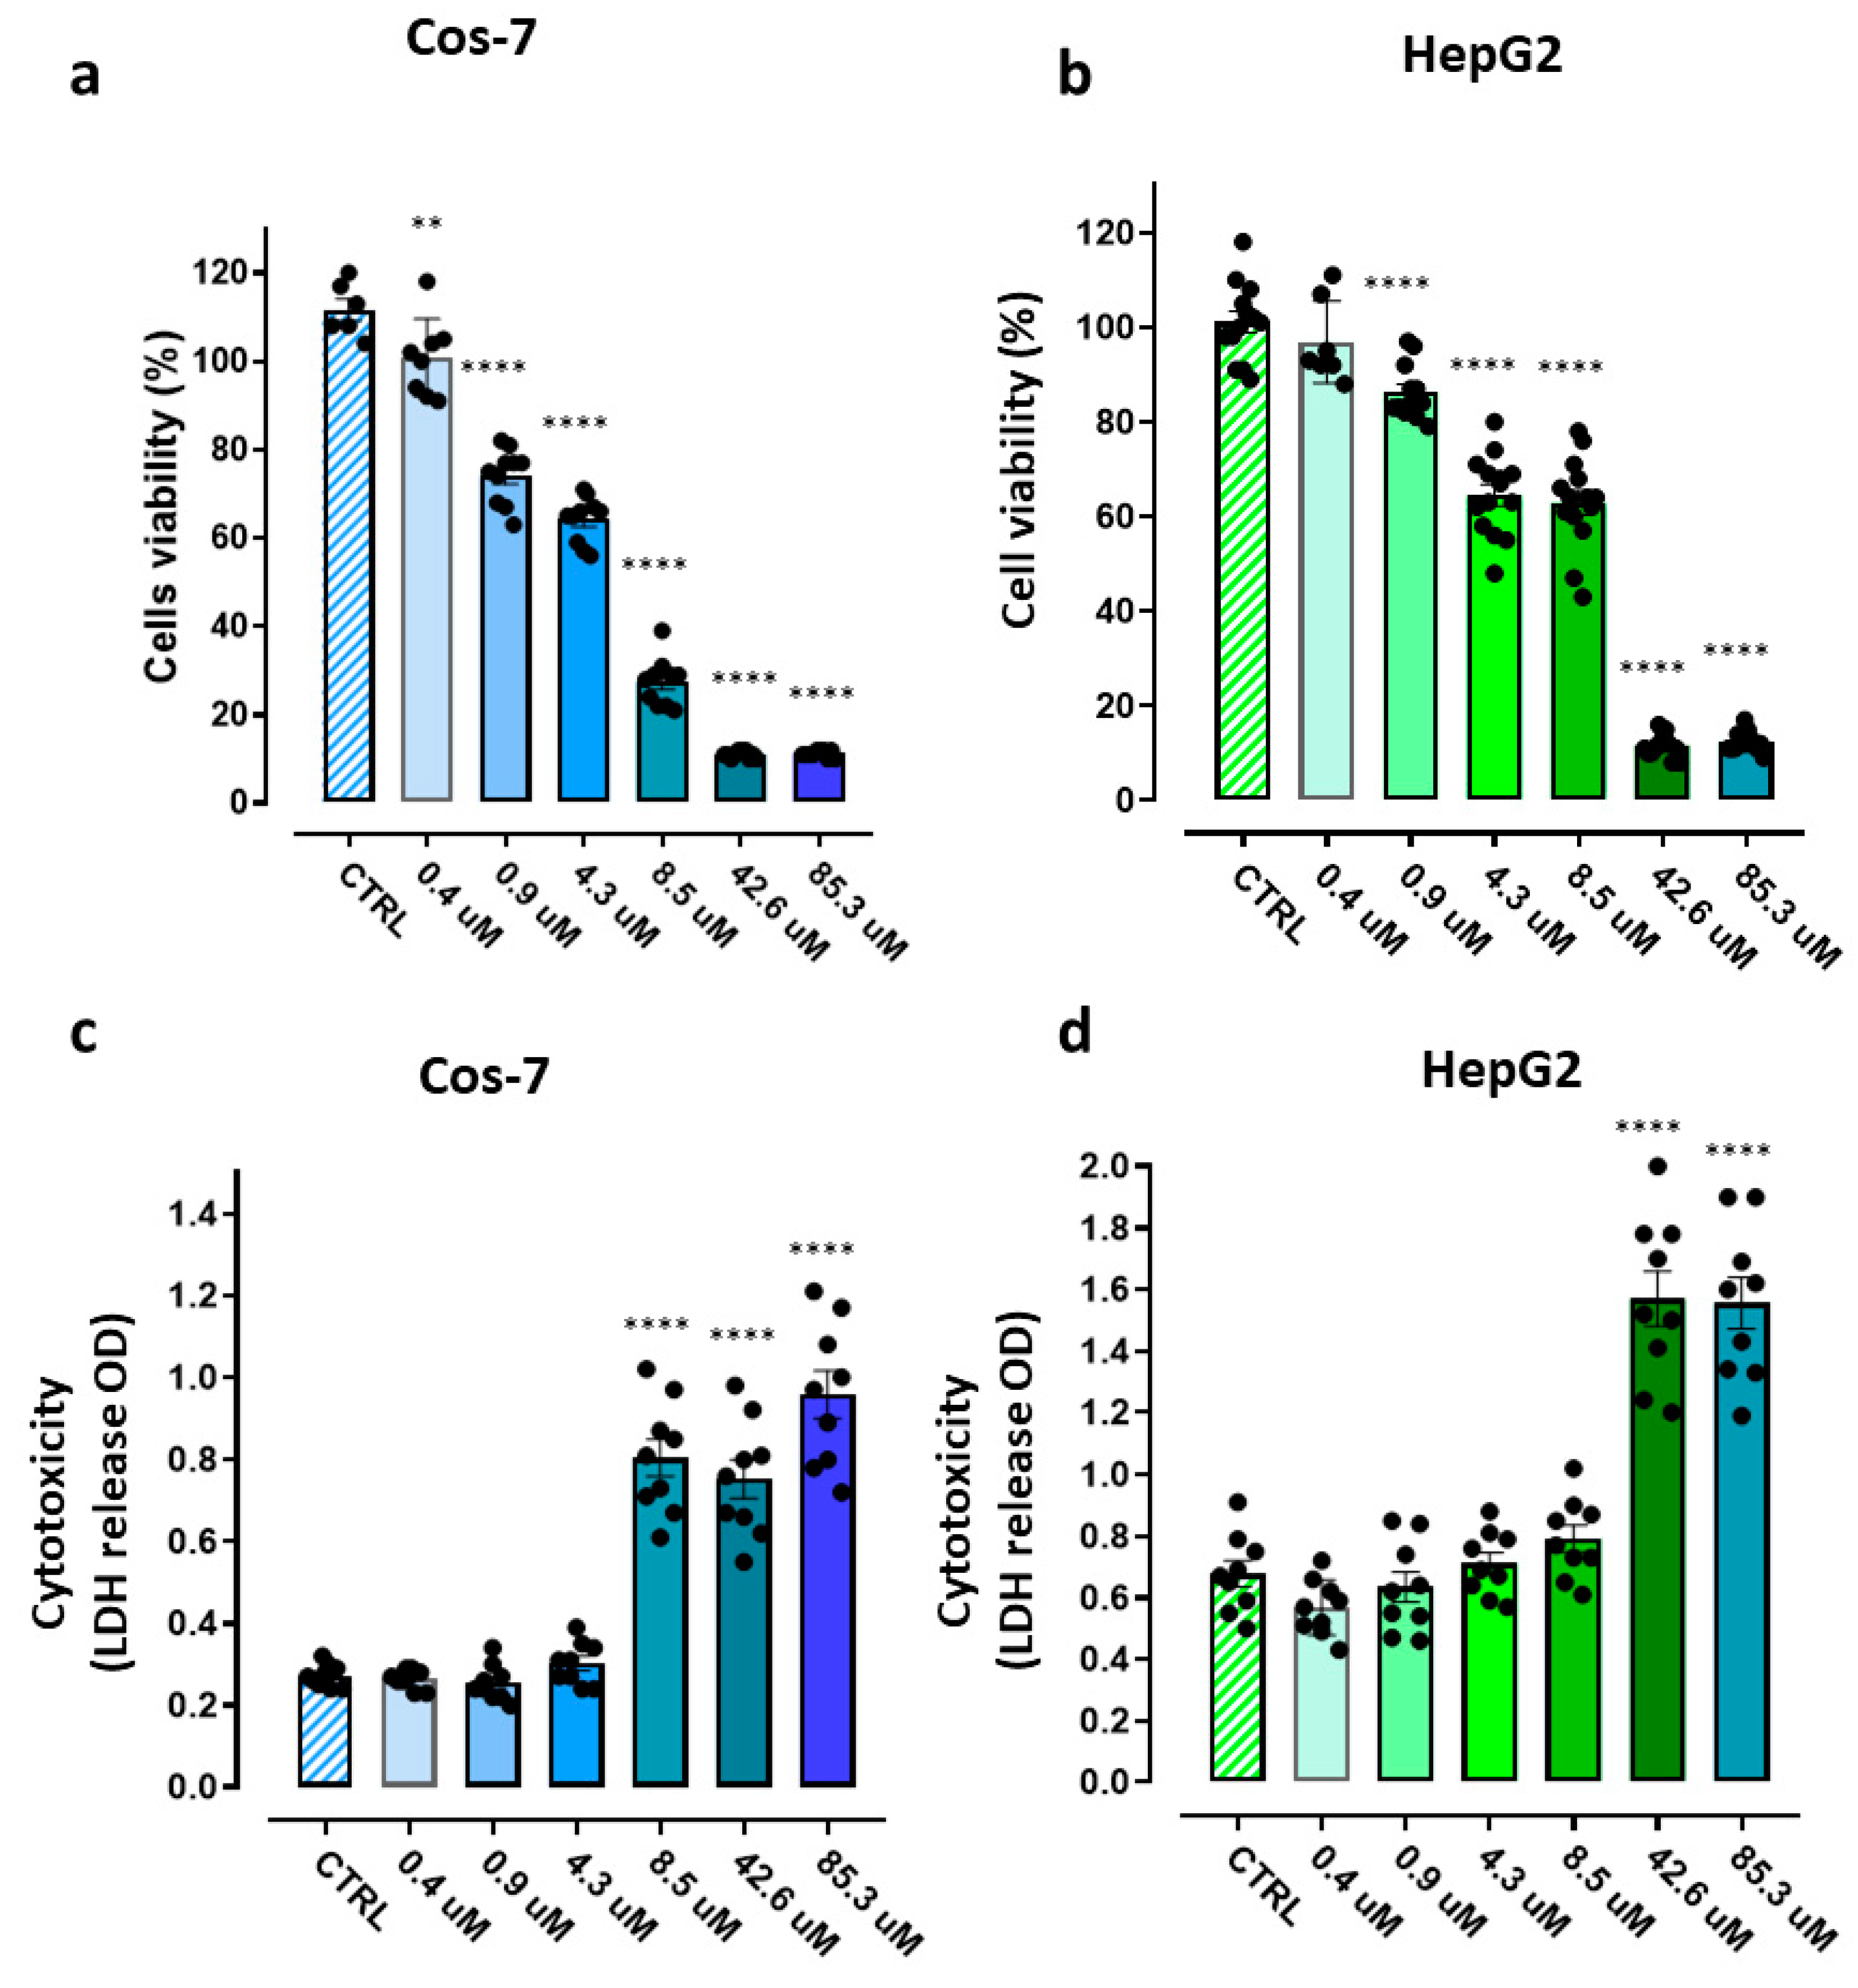
Figure 9.
Hemolytic ratio percentage (%) determined by a recently reported protocol slightly modified [54]. The bar graph shows the hemolytic ratio percentage (%) in untreated RBCs (CTRL), and after exposure to increasing concentrations (0.1-50.0 µM) of BPPB. Data are expressed as the mean ± S.D. of the data obtained on blood from four healthy donors. Significance is indicated exclusively s. control (CTRL) as follows: no symbols p > 0.05 and **** p < 0.0001 (one-way ANOVA followed by Tukey’s multi-comparisons test).
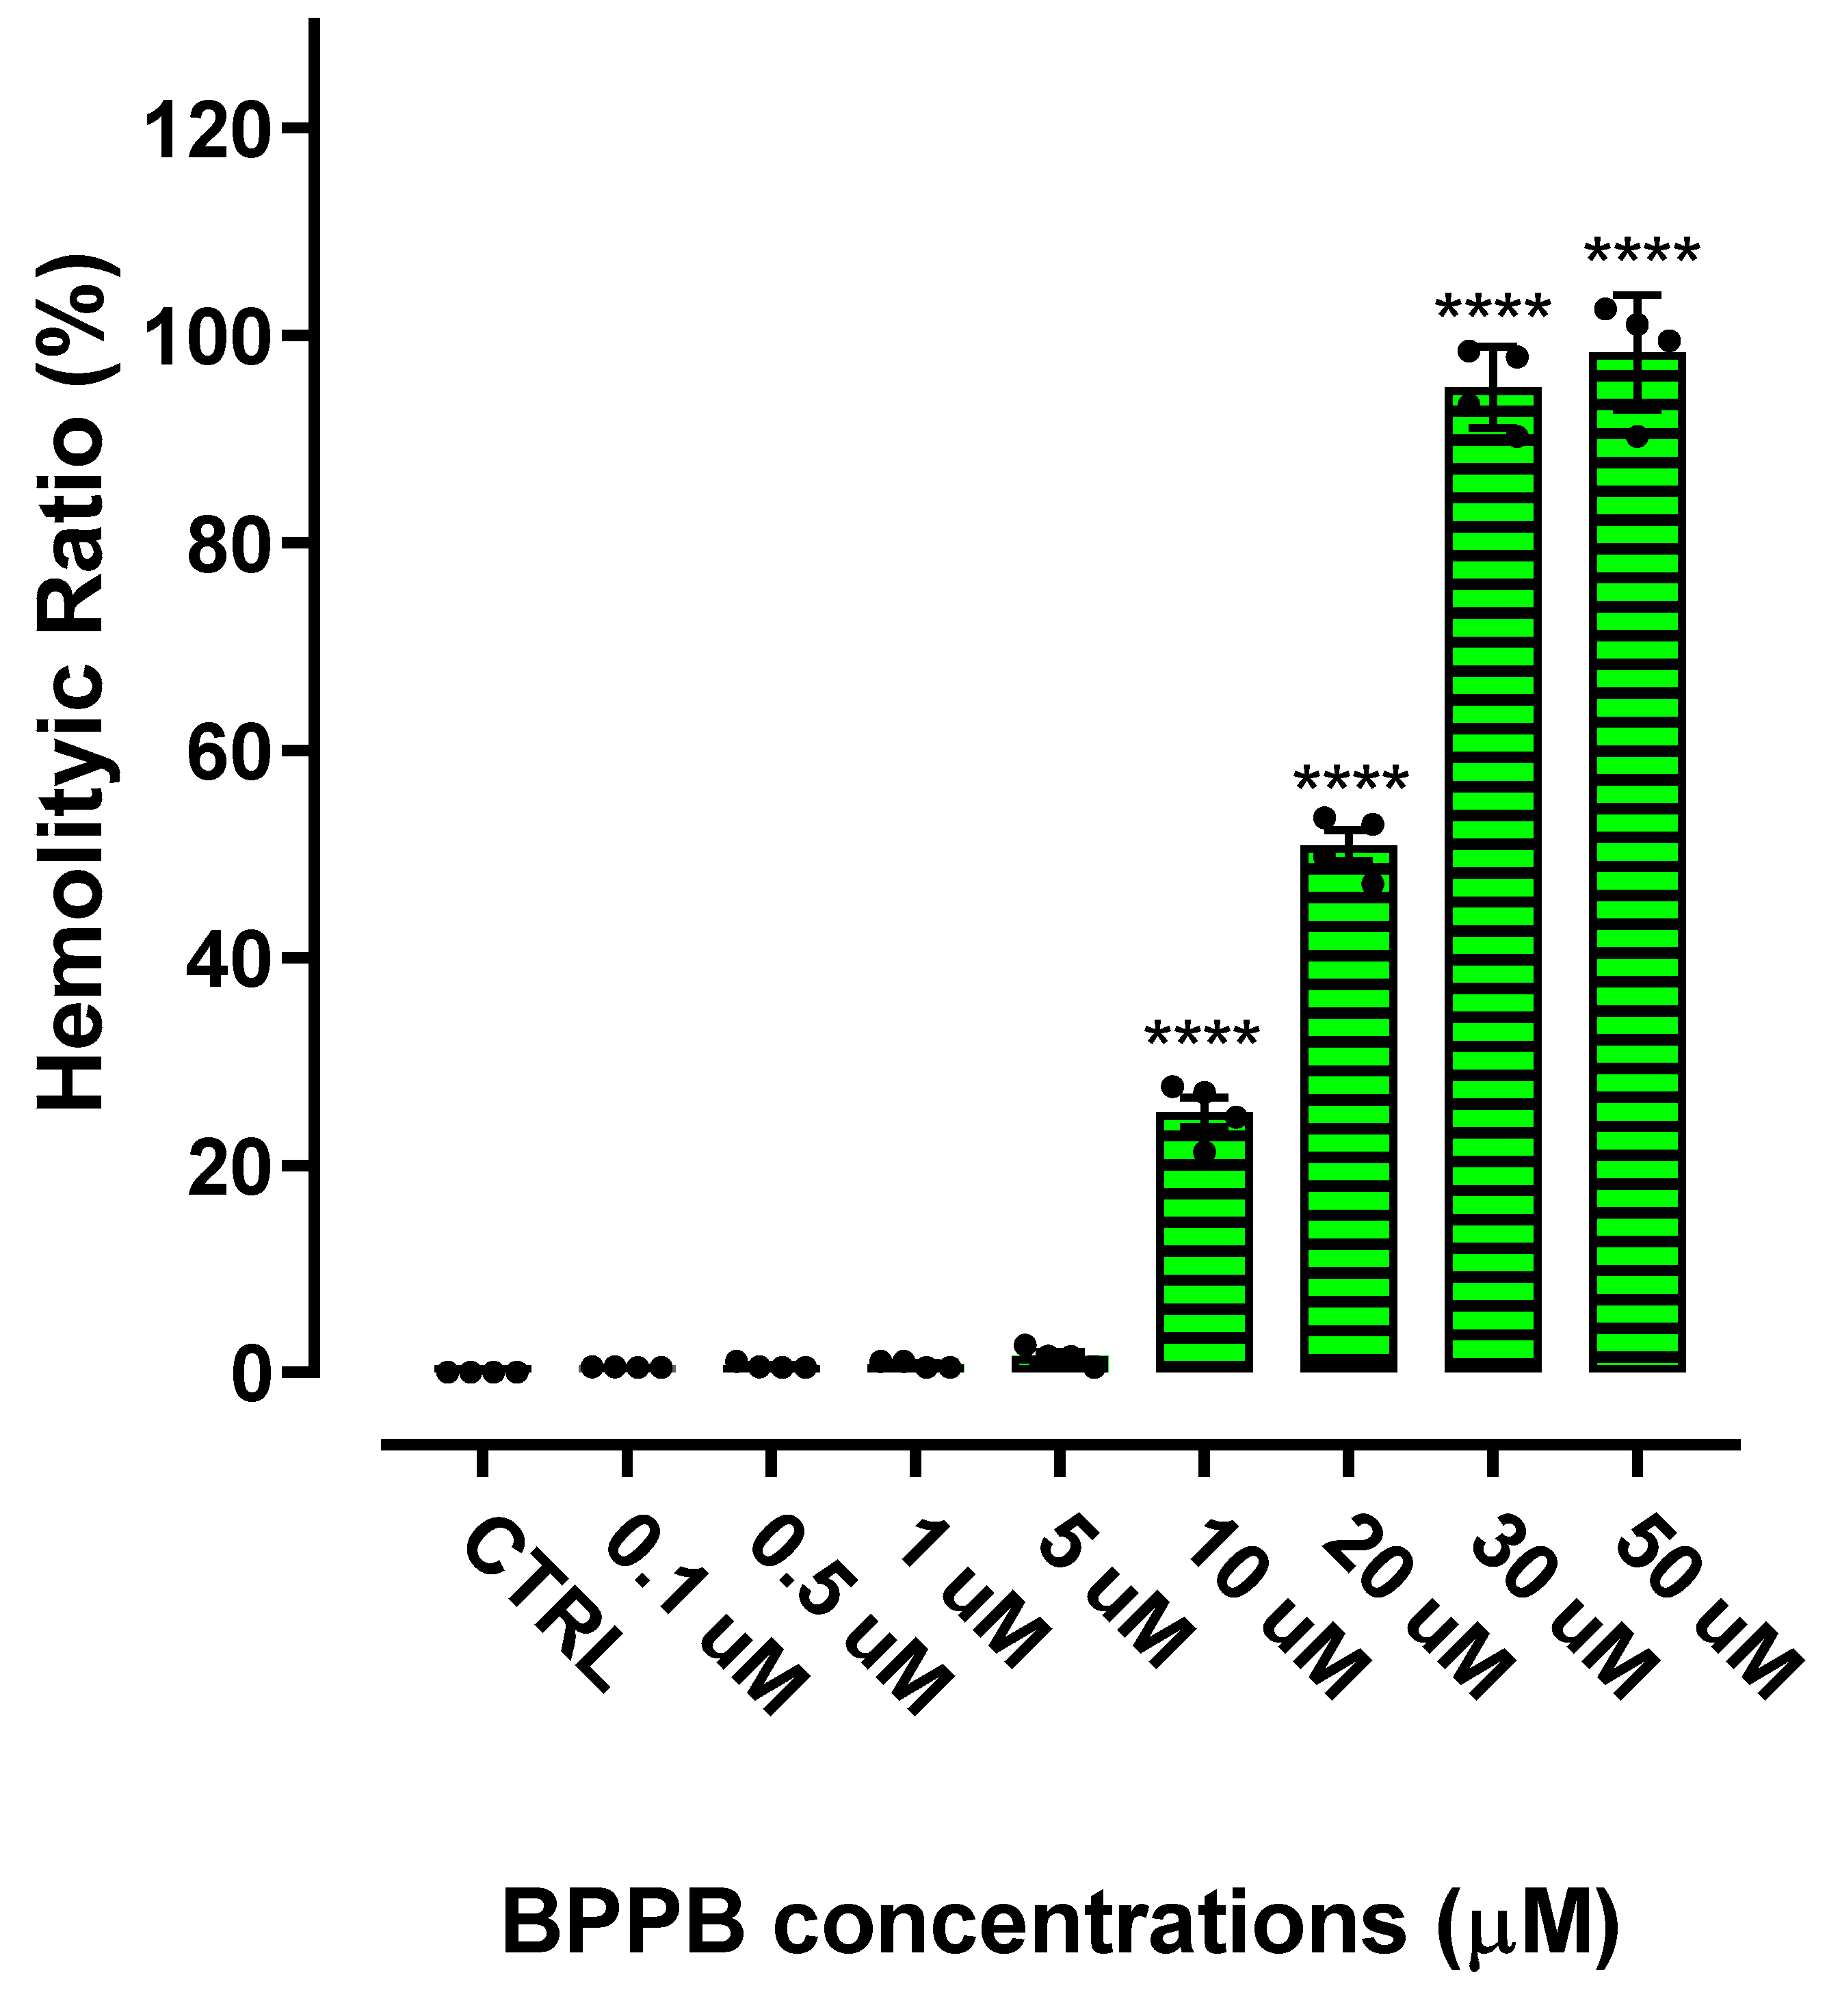
Figure 10.
Cell viability of HTLA-230, HTLA-ER and red blood cells (RBCs) exposed to increasing concentrations of BPPB (0.5–50 µM) for 24 h (NB cells) or for the time of the experiment as for protocol [54]. Bar graphs summarize quantitative data of the means ± S.D. of four independent experiments run in triplicate (NB cells) or of data from evaluations on blood from four healthy donors. Significance refers to control (Ctr) (*) and/or to RBCs (°). Specifically, p > 0.05 no symbols; (°) means p < 0.05, (°°°) means p < 0.001 and (°°°°) means p < 0.0001, **** means p < 0.0001 (two-way ANOVA followed by Tukey’s multi-comparisons test).
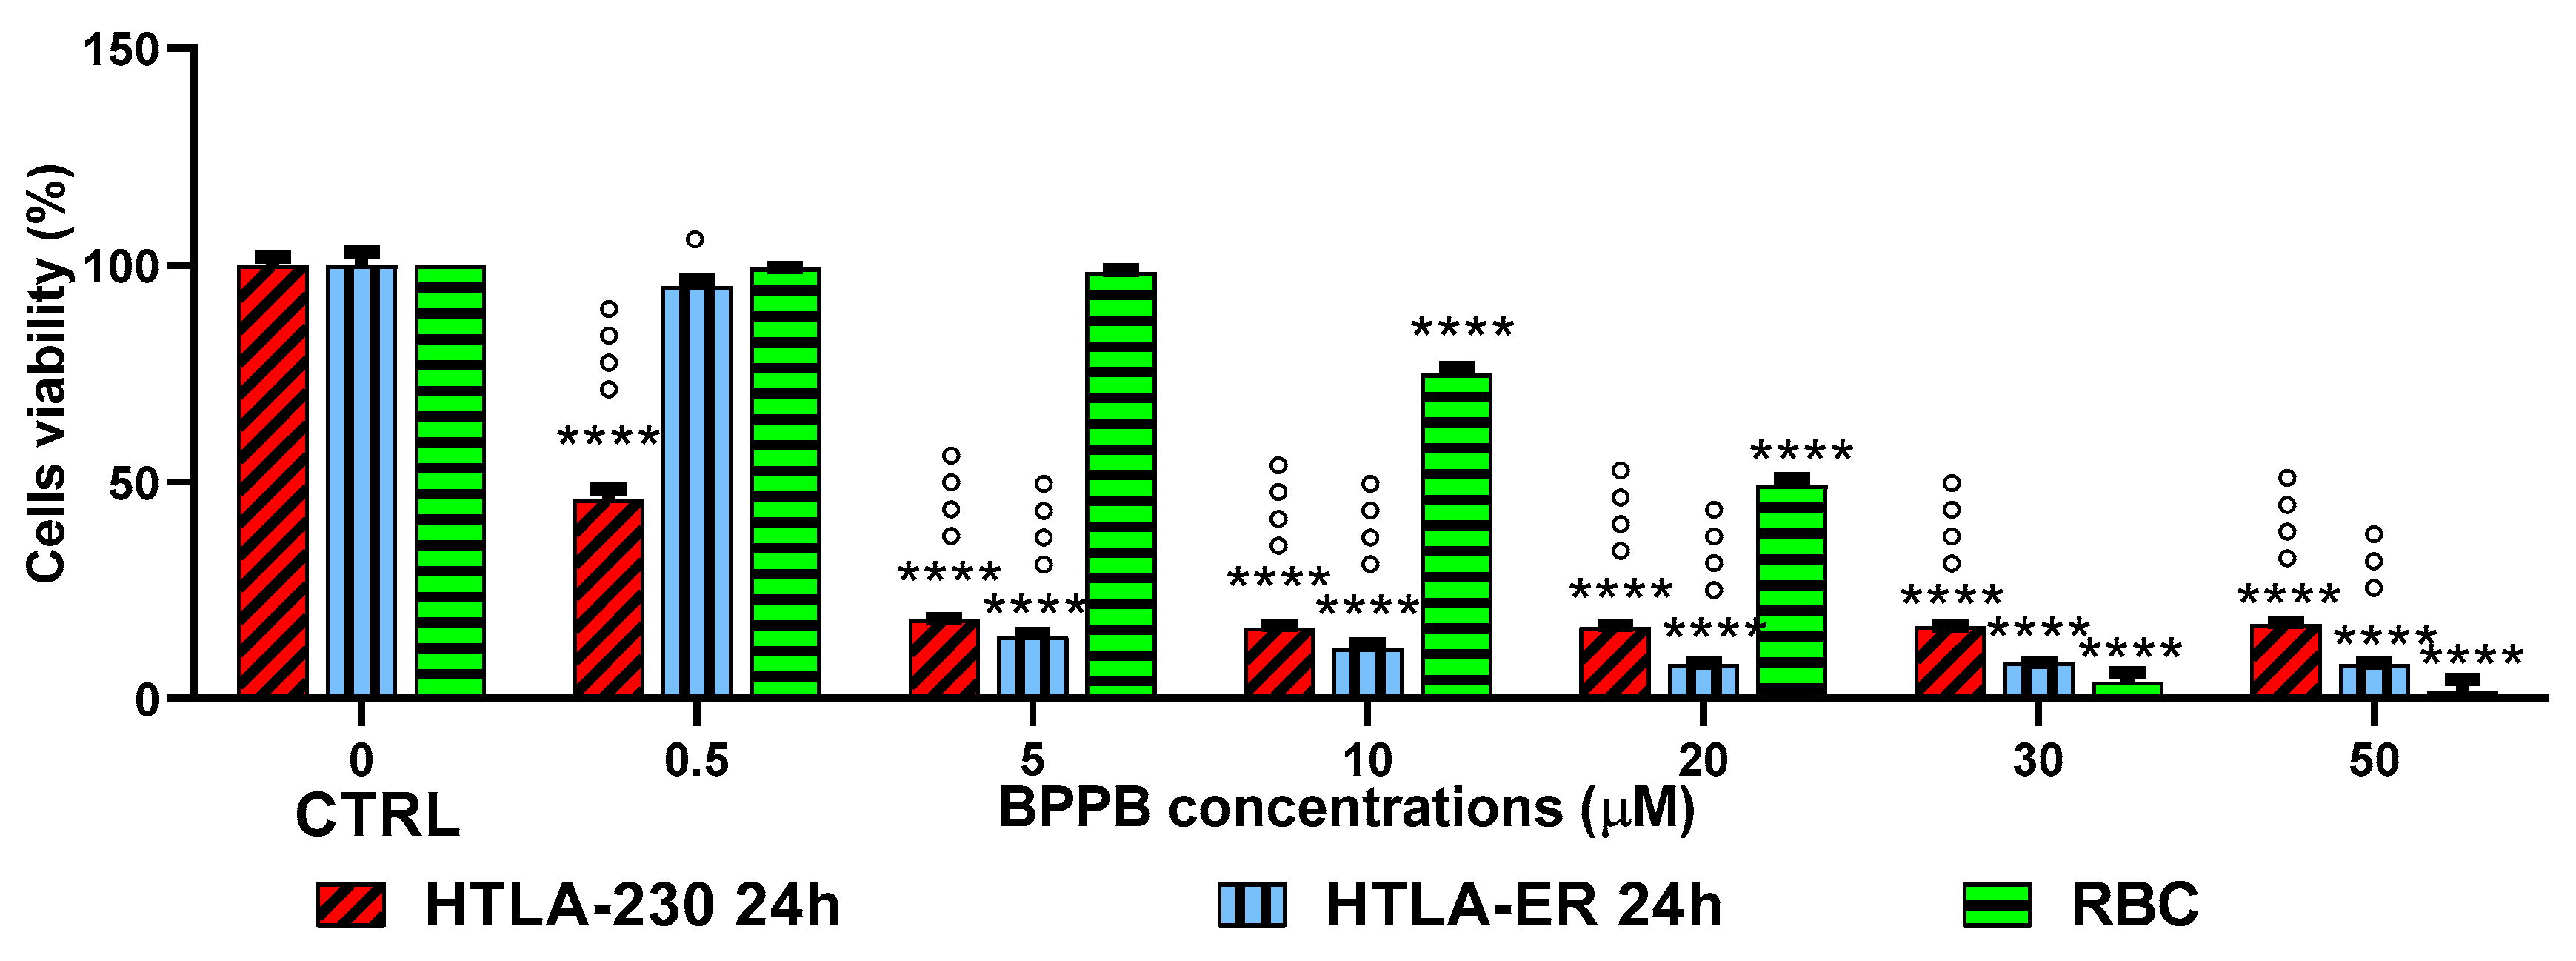
Figure 11.
Selectivity indices (SIs) towards HTLA-230 and HTLA-ER NB cells in relation to their toxic effects on MRC-5, Cos-7 and HepG2 cells. Concerning not immortalized human fibroblast MRC-5, the SIs were provided at both 24-, 48-, and 72-hours treatments.
Figure 11.
Selectivity indices (SIs) towards HTLA-230 and HTLA-ER NB cells in relation to their toxic effects on MRC-5, Cos-7 and HepG2 cells. Concerning not immortalized human fibroblast MRC-5, the SIs were provided at both 24-, 48-, and 72-hours treatments.
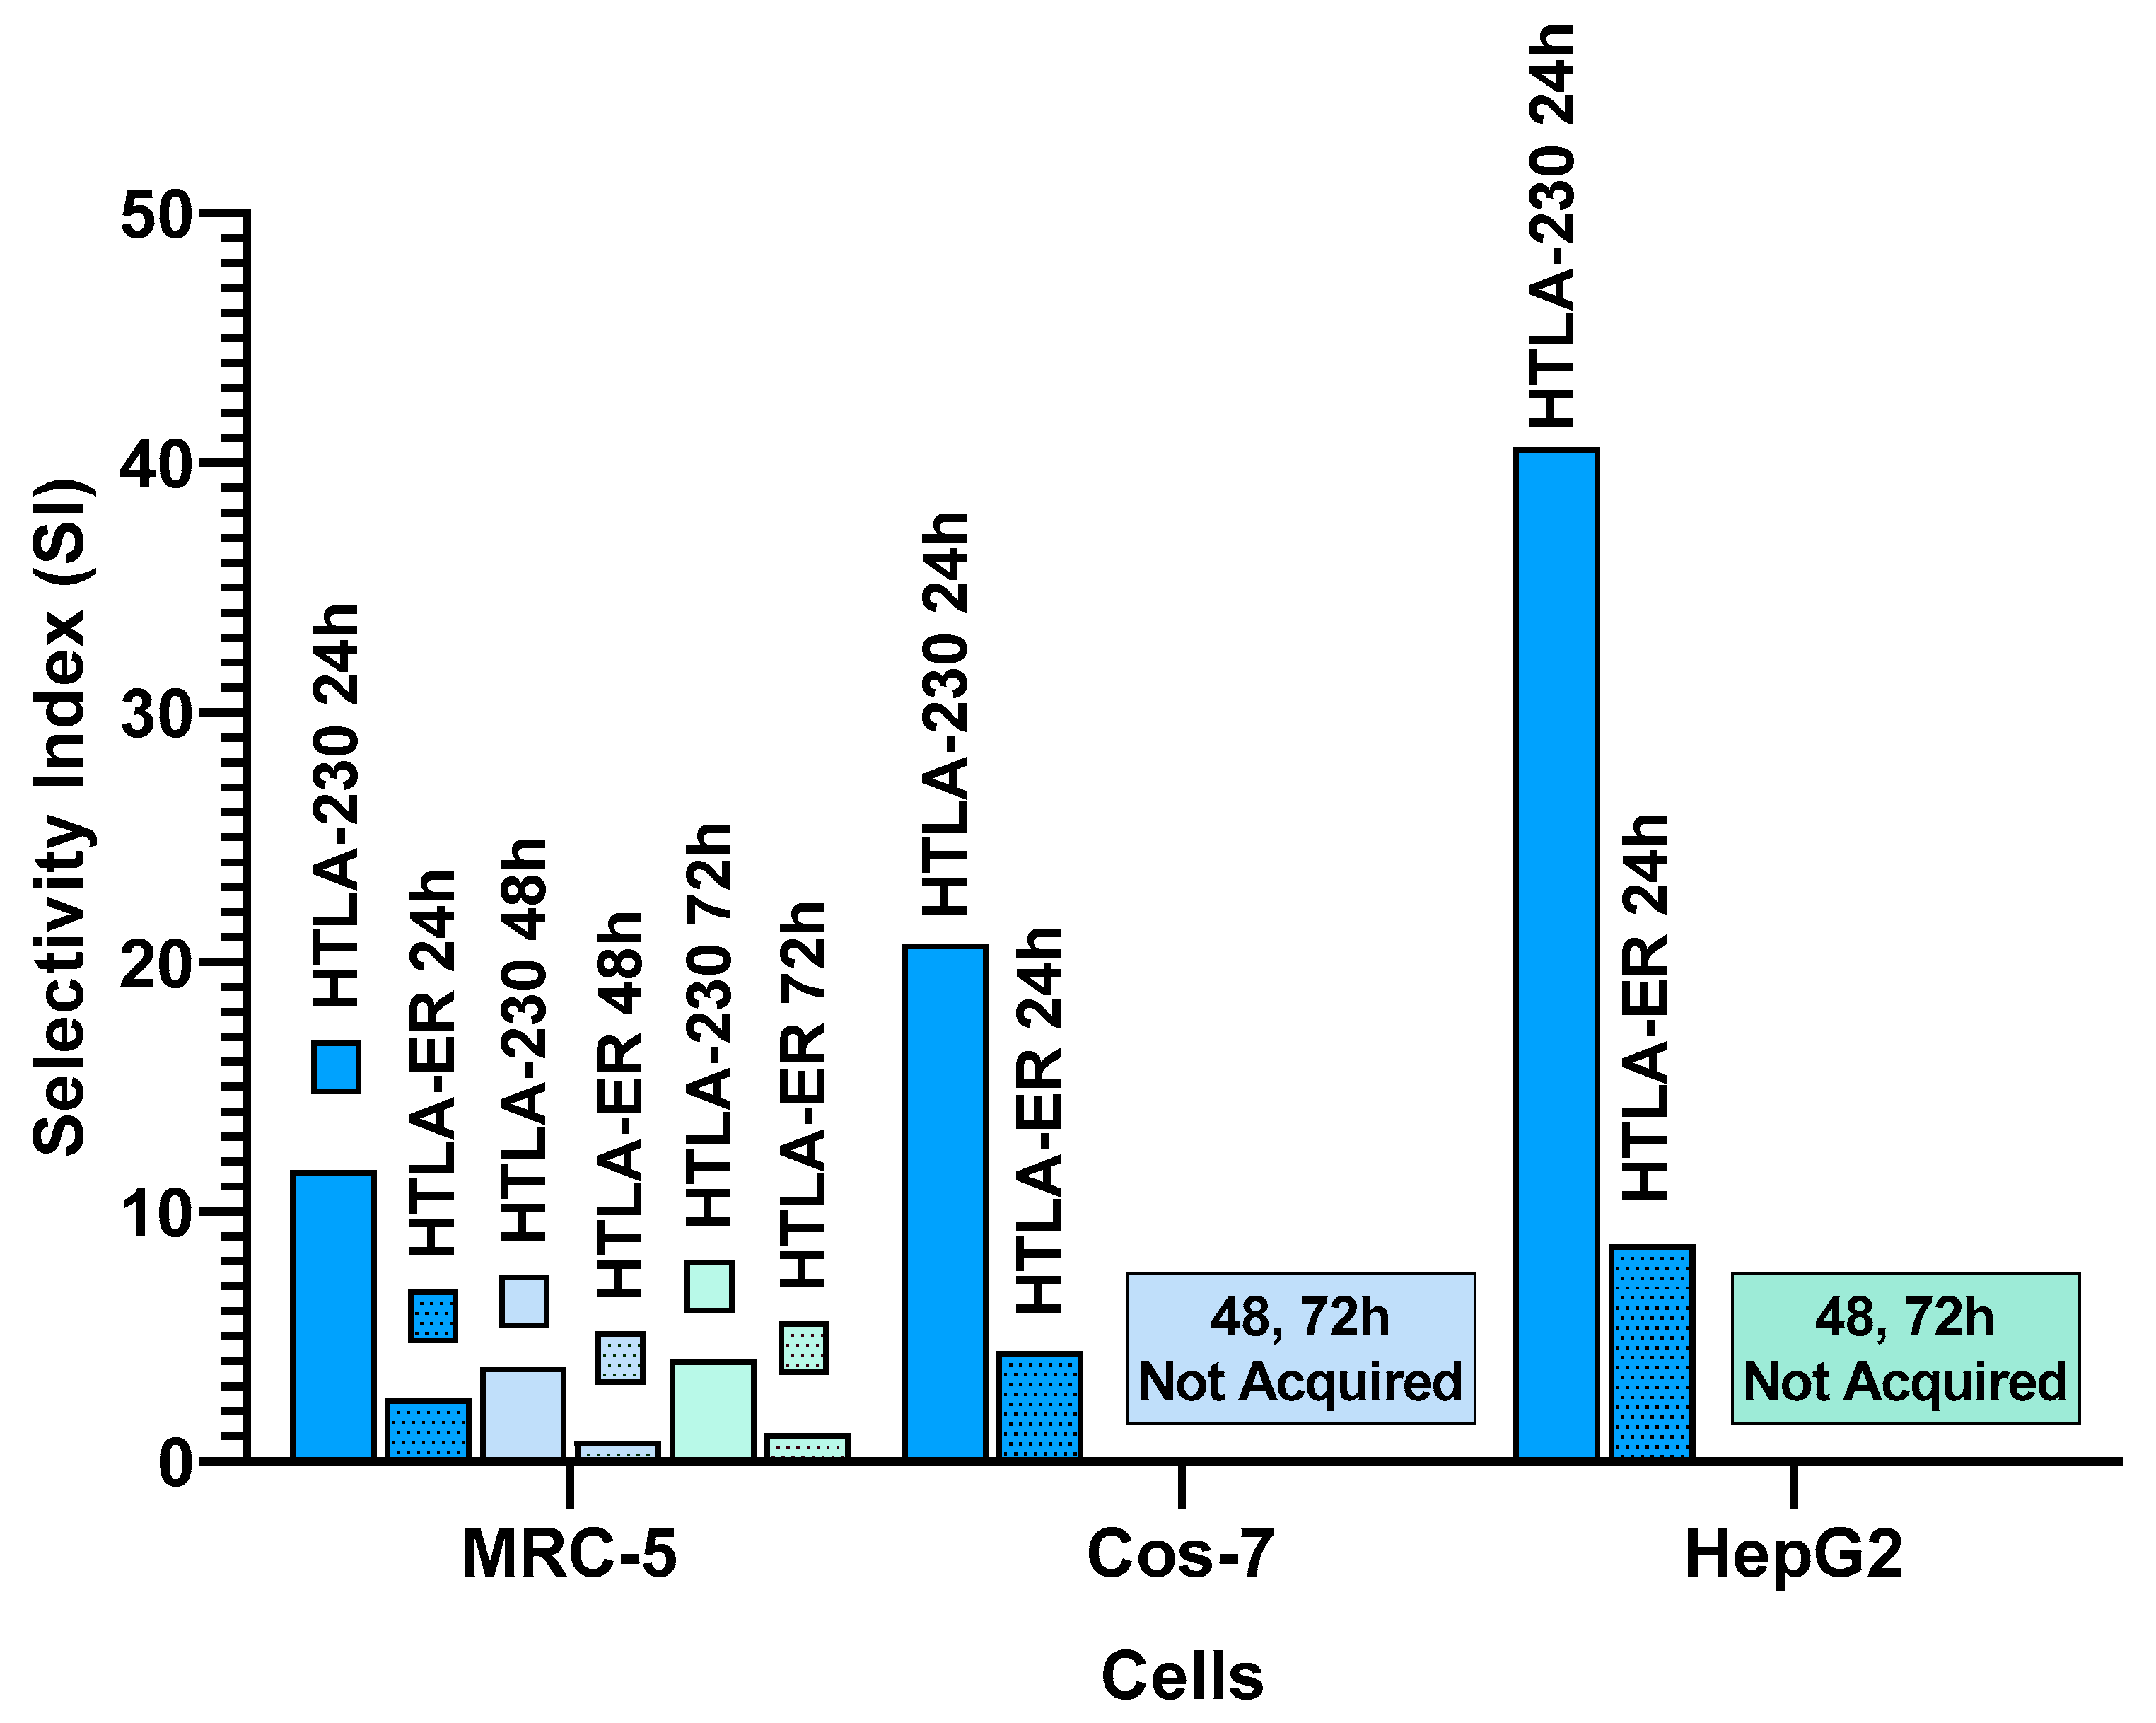
Figure 12.
Selectivity indices (SIs) of BPPB towards HTLA-230 and HTLA-ER NB cells in relation to their hemolytic effects on RBCs. Data of IC50 for NB cells were those obtained at 24-hours treatments.
Figure 12.
Selectivity indices (SIs) of BPPB towards HTLA-230 and HTLA-ER NB cells in relation to their hemolytic effects on RBCs. Data of IC50 for NB cells were those obtained at 24-hours treatments.
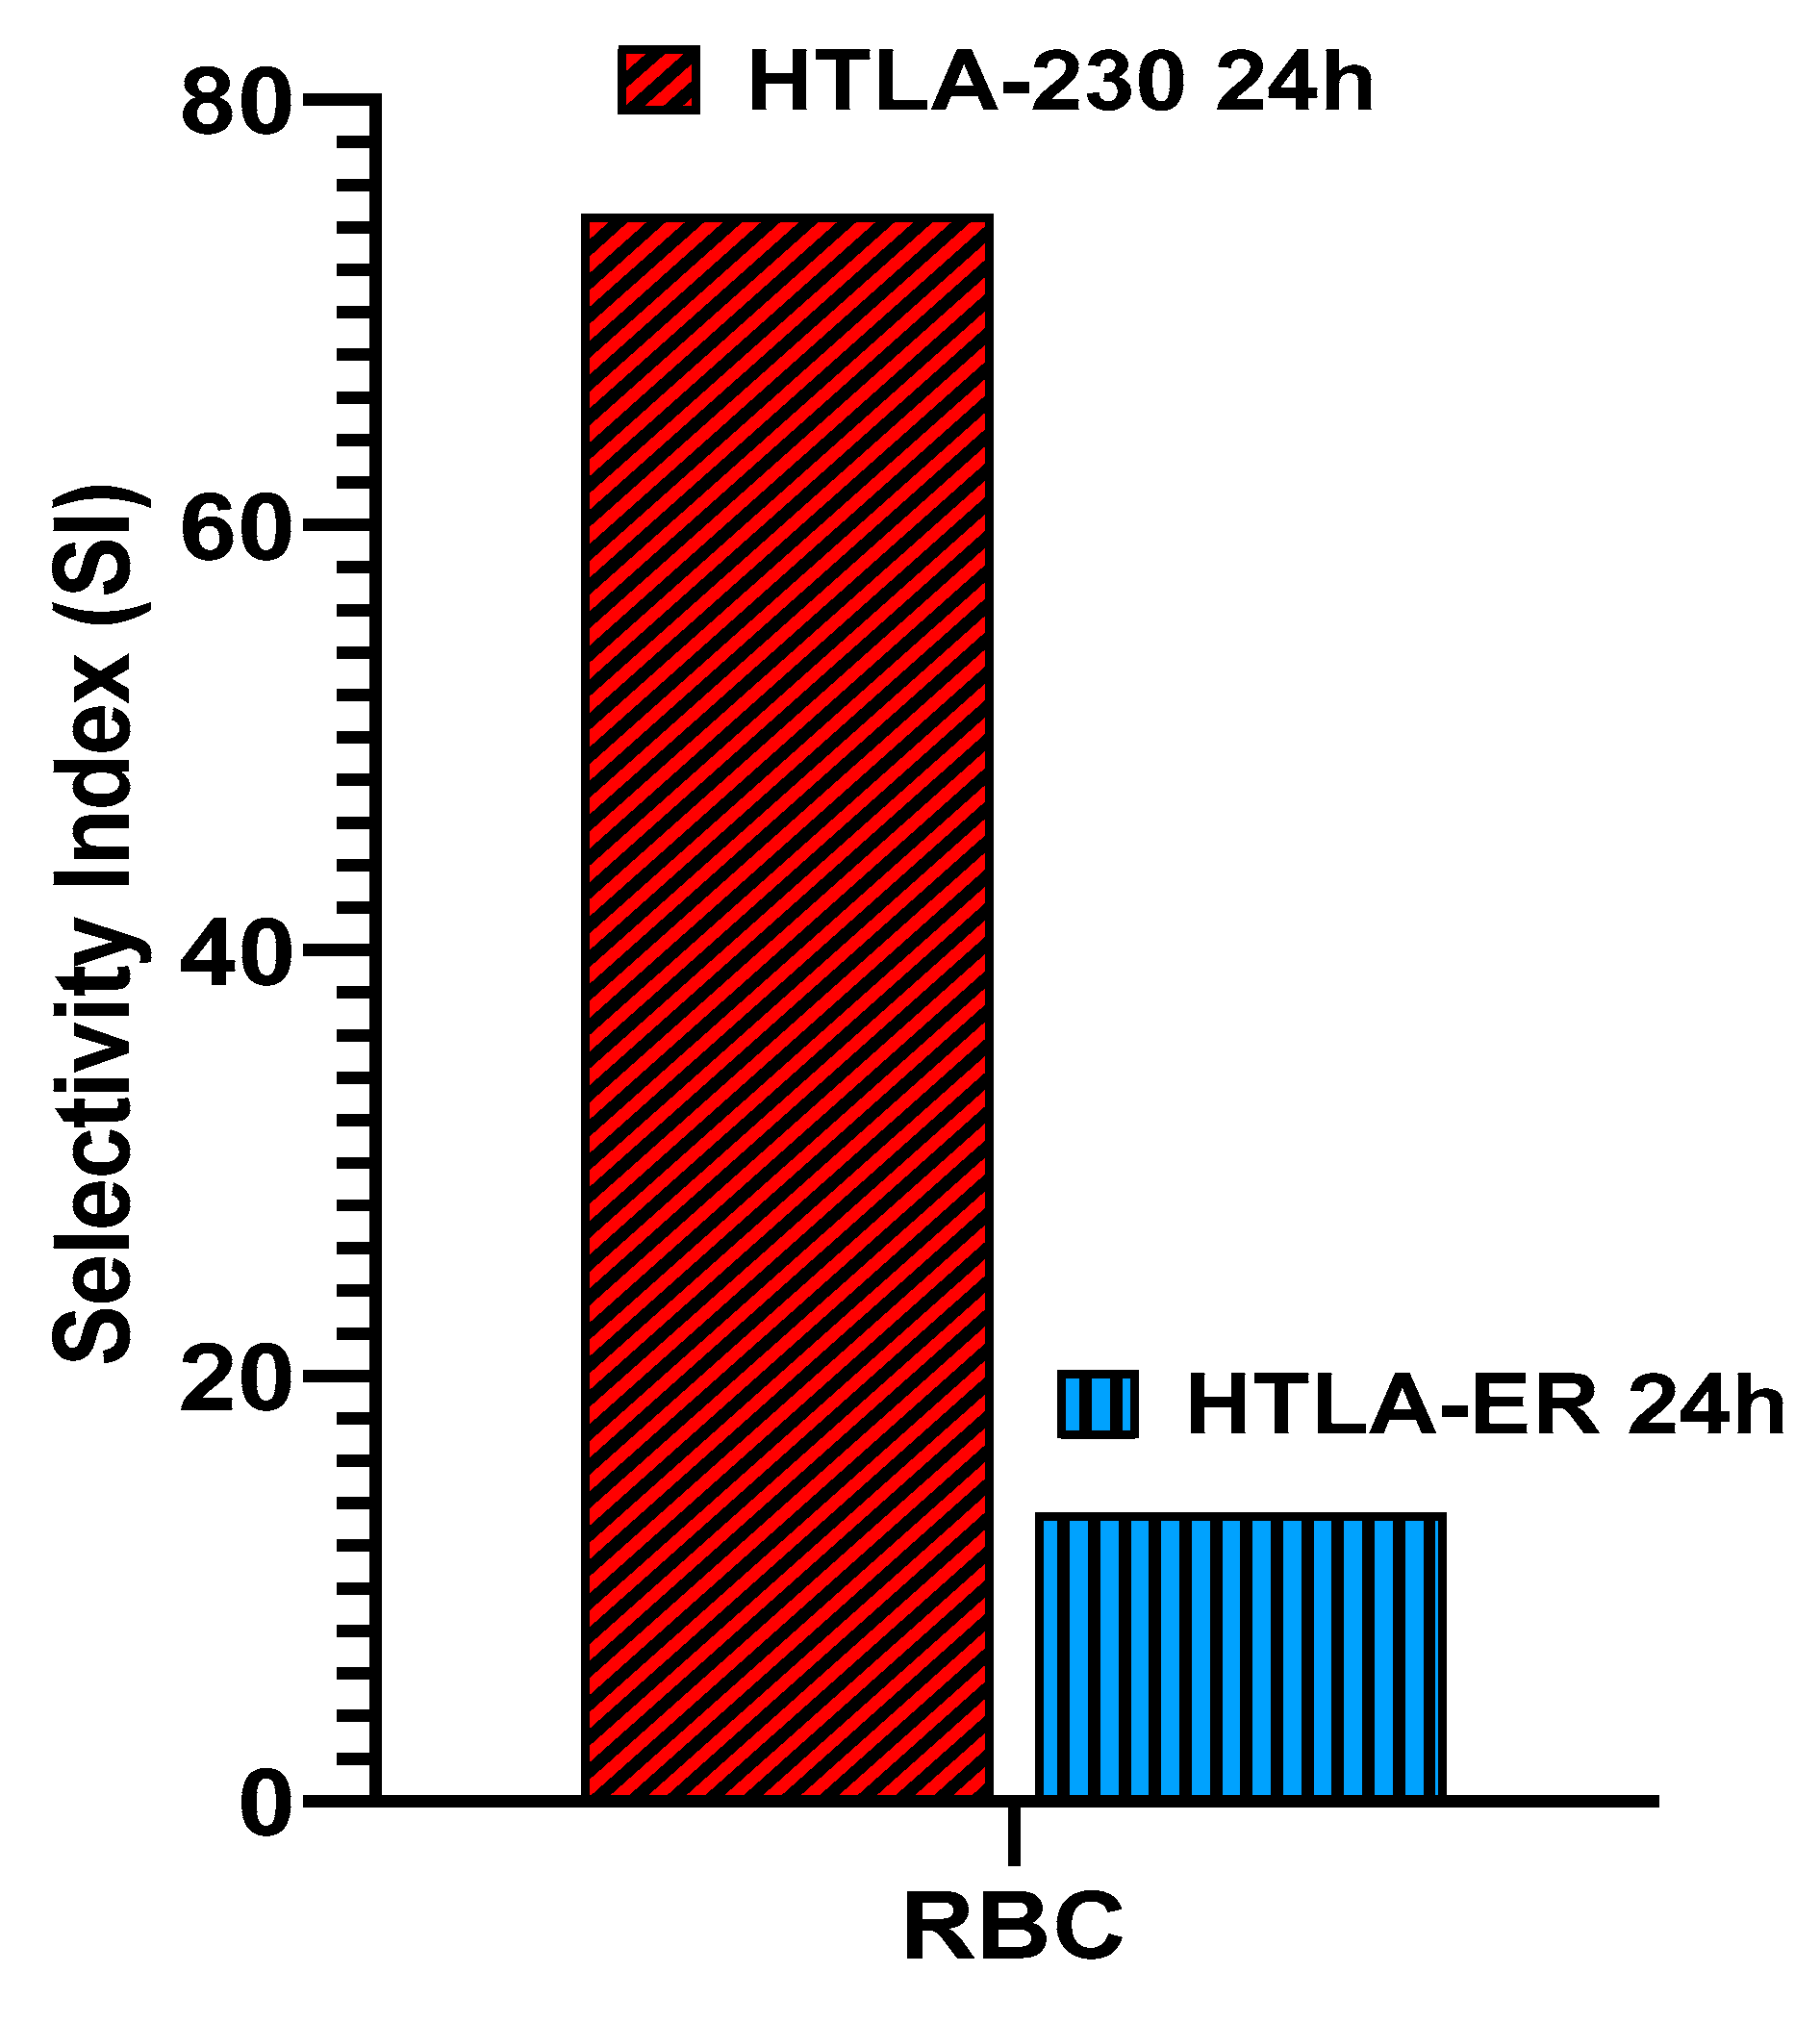

Table 1.
Main characteristics of BPPB [35].
Table 1.
Main characteristics of BPPB [35].
| Analysis | BTTB NPs |
| ATR-FTIR [cm−1] |
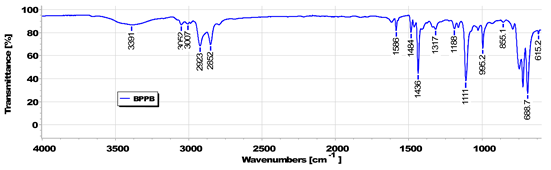 |
|
1H NMR (400 MHz, CDCl3) |
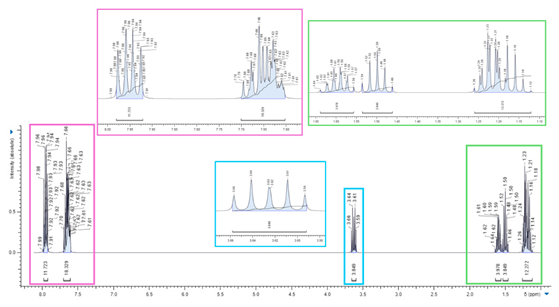 |
|
13C NMR (100 MHz, CDCl3) |
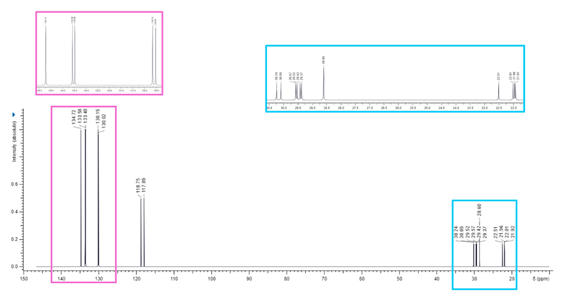 |
|
13C NMR DEPT 135 (100 MHz, CDCl3) 31P NMR (red square) (162 MHz, CDCl3) |
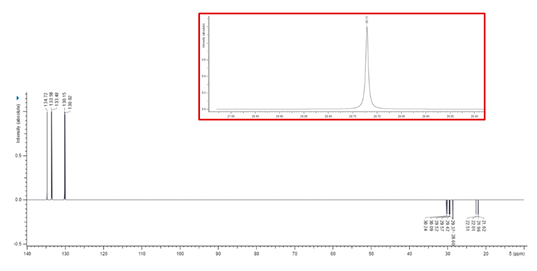 |
| Z-Ave (nm) and PDI (a) ζ-p (mV) (b) |
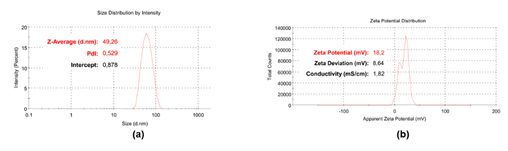 |
| UV-Vis Spectrum | 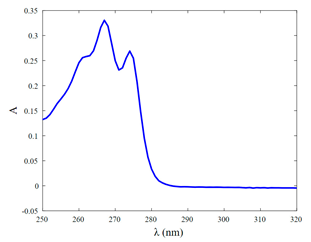 |
| IC50 COS-7 cell (µg/mL) * IC50 HepG2 cell (µg/mL) * |
5.76 ± 0.95 11.31 ± 1.54 |
| MICs Gram-positive (µg/mL) MICs Gram-negative (µg/mL) |
0.25-0.50 1.00-32.00 |
| SIs Gram-positive ** SIs Gram-negative ** |
23-46 0.4-11.3 |
| Potentiometric Titration # |  |
| Optical Microscopy Captured with a 40 × objective (a) Captured with a 100 × objective (b) |
 |
Z-Ave = hydrodynamic diameter of particle; PDI = polydispersity indices; ζ-p = measure of the electrical charge of particles suspended in the liquid of acquisition (water); # the image also shows the titration curve and the first derivative of BPPB; * MTT test; ** respect to HepG2 cells.
Table 2.
IC50 values of BPPB on HTLA-230 and HTLA-ER NB cells measured from results of cytotoxicity carried out in the range of concentrations 0.5-50 µM.
Table 2.
IC50 values of BPPB on HTLA-230 and HTLA-ER NB cells measured from results of cytotoxicity carried out in the range of concentrations 0.5-50 µM.
| Exposure time (hours) | IC50 HTLA-230 (µM) | IC50 HTLA-ER (µM) |
| 24 | 0.7378 ± 0.5459 | 1.8510 ± 0.3920 |
| 48 | 0.5900 ± 0.4453 | 0.7316 ± 0.1586 |
| 72 | 0.2033 ± 0.1781 | 0.8919 ± 0.1666 |
Table 3.
IC50 values of BPPB on HTLA-230 and HTLA-ER NB cells measured from results of cytotoxicity carried out in the range of concentrations 0.1-2 µM.
Table 3.
IC50 values of BPPB on HTLA-230 and HTLA-ER NB cells measured from results of cytotoxicity carried out in the range of concentrations 0.1-2 µM.
| Exposure time (hours) | IC50 HTLA-230 (µM) | IC50 HTLA-ER (µM) |
| 24 | 0.2375 ± 0.0322 | 1.1120 ± 0.2380 |
| 48 | 0.1962 ± 0.0211 | 0.9298 ± 0.0956 |
| 72 | 0.2281 ± 0.0176 | 0.8334 ± 0.0685 |
Table 4.
IC50 values of BPPB on MRC-5 cells measured from results of cytotoxicity carried out in the range of concentrations 0.5-5 µM.
Table 4.
IC50 values of BPPB on MRC-5 cells measured from results of cytotoxicity carried out in the range of concentrations 0.5-5 µM.
| Exposure time (hours) | IC50 MRC-5 (µM) |
| 24 | 2.7740 ± 2.6655 |
| 48 | 0.7395 ± 0.5716 |
| 72 | 0.9277 ± 0.8956 |
Table 5.
IC50 values of BPPB on Cos-7 and HepG2 cells measured from results of cytotoxicity carried out in the range of concentrations 0.4-85.3 µM.
Table 5.
IC50 values of BPPB on Cos-7 and HepG2 cells measured from results of cytotoxicity carried out in the range of concentrations 0.4-85.3 µM.
| Immortalized Cells | IC50 24 hours (µM) |
| Cos-7 * | 4.9100 ± 0.8100 |
| HepG2 ** | 9.6400 ± 1.3100 |
* Monkey kidney cells; ** human liver cells.
Table 6.
Selectivity indices (SIs) of BPPB towards HTLA-230 * and HTLA-ER ** NB cells in relation to its effects on MRC-5, Cos-7 and HepG2 cells.
Table 6.
Selectivity indices (SIs) of BPPB towards HTLA-230 * and HTLA-ER ** NB cells in relation to its effects on MRC-5, Cos-7 and HepG2 cells.
| Cells | Time of exposure | ||
| 24 hours | 48 hours | 72 hours | |
| MRC-5 * | 11.68 | 3.77 | 4.07 |
| Cos-7 * | 20.72 | N.R. | N.R. |
| HepG2 * | 40.63 | N.R. | N.R. |
| MRC-5 ** | 2.49 | 0.80 | 1.11 |
| Cos-7 ** | 4.42 | N.R. | N.R. |
| HepG2 ** | 8.68 | N.R. | N.R. |
* vs. HTLS-230 NB cells; ** vs. HTLS-ER NB cells.
Table 7.
IC50 values of BPPB towards RBCs and its selectivity indices (SIs) towards HTLA-230 * and HTLA-ER ** NB cells in relation to its effect on RBCs.
Table 7.
IC50 values of BPPB towards RBCs and its selectivity indices (SIs) towards HTLA-230 * and HTLA-ER ** NB cells in relation to its effect on RBCs.
| Cells | IC50 µM | SI |
| RBCs * | 14.92 ± 10.80 | N.A. |
| RBCs ** | ||
| HTLA-230 *** | 0.2375 ± 0.0322 | 74.60 |
| HTLA-ER *** | 1.1120 ± 0.2380 | 13.56 |
* vs. HTLS-230 NB cells; ** vs. HTLS-ER NB cells; *** 24 hours exposure; N.A. = not assignable.
Disclaimer/Publisher’s Note: The statements, opinions and data contained in all publications are solely those of the individual author(s) and contributor(s) and not of MDPI and/or the editor(s). MDPI and/or the editor(s) disclaim responsibility for any injury to people or property resulting from any ideas, methods, instructions or products referred to in the content. |
© 2024 by the authors. Licensee MDPI, Basel, Switzerland. This article is an open access article distributed under the terms and conditions of the Creative Commons Attribution (CC BY) license (http://creativecommons.org/licenses/by/4.0/).
Copyright: This open access article is published under a Creative Commons CC BY 4.0 license, which permit the free download, distribution, and reuse, provided that the author and preprint are cited in any reuse.


