Submitted:
06 August 2024
Posted:
08 August 2024
Read the latest preprint version here
Abstract
By introducing final goods trade, intermediate goods trade, and factor-strengthening technology spillovers, along with technology absorption thresholds into the global value chain, this paper builds a global dynamic recursive general equilibrium model. This model can simulate China's technological progress driven by both 'internal' and 'external' (trade and FDI) dual circulations. Eight scenarios are employed to test and demonstrate whether China can follow the dual-circulation pattern and achieve the 2035 economic vision. The main conclusions are as follows:: (1) If China maintains its trade opening policy, the 2035 vision goal can be achieved, with external circulation being more important than internal for technological spillovers; (2) The economic growth impacts of external and internal circulations operate relatively independently. However, Foreign Direct Investment (FDI) provides a relatively larger synergistic effect to all forms of external trade circulation; (3) Regarding international trade partners, we find that RCEP is the most important strategic partner to China; (4) Apparently, FDI is not an effective way to lift the productive services sector's TFP, and China's realistic choice is to open the productive services market wider, as its efficiency is a pivotal reflection of China's independent innovation capability; (5) For factor-strengthening effects, spillovers are more favorable to 'capital' than to other kinds of labor; (6) The impact of China-US decoupling is enormous to the world. In all the scenarios we have envisioned, the United States is always the country that loses the most, and Europe would be the group of countries to benefit when there is a large increase of TFP in the US.
Keywords:
global value chain
; TFP growth
; dual circulation
; dynamic recursive general equilibrium
; vision goal
1. Problem Statement
In October 2020, the Fifth Plenary Session of the 19th Central Committee of the Communist Party of China officially announced the Suggestions of the CPC Central Committee on Formulating the 14th Five-Year Plan for National Economic and Social Development and the Long-Range Vision Goals of China for 2035, which emphasized the goal of achieving the per capita level of medium-developed countries by 2035. It also pointed out that it is a strategic deployment of "building a new high-quality development pattern that promotes domestic and international dual circulation" to achieve this goal. Furthermore, the Political Bureau of the CPC Central Committee conducted the eleventh collective study on the afternoon of January 31, 2024, pointing out that "advanced productive force, with a significant increase in total factor productivity as its core indicator, is an intrinsic requirement and key focus for promoting new high-quality development." Hence, "medium-developed per capita," "high-quality development," and "significant increase in TFP" are considered synonymous terms.
What is the specific standard for the per capita level of medium-developed countries in 2035? According to the World Bank, for the current 2025 fiscal year, the threshold standard for high-income economies is defined as a GNI per capita of $14,005. It was $13,845 for the 2024 fiscal year and $13,205 for the 2023 fiscal year. Figure 1 shows that the per capita GNI arithmetic average of the high-income country group (86 countries) was $48,224 in 2023, $51,087 in 2022 (83 countries), and $47,887 in 2021 (81 countries). The median of this high-income group reached $32,000 in 2021, excluding countries with a population of less than 1 million. (Gao Shanwen, 2022).
Figure 1.
Trend of High-income Country Group average GNI per capita (US dollar, current value). Source: World Bank.
Figure 1.
Trend of High-income Country Group average GNI per capita (US dollar, current value). Source: World Bank.
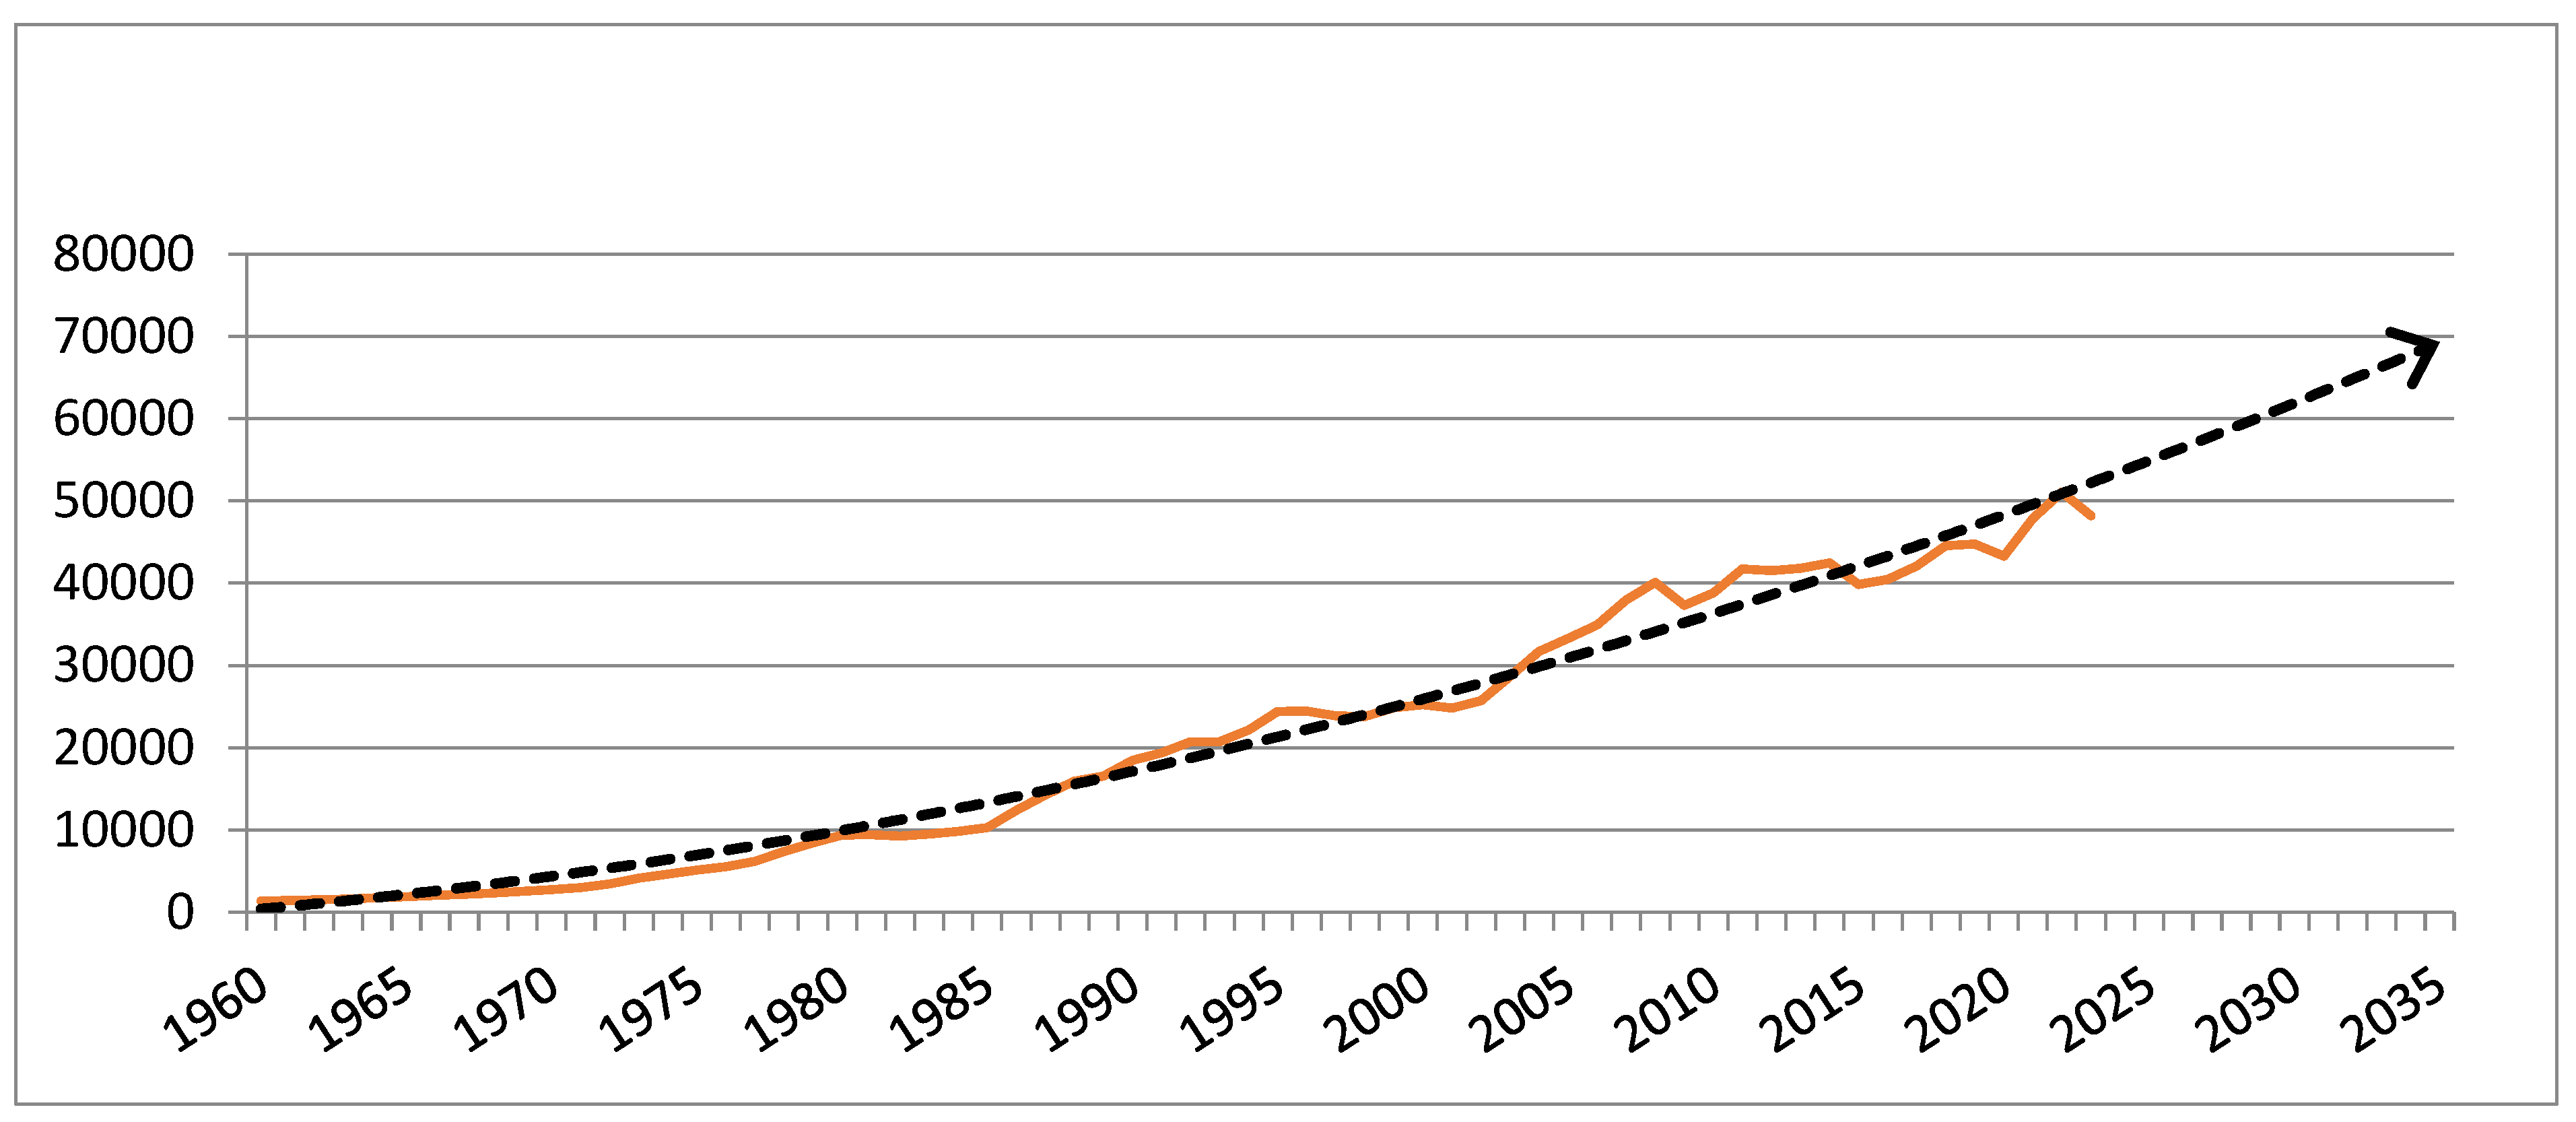
Although there is no direct conversion relationship between the arithmetic average of high-income countries, the median, and the CCP's expected medium-developed country level, the former can serve as evidence for determining the range of the latter. According to Figure 1, the steady trend of the arithmetic average of that country group indicates that the value for 2035 would be at least $55,000, with the median conservatively estimated to be at least $40,000. Based on this, we could define the medium-developed country level for 2035 as a range of $30,000-45,000 per capita. When converted using CEPII PPP [According to CEPII (Center for International Economics Information, France) PPP conversion, if the 2011 US dollar/Renminbi value was taken as 1, then 2024 would be 1.43, and 2035 would be 1.79, with 1.79/1.43 = 1.25 serving as the basis for our conversion ratio between 2023 US dollar to 2035 US dollar, which is the accumulation inflation of the US dollar during this period measured by Renminbi], it is equivalent to $24,000--36,000 in 2024. The actual value of China's per capita GDP, calculated based on the average exchange rate in 2023, is $12,681 (89,400 RMB). Therefore, combining the US dollar/Renminbi setting of CEPII PPP conversion ratio of 1.25, if we work backward from the target of achieving the aforementioned per capita GDP range by 2035, China would need to achieve an average annual real growth of 5.48% -- 9.08% from 2024 to 2035 over a span of 12 years.
12681*(1+5.48%)12*1.25= 30068
This is based on the assumption of a constant population. The premature arrival of negative population growth in China in 2022 might allow for additional relaxation of the 5.48% target, but this paper still uses 5.48% as our economic growth goal, as we have left much elastic room when setting the lower bound of the medium-developed country GNI per capita level interval.
Taking overall consideration into account of the aforementioned goal, strategic deployment, and key focus of the Communist Party of China, this paper establishes a computational global dynamic recursive general equilibrium model to rationalize the aforementioned 'vision goal' and its concerns through 'dual circulations and TFP', namely the international spillovers and independent domestic innovation of technology progress, into various simulated scenarios to test the feasibility of such growth targets in China.
The subsequent structure of the paper includes: Part II, Theoretical Analysis; Part III, Model and Innovations; Part IV, Aggregations; Part V, Baseline; Part VI, Shocks and Scenarios; Part VII, Results and Analyses; Part VIII, Main Findings; and Part IX, Policy Recommendations and Future Research Directions.
2. Theoretical Analysis
This part explains why we are making some innovative changes to the base model and shocking some specific variables. The global technology ladder suggests three main patterns of technological advancement for China's future: the first involves the internal circulation, while the second and third involve the external circulation.
2.1. Consumer-Driven Independent Innovation Approaching the Technological Frontier
For developing countries, the model of independent innovation, despite its high costs, is a mode of technological progress that ensures national economic security during the process of technological catch-up. So, when a country has already approached the world technological frontier and cannot obtain more technological spillovers through the external circulation, where does the internal motivation for independent innovation come from?
The answer lies in the consumer market, where the process of meeting market demands also promotes the growth of the country's Total Factor Productivity (TFP). Traditionally, consumption has been considered a negative factor for TFP as it is seen as the opposite variable to investment and capital formation. However, Foellmi and Zweimüller (2006) constructed a model within the framework of endogenous growth theory that links consumers of different qualities with the pricing and innovation behavior of monopolistic companies. Their research shows that as income increases, the hierarchical climb in consumer preferences leads to an expansion of the corresponding market scale, directly providing momentum for product innovation. To some extent, this proves the adage that demand creates supply. Foellmi et al. (2009) extended the aforementioned model to a more general field of process innovation, proving that even without disruptive hierarchical climbs in consumption, the upgrading of consumption among people below the median income level, driven by the advancement of income equalization, will promote innovation in product processes.
To what extent will China's burgeoning middle class and its consumption drive TFP growth? On the micro level, Beerli et al. (2020) used China's income distribution as an instrumental variable for future market share, along with independent variables such as the price and quality of durable goods, to explain changes in R&D investment and labor productivity at the micro-enterprise level. The results show that a 1% change in market share leads to a 4.4% increase in R&D, a 6.5% rise in micro labor productivity, and an increased probability of successful product innovation. On the macro level, Tian Youchun et al. (2021) calculated China's macro TFP based on industrial panel data, showing that from 1991 to 2002, China's TFP growth mainly originated from the secondary industry, with an average annual growth of 10.17% in the TFP of the secondary industry alone. From 2005 to 2014, TFP growth was contributed by both the secondary and tertiary industries, with the average annual growth of the secondary industry's TFP dropping to 6.38%, and the tertiary industry catching up to an average annual growth of 5.49%, with a trend towards equal contribution in the future. The increased contribution of the tertiary industry to TFP is mainly due to the growth of consumer-driven service industries. Therefore, it is foreseeable that in the future growth of China's macro TFP, the "internal circulation" will be a model led by consumer-driven service industries.
2.2. Technological Progress through International Investment: Threshold Effects, Forward and Reverse Spillovers
Romer (1986) pointed out that developing countries can learn and imitate advanced foreign technologies by utilizing international capital flows to narrow the technology gap, which is a practical choice. This model brings a direct Total Factor Productivity (TFP) growth effect due to increased capital accumulation: some research conclusions emphasize the accumulation of physical capital itself (Hymer, 1976; Thompson, 2008; Borensztein et al., 1998; Azman-Saini et al., 2010; Cooray et al., 2014; Slesman et al., 2015); others highlight the effect of human capital accumulation (Borensztein et al., 1998); and some provide positive conclusions about human capital accumulation in China (Eaton and Kortum, 1996; Xu, 2000; Caselli and Coleman, 2001).
In addition to the direct growth effects, Foreign Direct Investment (FDI) also generates indirect TFP spillover effects from the industry to the overall economy. Romer (1986), Li and Liu (2005), Woo (2009), and Baltabaev (2014) all affirmed the macro TFP promotion effect of FDI. Görg and Greenaway (2004), Saggi (2002), Fosfuri et al. (2001), and Javorcik (2004) analyzed the specific pathways through which FDI promotes macro TFP growth, such as demonstration and imitation functions, promoting labor mobility, and forward and backward economic linkages.
Is there any connection between the aforementioned increase in macro TFP from spillovers and the direct TFP effect of FDI? The answer to this question introduces another concept: the threshold effect of technology absorption. Abramovitz (1986) and Baumol et al. (1989) first proposed the issue of the host country's absorption capacity. Coe et al. (1997), Li et al. (2001), Liu et al. (2001), Wei and Liu (2001), Buckley et al. (2002), Hu and Jefferson (2002), Huang (2002), and Liu (2002), all based on Chinese data, reached research conclusions that the threshold effect indeed exists in China. Studies by Fosfuri et al. (2001) and Meryer and Sinani (2009) show that FDI is associated with human capital and macro TFP, where human capital is a key threshold factor determining the host country's ability to digest and absorb technology. Kima et al. (2012) classified 122 countries and used data from 1989 to 2008 for empirical analysis, finding that the greater the economic gap between the host country and the investing mother country, that is, the greater the North-South effect, the more obvious the TFP promotion effect of FDI. Mastromarco and Simar (2018) showed that another gap between the host country and the investing mother country—the size of the economy—is also a factor affecting the technology spillover effect.
The pattern of international capital flows also involves reverse spillover effects, meaning that Outward Direct Investment (ODI) can also promote the improvement of labor productivity in the home country. Herzer (2010) used a cointegration panel to analyze data from 33 developing countries from 1980 to 2005 and concluded that ODI is beneficial to the macro TFP growth of developing mother countries in the long run, revealing the mechanism: horizontal or market-oriented ODI improves the related service exports of developing mother countries, such as R&D, design, marketing strategies, etc. Pottelsberghe and Lichtenberg (2001) found that technology-seeking ODI from developing countries can enhance the long-term macro TFP of the mother country through the spillover of the host country's R&D stock weighted by ODI. Vertical ODI, specific asset and technology-seeking ODI, and natural resource-seeking ODI can improve the macro TFP of the mother country by reducing the production costs of the mother country and promoting the mother country's intermediate goods exports (Herzer, 2008), bringing brands, marketing networks, and technology to the mother country (Pottelsberghe and Lichtenberg, 2001), and enabling the mother country to benefit from natural resources in terms of TFP dynamics (Dunning, 1998).
2.3. Technological Progress through International Trade: Threshold Effects, Forward and Reverse Spillovers
Romer (1986) pointed out that international trade is an important source of macro TFP growth for developing countries, namely the so-called trade technology spillover (or embodied technology spillover) pathway. Since the 1990s, international trade has entered the era of global value chains (Baldwin, 2011). The United Nations Conference on Trade and Development recognized for the first time in the 2013 World Investment Report that global value chains have been formed, and pointed out that more than 60% of global trade, totaling more than 20 trillion US dollars, is trade in intermediate goods.
Meijl et al. (1999) divided trade technology spillovers into two pathways: one is technological progress that is Hicks-neutral, obtained through final product trade; the other is technological progress obtained through intermediate goods trade. Coe et al. (1997) used data from 77 developing countries and 22 developed countries from 1971 to 1990 to illustrate that the import of intermediate goods and machinery and equipment itself implies the digestion and absorption of the mother country's R&D investment, design, and technical blueprints. This effect is not limited to this product or industry but also generalizes in technology transfer, process introduction, and improvement of management skills through the use of imported goods and the host country's imitation of the embodied new technologies, ultimately reflecting in the improvement of macro TFP.
Meijl et al. (1999) also pointed out that trade technology spillovers have a threshold effect, and the human capital of the importing country, R&D capacity, knowledge infrastructure, and the economic structure gap between trade partners all affect the effectiveness of the spillover. Das (2009) demonstrated the existence of the threshold effect. Building on this, Coe et al. (2008) further clarified that the key variable determining whether other countries' R&D investment can be transformed into the host country's macro TFP through trade technology spillovers is the national system.
Bournakis et al. (2017) proved that under the global value chain, both import and export trade are ways to achieve technology spillover, that is, the trade technology pathway also has a reverse effect—reverse technology spillover. Empirical studies by Coe and Helpman (1993), Coe et al. (1995) show that trade partners have a strong technological progress dependence on each other's R&D investment, and the bidirectional effect exists. Sjoholm (1996) verified that trade volume is a robust explanatory variable for both trade partners citing each other's patents. Many other studies (Navaretti and Tarr, 2000; Keller, 1997; Coe et al., 1997; Coe and Helpman, 1995; Das, 2002 and 2003; Eaton and Kortum, 1996) have also proven that industries and sectors that rely more on relatively complex intermediate goods imports will benefit more from trade technology import spillovers.
Different from investment-type technology spillovers, traded goods, as tangible items, can be used and interacted with other factors of production aside from capital, thereby generating "factor-strengthening" characteristic spillover effects, which refer to "labor-strengthening" or "land-strengthening." Concepts first proposed by Hicks (1932). Meijl et al. (1999) found that when certain productivity growth occurs in the chemical and machinery sectors of Europe and North America, it will affect agricultural production in other regions of the world through "labor-strengthening" and "land-strengthening" technology diffusion. The speed of technological progress in the importing country can even exceed the technology origin, for example, when technology progress occurs in Europe, the impact on Japan is the greatest; while technological progress in the United States has the greatest impact on Australia.
3. Model Basics and Innovation
The model in this paper is based on the dynamic recursive global CGE model GTAP-RD (Aguiar et al., 2019), which in turn is built upon the seventh generation of the static GTAP (Corong et al., 2017) and is written in the TABLO language. When transitioning from static to dynamic, there are four possible axes for development: exogenous endowment, technological substitution, preference substitution, and policy substitution. GTAP-RD focuses on the type of dynamic change involving technological substitution, a feature that facilitates the following innovations of this paper.
Innovations lie in introducing structural changes through trade-related technology spillovers and threshold effects, referring to Meijl and Tongeren (1998), Meijl et al. (1997), Bernstein and Mohnen (1994), and Coe et al. (1995) for the spillovers, and to the specific approach of Barro and Lee (1993) for the thresholds. Both the innovative add-on module and the thresholds are introduced through TABLO programming sub-units.
3.1. Threshold Effect
Firstly, represented by the ratio of the average years of education between the importing and exporting countries, technology absorption capacity coefficient is introduced as a power value
where Sr and Sf are the average years of education for the importing and exporting countries respectively.
Secondly, following the approach of Van et al. (1999), an economic structure similarity coefficient is introduced to analyze the structural differences between the importing and exporting countries, reflected by the proportion of the difference in the capital-labor ratio µ between the two countries and the maximum gap among all countries in the sample
in which ,are the capital-labor ratios for the importing and exporting countries respectively.
Finally, following the method of Meijl et al. (1999), the threshold effect in this paper is defined as the absolute value of the difference between the product of the above two coefficients and 1:
3.2. Final Goods Trade Technology Spillover
Assume that the main product of production activity a is c, and the exporting country of c is f, while the importing country is r. Equation (1) represents the proportion of all c exported from country f that is accounted for by country r. For all r, there is . This import volume E is statistically based on the production sector with firms as the main body, not on imports for the purpose of residential consumption and government consumption.
3.3. Intermediate Goods Trade Technology Spillover
Assume that the main product of production activity a is c, and c is produced domestically in the importing destination country r, with a production volume of , but it uses imported intermediate goods d in quantity . In Equation (2), the denominator of the fraction represents the proportion of imported intermediate goods d used in the production of the same product in the exporting country f; represents the proportion of imports from country f in the total imports of the production sector a in country r.
3.4. Factor-Strengthening Technology Spillover Brought by Global Value Chains
Factor-strengthening technological progress is achieved through final goods trade technology spillovers and intermediate goods trade technology spillovers, that is, the importing country obtains technology through the technological progress of production activity a in the domestic production of product c in the importing source country f. In Equation (3), K represents the technological progress that has spilled over to various local factors at this time, including capital, unskilled labor, and skilled labor, denoted as, respectively. γ is the spillover ratio, with a value between (0, 1).
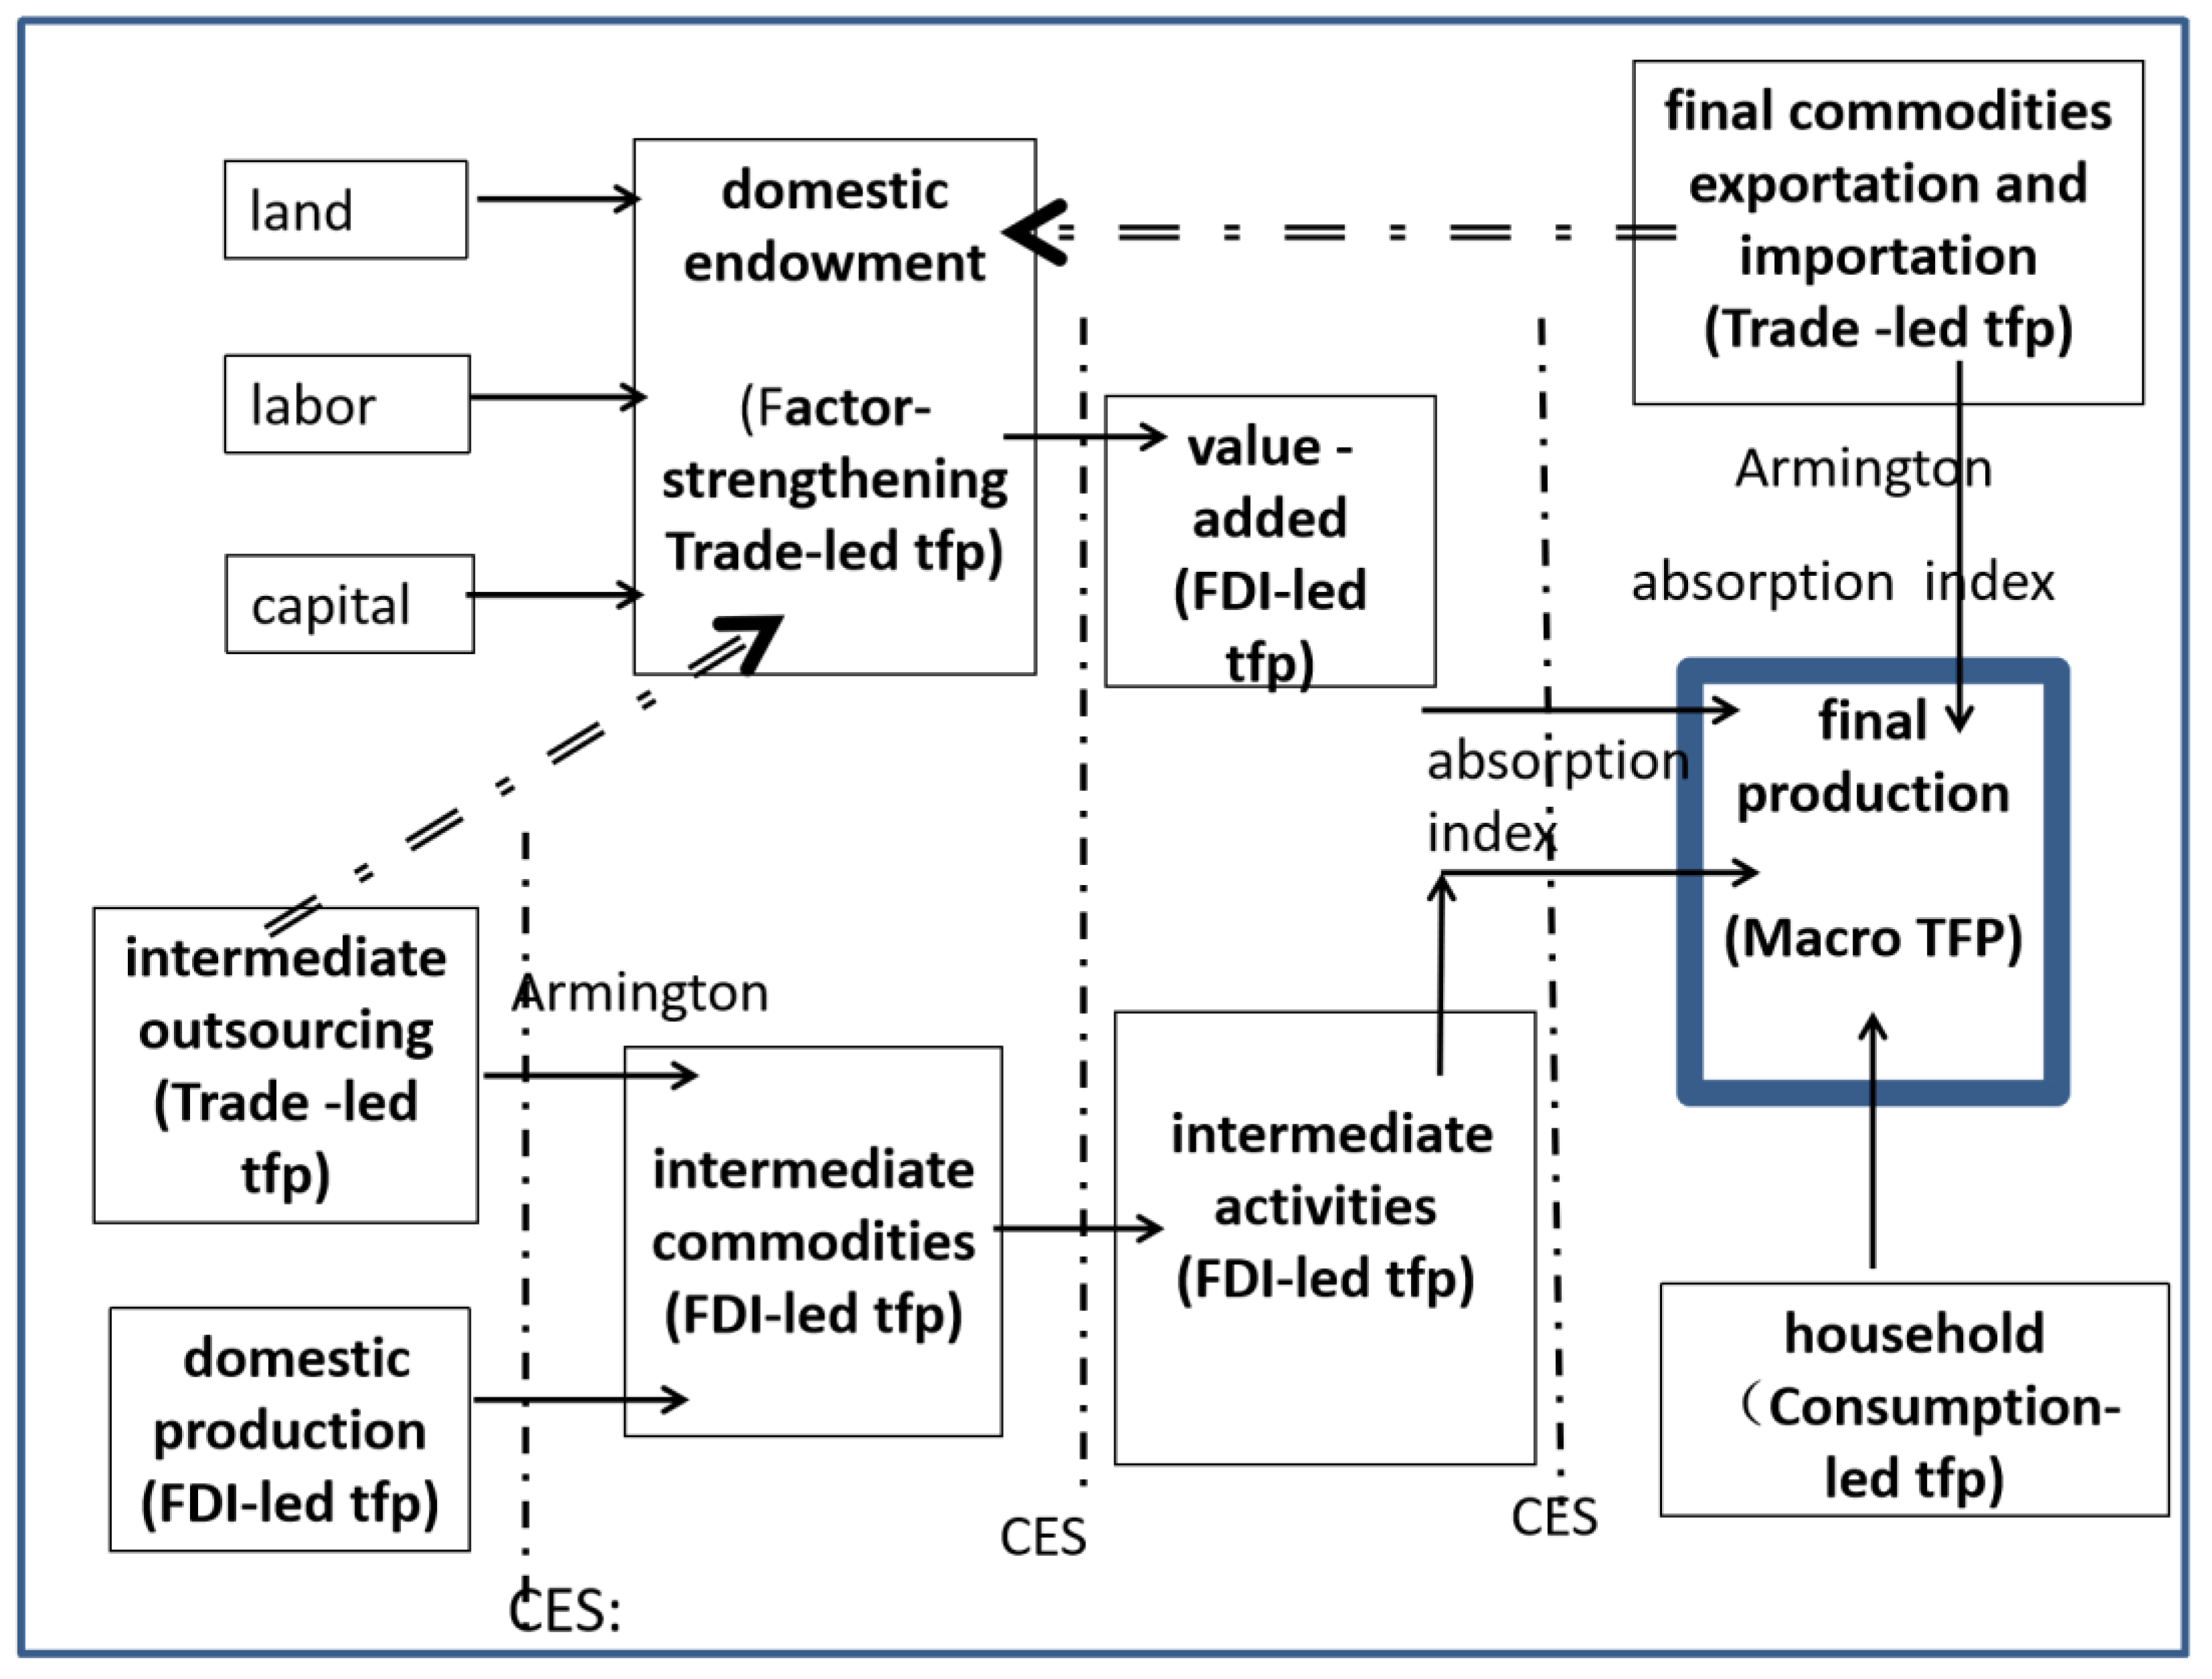
Figure 2 is the nested hierarchy production structure as well as a schematic diagram of the technological progress pathways based on our changed model structure described above.
And, this paper is using the GEMPECK RunDynam software and chooses the solution method of Gragg 2-4-6 step recursive extrapolation.
Figure 2.
Potential Pathways for Nested Structure of Model Production and TFP Enhancement.
4. Aggregations and Indexes Summary
For data, paper is going with the current 11th edition GTAP database which integrates input-output tables (I-O tables) from 141 countries and regions, including 65 production sectors, as well as happened-really detailed bilateral trade, logistics and transportation, and trade protection data characterizing economic links between regions, sourced from institutions such as the IMF, WB, OECD, UN Population Division, and IIASA as foundational data, necessary aggregations are carried out to make model more suitable for this paper’s problem.
4.1. Aggregation of Countries (Regions)
When dividing the 141 countries and regions in the 11 database into 10 regional groups (see Table 2), the main factors considered in this paper include whether they are part of the RCEP (Regional Comprehensive Economic Partnership Agreement), whether they are part of the OBOR (the 65 countries and regions along the "Belt and Road"), and whether they are part of the North American Free Trade Area. Both OBOR and RCEP are hotspot regions for China's outward ODI; the North American region except U.S., consisting of the Canada and Mexico, is categorized separately, mainly considering the potential supply chain layout for the United States' re-industrialization.

Table 1.
Classification of 141 countries and regions worldwide into 10 regional groups.
| Regional Groups | Specific Countries and Regions | Regional Groups | Specific Countries and Regions |
| Set1: CHINA | CHINA | Set4: US | US |
| Set 3: RCEPNOBOR(Four countries that are members of RCEP but not part of OBOR) | Japan, South Korea, Australia, New Zealand | Set 5: NAMERICA(the North American region except U.S.) | Canada, Mexica |
| Set 2: OBORYRCEP(Nine countries that are both part of OBOR and members of RCEP) | Indonesia, Malaysia, Philippines, Thailand, Singapore, Brunei, Cambodia, Laos, Vietnam | Set 7: EU28NOBOR(Ten countries that were part of the European Union but not part of OBOR before Brexit in the UK) | Germany, United Kingdom, France, Spain, Netherlands, Sweden, Belgium, Ireland, Denmark, Finland |
| Set 6: OBORYEU28(Eighteen countries overlapping between OBOR and the European Union) | Austria, Bulgaria, Cyprus, Croatia, Czech Republic, Estonia, Greece, Hungary, Italy, Latvia, Lithuania, Luxembourg, Malta, Poland, Portugal, Romania, Slovakia, Slovenia | Set 8: RESTOBOR(Twenty-seven countries in the Middle East and West Asia direction of OBOR) | Armenia, Albania, Azerbaijan, Bangladesh, Belarus, Egypt, Georgia, India, Kazakhstan, Oman, Nepal, Mongolia, Pakistan, Russia, Sri Lanka, Ukraine, Israle, Bahrain, Qatar, Iran, Kuwait, Saudi Arabia, Turkey, United Arab Emirates, Jordan, Kyrgyzstan, Tajikistan |
| Set 9: HK(China Hong Kong) | Hong Kong | Set 10: RESTWORLD(68 rest countries and regions) | Other countries and regions of the world |
4.2. Aggregation of Industries
This paper consolidates the 65 industries in GTAP 11 into nine major industrial categories, with the products they produce aggregated into ten types (see Table 4).
Table 2.
Collections of nine industries and ten commodities.
| Industrial classification | Specific industries included | Industrial classification | Specific industries included |
| a_Agricultur ( commodities produced includes: c_Crops and c_MeatLstk) |
Paddy rice; Wheat; Cereal grains nec; Vegetables, fruit, nuts; Oil seeds ; Sugar cane, sugar beet ; Plant-based fibers; Crops nec; Bovine cattle, sheep and goats, horses; Animal products nec; Raw milk; Wool, silk-worm cocoons; Bovine meat products ; Meat products nec ; Processed rice | a_HeavyMnfc (commodities produced include: c_HeavyMnfc) |
Petroleum, coal products;Chemical;Basic pharmaceutical products;Rubber and plastic;Mineral products nec;Ferrous metals;Metals nec;Computer, electronic and optical products;Electrical equipment;Machinery and equipment nec |
| a_Extraction (commodities produced include: c_Extraction) |
Forestry;Fishing;Coal;Oil;Gas;Minerals nec | a_Util_Cons (commodities produced include: c _ Util _ Cons) |
Electricity; Gas manufacture, distribution;Water; Construction |
| a_ProcFood (commodities produced include: c_ProcFood) |
Vegetable oils and fats;Dairy products;Sugar;Food products nec; Beverages and tobacco products | a_TransComm (commodities produced include: c_TransComm) |
Trade;Accommodation, Food and service activities ;Transport nec;Water transport;Air transport; Warehousing and support activities ;Communication |
| a_TextWapp (commodities produced include: c_TextWapp) |
Textiles;Wearing apparel | a_OthService (commoditie produced include: c_OthService) |
Financial services nec; Insurance;Real estate;Business services nec;Recreational and other services;Public Administration and defense;Education;Human health and social work activities;Dwellings |
| a_LightMnfc (commoditie produced include: c_LightMnfc) |
Leather products; Wood products;Paper products, publishing; Metal products;Motor vehicles and parts;Transport equipment nec; Manufactures nec |
Among them, a_Agricultur (planting), a_Extraction (mineral mining) constitute the primary industry; a_ProcFood (food and beverage processing), a_TextWapp (textile), a_LightMnfc (light industry), a_HeavyMnfc (heavy industry) constitute the secondary industry; a _ Util _ Cons (public service), a_TransComm (productive services), and a_OthService (consumer services) constitute the tertiary industry.
The contribution of the primary and resource product sector to China's macro TFP has consistently been negative (Tian Youchun et al., 2021), and the absolute value is very small, so all shocks from this paper does not consider this sector as a source of China’s economic growth.
4.3. Summary of Technology Threshold Indexes and Spillover Coefficients
After the classification of countries is determined, the power value of the threshold effect for China to obtain technology spillover from the other nine regional groups can be calculated.
Table 3.
The threshold effect value of China to obtain technologies from other countries.
| OBORYRCEP | RCEPNOBOR | US | NAMERICA | OBORYEU28 | EU28NOBOR | RESTOBOR | HK | RESTWORLD | |
| Education years ratio | 1.03 | 1.56 | 1.65 | 1.37 | 1.47 | 1.53 | 1.21 | 1.52 | 0.62 |
| Economic gap ratio (capital-labor ratio) | 1.04 | 1.38 | 2.5 | 1.41 | 1.18 | 1.77 | 1.07 | 1 | 1.09 |
| Technical overflow power value | 0.01 | 0.13 | 0.34 | 0.03 | 0.24 | 0.14 | 0.14 | 0.52 | 0.43 |
Data source: Years of education ratio from UNESCO Institute for Statistics (2020), Barro and Lee (2018), ICF Macro Demographic and Health Surveys, UNICEF Multiple Indicator Cluster Surveys and OECD (2019b);Capital data in the capital-labor ratio comes from World Bank(2021)The Changing Wealth of Nations 2021;Labor data comes from Derived using data from International Labor Organization, ILOSTAT database and World Bank population estimates. Labor data retrieved in September 2018. .
And, with aggregations of nations, the according direct final trade technology spillover coefficients are calculated and shown in Table 4.
Table 4.
The technological progresses spillover coefficients of final and intermediate goods trade classified by origin regions.
Table 4.
The technological progresses spillover coefficients of final and intermediate goods trade classified by origin regions.
| Regions | DirectKafr | IndirectKafr |
| OBORYRCEP | 0.98 | 0.96 |
| 3.RCEPNOBOR | 0.82 | 0.69 |
| 4.US | 0.74 | 0.40 |
| 5.NAMERICA | 0.68 | 0.87 |
| 6.OBORYEU28 | 0.63 | 0.25 |
| 7.EU28NOBOR | 0.67 | 0.56 |
| 8.RESTOBOR | 0.70 | 0.60 |
| 9.HK | 0.78 | 0.01 |
| 10.RESTWORLD | 0.75 | 0.31 |
As for the indirect spillovers, we need to explore China’s input-output table, we first should find out industries (those “a”s) that the imported intermediates commodities (those “c”s) account for more than 10% of an a’s industrial output. At the part of “Aggregation of industries” we have matched industries and its own commodities, now by going with I-O table ,we further match industries and commodities used crossing industries and that is the basis how indirect spillovers take place. Through further corresponding those matched-up imported intermediate commodities to their main source of regions, again only those whose exportation accounts for more than 5% of China’s same product importation will be taken as intermediate trade technology source regions. And although country group indirect coefficients are also shown in Table 4, in actual writing, we match each source industry in every source group with its own more specific after-powered indirect threshold index.
Table 6.
Main imported intermediate products and their source regions.
| China’s industries other than primary sector |
Imported intermediate commodities ( intermediates commodities (those “c”s) account for more than 10% of the industrial output) |
Source regions by country group number ( whose exportation accounts for more than 5% of China’s same product importation) |
| a_Extraction | c_Extraction | c_Extraction is from 2/3/8 |
| a_ProcFood | c_Crops;c_HeavyMnfc | c_Crops is from 2/3/4/5/10 c_HeavyMnfc is from 2/3/4/7/8/10 |
| a_TextWapp | c_Crops ;c_MeatLstk ;c_Extraction | c_Crops is from 2/3/4/5/10 c_MeatLstk is from 3/4/5/7/10 c_Extraction is from 2/3/8 |
| a_LightMnfc | c_Extraction | c_Extraction is from 2/3/8 |
| a_HeavyMnfc | c_Extraction;c_HeavyMnfc | c_Extraction is from 2/3/8 c_HeavyMnfc is from 2/3/4/7/8/10 |
| a_Util_Cons | c_Extraction | c_Extraction is from 2/3/8 |
| a_TransComm | c_LightMnfc; c_HeavyMnfc | c_LightMnfc is from 3/4/6/7/10 c_HeavyMnfc is from 2/3/4/7/8/10 |
| a_OthService | c_Extraction ;c_HeavyMnfc | c_Extraction is from 2/3/8 c_HeavyMnfc is from 2/3/4/7/8/10 |
5. Baseline Treatment
The newest GTAP database, version 11, adopts 2017 as the new base year, meaning that the world economic structure reflected in this study is as of 2017, and the scope of our estimation is from 2024 to 2035. Originally, GTAP-RD comes with two sets of predefined dynamic baseline data, OECD and IIASA [The International Institute for Applied Systems Analysis]. Comparative studies show that OECD is superior to IIASA since IIASA does not list Total Factor Productivity (TFP) at all, while OECD embeds a technology frontier growth rate based on the long-term growth trend of the economy (Johansson, 2013; Dellink et al., 2017). After examining all OECD Shared Socioeconomic Pathways (SSPs), which are scenarios set for researchers to choose backgrounds, we choose the average OECD SSP3 as our simulation baseline, forecasting economic growth of 3.46% and a built-in macro TFP growth rate of 2 percent for China from 2023 to 2035. This 2 percent can be regarded as the "natural" macro TFP growth rate determined by current urbanization, capital accumulation, and industrial structure in China with a growth rate of 3.46 percent. There is a certain gap between the embedded rates and the needed rates (5.48%-3.46%), which leaves room for this paper to accelerate China's total factor productivity through "internal" and "external" circulation pathways.
After determining the baseline as OECD SSP3, we updated the officially published actual GDP values for countries from 2018 to 2023 into the database and calibrated them according to the Walmsley dynamic recursive method (Walmsley, 2006) through shocks.
Before setting the scenarios, we consider the following background of global economic growth:
5.1. China-U.S. Trade Friction
The increase in tariffs resulting from the China-U.S. trade friction since 2018 has not been reduced, following the first phase trade agreement reached by the two countries in January 2020. Therefore, this paper updates trade and related tariff data and applies a corresponding tariff shock for the year 2020. Referring to Minghao Li et al. (2020), and using the commodity classification detailed in Table 4, this paper has determined the changes in tariffs as follows:
Table 7.
Tariff Changes before and after the US-China Phase One Agreement.
| product classification | US Tariffs on China | Chinese Tariffs on US | ||
| Pre-trade war tariffs | Post-trade war tariffs | Pre-trade war tariffs | Post-trade war tariffs | |
| c_Crops | 1.10% | 23.75% | 2.97% | 28.37% |
| c_MeatLstk | 0.64% | 24.10% | 8.21% | 28.06% |
| c_Extraction | 0.17% | 24.80% | 0.64% | 14.98% |
| c_ProcFood | 2.72% | 24.00% | 8.21% | 24.87% |
| c_TextWapp | 10.31% | 9.94% | 7.53% | 13.03% |
| c_LightMnfc | 4.33% | 15.05% | 9.58% | 19.84% |
| c_HeavyMnfc | 1.02% | 20.87% | 3.77% | 15.13% |
Data Source: Minghao Li et al. (2020) and calculations by paper author.
5.2. Consideration of COVID-19 Pandemic
As indicated by general equilibrium theory, CGE models focus on long-term impacts, and short-term disturbances, whether positive or negative, are eventually absorbed and compensated for by base effects in later stages. According to the IMF baseline forecast for the world, the economy is expected to continue growing at 3.2 percent during 2024 and 2025, at the same pace as in 2023. The forecast for global growth five years from now, for 2029, is 3.1 percent. In reality, the average growth rate of the world economy for the decade of 2010-2019 was 3.15%, and for the two decades of 2000-2019, it was 3.8%. This suggests that if there was a structural change in the world economy, it may have happened around 2010. We are now only moving forward along the path that has been established since then. As we have adjusted our baseline data to reflect what actually happened in 2023, this paper will not make any systematic shocks to describe this pandemic.
5.3. Base TFP Growth of Country Groups Except China
We take the arithmetic mean of every country group's TFP growth from 2008 to 2021 from CEPII as the basic TFP structure for the world (except China) to grow. We found that this series also corresponds with US BLS data and PWT 10.0 data. In the CEPII database, the same period of China's TFP growth shows a rate of 4.62%, which is absolutely too high.
According to existing studies, it is considered that the average growth rate of TFP in China's economy from 2003 to 2013 was approximately 3.2% (He Jingtong, He Lei, 2016); and from 2005 to 2014, it was 4.38% (Tian Youchun et al., 2021); the expected average TFP growth rate during the "13th Five-Year Plan" period, 2016-2020, was 3.21% (Xiao Hongwei, Li Hui, 2014). Since 2008, the overcapacity issue has always been a prominent and urgent issue to be resolved. The Chinese government has implemented various supply-side structural adjustment policies since November 2015, which is also why the CCP now advocates the concept of TFP-driven new development patterns. Therefore, we abandon this numerical value of 4.62% and assign China a basic non-zero starting point of 0.01% for us to explore various possible TFP acquisition combinations through both internal and external circulations.
Table 8.
basic TFP structure for the world (except China) to growth.
| 2 OBORYRCEP | 3 RCEPNOBOR | 4 US | 5 NAMERICA | 6 OBORYEU28 | 7 EU28NOBOR | 8 RESTOBOR | 9 HK | 10 RESTWORLD |
| 1.93% | 0.57% | 0.52% | 0.05% | 0.66% | 0.27% | 1.18% | 1.03% | 1.05% |
Source: CEPII.
6. Shocks and Scenario Settings
6.1. Shock Variables Involved
The shock variables involved in this paper are listed in Table 5:
Table 9.
List of shock variables.
| Impact variables | paraphrase |
| avareg (r) | Representative internal circulation. Simulate the local technological advances brought about by the consumption growth in the region. |
| aintall (a,r) | It represents the spillover type of local macro TFP growth (including forward and reverse) brought by foreign capital in the external circulation. |
| aoall (a,r) | It represents the final goods trade productivity spillover effect (both forward and reverse). Country r and the trading partner country f are connected by the final goods trade technology spillover coefficient: |
| afall (c,a,r) | Represents the intermediate goods trade productivity spillover effect (including forward and reverse). Country r and trading partner f are connected by the intermediate trade technology overflow coefficient: |
| afeall (e,a,r) | Technological advances representing factor enhancement from trade (transforming factor reinforcement (lab-biased))[1] |
6.2. Scenario Settings and Amplitude of Shocks
Baseline scenario: We run the simulation without any TFP shocks to any country just to see how much economic growth speed China would get from the baseline data. And we find that the average of 2024--2035 would be 3.46%. Any outcome of following scenario will be compared with this. All the scenarios are designed to achieve vision goal of 2035, which requires.least 5.48% economic growth averagely.
Trendy TFP scenario: We run the simulation without all basic TFP trends to other countries groups but not China, to see what this basic TFP structure of world could bring to China’s economic growth.
Scenario 1: Internal circulation: If household consumption (service-oriented consumption sector) leads to a 8% average annual macro TFP growth.
Given that China's consumption growth point is now mainly service-oriented consumption, we focus on a shock to the consumption-oriented service sector (a_OthService) from 2024 to 2035. The amplitude of 8 is decided by how much of this sector TFP increase would satisfy our vision goal of 2035.
Scenario 2: Internal circulation: If household consumption leads to an more reasonable average annual macro TFP growth of 3%.
Scenario 3: External Circulation: China acquires a 0.4% technological progress in each secondary and tertiary industry through the path of direct final trade spillover effects.
Here, the spillover impact is determined solely by trade in final products along the global value chain. With the trade friction between China and the United States and the recent emergence of other "anti-globalization" geopolitical factors, developed countries have begun to implement high-tech protection policies against China, among which the trade barriers for some products have become very high. In view of this, we assume that the technological spillover for China's secondary and tertiary industries is quite limited. According to the column "Percent of CEPII Base Accounts for Direct Source Industry TFP Increase" in Table 10, we can tell that, except for country group 5. NAMERICA and 7. EU28NOBOR, the world TFP growth structure will only support approximately 40% of "When the TFP of the Chinese industry grows by 1%, the TFP of the source industry increases." Thus, we determine that the corresponding total factor productivity growth rate of China's industries cannot be assumed to be as high as 1, but at most 0.4. Considering the relatively low values of direct spillover indexes for country groups 5 (0.68) and 7 (0.67), we can simply ignore these two groups.
Table 10.
List of shock variables.
| Regions | When the TFP of Chinese industry grows by 1%, the TFP direct spillover, how much of source industry increases | Percent of CEPII base accounts for direct Souce industry TFP increase | When the TFP of Chinese industry grows by 1%, the TFP indirect spillover, how much of source industry increases | Percent of CEPII base accounts for indirect Souce industry TFP increase |
| OBORYRCEP | 1.02 | 188% | 1.04 | 185% |
| 3.RCEPNOBOR | 1.22 | 47% | 1.45 | 39% |
| 4.US | 1.35 | 39% | 2.50 | 21% |
| 5.NAMERICA | 1.48 | 4% | 1.15 | 5% |
| 6.OBORYEU28 | 1.58 | 41% | 4.00 | 16% |
| 7.EU28NOBOR | 1.48 | 18% | 1.79 | 15% |
| 8.RESTOBOR | 1.43 | 82% | 1.67 | 71% |
| 9.HK | 1.28 | 81% | 100.00 | 1% |
| 10.RESTWORLD | 1.33 | 79% | 3.23 | 33% |
Scenario 4: External circulation: China acquires 0.1% technological progress in secondary and tertiary industries through path of indirect intermediate trade spillover effects.
Again, from Table 10, we see even more dispersed data this time for indirect spillovers. To be enough conservative, we just take 0.1 as the progress value.
Scenario 5: External Circulation: 1% annual growth in TFP in productive services due to US FDI.
Before, the main source of technological spillover to China's manufacturing industry was through attracting foreign investment in general product manufacturing. This was related to the low technological barriers that developed countries imposed on China in these competitive markets after its accession to the World Trade Organization. However, after 2004, the share of FDI in China's manufacturing industry has declined rapidly, while the technological level of China's general products has reached (or approached) the world frontier level. The "14th Five-Year Plan for the Utilization of Foreign Investment" pointed out that in 2021, the actual use of foreign investment in the service industry increased by 22.5%, with manufacturing only growing by 1.9%; the actual use of foreign investment in high-tech industries increased by 29.1%, with high-tech manufacturing growing by 15.2%, and high-tech services growing by 33.4%. It can be seen that high-tech tertiary industries have become the focus of foreign investment growth.
Among the three kinds of services in this paper, productive services (a_TransComm) consist of leasing and business services, transportation, warehousing and postal services, information transmission, computer services and software industries, scientific research and technical services, and geological exploration and finance. This means that productive services as a whole are inseparable from knowledge production and technology dissemination. Therefore, they are in turn regarded as representative of a country's high-tech tertiary industries and a country's independent innovation capability.
However, productive services do not play a significant role in China's input-output system. Overall, the share of intermediate inputs from productive services to other industries is still relatively low, reflecting China's shortage of independent innovation capabilities. Moreover, this "low" share is more prominent in light and heavy manufacturing.
Table 11.
Contribution of productive services in China's input and output.
| a_Agricultur | a_Extraction | a_ProcFood | a_TextWapp | a_LightMnfc | |
| c_TransComm Proportion of a certain industry | 12.15% | 12.21% | 12.33% | 8.94% | 9.70% |
| a_HeavyMnfc | a_Util_Cons | a_TransComm | a_OthService | ||
| c_TransComm Proportion of a certain industry | 8.20% | 9.45% | 27.40% | 20.47% |
Based on this, we assume a 1% annual technological progress impact on productive services (a_TransComm), and artificially assume technology source is the world technology frontier in the United States, and referring to the threshold effect power value of 0.34 (Table 3, US column ) and technology direct and indirect spillover value of 0.74 and 0.4 (Table 4, US row) we got before, the corresponding required positive shock happening in US can be assumed with conservation as 1 as well.
Scenario 5 plus: External circulation: 5% annual TFP growth impact on productive services brought about by US FDI .
Scenario 6: External circulation: Combination of all above external scenarios of 3, 4 and 5.
Scenario 7: Combination of all above internal and external scenarios of 2, 3, 4, and 5.
In the World Bank's "Top 10 Global Manufacturing Scale" list, China's manufacturing industry achieved an industry GDP of over $3.85 trillion in 2020, while the US manufacturing industry slightly surpassed $2.34 trillion, accounting for approximately 60% of China's manufacturing scale and 11.2% of the US's total economy. In order to revitalize the US manufacturing industry, starting from Obama, several US presidents have successively signed multiple "manufacturing reshoring" acts, such as the "Manufacturing Enhancement Act," "National Defense Production Act," and the National Network for Manufacturing Innovation (NNMI), continuously incentivizing the return of manufacturing to the US. The latest actions include the "Inflation Reduction Act" (IRA), officially passed by the US Senate on August 7, 2022, which plans to provide billions of dollars in tax credits to the photovoltaic manufacturing industry. This may result in the return of several tens of gigawatts of solar panel production to the US coast. On August 9, Biden officially signed the "Chip and Science Act," which claims that the current global semiconductor manufacturing is mainly concentrated in East Asia, with the US domestic share shrinking from nearly 40% in the early 1990s to around 12%. Therefore, the $280 billion law includes $52.7 billion allocated from 2022 to 2026 for subsidizing the construction and updating of semiconductor fabs to promote the reshoring of semiconductor manufacturing to the US. The chip act strongly hinders China from accessing related technologies, including restrictions such as not allowing US companies to invest in sub-28nm process technology in China if they receive national subsidies during the assistance period.
In response to this, we have considered and examined four scenarios based on Scenario 7 describing the United States' re-manufacturing, representing decoupling between the US and China. We hypothesize that industrial sectors in the United States (light industry (a_LightMnfc) and heavy industry (a_HeavyMnfc)) have experienced technological progress of 2% in both long terms (persisting between 2022 and 2035) and short terms (from 2025 to 2028), and 5% in both long and short terms. Additionally, to reflect the nature of the United States' global supply chain reversion, we apply shocks of 1% and 0.5% technological progress in the short and long terms, respectively, to simulate possible supply chain re-shoring effects, to the North American country group, which means the US manufacturing sector would most likely cooperate with that group to build up its own value chain.
Scenario 8: External Circulation: Factor-strengthening of Global Value Chain Technology Effects.
As shown in formula (3), γ ranges from 0 to 1. In this paper, 0.5 is taken. No matter through final or intermediate goods trade, γ means that the spillovers of the global value chain on China can be absorbed and spread to factors in China. Here, factors refer to skilled labor, unskilled labor, and capital, excluding land and natural resources. Each type of technological spillover is divided into three cases in this sense. Since this scenario cannot exist independently, it needs to be combined with scenarios 3 and 4, respectively.
7. Results and Analyses
The forecast range of this paper is from 2024 to 2035. Table below shows the average economic growth rate of China during this period, the year in which China's total GDP surpasses the United States, the CEPII PPP per capita GDP2 in 2035 value ) under each scenario from 1 to 8 .
Table 12.
Basic results of shocks.
| Average growth rate for 2024-2035 | The effect of scenario factors on the baseline mean velocity | China surpassed the United States in which year | GDP per capita in 2035 | |
| Baseline scenario | 3.46% | n.a. | n.a. | 24891 |
| Trendy TFP scenario | 3.17% | -0.30% | n.a. | 23415 |
| Scenario 1: Consumption increased by 8% | 5.48% | 2.02% | 2033 | 30544 |
| Scenario 2: Consumption increased by 3% | 4.17% | 0.70% | n.a. | 26284 |
| scenario 3: Technical progress of the final products | 5.11% | 1.65% | 2035 | 29306 |
| scenario 4: Technological progress of intermediate products | 2.51% | -0.96% | n.a. | 21679 |
| Scenario 5: FDI 1% | 3.29% | -0.17% | n.a. | 23755 |
| Scenario 5 plus: FDI 5% | 3.63% | 0.17% | n.a. | 24706 |
| scenario 3 + 4: Final and intermediate goods technological advances | 4.39% | 0.92% | n.a. | 26964 |
| scenario 3 + 5 | 5.20% | 1.74% | n.a. | 29610 |
| scenario 4 + 5 | 2.63% | -0.83% | n.a. | 21995 |
| Scenario 6: 3+4+5 | 4.48% | 1.01% | n.a. | 27249 |
| Scenario 7: Trade plus FDI 1% plus consumption 3% | 5.24% | 1.78% | 2035 | 29723 |
| scenario 7+ decoupling 2%, short term | 5.19% | 1.72% | n.a. | 29552 |
| scenario 7+ decoupling 2%, long term | 5.38% | 1.92% | n.a. | 30217 |
| scenario 7+ decoupling 5%, short term | 4.38% | 0.92% | n.a. | 26949 |
| scenario 7+ decoupling 5%, long term | 3.31% | -0.16% | n.a. | 23775 |
| scenario 3+8C Final goods plus capital | 5.44% | 1.97% | n.a. | 30410 |
| scenario 3+8SFinal goods plus skilled | 5.16% | 1.69% | 2035 | 29455 |
| scenario 3+8U Final goods plus unskilled | 5.28% | 1.81% | 2035 | 29860 |
| scenario 4+8C Intermediate goods plus capital | 2.82% | -0.64% | n.a. | 22486 |
| scenario 4+8S Intermediate goods plus skilled | 2.55% | -0.91% | n.a. | 21798 |
| scenario 4+8U Intermediate goods plus unskilled | 2.68% | -0.79% | n.a. | 22110 |
Under the baseline scenario, the average economic growth rate from 2025 to 2035 was 3.46%, and in 2035, China's per capita GDP reached 24,891 US dollars. The Trendy TFP scenario indicates that if all other countries are experiencing technological progress while China is not, then China will have an average negative growth rate of -0.3%, meaning it is lagging behind the world.
In scenario 1, a speed of 8% is needed for China to achieve the ideal economic growth by 2035 only through internal circulation. This is not very likely to happen.
In scenario 2, a rather reasonable increase of 3% in terms of consumption will give China a 0.7% positive average growth rate.
Scenario 3 shows that the final goods trade technological spillover effect, supported by the world TFP trend structure, would give China the opportunity to approach the needed speed, with an additional economic growth effect of 1.65%.
Scenario 4 has a negative effect on China's economic growth. Even though we have constrained this speed to be only 0.1%, given the more dispersed data of indirect spillovers, the harmful effect equals almost -1%, which is quite significant.
If the trade modes of final and intermediate goods are combined (scenario 3 + 4), we obtained a positive growth of 0.92%, larger than the sum of scenario 3 and scenario 4 by 0.23%. This exactly demonstrates the existence of the global value chain. Although reversed, it indicates that China's current intermediate goods trade and final goods trade with the world are not independent but intrinsically integrated with each other. They are both parts of the global value chain, and the manufacturing of most products requires the involvement of both types of trade to be completed. Otherwise, if China only engages in intermediate goods international trade and all the final goods produced are consumed by China's domestic demand, China's economic growth rate could be hindered by substantial importations of upstream components. When combined, the original economic growth increment created by the final goods part is somewhat mitigated by the intermediate part, showing a complementary effect between final and intermediate trades. Moreover, compared to intermediate goods, final goods trade is relatively independent and has a positive effect on economic growth.
In scenario 5, if foreign investment in productive service industries brings a 1% technological progress annually, its effect on China's economic growth is similarly negative as intermediate trade, at -0.17%.
In scenario 5 plus, if we increase the technological progress brought by foreign investment in productive service industries to 5%, the outcome would shift from negative to positive, although it would still be quite small, at 0.17%. However, the assumption of an average annual technological progress of 5% is obviously too high.
In scenario 6, by fully integrating foreign investment with foreign trade (combining final goods and intermediate goods trade), the incremental economic growth rate from 2024 to 2035 is 1.01%. This is the subtotal of external circulation.
If we combine scenario 2 (reasonable internal) with scenario 6 (reasonable external), we get scenario 7, and achieve a rather ideal growth rate of 1.78%, with per capita GDP reaching 29,723 by 2035. This could be seen as almost the sum of the two scenarios mechanically combined, making this scenario the most reasonable pattern of China's TFP development.
Decoupling effects show that in the short term, slow re-manufacturing of the US has no effect on China, while in the long term, slow re-manufacturing even has a positive effect on China. However, fast re-manufacturing of the US, regardless of the term, has significant effects on China.
Scenario 8: Table 12 shows that if land and natural resources are excluded from factor-enhanced technological advances, the remaining three economic input elements—capital, skilled labor, and unskilled labor—demonstrate how factor intensification occurs through trade in final or intermediate goods when working with Scenario 3 or Scenario 4.
Table 13.
Factor-intensifying spillover.
| scenario 3 + 8 final goods spillover on Capital factor |
scenario 3 + 8 final goods spillover on Skilled labor factor |
scenario 3 + 8 final goods spillover on Unskilled labor factor |
scenario 4 + 8 intermediate goods spillover on Capital factor |
scenario 4 + 8 intermediate goods spillover on Skilled labor factor |
scenario 4 + 8 intermediate goods spillover on Unskilled labor factor |
|
|---|---|---|---|---|---|---|
| The extra effect of scenario 8 on scenario 3 or 4 | 0.32% | 0.04% | 0.16% | 0.32% | 0.05% | 0.17% |
To sum up, the above estimations show that China's per capita GDP is projected to reach $30,000 in 2035 present value terms when Scenario 1, with its not-so-reasonable 8% internal circulation assumption, or the more reasonable Scenario 3, or other scenarios dominated by Scenario 3 occur. In terms of overall economic size, measured in US dollars, for those scenarios aiming to reach the 2035 per capita goal, China is projected to surpass the United States in 2035.
8. Main Findings
8.1. The Vision Goal of 2035 Can Be Achieved as Long as China Maintains Its Trade Opening Policy. The Final Product Technological Spillover in the Global Value Chain Has Been the Main Channel for China to Achieve TFP Increases, thus Making External Circulation More Important than the Internal One for China, although "Internal" Has Been Defined as the "Mainstay"
Obviously, Scenario 3 has the best economic growth effect compared to other separate scenarios. This indicates that as long as China maintains openness to the world and participates in the global value chain of the international economy, it will secure this main contributor.
As for the negative effect of Scenario 4, we attempted to extend the discussion by using one-tenth of the original shock. That is, we further constrained this intermediate increase speed to be only 0.01%, and we obtained the following result: a -0.38% impact on economic growth. This means that the negative impact of Scenario 4 cannot be eliminated under any circumstances. When we combine Scenario 3 with this diminished Scenario 4, we find that the effect of scenario factors on the baseline mean velocity becomes 1.55% from its original 0.92%, and the economic growth effect becomes 5.02% from 4.39%. This 5.02% can be regarded as the functioning limit of the superposition growth effect of final and intermediate trades' TFP spillover.
Table 14.
superposition of scenario 3 and tenth of the scenario 4.
| Average growth rate for 2024-2035 | The effect of scenario factors on the baseline mean velocity | China surpassed the United States in which year | GDP per capita in 2035 | |
| ideal scenario 4: Technological progress of intermediate products | 3.08% | -0.38% | n.a. | 23181 |
| scenario 3 + ideal 4: Final and intermediate goods technological advances | 5.02% | 1.55% | n.a. | 28981 |
All external circulation depends on the stability of the international geopolitical atmosphere.
On the other hand, since internal circulation requires only domestic consumption and total factor productivity growth, it is more controllable and reliable, and easier for the central government to stimulate. If "deglobalization" intensifies, China will have to shift towards domestic demand as the main driver of technological progress. Consumption (internal circulation) will have this potential to function. This is why the Chinese Communist Party emphasized that domestic circulation is the mainstay, and the domestic and international circulations reinforce each other. This "mainstay" does not refer to the majority in quantity but rather to the foundation and cornerstone for stable and secure economic development.
Essentially, regardless of Foreign Direct Investment (FDI), we can achieve a very reasonable combination of an ideal economic growth rate rooted in Total Factor Productivity (TFP) from dual pathways: Scenario 3 plus Scenario 4 forms the basic base, with an additional effect on the baseline of 0.92%. From there, we hope to minimize the effect of Scenario 4 as much as possible, until it is reduced to one-tenth of its previous extent, denoting a speed of 1.55%. Then, we turn to consumption (internal circulation) for further TFP-driven growth, aiming for an additional rate of 0.70% (Scenario 2):
3.46% baseline rate + (0.92%+0.70%, 1.55%+0.70%) = (5.08%, 5.71%)
8.2. The Economic Growth Impacts of External and Internal Circulations Operate Relatively Independently. However, Foreign Direct Investment (FDI) Itself Has a Limited Effect but Provides a Synergistic Effect to All Forms of External Trade Circulation
The reason we add the consumption-TFP-driven economic growth rate of 0.70% directly to the result of the possible internal scenario 3 plus scenario 4 from the last main finding is that we find internal circulation to be rather independent. What forms a stark contrast is that when FDI is added to either final trade or intermediate trade, we can find positive effects as follows: FDI itself has a limited effect of -0.17% when it grows by 1% per year and only 0.17% when it grows by 5% per year, even in the productive service sectors where China is relatively lacking in capital. In particular, there is a slightly greater synergistic effect between foreign investment and intermediate goods trade.
Still, if we combine foreign scenario 5 with all trade modes, we find that the sum is larger than what we obtained separately, with an additional 0.09% in scenario 6.
Table 15.
Synergistic effect of FDI to trades.
| The effect of scenario 3 on the baseline mean velocity | scenario 3 + 5 | Synergistic of FDI | The effect of scenario 4 on the baseline mean velocity | scenario 4 + 5 | Synergistic of FDI |
| 1.65% | 1.74% | 0.09% | -0.96% | -0.83% | 0.13% |
8.3. As for International Trade Partners, We Find That the Regional Comprehensive Economic Partnership (RCEP) Is the Most Important Strategic One to China
In terms of technology spillover through final goods trade, the coefficients for the country set 5 of NAMERICA, set 6 of OBORYEU28, and set 7 of EU28NOBOR are significantly lower compared to the coefficients of the main technology spillover source countries of China (set 2 of OBORYRCEP and set 3 of RCEPNOBOR). This indicates that, in the current rise of "deglobalization" sentiment, it is almost impossible to obtain technology spillover effects from EU groups, and the combination of set 2 and set 3 makes the RCEP most important to China now.
Currently, there are five sets of countries that serve as the main sources of technology spillover through final goods trade. Three of these, set 3 of RCEPNOBOR, set 4 of the US, and set 9 of Hong Kong, are developed regions and include countries such as Japan, South Korea, Australia, and New Zealand from the RCEP countries and the US. Therefore, besides the RCEP countries, maintaining good relations with the US is perhaps the most realistic choice for China. And again, set 3 of RCEPNOBOR is very important to China. It is not surprising to see the Hong Kong Special Administrative Region here because its trade structure is focused on re-export to mainland China.
The other two sets of countries, set 8 of RESTOBOR (27 countries in the Middle East and Western Asia direction of the OBOR) and set 10 of RESTWORLD, both have medium-low coefficients. Considering that set 6 of OBORYEU28 has been among the lowest, we can safely draw a conclusion that the development of the Belt and Road Initiative has not taken the strategic position that the initiative was expected to have for China. This forward-thinking "going global" strategy is crucial for China's economic development in the next century in terms of potential.
8.4. Apparently, FDI Is Not an Effective Way to Lift the Productive Services Sector's TFP, and since the Productive Services Sector Relies Heavily on Importation, a Realistic Choice for China Is to Open Wider the Productive Services Market
It is worth noting that in the productive service inputs required by various industries, compared with other countries, China generally relies more on imports, as shown in the table below. The table presents the comparative situation of China's productive services as inputs to certain industries compared to a specific country. A value greater than 1 indicates that China needs more imports compared to that specific country. The data shows that, except for European countries, China's industries generally rely more on imports of productive services. As European countries are part of a unified large market, they are accounted for separately only in statistics. Therefore, it may seem that China is not as dependent on imports compared to European countries. However, in Europe, a large amount of imports does not necessarily indicate an increase in uncertainty. Excluding Europe, a ratio greater than 1 indicates that China's productive service capacity is severely lacking compared to other countries and has to rely on imports, thereby increasing economic uncertainty.
The aforementioned descriptions of the effects of FDI have indicated that improvements in this area cannot rely on foreign investment. Therefore, the realistic choice for China is to open wider the productive services market to stimulate domestic competition and facilitate efficiency.
Table 16.
Comparison of the proportion of productive services contributing to other industries in China with that of other countries.
Table 16.
Comparison of the proportion of productive services contributing to other industries in China with that of other countries.
| A collection of countries compared with China | a_Agricultur | a_Extraction | a_ProcFood | a_TextWapp | a_LightMnfc | a_HeavyMnfc | a_Util_Cons | a_TransComm | a_OthService |
| OBORYRCEP | 1.08 | 0.79 | 2.41 | 1.50 | 1.44 | 1.62 | 1.01 | 0.19 | 0.35 |
| RCEPNOBOR | 1.86 | 0.69 | 3.61 | 0.98 | 1.78 | 1.31 | 2.14 | 0.59 | 2.25 |
| US | 6.57 | 6.34 | 3.93 | 6.11 | 5.76 | 6.86 | 1.25 | 3.20 | 1.05 |
| NAMERICA | 1.63 | 1.33 | 3.06 | 3.40 | 2.53 | 2.41 | 1.44 | 1.07 | 1.84 |
| OBORYEU28 | 0.82 | 0.49 | 0.82 | 0.68 | 0.62 | 0.77 | 0.56 | 0.41 | 0.66 |
| EU28NOBOR | 0.43 | 0.25 | 0.35 | 0.45 | 0.46 | 0.45 | 0.49 | 0.33 | 0.60 |
| RESTOBOR | 1.85 | 1.52 | 2.31 | 3.33 | 2.05 | 1.90 | 1.20 | 0.84 | 1.12 |
| HK | 0.43 | 0.95 | 0.73 | 1.03 | 1.00 | 0.98 | 0.48 | 1.07 | 1.14 |
| RESTWORLD | 1.63 | 1.15 | 1.63 | 2.01 | 1.75 | 1.94 | 0.96 | 0.69 | 1.21 |
8.5. For Factor-Strengthening Effects, Spillovers Are Generally more Favorable to "Capital" than to the Other Two Factors
Table 12 illustrates that among the three productive factors, the capital-augmenting effect is most pronounced in both final product trade and intermediate product trade spillover supplementary cases. This implies that although FDI may not play as crucial a role in increasing China's TFP as it did previously, domestic capital as a factor can still learn from international trade and develop the potential to provide additional growth effects.
Furthermore, the effects of skilled labor are the least pronounced.
Regarding the technological progress obtained by unskilled labor, intermediate goods trade can play a slightly greater role than final goods trade. Additionally, the supplementary effects manifested in unskilled labor are half of what is manifested in capital across both trade modes.
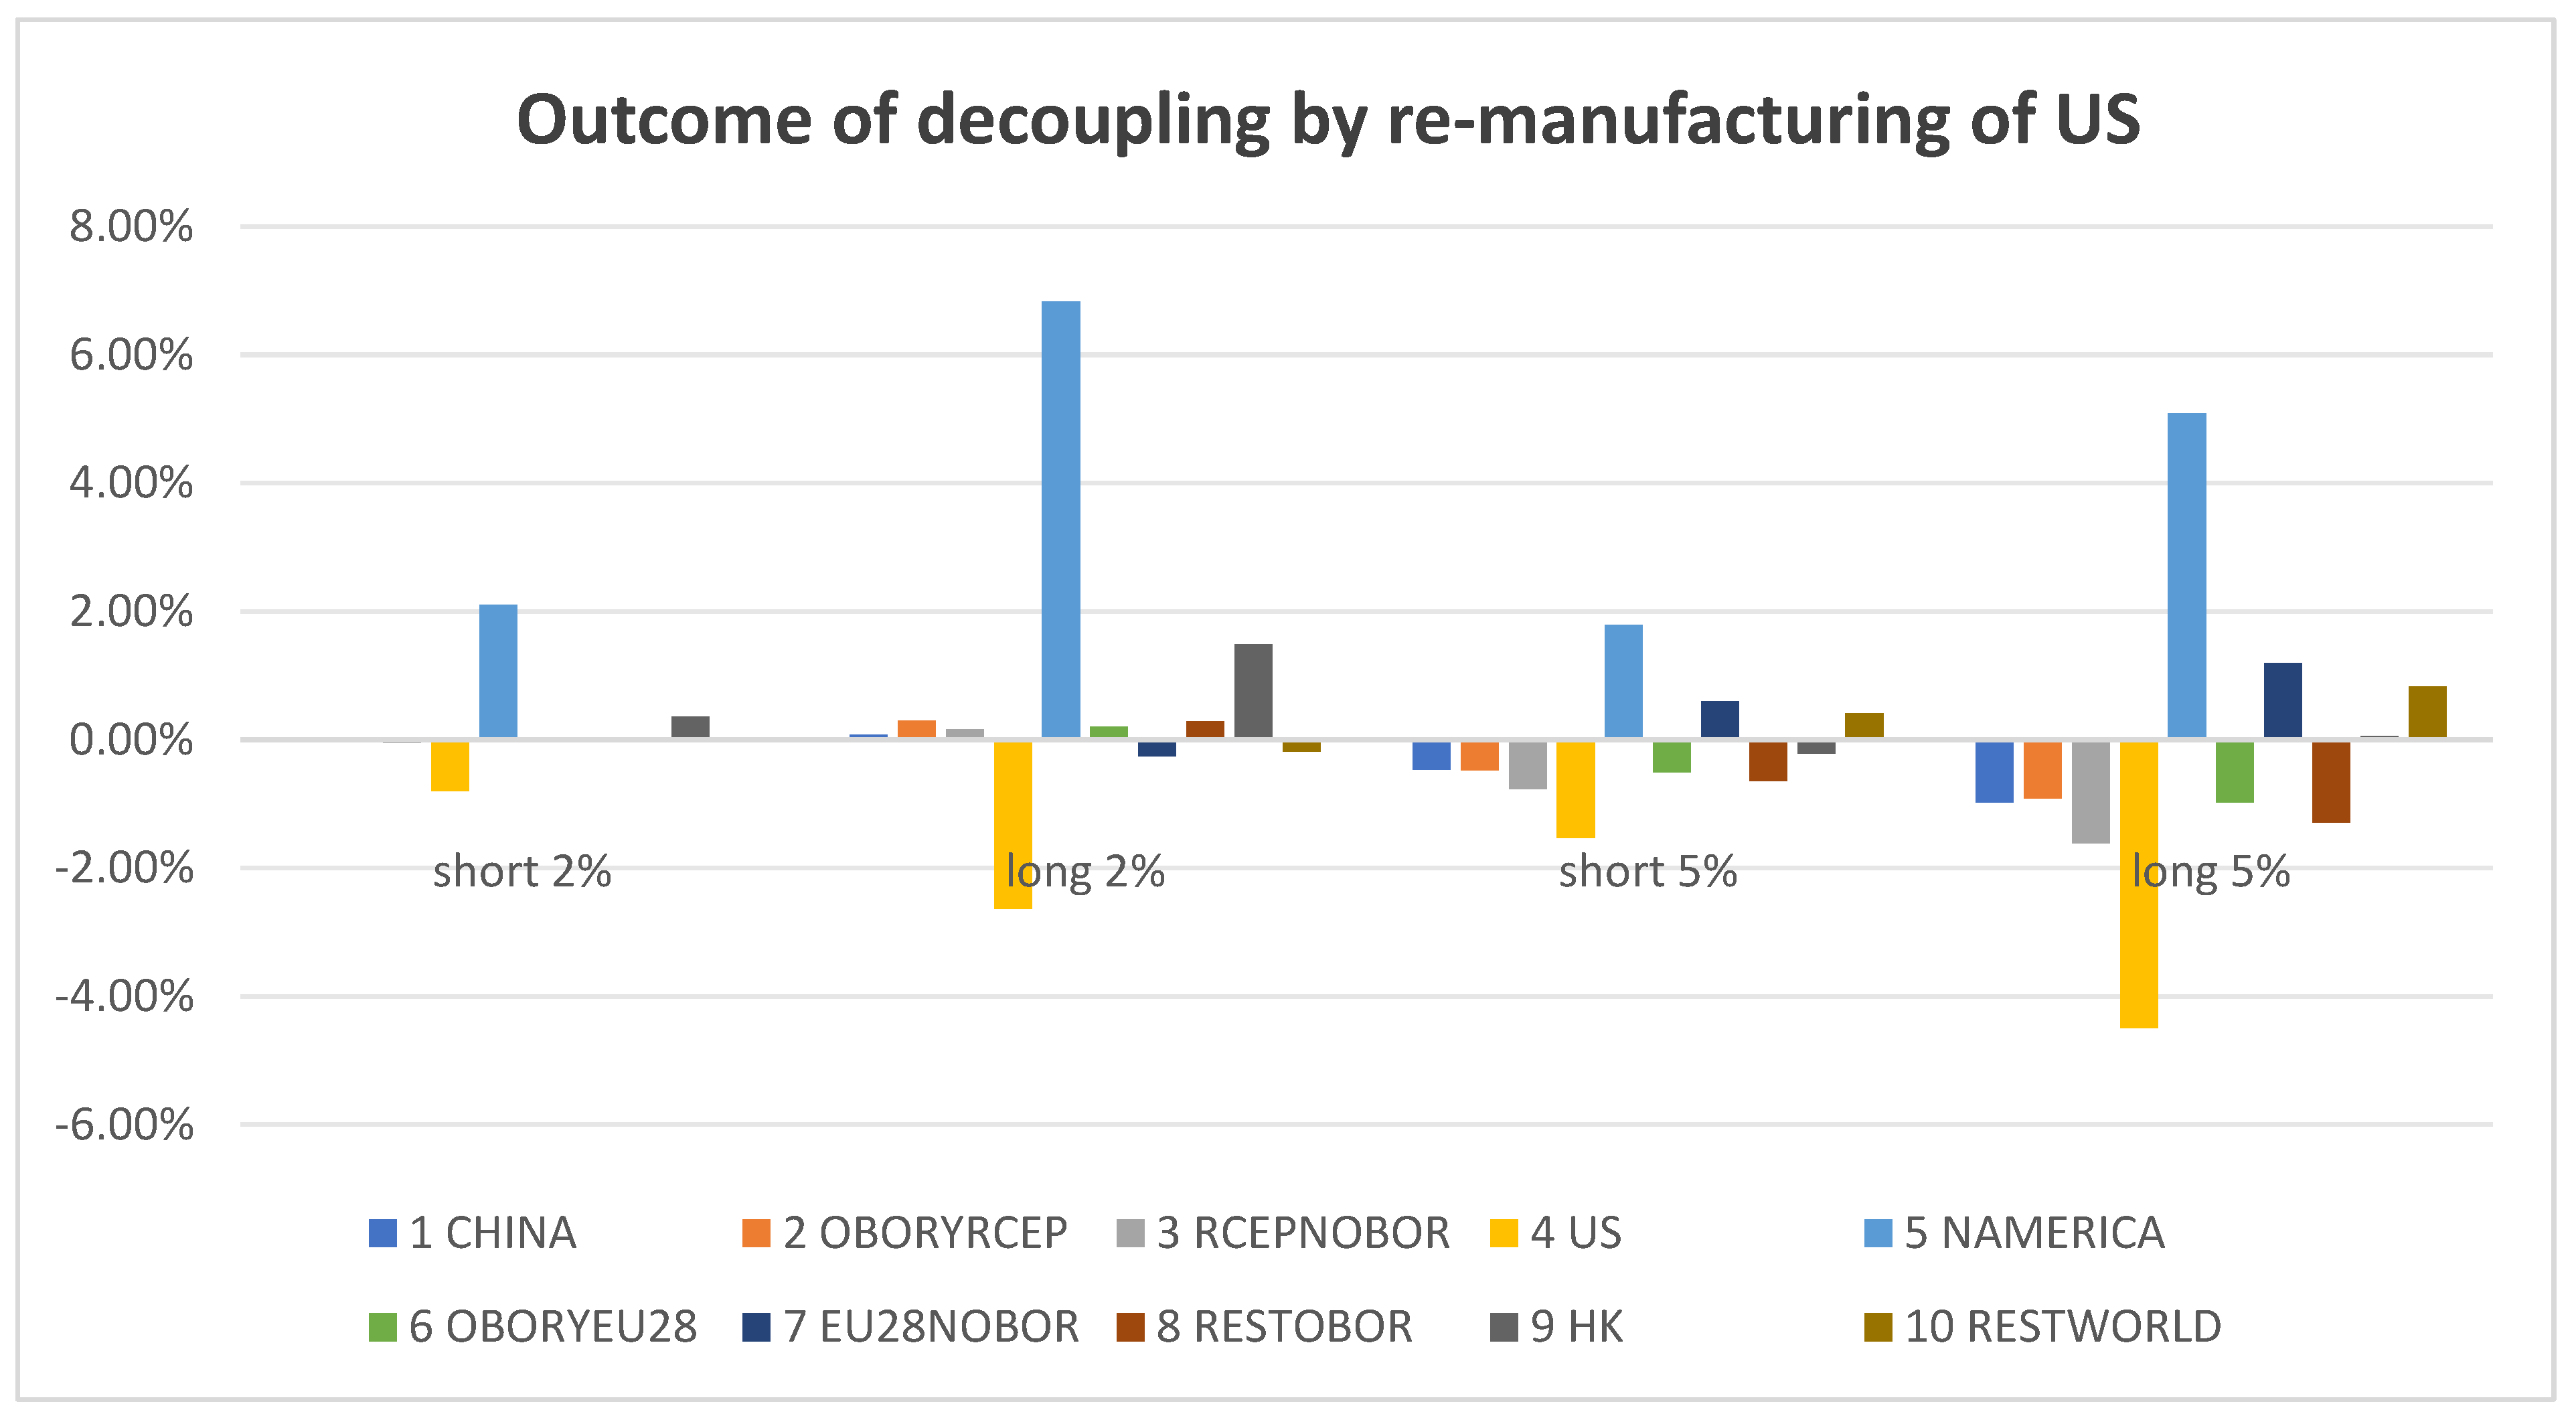
8.6. The Impact of China-US Decoupling Is Enormous to the World, and in All the Scenarios We Have Envisioned, the United States Is Always the Country that Loses the Most, and Europe Would Be the Country Group to Benefit when a Large Increase in TFP Occurs in the US
The term "decoupling" in this paper refers to the United States making technological advancements primarily with other North American countries, indicating a re-manufacturing of the US by excluding China from its global value chain, without simulating scenarios where the United States actively seeks to contain China.
Results can be seen from the chart below; it is very interesting.
First, we can see that in all cases, the United States would be the one that suffers the most, even though its domestic manufacturing sector is gaining a significant TFP increase. And regarding the extent of losses, in the comparison between time and degree, time is the better key element, meaning that long-term cases are always more severe.
Secondly, China will suffer a colossal loss only under scenarios of a relatively large TFP increase in the US, but not under scenarios of a relatively mild TFP increase. Moreover, it is intriguing that under the scenario of mild TFP increase in the long term in the US, China will be one of the countries that benefit from this change.
Thirdly, in every case, Set 5 NAMERICA (the North American region except the U.S.) is always the biggest winner. When a mild increase in TFP occurs in the US with a short interval, benefiting countries also include Set 2 OBORYRCEP (nine countries that are both part of OBOR and members of RCEP), Set 8 RESTOBOR (twenty-seven countries in the Middle East and West Asia direction of OBOR), and Set 9 HK (China Hong Kong). When with a long interval, benefiting countries cover not only the above four sets but also Set 1 CHINA, Set 3 RCEPNOBOR (four countries that are members of RCEP but not part of OBOR), and Set 6 OBORYEU28 (eighteen countries overlapping between OBOR and the European Union). When a large increase in TFP occurs in the US with a short interval, benefiting countries include Set 7 EU28NOBOR (ten countries that were part of the European Union but not part of OBOR before Brexit in the UK) and Set 10 RESTWORLD (68 other countries and regions). When with a long interval, benefiting countries will also cover Set 9 HK (China Hong Kong) in addition to the above two.
Figure 3.
Comparing the four results of simulating re-industrialization in the United States.
We can roughly depict a capacity-transition map story: When TFP (Total Factor Productivity) changes in the US are mild, besides the North American countries benefiting, the new global value chain will also require those OBOR countries that are also connected to RCEP and Hong Kong (representative of China) to join and formulate the whole chain. When this change is sustained over a long period, China and developed countries in RCEP, as well as other European OBOR countries, would also be needed. Strong and continuous technological advancements make the labor cost advantage less significant in the overall production process and emphasize more on stages of transition.However, when TFP changes are substantial, it implies that only those developed European countries have the foundation to undertake such technological growth. For further cost-saving supply chains, the US and Europe could shift to other countries in the world outside of RCEP and OBOR to avoid geopolitical pressure from the US. In the long run, key factors for the United States to choose a global production layout would depend more on geopolitical considerations.
China will be one of the countries that benefit from this change, especially in the case of mild TFP occurring in the long term in the US. The reason for this phenomenon lies in the fact that the spillover coefficient of set 5 countries is one of the lowest among country groups to China, which means it is somewhat a bottleneck in terms of technological diffusion on a global scale. Therefore, when the TFP of set 5 has been improved by cooperating more closely and more stably with the US over the long term than ever before, China will benefit instead of lose, keeping in mind that only a mild TFP increase is occurring in set 5. In the short term, this kind of change will not benefit China because the TFP has not yet taken root and grown sufficiently in set 5.
9. Policy Recommendations and Further Research Directions
Based on the above main conclusions, we propose the following policy recommendations:
1.As China shifts from high-speed growth to high-quality development and aims to establish a modern economic system, in which the mainstay is internal circulation, therefore attention should be paid to cultivate high-tech consumer hot spots and explore technological innovation space while guiding consumption to upgrade reasonably since constant evolution of consumer desires is itself a driving force for technological development.
2. Considering that China's main channel for obtaining technology spillover from the external circulation has shifted from technology spillover through foreign investment at the beginning of joining the World Trade Organization to technology spillover in final goods trade, when formulating trade encouragement policies, including free trade zone policies, emphasis should be placed on ensuring the transparency and sustained stability of these policies..
3. The "low" share of productive activities in China’s input-output table is undoubtedly related to China's status of being a "manufacturing powerhouse" that is increasingly solidified within the global value chain, other correlated factors including China's late start and weak foundation in R&D, the disconnect between the knowledge-intensive service industry and production sectors, as well as insufficient innovation capacity and low R&D efficiency in research institutions.
Therefore, establishing a collaborative innovation system between the knowledge-intensive service industry and production sectors is crucial for enhancing the future technological progress rate of productive sectors. Moreover, the current dependence on imported relevant services does not necessarily indicate an over-sufficient openness; on the contrary, it often indicates insufficient openness, resulting in the lack of internal competition and the clear characteristics of related monopolies. Therefore, while ensuring economic security, the pace at which the productive service industry is opened up should be accelerated appropriately.
Further research directions include:
1. New growth theory focuses on endogenous technological progress and emphasizes research on human capital, R&D, increasing returns, labor division and specialization, open economies, and monopolization. However, the absence of R&D variables in the GTAP database limits the model to assumptions made through external percentage shock increases. From this perspective, technology seems to be exogenous to this model. However, the technological spillover portrayed by this paper's module is consistent with the explanatory framework of endogenous growth. Therefore, further research can consider integrating more endogenous theoretical elements, such as (1) combining the D-S model that can incorporate increasing returns to scale and monopolistic competition into general equilibrium models to add and set parameters and variables; (2) introducing the MELITZ model involving micro-industry and firm efficiency.
2. Linear models offer more potential and intuitive presentations for simulating economic realities, but their linearity limits the accurate representation of nonlinear outcomes. Further research can optimize model simulation effects through parameter updates and non-parametric substitutions.
3. Dynamic recursive general equilibrium models analyze problems within the framework of general equilibrium. General equilibrium means that economic growth, under the influence of trend lines, will be slowly absorbed and dissipated by the economic system as long as enough time has passed. This framework results in the model's negative handling of shocks during recursive analysis. This may not be consistent with non-equilibrium phenomena in economic reality. Given that neoclassical and new Keynesian macroeconomics have achieved unity in dynamic stochastic general equilibrium (DSGE) methods, this paper can further conduct research based on DSGE as needed, considering non-equilibrium phenomena and divergent shocks near the steady-state.
4. The extrapolation algorithm used in this paper assumes equilibrium growth, following Kaldor's stylized facts. However, economic reality also encompasses Kuznets's insights, highlighting structural changes beyond the growth changes outlined by Kaldor's facts.
5. Further research is needed to clarify and explore the various factors behind the trade structure, international capital flows, and changes in national welfare discussed in the conclusion.
| 1 | In the IF statement of afe, On the premise that the e-element is an ENDWL, The original model emphasizes that the afelab (e, a,r), That is, when the dynamic baseline determination process is mainly inconsistent between the actual occurring GDP and the calculated GDP of the model, Used to absorb this residual difference, In order to further calibrate the variables of the model baseline (otherwise, 0), Under the condition that the baseline calibration has been conducted, The emphasis is used to depict the productivity changes transmitted through the international trade in intermediate goods afelabact (a, r), Variables with other components are set to 0. Corresponding main TABLO language formulas: afe(e,a,r) = afecom(e) + afesec(a) + afereg(r) + afeall(e,a,r) + afecomreg(e,r) + IF[e in ENDWL, afelabreg(r) + afelabact(a,r) + afelab(e,a,r)] + IF[e in ENDWXC, afendwxcreg(r) + afendwxcact(a,r) + afendwxc(e,a,r)]. |
| 2 | As before, the conversion here refers to the PPP calculation of CEPII, 1.25. |
References
- Abramovitz, M.A., 1986,” Catching Up, Forging Ahead and Falling Behind, Journal of Economic History,” Vol. 46, pp. 385-406.
- Alfaro, L., Kalemli-Ozcan, S., Sayek, S., 2009,”FDI, Productivity and Financia Development”, World Economy. 32, 111–135.
- Angel Aguiar, Erwin Corong and Dominique van der Mensbrugghe, 2019, “ The GTAP Recursive Dynamic (GTAP-RD) Model.” Center for Global Trade Analysis, Department of Agricultural Economics, Purdue University.
- Armington, P. A. (1969). “A Theory of Demand for Products Distinguished by Place of Production.” IMF Staff Papers, 16: 159-78.
- 5. sa Johansson, Yvan Guillemette, Fabrice Murtin, David Turner, Giuseppe Nicoletti, Christine de la Maisonneuve, Phillip Bagnoli, Guillaume.
- Bai Chong 'en, Zhang Qiong, 2017, Forecdiction of China's Economic Growth Potential: Supply-side Analysis of Considering Transnational Productivity Convergence and Characteristics of China's Labor force, Economic Daily, no. 4.
- Bousquet and Francesca Spinelli, 2012, “Long-term growth Scenarios” , ECONOMICS DEPARTMENT WORKING PAPERS , No.1000, ECO/WKP(2012)77.
- Azman-Saini, W. N. W., A. Z. Baharumshah and S. H. Law , 2010a, “Foreign Direct Investment, Economic Freedom and Economic Growth: International Evidence”, Economic Modelling, 27,5,1079–89.
- Azman-Saini, W.; Law, S.H.; Ahmad, A.H. FDI and economic growth: New evidence on the role of financial markets. Econ. Lett. 2010, 107, 211–213. [CrossRef]
- Baldwin,R. ,2011,“Trade and Industrialisation after Globalisation's 2nd Unbundling:How Building and Joining a Supply Chain are Different and Why it Matters”,NBER Working Paper,No. 17716.
- Battese, G.E.; Coelli, T.J. A model for technical inefficiency effects in a stochastic frontier production function for panel data. Empir. Econ. 1995, 20, 325–332. [CrossRef]
- Baumol, W.J., S.A. Batey Blackman and E.N. Wolff., 1989. “Productivity and American Leadership: The Long View”, Cambridge Mass, MIT Press.
- Beerli, A.; Weiss, F.J.; Zilibotti, F.; Zweimüller, J. Demand forces of technical change evidence from the Chinese manufacturing industry. China Econ. Rev. 2020, 60, 101157. [CrossRef]
- Bekaert, G.; Harvey, C.R.; Lundblad, C. Financial Openness and Productivity. World Dev. 2011, 39, 1–19. [CrossRef]
- Borensztein, E., De Gregorio, J., Lee, J., 1998, “How does Foreign Direct Investment Affect Economic Growth? ” Journal of International Economics, 45 (1), 115–135.
- Baltabaev, B. Foreign Direct Investment and Total Factor Productivity Growth: New Macro-Evidence. World Econ. 2013, 37, 311–334. [CrossRef]
- Bournakis, I., Christopoulos, D., and Mallick, S. , 2018, “ Knowledge Spillovers and Output Per Worker: an Industry‐level Analysis for OECD Countries”, Economic Inquiry, 56(2), 1028-1046. [CrossRef]
- O’Neill, B.C.; Kriegler, E.; Riahi, K.; Ebi, K.L.; Hallegatte, S.; Carter, T.R.; Mathur, R.; van Vuuren, D.P. A new scenario framework for climate change research: the concept of shared socioeconomic pathways. Clim. Chang. 2014, 122, 387–400. [CrossRef]
- Buckley, P.J.; Clegg, J.; Wang, C. The Impact of Inward FDI on the Performance of Chinese Manufacturing Firms. J. Int. Bus. Stud. 2002, 33, 637–655. [CrossRef]
- Cai, P., 2017. “ Understanding China’s Belt and Road Initiative. Lowy Institute.” 1–26.
- https://www.lowyinsti tute.org/sites/default/files/documents/Understanding China’s Belt and Road Initiative_WEB_1.pdf.
- Caselli, F.; Coleman, W.J. Cross-Country Technology Diffusion: The Case of Computers. Am. Econ. Rev. 2001, 91, 328–335. [CrossRef]
- Chen, Y.; Xu, C.; Yi, M. Does the Belt and Road Initiative Reduce the R&D Investment of OFDI Enterprises? Evidence from China’s A-Share Listed Companies. Sustainability 2019, 11, 1321. [CrossRef]
- Coe, D.T.; Helpman, E. International R&D spillovers. Eur. Econ. Rev. 1995, 39, 859–887. [CrossRef]
- Coe, D.T., Helpman, E., Hoffmaister, A.W., 1997, “North-South R&D spillovers”, The Economic Journal ,107, 134–149.
- Coe, D. T., E. Helpman, and A.W. Hoffmaister. 1997, “North-South R & D Spillovers.” The Economic Journal, 107, , 134–49.
- Coe, D.T.; Helpman, E.; Hoffmaister, A.W. International R&D spillovers and institutions. Eur. Econ. Rev. 2009, 53, 723–741. [CrossRef]
- Cooray, A.; Dutta, N.; Mallick, S. Trade Openness and Labor Force Participation in Africa: The Role of Political Institutions*. Ind. Relations: A J. Econ. Soc. 2017, 56, 319–350. [CrossRef]
- Cooray, A.; Mallick, S.; Dutta, N. Gender-specific Human Capital, Openness and Growth: Exploring the Linkages for South Asia. Rev. Dev. Econ. 2014, 18, 107–122. [CrossRef]
- Cozza, C., R. Rabellotti, and M. Sanfilippo., 2015 “The Impact of Outward FDI on the Performance of Chinese Firms”, China Economic Review 36: 42–57. [CrossRef]
- Das, G. G. , 2002, “Trade, Technology and Human Capital: Stylized Facts and Quantitative Evidence”, The World Economy, Vol 25, No. 2, (February 2002): 257-281.
- Das, Gouranga Gopal, 2007, “Information Age to Genetic Revolution: Embodied Technology Transfer and Assimilation — A tale of two technologies” Online at https://mpra.ub.uni-muenchen.de/37250/ MPRA Paper No. 37250.
- Das, Gouranga Gopal, 2009, “How does Trade-mediated Technology Transfer fAfect Interregional and Intersectoral Competition? Exploring multi-sectoral effects in a global trade Model” Online at https://mpra.ub.uni-muenchen.de/37256/ MPRA Paper No. 37256.
- Dierk Herzer,2011 ,“The Long-run Relationship between Outward Foreign Direct Investment and Total Factor Productivity: Evidence for Developing Countries” Journal of Development Studies, Vol. 47, No. 5, 767–785, May 2011.
- Dunning, J., 1993.,“Multinational Enterprises and the Global Economy”,Addison-Wesley Publ. Co., Reading.
- Eaton, J., Kortum, S., 1996.,“Trade in Ideas Patenting and Productivity in the OECD”,J. Int. Econ. 40, 251–278.
- Erwin L. Corong, Thomas W. Hertel, Robert A. McDougall, Marinos E. Tsigas and Dominique van der Mensbrugghe,, 2017, “The Standard GTAP Model, Version 7.” Journal of Global Economic Analysis, [S.l.], v.2, n.1, p. 1-119.
- Feng Ming, 2020, A Study on the Medium-and Long-term Potential Growth Rate of China's Economy: Progress, Consensus and Differences, Financial Think Tank, September 2020, Vol. 5, No.5,029-057.
- Foellmi, R.; Zweimüller, J. Income Distribution and Demand-Induced Innovations. Rev. Econ. Stud. 2006, 73, 941–960. [CrossRef]
- Foellmi, R. and Zweimuller, J. , 2008, “Structural Change, Engel's Consumption circulations and Kaldor's Facts of Economic Growth", Journal of Monetary Economics, 55, 1317-1328.
- Fosfuri, A., Motta, M., & Rønde, T. , 2001, “ Foreign Direct Investment and Spillovers Through Workers’ Mobility”, Journal of International Economics, 53, 205–222.
- Fu, X., J. Hou, and X. Liu., 2018,.“Unpacking the Relationship between Outward Direct Investment and Innovation Performance:Evidence from Chinese Firms.” World Development 102: 111–123. [CrossRef]
- Gao Shanwen, July 17,2022, China's Current Market Situation and Long-term Growth prospects ". See the section of https: / / www.163.com/dy/article/HCG7JKI70519X10F.html。This conclusion removes a sample of countries with less than 1 million people in high-income countries.
- Görg, H., Greenaway, D., 2004, “Much Ado about Nothing? Do Domestic Firms Feally Benefit from Foreign Direct Investment? ”World Bank Res. Obs. 19 (2), 171.
- Hall, R.E.; Jones, C.I. Why do Some Countries Produce So Much More Output Per Worker than Others?. Q. J. Econ. 1999, 114, 83–116. [CrossRef]
- Hans van Meijl and Frank van Tongeren, 1999, “Endogenous International Technology Spillovers And Biased Technical Change.” GTAP Technical Paper No. 15.
- Hayami, Y and V.W. Ruttan. 1985.”Agricultural Development:An International Perspective”, Baltimore and London: The John Hopkins University Press.
- He Jingtong, He Lei, 2016, empirical Research on Factor Allocation, Productivity and Economic Growth ——— Empirical Research from the Perspective of the Whole Industry, Industrial Economic Research, 2016, Phase III.
- Hertel, T.W. and M.E. Tsigas, 1997, "Structure of the Standard GTAP Model", Chapter 2 in T.W. Hertel (editor), Global Trade Analysis: Modeling and Applications, Cambridge University Press,.
- Herzer, D.; Klasen, S.; D., F.N.-L. In search of FDI-led growth in developing countries: The way forward. Econ. Model. 2008, 25, 793–810. [CrossRef]
- Hicks, J.R. 1932. “The theory of wages”, London: Macmillan and Co. Ltd.
- Hou, J.; Chen, S.-C.; Xiao, D. Measuring the Benefits of the “One Belt, One Road” Initiative for Manufacturing Industries in China. Sustainability 2018, 10, 4717. [CrossRef]
- Hsieh, C. T., & Klenow, P. J. , 2010, “Development accounting.” American Economic Journal: Macroeconomics, 2, 207–23.
- Hu, A.G.Z.; Jefferson, G.H. FDI Impact and Spillover: Evidence from China's Electronic and Textile Industries. World Econ. 2002, 25, 1063–1076. [CrossRef]
- Huang, T., 2002, “Spillover from Taiwan, Hong Kong and Macau investment in Chinese industries”, Contemp. Econ. Policy 22 (1), 13–25.
- Huang, Y.; Zhang, Y. How does outward foreign direct investment enhance firm productivity? A heterogeneous empirical analysis from Chinese manufacturing. China Econ. Rev. 2017, 44, 1–15. [CrossRef]
- Hymer, S.H.; Rugman, A.M. The International Operations of National Firms: A Study of Direct Foreign Investment; Springer Science and Business Media LLC: Cham, Switzerland, 2009; pp. 33–35.
- Hyuk-Hwang Kima, Hongshik Leeb,, Joonhyung Lee, 2015, “ Technology Diffusion and Host–country Productivity in South-South FDI Flows”.Japan and the World Economy 33 (2015) 1–10.
- IPCC, Core Writing Team, R.K. Pachauri and L.A. Meyer (eds.), 2014, “ Climate Change 2014: Synthesis Report.”, Contribution of Working Groups I, II and III to the Fifth Assessment Report of the Intergovernmental Panel on Climate Change, IPCC, Geneva, Switzerland, 151 pp.
- Javorcik, B.S. Does Foreign Direct Investment Increase the Productivity of Domestic Firms? In Search of Spillovers Through Backward Linkages. Am. Econ. Rev. 2004, 94, 605–627. [CrossRef]
- Kang, L., F. Peng, Y. Zhu, and A. Pan. 2018., “ Harmony in Diversity: Can the One Belt One Road Initiative Promote China’s Outward Foreign Direct Investment?” Sustainability (Switzerland) 10 (9): 1–28. [CrossRef]
- Keller, W., 1998. “Are International R&D Spillovers Trade-related? Analyzing Spillovers Among Randomly Matched Trade Partners”, Eur. Econ. Rev. 42,1469–1481.
- Kose, M.A.; Prasad, E.S.; Terrones, M.E. Does openness to international financial flows raise productivity growth?. J. Int. Money Finance 2009, 28, 554–580. [CrossRef]
- Li, C.; Tanna, S. The impact of foreign direct investment on productivity: New evidence for developing countries. Econ. Model. 2018, 80, 453–466. [CrossRef]
- Li, M.; Li, D.; Lyles, M.; Liu, S. Chinese MNEs' Outward FDI and Home Country Productivity: The Moderating Effect of Technology Gap. Glob. Strat. J. 2016, 6, 289–308. [CrossRef]
- Fontagné, L.; Perego, E.; Santoni, G. MaGE 3.1: Long-term macroeconomic projections of the World economy. Int. Econ. 2022, 172, 168–189. [CrossRef]
- Li Shantong, 2010, "Outlook for China's Economic Growth from the 12th Five-Year Plan period to 2030", Economic Research Reference, no. 43,2010.
- Li, X.; Liu, X. Foreign Direct Investment and Economic Growth: An Increasingly Endogenous Relationship. World Dev. 2005, 33, 393–407. [CrossRef]
- Li, X., Liu, X., Parker, D., 2001, “ Foreign Direct Investment and Productiv-ity Spillovers in the Chinese Manufacturing Sector.”, Econ. Syst. 25 (4),305–321.
- Liu, H.Y., Tang, Y.K., Chen, X.L., Poznanska, J., 2017, “The Determinants of Chinese Outward FDI in Countries Along ‘One Belt One Road’ ” , Emerg. Markets Finance Trade 53 (6), 1374–1387.
- Liu Shijin, 2020, Goals, Policies and Reforms under the War-Epidemic Growth Model, China Economic Report, no. 3,2020.
- Liu, X.; Parker, D.; Vaidya, K.; Wei, Y. The impact of foreign direct investment on labour productivity in the Chinese electronics industry. Int. Bus. Rev. 2001, 10, 421–439. [CrossRef]
- Liu, Z. Foreign Direct Investment and Technology Spillover: Evidence from China. J. Comp. Econ. 2002, 30, 579–602. [CrossRef]
- Lucas G.L., Brand~ao, Philipp Ehrl , 2019, “International R&D Spillovers to the Electric Power Industries”, Energy 182 (2019) 424e432.
- Lu Yang, CAI Fang, 2016, From Demographic Dividend to Reform Dividend: A Simulation Based on China's Potential Growth Rate, World Economy, No.1.
- Lu Yucheng, Zhou Jian, Zhou Sheng, Lu Chuanyi, 2021, Scenario Analysis of China's Energy Demand and Carbon Emission in 2035 under the Carbon Neutral Goal, China Energy, no. 8.
- Mastromarco, C., Simar, L., 2018, “Globalization and Productivity: a Robust Nonparametric World Frontier Analysis”, Econ. Modell. 69, 134–149. [CrossRef]
- van Meijl, H. Measuring Intersectoral Spillovers: French Evidence. Econ. Syst. Res. 1997, 9, 25–46. [CrossRef]
- Meijl, Hans. van and Frank van Tongeren, 1998, “Trade, Technology Spillovers, and Food Production in China.” Weltwirtschaftliches Archiv, Band 134 (Heft 3): 443-449.
- Meryer, K.E., Sinani, E., 2009. “When and Where does Foreign Direct Investment Generate Positive Spillovers? A Meta-analysis.”, J. Int. Bus. Stud. 40 (7), 1075.
- Minghao Li, Edward J. Balistreri, Wendong Zhang,2020,“The U.S.–China Trade War: Tariff Data and General Equilibrium Analysis”,Journal of Asian Economics, 69, 101216.
- Navaretti, G.B.; Tarr, D.G. International Knowledge Flows and Economic Performance: A Review of the Evidence. World Bank Econ. Rev. 2000, 14, 1–15. [CrossRef]
- Pritchett, L., and L.H., Summers, 2014,“Asia-phoria Meet Regression to the Mean”, NBER Working Paper No. 20573.
- Dellink, R.; Chateau, J.; Lanzi, E.; Magné, B. Long-term economic growth projections in the Shared Socioeconomic Pathways. Glob. Environ. Chang. 2017, 42, 200–214. [CrossRef]
- Robert J. Barro and Jong Wha Lee, 2013,“A New Data set of Educational Attainment in the World, 1950–2010” Journal of Development Economics,104 (2013) 184–198.
- Romer, P.M. Increasing Returns and Long-Run Growth. J. Politi- Econ. 1986, 94, 1002–1037. [CrossRef]
- Saggi, K. Trade, Foreign Direct Investment, and International Technology Transfer: A Survey. World Bank Res. Obs. 2002, 17, 191–235. [CrossRef]
- Sj¨oholm, F., 1999, “Technology Gap, Competition and Spillovers from Direct Foreign Investment: Evidence from Establishment Data”, J. Dev. Stud. 36 (1), 53–73.
- Slesman, L.; Baharumshah, A.Z.; Wohar, M.E. Capital Inflows and Economic Growth: Does the Role of Institutions Matter?. Int. J. Finance Econ. 2015, 20, 253–275. [CrossRef]
- Su Jian, 2021, How The Aging Population Affects Economic Growth —— An Analytical Perspective Based on Total Supply and Total Demand, Journal of Beijing Technology and Business University, 2021,36 (05).
- Tian Youchun, Lu Shengrong, Li Wenpu, 2021, Changes and Improvement of China's Total factor Productivity Growth Rate —— Based on Industrial Perspective, Economics (Quarterly), March, 2021.
- Meles, T.H.; Ryan, L.; Wheatley, J. COVID-19 and EU Climate Targets: Can We Now Go Further?. Environ. Resour. Econ. 2020, 76, 779–787. [CrossRef]
- Thomas Chappuis and Terrie L. Walmsley, 2011,“Projections for World CGE Model Baselines”, GTAP Research Memorandum No. 22.
- Thompson, H. Economic Growth with Foreign Capital. Rev. Dev. Econ. 2008, 12, 694–701. [CrossRef]
- Potterie, B.v.P.d.l.; Lichtenberg, F. Does Foreign Direct Investment Transfer Technology Across Borders?. Rev. Econ. Stat. 2001, 83, 490–497. [CrossRef]
- Wei, Y. and Liu, X. , 2006, “ Productivity, Spillovers from R&D, Exports and FDI in China’s Manufacturing Sector”, Journal of International Business Studies, 37, pp. 544–557.
- Woo, J. Productivity Growth and Technological Diffusion through Foreign Direct Investment. Econ. Inq. 2009, 47, 226–248. [CrossRef]
- Xu, B., 2000, “Multinational Enterprises, Technology Diffusion, and Host Country Pro-ductivity Growth”, J. Dev. Econ. 62, 477–493.
- Xu Zhong, Jia Yandong, 2019, Comprehensive Calculation of China's Potential Output and Its Policy Meaning, Financial Research, no. 3,2019.
- Yi Xin, Guo Chunli, 2018, Changing Trend of China's Potential Growth Rate in the Next 30 Years and Development Level in 2049, Economist, no. 2,2018.
- Zhang Jun, 2017, "Looking into the Potential Growth rate and Transformation and Upgrading of China's Economy", Journal of Guangxi University of Finance and Economics, no. 5,2017.
- Zhang Jun, Xu Liheng, Liu Fang, 2016, Learning From the Past: Thoughts on China's Economic Growth Potential and Structural Evolution, World Economy, no. 1,2016.
- Zhang, S.; Chang, T.-P.; Liao, L.-C. A Dual Challenge in China’s Sustainable Total Factor Productivity Growth. Sustainability 2020, 12, 5342. [CrossRef]
Disclaimer/Publisher’s Note: The statements, opinions and data contained in all publications are solely those of the individual author(s) and contributor(s) and not of MDPI and/or the editor(s). MDPI and/or the editor(s) disclaim responsibility for any injury to people or property resulting from any ideas, methods, instructions or products referred to in the content. |
© 2024 by the authors. Licensee MDPI, Basel, Switzerland. This article is an open access article distributed under the terms and conditions of the Creative Commons Attribution (CC BY) license (http://creativecommons.org/licenses/by/4.0/).
Copyright: This open access article is published under a Creative Commons CC BY 4.0 license, which permit the free download, distribution, and reuse, provided that the author and preprint are cited in any reuse.


