Submitted:
05 August 2024
Posted:
07 August 2024
You are already at the latest version
Abstract
The field of biosensors has found great use for surface plasmon resonance (SPR), which has attracted attention for its multiple applications. With the goal of early cancer detection at the level of a single living cell, this research numerically investigates a very sensitive D-shaped fiber-optic biosensor based on surface plasmon resonance (SPR). The titanium oxide (TiO2) is coated on gold (Au), which is utilized as a thin-film plasmonic material in the suggested biosensor structure. The guiding of light in the fiber is modeled using the finite element method (FEM) when six different types of healthy human cells and their malignant counterparts are exposed to its sensitive region. Refractive index (RI) differences between cancer cells and healthy cells are found through the analysis of the optical spectra and their amplitudes. This enables us to identify small changes in the optical characteristics of cells that could be a sign of pathogenic alterations. In this work, we concentrated on three forms of cancer: skin cancer (basal cell) and breast cancer (MDA-MB-231 and MCF-7). The results show which parameters are optimal to ensure that the sensor performs well when used to detect the three types of cancer under study. When the suggested sensor’s performance is compared to SPR sensors that have previously been published in the literature, it becomes clear that our sensor offers great promise for early cancer detection.
Keywords:
fiber optic sensor
; surface plasmon resonance
; biosensor
; sensitivity
; FEM
1. Introduction
Surface Plasmon Resonance (SPR) is a sensitive optical technique used for real-time, label-free analysis of molecular interactions. Its versatility spans applications in life sciences, industry, environmental monitoring, medical diagnostics, drug development, and pathogen detection. Beyond chemical and biochemical detection, SPR can measure physical parameters like magnetic fields, pressure, and temperature, enhancing its scope across various sectors. In SPR, polarized light directed through an optical fiber towards a metal-dielectric interface induces collective electron oscillations (SPR waves) on the metal surface. Key factors like the angle of incidence, light wavelength, and material dielectric functions determine resonance conditions, marked by a sharp reduction in reflected light intensity. This sensitivity to surface changes makes SPR a powerful sensing tool [1,2].
Since its introduction in 1983, various SPR sensor structures for chemical and biochemical detection have emerged, including Metal-Insulator-Metal (MIM) and metasurface configurations, and photonic crystal fibers (PCFs). SPR-based D-shaped fiber optic sensors (FOS) offer the advantages of optical fibers combined with SPR sensitivity. These sensors, with a polished flat surface exposing the fiber core for metal layer deposition, can detect RI changes in surrounding media or identify specific chemical or biological substances. In medicine, SPR sensors provide high sensitivity, speed, and real-time information for applications like rapid diagnosis, health monitoring, biomedical research, infection detection, and therapeutic interventions. They detect biomarkers in body fluids (blood, urine, saliva), identifying proteins, antibodies, and nucleic acids linked to diseases such as cancer and cardiovascular conditions [3,4].
Research into SPR sensors has focused on enhancing sensitivity and selectivity through plasmonic materials (gold, silver) and hybrid composites. Recent studies on D-shaped SPR-based FOS have explored adding coatings like graphene and metal oxides (Al2O3, TiO2, SnO2) to the plasmonic layer, improving performance by enhancing selectivity and minimizing external interferences [5,6].
Theoretical and numerical studies, including finite element method (FEM) and finite difference method (FDM) simulations, help optimize sensor performance by modeling the behavior of SPR sensors under various conditions. These methods enable precise, economical, and adaptable optimization of sensor design [7]. In cancer detection, FEM simulations allow realistic modeling of the biological environment, tailoring sensor design to specific cancer types. Early detection is crucial for effective treatment, making it essential to develop biosensors capable of identifying cancer progression [8].
This work presents a D-shaped SPR-based biosensor designed for detecting cancer cells in human organs, with FEM-based simulations optimizing sensor parameters. The sensor aims to differentiate between healthy and cancerous cells by monitoring RI changes. The study focuses on three cancer types: skin cancer (basal cell carcinoma) and two types of breast cancer (MDA-MB-231 and MCF-7). The following sections outline the D-shaped optical fiber design and numerical method (Section 2), results and discussions (Section 3), and conclusions (Section 4).
2. D-Shaped Optical Fiber Design and Numerical Method
2.1. D-Shaped Optical Fibers Design
The biosensor design comprises: a GeO2 cylindrical core (radius ), a pure fused silica cladding (radius ), a rectangular polished part of length L () on which is deposited an Au thin film with thickness noted () coated with TiO2 layer of thickness named () via pulsed laser deposition or magnetron sputtering. The distance separating the core from the gold film is called residual cladding denoted . Micro/nano laser machining and lateral polishing techniques can be employed experimentally to prepare this micro/nano structure. The polishing depth can be precisely controlled using these processing technologies [9,10]. Figure 1a illustrate the basic scheme for analyzing cell samples using the biosensor, Figure 1b shows the cross-section of the optical fiber biosensor, and Figure 1c 3D optical fiber sensing probe.
2.2. Theoretical Analysis
To conduct our study, we analyzed a single-mode fiber with a GeO2 core and a pure silica cladding. The wavelength dependent RI of core and cladding is obtained by solving Sellmeier relation as given below.
where λ is wavelength (in ) and b1, b2, b3, c1, c2, c3 are Sellmeier coefficients of pure silica and pure Germanium dioxide which are detailed in references [11,12].
The complex permittivity of the gold layer, considering interband and intraband electronic transitions, is obtained from the Drude-2-critical points model by the following relation (2) [13].
where represents the permittivity of gold (Au), ω is the angular frequency and A1, , A2, , are the parameters for the Drude-2-critical points fit of the dielectric functions of gold in the 200–2000 nm range shown in reference [14].
The refractive index of TiO2 changes in response to the wavelength of the incident light, a variation attributed to the phenomenon of dispersion, leading to alterations in the refractive index (RI). In order to precisely depict this correlation, the Sellmeier formula (3) was employed to examine the refractive index in relation to the wavelength (), including an extra adjustment for wavelengths in the infrared [15].
The following parameters resulted in the best fit for this analysis:
, , , .
The propagation of light in an optical fiber is described by Maxwell's equations, which detail the behavior of electric and magnetic fields constituting electromagnetic waves. By considering the optical fiber's layers, geometry, and refractive index, a propagation equation can be derived (represented by relation (4)), explaining how light travels through the fiber [16].
where is the electromagnetic wave's frequency, is the RI, and is the speed of light in a vacuum.
The propagation equation is numerically solved using the FEM to determine the electric field distribution in different fiber layers. With this approach, the fiber domain is discretized into small finite elements and solving the propagation equations in each element which is characterized by specific optical and geometrical properties while considering boundary conditions.
The effective complex refractive index is computed based on the collected data regarding the electric field distribution and its normal derivative, where represents the refractive index, and stands for the extinction coefficient. To calculate the transmittance T at the receiving device, the formula (5) is utilized, with L denoting the length of the sensing area. The confinement dielectric loss function L (ω) is determined by the following optical relationship (6) [17]:
3. Results and Discussions
In surface plasmon resonance (SPR)-based fiber optic biosensors (FOBs), the refractive index (RI) of the sensing medium is crucial for determining light propagation. The interaction between light and materials with varying RI is utilized to detect changes at the sensor surface, such as biomolecular interactions, DNA mutations, and tumor growth. The selectivity of the functional layer on the sensor surface allows FOBs to target specific molecules, with changes in RI providing quantitative data on analyte concentration, kinetics, and other characteristics. Designing highly sensitive FOBs to detect RI changes enhances sensitivity and response time, broadening their applications in molecular biology and environmental monitoring. Increased RI sensitivity also improves the detection selectivity and specificity for tumor tissues, enabling precise targeting of cancer cells and genetic mutations.
This study proposes a numerical analysis of a D-shaped SPR-based FOB, featuring a sensitive chip with a gold layer covered by a TiO2 layer, aiming to optimize sensor parameters for detecting three types of cancer, including two breast cancer types (MDA-MB-231 and MCF-7) and basal cell skin cancer. The MDA-MB-231 cell line is an aggressive breast cancer model known for not overexpressing estrogen, progesterone, and HER2 receptors, making it resistant to therapies targeting these receptors. MCF-7 cells, in contrast, express hormone receptors, particularly estrogen and progesterone receptors, and are used to study hormonal regulation in breast cancer and evaluate treatments like tamoxifen. Skin cancer is one of the most common types of cancer in the world. It usually develops on areas of the skin exposed to the sun, the main type of skin cancer is basal cell carcinoma (BCC), which develops in the basal cells of the epidermis. Numerical simulations of detection tests are essential before conducting real tissue tests to optimize experimental design, minimize costs and resource use, and assess ethical and safety risks. Understanding the RI of healthy and cancerous tissues is critical for simulating light propagation in biological media, which involves various structures with distinct optical properties, like cells and proteins. These structures affect light absorption and scattering, complicating light propagation analysis. To simplify, four coefficients are often used to describe the average properties of the medium: RI, absorption coefficient, scattering coefficient, and anisotropy coefficient. The RI, a dimensionless and wavelength-dependent quantity, influences the optical path, with typical values in biological media ranging from 1.35 to 1.42. Pathological changes, such as those caused by cancer, alter tissue RI, making it a valuable diagnostic parameter. This research utilizes infrared measurement data for both healthy and cancerous cells from existing literature, as detailed in Table 1.
In the study of the proposed sensor, various geometric and physical parameters can influence the optical spectra obtained during the analysis of biological media. These parameters include the core and cladding composition, core and cladding diameter, and the polishing depth of the D-shaped section. The optimal configuration of a D-shaped sensor, that incorporates Au/TiO2 layers and should result in higher sensitivity in the refractive index region that is pertinent to biological tissues, has been explored. We employed the finite element technique (FEM) to simulate the sensor in order to investigate this with the following geometric parameters: The cladding diameter is , the core diameter is , and the distance between the polished surface of the sensitive zone and the end of the core is . The polished portion of the cladding was then covered by a layer of gold, with a thickness of . This layer of gold is covered by a second layer of TiO2 with thickness . The essential element of this D-shaped fiber optic SPR sensor is the evanescent TM (p-polarized) mode field that propagates through the optical fiber's core. As we are working with a single-mode OF, only one mode moves unidirectionally along the fiber because its core diameter is considerably smaller than the guided wavelength.
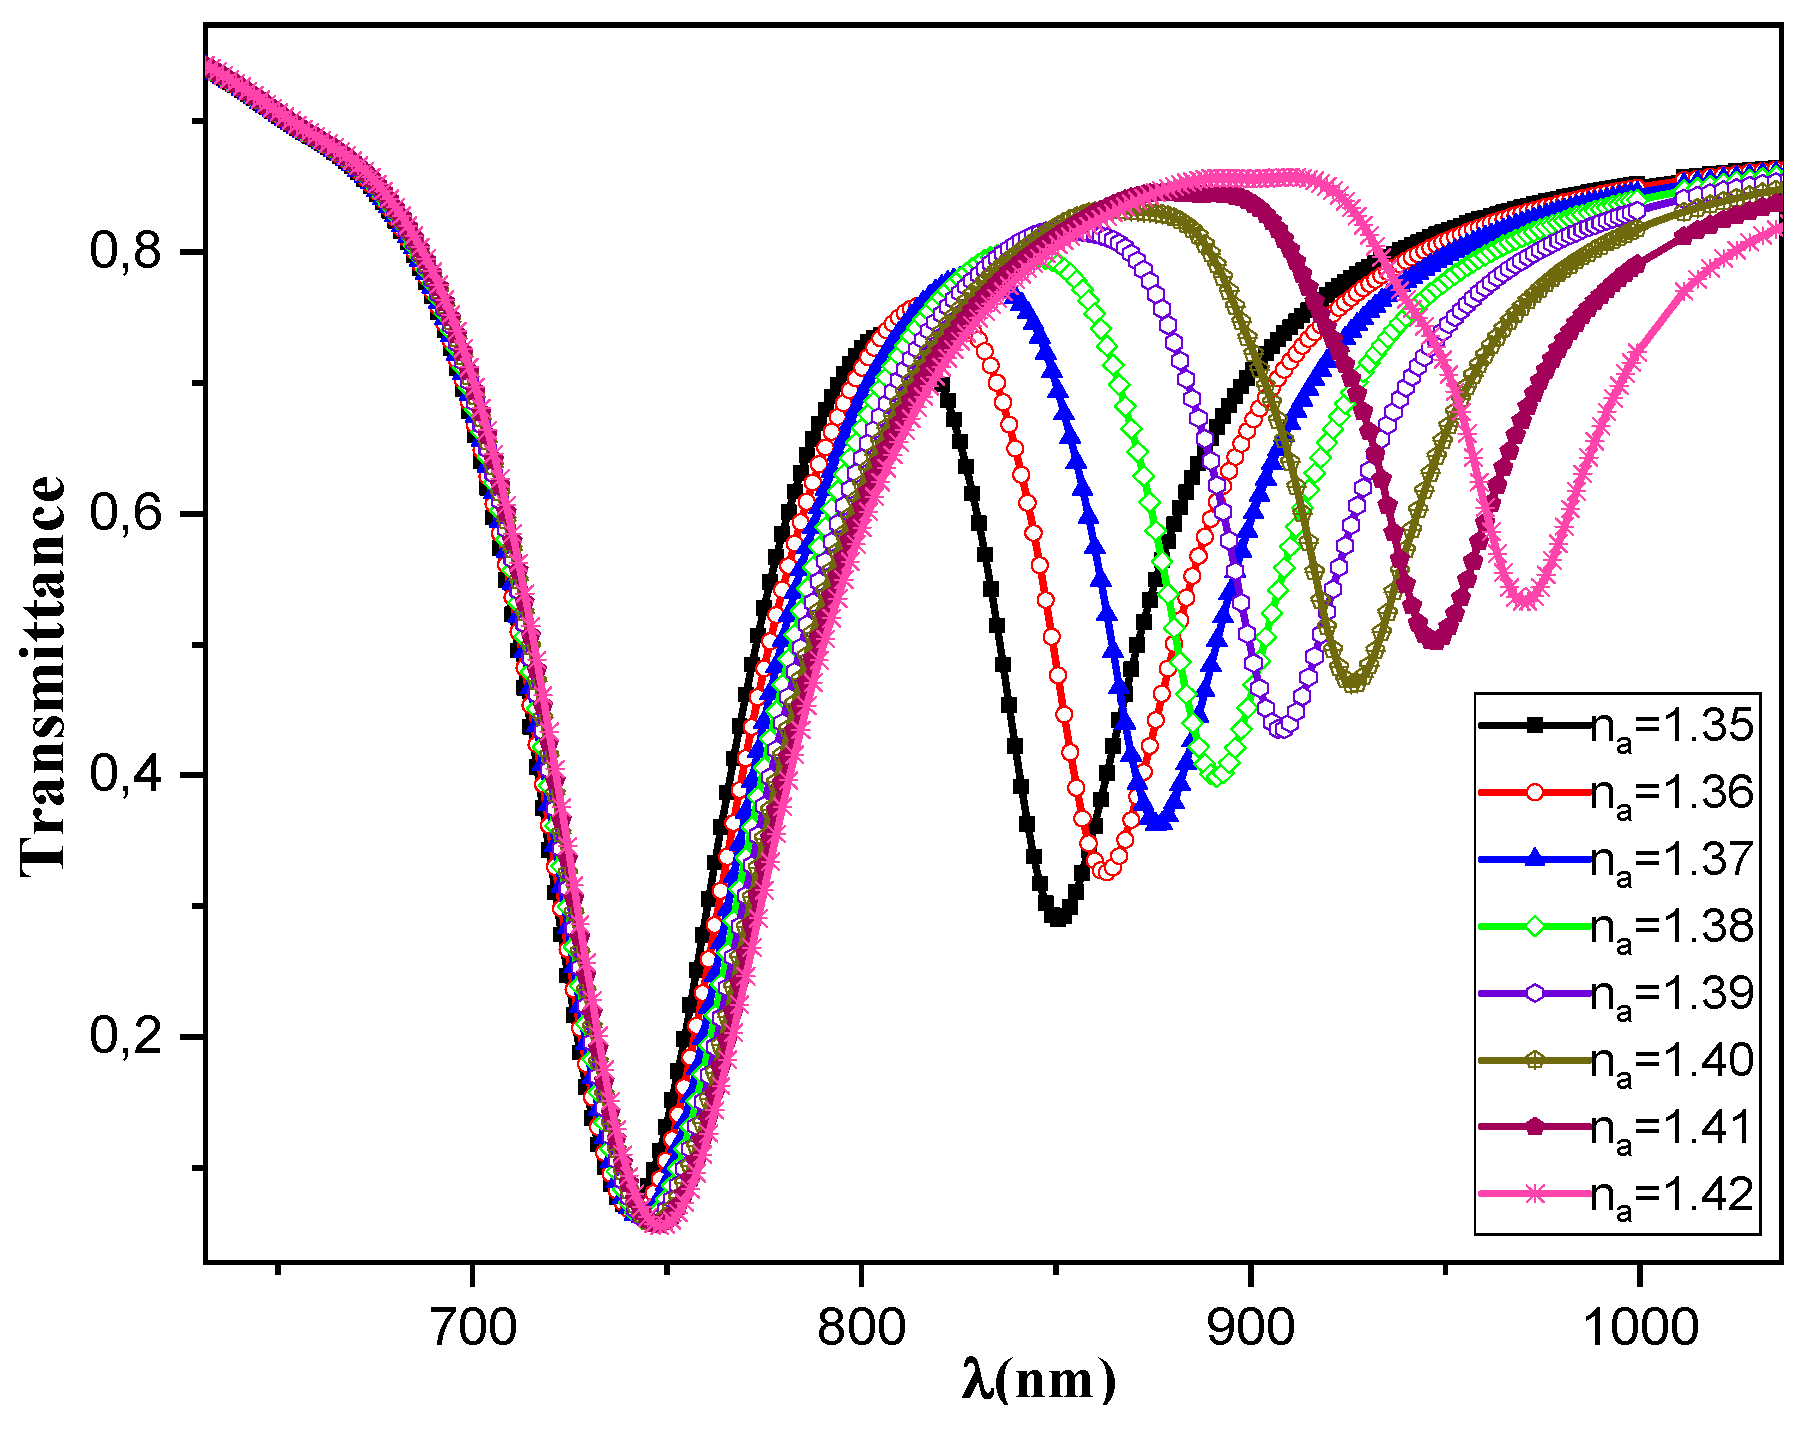
In this first study we considered the medium under study in these simulations to be biological cells, characterized by a refractive index ranging from 1.35 to 1.42. This section contains the numerical simulation results obtained to characterize the optical response of the proposed sensor. The records of light transmission as a function of wavelength for a range of external medium RI values are shown in Figure 2, with a step size of 0.01. The indices increase from to . The excitation of metal plasmons in the Vis (SPR-Vis) and NIR (SPR-NIR) bands is reflected in the two minima thus obtained in the light transmission curves through the fiber. The resonance wavelengths and respectively increase in concordance with the external medium's refractive index . When the varies from 1.35 to 1.42, the first SPR signal, , shows a small shift from 740 nm to 748 nm, while the second signal, , shows a large shift from 850 nm to 971 nm when the RI varies from 1.35 to 1.42. The results highlight that the shift and amplitude of the SPR signals are more pronounced in the NIR region compared to the Vis region, making the NIR signals more suitable for detecting RI variations. The focus of the discussion will be on the NIR signal pair, as they show a significant gap in SPR signals between normal and cancerous tissues.
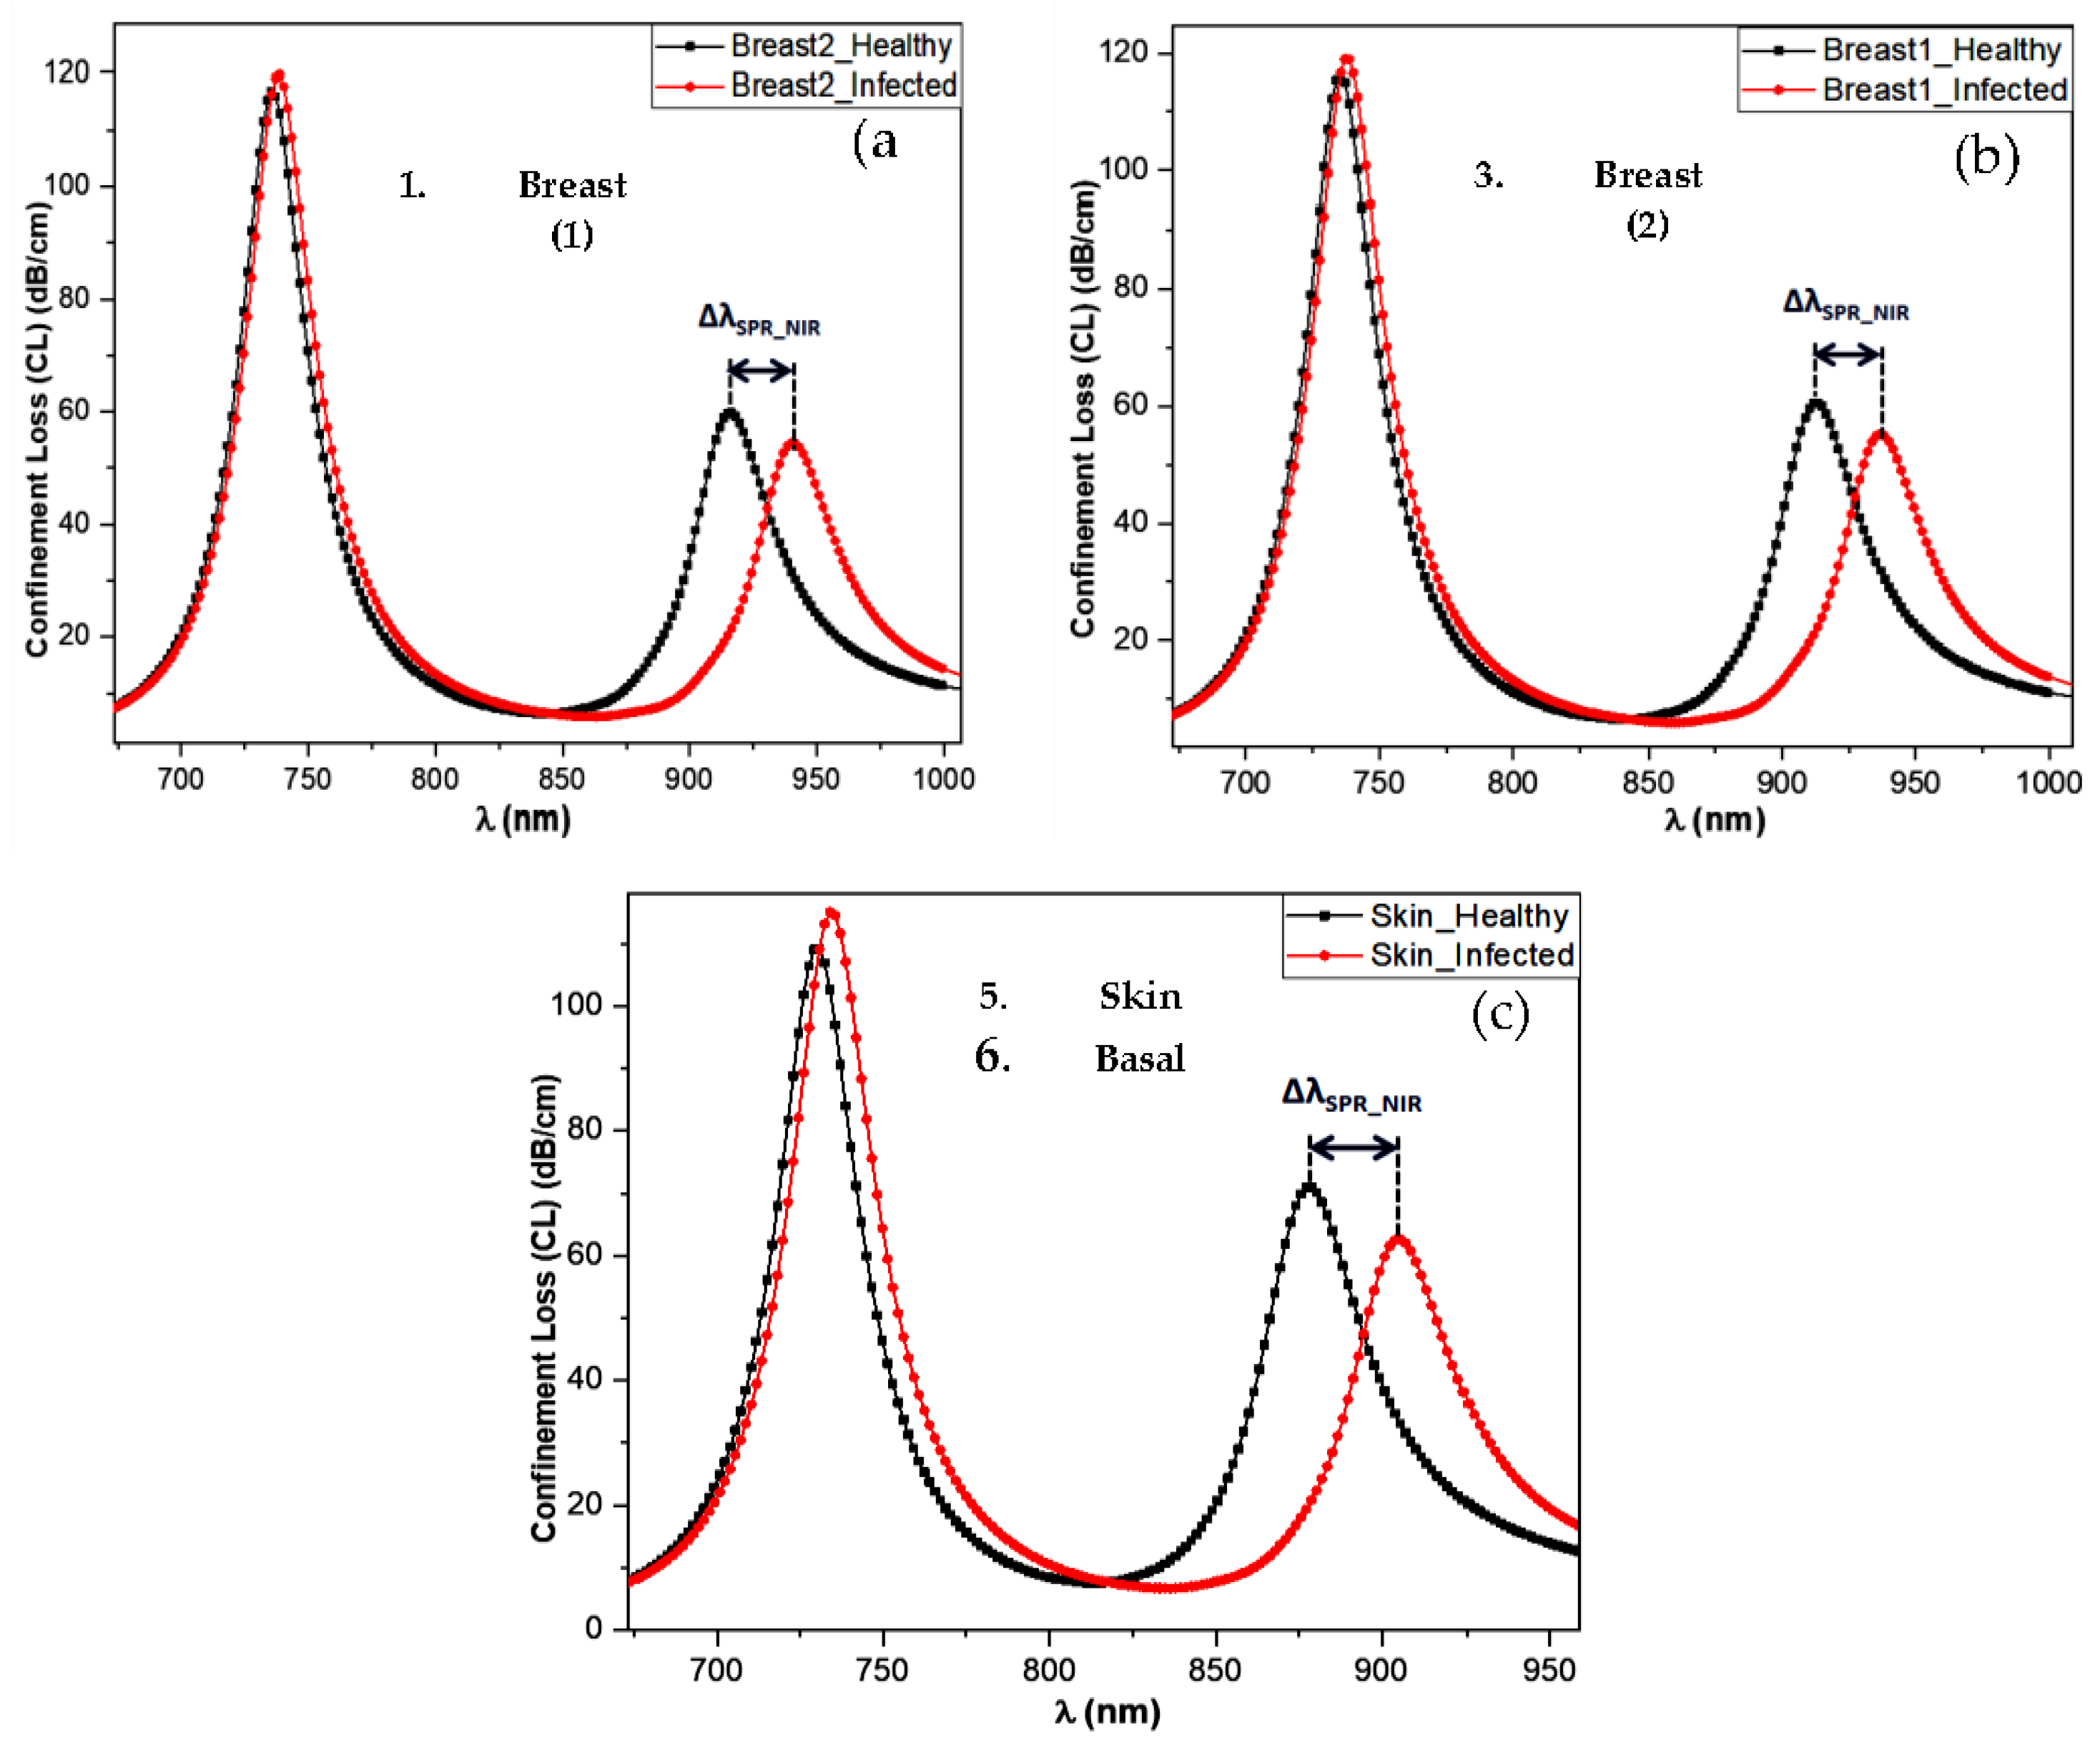
Simulation results of the proposed sensor, when used to detect MDA-MB-231 and MCF-7 breast cancers and basal cell skin cancer, are shown in Figure 2a-c. In these figures, the pair of curves represent the cases of healthy skin tissue (black line) and infected skin (red line). The SPR signal obtained in the NIR band shows a significant shift between healthy and cancerous tissue. To achieve effective detection of the skin tumor by the sensor under study, a significant gap must be observed between the signals corresponding to healthy and malignant tissue.
This study observes that the confinement loss signal for MDA-MB-231 and MCF-7 cancer cells shift towards longer wavelengths compared to normal cells (Figure 1a,b), with specific shifts in the NIR region. Figure 2c shows that for basal cells, we obtained a resonance wavelength shift between normal and cancerous cells of .
Figure 3.
Confinement Loss spectra obtained by the sensor as a function of wavelength for various normal and cancerous cells with and .
Figure 3.
Confinement Loss spectra obtained by the sensor as a function of wavelength for various normal and cancerous cells with and .
An important parameter impacting the assessment of detection efficiency is the resolution of the proposed sensor, which gauges its capacity to detect even minor variations in the RI of the analyte medium. Better sensor performance is indicated by a lower resolution, as determined by the following formula (9) [21].
where the minimum value of spectral resolution and the change in analyte RI of are illustrated in table 1. This proposed sensor shows better RI resolution of for Breast cells and for Skin basal cells.
4. Conclusions
In this proposed study, we numerically examined a D-shaped optical fiber sensor based on surface plasmon resonance using the finite element method. The sensor’s sensitive zone consists of an Au thin layer coated with TiO2, both superimposed on the polished part of the fiber. To analyze biological tissue using this sensor by detecting variations in refractive index, in the first study we take into consideration an analytical medium with refractive index changes in the range. The appearance of two plasmonic resonance peaks indicates that this plasmonic behavior is distinctive and creates new opportunities in the fields of cancer detection. Additionally, it has been demonstrated that sensor performance shows better refractive index resolution of for Breast cells and for Skin basal cells. This configuration offers several advantages, such as reduced size, lower cost and easy portability. Our study shows that this proposed structure can be used in a wide range of applications requiring high sensitivity, such as cancer cells detection.
References
- Duan, Q.; Liu, Y.; Chang, S.; Chen, H.; Chen, J.-h. Surface Plasmonic Sensors: Sensing Mechanism and Recent Applications. Sensors 2021, 21, 5262. [Google Scholar] [CrossRef] [PubMed]
- Liu, H.; Fu, Y.; Yang, R.; Guo, J.; Guo, J. Surface plasmonic biosensors: principles designs and applications. Analyst 2023, 148, 24. [Google Scholar] [CrossRef] [PubMed]
- Stuart, D.D.; Van Zant, W.; Valiulis, S.; et al. Trends in surface plasmon resonance biosensing: materials, methods, and machine learning. Anal Bioanal Chem 2024. [CrossRef] [PubMed]
- Sasidevi, S.; Kumarganesh, S.; Saranya, S.; Thiyaneswaran, B.; et al. Design of Surface Plasmon Resonance (SPR) Sensors for Highly Sensitive Biomolecular Detection in Cancer Diagnostics. Plasmonics 2024. [CrossRef]
- Sarvesh, K.D.; Anil, K.; Awadhesh, K.; Amit, P.; Srivastava, S.K. A study of highly sensitive D-shaped optical fiber surface plasmon resonance based refractive index sensor using grating structures of Ag-TiO2 and Ag-SnO2. Optik 2022, 252, 168527. [Google Scholar] [CrossRef]
- Tabassum, R.; Gupta, B.D. Influence of Oxide Overlayer on the Performance of a Fiber Optic SPR Sensor With Al/Cu Layers. IEEE Journal of Selected Topics in Quantum Electronics 2017, 23, 2. [Google Scholar] [CrossRef]
- Hossain, M.B.; Hossain, M.S.; Islam, S.M.R.; et al. Numerical development of high-performance quasi-D-shape PCF-SPR biosensor: An external sensing approach employing gold. Results in Physics 2020, 18, 103281. [Google Scholar] [CrossRef]
- Singh, S.; Chaudhary, B.; Upadhyay, A.; et al. Bottom side partially etched D-shaped PCF biosensor for early diagnosis of cancer cells. Eur. Phys. J. Plus 2023, 138, 511. [Google Scholar] [CrossRef]
- Pathak, A.K.; Singh, V.K.; Ghosh, S.; Rahman, B.M.A. Investigation of a SPR based refractive index sensor using a single mode fiber with a large D shaped microfluidic channel. OSA Continuum 2019, 2, 3008–3018. [Google Scholar] [CrossRef]
- Xie, Q.; Chen, Y.; Li, X.; Yin, Z.; Wang, L.; Geng, Y.; et al. Characteristics of D-shaped photonic crystal fiber surface plasmon resonance sensors with different side-polished lengths. Appl Opt 2017, 56, 1550–1555. [Google Scholar] [CrossRef]
- Fleming, J.W. “Dispersion in GeO2-SiO2 glasses”, Applied Optics, 23(24), 4886 - 4493. 1984. http://www.sciepub.com/reference/4236. [CrossRef] [PubMed]
- Nayak, J.K.; Jha, R. Numerical simulation on the performance analysis of a graphene-coated optical fiber plasmonic sensor at anti-crossing. Appl. Opt. 2017, 56, 3510–3517. [Google Scholar] [CrossRef] [PubMed]
- Vial, A.; Laroche, T. Comparison of gold and silver dispersion laws for FDTD simulations. Appl. Phys. B 2018, 93, 139–149. [Google Scholar] [CrossRef]
- Johnson, P.B.; Christy, R.W. Optical Constants of the Noble Metals. Phys. Rev. B 1972, 6, 4370. [Google Scholar] [CrossRef]
- Brik, M.G.; Sildos, I.; Kiisk, V. First-principles calculations of optical and electronic properties of pure and Sm3+-doped TiO2. Phys. B: Condensed Matter. 2010, 405, 2450–2456. [Google Scholar] [CrossRef]
- Eoll, C.-K.; Goldring, T.; Lucas, T.-R. Efficient solution of Maxwell’s equations for optical fibers with arbitrary refractive-index profiles. Opt. Lett. 1987, 12, 841–843. [Google Scholar] [CrossRef] [PubMed]
- Cao, S.; Shao, Y.U.; Wang, Y.; Wu, T.; Zhang, L.; Huang, Y.; Zhang, F.; Liao, C.; He, J.; Wang, Y. Highly sensitive surface plasmon resonance biosensor based on a low-index polymer optical fiber. Opt. Express 2018, 26, 3988. [Google Scholar] [CrossRef] [PubMed]
- Yaroslavsky, A.N.; Patel, R.; Salomatina, E.; Li, C.; Lin, C.; Al-Arashi, M.; Neel, V. High-contrast mapping of basal cell carcinomas. Opt. Lett. 2012, 37, 644–646. [Google Scholar] [CrossRef] [PubMed]
- Yasli, A. Cancer Detection with Surface Plasmon Resonance-Based Photonic Crystal Fiber Biosensor. Plasmonics 2021, 16, 1605–1612. [Google Scholar] [CrossRef]
- Sharan, P.; Bharadwaj, S.; Gudagunti, F.D.; Deshmukh, P. Design and modelling of photonic sensor for cancer cell detection, International Conference on the IMpact of E-Technology on US (IMPETUS), IEEE, 2014, 20–24. [CrossRef]
- Akouibaa, A.; Akouibaa, A.; Masrour, R.; Benhamou, M.; Rezzouk, A. Numerical study of a D-shaped optical fiber SPR biosensor for monitoring refractive index variations in biological tissue via a thin layer of gold coated with titanium dioxide. Spectrochim. Acta Part A: Mol. Biomol. Spectrosc. 2024, 304, 123358. [Google Scholar] [CrossRef] [PubMed]
Figure 1.
(a) Schematic diagram practical optical setup for cell sample analysis, (b) cross sectional view of optical fiber sensor, (c) 3D optical fiber sensing probe.
Figure 1.
(a) Schematic diagram practical optical setup for cell sample analysis, (b) cross sectional view of optical fiber sensor, (c) 3D optical fiber sensing probe.
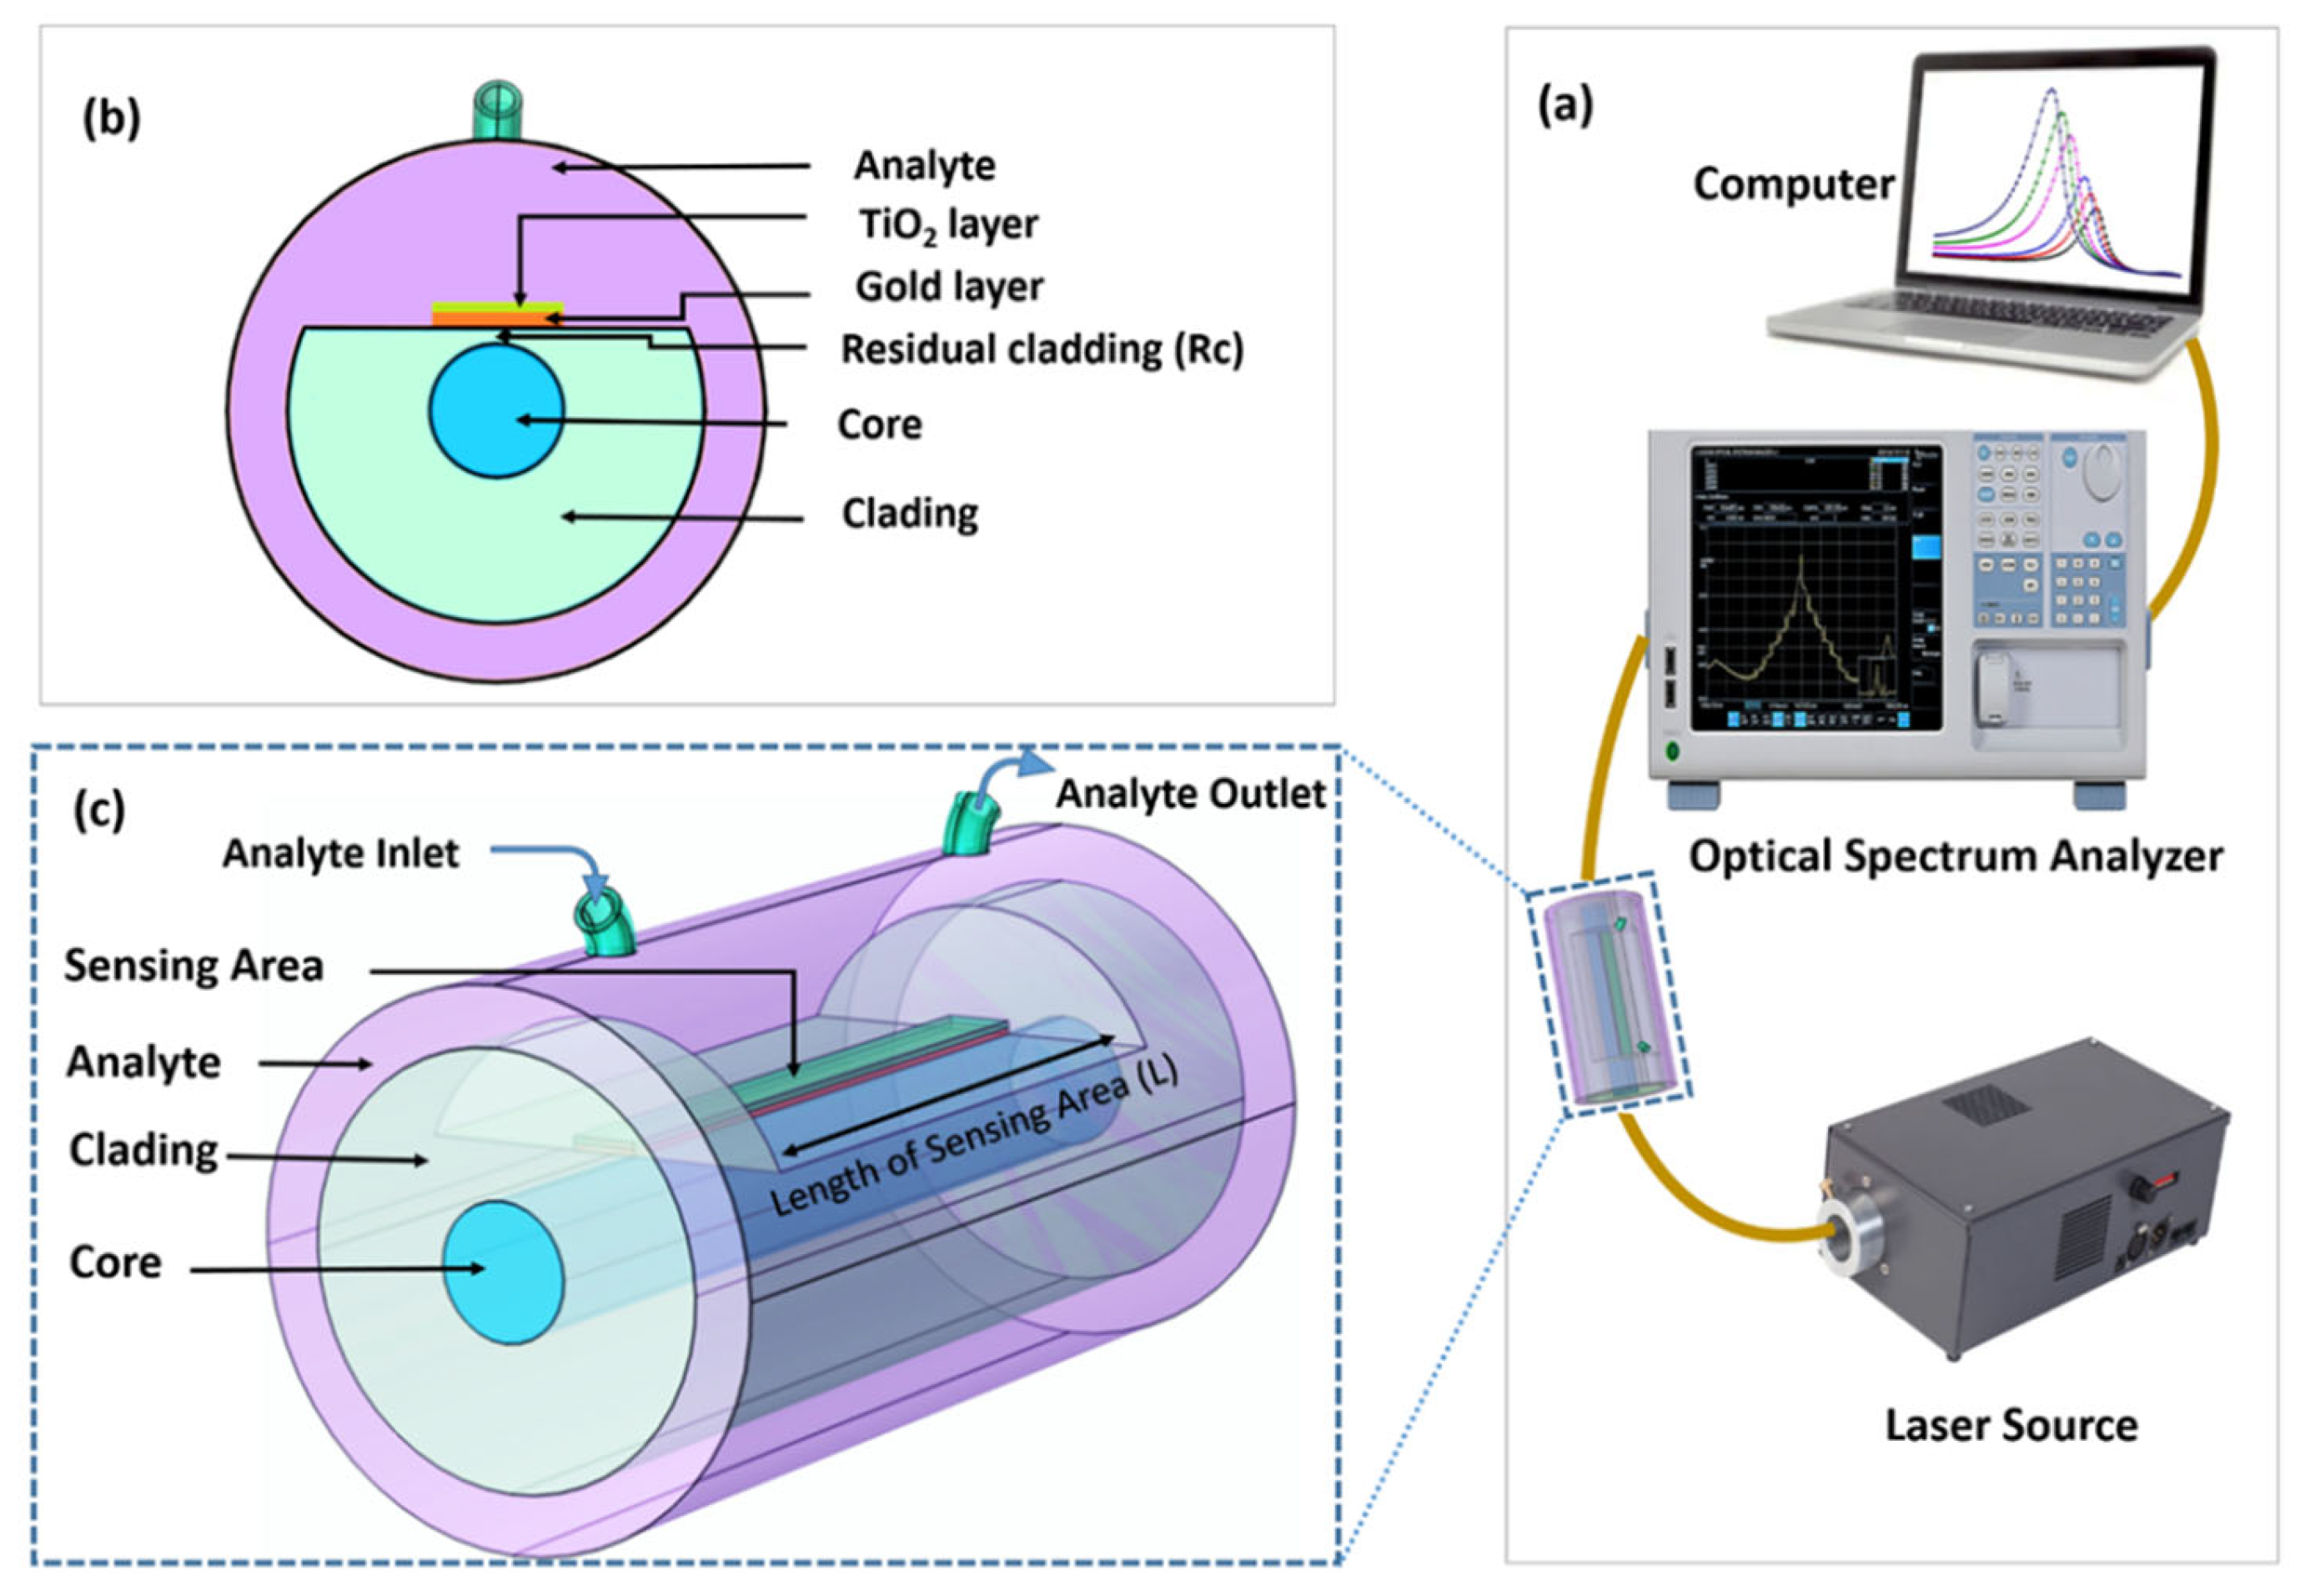
Figure 2.
Confinement Loss spectra of the sensor versus λ for different RI values of the analyte.

Disclaimer/Publisher’s Note: The statements, opinions and data contained in all publications are solely those of the individual author(s) and contributor(s) and not of MDPI and/or the editor(s). MDPI and/or the editor(s) disclaim responsibility for any injury to people or property resulting from any ideas, methods, instructions or products referred to in the content. |
© 2024 by the authors. Licensee MDPI, Basel, Switzerland. This article is an open access article distributed under the terms and conditions of the Creative Commons Attribution (CC BY) license (http://creativecommons.org/licenses/by/4.0/).
Copyright: This open access article is published under a Creative Commons CC BY 4.0 license, which permit the free download, distribution, and reuse, provided that the author and preprint are cited in any reuse.


