Submitted:
04 August 2024
Posted:
06 August 2024
You are already at the latest version
Abstract
Rice yield underperformance coupled with production instability in Odisha state of India is primarily due to low irrigation potential, the spatiotemporal disparity in rainfall pattern and relentless confrontation with biotic and abiotic stresses. System of Rice Intensification (SRI) was introduced in the state with the promises of higher production horizon. However, the present scenario of patchy adoption pattern has necessitated comprehensive study on dynamics and determinants of adoption of SRI. We found that, 57 percent farmers continued SRI, 28 percent discontinued and rest were practicing conventional rice farming. The focused group discussion among the farmers helped us to triangulate the determinants of SRI adoption.The increased SRI area allocation was observed at the expense of reduced number of adopting farmers. Economic scarcity of skilled labour, difficulties in transplantation and mechanical weeding, low irrigation potential and poor on-farm water management were major constraints in SRI practice. Farmers’ compliance in following different resilient SRI components that also varied spatiotemporally has resulted in realized incremental yield. SRI was proved to be resilient to severe drought during 2015-16 and yielded 27 percentage higher than conventional one with considerable decline in hazardous chemicals usage. Farmers’ decision on SRI adoption/discontinuation was analysed using probit regression analysis. The results indicated that, active social involvements of NGOs, on-farm training and demonstrations, and realized incremental rice income influenced SRI adoption. On the other hand, SRI area expansion hindered mainly because of infeasible land topography, area saturation and lack of farmers’ interest. The sustainability index was developed to analyse SRI’s performance to other conventional methods at farm level. Comparatively, SRI adopters benefitted in terms of incremental net return by enhancing ecological balance and sustained productivity of soil, use of eco-friendly and own farm inputs. Nonetheless, higher women labour displacement observed under SRI can be curtailed by providing training to young farm women.
Keywords:
SRI
; Dis-adoption
; Sustainability
; resource conservation
; probit
; odisha
Highlights:
- System of Rice Intensification (SRI), though advocated to overcome low and unstable rice productivity, its adoption remained patchy in Odisha.
- SRI’s benefit outweighed conventional rice farming practices both in terms of yield and net return during stress year.
- An increased SRI area allocation was observed at the expense of reduced number of adopting farmers.
- Farmers’ compliance in following different SRI practices varied widely across farm size and years during kharif (wet season).
- Hazardous and environment polluting chemicals’ usage significantly reduced in SRI farms than that of its counterpart.
- However, more than 75 percent farmers expressed their inability for area expansion because of compelling factors.
1. Introduction
Despite significant improvements in terms of farm technology and its expansion over the last several years, food security remains a crucial global problem. Rice is the staple food for more than half of the global population, while in Asia, it accounts for 91 percentage (Varma, 2017). Facing mounting pressure on land and water resources, enhancing rice yield is crucial for improving food security and lessening poverty amid masses in rural India. With largest area under rice (43.39 million ha), India produced 156.54 million tons during 2015-16 and stood next to China in the world (FAOSTAT, 2017). But, the yield levels in India were low at 3.62 tons per ha compared to other major rice producing countries such as, China (6.75 tons/ha), Japan (6.70 tons/ha), and Indonesia (5.13 tons/ha). Rice consumption is growing due to its high-income elasticity of demand. To meet the growing demand, strategic increase in rice production is indispensable. While there exists meagre scope in area expansion, production enhancement is conceivable only by heightening productivity with an improvement in production efficiency through technological breakthrough to meet the goal of sustainable development goals (SDGs) sub objective of ensuring sustainable food production systems and implementation of resilient agricultural practices by 2030 (UN, 2015).
India’s food security has greatly sustained through the green revolution of 1960’s but is characterized with high input usage particularly fertilizers, irrigation and plant protection chemicals that has enhanced the cost of production significantly in later stage. The impressive surge in rice output has been limited to irrigated belts of the country. The skewed distribution of green revolution and increased costs of cultivation have given alarming signal to future needs of food security, while water scarcity has posed a major threat (Shah, 2009; Shah et al., 2016).
With looming climate change conditions, reliability of farming on monsoon is going to be a very tough proposition. Increasing need of water from diverse sectors have necessitated innovations in farm techniques to harness additional farm output from per drop of water (UNESCO, 2016). Rice is grown with high water consumption. It has been estimated that irrigated rice uses 34-43 percent of the global irrigated area while 1900 to 5000 litters of water is used to produce one kg of rice (Jagannath, Pullobhatla, & Uphoff, 2013). Therefore, it is pertinent to introduce innovations in rice production system.
In the context of rice production enhancement to meet the global food demand and ensuring food security to masses, it is relevant to have a technique which not only ensures high productivity but also sustainability in terms of resource conservation and efficient use of the scarce factors of production.
System of Rice Intensification (SRI) is an innovative method of rice farming which ensures high productivity by manipulating the agronomic aspects of plants, soil, nutrient and water which thereby enhances land, labour and water productivity. The main advantage of SRI as envisaged is the resource conservation in shape of less seed and lower water utilization than that of the conventional transplanting. This technique has raised the hope, aspiration and new possibilities of higher yields. Large number of studies indicates considerable higher productivity and enhanced returns linked with SRI (Varma, 2017). Takahashi and Barrett (2014) illustrated that SRI generated average yield gains of around 64% relative to conventional methods in a study in Indonesia. Sinha and Talati (2007) found average yield increase of 32% among farmers who partially adopted SRI in West Bengal. Styger et al. (2011) demonstrated 66% enhanced yields in SRI compared to experimentally controlled plots using farming practices similar to local rice growers in Mali and 87% higher productivity against the surrounding farmer rice fields.
SRI has also faced extensive cynicism within the conventional rice breeding community (Sheehy, et al., 2004; McDonald, Hobbs, & Riha, 2006). Disagreement among the scientific community on metrics of the benefits of SRI in terms of rice productivity has been a matter of concern (Glover, 2011). Takahashi and Barrett (2014) and Sinha and Talati (2007) demonstrated that increased productivity was related to varying degrees of adherence to SRI principles.
Taking into consideration of beneficial impact on the rice yield and overall income, it can be anticipated that SRI should have wide spread. While, at national scale, its adoption is patchy and scale advantage is not yet achieved in India. Diffusion of SRI has been sluggish and uptake rates have been low in many areas where it has been introduced as a potential catalyst for improving productivity, integration and food security (Moser & Barrett, 2003). Given its asserted yield and earning prospective, low adoption is a dilemma even in places with excess labour.
The primary impediments for embracing SRI seems to revolve around learning the principles and practices involved in this knowledge-intensive method and possible social constraints to adopting visibly different rice production and water management methods within ostensibly homogenous production communities (Moser & Barrett, 2003), or, what we now term ‘homophily’(Banerjee, Chandrasekhar, Duflo, & Jackson, 2013). SRI is a knowledge-intensive farming practice that requires significant local adaptation and managerial skills but requires time and aptitude. There is evidence that farmers are constrained by information and skills necessary for local adaptation.
While the area under SRI has been increasing, comprehensive studies using farm level data covering various socio-economic aspects of SRI adoption at the farm level is still lacking for Odisha, a predominantly rainfed rice farming state in Eastern India. In this background, an attempt has been made in this study with the following objectives:
- To study the dynamics and determinants of adoption of SRI and constraints confronted by farmers in package of practice adoption
- To estimate the yield, income, cost advantage and resource conservation of SRI adopter over non-adopters
- To evaluate the level of adoption of different components of SRI by farm typology
2. Characteristics of Rice Production in Odisha
Rice covers about 46% of the gross cropped area (GCA) and is the major crop, covering about 62% of the total area under food grains in Odisha. Being the staple food, the state economy is directly linked with improvements in production and productivity of rice. Odisha is the 5th largest rice-producing state in India accounting for 6 percentage of the national rice output. During 2015-16, the area under rice was 3.94 million ha, with average yield of 2.26 tons/ha that produced 8.91 million tons (Govt. of Odisha, 2018).
Majority of the rice area is rainfed, while only 35 percentage is irrigated. The state is prone to drought as well as submergence that results in a low and highly unstable yield. As per the official statistics, Modern variety acreage increased from 4 percentage in 1970 to about 86 percentage in 2013 at the rate of 6.4 percentage annually (various issues of Odisha Agriculture Statistics). Although rice yield in Odisha is positively correlated with modern variety (MV) coverage, rice yield increased only by 155kg/ha, on an average, for every 10 percentage -point increase in the share of area under MVs (Figure 1). Thus MVs expansion alone will not result in a substantial yield improvement which necessitates technological breakthrough. Here the innovative SRI technology may play significant role in swinging the productivity at a higher plateau.
3. Methodology and Data
Data for this study has been obtained from field level household surveys across 13 districts of Odisha (Figure 2).
A sample of 522 farmers, covering 297 SRI adopters, 148 drop outs and rest 77 farmers practicing conventional rice farming were chosen for the study (Table 1). Purposive sampling method was followed for selecting villages and then the farmers as it was still believed that the spread of adoption of SRI was limited. Farmers practicing conventional method of rice nearby SRI farms were considered as non-adopters. SRI drop out farmers had been selected from among the farmers who had discontinued practicing or who had not practiced SRI during the kharif, 2015 though some package of practices of SRI recommendation were partially followed during earlier rice growing seasons.
3.1. Data
3.1.1. Socio-Economic Profile of the Sample Households
Among the adopters, 49% belonged to scheduled tribes (STs) followed by other backward castes (OBC) (44%) and scheduled caste (SC) (5 %) as depicted in Table 2. OBCs constituted 49% of the drop outs. STs comprised 56% of the non-adopters and OBCs’ share was 40 percent (Figure 3). Only three percent of the adopters were female headed. Considering the age of the respondents (average 46 years), more than 60 percent of the adopters and dropouts were in the age group of 40 -60 years. Educational status of the adopting farmers indicated that 38 and 21 percentage of them had attended the secondary and higher secondary classes respectively. A significant 31 percentage of farmers had no formal educational attainment, mainly because of the fact that the SRI promotion has been mainly targeted towards the poor marginalized section of the society.
Farming was the main profession and livelihood of the majority of the households among the sample respondents (97%) and more than 60 percentage were also found to be engaged in both off-farm and non-farm labour wage earning activities as secondary occupation (Table 3 and Figure 4). Average labour availability of the sample households was 498 human labour days that varied between 485 in case of non-adopters to 502 for adopters. It indicates that SRI adopters had higher family labour to sustain the time bound activities for SRI technique of farming. Female labour availability was about 33 percentage of the total family labour across the study districts.
3.2. Classification of Farm Categories
Marginal farmers constituted 53 percentage of the total farming households that varied from 51 percent in case of drop outs to 64 percent for non-adopters (Table 4).
Average operational holding of the households varied between 2.35 acres in case of non-adopters to 3.25 acres for adopters. On an average, acreage under rice was about 2.48 acres which was found to be highest among the adopters (2.67acres) and lowest in case of non-adopters (1.91 acres). Out of the total rice area, about 61 percent was under medium land. Irrigated area under rice was highest among the adopters. Irrigated rice area was as low as 30% in case of drop outs. Low irrigation potential might have played major role for dis–adoption among the drop outs while, majority of the respondents affirmed SRI could be practiced on medium land (Table 5).
Source wise irrigation status (Table 6) indicates that 64% of the adopters were having some assured irrigation sources whereas the same was only 44 and 40% for drop outs and non-adopters respectively.
Farming was considered as the major occupation as well as main source of income (Table 7). Total farm income varied from Rs 33516/-(43% of total income) in case of adopters to Rs 17676/- (31 % of total income) for non-adopters. It was observed that share of rice income to total income was highest at 30% for adopters and lowest for drop outs (22%). For adopters, share of non-farm wage income was considerably lower than that of drop outs and non-adopters. On the income front, adopters were having highest income with Rs 78035/- per annum than that of drop outs (Rs 64088/-) and non-adopters (Rs 57290/-) and rice was the major source of income among all. It is also observed that wage labour component both off farm as well as non-farm was higher in case of drop outs and non-adopters than that of adopters.
About 46% of the adopters had some affiliations with service cooperative society or Panchayat Raj institutions or NGOs. But majority of the farmers had no affiliation which indicates scope for further social networking to bring dis-adopters and non-adopters under technology adoption purview.
3.3. Analytical Techniques Employed
3.3.1. Garrett’ Ranking Technique
Analysis of constraints faced by the farmers have been carried out by using Garrett’ ranking technique. A 10 point scale was prepared according to their responses regarding their constraints which range from Scale: Lowest=1 and highest=10. Garrett’s ranking technique is in the following manner:
Percentage position = 100 (Rij-0.50)/Nj
Where, Rij= Rank given for the ith item by the jth individual and
Nj-= Number of items ranked by the jth individual
The percentage position of each rank was converted into scores using Garrett table. For each constraint, scores of individual respondents were added together and were divided by total numbers of respondents. Thus, mean score for each constraint was ranked by arranging them in the descending order.
Probit model
Further, to analyse the probability of adoption of SRI method of rice cultivation by the household subject to different factors that influence the participation in that particular activity, probit model has been used. In comparison with other analytical tools, Probit explains the second level of hurdle in adoption studies(Varma, 2018). The participation equation is estimated with a dummy variable equal to 1, if the household participated in the activity, and 0 otherwise is regressed on the independent variables: years of education, experience in years of farming, affiliation with any type of organization in the village equal to 1 or otherwise 0, total operational area in acres, total income in rupees, total land under rice cultivation in acres, rice yield on non SRI farms in qt/acre, NGO support in facilitating SRI equal to 1 or otherwise 0, training received on SRI, canal as source of irrigation, percentage of non-farm income to total income, percentage net agricultural income, percentage of medium land to total land and percentage area irrigated. It is understood that, SRI is more adopted by those who have got higher proportionate of medium land. Thus, a probit is fitted separately for each case to reveal the intensity of participation in SRI as compared to non-adopters.
Z I is a vector of independent variables of the participation equation.
where, Pi*is a non-observed continuous latent variable and Pi is an observed binary variable, with a value of 1 if the household participates in the SRI and 0 as non-adopter.
3.3.2. Tabular Analysis
The cross tabulation technique was used to assess the economics of crop production in the studied area. The percentage and average were computed and compared to draw meaningful inferences.
4. Results and Discussion
4.1. Adoption Patterns of SRI
SRI involves mainly six component practices, such as low seed rate (2 kg/ac,) using single seedling per hill, transplanting young seedling (less than 15 days), transplanting at wider spacing (25 cm X 25 cm), high dose of farm yard manure (FYM) and weeding at regular interval by mechanical weeder (minimum 2-3 times). Adoption levels of these practices are presented in Table 9 during 2013-14 to 2015-16 kharif (wet) and rabi (post rainy) seasons separately. It is observed that the number of marginal farmers practicing SRI during kharif had increased from115 during 2013-14 to 178 in 2014-15 but declined to 156 during 2015-16. However, area allocation to SRI had increased from 1.14 acre in 2013-14 to 1.22 acre during 2015-16. Similar observation was also observed for small farmers. Lower number of farmers opting for SRI during last year might be due to severe drought situation prevailing during 2015-16. So it is evinced that though overall number of farmers practicing SRI declined, area allocation had increased across size class. Thus, the perceived benefit from SRI influences area expansion. But due to bio-physical, agro ecological and social constraints, many farmers dropped out of practicing SRI.
Seed rate was found to be more than double than that of the prescribed rate of 2 kg per acre during kharif which was due to varied reasons like apprehension of poor germination due to seedbed damage by animals/birds/insects and weather parameters, chances of mortality of seedlings, deficient rainfall, etc. High deviation was observed also in the young seedling transplantation, which varied by seasons, years and farm categories. Lower adoption of transplanting of seedling of prescribed age during 2015-16 was mainly because of late monsoon and early season drought. Other major reasons for transplanting older seedlings were scarce availability of assured irrigation, climatic aberrations, fear of mortality of seedlings due to both biotic as well as abiotic stresses, labour problem etc. Though one seedling per hill was practiced by more than or close to 60 percentage of the farmers irrespective of farm sizes, low adoption was observed during kharif, 2015-16 because of transplanting of older seedlings. Barring few exceptions, square planting with 25 cm X 25 cm had been widely practiced among the adopters. Mechanical weeding by weeder was widely followed among the adopters, however, adoption was limited to two numbers of weeding against three. Though FYM was utilized, it was not at par with the recommended dose mainly due to scarcity.
Water management was not found to be truly followed because of uncertainty of rainfall and availability of irrigation water during kharif season.
Yield gain of SRI over conventional practices was observed across size class, years and seasons. Still with severe drought, farmers practicing SRI had experienced significantly higher yield advantage than that of non-practicing farmers during kharif, 2015-16. More than 80% of farmers reported incremental yield gain under SRI against that of conventional (Figure 5).
Overall it was observed that farmers’ compliance towards practicing of different components of SRI varied widely across farm size and years during kharif. It was observed that in initial years, farmers’ compliance remained low whereas, in subsequent years, the same was observed to be higher. This might be due to farmers’ realizing higher yield complying with various SRI principles.
4.2. Factors Influencing Adoption of SRI Over Dis-Adoption and Non-Adoption
To analyse the probability of participating in SRI method of rice cultivation by the households subject to different factors that influence the participation in a given activity, the probit regression technique was used with the help of statistical package ‘gretl’. The results presented in Table 10 suggest that the model has correctly predicted 94.7 percentage considering the independent variables. The Chi-square value with 14 independent variables is highly significant implying the robustness of the model. It indicates that farmers with higher experience in rice farming, the probability of SRI adoption becomes higher. Interestingly, farmers owning higher operational land primarily used for rice cultivation are less likely to adopt the SRI. It has been observed that probability of adoption of SRI is more in case of marginal farmers with typical tiny parcel of land where they have much more holds on field operations. Similarly farmers having large operational area are quite hesitant to adopt a technology which has got to adhere to strict and timely management practices.
The total income of the farming households has very little but positive impact on SRI adoption. Farmers with assured income sources, the probability of SRI adoption is higher. Also, when rice yield of non SRI farms are quite satisfactory, there is little incentive to go for SRI. The factors which had got positive significant impact on adoption of SRI were found to be the involvement of NGOs in providing information on SRI, training received on SRI, percentage net agricultural income to the total income and percentage area under medium land to total rice area. So, it is evident from the study that involvement of civil society actors in promoting SRI has influenced probabilities of adoption of SRI in Odisha. Similarly, imparting training to farmers on different SRI principles has desired impact on adoption of SRI. Medium land provides the most secure environment for SRI and thus large numbers of farmers are following SRI in medium lands.
| Mean dependent var | 0.794118 | S.D. dependent var | 0.404887 | |
| McFadden R-squared | 0.656328 | Adjusted R-squared | 0.577447 | |
| Log-likelihood | −65.35279 | Akaike criterion | 160.7056 | |
| Schwarz criterion | 219.5694 | Hannan-Quinn | 184.0772 |
Number of cases 'correctly predicted' = 354 (94.7%)
f(beta'x) at mean of independent vars = 0.405
Likelihood ratio test: Chi-square(14) = 249.615 [0.0000]
Test for normality of residual -
Null hypothesis: error is normally distributed
Test statistic: Chi-square(2) = 3.67044 with p-value = 0.159579
Economics of rice cultivation in SRI and conventional method
There was difference in nursery management between conventional and SRI methods. Quantity of seeds used by the SRI practicing farmers was found to be 4.5 and 3.6 kgs/ac for kharif and rabi season respectively whereas, for conventional practice the seed rate was 28 and 26 kg/ac respectively. It was observed that overall cost advantage including seed cost in nursery management was found to be Rs 655 and Rs 743/- per acre for the respective seasons (Table 12).
Overall cost and return analysis indicates that, in spite of severe drought experienced during 2015-16, the average yield advantage under SRI practice was found to be 3.23 and 1.4 quintals per acre respectively during kharif and rabi (Table 13). The return to cost ratio was found to be 1.66 and 2.08 for SRI plots against 1.27 and 1.90 for conventional plots during kharif and rabi season respectively.
4.2.1. Resource Conservation under SRI
It is widely perceived that SRI is an input saving technology. Table 14a and Table 14b depict the quantum of reduction in the use of different resources both in terms of quantity and value terms for kharif and rabi seasons respectively.
Quantum of seed saved was more than 22 kgs during both the seasons. Use of FYM was found to be higher than that of conventional practice and it was obvious as SRI principles manoeuver on organic farming. There was significant decline in application of Urea by around 5 kgs during kharif season and that for rabi season it varied between 12.84 to 16.46 kgs respectively for all the farmers practicing conventional rice farming and SRI adopters who had also conventional rice plots. The decline in DAP/mixed and MOP fertilizers during rabi season varied from 13.73 and 10.47 kgs respectively in case of all non SRI farms to 14.7 and 11.35 kgs respectively for farms following both conventional as well as SRI practice.
Higher male labour hours during kharif and rabi had been used in SRI against that of conventional practice indicating female labour displacement under SRI against that of conventional practice. Cost advantages were also observed across seasons which were prominent during rabi. There was significant decline in plant protection chemicals during rabi season over conventional farming.
By and large, the study clearly shows that there was considerable decline in hazardous and environment polluting chemicals under SRI practice. Taking in to consideration that 2015-16 being severe drought year, practicing SRI farms could achieve higher yield establishes the fact that the SRI practice can be followed in rainfed drought prone area.
4.3. Factors Affecting Drop Outs in SRI
Though farmers are found to be adopting SRI, there is tendency to drop out in the later years. Many factors are responsible for this behaviour. Though in this study, only constraints have been quantified, focus group discussions with the farmers during field visit reveal some compelling features which are both deliberate as well as many a time uncontrollable. The qualitative information gained from field visits, interactions with the farmers, field functionaries, coordinators of partner organizations, reveals that there are broadly two types of dis-adoption:
- Wilful dis-adoption: In which, the farmer wilfully decides not to adopt the practice in subsequent years.
- Forced dis-adoption: In which, some uncontrolled external factors forced the farmer not to adopt SRI. Such type of dis-adoption can either be temporary (if the farmer dis-adopts for a particular season/year) or permanent.
4.3.1. Lack of Proper Awareness among the Farmers
It is observed that in majority of the cases, rather than farmers’ own initiatives, SRI has been forced upon by the implementing agencies and due to constrained of limited time and higher target compulsions, proper awareness and capacity building could not be made. Because of affinity and rapport of the extension personnel with the farmers at ground level, many a times though farmers initiate SRI, lack of whole hearted involvement resulted in area allocation to unfeasible land and also improper care and timely operations mostly related to planting and weeding upsets the desired yield. Because of time bound nature of operations, farmers’ anxiety and worry to implement the various operations create a sense of insecurity which led to drop outs in subsequent seasons.
4.3.2. High Expectations
While promoting SRI, positive aspects of the practice are briefed which creates high expectations among the farmers about incremental yield and income advantages without considering the field and environmental viability as well as practices to be followed. This often leads to loss in confidence when unexpected yield is realized and created a negative sense in following SRI.
4.3.3. Excessive Emphasis on Practices than Principles
It is frequently found that farmers are compelled to follow strict management practices without considering the viability of the bio physical parameters. So it becomes wearisome for the farmers to follow SRI in subsequent seasons. Without considering the rationale behind the principles, farmers follow practices, which hinder achieving the desired results.
4.3.4. Prioritization of SRI Principles
It is often found that excessive emphasis is given on transplanting young seedlings in recommended spacing and due diligence is not maintained in making farmers follow timely intercultural activity of mechanical weeding which has also higher bearing on successful SRI crops. Levelled and graded field is another important consideration for successful SRI practice. However, this key aspect is often neglected while selecting fields for SRI adoption which hampers proper water management leading to less than expected yield and thus created indifference towards further adoption.
4.3.5. Channelizing Inputs and Resources
Promoting SRI by provision of inputs dose create a hype in initial stage but sends wrong signal about subsidies and contributes seriously towards changing the mind-set of the farmers. So instead of concerning towards benefits of SRI, priority is fixed on input and cash incentives. So as soon as the inputs supply is blocked, withdrawal symptom is found to be too common.
4.3.6. Withdrawal of Technical Support
Very often, implementing agencies constrained by withdrawing from area of operation due to various reasons within a stipulated time and this creates a sense of deprivation among the farmers and there remains greater likelihood of drop outs among them though they might have experienced higher yield advantage but confidence still remains low. Marginal risk averse farmers are very often reluctant to take up a new technology in the absence of technical support, guidance and continuous backing.
4.3.7. Lack of Water/Water Control
Rice farming in the state is predominantly rainfed while farmers rely on monsoon rain for different rice cultivation practices. Since SRI advocates practices which need time bound activities, farmers very often inhibited by lack of timely water availability because of poor monsoon. In addition to that, field level water management gets complicated very often due to erratic and uneven rainfall distribution pattern.
4.3.8. Constraints Faced by the Farmers
The study has categorized 50 numbers of constraints under different dimensions such as technological, transplanting, intercultural operations, infrastructure support, general, technical, social, economic and others. Results revealed large number of variations in terms of constraint faced by the farmers in adoption of SRI across adopters, drop outs and non-adopters. Overall, adopters had fifteen major limitations (Table 11a) in maintaining ideal field condition and water level at field situation, scarcity of skilled labour and their reluctance to performing activities confirming to the SRI practices, hardship in mechanical weeding, non-availability of green manure, required FYM/organic manure, labourers reluctance as planting window is short and labourers want to maximize their objective function of higher wage per hour, hydrological problem constraining practice of alternate drying and wetting, non-availability of required bio fertilizer, weeding higher area with weeder, lack of support price to output, topographical as majority of the rice land are not levelled which results in uneven distribution of water and thus poor plant population and ultimately lower yield, problem to solve technological problems through extension personnel as well as implementing agencies and lack of assured source of irrigation.
Drop outs and non-adopters had different sets of constraints than that of adopters which can be seen by the ranks from Table 11b,c respectively.

Table 11a.
Estimates of Garrett score and ranking for constraint analysis by adopters.
| Constraints | Constraints Sub Group | Garrett Score | Rank |
|---|---|---|---|
| Technological support | No attempt to solve technological problems | 25.33 | 13 |
| Transplantation | Difficulty in maintaining ideal field condition | 63.70 | 1 |
| Labourer’s reluctance | 36.44 | 7 | |
| Intercultural | Not possible to maintain water at field situation level | 60.36 | 2 |
| No assured source of irrigation | 23.94 | 15 | |
| Difficulty in mechanical weeding | 38.45 | 4 | |
| Not possible to weed more area with weeder | 29.69 | 10 | |
| Infrastructural support | Non availability of irrigation infrastructure | 24.96 | 14 |
| General | Economic scarcity of skilled labour | 39.64 | 3 |
| Non availability of sufficient FYM/organic manure | 36.91 | 6 | |
| Non availability of Green manure | 37.01 | 5 | |
| Non availability of Bio-fertilizer | 30.12 | 9 | |
| Economic | No support price in marketing | 27.32 | 11 |
| Others | Topographical | 27.15 | 12 |
| Hydrological | 36.23 | 8 |
Table 11b.
Estimates of Garrett score and ranking for constraint analysis by dropouts.
| Constraints | Constraints Sub Group | Garrett Score | Rank |
|---|---|---|---|
| Technological support | Inadequate training | 29.73 | 14 |
| Insufficient guidance and experience | 37.53 | 8 | |
| No attempt to solve technological problems | 34.23 | 11 | |
| Transplantation | Difficulty in maintaining ideal field condition | 62.63 | 1 |
| Labourer’s reluctance | 40.07 | 5 | |
| Intercultural | Not possible to maintain water at field situation level | 60.32 | 2 |
| No assured source of irrigation | 37.77 | 7 | |
| Difficulty in mechanical weeding | 43.12 | 4 | |
| Infrastructural support | Non availability of irrigation infrastructure | 30.08 | 13 |
| General | Economic scarcity of skilled labour | 39.64 | 6 |
| Non availability of sufficient FYM/organic manure | 33.35 | 12 | |
| Technical | Complex technology for actual implementation | 28.91 | 15 |
| Economic | No support price in marketing | 35.56 | 9 |
| Others | Topographical | 47.23 | 3 |
| Hydrological | 35.54 | 10 |
Table 11c.
Estimates of Garrett score and ranking for constraint analysis by Non adopters.
| Constraints | Constraints Sub Group | Garrett Score | Rank |
|---|---|---|---|
| Technological support | Inadequate training | 60.93 | 2 |
| Lack of exposure visit to develop confidence | 34.63 | 15 | |
| Insufficient guidance and experience | 49.43 | 6 | |
| No clarification and understanding of SRI principles | 50.99 | 4 | |
| No attempt to solve technological problems | 40.53 | 10 | |
| Transplantation | No skill competency in nursery raising | 46.58 | 7 |
| Difficulty in uprooting single seedlings from the mat/raised bed | 35.67 | 13 | |
| Difficulty in maintaining ideal field condition | 41.03 | 9 | |
| No skill in transplanting single seedling with proper spacing | 50.08 | 5 | |
| Difficulty in transplanting at shallow depth | 38.09 | 12 | |
| Intercultural | Not possible to maintain water at field situation level | 41.29 | 8 |
| General | Non availability of sufficient FYM/organic manure | 35.18 | 14 |
| Technical | Complex technology for actual implementation | 61.49 | 1 |
| Unsuitability of the technology | 38.26 | 11 | |
| Social | Lack of confidence in taking new technique | 3.42 | 3 |
4.4. Area Expansion under SRI
Only 18% of the SRI practicing farmers had expressed their willingness on area expansion under SRI whereas, 76% had expressed their inability to increase the area as 34% of them had already covered their entire rice area under SRI and for 40%, the remaining area under rice was not feasible for SRI. Among the farmers who opted for increasing area, main reasons were increase in yield and cost effectiveness of SRI over conventional practice. About six percent had expressed that they would decrease the area under SRI because of uncertainty in the production front due to drought and production was not commensurate with conventional practice and few had expressed that the SRI practices were too cumbersome and also labourers unwillingness to follow the practices particularly for transplanting and weeding operations (Figure 6).
4.4.1. Perceived Benefits of SRI over Conventional Practice
While analysing the positive impact of SRI over conventional practice, cent percent farmers had expressed high saving of seeds over conventional practice (Figure 7). Yield advantage and profitability over conventional practice had been observed by 86 and 88% respectively of the practicing farmers, while only around 52 to 53% had expressed that SRI was compatible to the system, technically feasible and resulted in sustained production. However, 74% maintained that SRI helped in improving the soil health and only 42% had opinion that SRI had increased water use efficiency.
5. Major Policy Options
The study clearly specified that SRI had positive impact on both rice yield and income even during adverse weather condition. However, there had been wide disparity among the level and intensity of adoption. The different components of SRI had different acceptance level across the state. Thus, redesigning location specific technology pertaining to different SRI components is necessary.
Resource farmers should be identified at the community level and developed who would promote demonstration and dissemination of SRI. Suitable farm level modification of different SRI components should be encouraged in performing different operations as well as improve the rice productivity.
Mechanization should be taken up in large scale particularly related to power weeder, as manual mechanical weeding is strenuous and suitable incentives should be provided for promoting use of power weeder.
Necessary arrangements should be made to provide adequate training to the young labour especially to the young women as they were found to be displaced and disadvantaged due to highly skilled nature of the operations. Labour bank may be created at community level.
Location specific trials should be carried out to find out the factors responsible for yield variability and suggested majors should be followed to overcome the issue.
Efforts should be given to tap irrigation potential under the existing framework like suitability of diversion based irrigation, water harvesting structure etc. A radical institutional set up of extension services need to be reframed to bring back the SRI drop outs for SRI area expansion.
6. Conclusions
Odisha is handicapped with low irrigation infrastructure, frequently subjugated by adverse climatic fluctuations which have resulted in low and wide variability in yield across the years. Also, it has wide variations in rice ecosystem which prohibits farmers to adapt a particular rice technology. So sustainability of rice production in varied agro system is an issue for the farmers over the years. To bring the productivity to a higher platform, SRI has been regarded as a technology which is proved to be resilient to the problems encountered by the farmers in the state.
The rice ecosystem represents quite a risk prone environment particularly during drought years. Canal was found to be major source of irrigating indicating that water management in SRI plots would be very difficult to maintain because of flow irrigation. Adoption pattern of SRI among practicing farmers indicated that agro ecological factors along with mental obstruction and predicament played significant role in deciding the seed rate and age of the seedling in majority of the farmers. Similarly mechanical weeding was found to be widely followed but timing and number of times were compromised. Irrespective of prevailed drought during 2015-16, SRI farmers experienced an incremental yield gain during the year while, farmers compliance towards following different components of SRI improved over the time.
The benefits out of SRI outweighed that of conventional practice both in terms of yield and profits during kharif season while considering the severe drought faced by the state during 2015-16. However, more than 75% had expressed their inability for area expansion because of compelling factors. We found that more than 70% of farmers had positive outlook for SRI in terms of yield, profitability and improved soil status, however, compatibility of the SRI to the existing farming system, technical feasibility, sustained production and increased water use efficiency.
Acknowledgements
Authors acknowledge the financial support by Tata Trust for Systematic Approach to Research and Adoption of SRI (SARAS) project. All errors are born solely by authors.
References
- Banerjee, A.; Chandrasekhar, A.G.; Duflo, E.; Jackson, M.O. (2013). The diffusion of Microfinance. Science, 341. [CrossRef]
- Barrett, C.B.; Christine, M.M.; Oloro, V.; McHugh, B; J. (2004). Better Technology, Better Plots, or Better Framers? Identifying Changes in Productivity and Risk among Malay Rice Farmers. Americal Journal of Agricultural Economics, 86(4), 869-888.
- FAOSTAT. (2017). Crops. Retrieved January 6, 2018, from FAO: http://www.fao.org/faostat/en/#data/QC.
- Glover, D. (2011).The System of Rice Intensification: Time for an empirical turn. NJAS –Wageningen Journal of Life Sciences, 57 (3–4), 217–224. [CrossRef]
- Govt. of Odisha, D. o. E. a. S. 2018. Odisha Economic Survey 2017-18. 327. Bhubaneswar: Planning and Convergence Department, Govt. of Odisha.
- Jagannath, P.; Pullobhatla, H.; Uphoff, N. (2013). Meta Analysis Evaluating Water Use, Water Savings and Water Productivity in Irrigated Production of Rice with SRI vs. Standard Management Methods. Taiwan Water Conservancy, 61(4).
- McDonald, A.J.; Hobbs, P.; Riha, S. (2006). Does the system of rice intensification outperform conventional best management? A synopsis of the empirical record. Field Crops Research, 96, 31-36.
- Moser, C.M.; Barrett, C.B. (2003). The disappointing adoption dynamics of a yield-increasing, low external-input technology: the case of SRI in Madagascar. Agricultural System, 76(3), 1085-1100. [CrossRef]
- Shah, T. 2009. Taming the anarchy: Groundwater governance in South Asia. Washington, DC: Resources for the Future.
- Shah, T.; Verma, S.; Durga, N.; Rajan, A.; Goswami, A. Palrecha (2016) Har Khet Ko Pani (Water to Every Farm): rethinking Pradhan Mantri Krishi Sinchai Yojana (PMKSY).
- Sheehy, J.E.; Peng, S.; Dobermann, A.; Mitchell, P.; Ferrer, A.; Yang, J., et al. (2004). Fantastic yields in the system of rice intensification: fact or fallacy? Field Crops Res., 88, 1-8.
- Sinha, S.K.; Talati, J. (2007). Productivity impacts of the system of rice intensification(SRI): A case study in West Bengal, India. Agricultural water Management, 87(1), 55-60. [CrossRef]
- Stygler, E.; Attaher, M.A.; Guindo, H.; Ibrahim, H.; Diaty, M.; Abba, I., et al. (2011). Application of system of rice intensification practices in the aridenvironment of the Timbuktu region in Mali. Paddy and Water Environment, 9(1), 137-144.
- Takahasi, K.; Barrett, C.B. (2014). The System of Rice Intensification and Its Impacts on Household Income and Child Schooling: Evidence from Rural Indonesia. American Journal of Agricultural Economics, 96(1), 269-289.
- UN. (2015, September 25). SUSTAINABLE DEVELOPMENT KNOWLEDGE PLATFORM. Retrieved January 6, 2018, from United Nations: http://www.un.org/ga/search/view_doc.asp?symbol=A/RES/70/1&Lang=E.
- UNESCO. (2016). The United Nations World Water Development Report 2016. Retrieved January 6, 2018, from UNESCO: http://unesdoc.unesco.org/images/0024/002440/244041e.pdf.
- Varma, P. (2017). Rice Productivity and Food Security in India: A Study of the System of Rice Intensification. Ahmedabad: Springer.
- Varma, P. (2018). Adoption of System of Rice Intensification under Information Constraints: An Analysis for India. The Journal of Development Studies, 54(10), 1838-1857. [CrossRef]
Figure 1.
Relationship between rice yield and percentage area grown to modern varieties in Odisha during 1971-2013.
Figure 1.
Relationship between rice yield and percentage area grown to modern varieties in Odisha during 1971-2013.
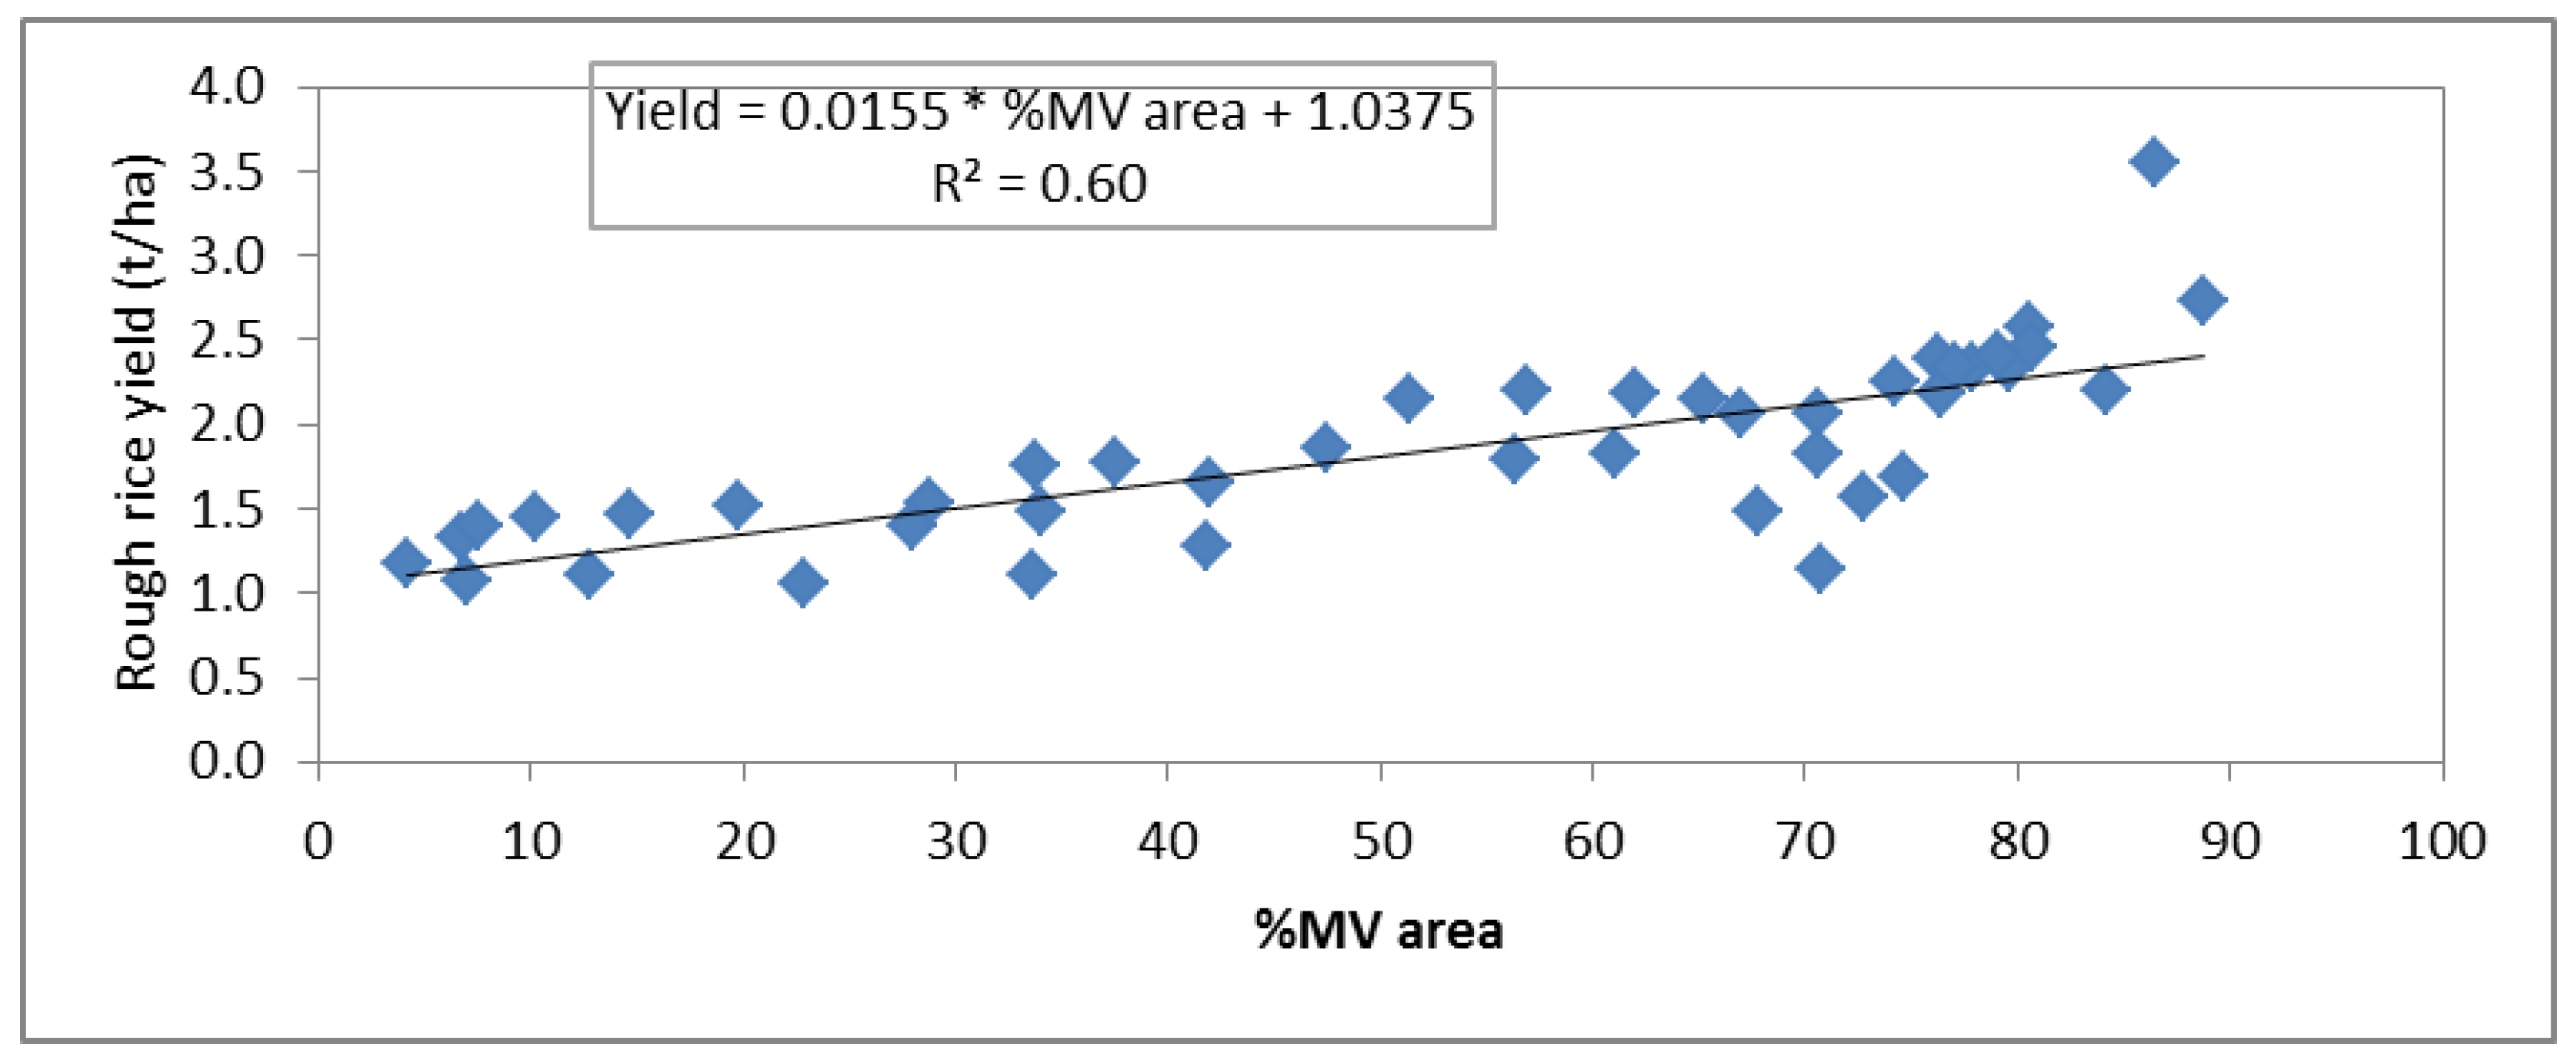
Figure 2.
Map of the study areas highlighted with red triangles on Odisha state map. The intensity of the green colour indicates area coverage of rice in kharif season. A larger yellow circle indicates higher productivity of rice.
Figure 2.
Map of the study areas highlighted with red triangles on Odisha state map. The intensity of the green colour indicates area coverage of rice in kharif season. A larger yellow circle indicates higher productivity of rice.
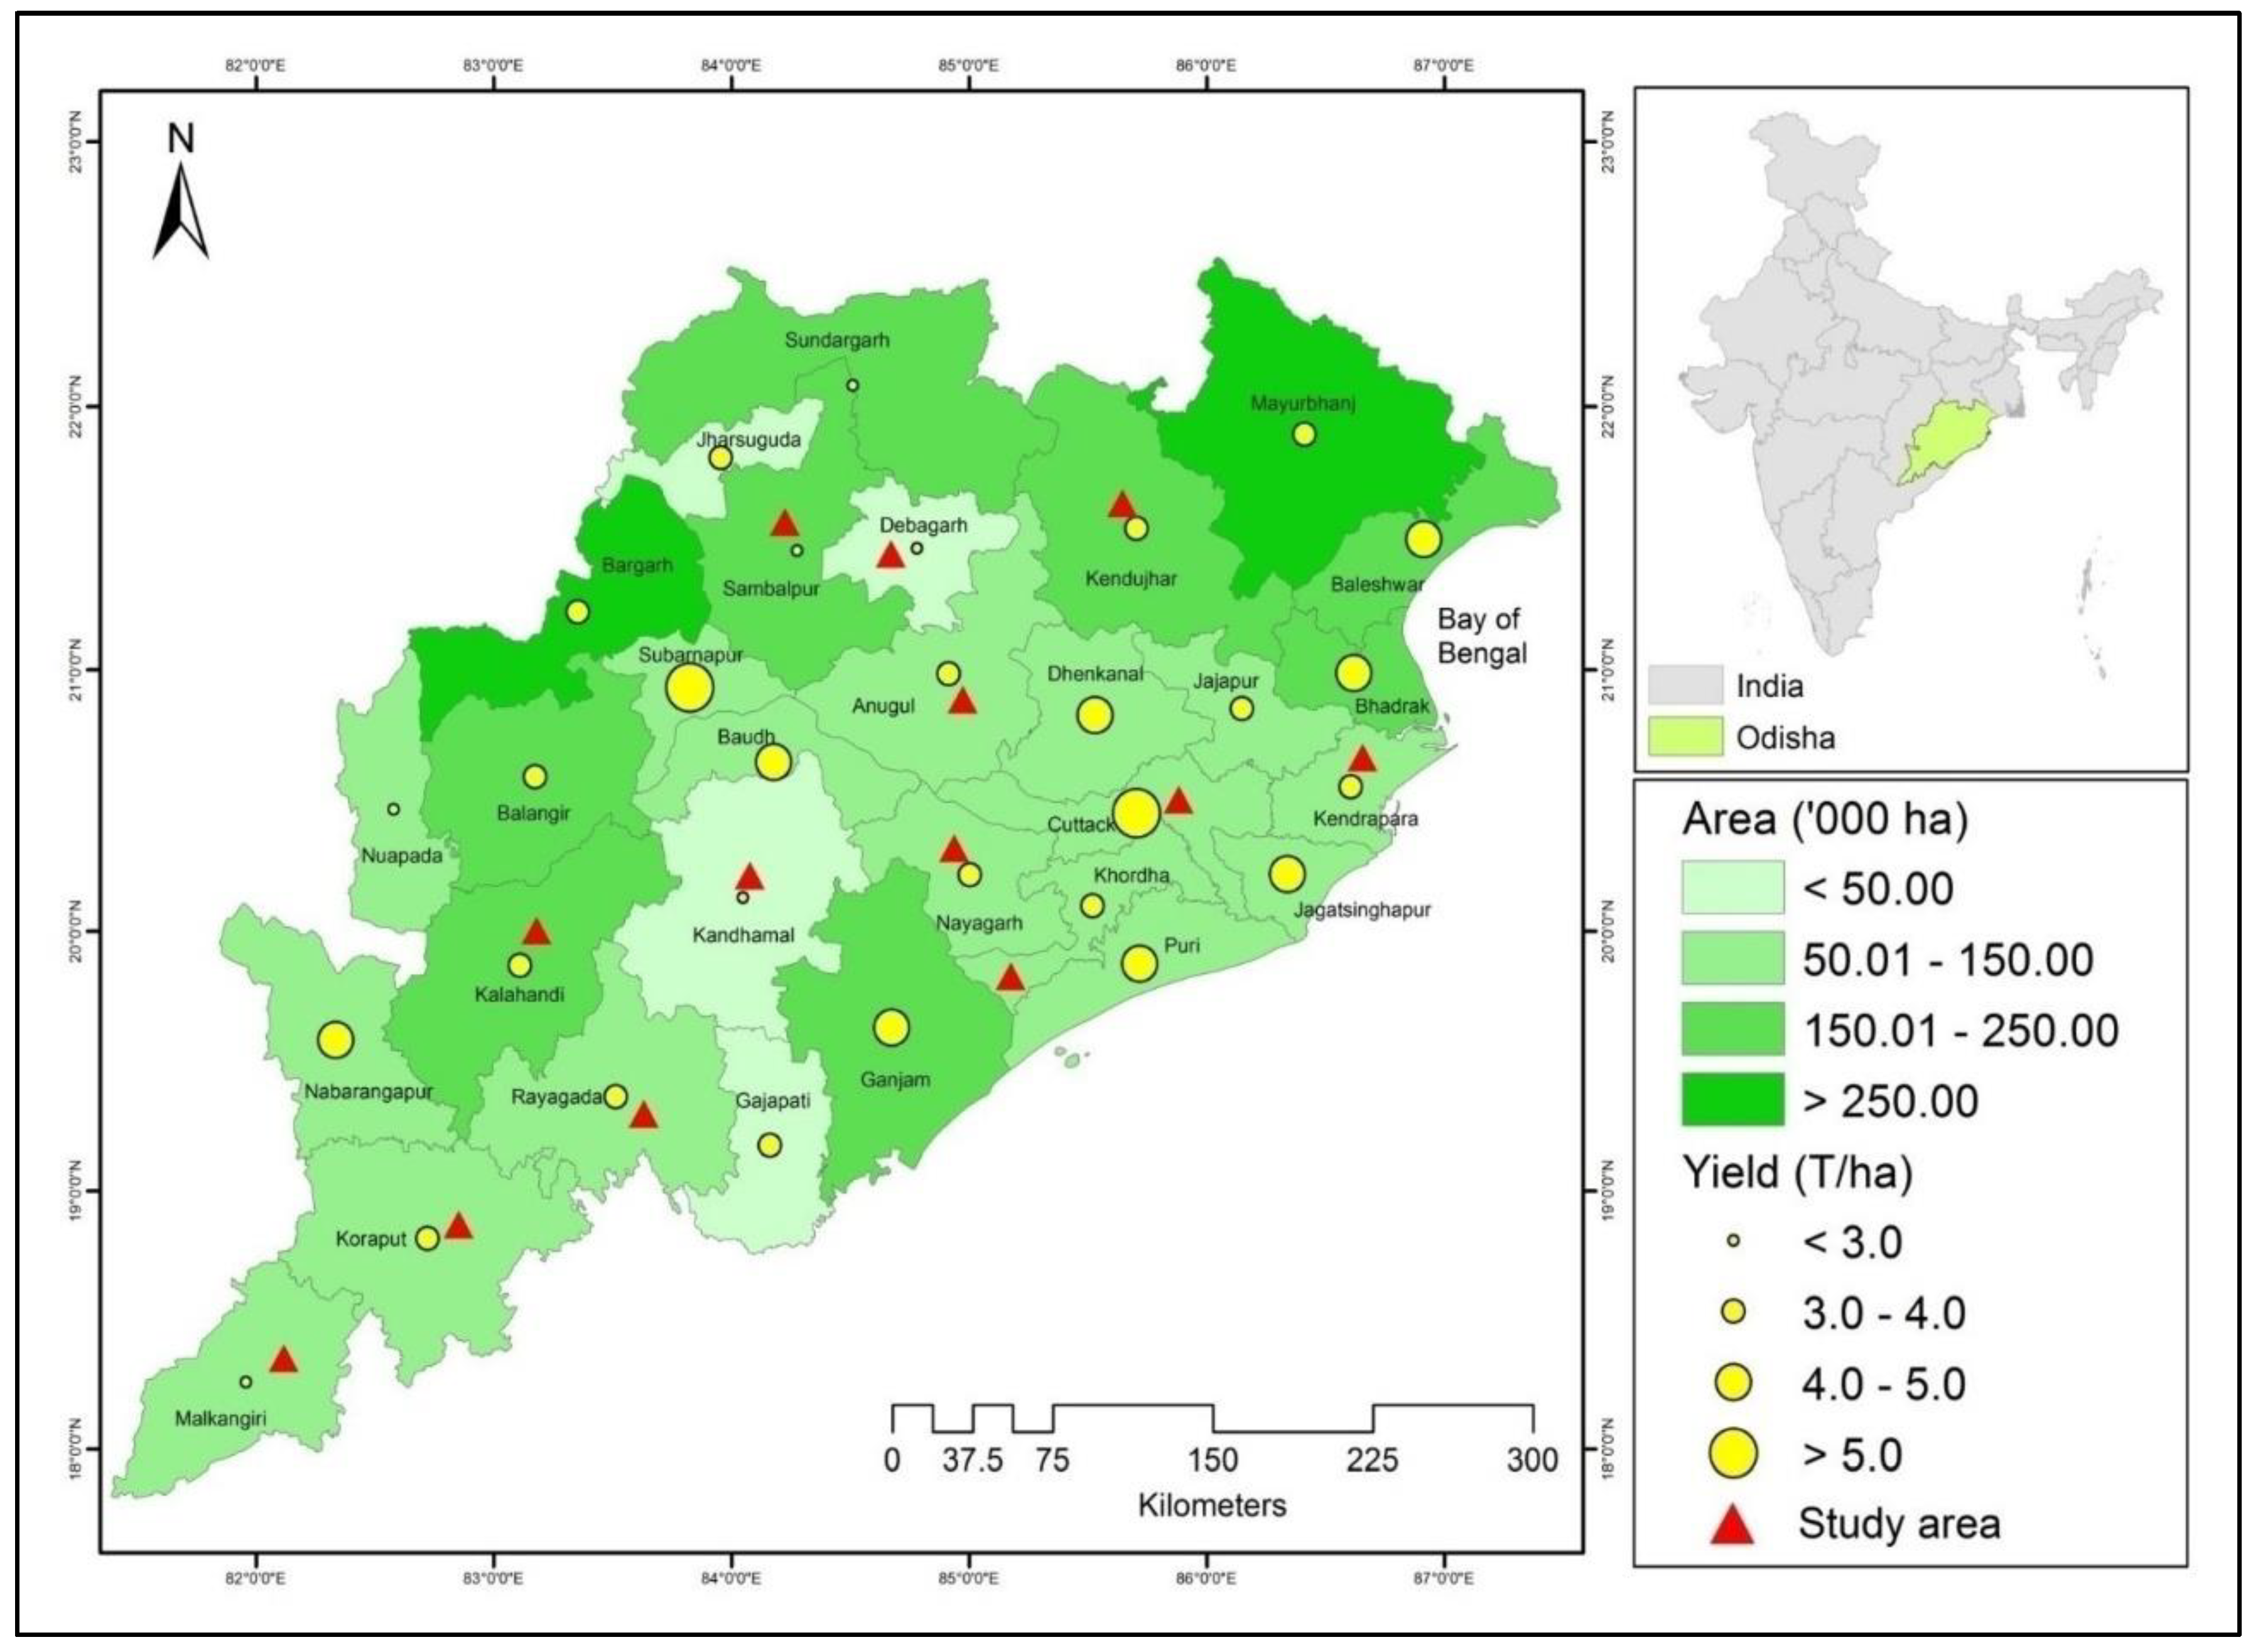
Figure 3.
Social classification of sample respondents considered in the survey according to the level of adoption of SRI method. Note: TOT- total number of sample respondents, NAD- SRI non-adopters, DO- SRI dropouts meaning, who discontinued SRI method, AD- SRI adopters and continuing.
Figure 3.
Social classification of sample respondents considered in the survey according to the level of adoption of SRI method. Note: TOT- total number of sample respondents, NAD- SRI non-adopters, DO- SRI dropouts meaning, who discontinued SRI method, AD- SRI adopters and continuing.
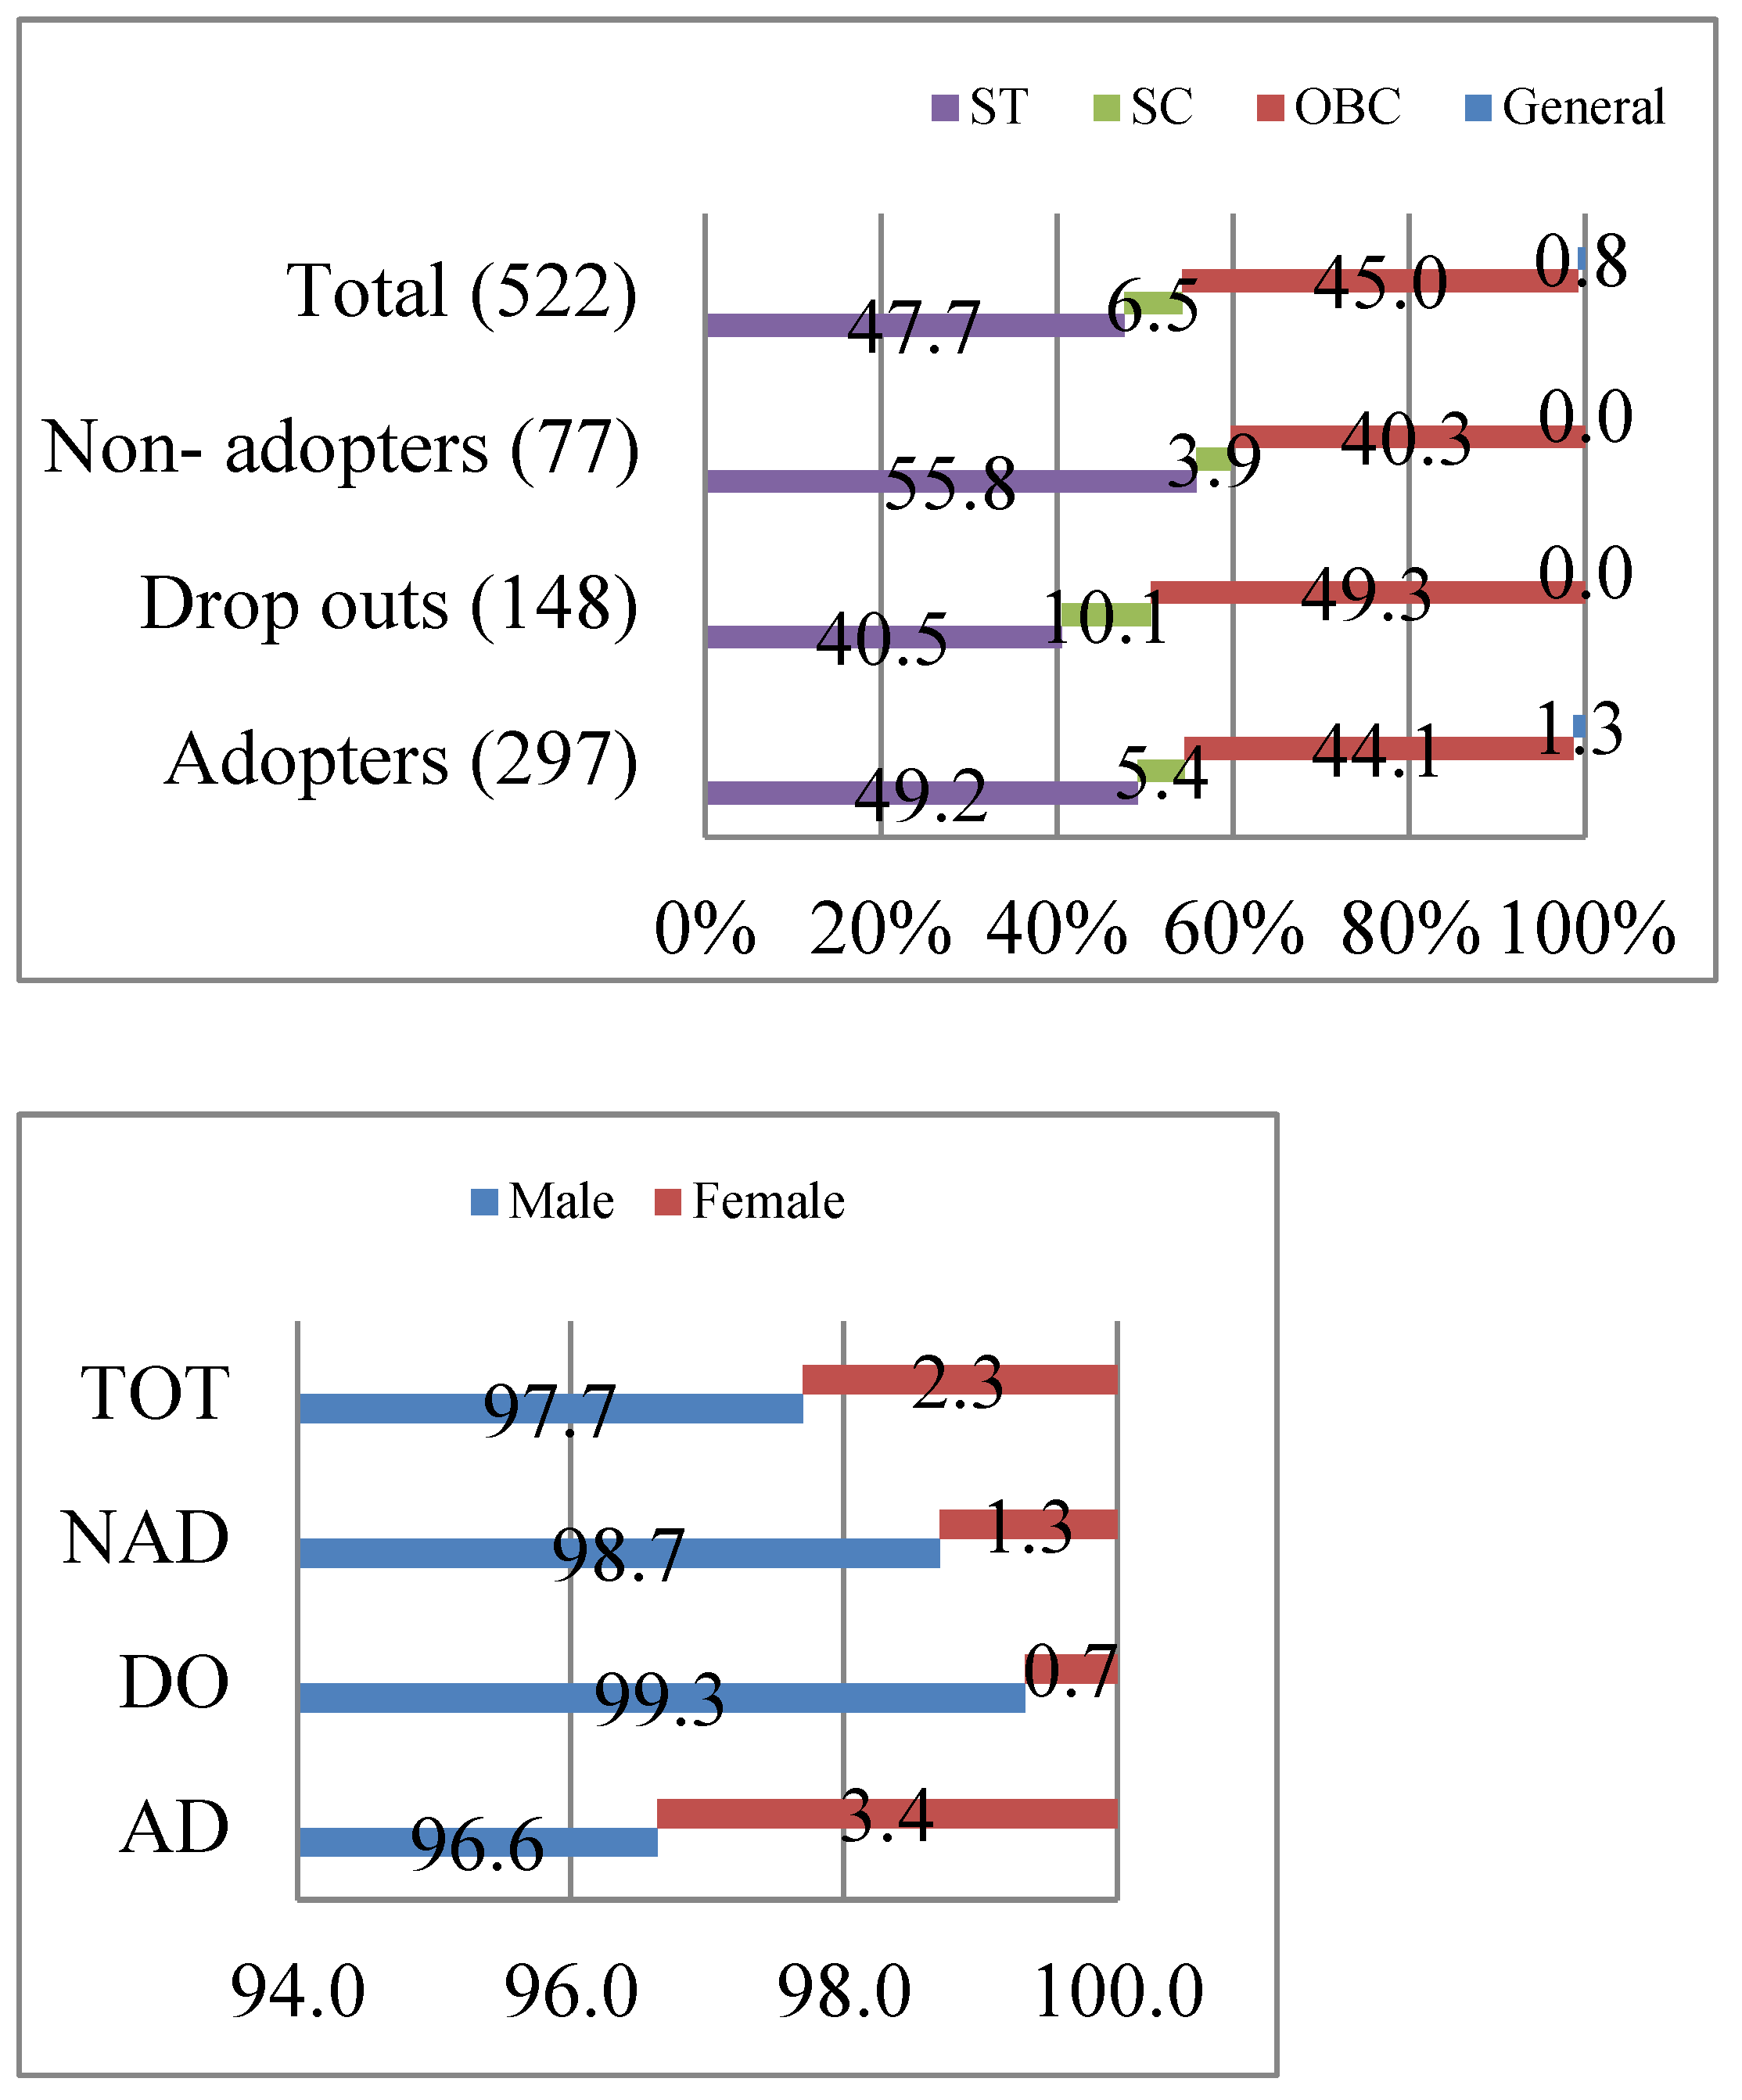
Figure 4.
Primary and secondary occupations of sample respondents in the study area.
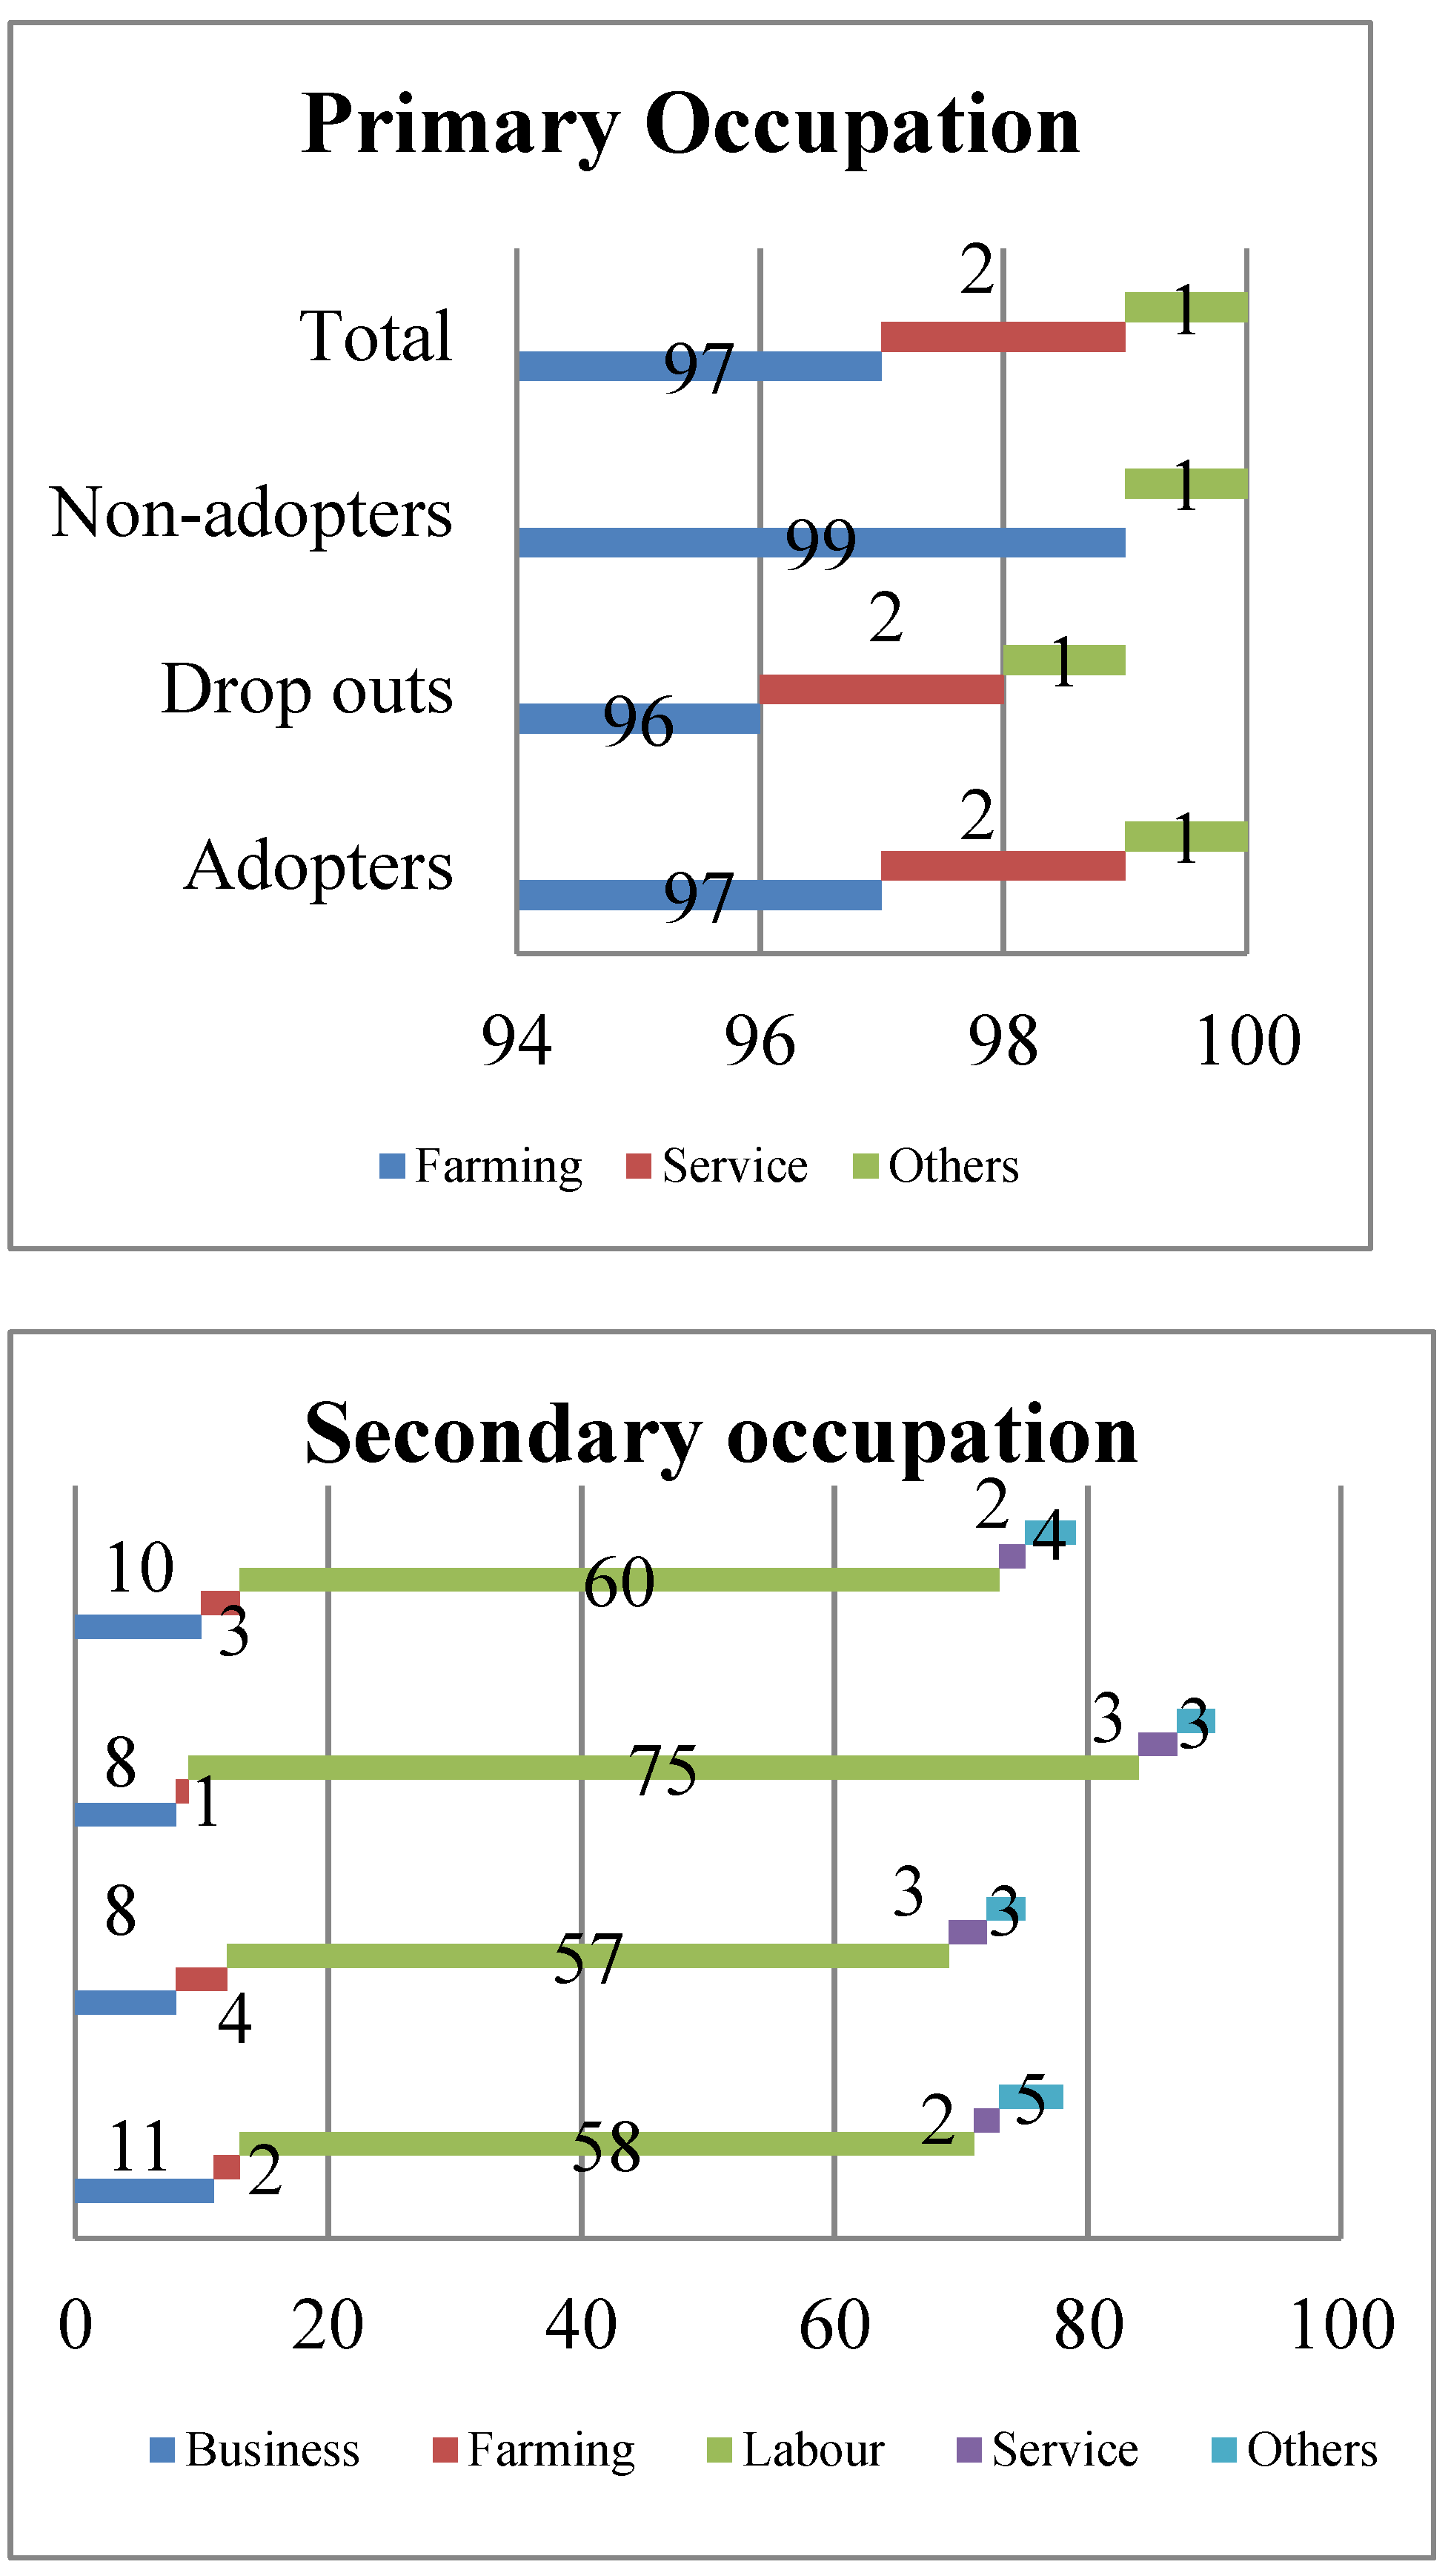
Figure 5.
Yield gains of sample respondents by farm size class in two different seasons (in percentages).
Figure 5.
Yield gains of sample respondents by farm size class in two different seasons (in percentages).
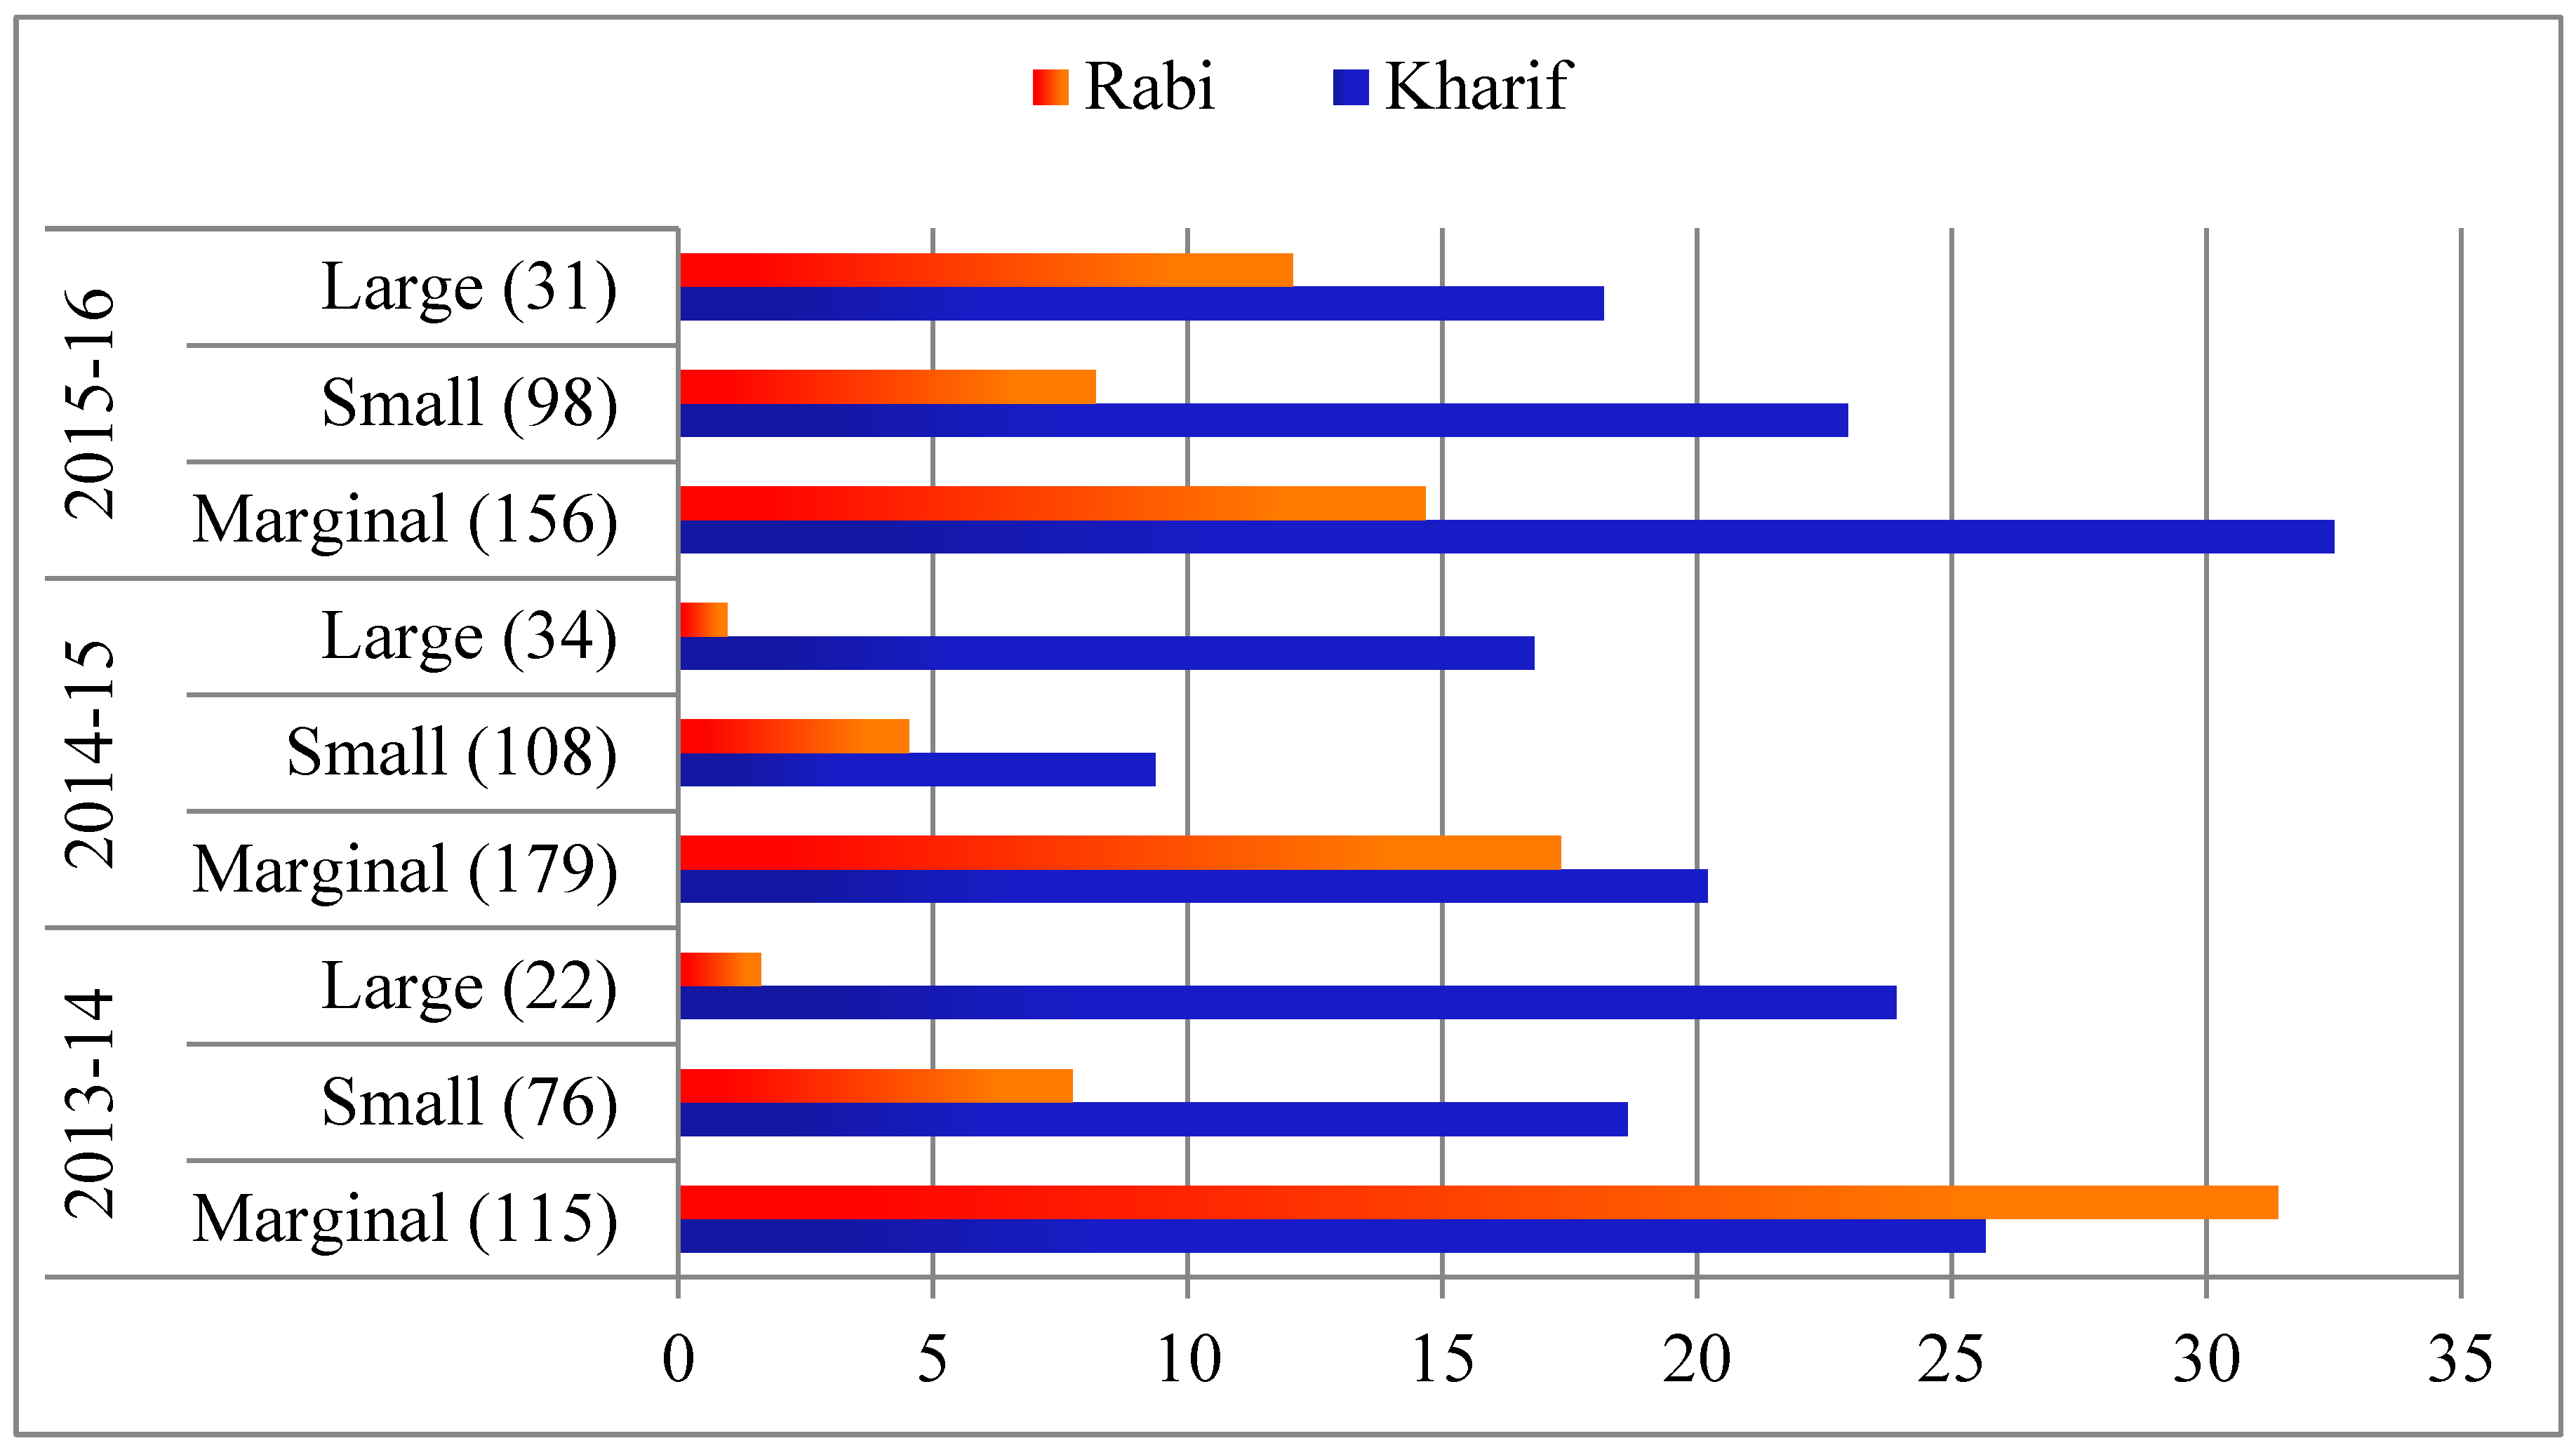
Figure 6.
Perception of the practicing farmers about change in area under SRI.
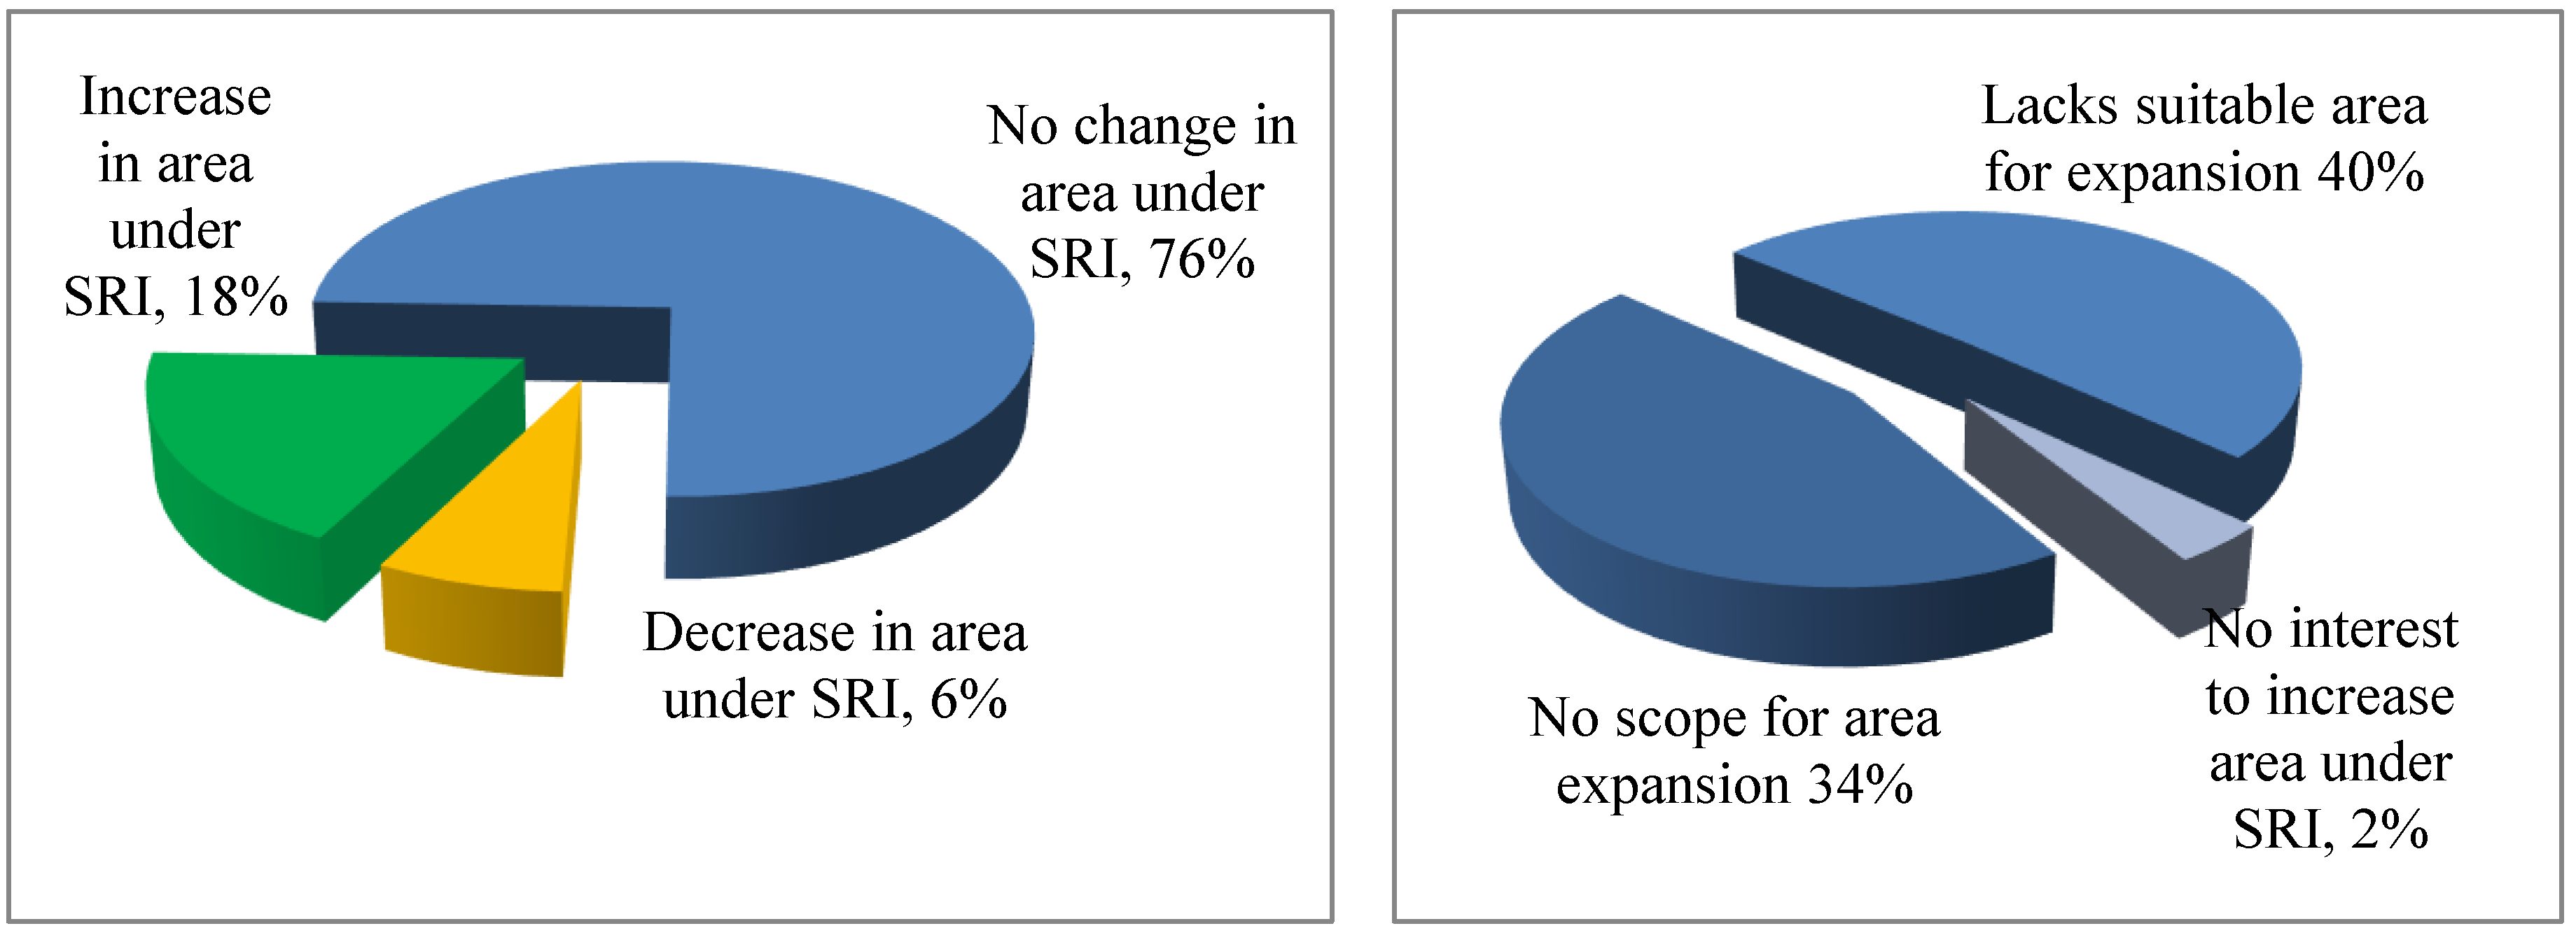
Figure 7.
Advantages of SRI relative to Conventional practice.
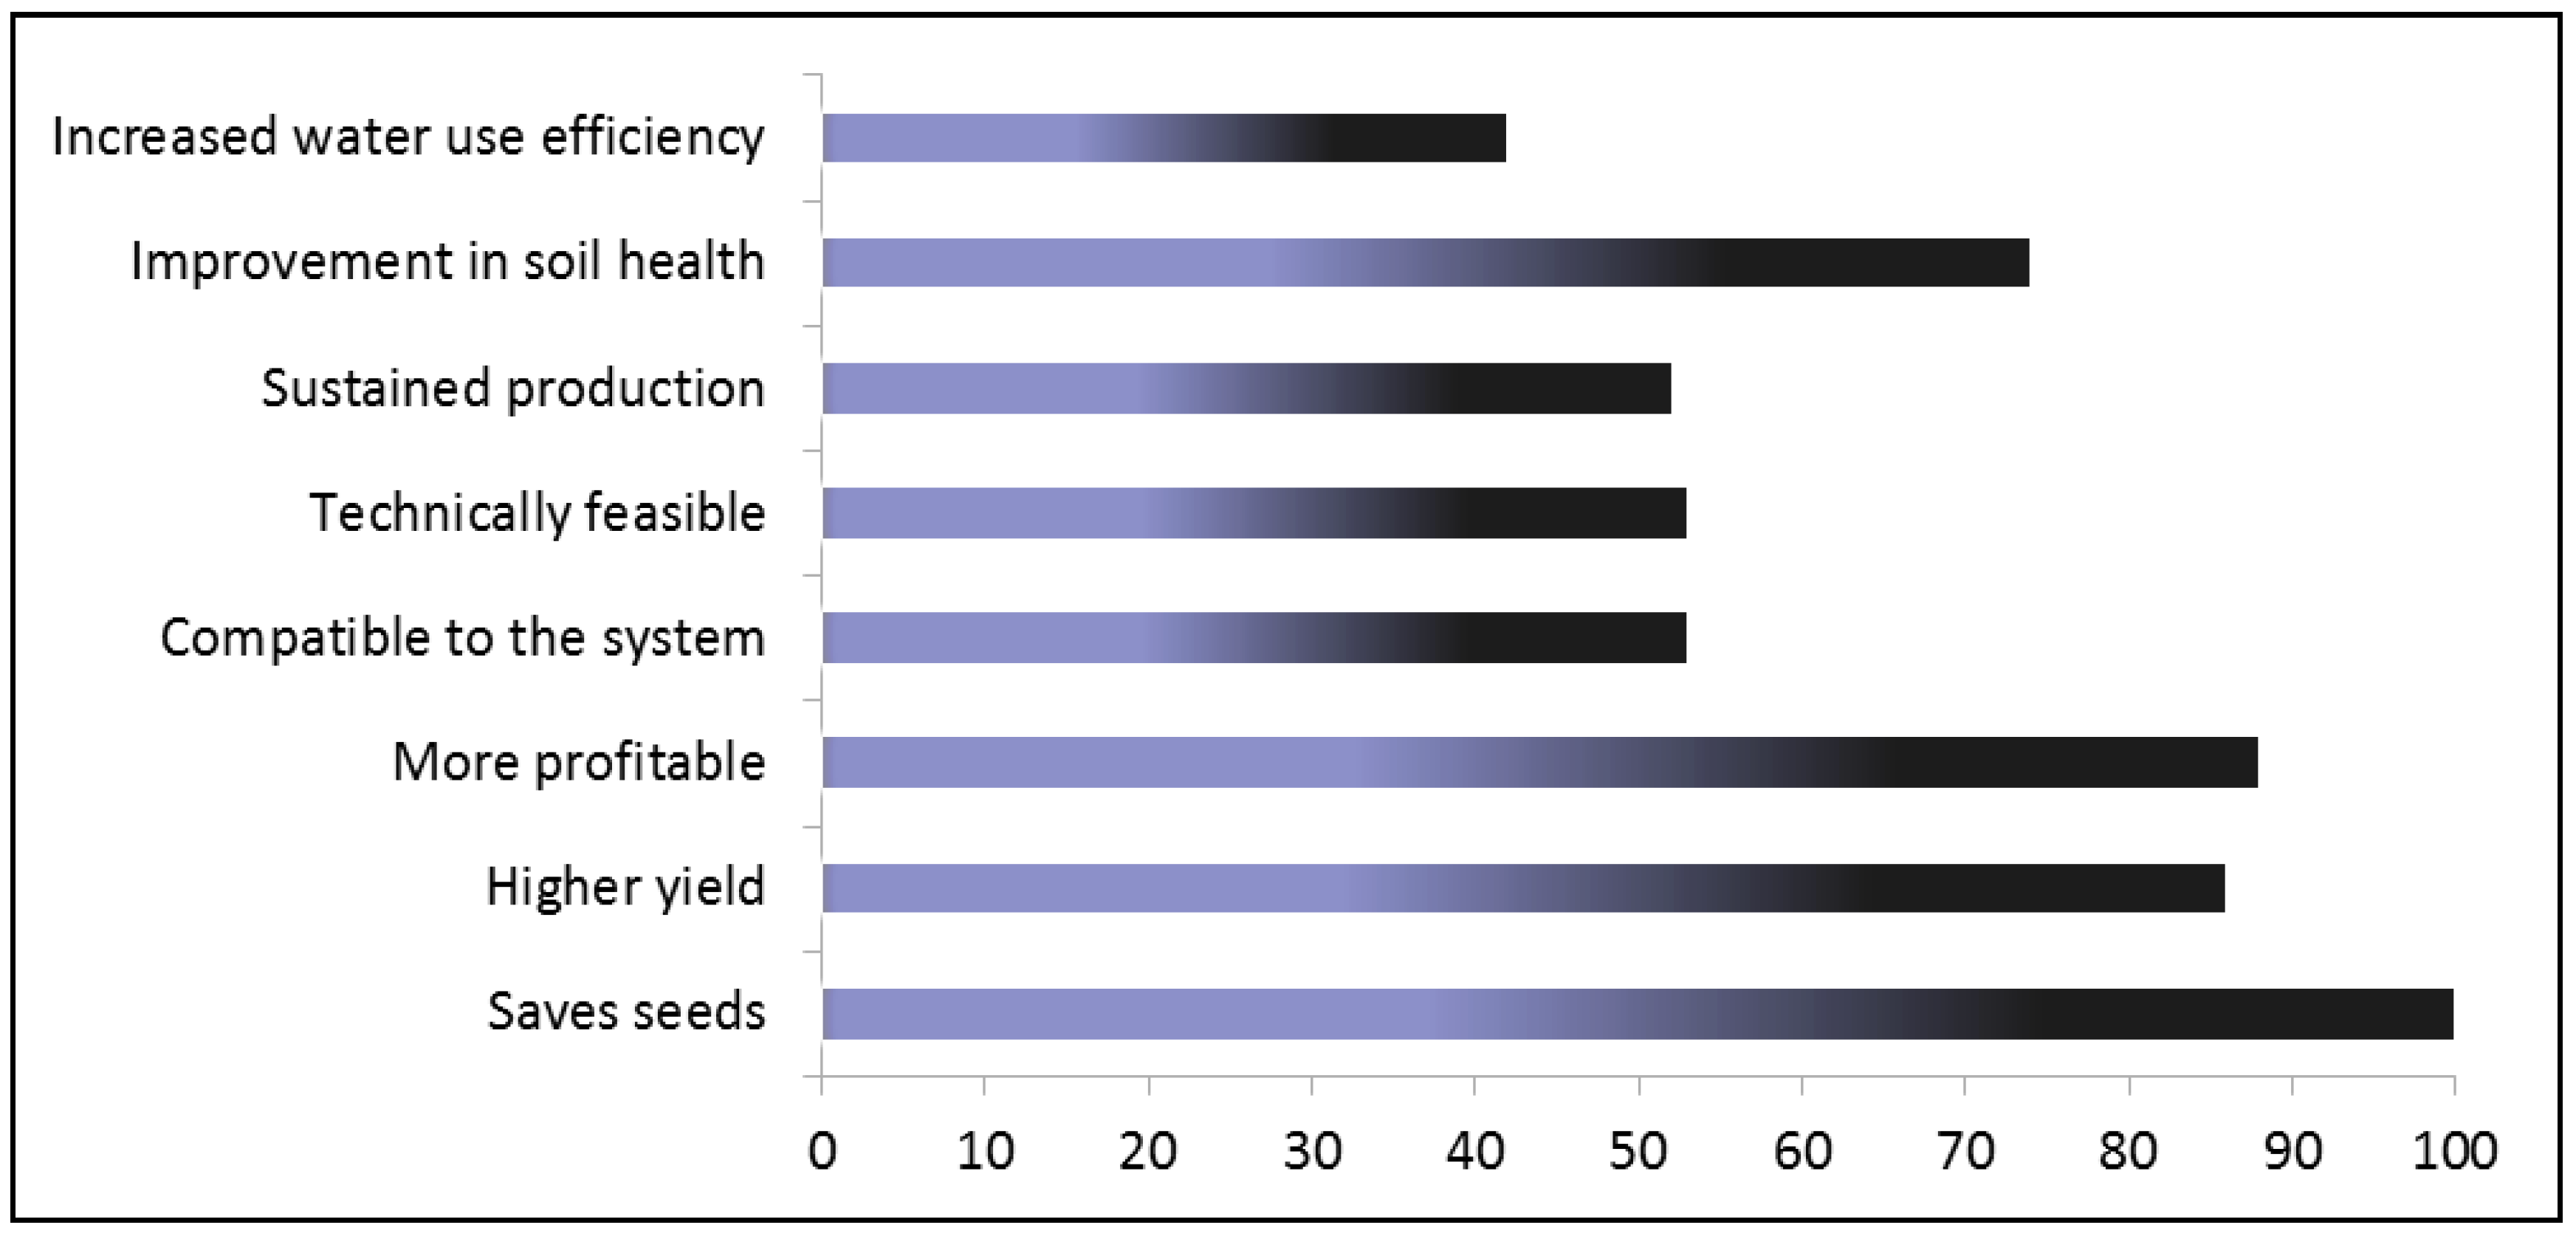
Table 1.
Sampling framework.
| Sl. No | District | Adopters | Drop outs | Non adopters | Total |
|---|---|---|---|---|---|
| 1. | Angul | 21 (7) | 17 (11) | 10 (13) | 48 (9) |
| 2. | Cuttack | - | 7 (5) | - | 7 (1) |
| 3. | Deogarh | 31 (10) | 7 (5) | 6 (8) | 44 (8) |
| 4. | Kalahandi | 27 (9) | 12 (8) | 10 (13) | 49 (9) |
| 5. | Kandhamal | 34 (11) | 10 (7) | 5 (6) | 49 (9) |
| 6. | Kendrapara | - | 6 (4) | - | 6 (1) |
| 7. | Keonjhar | 32 (11) | 21 (14) | 7 (9) | 60 (11) |
| 8. | Khurda | 11 (4) | 7 (5) | (0) | 18 (3) |
| 9. | Koraput | 43 (14) | 5 (3) | 9 (12) | 57 (11) |
| 10. | Malkangiri | 12 (4) | 12 (8) | 6 (8) | 30 (6) |
| 11. | Nayagarh | 34 (11) | 21 (14) | 5 (6) | 60 (11) |
| 12. | Rayagada | 25 (8) | 10 (7) | 8 (10) | 43 (8) |
| 13. | Sambalpur | 27 (9) | 13 (9) | 11 (14) | 51 (10) |
| Grand Total | 297 (100) | 148 (100) | 77 (100) | 522 (100) |
Note: Figures in parentheses are percentage to column total.
Table 2.
Profile of sample respondents.
| Sl. No | Particular | Adopters (297) |
Drop outs (148) |
Non-adopters (77) |
Grand Total (522) |
|---|---|---|---|---|---|
| 1. | Caste wise classification | ||||
| a) | General | 4(2) | - | - | 4(1) |
| b) | Other backward caste | 131(44) | 73(49) | 31(40) | 235(45) |
| c) | Scheduled caste | 16(5) | 15(10) | 3(4) | 34(6) |
| d) | Scheduled tribe | 146(49) | 60(41) | 43(56) | 249(48) |
| 2. | Gender wise classification | ||||
| a) | Male | 287 (97) | 147 (99) | 76 (99) | 510 (98) |
| b) | Female | 10 (3) | 1 (1) | 1 (1) | 12 (2) |
| 3. | Age classes | ||||
| a) | 15-40 years | 72 (24) | 37 (25) | 25 (32) | 134 (26) |
| b) | 40-60 years | 200 (67) | 95 (64) | 39 (51) | 334 (64) |
| c) | >60 years | 25 (9) | 16 (11) | 13 (17) | 54 (10) |
| 4. | Average age of household head (years) | 45 | 46 | 46 | 46 |
| 5. | Educational status(Years) | ||||
| a) | No formal education | 93 (31) | 26 (18) | 19 (25) | 138 (26) |
| b) | 1-4 | 19 (6) | 10 (7) | 10 (13) | 39 (8) |
| c) | 4-10 | 114 (39) | 76 (51) | 32 (41) | 222 (43) |
| d) | 10-12 | 63 (21) | 28 (19) | 14 (18) | 105 (20) |
| e) | 12-15 | 8 (3) | 8 (5) | 2 (3) | 18 (3) |
| 6. | Average years of schooling of HH | 5 | 6.3 | 5 | 5.5 |
Note: Figures in parentheses are percentage to column total.
Table 3.
Occupational status and average family labour contribution.
| Particular | Adopters (297) |
Drop outs (148) |
Non-adopters (77) |
Grand Total (522) |
|---|---|---|---|---|
| Primary occupations | ||||
| 1. Farming | 291 (97) | 142 (96) | 76 (99) | 509(97) |
| 2. Service | 5 (2) | 4 (2) | - | 9 (2) |
| 3. Others | 1(1) | 2(1) | 1(1) | 4(1) |
| Secondary occupations | ||||
| 1. Business | 32 (11) | 12 (8) | 6 (8) | 50 (10) |
| 2. Farming | 6 (2) | 6 (4) | 1 (1) | 13 (3) |
| 3. Labour | 172 (58) | 85 (57) | 58 (75) | 314 (60) |
| 4. Service | 6 (2) | 4 (3) | 2 (3) | 12 (2) |
| 5. Others | 15(5) | 5(3) | 2(3) | 22(4) |
| A. Average family labour available/ year | 502 | 494 | 485 | 498 |
| B. Average male family labour available/ year | 338(67) | 336(68) | 313(65) | 334(67) |
| Average female family labour available/ year | 164(33) | 158(32) | 172(35) | 164(33) |
Table 4.
Distribution of farmers according to farm size.
| Farm types | Adopters | Drop outs | Non-adopters | Grand Total |
|---|---|---|---|---|
| 1. Marginal | 155(53) | 76(51) | 49(64) | 280(54) |
| 2. Small | 102(34) | 62(42) | 27(35) | 191(36) |
| 3. Large | 40(13) | 10(7) | 1(1) | 51(10) |
| 4. Total | 297(100) | 148(100) | 77(100) | 522(100) |
Note: Figures in parentheses are percentage to column total.
Table 5.
Land holding pattern of sample farmers.
| Particulars | Adopters | Drop outs | Non-adopters | Grand Total |
|---|---|---|---|---|
| Experience in years of rice farming (years) | 21.9 (100) | 21.9 (100) | 22.1 (100) | 21.9 (100) |
| Own land irrigated area (ac) | 1.26 | 0.60 | 0.80 | 1.00 |
| Owned-land dry area (ac) | 1.76 | 1.98 | 1.46 | 1.78 |
| Leased in land irrigated area (ac) | 0.13 | 0.22 | 0.03 | 0.14 |
| Leased in dry area (ac) | 0.11 | 0.19 | 0.06 | 0.13 |
| Leased out land irrigated area (ac) | 0 | 0.02 | 0 | 0 |
| Leased out dry area (ac) | 0.02 | 0.04 | 0 | 0.02 |
| Total owned land (ac) | 3.02 | 2.58 | 2.26 | 2.79 |
| Average total operational area (ac) | 3.25 | 2.92 | 2.35 | 3.02 |
| Average operational irrigated area (ac) | 1.39(43) | 0.80(27) | 0.83(35) | 1.14(38) |
| Total land under rice cultivation (ac) | 2.67(100) | 2.39(100) | 1.91(100) | 2.48(100) |
| Upland (ac) | 0.06(2) | 0.02(1) | 0.03(2) | 0.05(2) |
| Medium (ac) | 1.55(58) | 1.56(65) | 1.34(70) | 1.52(61) |
| Low (ac) | 1.06(40) | 0.81(34) | 0.54(28) | 0.91(37) |
| Rice area irrigated(ac) | 1.01(38) | 0.72(30) | 0.67(35) | 0.86(35) |
| Area feasible for SRI(ac) | 1.56(58) | 1.15(48) | 1.03(54) | 1.37(55) |
Note: Figures in the parentheses indicate percentage to the total.
Table 6.
Source wise irrigation status of the sample farmers.
| Sources of irrigation | Adopters | Drop outs | Non-adopters | Grand Total |
|---|---|---|---|---|
| Rainfed | 108(36) | 82(56) | 46(60) | 236(45) |
| Canal | 147(50) | 39(26) | 25(33) | 211(40) |
| Bore well | 4(1.5) | 7(5) | - | 11(2.5) |
| River lift and stream | 18(6) | 11(7) | 5(6) | 34(6) |
| Tank | 4(1.5) | 5(3) | 1(1) | 10(2) |
| Well | 7(2) | 4(3) | - | 11(2.5) |
| DBI (Diversion based irrigation) | 9(3) | - | - | 9(2) |
| Total | 297(100) | 148(100) | 77(100) | 522(100) |
Note: Figures in the parentheses indicate percentage to the total.
Table 7.
Income profile of the sample farmers from various sources.
| Sources of income | Adopters | Drop outs | Non-adopters | Overall |
|---|---|---|---|---|
| Rice | 23182(30) | 14111(22) | 13873(24) | 19237(27) |
| Total farm income(crop) | 33516(43) | 21121(33) | 17676(31) | 27665(39) |
| Business income | 13253(17) | 8480(13) | 7506(13) | 11052(16) |
| Non-farm labour | 13506(17) | 17626(28) | 16948(30) | 15182(21) |
| Off farm labour | 4730(6) | 4539(7) | 4344(7) | 4619(6) |
| Service | 7982(10) | 7493(12) | 7247(13) | 7735(11) |
| Remittances | 783(1) | 1622(2) | 1429(2) | 1116(2) |
| Others | 4265(5) | 3207(5) | 2140(4) | 3652(5) |
| Total | 78035(100) | 64088(100) | 57290(100) | 71020(100) |
Note: Figures in the parentheses indicate percentage to the total.
Table 9.
Percentage of adopters adopting different practices of SRI during 2013-14 to 2015-16.
| Yr. | Farm class | Number of farmers | Area (acres) | Seed rate (kg/ac) | Application of organic manures qt/ac | Planting of 8-12 days seedlings (%) | One seedling per hill (%) | Square planting | Mechanical weeding minimum two times (%) | Required water level (%) | Grain yield (kg/acre) | % yield increment over conventional | Farmers realized yield increment (%) | Adopted All SRI practices (%) |
|---|---|---|---|---|---|---|---|---|---|---|---|---|---|---|
| Kharif | ||||||||||||||
| 2013-14 | Marginal | 115 | 1.14 | 4.75 | 12.69 | 36.52 | 56.52 | 98.26 | 74.78 | 16.99 | 16.24 | 81.58 | 24.35 | |
| Small | 76 | 1.3 | 3.83 | 10.34 | 63.16 | 67.11 | 93.42 | 86.84 | 1.32 | 16.11 | 13.42 | 80.00 | 25.00 | |
| Large | 22 | 1.05 | 2.91 | 12.64 | 68.18 | 77.27 | 95.45 | 90.91 | 4.55 | 15.86 | 27.6 | 100.00 | 40.91 | |
| 2014-15 | Marginal | 178 | 1.12 | 4.39 | 12.05 | 37.08 | 57.30 | 99.44 | 79.21 | 16.85 | 20.76 | 85.83 | 27.53 | |
| Small | 109 | 1.36 | 3.53 | 10.88 | 48.62 | 60.55 | 95.41 | 88.07 | 15.51 | 18.77 | 87.18 | 43.12 | ||
| Large | 34 | 1.06 | 3.34 | 14.13 | 61.76 | 73.53 | 97.06 | 94.12 | 15.5 | 21.95 | 96.43 | 44.12 | ||
| 2015-16 | Marginal | 156 | 1.22 | 4.68 | 12.12 | 28.21 | 44.87 | 98.08 | 79.49 | 15.32 | 28.09 | 75.64 | 33.97 | |
| Small | 98 | 1.56 | 3.42 | 11.69 | 44.90 | 53.06 | 95.92 | 85.71 | 14.25 | 26.54 | 84.69 | 51.02 | ||
| Large | 31 | 1.33 | 3.69 | 14.5 | 38.71% | 45.16% | 96.77% | 77.42% | 13.92 | 38.64 | 93.55% | 45.16% | ||
| Rabi | ||||||||||||||
| 2013-14 | Marginal | 17 | 0.95 | 2.76 | 4.05 | 58.82 | 76.47 | 100.00 | 88.24 | 11.76 | 20.76 | 11.12 | 91.67 | 17.65 |
| Small | 23 | 0.83 | 2.39 | 7.69 | 86.96 | 78.26 | 100.00 | 100.00 | 18.28 | 12.33 | 94.44 | 47.83 | ||
| Large | 10 | 0.92 | 3.1 | 12.11 | 90.00 | 90.00 | 100.00 | 100.00 | 10.00 | 17.45 | 10.44 | 90.00 | 50.00 | |
| 2014-15 | Marginal | 35 | 0.89 | 2.94 | 8.71 | 71.43 | 71.43 | 100.00 | 88.57 | 19.7 | 12.78 | 93.55 | 34.29 | |
| Small | 40 | 0.93 | 2.78 | 10.53 | 70.00 | 75.00 | 100.00 | 87.50 | 7.50 | 17.31 | 8.91 | 75.68 | 45.00 | |
| Large | 15 | 0.91 | 3.8 | 12.79 | 93.33 | 93.33 | 100.00 | 93.33 | 6.67 | 17.13 | 8.77 | 85.71 | 53.33 | |
| 2015-16 | Marginal | 37 | 1.05 | 2.78 | 10.19 | 86.49 | 75.68 | 100.00 | 100.00 | 8.11 | 19.73 | 18.24 | 89.19 | 45.95 |
| Small | 42 | 1.12 | 2.52 | 10.3 | 85.71 | 78.57 | 100.00 | 97.62 | 11.90 | 17.83 | 14.79 | 85.71 | 52.38 | |
| Large | 14 | 1.12 | 3.71 | 13.51 | 92.86 | 92.86 | 100.00 | 92.86 | 7.14 | 17.11 | 11.52 | 71.43 | 57.14 | |
Table 10.
Factor affecting Adoption of SRI over non-adopter.
| Coefficient | Std. Error | z | p-value | |
|---|---|---|---|---|
| Constant | −0.1265 | 0.7311 | −0.1730 | 0.8626 |
| Education (Yrs.) | −0.0432 | 0.0346 | −1.2479 | 0.2121 |
| Experience in years of farming | 0.0311 | 0.01334 | 2.3250 | 0.0201** |
| Membership with organization | 0.3339 | 0.3104 | 1.0759 | 0.2820 |
| Total operational area (acre) | −0.2279 | 0.1315 | −1.7331 | 0.0831* |
| Total land under rice cultivation (acre) | 0.2539 | 0.1902 | 1.3348 | 0.1820 |
| Total income (Rs) | 6.70263e-06 | 2.91885e-06 | 2.2963 | 0.0217** |
| Non SRI/Conventional farm grain yield (qt/acre) | −0.2201 | 0.03702 | −5.9434 | <0.0001*** |
| NGO Support (Y=1, N=0) | 2.2365 | 0.4352 | 5.1383 | <0.0001*** |
| Training received on SRI (Y=1, N=0) | 1.0868 | 0.2993 | 3.6313 | 0.0003*** |
| Have access to Canal irrigation (Y=1, N=0) | 0.4725 | 0.3491 | 1.3535 | 0.1759 |
| % of non-farm income to total income | −0.4281 | 0.5937 | −0.7212 | 0.4708 |
| % of net agriculture income to total income | 2.1065 | 0.8521 | 2.4723 | 0.0134** |
| % of medium land to total land | 1.3305 | 0.4419 | 3.0106 | 0.0026*** |
| % irrigated area of GCA | 0.0025 | 0.0046 | 0.5605 | 0.5751 |
Note: Dependent variable: SRI adopter and non-adopter, Standard errors based on Hessian; ***, ** and*indicates level of significance at at1, 5 and 10 percent respectively.
Table 12.
Per acre economics of nursery management in SRI and Conventional method during 2015-16.
| Particulars | Adopters | Drop outs | Non adopters | |||||
|---|---|---|---|---|---|---|---|---|
| Non SRI | SRI | Non SRI | Non SRI | |||||
| Kharif | Rabi | Kharif | Rabi | Kharif | Rabi | Kharif | Rabi | |
| Male labour (human hrs.) | 4.2 (94) | 5.5 (156) | 3.8 (93) | 5 (141) | 4 (104) | 4.7 (129) | 4.6 (108) | 5.7 (161) |
| Female labour (human hrs.) | 0.6 (10) | 0 (0) | 0.5 (9) | 0 (0) | 0.7 (13) | 0 (0) | 0.8 (15) | 0 (0) |
| Bullock pair (animal labour hrs.) | 2 (58) | 1.8 (47) | 1.1 (41) | 0.6 (22) | 2.1 (67) | 1.8 (93) | 2.3 (61) | 2.3 (104) |
| Machine labour (hours) | 0.1 (18) | 0.3 (57) | 0.1 (20) | 0.1 (35) | 0.1 (36) | 0.3 (103) | 0 (17) | 0.2 (76) |
| Seed (Kg) | 27.6 (402) | 25.9 (436) | 4.5 (82) | 3.6 (96) | 28.2 (399) | 29.1 (520) | 27.6 (436) | 31 (485) |
Note: Figures in parentheses are expenditures in rupees of respective inputs.
Table 13.
Per acre economics of rice cultivation across the groups.
| Particulars | Adopters | Drop outs | Non adopters | |||||
|---|---|---|---|---|---|---|---|---|
| Non SRI | SRI | Non SRI | Non SRI | |||||
| Kharif | Rabi | Kharif | Rabi | Kharif | Rabi | Kharif | Rabi | |
| Area(ac) | 1.91 | 1.51 | 1.35 | 1.10 | 1.94 | 1.55 | 1.88 | 1.39 |
| Grain yield (Qt/ac) | 11.40 | 18.53 | 14.63 | 19.93 | 13.51 | 19.48 | 12.75 | 18.33 |
| Total value of output (Rs.) | 13580 | 22719 | 17854 | 23678 | 15397 | 23101 | 14617 | 22176 |
| Total cost of cultivation(Rs.) | 11069 | 12889 | 11212 | 11486 | 11677 | 13625 | 11211 | 13707 |
| Net profit(Rs.) | 2511 | 9830 | 6642 | 12192 | 3720 | 9476 | 3406 | 8469 |
| Return to cost ratio | 1.23 | 1.76 | 1.59 | 2.06 | 1.32 | 1.70 | 1.30 | 1.62 |
Table 14.
a: Resource use efficiency in SRI over conventional practice during kharif season (2015-16).
Table 14.
a: Resource use efficiency in SRI over conventional practice during kharif season (2015-16).
| Particulars | N | Mean | Mean difference | |||||
|---|---|---|---|---|---|---|---|---|
| SRI (239) | Non-SRI (All=367) | Non-SRI (adopter only=157) | SRI | Non-SRI (All) | Non-SRI (adopter only) | SRI v/s Non-SRI (All) | SRI v/s Non-SRI (adopter) | |
| Quantity | ||||||||
| Grain yield (qtls/ac) | 239 | 367 | 157 | 14.63 | 12.46 | 11.40 | 2.17*** | 3.24*** |
| Seed (kg /ac) | 239 | 367 | 157 | 4.38 | 27.17 | 27.96 | -22.79*** | -23.58*** |
| Manure (qtls/ac) | 214 | 306 | 129 | 12.17 | 10.35 | 9.66 | 1.82** | 2.51*** |
| Fertilizer Urea (kg /ac) | 181 | 309 | 123 | 32.20 | 37.11 | 37.34 | -4.92** | -5.14** |
| Fertilizer DAP/ mixed in (kg /ac) | 176 | 305 | 122 | 30.01 | 32.31 | 33.64 | -2.3 | -3.63* |
| Fertilizer MOP in (kg /ac) | 131 | 214 | 88 | 20.17 | 20.82 | 23.27 | -0.65 | -3.1* |
| Other fertilizer in (kg /ac) | 24 | 43 | 17 | 7.61 | 13.20 | 11.63 | -5.59 | -4.02 |
| Bullock power in (hours/ac) | 239 | 367 | 157 | 32.64 | 31.63 | 31.38 | 1.01 | 1.27 |
| Machine power in (hours/ac) | 239 | 367 | 157 | 4.97 | 4.67 | 4.69 | 0.3 | 0.28 |
| Total human labour in (hours/ac) | 239 | 367 | 157 | 256.22 | 266.00 | 270.09 | -9.78 | -13.87* |
| Male labour in (hours/ac) | 239 | 367 | 157 | 153.36 | 125.47 | 128.88 | 27.89*** | 24.49*** |
| Female labour in (hours/ac) | 239 | 367 | 157 | 102.86 | 140.53 | 141.22 | -37.67*** | -38.36*** |
| Value | ||||||||
| Seed(Rs/ac) | 239 | 367 | 157 | 83.45 | 406.87 | 403.01 | -323.41*** | -319.55*** |
| Manure(Rs/ac) | 218 | 320 | 131 | 1277.23 | 949.48 | 997.78 | 327.75*** | 279.45** |
| Fertilizer Urea(Rs/ac) | 181 | 309 | 123 | 259.24 | 289.33 | 297.96 | -30.09** | -38.72** |
| Fertilizer DAP/ mixed(Rs/ac) | 176 | 305 | 122 | 766.49 | 836.71 | 870.52 | -70.22* | -104.03** |
| Fertilizer MOP(Rs/ac) | 131 | 214 | 88 | 396.48 | 399.10 | 444.21 | -2.63 | -47.73 |
| Other fertilizer(Rs/ac) | 34 | 43 | 17 | 328.18 | 437.77 | 515.40 | -109.59 | -187.22 |
| Total human labour (Rs/ac) | 239 | 367 | 157 | 5791.70 | 5894.71 | 5837.10 | -103.02 | -45.4 |
| Male labour (Rs/ac) | 239 | 367 | 157 | 3866.92 | 3195.21 | 3174.32 | 671.71*** | 692.61*** |
| Female labour (Rs/ac) | 239 | 367 | 157 | 1924.77 | 2699.50 | 2662.78 | -774.73*** | -738.01*** |
| Plant protection expenses(Rs/ac) | 86 | 122 | 50 | 402.23 | 466.62 | 445.94 | -64.4 | -43.71 |
| Total rupees saved in SRI over conventional practice (Rs/ac) | -478.61 | -552.31 | ||||||
Note: ***, **, * indicates statistical significance at 1%, 5% and 10% level.
Table 14.
b: Resource use efficiency in SRI over conventional practice during rabi season (2015-16).
Table 14.
b: Resource use efficiency in SRI over conventional practice during rabi season (2015-16).
| Particulars | N | Mean | Mean difference | |||||
|---|---|---|---|---|---|---|---|---|
| SRI (82) | Non-SRI (69) | Non-SRI (adopter only=36) | SRI | Non-SRI (All) | Non-SRI (adopter only) | SRI v/s Non-SRI (All) | SRI v/s Non-SRI (adopter) | |
| Quantity | ||||||||
| Grain yield (qtls/ac) | 82 | 69 | 36 | 19.93 | 18.68 | 18.53 | 1.24** | 1.4** |
| Straw yield (qtls/ac) | 82 | 69 | 36 | 24.67 | 23.33 | 23.23 | 1.35** | 1.45** |
| Seed (kg /ac) | 82 | 69 | 36 | 3.18 | 28.02 | 25.47 | -24.84*** | -22.29*** |
| Manure (qtls/ac) | 78 | 42 | 28 | 11.05 | 9.41 | 8.22 | 1.64 | 2.83* |
| Fertilizer Urea (kg /ac) | 82 | 59 | 26 | 31.66 | 44.50 | 48.13 | -12.84*** | -16.46*** |
| Fertilizer DAP/ mixed in (kg /ac) | 82 | 58 | 26 | 31.23 | 44.96 | 45.93 | -13.73*** | -14.7*** |
| Fertilizer MOP in (kg /ac) | 81 | 52 | 25 | 19.99 | 30.45 | 31.33 | -10.47*** | -11.35** |
| Other fertilizer in (kg /ac) | 19 | 32 | 16 | 5.07 | 4.84 | 4.90 | 0.23 | 0.17 |
| Bullock power in (hours/ac) | 82 | 69 | 36 | 20.05 | 24.19 | 30.75 | -4.14 | -10.7* |
| Machine power in (hours/ac) | 82 | 69 | 36 | 2.76 | 2.93 | 3.14 | -0.17 | -0.38 |
| Total human labour in (hours/ac) | 82 | 69 | 36 | 205.22 | 189.76 | 208.18 | 15.46 | -2.96 |
| Male labour in (hours/ac) | 82 | 69 | 36 | 108.84 | 85.39 | 96.66 | 23.45** | 12.18 |
| Female labour in (hours/ac) | 82 | 69 | 36 | 96.38 | 104.37 | 111.51 | -7.99 | -15.14 |
| Value | ||||||||
| Seed(Rs/ac) | 82 | 69 | 36 | 89.88 | 467.63 | 442.22 | -377.75*** | -352.34*** |
| Manure(Rs/ac) | 79 | 57 | 30 | 913.97 | 598.86 | 678.94 | 315.11** | 235.03* |
| Fertilizer Urea(Rs/ac) | 82 | 59 | 26 | 249.45 | 334.67 | 364.66 | -85.21*** | -115.21*** |
| Fertilizer DAP /mixed(Rs/ac) | 82 | 58 | 26 | 810.70 | 1143.40 | 1167.15 | -332.7*** | -356.45*** |
| Fertilizer MOP(Rs/ac) | 81 | 52 | 25 | 392.37 | 598.87 | 626.80 | -206.5*** | -234.43*** |
| Other fertilizers(Rs/ac) | 19 | 33 | 16 | 367.41 | 407.63 | 352.60 | -40.23 | 14.8 |
| Total human labour(Rs/ac) | 82 | 69 | 36 | 4981.23 | 4822.87 | 5408.28 | 158.37 | -427.04 |
| Male labour(Rs/ac) | 82 | 69 | 36 | 3106.29 | 2529.05 | 2812.52 | 577.24** | 293.77 |
| Female labour(Rs/ac) | 82 | 69 | 36 | 1874.95 | 2293.82 | 2595.76 | -418.87 | -720.81** |
| Plant protection expenses(Rs/ac) | 59 | 45 | 22 | 515.73 | 1023.97 | 749.55 | -508.24*** | -233.81** |
| Total rupees saved in SRI over conventional practice (Rs/ac) | -918.79 | -1896.5 | ||||||
Note: ***, **, * indicates statistical significance at 1%, 5% and 10% level.
Disclaimer/Publisher’s Note: The statements, opinions and data contained in all publications are solely those of the individual author(s) and contributor(s) and not of MDPI and/or the editor(s). MDPI and/or the editor(s) disclaim responsibility for any injury to people or property resulting from any ideas, methods, instructions or products referred to in the content. |
© 2024 by the authors. Licensee MDPI, Basel, Switzerland. This article is an open access article distributed under the terms and conditions of the Creative Commons Attribution (CC BY) license (http://creativecommons.org/licenses/by/4.0/).
Copyright: This open access article is published under a Creative Commons CC BY 4.0 license, which permit the free download, distribution, and reuse, provided that the author and preprint are cited in any reuse.


