
Submitted:
29 July 2024
Posted:
02 August 2024
You are already at the latest version
Abstract
Objective: Interstitial fibrosis / tubular atrophy (IFTA) is a common, irreversible, and progressive form of chronic kidney allograft injury, and it is considered a critical predictor of kidney allograft outcomes. The extent of IFTA is estimated through a graft biopsy, while a non-invasive test is lacking. The aim of this study was to evaluate the feasibility and accuracy of an MRI radiomic-based machine learning (ML) algorithm in estimating the degree of IFTA in a cohort of transplanted patients. Approach: Patients who underwent MRI and renal biopsy within a 6-month interval from 1/1/2012 to 1/3/2021 were included. Stable MRI sequences were selected, and renal parenchyma, renal cortex and medulla were segmented. After image filtering and pre-processing, we computed radiomic features which were subsequently selected through a LASSO algorithm for their highest correlation with the outcome and lowest intercorrelation. Selected features and relevant patients’ clinical data were used to produce ML-algorithms using 70% of the study cases for feature selection, model training and validation with a 10-fold cross-validation, and 30% for model testing. Performances were evaluated using AUC with 95% confidence interval. Main results: 70 coupled tests (63 patients, 35.4% females, mean age 52.2 years) have been included and subdivided into a wider cohort of 50 for training and a smaller cohort of 20 for testing. For IFTA ≥ 25%, AUCs in test cohort were 0.60, 0.59, and 0.54 for radiomic features only, clinical variables only, and combined radiomic-clinical model, respectively. For IFTA ≥ 50%, AUCs in training cohort were 0.89, 0.84, 0.96, and in test cohort were 0.82, 0.83, and 0.86, for radiomic features only, clinical variables only, and combined radiomic-clinical model, respectively. Significance: An ML-based MRI radiomic algorithm showed promising discrimination capacity for IFTA>50%, especially when combined with clinical variables. These results need to be confirmed in larger cohorts.
Keywords:
kidney
; Magnetic Resonance
; Transplantation
; Radiomics
Introduction
End-stage kidney disease (ESKD) is a major cause of morbidity and mortality worldwide, with a high impact on health systems due to the high costs of renal replacement therapies (RRT) [1]. ESKD has a growing incidence due to increasing rates of chronic diseases such as diabetes and hypertension with a projection of 5 million people receiving RRT in 2030 [2]. Kidney transplantation represents the treatment of choice for ESKD regardless of the cause [3], improving both patients’ survival and quality of life with respect to dialysis [4,5,6]. With constant advances in surgical techniques and medical management substantially reducing the risk of early post-transplant complication, the current focus is set in improving long-term survival of kidney grafts. IFTA is a common, irreversible and progressive form of chronic allograft injury, with a multi-factorial etiology (ischemia-reperfusion damage, episodes of rejection, immunosuppressive medications nephrotoxicity), characterized by the deposition of extracellular collagen and development of tubular atrophy with rarefaction of peritubular capillaries [7,8]. Interstitial Fibrosis / Tubular atrophy is unanimously considered a critical predictor of kidney allograft outcomes [9]. Since treatments for rejection and other causes of graft dysfunction bear substantial toxicity and could have limited efficacy, the extent of irreversible graft scarring is a crucial information for the clinician, in order to evaluate risks and benefits of specific therapies. The assessment of IFTA is based on pathological evaluation of renal graft biopsies and its extent estimated according to updated Banff classification [10], which differentiates three grades depending on the percentage of the affected cortical tissue: < 25% grade one, ≥ 25% and < 50% grade two, ≥ 50% grade three. Kidney graft biopsy is considered a relatively safe procedure when performed by a skilled operator; nevertheless, it is an invasive manoeuvre and its risks are not negligible, with significant bleeding occurring in up to 4% of patients and minor complications in almost one fifth [11,12,13].
Radiomics is a quantitative imaging approach that extract information from diagnostic images produced by routinary examinations in the form of numeric continuous variables. Those variables describe intrinsic characteristics of the imaged region of interest that may be related to specific aspects of tissue, or its cellular, metabolic and genetic characteristics. Although radiomics-based works have been developed and validated mainly in oncologic settings, there is a growing interest in adopting these techniques for the study of non-cancerous tissues.
In this study we aimed to evaluate whether radiomics applied to the analysis of kidney graft MRI may have the potential to assess a binary outcome of IFTA grading according to Banff classification using different models based on clinical data, radiomic data, and the combination of both.
Materials and Methods
Study Design, Ethics and Population
We conducted a single center retrospective study to explore the feasibility and potential of MRI radiomics in reproducing the histologic IFTA grading in kidney graft biopsies. The study has been approved by the “Area Vasta Emilia Nord” Ethical Committee (0007669/21, 11/03/2021). Whenever it was impossible to contact the patients, informed consent was waived according to the retrospective nature of the study.
We included all consecutive kidney transplanted patients, in clinical follow-up at the Nephrology and Dialysis Unit of Azienda Ospedaliero-Universitaria di Modena (Italy), who received a graft biopsy and a contrast-enhanced MRI within 6 months on clinical indication from 1/1/2012 to 1/3/2021.
Among acquired sequences, SShT2 weighted and post-contrast fat-saturated T1 3D GRE sequences were adopted because the possible presence of tissue information related to organ water content and vascularization. Among those sequences, a preliminary analysis on MRI images was made by two radiologists in order to select sequences with more stable acquisition parameters among different exams. Axial SSh T2 weighted sequence and post-contrast fat-saturated T1 3D GRE sequence in venous phase (supplementary table 1) were selected due to lower variability and better reproducibility.
Exclusion criteria were unsuitable biopsies (inadequate material) or MRI examinations (incomplete transplanted kidney coverage, artifacts, absence of contrast administration or adoption of a different acquisition protocol with highly divergent acquisition parameters) (Figure 1).
For patients who underwent multiple MRI exams and biopsies, each suitable pair of tests (MRI and biopsy within 6 months) was considered separately.
Our work is a pilot study primarily aimed at exploring the potential of kidney graft MRI radiomics and how radiomic features were related to IFTA. We also attempted to evaluate the accuracy of clinical and/or radiomic signatures in the assessment of a binary IFTA-based outcome. For the data preparation, we followed the methodology suggested by the Image biomarker standardisation initiative (IBSI) [14]. Hence, among the whole cohort, we chose a hold-out validation method to assess our model performance metric. The initial cohort was thus divided in two cohorts, one composed of 70% of samples, used firstly for feature selection and then for model training and validation (10-fold cross-validation), and the other with the remaining 30% of samples used for testing the final model. Samples in the training and validation sets were chosen randomly, but maintaining a similar distribution of the primary binary outcome in both sets.
Clinical Data
Relevant clinical and laboratory data were collected from patient records. These included: age, sex, ethnicity, BMI, transplant type, transplant age, estimated glomerular filtration rate (eGFR) according to CKD-EPI equation at biopsy, proteinuria / creatininuria ratio on single void urine sample immediately before biopsy.
Kidney Graft Biopsy
All biopsies were performed on clinical indication by one of three expert nephrologists in hospitalized patients, who were adequately informed and provided written consent for the procedure.
Adequate blood pressure control was ensured before the procedure; coagulation parameters and platelet levels were assessed before biopsy; a minimum level of patients’ collaboration was required. In brief, graft kidney biopsy was carried out with the patient on supine position, with adequate local anaesthesia and under real-time ultrasound assistance, using a 16- or 18-gauge spring-loaded automatic needle (Bard Magnum, C.R. Bard Inc., USA) and targeting the lower pole of the transplanted kidney through a percutaneous anterior abdominal approach. In general, two cores of renal tissue were obtained and allocated to light microscopy, immunofluorescence and, whenever indicated, electron microscopy technique for diagnosis. Biopsies were revised by one expert nephropathologist (FF), according to updated Banff classification; amount of IFTA in renal cortical tissue was assessed on light microscopy through analysis of multiple slides with different stains and reported as deciles and terciles classes (< 25%, >25%, >50%). Due to the reduced dimensions of the cohort, we decided to build a model for predicting a binary IFTA outcome. The deciles and terciles IFTA values were thus used as thresholds for our two examined binary IFTA outcomes: IFTA>25% and IFTA>50%.
Image data acquisition and analysis
All the included MRI scans were acquired using a 1.5 T scanner (Philips Achieva, The Best, Netherlands). SSh T2 sequences were performed without the injection of contrast medium in the axial and coronal planes and those providing an axial view of the transplanted kidney (short axis) have been selected. Axial post-contrast fat-saturated T1 3D GRE sequences were acquired with a dynamic protocol in arterial phase with bolus tracking technique and after 30, 60 and 90 seconds respectively from the threshold. The last phase was selected due to higher reproducibility among different examinations in terms of contrast distribution. Acquisition parameters of selected sequences are reported in supplementary Table 1.
Image pre-processing was conducted following IBSI guideline [14] and the whole radiomic pipeline is summarized in supplementary Figure 1. Among the included exams, we decided to split the cohort in a training cohort (70%), where our predictive model is trained and the feature selection process is carried out, and a separate test cohort (30%) where the model final performances are tested. The test cohort is never used in the training step. The splitting process was randomized with a balanced separation of the IFTA>25% binary outcome. The two included exam sequences (T1 3D and T2 2D) were spatially resampled with B-Spline interpolation method. T1 3D sequences were resampled to an isotropic voxel of 2 x 2 x 2 mm3 to obtain rotationally invariant features. T2 2D sequences were resampled to a voxel isotropic in two dimensions of 2 x 2 x 3 mm3 and consequently features from that image set are computed only in 2 dimensions (2D features). Then, we performed an image intensity normalization using a chosen range, set to -3 standard deviations (σ) and +3 σ from the mean value of the analysed ROI. Finally, the images were binned by intensity, grouping the original intensity values into 5 bins (fixed bin number) with the aim of reducing image noise and computational burden, according to the IBSI guidelines.
After the image pre-processing steps, we computed radiomic features from the image sets. Features (intensity-based, shape-based, and second-order) were extracted both from the original images and filtered images, namely wavelets (High-Low, Low-High, High-High, Low-Low filters), Laplacian of Gaussian (LoG) with sigma of 1 and 3 mm, and gamma modifier filters [16]. Radiomic features were calculated using a in-house software pipeline employing the widely-used pyRadiomics package (v. 3.0.1) running on Python (v. 3.7.9). The list of the extracted radiomic features is compliant with the image biomarker standardization initiative guidelines [14] and can be found at https://pyradiomics.readthedocs.io/en/latest/features.html.
Since the study is focused on transplanted non-cancerous organs, we chose to avoid the extraction of shape features, that are not expected to have a clear correlation with the outcome of interest (IFTA), differently from tumor shape in oncologic studies. As detailed before, from T2 2D images we extracted only features derived from 2D matrices, while for T1 3D images the whole set of features derived from 2D and 3D matrices was used.
A radiologist (FM) blinded to the clinical outcomes segmented the transplanted kidneys using 3D Slicer software version 4.10.1 [17]. For T2 2D images the manual contouring tool was used to select the whole parenchyma (Fig. 2A), the medulla (Fig. 2B) and the cortex (Fig. 2C) obtained through previous segment subtraction. For T1 3D postcontrast images, the semiautomatic contouring tool based on intensity levels was used for the delineation of the whole parenchyma only, since it was not possible to reliably differentiate cortex and medulla (Fig. 2D). A different tool was adopted because on T2 weighted sequences, the intensities of parenchyma and surrounding tissue were too similar to be reliably differentiated by the semiautomatic contouring tool. Moreover, the higher number of images of T1 3D sequences, caused by a lower thickness, made the manual contouring tool too slow to be adopted.
Statistical Analyses and Model Building
Associations of ordinal clinical features and IFTA were evaluated using Kendall rank correlation coefficient “τ” to investigate a possible correlation without assuming a linearity between the two variables. Association between transplant type (categorical variable) and IFTA was assessed with Spearman rank correlation coefficient. To reduce the dimensionality of our extracted features set, we employed a selection process based on the association between radiomic features and the two aforementioned binary IFTA outcomes (IFTA>25% and IFTA>50%), assessed through a least absolute shrinkage and selection operator (LASSO). LASSO uses a shrinkage penalty term in its optimization function which can be controlled by tuning a parameter called λ. λ was chosen using 10-folds cross-validation (CV). LASSO penalty feature selection sets to zero the weight coefficients of irrelevant features not predictive of the chosen outcome. In addition, LASSO handles sets of collinear features by increasing the weight of one of them while setting the others zero. Because IFTA was considered as binary, we used a binomial function for our performed LASSO regression. Relevant features were thus selected by setting a threshold on the LASSO regression coefficients associated to the involved radiomic features.
Using the selected features, we built two Ensemble Subspace Discriminant (ESD) models to predict IFTA>25% and IFTA>50%. Three models were built for both outcomes using radiomic features (radiomic model), clinical variables (clinical model) and the combination of both (combined model). Therefore, we trained a total of 6 ML models through a 10-fold cross-validation method from which we computed model performance on the training cohort using areas under the curve (AUCs) with 95% CI. Similarly, we calculated performances of the models on our test cohort comprised of new cases unseen by the previous trained models.
Results
Study Population
In the study period (from 1/1/2012 to 1/3/2021), a total of 254 graft biopsies were performed for clinical indication in 194 transplanted patients. For 94 of these 254 procedures, an MRI performed within 6 months from kidney biopsy was available, for a total of 80 patients (twelve patients had two pair of tests and one patient had three pair of tests). A total of 24 MRI examinations were judged unsuitable and excluded from the study (Figure 1), resulting in the inclusion of 70 paired tests performed on 63 patients.
Those 70 paired tests were randomly subdivided in a training set of 50 tests and a test set of 20 tests, with a fixed proportion of IFTA over 25% and 50% in the two sets. Clinical variables from the whole study population and the two cohorts (training and test sets) are reported in Table 1.
MRI Radiomic Feature Selection and Radiomic Signatures
Feature extraction produced a total of 2595 features (1120 2D-spaced from T2 sequences and 1475 3D-spaced from T1 sequences). To select radiomic features associated with the outcome of interest we performed a binomial LASSO feature selection for both MRI sequences. Selected features for IFTA≥25% and IFTA≥50% were then merged in two radiomic signatures associated to the two outcomes. These signatures are reported in Table 2 with every selected radiomic feature and its respective LASSO regression coefficient.
Clinical Variables and Signature
The association between meaningful clinical variables and IFTA in our cohort was evaluated using Kendall test (Supplementary table 2). Among analysed variables, transplant age and proteinuria/creatininuria ratio at biopsy were associated with the outcome. Other relevant clinical variables were also combined with radiomic features in a clinical model, since they are considered as prognostic factors and thus commonly used in clinical practice.
Machine Learning Model Performances
Model performances are reported in Table 3 providing AUCs with respective 95% CI for IFTA ≥50% and ≥25% both in training and in test sets. The models showed a better performance for IFTA ≥50%. Radiomics performed slightly better than clinical-only models and models using both radiomic and clinical variables showed a marked increase in AUC. Models showed higher AUCs, especially for IFTA ≥50%, in the training set than in the test set. The decrease in AUC from training to test set was particularly significant for the model including both radiomic and clinic characteristic (for IFTA ≥50%, AUC 0.96, 95%CI 0.84-0.98 and 0.86, 95% CI 0.41-0.99, for training and test set respectively) (Figure 3).
Discussion
In this cohort of 63 transplanted patients who underwent graft biopsy and contrast-enhanced MRI within 6 months (for a total of 70 coupled procedures), radiomic features were extracted from T2-weighed and post-contrast T1-weighted MR images and selected according to their association with histology outcome (IFTA) and relevant clinical variables of all patients were collected. Using those data, different ML-based MRI radiomic algorithms were deployed and demonstrated a good discrimination capacity for IFTA>50%, especially when radiomic features were merged with clinical variables (AUC for clinical-radiomic combined model 0.96 and 0.86 in training set and test set respectively).
Diagnostic kidney graft biopsy currently remains an essential procedure to provide a precise diagnosis and guide management of transplanted patients. However, the decision to proceed to biopsy could be not always as straightforward, especially with increased complexity of patients’ co-morbidities and treatments potentially interfering with adequate haemostasis (antiplatelets or anticoagulants). Moreover, prediction of severe chronic parenchymal damage (i.e., IFTA >50%) in the transplanted kidney may justify avoidance of graft biopsy to diagnose rejection, since the patient would likely not be a candidate for further immunosuppressive treatment. In addition, higher degree of parenchymal scarring has been reported as a risk factor for bleeding, at least in native kidneys [18]. Although biological parameters, such as eGFR and proteinuria, are commonly used in clinical practice to estimate the degree of chronic injury, their reliability is questionable [19]. Consequently, the development of robust and non-invasive tools to detect the presence of extensive IFTA in kidney grafts would represent a step forward in personalizing patients’ management.
Increased attention has been devoted in recent years to the use of MRI for the study of transplanted kidney, with specific focus on multiparametric/functional techniques [7,20,21] and elastography [22]. Indeed, even if results are promising especially for the prediction of kidney fibrosis, the availability of these techniques has not been widespread yet.
Radiomics is an advanced technique that allows to extract and analyse a large number of quantitative features from medical images, acquired during the course of the routine clinical pathway of the patient. Available data in non-oncological kidney diseases are scarce, with only a few available studies investigating T2-weighted MR-based radiomics for the evaluation of autosomal dominant polycystic kidney disease progression [23] and decreased glomerular filtration rate during chronic lithium treatment [24], or US-derived radiomics in the classification of IgA nephropathy [25]. One study evaluated the potential role of US-based radiomics in the assessment of post-transplant renal function [26]. Recently, Zhi et al [27] integrated clinical variables and MRI radiomic features into a convolutional neural network reporting stable performance in discriminating the cause of kidney allograft dysfunction in a cohort of 252 patients from China. Furthermore, radiomic studies based on MRI images carry the intrinsic issue of how to deal with the variability of the image sets in the context of multicentric studies.
We selected T2 and post-contrast T1 MR-derived radiomic features with the highest association with histopathological IFTA in transplanted patients who underwent graft biopsy and MRI. In our cohort of patients, models produced to assess IFTA ≥ 50% showed a good performance. In particular, the combined model (with clinical and radiomics variables) lowered its performance, in term of AUC, from 0.96 in training set to 0.86 in test set. With respect to models produced to assess IFTA > 25%, their performances can be considered poor with a much higher decrease in term of AUC from training to test sets. As expected, the decrease in AUC from training to test set was stronger for the combined model, probably due to the higher number of variables used to build the model. Notwithstanding the small size of the test set, the consistency of AUC in training and test sets in the prediction of IFTA > 50% seems to suggest that the methodology we adopted allowed to reduce overfitting. These results highlight the presence of valuable information in MRI images, that may be predictive of the chosen threshold of the histological IFTA grading. Indeed, MRI T2 relaxation time is related to kidney tissue water content, which is a sensitive indicator of IFTA [27], and T1 postcontrast images are influenced by organ vascularization and penetration of contrast medium through the whole parenchyma, which could be reduced by advanced parenchymal scarring. The information that more than half of kidney parenchyma is affected could be clinically meaningful, preventing further invasive procedures, since they would not alter patients’ management.
The main limitation of our study is the small sample size; moreover, its limited number of events (IFTA≥25% and ≥50%) in the test set do not allow to derive definitive conclusions, emphasizing the feasibility nature of our proposed study. In addition, the number of selected features, based on the relevance of their associated LASSO coefficient, could be high in comparison to the sample size. Thus, a more extensive training cohort, combined with an external validation test set to exclude the risk of overfitting needs to be accounted for in future studies to confirm our results. In addition, the single-centre design implied lack of external validation which could also produce a bias due to the different clinical protocols employed in the image acquisition step. We tried to overcome this limitation by building a sub-cohort of patients for feature selection and model training and a separate sub-cohort for testing. Another limitation of the study was its retrospective nature, that prevented us to design specific MR sequences, more fit for radiomic feature extraction. Hence, some sequences were affected by high parameter variability; in fact only SSh T2 and post-Gd fat-saturated T1 3D sequences were selected. However, the selection of both T1 and T2 weighting as well as post-contrast images probably allowed us to collect the most part of MRI-based information for transplanted kidney tissue characterization. Moreover, the inclusion of transplanted patients who were referred to MRI for clinical reasons could have led to a selection bias. Finally, we acknowledge that the temporal allowed interval between biopsy and MRI (within 6 months) may be considered to be long enough to have important changes in kidney tissue. Nevertheless, less than 20% of the enrolled patients had an interval longer than 3 months. Furthermore, since IFTA is a chronic condition following kidney transplantation, we did not expect a relevant IFTA modification in the considered time interval.
The major strength of the study is our effort to pursue the standardization guidelines, especially critical in the pre-processing step for MRI images due to their intrinsic nature, following IBSI indications [14], despite the retrospective nature of the study and the small sample size. Shape features have not been extracted. In fact, while these may be of interest when collecting radiomics in oncology, where size, shape and borders are expected to correlate with the nature of the tissue, its histology and diagnosis and prognosis, in the case of a transplanted organ they are not likely to introduce meaningful informative value but could add unwanted complexity to the analysis and increase the probability of observing false associations and overfitting. Another strength of our study is that the ground truth of our prediction models is represented by kidney graft biopsy, which is currently considered the gold standard for histopathological diagnosis of kidney allograft (and IFTA quantification), in opposition to the only available study on MRI radiomics in kidney transplant patients [18], where a relevant proportion of predicted diagnosis were assigned based on clinical judgement.
Conclusions
In conclusion, this preliminary study shows that MR-derived radiomics of kidney graft is feasible, and may add informative value to clinical factors in the prediction of an IFTA binary outcome (>50%). To confirm this hypothesis, prospective studies, possibly with predefined MR acquisition parameters, are necessary. Further studies evaluating the potential role of MR radiomics as a predictor of long-term graft disfunction are also needed. Our data establish a new radiological/histopathological correlation, which could support future clinical applications; in fact, should the good performance of MR radiomics be confirmed, it could be used as a non-invasive tool to assess and monitor chronic parenchymal injury in kidney transplanted patients.
Supplementary Materials
The following supporting information can be downloaded at the website of this paper posted on Preprints.org.
Author Contributions
Conceptualization, Filippo Monelli, Giulia Besutti, Marco Bertolini, Roberto Sghedoni and Francesco Fontana; Data curation, Filippo Monelli, Giulia Besutti and Marta Ottone; Formal analysis, Valeria Trojani; Funding acquisition, Francesco Fontana; Investigation, Valeria Trojani, Filippo Monelli, Laura Verzellesi and Paolo Giorgi Rossi; Methodology, Valeria Trojani, Filippo Monelli, Giulia Besutti, Paolo Giorgi Rossi and Marta Ottone; Project administration, Giulia Besutti, Mauro Iori, Pierpaolo Pattacini and Francesco Fontana; Resources, Giulia Besutti, Marco Bertolini, Roberto Sghedoni, Mauro Iori, Guido Ligabue, Pierpaolo Pattacini, Alessia Piccinini, Gaetano Alfano and Gabriele Donati; Software, Valeria Trojani and Laura Verzellesi; Supervision, Giulia Besutti, Marco Bertolini, Mauro Iori and Francesco Fontana; Validation, Valeria Trojani, Filippo Monelli, Marco Bertolini, Paolo Giorgi Rossi and Marta Ottone; Visualization, Valeria Trojani, Filippo Monelli, Laura Verzellesi, Roberto Sghedoni, Guido Ligabue, Pierpaolo Pattacini, Paolo Giorgi Rossi, Marta Ottone, Alessia Piccinini, Gaetano Alfano and Gabriele Donati; Writing – original draft, Valeria Trojani and Filippo Monelli; Writing – review & editing, Giulia Besutti, Marco Bertolini, Laura Verzellesi, Paolo Giorgi Rossi, Marta Ottone and Francesco Fontana.
References
- Jha V, Garcia-Garcia G, Iseki K, et al. Chronic kidney disease: global dimension and perspectives. Lancet 2013; 382: 260–72.
- Liyanage T, Ninomiya T, Jha V, et al. Worldwide access to treatment for end-stage kidney disease: a systematic review. Lancet. 2015;385(9981):1975-1982. [CrossRef]
- Suthanthiran, M.; Strom, T.B. Renal transplantation. N Engl J Med. 1994;331(6):365-376. [CrossRef]
- Schnuelle, P.; Lorenz, D.; Trede, M.; Van Der Woude, F.J. Impact of renal cadaveric transplantation on survival in end-stage renal failure: evidence for reduced mortality risk compared with hemodialysis during long-term follow-up. J Am Soc Nephrol. 1998;9(11):2135-2141.
- Port, F.K.; Wolfe, R.A.; Mauger, E.A.; Berling, D.P.; Jiang, K. Comparison of survival probabilities for dialysis patients vs cadaveric renal transplant recipients. JAMA. 1993;270(11):1339-1343.
- Ojo, A.O.; Port, F.K.; Wolfe, R.A.; Mauger, E.A.; Williams, L.; Berling, D.P. Comparative mortality risks of chronic dialysis and cadaveric transplantation in black end-stage renal disease patients. Am J Kidney Dis. 1994;24(1):59-64. [CrossRef]
- Wang W, Yu Y, Wen J, Zhang M, Chen J, Cheng D, et al. Combination of functional magnetic resonance imaging and histopathologic analysis to evaluate interstitial fibrosis in kidney allografts. Clin J Am Soc Nephrol. 2019 Sep 6;14(9):1372–80.
- Poggio, E.D. Imaging as a noninvasive tool for evaluating interstitial fibrosis in kidney allografts. Vol. 14, Clinical Journal of the American Society of Nephrology. American Society of Nephrology; 2019. p. 1286–7.
- Chand S, Atkinson D, Collins C, Briggs D, Ball S, Sharif A, et al. The spectrum of renal allograft failure. PLoS One. 2016 Sep 1;11(9).
- Roufosse, C.; Simmonds, N.; Clahsen-van Groningen, M.; Haas, M.; Henriksen, K.J.; Horsfield, C.; Loupy, A.; Mengel, M.; Perkowska-Ptasińska, A.; Rabant, M.; Racusen, L.C.; Solez, K.; Becker, J.U. A 2018 Reference Guide to the Banff Classification of Renal Allograft Pathology. Transplantation. 2018 Nov;102(11):1795-1814. Erratum in: Transplantation. 2018 Dec;102(12):e497. [CrossRef] [PubMed]
- Morgan, T.A.; Chandran, S.; Burger, I.M.; Zhang, C.A.; Goldstein, R.B. Complications of Ultrasound-Guided Renal Transplant Biopsies. Am J Transplant. 2016 Apr;16(4):1298-305. [CrossRef] [PubMed]
- Furness, P.N.; Philpott, C.M.; Chorbadjian, M.T.; Nicholson, M.L.; Bosmans, J.L.; Corthouts, B.L.; Bogers, J.J.; Schwarz, A.; Gwinner, W.; Haller, H.; Mengel, M.; Seron, D.; Moreso, F.; Cañas, C. Protocol biopsy of the stable renal transplant: a multicenter study of methods and complication rates. Transplantation. 2003 Sep 27;76(6):969-73. [CrossRef] [PubMed]
- Schwarz, A.; Gwinner, W.; Hiss, M.; Radermacher, J.; Mengel, M.; Haller, H. Safety and adequacy of renal transplant protocol biopsies. Am J Transplant. 2005 Aug;5(8):1992-6. [CrossRef] [PubMed]
- Zwanenburg, Alex et al. “The Image Biomarker Standardization Initiative: Standardized Quantitative Radiomics for High-Throughput Image-based Phenotyping.” Radiology vol. 295,2 (2020): 328-338. [CrossRef]
- Reuzé, S.; et al. Prediction of cervical cancer recurrence using textural features extracted from 18F-FDG PET images acquired with different scanners. Oncotarget 2017;8:43169-43179.
- van Griethuysen, J. J. M. , Fedorov, A., Parmar, C., Hosny, A., Aucoin, N., Narayan, V., Beets-Tan, R. G. H., Fillon-Robin, J. C., Pieper, S., Aerts, H. J. W. L. (2017). Computational Radiomics System to Decode the Radiographic Phenotype. Cancer Research, 77(21), e104–e107. [CrossRef]
- Fedorov A, Beichel R, Kalpathy-Cramer J, Finet J, Fillion-Robin JC, Pujol S, Bauer C, Jennings D, Fennessy F, Sonka M, Buatti J, Aylward S, Miller JV, Pieper S, Kikinis R. 3D Slicer as an image computing platform for the Quantitative Imaging Network. Magn Reson Imaging. 2012 Nov;30(9):1323-41. PMCID: PMC3466397. [CrossRef] [PubMed]
- Zhi, R.; Zhang, X.-D.; Hou, Y.; Jiang, K.-W.; Li, Q.; Zhang, J.; et al. RtNet: a deep hybrid neural networks for the identification of acute rejection and chronic allograft nephropathy after renal transplantation using multiparametric, M.R.I. Nephrol Dial Transplant. 2022 Jan 10.
- Chantaduly, C.; Troutt, H.R.; Perez Reyes, K.A.; Zuckerman, J.E.; Chang, P.D.; Lau, W.L. Artificial Intelligence Assessment of Renal Scarring (AIRS Study). Kidney360. 2021 Jan 27;3(1):83–90.
- Berchtold L, Crowe LA, Friedli I, Legouis D, Moll S, De Perrot T, et al. Diffusion magnetic resonance imaging detects an increase in interstitial fibrosis earlier than the decline of renal function. Nephrol Dial Transplant. 2020 Jul 1;35(7):1274–6.
- Berchtold L, Crowe LA, Combescure C, Kassaï M, Aslam I, Legouis D, et al. Diffusion-magnetic resonance imaging predicts decline of kidney function in chronic kidney disease and in patients with a kidney allograft. Kidney Int. 2022 Apr 1;101(4):804–13.
- Bane O, Hectors SJ, Gordic S, Kennedy P, Wagner M, Weiss A, et al. Multiparametric magnetic resonance imaging shows promising results to assess renal transplant dysfunction with fibrosis. Kidney Int. 2020 Feb 1;97(2):414–20.
- Kirpalani A, Hashim E, Leung G, Kim JK, Krizova A, Jothy S, et al. Magnetic resonance elastography to assess fibrosis in kidney allografts. Clin J Am Soc Nephrol. 2017 Oct 1;12(10):1671–9.
- Cong, L. , Hua, Q. Q., Huang, Z. Q., Ma, Q. L., Wang, X. M., Huang, C. C., Xu, J. X., & Ma, T. (2021). A radiomics method based on MR FS-T2WI sequence for diagnosing of autosomal dominant polycystic kidney disease progression. European review for medical and pharmacological sciences, 25(18), 5769–5780. [CrossRef]
- Beunon, P. , Barat, M., Dohan, A., Cheddani, L., Males, L., Fernandez, P., Etain, B., Bellivier, F., Marlinge, E., Vrtovsnik, F., Vidal-Petiot, E., Khalil, A., Haymann, J. P., Flamant, M., & Tabibzadeh, N. (2022). MRI-based kidney radiomic analysis during chronic lithium treatment. European journal of clinical investigation, 52(5), e13756. [CrossRef]
- Zhang, L., Chen, Z., Feng, L., Guo, L., Liu, D., Hai, J., Qiao, K., Chen, J., Yan, B., & Cheng, G. (2021). Preliminary study on the application of renal ultrasonography radiomics in the classification of glomerulopathy. BMC medical imaging, 21(1), 115. [CrossRef]
- Zhu, L. , Huang, R., Li, M., Fan, Q., Zhao, X., Wu, X., & Dong, F. (2022). Machine Learning-Based Ultrasound Radiomics for Evaluating the Function of Transplanted Kidneys. Ultrasound in medicine & biology, 48(8), 1441–1452.
- Zhi, R.; Zhang, X.-D.; Hou, Y.; Jiang, K.-W.; Li, Q.; Zhang, J.; et al. RtNet: a deep hybrid neural networks for the identification of acute rejection and chronic allograft nephropathy after renal transplantation using multiparametric, M.R.I. Nephrol Dial Transplant. 2022 Jan 10.
Figure 1.
Patient and exam inclusion flow chart. p.n.: patient number; e.n.: exam number, referring to the number of couples of MR/biopsy tests.
Figure 1.
Patient and exam inclusion flow chart. p.n.: patient number; e.n.: exam number, referring to the number of couples of MR/biopsy tests.
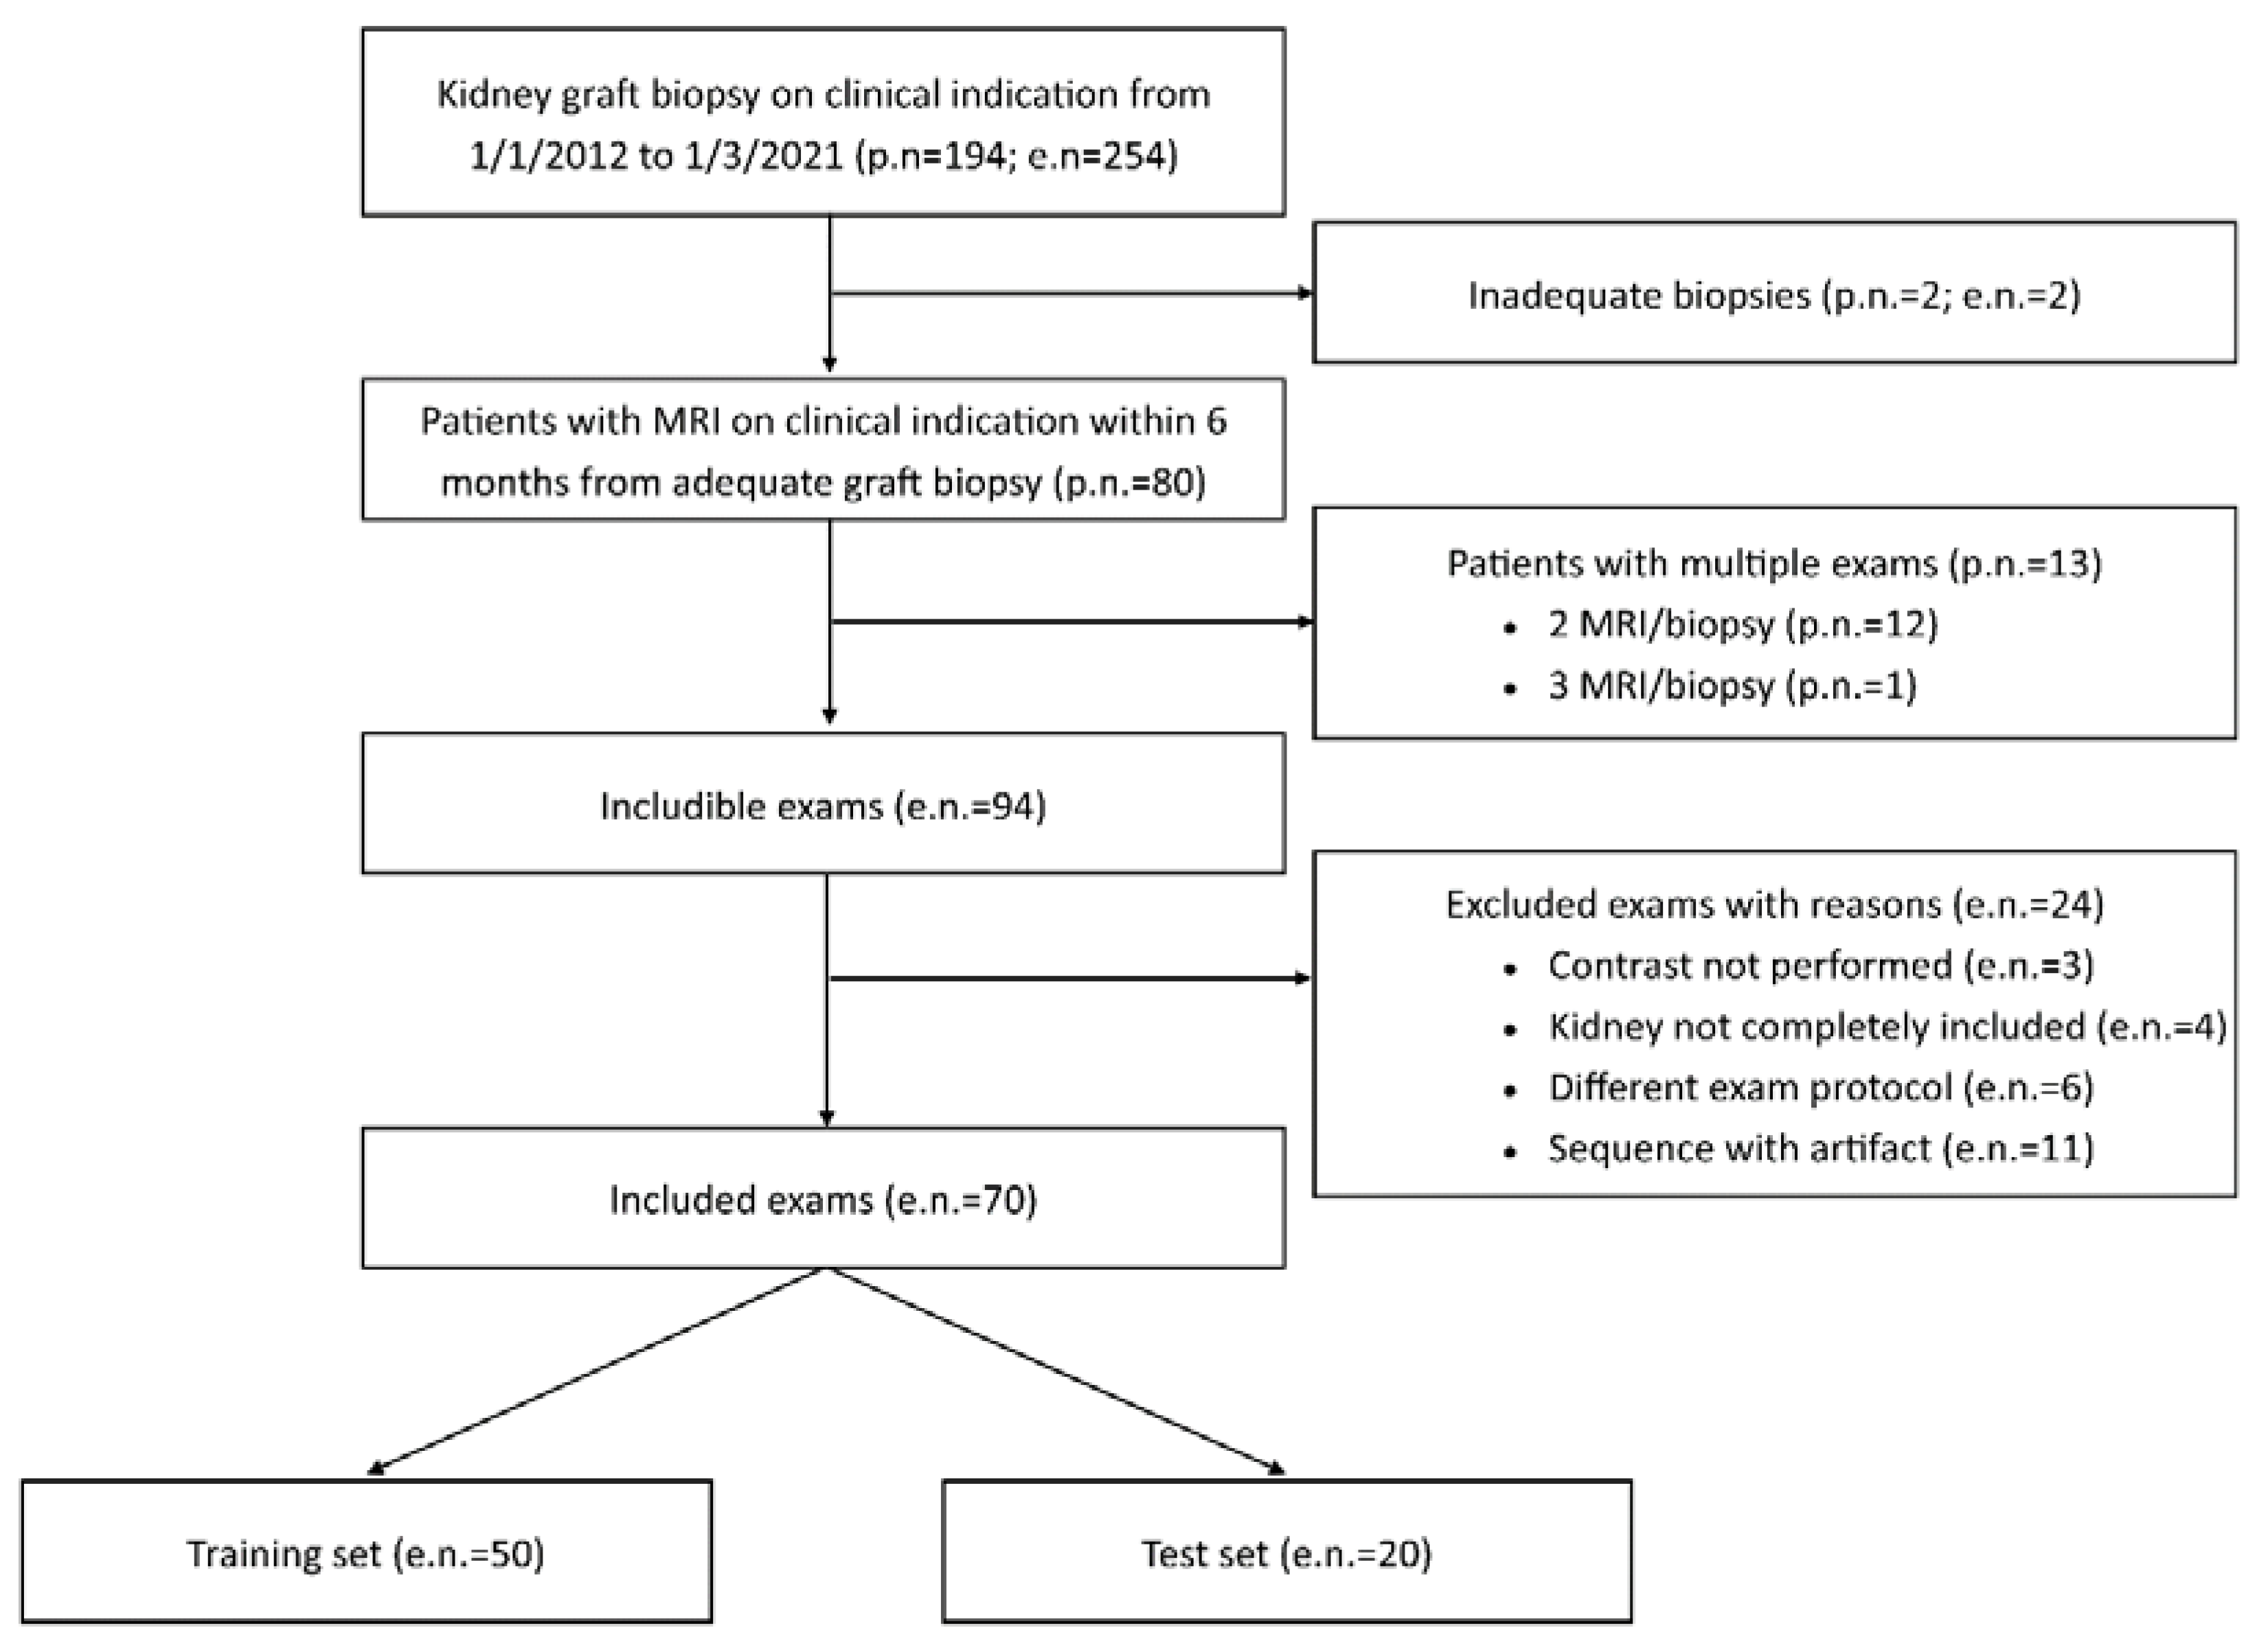
Figure 2.
A, B and D: Gradient Echo T1 weighted 3D venous phase post contrast sequence segmented in whole parenchyma only through the intensity-levels based semiautomatic contouring tool and depicted in axial view (A), sagittal view (B) and coronal view (D). C: Single Shot T2 weighted sequences segmented with 3D slicer manual contouring tool respectively subdivided in medulla (yellow) and cortex (red). E: 3D rendering of whole parenchyma using T1 3D segmentation.
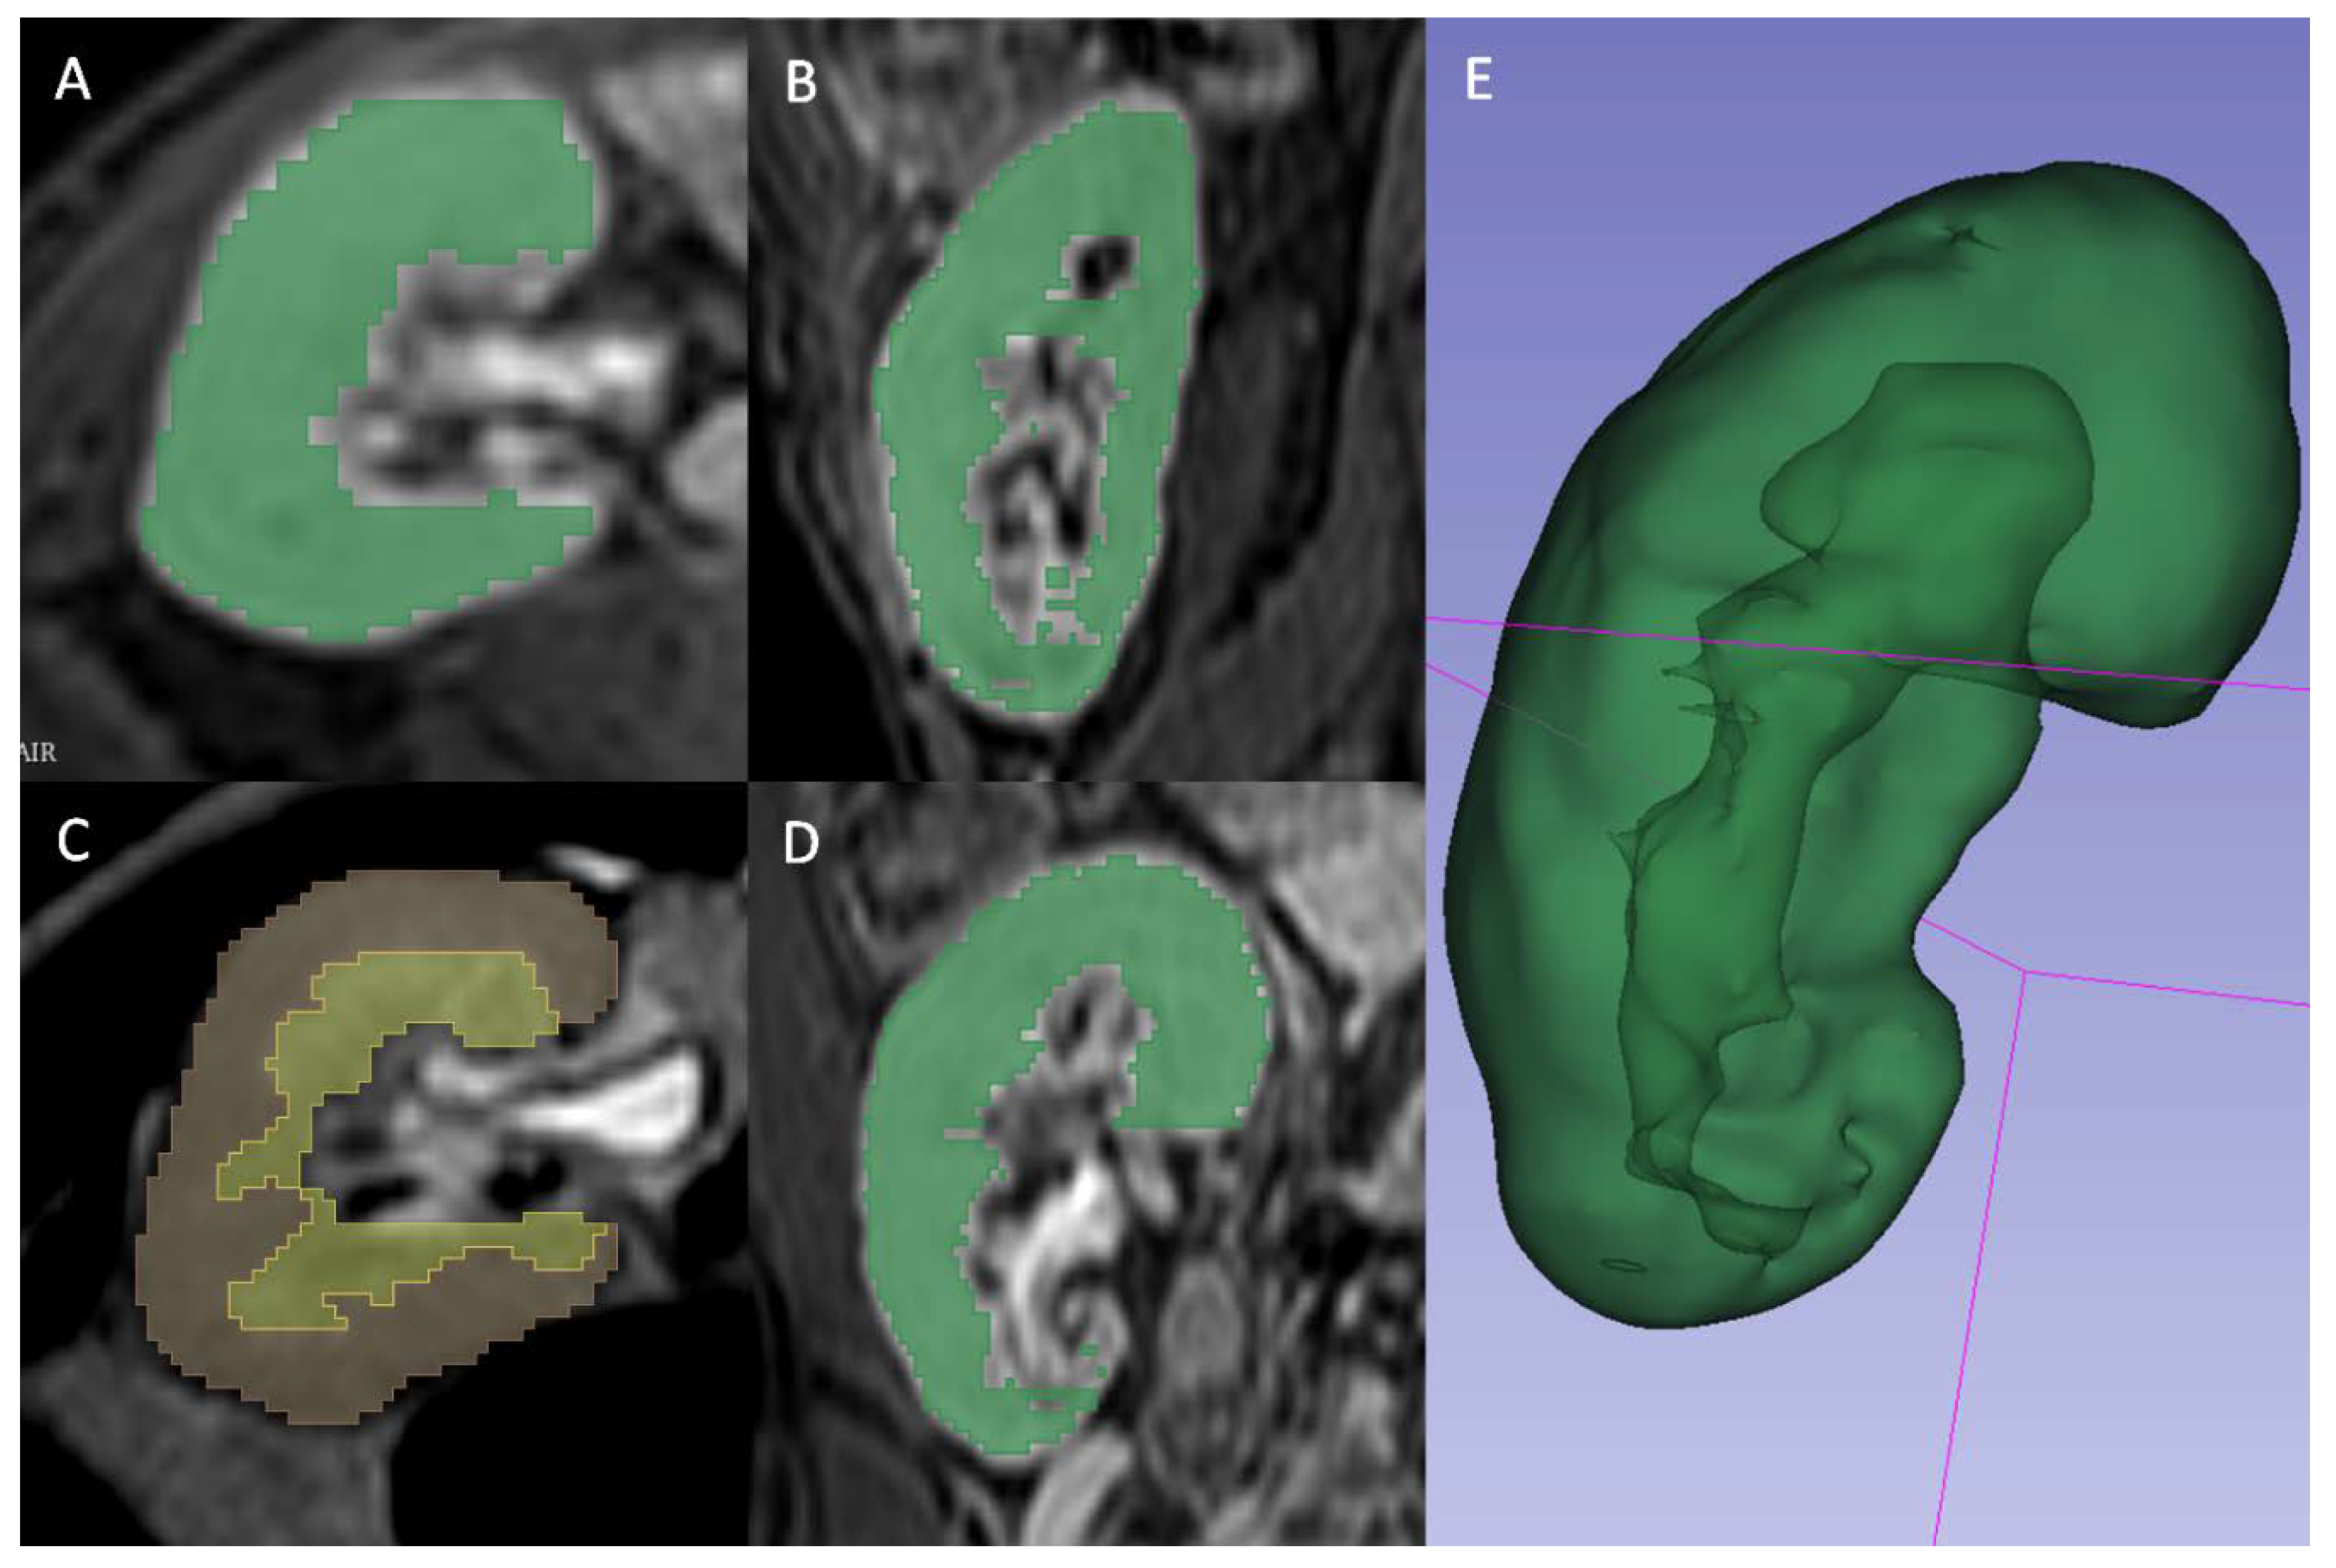
Figure 3.
AUC of the two models based on clinical, radiomic and mixed model. A and C) AUC obtained using an internal 10-fold cross validation method on the training cohort (A IFTA ≥ 25%, C IFTA ≥ 50%). B and D) AUC obtained applying models deployed on training cohort to a validation cohort composed by new tests (B IFTA ≥ 25%, D IFTA ≥ 50%).

Table 1.
clinical characteristics of the included patients / paired tests. DBD donation after brain death; DCD donation after cardiac death; LD living donor.
Table 1.
clinical characteristics of the included patients / paired tests. DBD donation after brain death; DCD donation after cardiac death; LD living donor.
| Table 1 Clinical Variables | Total (n=70) | Training set (n=50) | Test set (n=20) | |
| Sex (M : F) | 45 : 25 | 33 : 17 | 12 : 8 | |
| Ethnicity (Caucasian : Sub-Saharan) | 62 : 8 | 45 : 5 | 17 : 3 | |
| Age (years) (mean ±SD) | 52.19 ±12.76 | 54.10 ±12.36 | 47.41 ±12.78 | |
| RM/Biopsy interval (days) (median, IQR) | 16, 4-48.75 | 16, 4-48.75 | 15, 4.75-49 | |
| RM/Biopsy interval >90 days (n, %) | 13 (18.57%) | 10 (20%) | 3 (15%) | |
| BMI (median, IQR) | 24.59, 22.47-27.30 | 25.39, 22.68-27.90 | 23.50, 22.46-25.39 | |
| eGRF at biopsy (median, IQR) | 25.68, 11.88-35.51 | 26.90, 13.08-34.95 | 20.17, 11.10-38.08 | |
| Proteinuria/creatininuria, g/g (median, IQR) | 0.79, 0.30-2.10 | 0.74, 0.21-2.09 | 0.79, 0.35-2.00 | |
| Transplant type (n, %) | DBD | 59 (84,29%) | 42 (84,00%) | 17 (85,00%) |
| DCD | 2 (2,86%) | 2 (4,00%) | 0 (0,00%) | |
| LD | 9 (12,86%) | 6 (12,00%) | 3 (15,00%) | |
| Transplant age (years) (median, IQR) | 0.78, 0.31-6.36 | 1.03, 0.36-0.77 | 0.62, 0.24-1.78 | |
| IFTA % (median, IQR) | 20, 10-30 | 20, 10-37.5 | 20, 10-30 | |
| IFTA ≥ 25% (n, %) | 29 (41.42%) | 21 (42.00%) | 8 (40.00%) | |
| IFTA ≥ 50% (n, %) | 14 (19.72%) | 11 (22.00%) | 3 (15.00%) | |
Table 2.
T1 and T2 radiomic features used for the prediction of IFTA ≥ 25% and IFTA ≥ 50% with their respective LASSO regression coefficients at the chosen penalization parameter.
Table 2.
T1 and T2 radiomic features used for the prediction of IFTA ≥ 25% and IFTA ≥ 50% with their respective LASSO regression coefficients at the chosen penalization parameter.
| IFTA ≥25% | LASSO RC | IFTA ≥50% | LASSO RC |
| T1 Logsigma30mm3D glrlm LongRunLowGrayLevelEmphasis | 1.8 | T1 logsigma30mm3D glcm ClusterShade | -0.071 |
| T1 waveletHHL glcm Idmn | -2.6E+03 | T1 waveletHLH glcm Idmn | 0.0071 |
| T1 waveletHHH firstorder Skewness | 2.4 | T1 squareroot firstorder Kurtosis | 1.6 |
| T1 logarithm glszm SizeZoneNonUniformity | 1.5 | T1 exponential glcm Imc2 | -8.5 |
| T1 exponential glcm Imc2 | -84 | T1 exponential gldm SmallDependenceLowGrayLevelEmphasis | 610 |
| T1 exponential gldm SmallDependenceLowGrayLevelEmphasis | 2.6E+03 | T1 gradient glcm Imc2 | 57 |
| T2 waveletLH firstorder Mean | 8.4 | T2 logsigma30mm3D firstorder Median | 0.0012 |
| T2 waveletLH firstorder Median | 2.5 | T2 waveletLH glszm ZoneEntropy | -1.9 |
| T2 waveletLH glszm ZoneEntropy | -88 | T2 waveletHH glcm Idmn | 2.3 |
| T2 waveletHH glcm Imc1 | 3.7 | T2 waveletHH glcm Imc1 | -0.67 |
| T2 waveletHH ngtdm Busyness | 2.4 | T2 waveletHH ngtdm Busyness | 0.10 |
| T2 waveletLL glcm MaximumProbability | -2.9E+03 | T2 logarithm gldm SmallDependenceLowGrayLevelEmphasis | -0.34 |
| T2 exponential glrlm ShortRunLowGrayLevelEmphasis | 8.9 | T2 exponential glrlm LongRunHighGrayLevelEmphasis | 0.56 |
Table 3.
Areas under the curve (AUCs) with respective 95% confidence intervals of different models (radiomic-based, clinical-based, mixed) for IFTA ≥50% and ≥25% in the training and test sets.
Table 3.
Areas under the curve (AUCs) with respective 95% confidence intervals of different models (radiomic-based, clinical-based, mixed) for IFTA ≥50% and ≥25% in the training and test sets.
| Table 3 Model Performance | AUC | 95% Confidence Interval | ||
| IFTA≥25% | Training | Radiomic Model | 0.80 | (0.64/0.90) |
| Clinical Model | 0.64 | (0.45/0.79) | ||
| Mixed Model | 0.83 | (0.66/0.93) | ||
| Test | Radiomic Model | 0.60 | ||
| Clinical Model | 0.59 | |||
| Mixed Model | 0.54 | |||
| IFTA≥50% | Training | Radiomic Model | 0.89 | (0.84/0.94) |
| Clinical Model | 0.83 | (0.75/0.91) | ||
| Mixed Model | 0.94 | (0.90/0.98) | ||
| Test | Radiomic Model | 0.82 | ||
| Clinical Model | 0.83 | |||
| Mixed Model | 0.86 | |||
Disclaimer/Publisher’s Note: The statements, opinions and data contained in all publications are solely those of the individual author(s) and contributor(s) and not of MDPI and/or the editor(s). MDPI and/or the editor(s) disclaim responsibility for any injury to people or property resulting from any ideas, methods, instructions or products referred to in the content. |
© 2024 by the authors. Licensee MDPI, Basel, Switzerland. This article is an open access article distributed under the terms and conditions of the Creative Commons Attribution (CC BY) license (http://creativecommons.org/licenses/by/4.0/).
Copyright: This open access article is published under a Creative Commons CC BY 4.0 license, which permit the free download, distribution, and reuse, provided that the author and preprint are cited in any reuse.


