
Submitted:
01 August 2024
Posted:
02 August 2024
You are already at the latest version
Abstract
The current surge in the deployment of web applications underscores the need to consider users' individual preferences in order to enhance their experience. In response to this, an innovative approach is emerging that focuses on the detailed analysis of interaction data captured by web browsers. This data, which includes metrics such as the number of mouse clicks, keystrokes, and navigation patterns, offers insights into user behaviour and preferences. By leveraging this information, developers can achieve a higher degree of personalization in web applications, particularly in the context of interactive elements such as online games. This paper presents the WebTraceSense project, which aims to pioneer this approach by developing a framework that encompasses a backend and frontend, advanced visualization modules, a DevOps cycle, and the integration of AI and statistical methods. The backend of this framework will be responsible for securely collecting, storing, and processing vast amounts of interaction data from various websites. The frontend will provide a user-friendly interface that allows developers to easily access and utilize the platform’s capabilities. One of the key components of this framework is the visualization modules, which will enable developers to monitor, analyse, and interpret user interactions in real-time, facilitating more informed decisions about user interface design and functionality. Furthermore, the WebTraceSense framework incorporates a DevOps cycle to ensure continuous integration and delivery, thereby promoting agile development practices and enhancing the overall efficiency of the development process. Moreover, the integration of AI methods and statistical techniques will be a cornerstone of this framework. By applying machine learning algorithms and statistical analysis, the platform will not only personalize user experiences based on historical interaction data but also infer new user behaviours and predict future preferences. In order to validate the proposed components, a case study was conducted which demonstrated the usefulness of the WebTraceSense framework in the creation of visualizations based on an existing dataset.
Keywords:
User Log
; Behavior Identification
; Web Platform
; DevOps
; Statistical Analysis
1. Introduction
E-commerce websites, web games, and other digital platforms will significantly benefit from the implementation of personalization strategies. The utilization of user data to tailor content and experiences has the potential to enhance user satisfaction and engagement on these platforms. For instance, the implementation of personalized recommendations in e-commerce has the potential to enhance sales and foster customer loyalty by enabling users to access products that align with their preferences [1]. Personalizing digital experiences is a complex process. For example, Nguyen and Hsu [2] discovered that the most personalized recommendation is not always perceived as useful as conventionally believed. Their study showed that highly personalized recommendations were effective for simple technology products among experienced customers, while partially personalized recommendations were more beneficial for complex technology products. This indicates that e-commerce vendors should consider the resource matching dimensions to avoid collecting excessive customer data, thus enabling the delivery of adequately personalized recommendation results. Moreover, research has demonstrated that the adaptation and personalization of game content significantly enhance player satisfaction and engagement, thereby contributing positively to gamified education and rehabilitation [3]. By adapting the difficulty and content of games to align with individual player preferences, developers can create more immersive and enjoyable gaming experiences. The personalization of web games allows for the adaptation of both the difficulty level and the narrative to align with the preferences of individual players, thereby enhancing their enjoyment and prolonging their engagement with the game. By adapting the gaming experience to align with the preferences of individual players, developers can enhance user engagement and satisfaction [4]. In the context of web games, gamification plays a pivotal role in the creation of immersive and interactive experiences for players. The utilization of gamification techniques and personalization facilitates player retention and encourages repeated gameplay, which contributes to the success of web games in the digital landscape [5].
Similarly, personalization can be beneficial in other contexts, such as web platforms designed for use in healthcare settings. For example, modifying the interface to accommodate users with limited digital literacy can markedly enhance the user experience and accessibility [6]. The research on understanding, developing, and assessing personalization systems is distributed across multiple disciplines and draws upon methodologies and findings from a variety of research fields and traditions, including artificial intelligence (AI), machine learning (ML), human-computer interaction (HCI), and user modeling based on social and cognitive psychology. The focus of AI and ML is the optimization of personalization applications through the implementation of accurate algorithmic decision-making and prediction models. The fields of Human-Computer Interaction (HCI) and Information Systems examine the phenomena surrounding the use and interaction with personalization systems. Meanwhile, Cognitive Science provides the theoretical foundations for these observed effects [7].
Digital phenotyping is an approach that employs data gathered from digital devices to evaluate and comprehend user behaviors and characteristics. This approach can facilitate a comprehensive understanding of user interactions and preferences. The term "digital phenotyping" is defined as the moment-by-moment quantification of the individual-level human phenotype in situ, utilizing data from personal digital devices [8]. A related concept is task fingerprinting, which refers to the distinctive patterns and behaviors exhibited by users when engaged with digital tasks. By analyzing these patterns, developers are able to create highly personalized experiences that are tailored to the specific behaviors and preferences of users [9]. These techniques are of great value in the enhancement of the personalization of web applications, including games, through the provision of a detailed understanding of user engagement. A similar trajectory may be envisaged for digital phenotyping, whereby traditional statistical tools may be combined with machine learning to translate smartphone sensor and usage data into biomedical and clinical insights [10]. In order to identify behavioral patterns and inform personalization strategies, it is essential to create a web platform for the visualization of user log interaction data. Such a platform can provide developers with intuitive tools for the analysis of interaction data, including mouse clicks and keystrokes, thereby enabling the identification of trends and preferences. The visualization of this data enables informed decision-making by developers regarding game design and content delivery, which in turn enhances the user experience [11].
The primary objective of this article is to present the utilization of the WebTraceSense project to analyze user interaction data from a dataset derived from another study involving 134 distinct crowd workers, employing the task fingerprinting technique to examine the user interaction logs [12]. The objective of our research is to investigate the potential of WebTraceSense in enhancing the personalization of web applications by leveraging these logs. The following research questions (RQs) were formulated:
RQ1: How can the visualization of user interaction logs enhance the personalization of web applications, including e-commerce websites, web games, and other digital platforms?
RQ2: What are the most effective statistical and machine learning techniques for analyzing user interaction data to identify and predict user behavioral patterns in web applications?
In order to respond to these queries, we will generate visualizations and apply statistical analyses with a view to assessing the potential for personalized visualizations to enhance user experience and engagement on digital platforms. The generation of detailed visual representations of user interactions will facilitate the uncovering of patterns and insights that can inform the customization of web content and features. Furthermore, the optimal statistical and machine learning methodologies for analyzing the interaction data gathered through the WebTraceSense project will be identified. The objective is to ascertain which techniques are most efficacious in identifying and predicting user behavioral patterns, thereby informing the development of personalized web content. The behavioral traces of crowd workers will be analyzed from a performance standpoint using task fingerprinting, with data from cognitive ability tests being employed to complement this analysis. The investigation of WebTraceSense in the customization of web application interaction data has the potential to yield significant outcomes for the web development industry. A more profound comprehension of user behaviors and preferences enables developers to refine the design, functionality, and content of their applications in a manner that aligns with the specific requirements and interests of their target audience.
2. Background
User log analysis serves as a versatile tool across various domains, particularly in enhancing healthcare diagnostics and treatments by integrating traditional and digital biomarkers. Termed digital phenotyping, this method improves "point-of-care" diagnostics by enabling swift and real-time feedback, thus improving patient care by offering immediate insights into patient conditions [13-15]. In healthcare settings where timely decision-making is crucial, the rapid analysis and feedback capabilities of digital phenotyping are invaluable. In mental health, analyzing touchscreen typing patterns has shown potential in detecting depressive tendencies. A study utilizing machine learning to analyze keystroke dynamics and metadata from smartphone interactions identified significant correlations with depressive symptoms, measured by PHQ-9 scores [16], highlighting the method's accuracy and its utility for routine mental health monitoring [17]. Additionally, physiological assessments, such as those analyzing arm movement functions, are seamlessly integrated into web platforms, offering quantitative and automated evaluations that facilitate the personalization and adaptation of user interfaces for enhanced interaction [18].
In the realms of e-commerce and digital workplaces, user log analysis is crucial. Evaluating performance on microtasks, commonly used in crowdsourcing, can extend beyond simple outcome measures to include interaction log analysis, offering a detailed view of worker engagement and efficiency [19,20]. These logs, often collected via simple JavaScript libraries, reveal insights into user behavior, distinguishing between high and low-effort interactions which can inform task allocation and design. Furthermore, user interaction logs are vital in game design, where understanding player behavior and preferences is essential to crafting more engaging and personalized experiences. Game analytics studies underscore the importance of leveraging user data to refine game mechanics and narratives to suit individual player profiles [21].
The methodologies used in web interaction analysis are varied, including descriptive statistics, machine learning, knowledge inference, deep learning, and sequence mining. Each methodology provides unique insights into data patterns and user behaviors, aiding in the development of targeted and effective web applications. For instance, deep learning models are particularly adept at analyzing complex patterns within large datasets, providing predictive insights that enhance the identification of user behaviors [22-25]. Although significant advancements have been made in user log analysis, particularly by researchers like Mastoras and colleagues [17], there remains a research gap in the strategic application of user log analysis through advanced statistical and computational techniques, such as generating interactive visualizations, to create tailored web experiences. This approach not only boosts user satisfaction and engagement but also supports the ongoing enhancement of digital platforms.
3. WebTraceSense Platform – A framework for the visualization of user log interactions
The WebTraceSense platform aims to provide a comprehensive solution for analyzing web interaction data. The project involves the development of a backend using .NET1 (a framework based on C#) for the CRUD (Create, Read, Update, Delete) operations on the visualization data, and a Django API 2(a framework based on Python) for the application of statistical and Machine Learning methods on the user interaction log data. This backend is complemented by the establishment of a database designed to store interaction log files in JSON format, ensuring efficient data management and retrieval. The authentication for accessing the backend is made with Auth03, that handles OAuth authentication. On the frontend, the development focuses on creating a web application using React4, to facilitate the visualization of interaction data. This involves not only the creation and editing of HTML/CSS pages but also the implementation of a step-by-step web form, commonly referred to as a "Wizard," which helps users customize the visualization of their web interaction records. Additionally, registration and login pages are developed, adhering to web usability heuristics to ensure a smooth and intuitive user experience. A significant aspect of the WebTraceSense platform is the development of visualization modules using JavaScript libraries such as D3.js5. These modules are essential for illustrating interaction data in a dynamic and interactive manner, providing users with clear and insightful visual representations of their data. To ensure that the platform operates efficiently in a production environment, a robust DevOps [26] and automation process is implemented. This includes the deployment of backend and frontend components into production mode, conducting thorough integration tests to validate both components, and creating containerized solutions using Docker6. These steps are crucial for maintaining the reliability and scalability of the platform.
Figure 1 illustrates a component diagram of the WebTraceSense framework. The WebTraceSense framework is contingent upon researchers, web developers, or any individual interested in analysing user interaction data having access to a website where these logs can be collected. The interaction logs are exported into a JSON file, which captures essential metrics such as click data, key presses, and the latency of the user's session. The OAuth protocol is employed to streamline the process of user authentication, thereby enabling users to log in using a third-party provider. Upon successful authentication on an external platform, users are redirected to the WebTraceSense frontend. The main webpage provides users with the ability to manage the visualizations of user logs. The generation of these visualizations is facilitated through the utilization of a wizard form, which guides users through a series of steps, including the upload of interaction log files and the selection of metrics to be analysed. These may include mouse data, key presses and temporal intervals, as well as the types of visualization charts to be generated. Following the submission of a visualization request, the ‘Visualization Module’ processes it to produce dynamic, data-driven graphics. Subsequently, the backend collates data on the visualization metrics employed, which are then subjected to statistical analysis in order to optimize the visualizations produced. The refined visualizations provide valuable insights that assist in the definition of requirements for researchers, game developers, or web developers to enhance their web platforms. This iterative process of continuous refinement entails the generation of new user interaction logs and the conduct of further analyses. Throughout its operational lifespan, the WebTraceSense project incorporates a DevOps cycle to automate the integration of statistical methods into its data-driven processes. This automation facilitates a seamless transition of backend and frontend components from the development phase to the production environment, with unit and integration tests ensuring efficient and seamless functionality.
The activity diagram for the Visualization Module in the WebTraceSense project outlines a structured process for creating data visualizations based on user interaction logs (see Figure 2). Initially, the module fetches the interaction log data from the specified web platform that the researcher wishes to analyze. Once the data is retrieved, the user can choose the type of chart or visualization they prefer, which sets the framework for how the data will be presented. Following this, the user selects specific interaction log metrics to focus on, such as mouse clicks, keystrokes, or navigation paths, depending on what aspects of user behavior they are most interested in exploring. The user also specifies a time interval or selects specific data values to map, which helps in narrowing down the data analysis to relevant time frames or specific events. Finally, the module generates the visualization of the interaction log, translating the complex data into a visual format that is easier to understand and analyze. This streamlined process allows for efficient and tailored visualizations, providing valuable insights into user interactions on the web platform.
The sequence diagram of the Visualization Module (see Figure 3) provides a comprehensive overview of the process, which commences when a creator (researcher, web developer, or game developer) requests interaction log data from a particular web platform. This constitutes the inaugural stage in a series of data-driven activities with the objective of creating sophisticated visualizations. Once the log data has been obtained, the creator must then select the type of visualization that is required. This may range from a relatively simple chart to a more complex graphical representation, such as a heatmap or a dynamic visualization of player interactions. This decision is of great consequence, as it determines the visual framework through which data insights are conveyed. Subsequently, the creator must select the specific interaction log metrics that will be subjected to analysis. Such data points may include click rates, navigation paths, or time spent on specific tasks. Additionally, the creator establishes the temporal scope of the data, or alternatively, selects specific data values for mapping, thereby facilitating a concentrated examination of specific behaviours or occurrences. At this juncture, the Visualization Module deploys statistical techniques to conduct a comprehensive analysis of the specified metrics. Descriptive statistics may be employed to summarise the characteristics of the data, while inferential statistics may be used to make predictions and test hypotheses about user behaviours. It is imperative that statistical analysis is conducted on the raw data in order to accurately interpret it and transform it into actionable insights. Once the data has been statistically processed, the Visualization Module generates the visual representation. This final visualization integrates both the statistical analysis and the initial user specifications to produce a comprehensive, easily comprehensible display of user interactions. These visualizations serve as powerful tools for the creator, providing a visual summary of complex datasets and highlighting trends and patterns that may not be immediately apparent from raw data alone.
Figure 4 presents a comprehensive visual guide to the WebTraceSense platform, illustrating the key components of its user interface that facilitate efficient interaction analysis and visualization. The image in the top left-hand corner depicts the Home Screen, which represents the initial point of interaction for users and provides access to the various functionalities of the platform. The top right screenshot illustrates the login screen integrated with Auth0, which serves to demonstrate the platform's commitment to robust security and streamlined user authentication. The bottom left image depicts the CRUD visualization table, which plays a pivotal role in the management and editing of user-generated visualizations, enabling real-time modifications and updates. The bottom right screenshot presents the Wizard form, which guides users through the process of generating custom visualizations. This form simplifies the selection of data sets, metrics, and visualization types, ensuring that users can effectively tailor the analysis to meet their specific needs. The Wizard form is a step-by-step interface that simplifies the process of generating custom visualizations. The initial step in the wizard form provides a brief tutorial. The second step presents the option to upload the JSON file of the user log. The third step allows the user to specify the time interval and the type of charts they would like to produce. The fourth step presents a preview of the generated visualization. The generated visualization can have multiple options, and the main types of charts are the line chart (see Figure 5), bar chart, pie chart and the dynamic player (presented in Figure 6).
4. Case Study of Analyzing the User Interaction Logs in a Crowdsourcing Context
The principal aim of this article is to present the utilization of the WebTraceSense project to analyse user interaction data from a dataset derived from another study involving 134 distinct crowd workers [12]. This is achieved by employing the task fingerprinting technique to examine the user interaction logs. This study makes use of the advanced capabilities of the WebTraceSense platform to gain insight into the patterns and nuances of user behaviour by reconstructing the sequence of interactions from extensive log data. The application of task fingerprinting enables the differentiation of disparate user behaviours and the identification of notable trends and anomalies within the data set. This approach not only enhances our understanding of user engagement but also provides insights that can be acted upon to optimise user interfaces and improve the overall user experience.
4.1. Visualizations Generated for the Analysis of Some Logs of the Dataset
Figure 5 presents a line chart comparing user interaction logs from two versions of a web application, one with personalization and the other without, as documented by Paulino et al. [12]. The chart effectively illustrates the temporal dynamics between user interactions. In the personalized version (left side of the chart), there is a noticeable reduction in the time intervals between interactions, suggesting a smoother and potentially more intuitive user experience. Conversely, the version without personalization (right side of the chart) exhibits longer time intervals between interactions, implying a more challenging user interface that may require more time for users to navigate and complete tasks. This visual representation underscores the efficiency gains that can be achieved through personalized interfaces, aligning with expectations that personalized systems can enhance user engagement and task performance by tailoring the experience to individual user needs.
The Dynamic Player shows user behaviour more realistically than other visualization options. It draws the corresponding interaction (mouse or key press) in screenshots of the user's login interface. It also shows where the user clicked most. Figure 6 shows an example of the cognitive test "Pointing", analysed in the same scenario as an experiment on Paulino et al. [12], which collected user interaction data.
4.2. Statistical Analysis
The results of the statistical analysis, conducted with the objective of evaluating the potential of personalised visualizations to optimise user experience and engagement on digital platforms, are presented in this section. In the context of the WebTraceSense system, the Python packages Pandas [27] and NumPy [28] were employed to facilitate data manipulation and numerical computations, which were essential for preparing the datasets. The Scikit-learn package [29] is employed for the application of statistical modelling techniques, such as clustering, with the objective of identifying behavioural patterns. The SciPy package [30] provides additional statistical tests that are necessary for deeper analysis. To facilitate the visualization of these insights, Matplotlib [31] and Seaborn [32] are employed to create clear, informative charts that depict the relationships and trends within the data. This enables a thorough understanding of different user groups based on their interaction logs. The aforementioned packages integrate seamlessly, facilitating the analysis and presentation of data in a meaningful manner. The microtasks subjected to analysis were as follows: classification accuracy, counting accuracy, transcription accuracy and sentiment analysis accuracy. These were identified as dependent variables and correlated with the results of the cognitive tests, which were considered to correspond to the independent variables.
The analysis indicates that personalization is associated with enhanced performance metrics, particularly with regard to accuracy and efficiency. In order to gain a more nuanced understanding and identify patterns, we employed a range of analytical techniques, including the use of correlations, trends, and potential clusters. The following steps were then undertaken: A correlation analysis was conducted to evaluate the relationships between different metrics and identify significant correlations that might indicate how certain factors influence performance. To examine trends in the data, such as changes in performance metrics across different tasks or groups, a trend analysis was conducted. In order to identify distinct groups within the analysed data that may exhibit similar characteristics or behaviours, a cluster analysis was conducted using a variety of clustering techniques. The results of this analysis are presented in Figure 7.
The results demonstrated that the independent variables exhibited the most significant correlations with each of the dependent variables when applied the personalization. The limit of correlation was employed to determinate the significance, with a value of correlation coefficient greater than 0.3 or less than -0.3 with each dependent variable [34]. This approach is illustrated in Figure 8.
This analysis aimed to identify and compare the performance metrics of different clusters of participants based on their performance in various microtasks as showed. Furthermore, we were interested in identifying the factors that were most strongly associated with counting accuracy within each cluster. This analysis is vital for elucidating the manner in which disparate factors influence task performance showing in this way the design of personalized interventions. The analysis of clusters revealed the following behavioral distinct tendencies:
Cluster 0: This cluster, encompassing 4 participants, has a mean score of 0.62, a median score of 0.69, a standard deviation of 0.37, with scores ranging from a minimum of 0.11 to a maximum of 1.0. This cluster suggests a group of participants who are likely to excel across multiple task types, potentially due to higher overall engagement or superior cognitive strategies.
Cluster 1: With 24 participants, this cluster shows a mean score of 0.58, a median score of 0.67, and a standard deviation of 0.35, with scores ranging from 0.0 to 1.0. It reflects a more varied group in which some participants excel in certain tasks while others struggle, indicating diverse strategies or varying levels of task-specific expertise.
Cluster 2: This cluster represents a singular participant with constant scores (mean, median, min, and max all at 0.25) and no recorded standard deviation, suggesting either uniform performance across a limited set of tasks or incomplete data. This cluster represents participants who generally perform poorly or have incomplete data, indicating the need for deeper investigation or targeted support.
Finally, we analyzed the pair plot graph as presented in Figure 9. It is able to analyze and explore the relationships between a selection of key variables countingAccuracy, classificationAccuracy and transcriptAccuracy.
The presented statistics until this moment served to elucidate divergences in performance across clusters, thereby indicating that Cluster 0 and Cluster 1 exhibit a more extensive and variability in counting accuracy, whereas Cluster 2, has limited representation. This information serves to assist in the personalization of interventions and training programmes to align with the specific needs of individual participants. Thus enhancing overall task performance and facilitating an understanding of the diversity in selected task.
5. Discussion
5.1. RQ1: How Can the Visualization of User Interaction Logs Enhance the Personalization of Web Applications, Including e-Commerce Websites, Web Games, and Other Digital Platforms?
The visualization of user interaction logs is of significant importance in the personalization of web applications across a range of platforms, including e-commerce sites, web games and other digital interfaces. By mapping user interactions within these environments, developers and designers can gain a profound comprehension of user behavioural patterns, preferences, and areas of difficulty. To illustrate, in the context of e-commerce platforms, the visualization of user pathways can assist in the identification of products that elicit greater interest and those sections of the site that give rise to confusion or abandonment. These insights facilitate the implementation of targeted modifications to the user interface and user experience (UI/UX) design, thereby promoting a more seamless shopping experience that can ultimately lead to increased sales and customer retention.
The capacity for visualization inherent to the WebTraceSense platform is pivotal to its functionality, facilitating a comprehensive and interactive representation of user interaction logs. The employment of D3.js for the purpose of visualization modules enables the platform to represent interaction data in a dynamic manner, thereby facilitating the intuitive visualization of complex data sets for users. This is particularly advantageous in a personalised setting, as evidenced by the comparative analysis of user logs from personalised versus non-personalised versions of web applications. The data clearly demonstrates that the implementation of personalised interfaces results in a notable reduction in the time between interactions, which suggests a more streamlined and user-friendly experience. The aforementioned visualizations facilitate the immediate acquisition of insights into user behaviour, thereby guiding subsequent enhancements to the web application based on real-time user feedback.
Furthermore, the incorporation of robust backend technologies with advanced frontend visualization tools enables WebTraceSense to provide a comprehensive solution for web developers and researchers seeking to enhance web platforms through data-driven insights. The application of statistical and machine learning methods via the Django API to the interaction data facilitates the generation of highly tailored visualizations through the further refinement of the customisation process. These capabilities render WebTraceSense an invaluable tool for enhancing the user experience across a range of digital platforms, whereby detailed interaction logs inform and drive the personalisation process. This approach guarantees that each user interaction is not only recorded and examined but also effectively employed to enhance the user's navigational experience, thus promoting higher engagement and satisfaction. The visualization of behavioural traces is a well-documented phenomenon in scientific literature. For example, the work of Rzeszotarski and Kittur [19] demonstrated the potential of visualizing interaction data to uncover user behaviours. Nevertheless, despite these developments, there remains a notable deficiency in the availability of tools that facilitate the seamless identification of behavioural traces through ad-hoc visualizations, which are tailored to the specific requirements of researchers, game developers and website programmers. WebTraceSense addresses this gap by providing a robust platform that supports the creation of bespoke visualizations. The incorporation of sophisticated statistical and AI modules serves to augment the platform's capacity to furnish profound insights into user behaviour. Such modules are capable of applying sophisticated techniques to interaction data, thereby revealing subtle patterns that may not be immediately apparent through basic visualization methods
5.2. RQ2: What Are the Most Effective Statistical and Machine Learning Techniques for Analyzing User Interaction Data to Identify and Predict User Behavioral Patterns in Web Applications?
The analysis of user interaction data for the purpose of identifying and predicting behavioural patterns in web applications requires the application of a range of statistical and machine learning techniques. Among these, correlation analysis represents a fundamental statistical method, employed for the purpose of uncovering relationships between different interaction metrics. By calculating correlation coefficients, researchers can identify significant variables that have strong relationships with key user behaviours, such as task completion accuracy. This preliminary stage is of paramount importance, as it provides the foundation for subsequent data preprocessing and feature selection, ensuring that the analysis is focused on the most pertinent factors influencing user behaviour.
While not the focus of this case study, clustering techniques, including K-Means clustering [35] and Principal Component Analysis (PCA), are highly effective for identifying distinct user groups based on interaction data. K-Means clustering is an effective method for grouping users with similar interaction patterns, thereby identifying distinct behavioural segments. In contrast, PCA reduces the dimensionality of the data, thereby facilitating the visualization and interpretation of these clusters. The combination of these methods enables researchers to identify underlying patterns and segments within the user base, which are crucial for the development of targeted interventions and the delivery of personalised experiences in web applications.
In the context of predictive modelling, machine learning algorithms such as Random Forests and Gradient Boosting have been demonstrated to be highly effective [36]. These techniques are robust in handling both linear and non-linear relationships and can manage complex interactions between variables. For example, Random Forests provide insights into the importance of various features in predicting user behaviour, while Gradient Boosting can enhance prediction accuracy by iteratively improving the model. Collectively, these methods facilitate the development of models that not only explain user behaviour but also predict future actions, thereby enabling web applications to adapt dynamically to user needs and preferences.
6. Final Remarks
The WebTraceSense platform represents a comprehensive methodology for the analysis and visualization of web interaction data, thereby significantly enhancing the personalization capabilities of web applications, e-commerce sites and digital games. By leveraging user interaction logs, the platform facilitates a more profound comprehension of user behaviours, thereby enabling developers and researchers to tailor user experiences with greater precision. The integration of a four-step wizard form allows for the upload and meticulous analysis of these logs, where users can select specific interaction metrics to visualize, such as mouse clicks and keystrokes, along with choosing from various visualization options, including line charts, bar charts, and pie charts. Of particular note is the Dynamic Player feature, which provides a dynamic visual representation of user interactions over time on actual interface screenshots, including heatmaps that highlight frequent interaction points. Furthermore, the comprehensive architecture of the WebTraceSense platform, which encompasses robust backend and frontend components, is designed to facilitate the streamlining of operational workflows from data collection to visualization. The platform employs advanced statistical and machine learning techniques to process interaction data, which significantly aids in the identification and prediction of user behaviour patterns. Techniques such as correlation analysis and clustering facilitate the discernment of relationships between different user interactions and the grouping of users with similar behaviours, thereby enabling the implementation of targeted interventions. Additionally, predictive models are employed to predict user actions, offering insights that are crucial for the dynamic adaptation of web applications to enhance user satisfaction and engagement. This integration of sophisticated analytical tools ensures that WebTraceSense can provide continuous improvements to web platforms, leading to more refined and user-centred applications. A case study was conducted to evaluate the utility of the proposed platform for the generation of visualizations based on an existing dataset. The results demonstrated the effectiveness of the proposed approach.
In the future, it is anticipated that the platform will undergo further refinement in the future, including the development of additional visualizations. Moreover, the dynamic player will be enhanced through the generation of logs of the interface based on user interactions, thereby eliminating the necessity for screenshots for these visualizations. Additionally, improvements to the visualizations of the collective tendencies of the entire dataset are required in order to more effectively identify behavioural traces of users in the user interaction log.
Author Contributions
Conceptualization, D.P., A.N. and H.P.; methodology, D.P., A.N. and H.P; software, D.P., and A.N.; validation, D.P. and A.N.; formal analysis, D.P., A.N. and W.B.; investigation, D.P., and A.N.; resources, D.P.; data curation, D.P. and A.N.; writing—original draft preparation, D.P.; writing—review and editing, D.P. and A.N.; visualization, D.P., A.N. and W.B.; supervision, D.P., A.N. and H.P.; project administration, D.P and H.P.; funding acquisition, H.P. All authors have read and agreed to the published version of the manuscript.
Funding
This work is co-financed by Component 5 - Capitalization and Business Innovation, integrated in the Resilience Dimension of the Recovery and Resilience Plan within the scope of the Recovery and Resilience Mechanism (MRR) of the European Union (EU), framed in the Next Generation EU, for the period 2021 - 2026, within project HfPT, with reference 41.
Institutional Review Board Statement
Not applicable.
Informed Consent Statement
Not applicable.
Acknowledgments
The authors would like to thank the students Bernardo Pinto, Francisco Sousa, Gonçalo Silva, José Marinho, Marcelo Apolinário and Aman Kumar for their assistance in the development of several components for the WebTraceSense system, which is described in this article.
Conflicts of Interest
The authors declare no conflicts of interest.
References
- Smith, A.D.; Shock, J.R.; Beaves, R.G. Customer relationship management and the impact of e-coupons on B2C retail markets. Int. J. Bus. Inf. Syst. 2019, 30, 203–231. [Google Scholar] [CrossRef]
- Nguyen, T. (Kellan); Hsu, P.F. More Personalized, More Useful? Reinvestigating Recommendation Mechanisms in E-Commerce. Int. J. Electron. Commer. 2022, 26, 90–122. [Google Scholar] [CrossRef]
- Paraschos, P.D.; Koulouriotis, D.E. Game Difficulty Adaptation and Experience Personalization: A Literature Review. Int. J. Hum.–Comput. Interact. 2022, 39, 1–22. [Google Scholar] [CrossRef]
- Aria, R.; Archer, N.; Khanlari, M.; Shah, B. Influential Factors in the Design and Development of a Sustainable Web3/Metaverse and Its Applications. Future Internet. 2023. [CrossRef]
- Lamprinou, D.; Fotini, P. Gamification design framework based on SDT for student motivation. In Proceedings of the 2015 International Conference on Interactive Mobile Communication Technologies and Learning (IMCL); IEEE: pp. 406-410, 2015. [Google Scholar]
- Paredes, H.; Paulino, D.; Barroso, J.; Abrantes, C.; Machado, I.; Silva, I. Supervised physical exercise therapy of peripheral artery disease patients: M-health challenges and opportunities. In Proceedings of the 54th Hawaii International Conference on System Sciences, HICSS 2021, Kauai, Hawaii, USA, January 5, 2021; pp. 1–10. [Google Scholar] [CrossRef]
- Zanker, M.; Rook, L.; Jannach, D. Measuring the impact of online personalisation: Past, present and future. Int. J. Hum.-Comput. Stud. 2019, 131, 160–168. [Google Scholar] [CrossRef]
- Torous, J.; Kiang, M.; Lorme, J.; Onnela, J.P. New tools for new research in psychiatry: A scalable and customizable platform to empower data-driven smartphone research. JMIR Ment. Health 2016, 3, e5165. [Google Scholar] [CrossRef] [PubMed]
- Onnela, J.P.; Rauch, S. Harnessing Smartphone-Based Digital Phenotyping to Enhance Behavioral and Mental Health. Neuropsychopharmacol. 2016, 41, 1691–1696. [Google Scholar] [CrossRef] [PubMed]
- Mohr, D.C.; Zhang, M.; Schueller, S.M. Personal sensing: Understanding mental health using ubiquitous sensors and machine learning. Annu. Rev. Clin. Psychol. 2017. [CrossRef] [PubMed]
- MacCormick, D.; Zaman, L. Echo: Analyzing gameplay sessions by reconstructing them from recorded data. In Proceedings of the Annual Symposium on Computer-Human Interaction in Play; 2020; pp. 281–293. [Google Scholar]
- Paulino, D.; Guimarães, D.; Correia, A.; Ribeiro, J.; Barroso, J.; Paredes, H. A model for cognitive personalization of microtask design. Sensors. 2023, 23, 3571. [Google Scholar] [CrossRef]
- Arya, S.S.; Dias, S.B.; Jelinek, H.F.; Hadjileontiadis, L.J.; Pappa, A.M. The convergence of traditional and digital biomarkers through AI-assisted biosensing: A new era in translational diagnostics? Biosens. Bioelectron. 2023, 115387. [Google Scholar] [CrossRef]
- Insel, T.R. Digital phenotyping: a global tool for psychiatry. World Psychiatry 2018, 17, 276. [Google Scholar] [CrossRef] [PubMed]
- Bufano, P.; Laurino, M.; Said, S.; Tognetti, A.; Menicucci, D. Digital phenotyping for monitoring mental disorders: systematic review. J. Med. Internet Res. 2023, 25, e46778. [Google Scholar] [CrossRef] [PubMed]
- Kroenke, K.; Spitzer, R.L.; Williams, J.B. The PHQ-9: Validity of a brief depression severity measure. J. Gen. Intern. Med. 2001, 16, 606–613. [Google Scholar] [CrossRef] [PubMed]
- Mastoras, R.E.; Iakovakis, D.; Hadjidimitriou, S.; Charisis, V.; Kassie, S.; Alsaadi, T.; Hadjileontiadis, L. Touchscreen typing pattern analysis for remote detection of the depressive tendency. Sci. Rep. 2019, 9, 13414. [Google Scholar] [CrossRef]
- Rodríguez-de Pablo, C.; Savić, A.; Keller, T. Game-based assessment in upper-limb post-stroke telerehabilitation. Biosyst. Biorobot. 2017, 15, 413–417. [Google Scholar]
- Rzeszotarski, J.M.; Kittur, A. Instrumenting the crowd: using implicit behavioral measures to predict task performance. In Proceedings of the 24th annual ACM symposium on User interface software and technology; 2011. [Google Scholar]
- Paulino, D.; Correia, A.; Barroso, J.; Paredes, H. Cognitive personalization for online microtask labor platforms: A systematic literature review. User Model. User-Adapt. Interact. 2023; 1–42. [Google Scholar] [CrossRef]
- Gómez, M.J.; Ruipérez-Valiente, J.A.; García Clemente, F.J. A systematic literature review of game-based assessment studies: Trends and challenges. IEEE Trans. Learn. Technol. 2023. [CrossRef]
- Gomez, M.J.; Ruipérez-Valiente, J.A.; Martinez, P.A.; Kim, Y.J. Exploring the affordances of sequence mining in educational games. In Proceedings of the 8th International Conference on Technological Ecosystems for Enhancing Multiculturality; 2020; pp. 648–654. [Google Scholar]
- De Cnudde, S.; Ramon, Y.; Martens, D.; Provost, F. Deep learning on big, sparse, behavioral data. Big Data 2019, 7, 286–307. [Google Scholar] [CrossRef] [PubMed]
- Ussath, M.; Jaeger, D.; Cheng, F.; Meinel, C. Identifying suspicious user behavior with neural networks. In Proceedings of the 2017 IEEE 4th International Conference on Cyber Security and Cloud Computing (CSCloud), June 2017; IEEE: pp. 255-263. [Google Scholar]
- Koehn, D.; Lessmann, S.; Schaal, M. Predicting online shopping behaviour from clickstream data using deep learning. Expert Syst. Appl. 2020, 150, 113342. [Google Scholar] [CrossRef]
- Faustino, J.; Adriano, D.; Amaro, R.; Pereira, R.; da Silva, M.M. DevOps benefits: A systematic literature review. Software: Pract. Exp. 2022, 52, 1905–1926. [Google Scholar]
- McKinney, W. Data Structures for Statistical Computing in Python. In Proceedings of the 9th Python in Science Conference, Austin, TX, USA, 28 June–3 July 2010; pp. 51–56. [Google Scholar]
- Harris, C.R.; Millman, K.J.; van der Walt, S.J.; et al. Array programming with NumPy. Nature 2020, 585, 357–362. [Google Scholar] [CrossRef]
- Pedregosa, F.; Varoquaux, G.; Gramfort, A.; et al. Scikit-learn: Machine Learning in Python. J. Mach. Learn. Res. 2011, 12, 2825–2830. [Google Scholar]
- Virtanen, P.; Gommers, R.; Oliphant, T.E.; et al. SciPy 1.0: Fundamental Algorithms for Scientific Computing in Python. Nat. Methods 2020, 17, 261–272. [Google Scholar] [CrossRef]
- Hunter, J.D. Matplotlib: A 2D Graphics Environment. Comput. Sci. Eng. 2007, 9, 90–95. [Google Scholar] [CrossRef]
- Waskom, M. Seaborn: statistical data visualization. J. Open Source Softw. 2021, 6, 3021. [Google Scholar] [CrossRef]
- Wan, X.; Wang, W.; Liu, J.; Tong, T. Estimating the sample mean and standard deviation from the sample size, median, range and/or interquartile range. BMC Med. Res. Methodol. 2014, 14, 1–13. [Google Scholar]
- Hemphill, J.F. Interpreting the Magnitudes of Correlation Coefficients. Am. Psychol. 2003, 58, 78–79. [Google Scholar] [CrossRef] [PubMed]
- Jain, A.K. Data clustering: 50 years beyond K-means. Pattern Recognit. Lett. 2010, 31, 651–666. [Google Scholar]
- Chen, T.; Guestrin, C. XGBoost: A scalable tree boosting system. In Proceedings of the 22nd ACM SIGKDD International Conference on Knowledge Discovery and Data Mining, San Francisco, CA, USA, 13-17 August 2016; pp. 785–794. [Google Scholar] [CrossRef]
Figure 1.
Component Diagram for the WebTraceSense System.
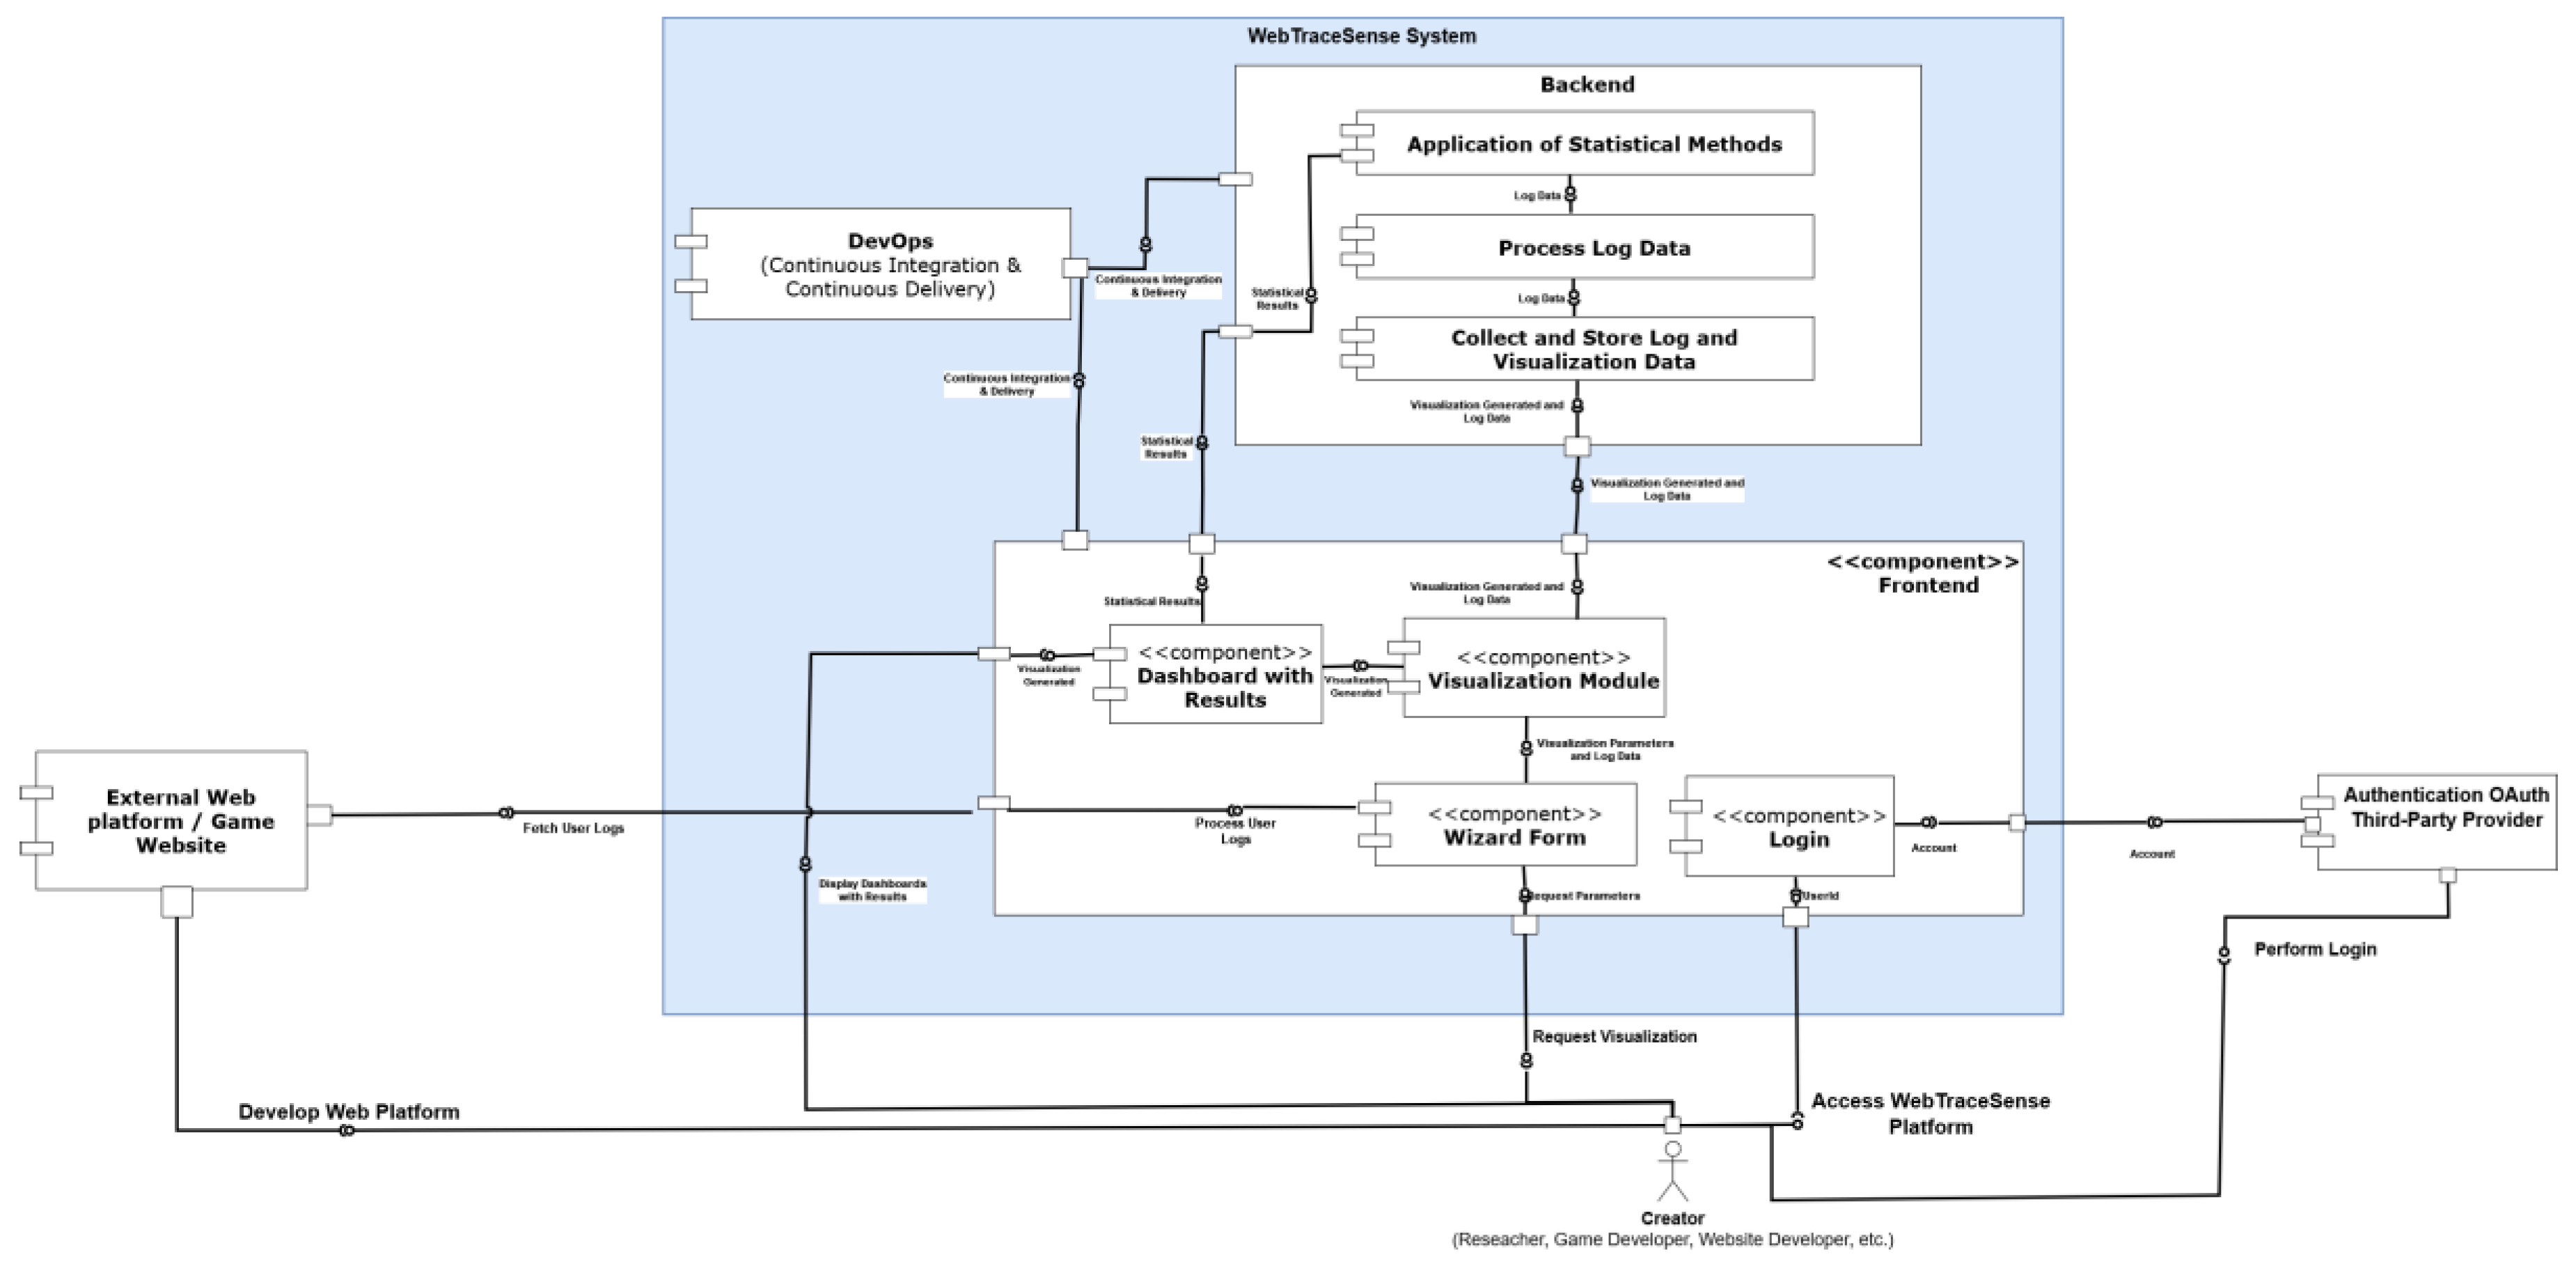
Figure 2.
UML Activity Diagram for the Visualization Module.
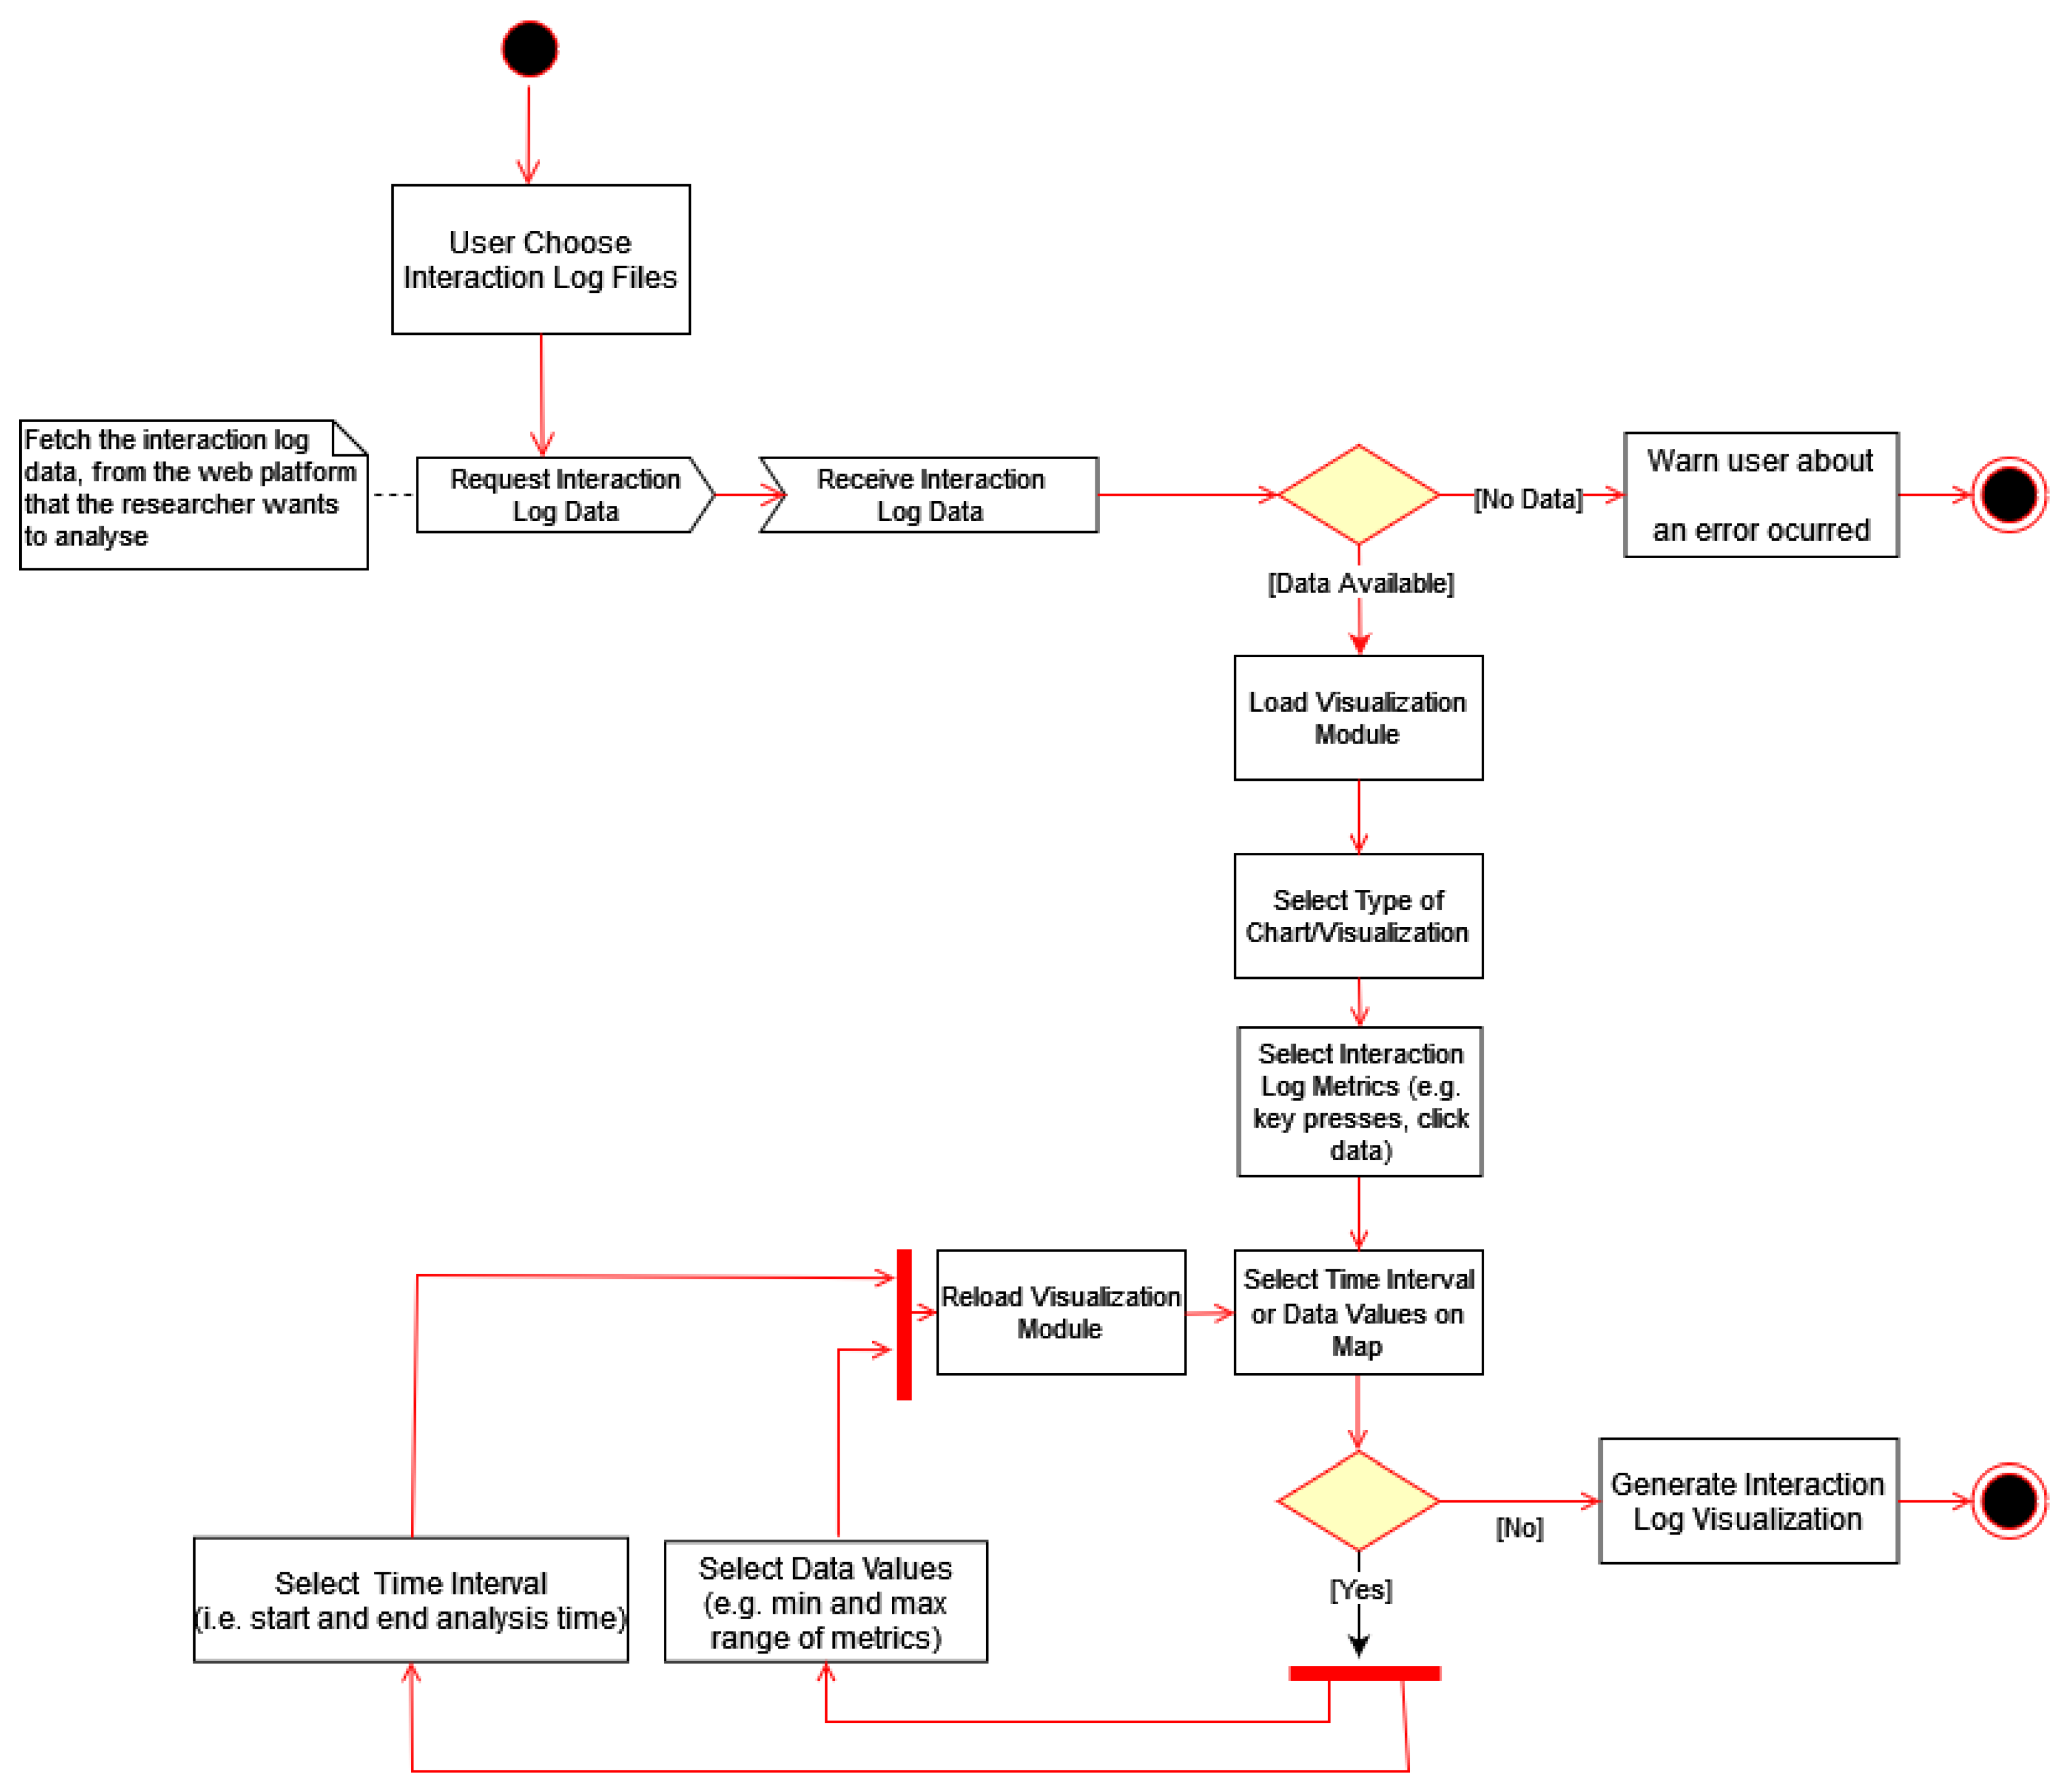
Figure 3.
UML Sequence Diagram for the interaction between the Visualization and Statistics modules.
Figure 3.
UML Sequence Diagram for the interaction between the Visualization and Statistics modules.
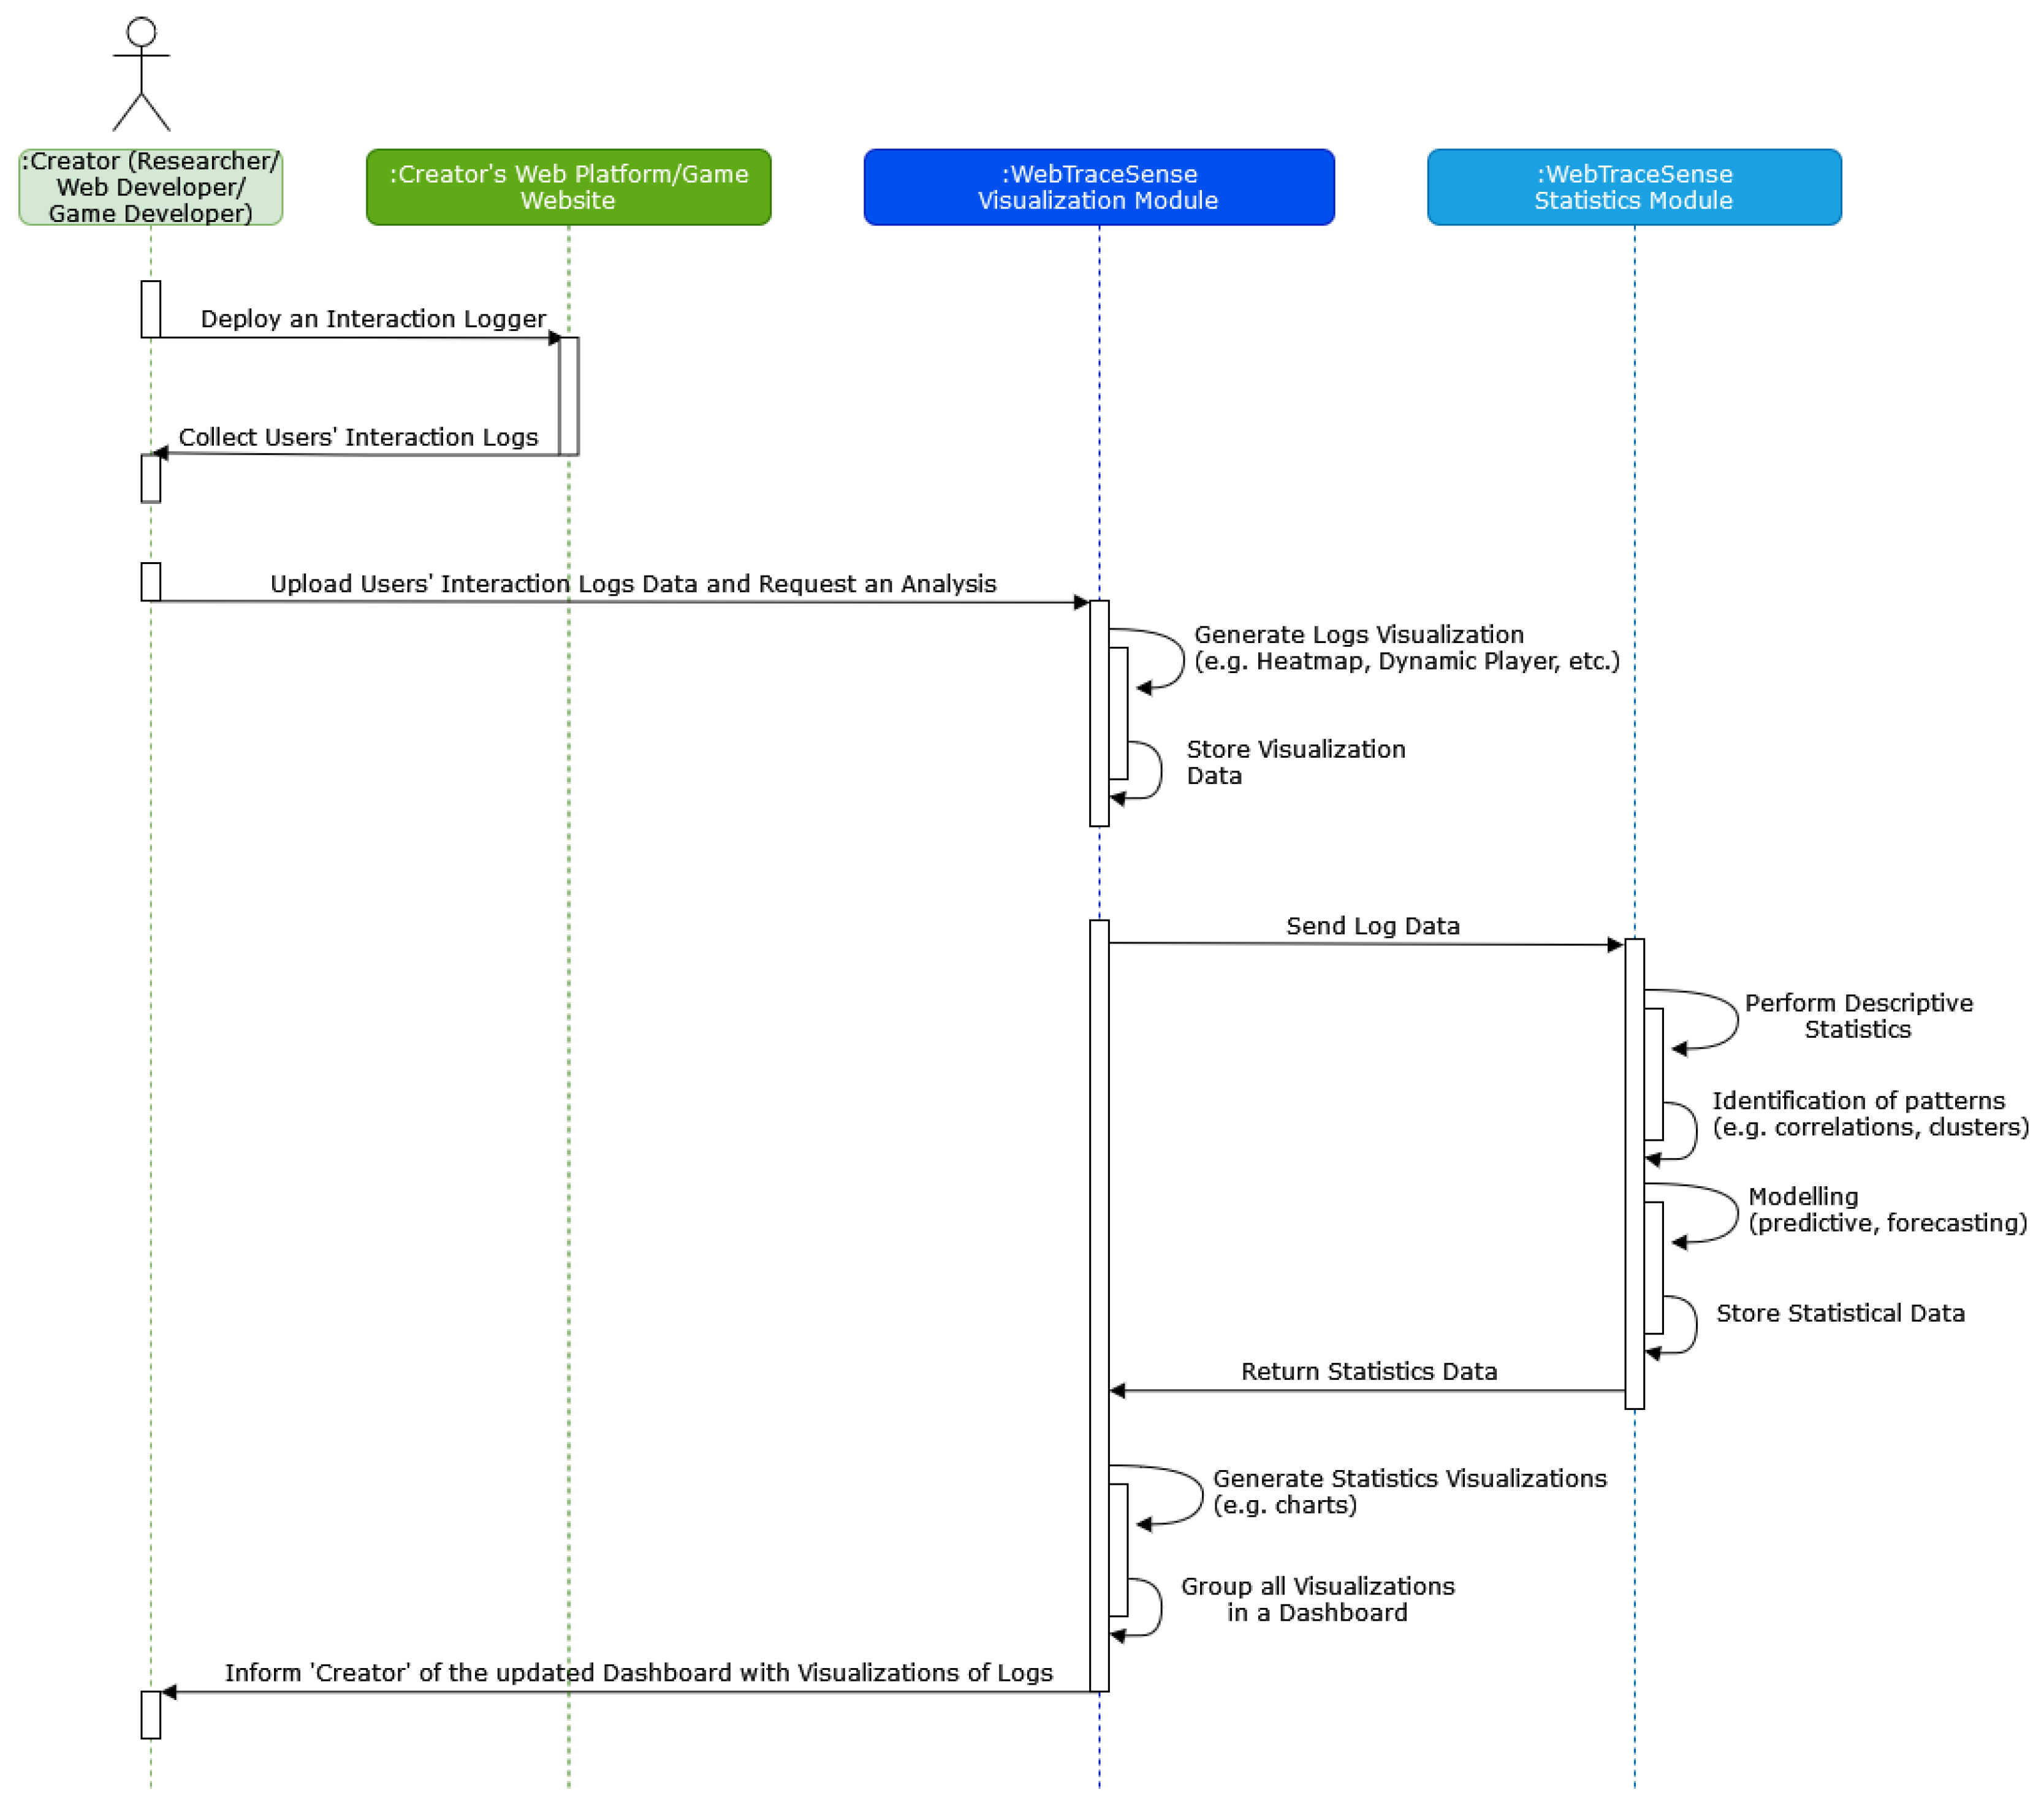
Figure 4.
Overview of the WebTraceSense (Top left: Home Screen; Top right: Login screen with Auth0; Bottom left: CRUD visualization table; Bottom right: Wizard form for generating visualizations).
Figure 4.
Overview of the WebTraceSense (Top left: Home Screen; Top right: Login screen with Auth0; Bottom left: CRUD visualization table; Bottom right: Wizard form for generating visualizations).
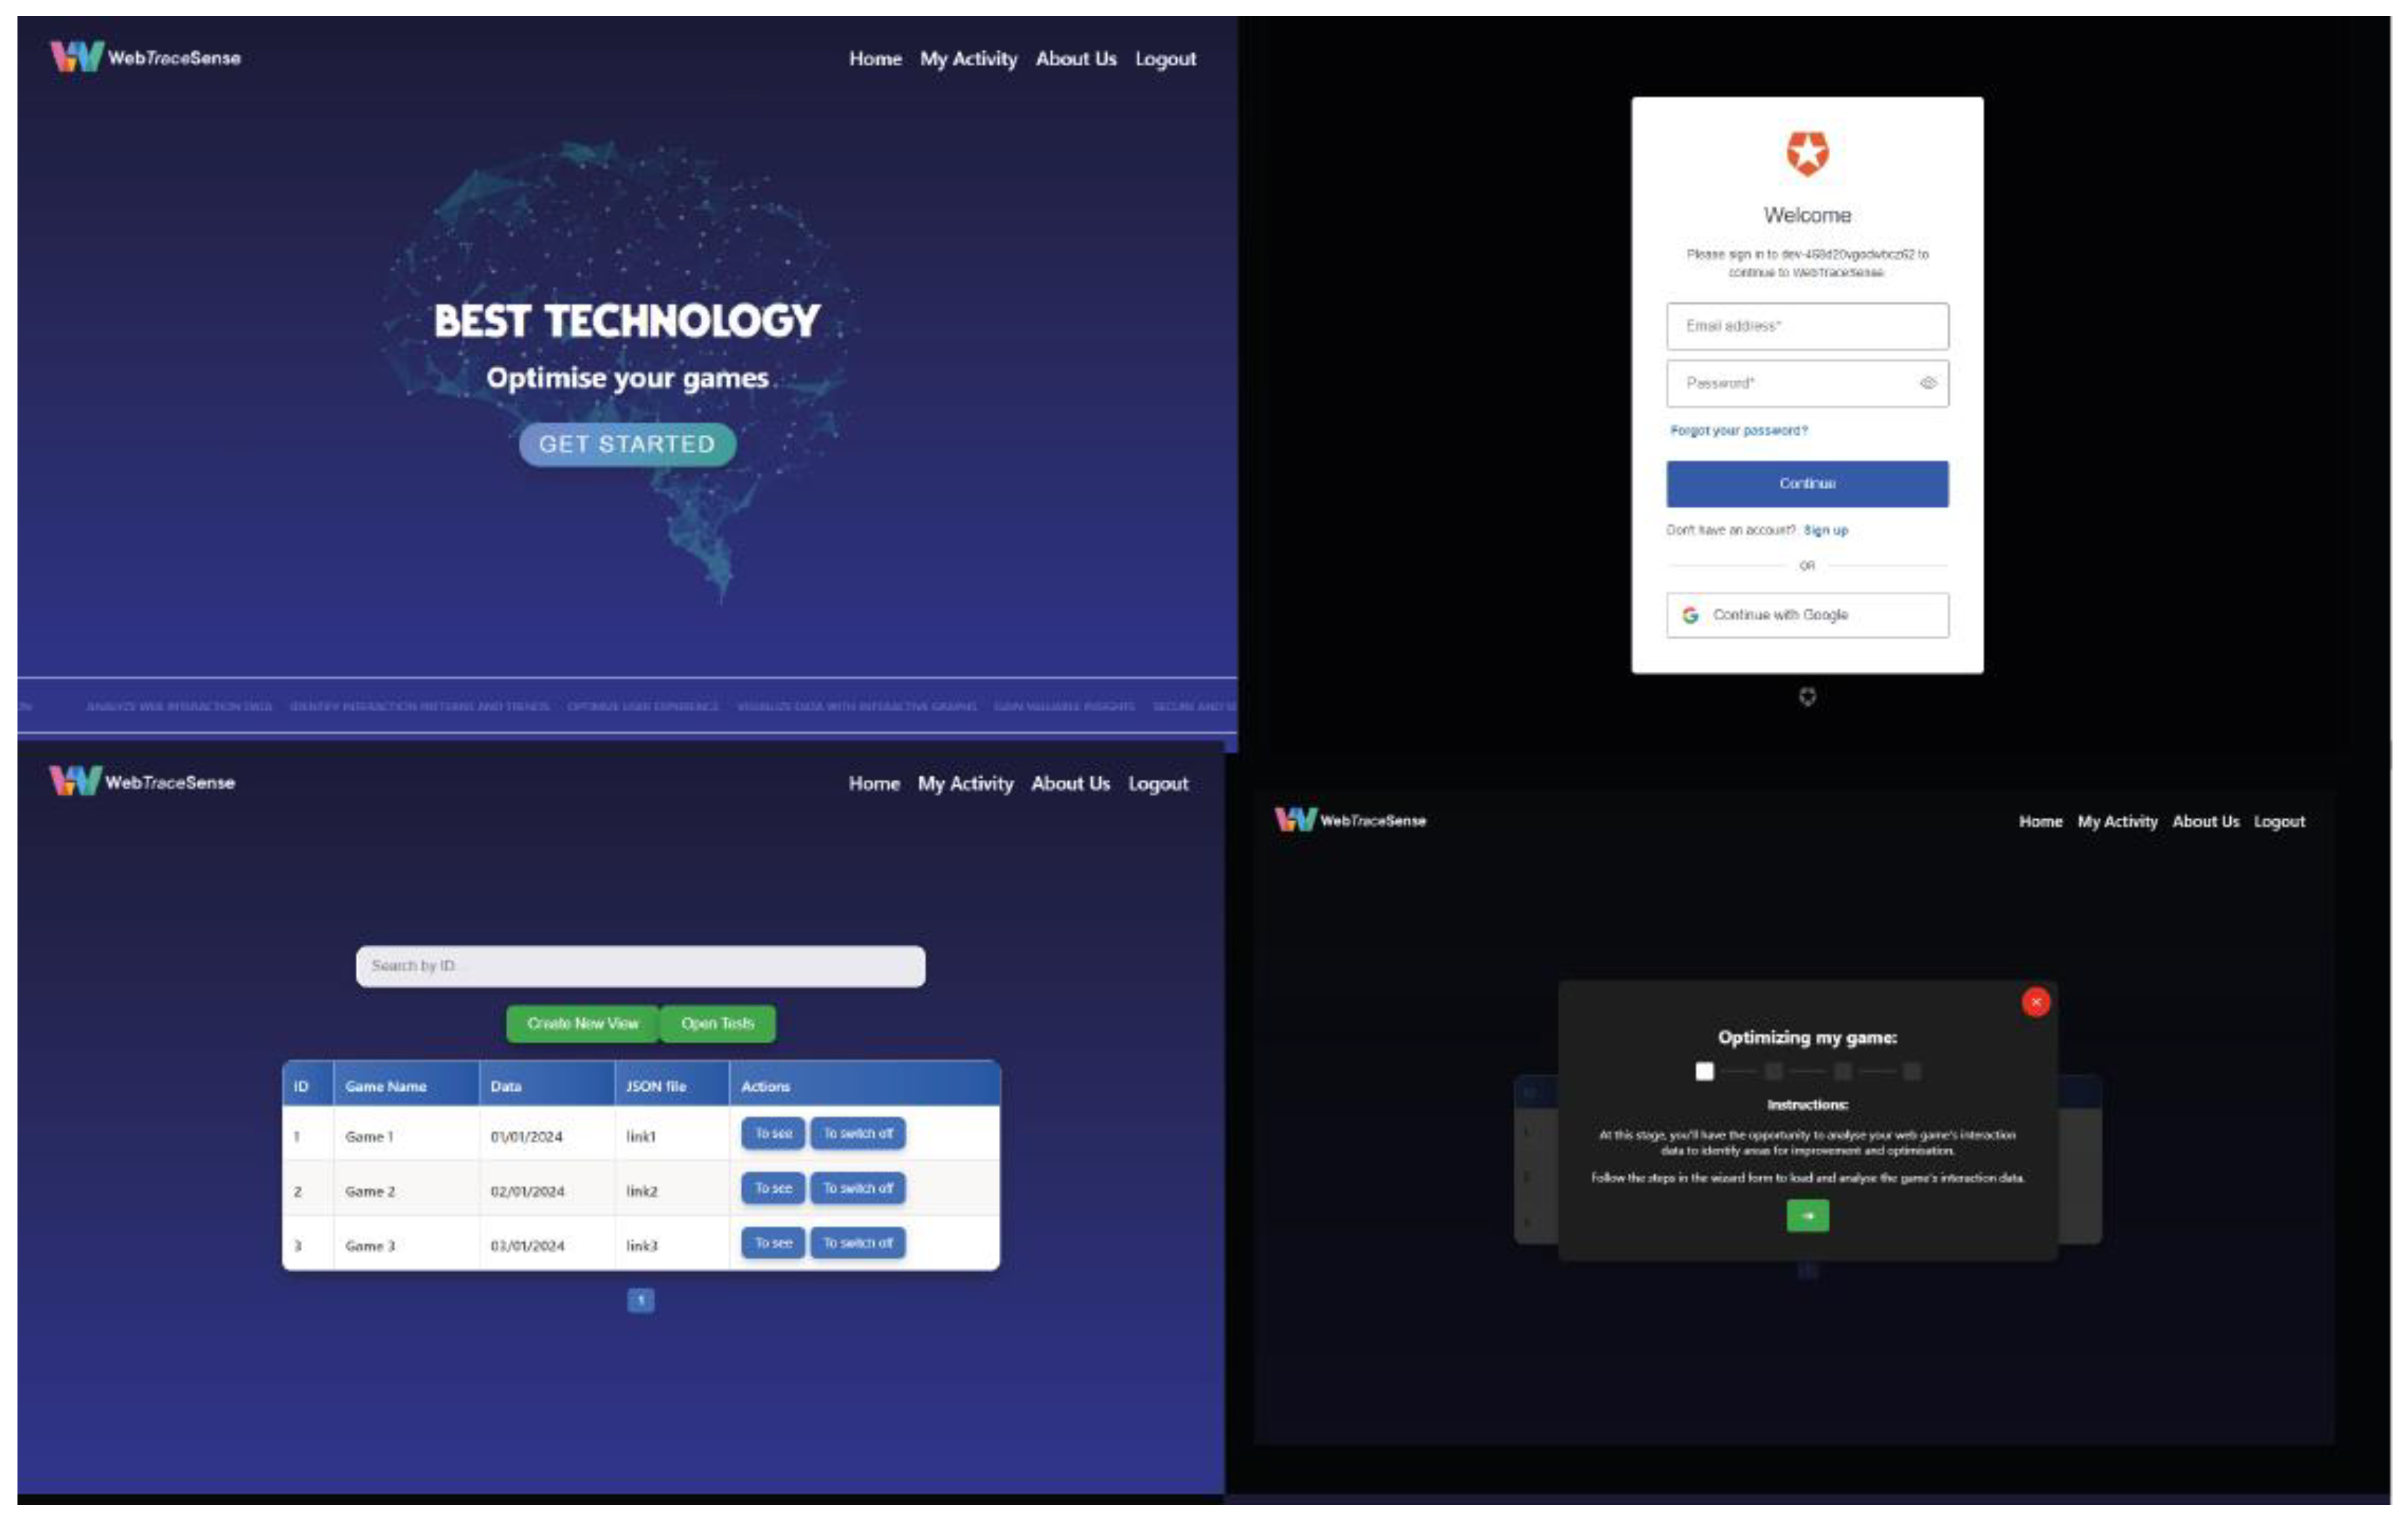
Figure 5.
A line chart showing one user log for the version with personalization (left) and another for the version without personalization (right). The user log is from the Paulino et al. [12] dataset.
Figure 5.
A line chart showing one user log for the version with personalization (left) and another for the version without personalization (right). The user log is from the Paulino et al. [12] dataset.
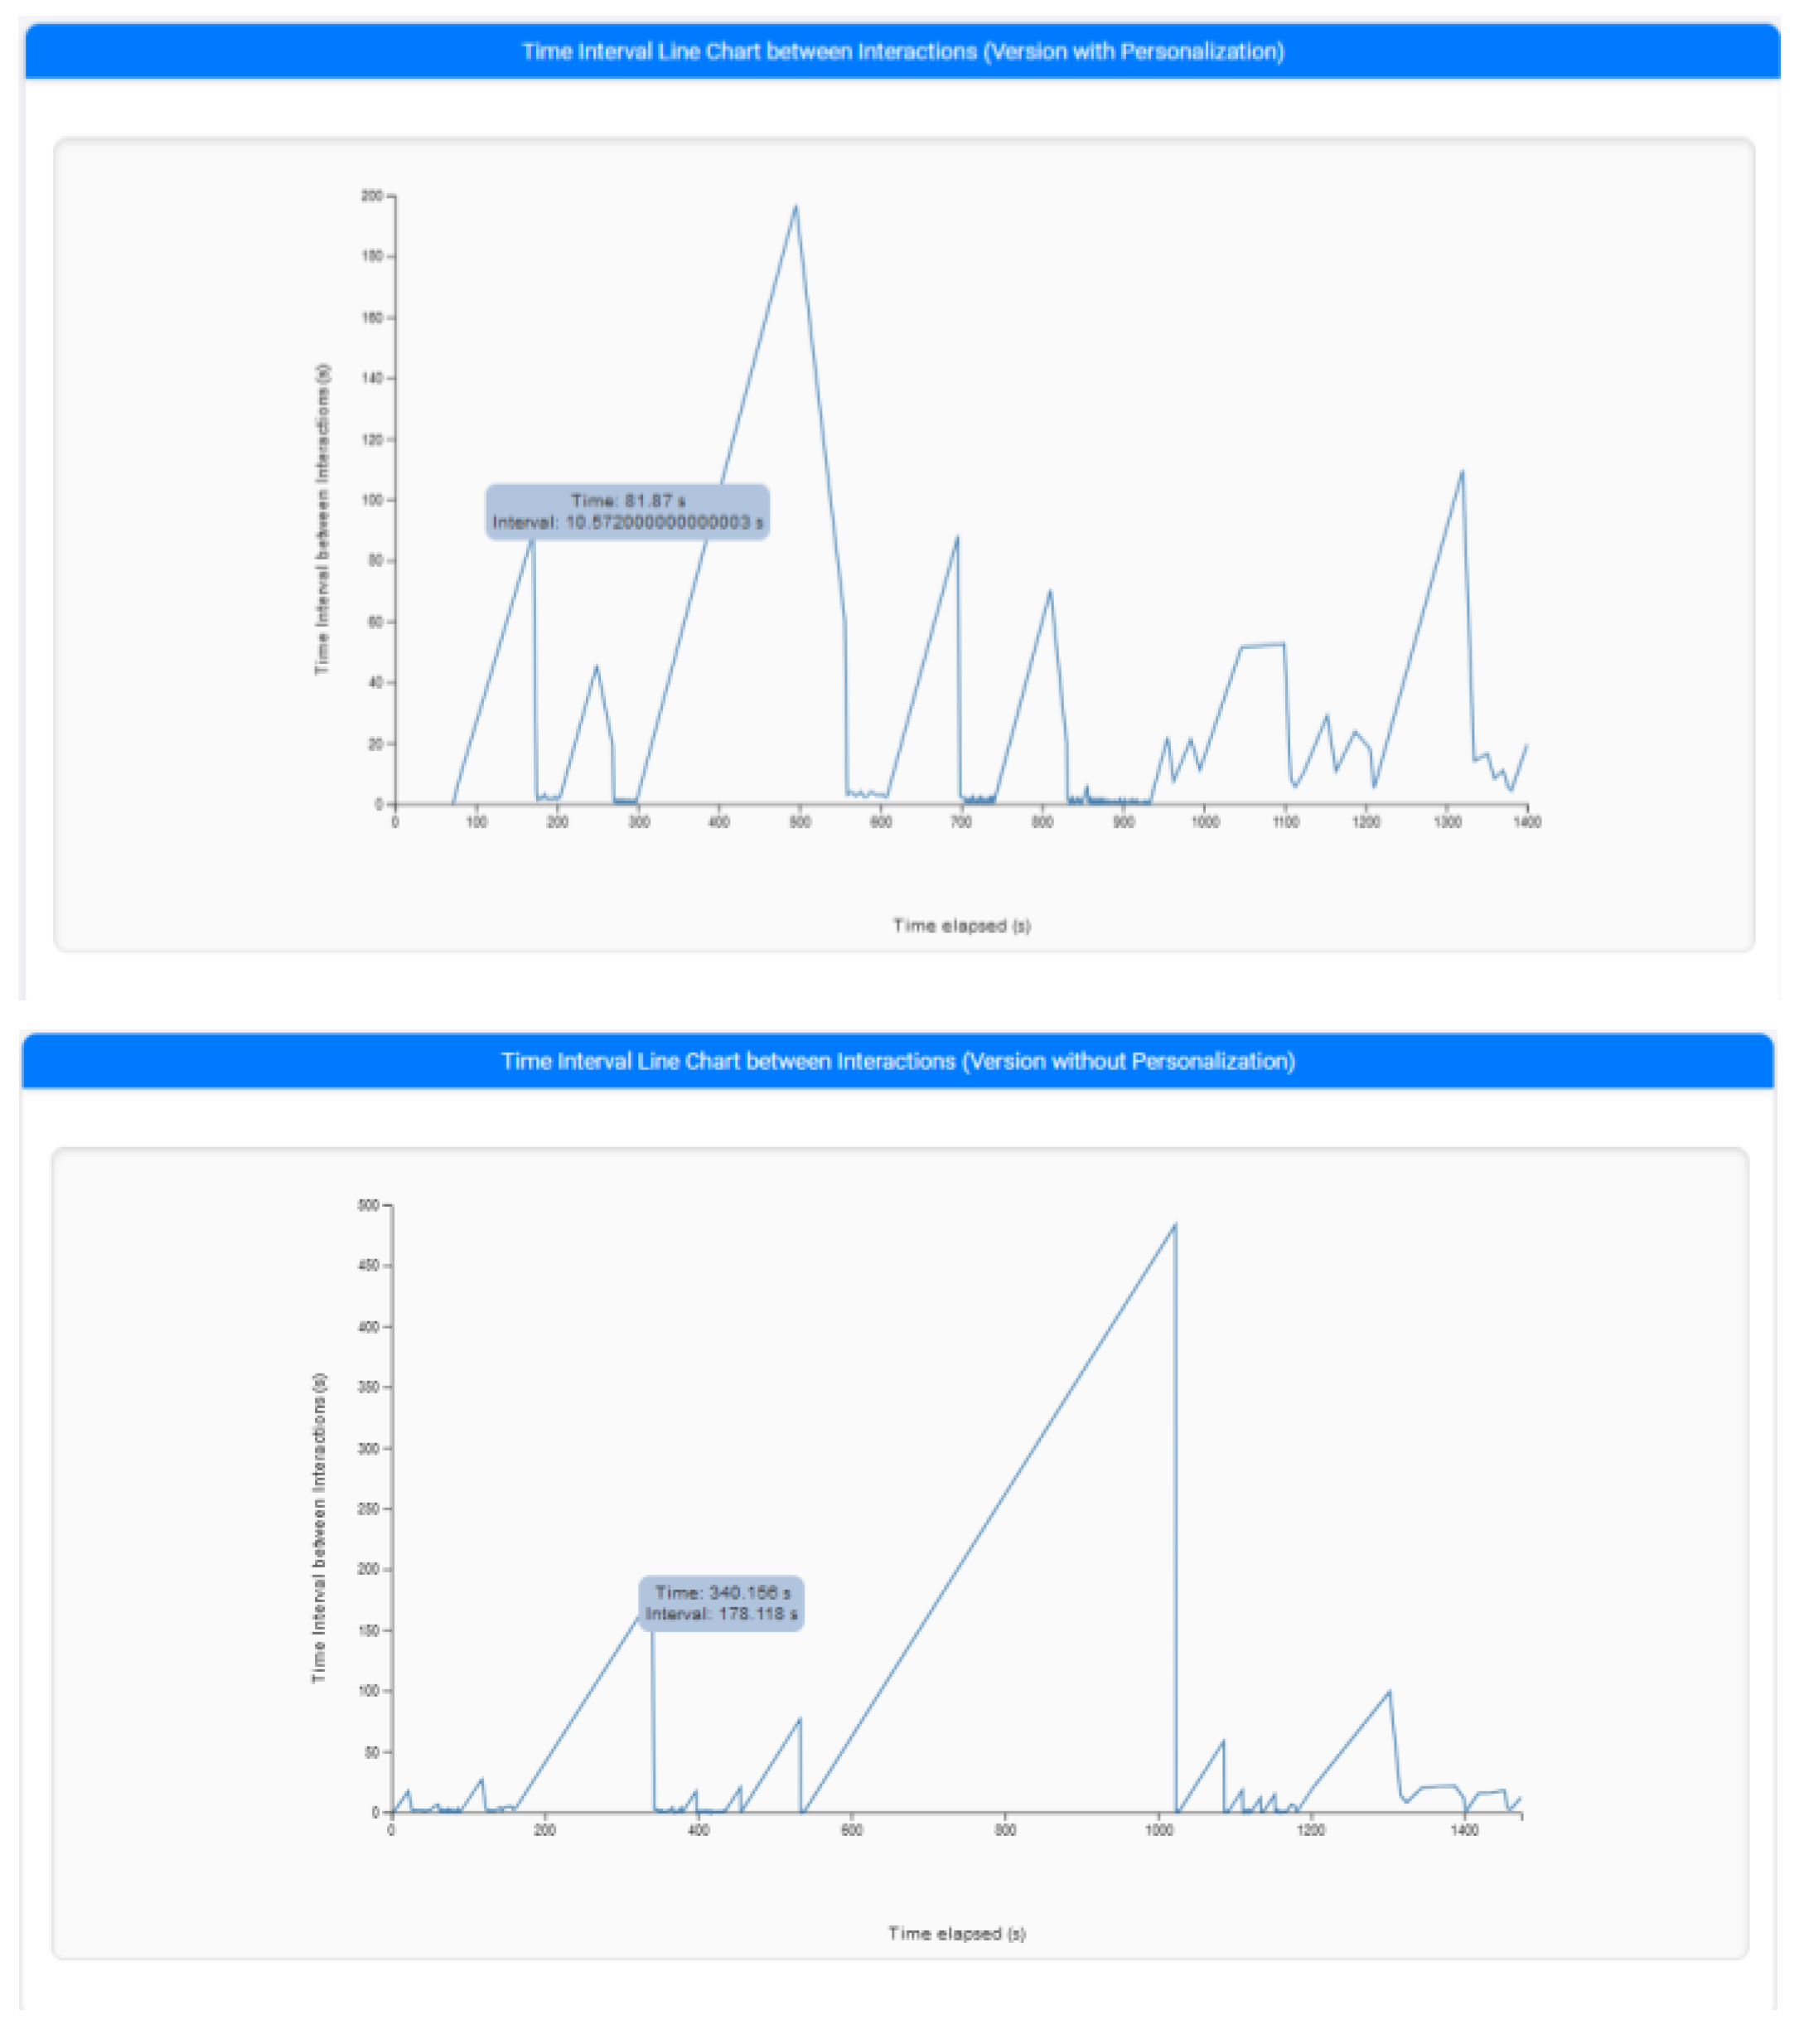
Figure 6.
Dynamic player with the heatmap option for the visualization of a user log based on the scenario of Paulino et al. [12].
Figure 6.
Dynamic player with the heatmap option for the visualization of a user log based on the scenario of Paulino et al. [12].
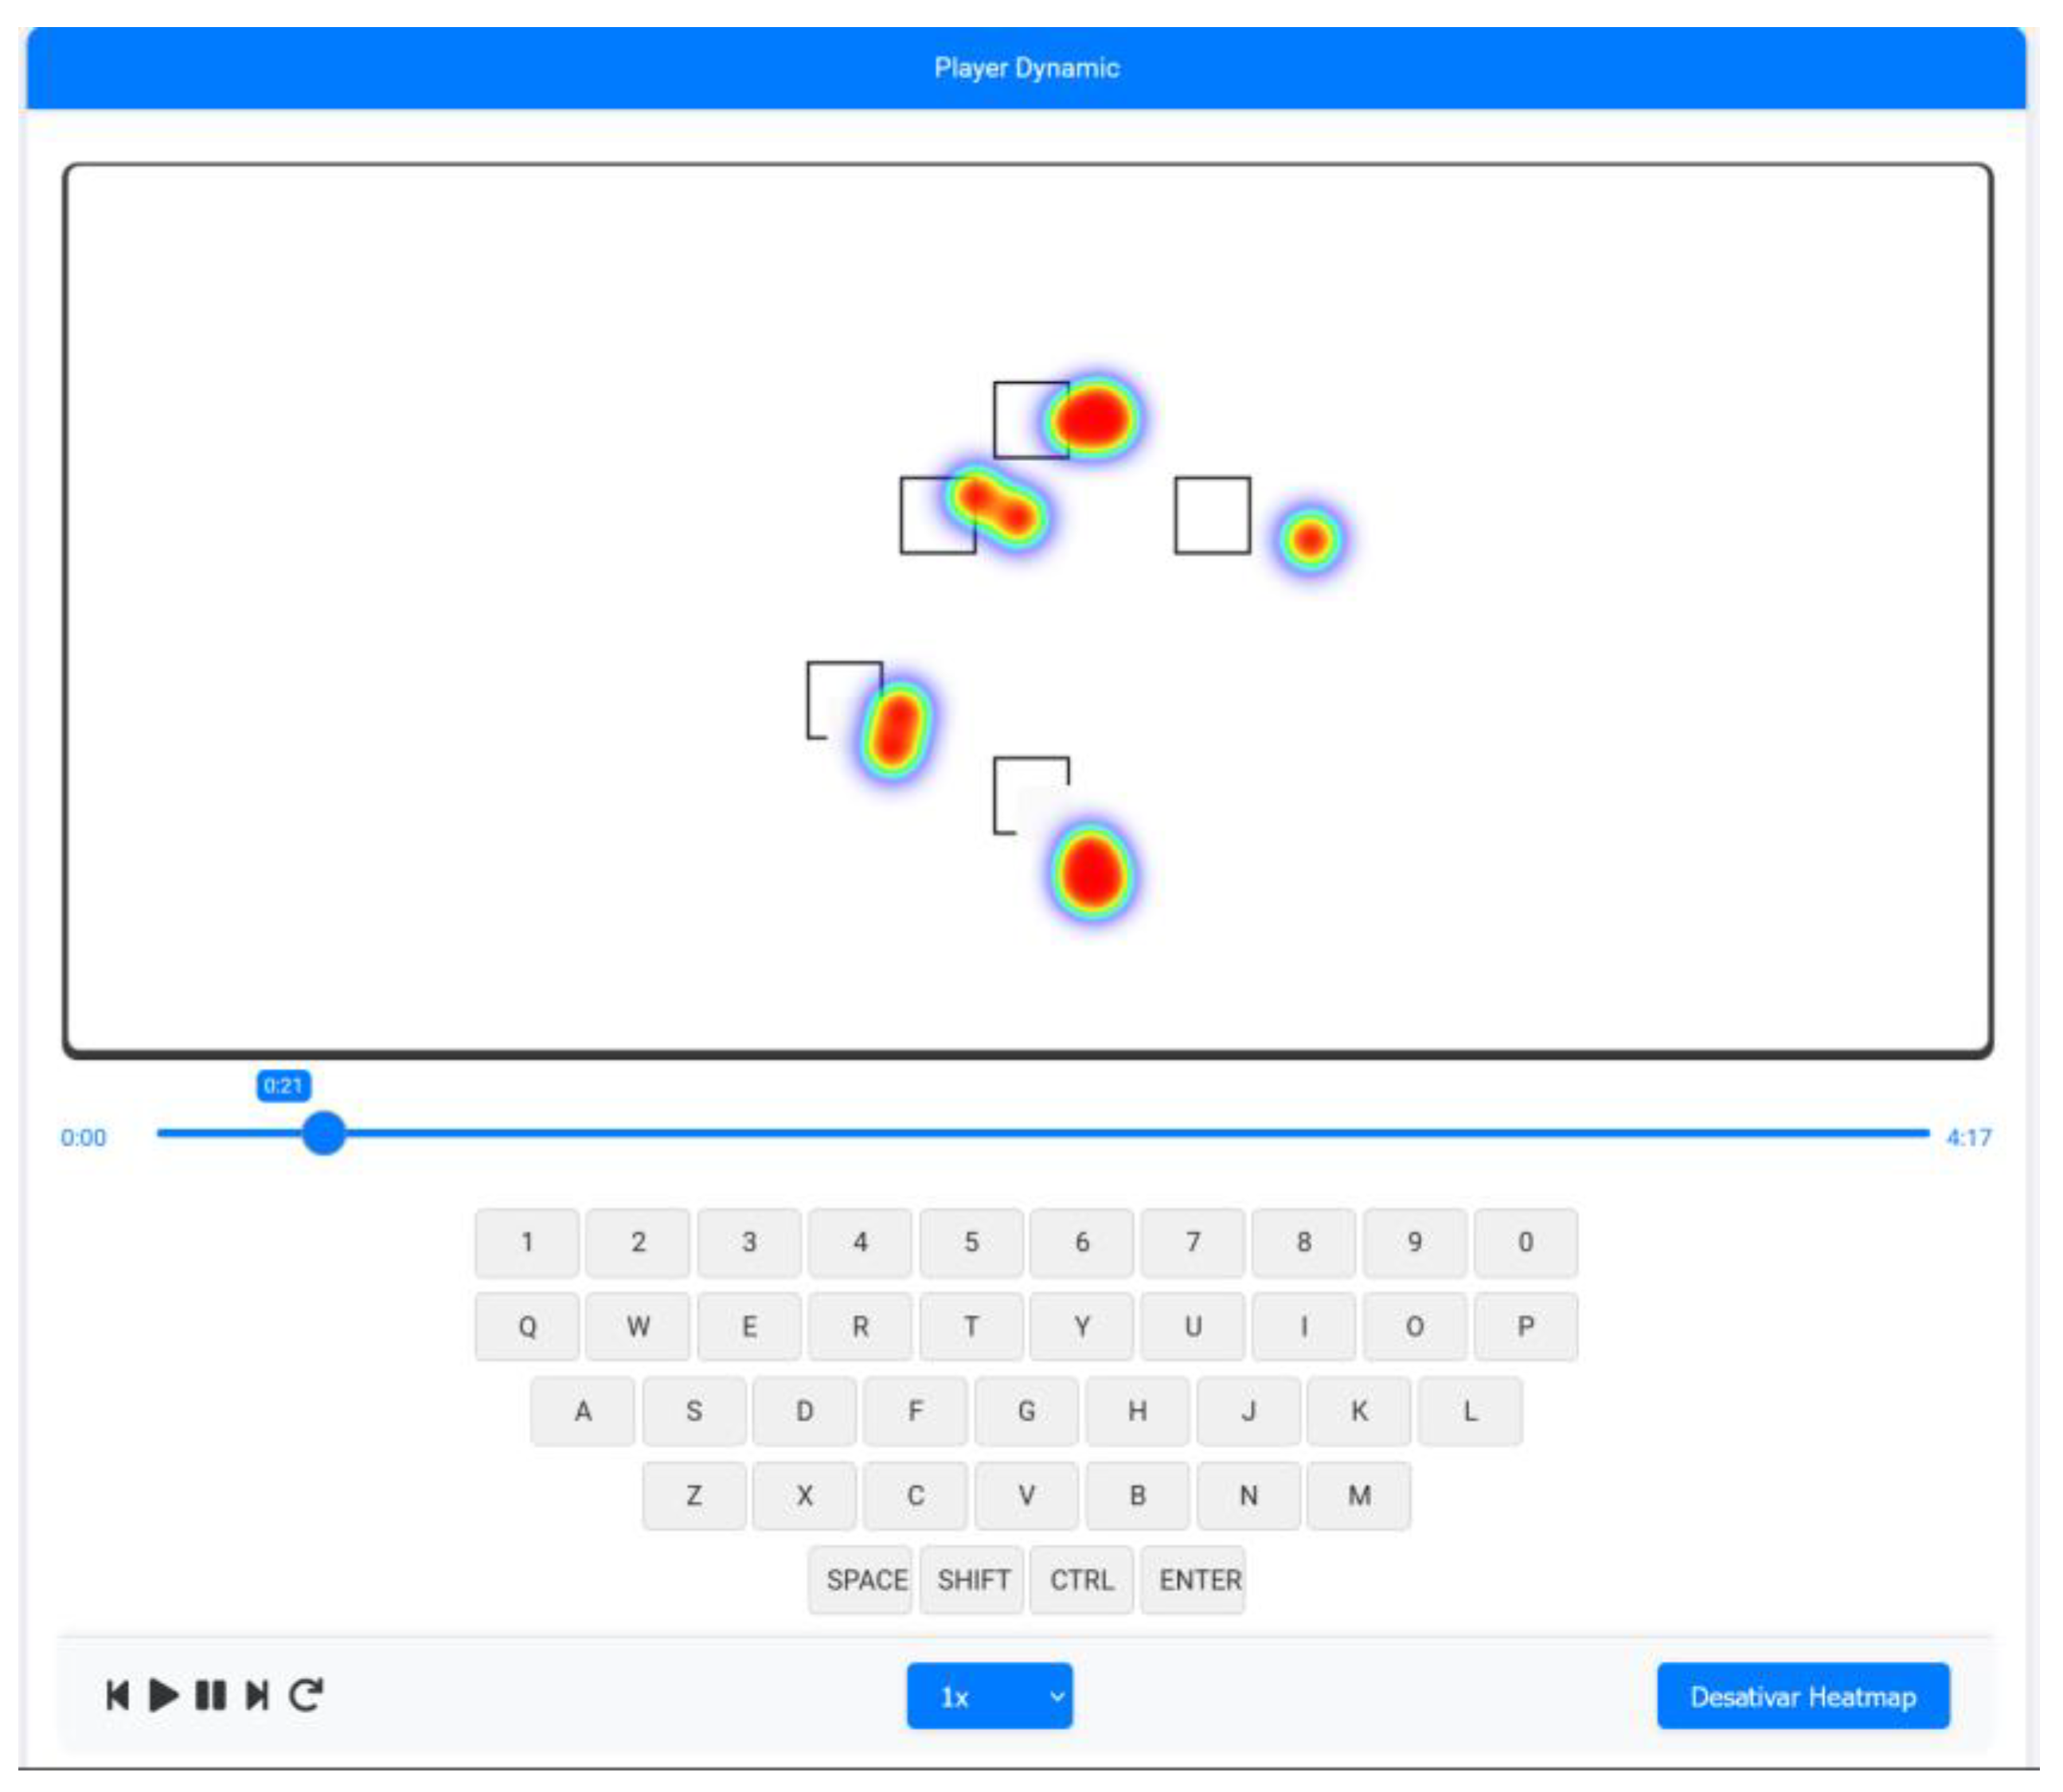
Figure 7.
Clusters of microtask performance metrics with centroids (Interquartile Range Method [33]).
Figure 7.
Clusters of microtask performance metrics with centroids (Interquartile Range Method [33]).
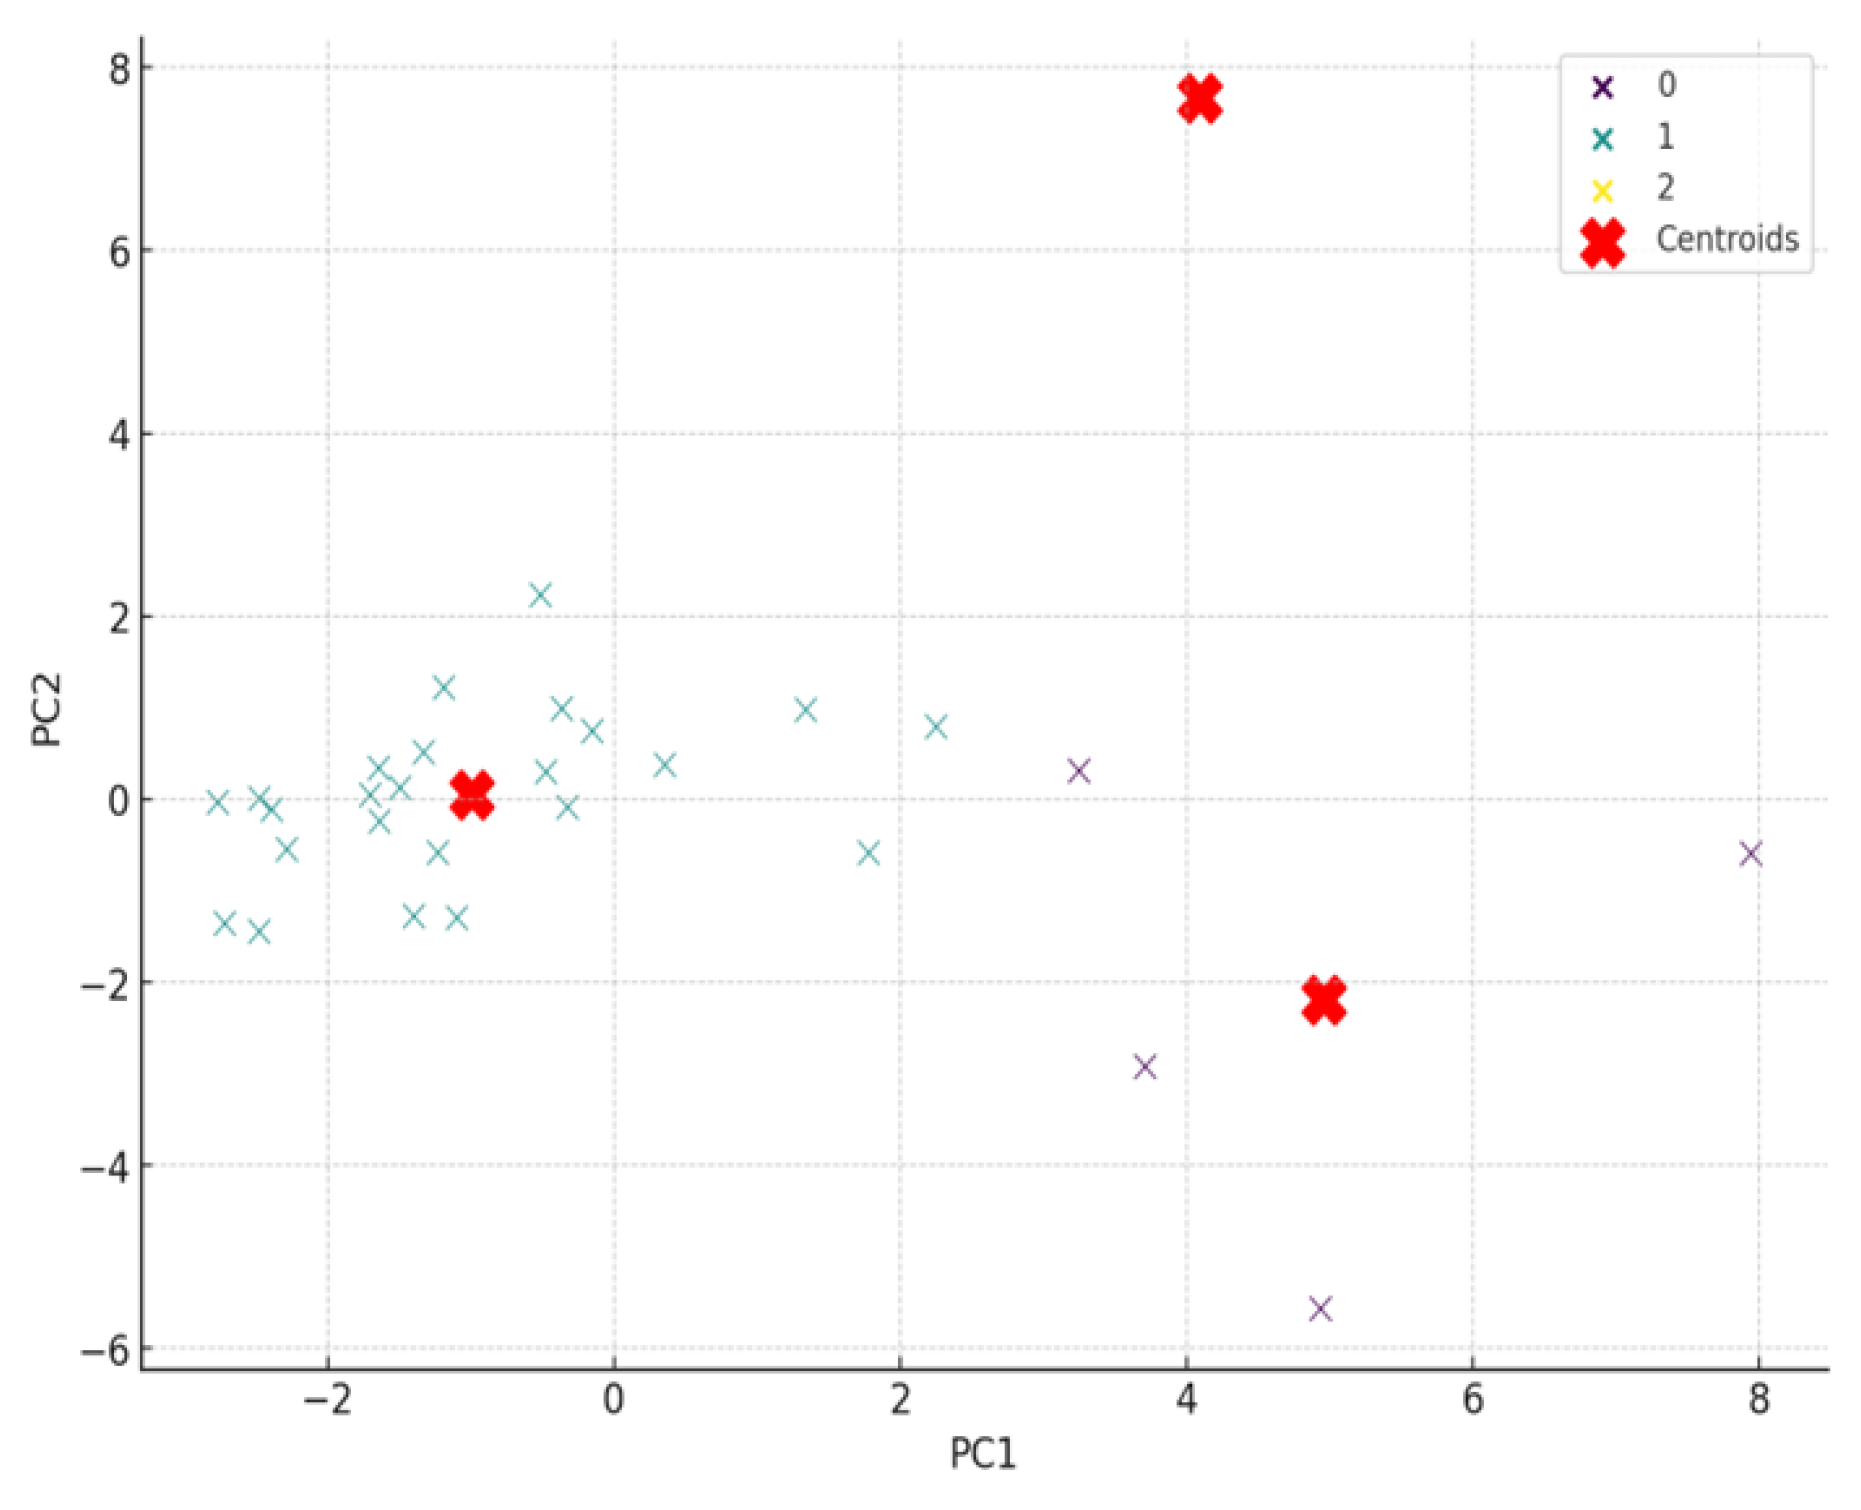
Figure 8.
Clusters centers (Left: version with personalization; Right: version without personalization).
Figure 8.
Clusters centers (Left: version with personalization; Right: version without personalization).
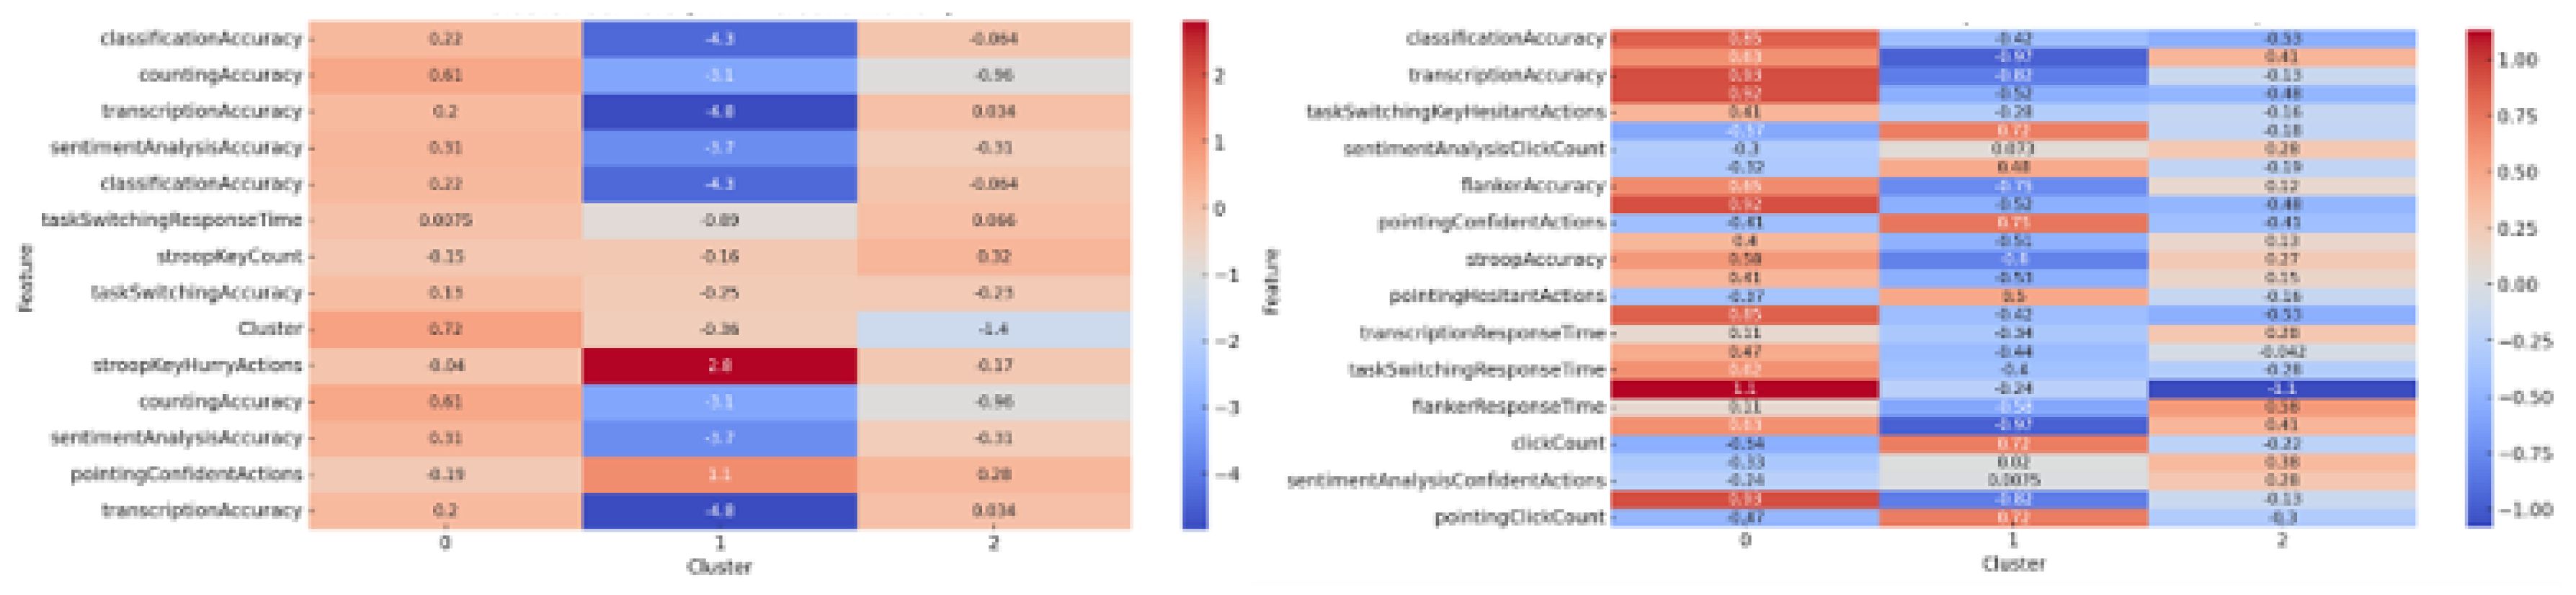
Figure 9.
Pair plot of selected variables (accuracy of classification, counting, transcription and sentiment analysis microtasks).
Figure 9.
Pair plot of selected variables (accuracy of classification, counting, transcription and sentiment analysis microtasks).
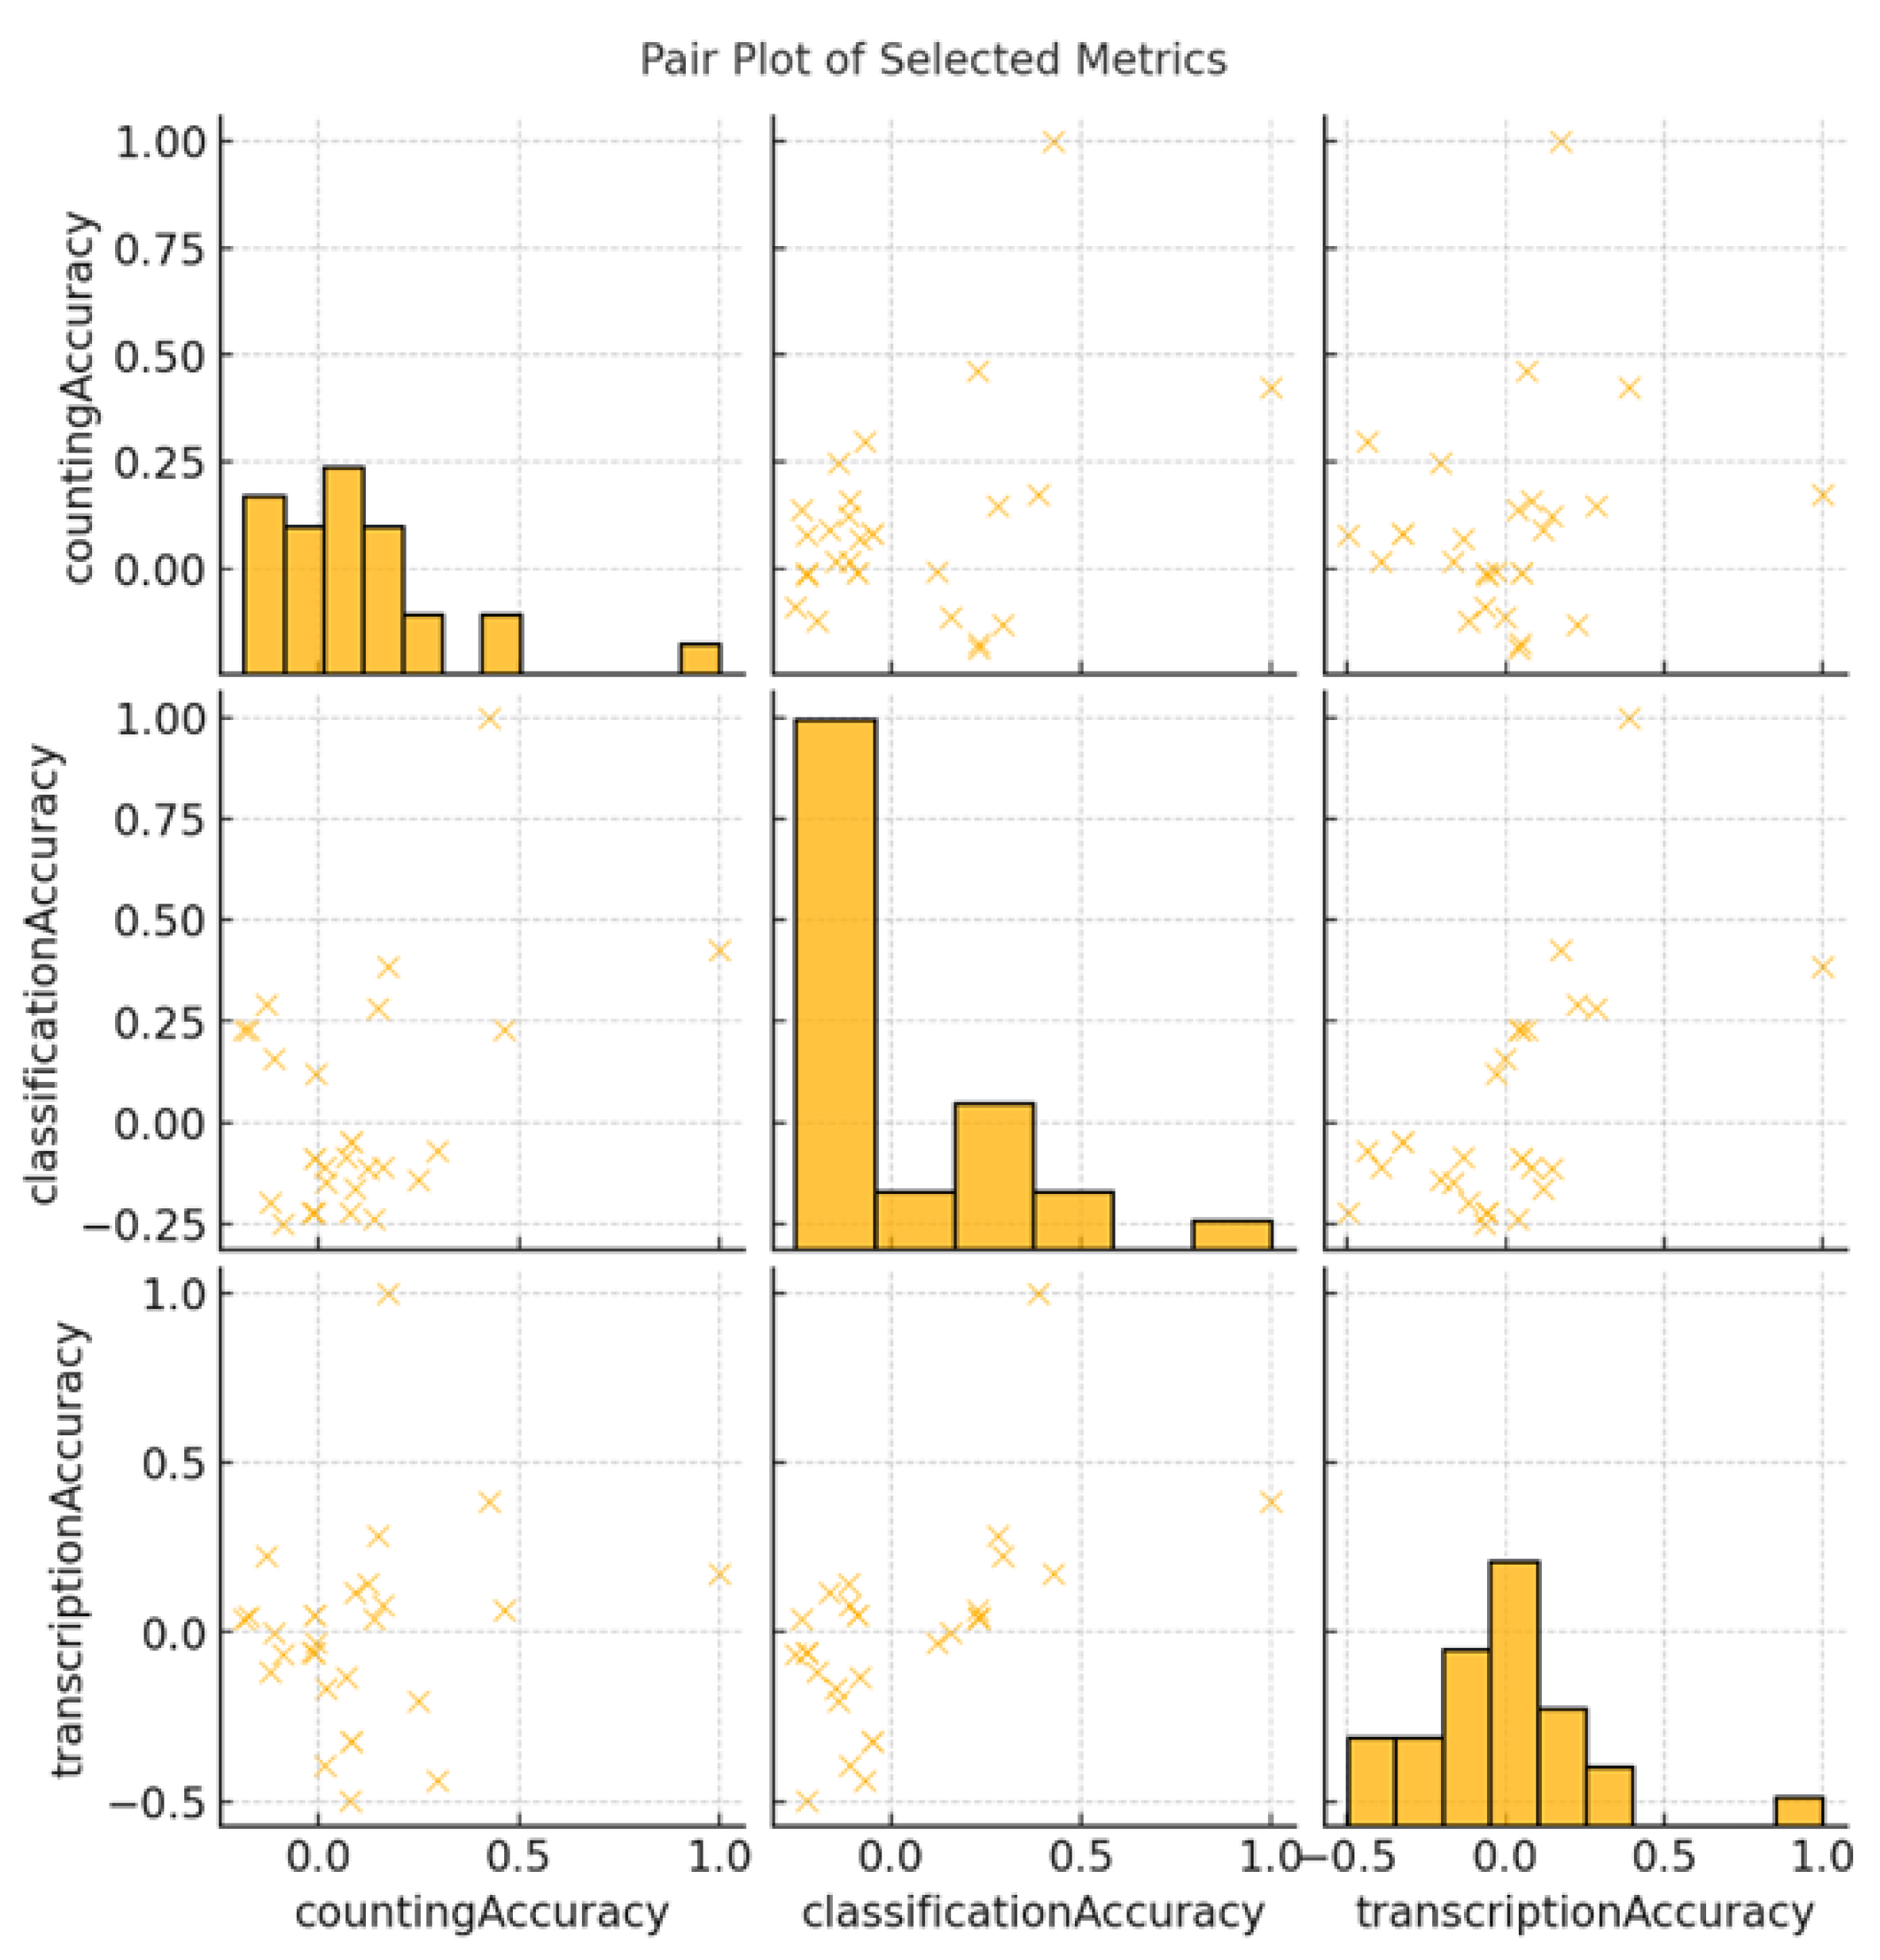

Table 1.
Comparative analysis of personalization data.
| Task | Metric | Group with Personalization | Group without Personalization |
|---|---|---|---|
| Counting Task | Accuracy | Higher average accuracy | Lower average accuracy |
| Response Time | Lower response times | Higher response times | |
| Click and Action Counts | Lower hesitant actions, low counts of hurry and special actions | Higher hesitant actions, low counts of hurry and special actions | |
| Transcriptions and Classification Tasks | --- | Less prominent data in initial extract, might not have distinct columns or might be combined | --- |
| Sentiment Analysis | Key Confident Actions | More consistent performance with fewer high deviations | Greater variation in key confident actions |
| Special Actions | Similar low occurrences in both groups, slightly higher averages in the group without personalization | Similar low occurrences |
Disclaimer/Publisher’s Note: The statements, opinions and data contained in all publications are solely those of the individual author(s) and contributor(s) and not of MDPI and/or the editor(s). MDPI and/or the editor(s) disclaim responsibility for any injury to people or property resulting from any ideas, methods, instructions or products referred to in the content. |
© 2024 by the authors. Licensee MDPI, Basel, Switzerland. This article is an open access article distributed under the terms and conditions of the Creative Commons Attribution (CC BY) license (https://creativecommons.org/licenses/by/4.0/).
Copyright: This open access article is published under a Creative Commons CC BY 4.0 license, which permit the free download, distribution, and reuse, provided that the author and preprint are cited in any reuse.


