
Submitted:
01 August 2024
Posted:
01 August 2024
You are already at the latest version
Abstract
The severe climate changes due to global warming pushed the world to strive to reduce carbon emissions. This study aims to minimize the carbon emissions for a proposed smart energy hub. This paper prioritizes the minimization of carbon emissions, taking into consideration the minimization of operation running costs, and the maximization of profit. In this paper two optimization scenarios were studied, to compare the results. In the first scenario, the minimization of carbon emissions was achieved, in the second scenario, the minimization of running costs and maximization of profit from the hub assets were studied. The proposed model was designed in MATLAB. Then the results were verified by CPLEX and validated by RTDS. The multi-objective model was presented to obtain the optimal operation. The mitigation of data uncertainty was achieved by applying the Kalman filter. In this work, a novel method was proposed for the estimation of the quarter-hour resolution data from the hourly one via the Kalman filter rather than applying the classic polynomial interpolation methods.
Keywords:
Smart energy hub
; carbon footprin
; dynamic pricing
; Kalman filter
1. Introduction
A carbon footprint indicates the greenhouse gases accumulated quantity that is emitted from any activity considering its lifecycle and its manufacturing process. The carbon footprint is measured in tons of CO2 [1]. Some values of fuel carbon footprints are shown in Table 1. A greenhouse gas is defined as any gas that is able to absorb and emit infrared radiation, such as methane and CO2 [2]. To reduce the increasingly severe global warming, the energy production that depends on fossil fuel has to be minimized [3]. Advanced technology is deployed to manage the energy needs through energy hubs and microgrids [4]. As energy sources are the main source of CO2, countries apply regulations for reducing CO2 emissions [5]. The deployment of renewable energy sources was raised for economic reasons such as the increasing in fuel prices and environmental resons to decrease CO2 emissions [6]. The term All-Electric leads to the opportunity of reducing CO2 emissions [7]. Clean energy results in reducing CO2 emissions and saving energy [8].
In [9], a plan to design a Smart Zero Carbon City is presented to realize the no-emission goal. Economics is the primary goal of energy production [10]. The future energy system goals are profit maximization, cost minimization, and CO2 reduction [11]. The Energy Hub system benefits are improving reliability, minimizing operating costs and CO2 emissions [12]. The multi-energy systems reduce CO2 emissions and enhance energy efficiency [13]. To reduce energy consumption, CO2 emissions, and operation costs, load dispatch optimization problem is deployed [14]. The energy hub can be the secure energy system of the future [15].
An integrated energy system, such as an energy hub system has the capability of optimizing the operation, enhancing energy efficiency, and reducing CO2 emissions [16]. The main form of the integrated energy system is the energy hub [17]. Energy storage systems increase power system stability and compensate for the intermittency of renewable energy sources [18]. The Kalman-filter is extensively applied to provide accurate data for the applications of power systems [19]. Data that has a lot of noise can be estimated by applying Kalman filter [20], Kalman filter depends on a recursive algorithm to minimize the error covariance of the estimated data [21].
As power system design and operation arise for mainly economic goals [10], this paper aims to decrease carbon emissions by setting the main optimization as the minimization of carbon emissions for any energy asset. In this work, two scenarios were achieved for the proposed smart energy hub to compare the results. In the first scenario, minimization of CO2 was achieved. In the second one, minimizing the running cost of the hub component and maximizing profit were studied. The multi objective model was studied to obtain the optimal operation of the energy hub assets. Kalman filter was used in this work in order to mitigate the generation and demand data uncertainty [22].
In this study, a novel method is proposed for online estimation of a quarter hour resolution dataset from an hourly one. The proposed method depends on the over sampling of input data and applying Kalman filter instead of applying classic interpolation methods. This can help in decreasing the aggregation system, data log sizes, duties, excitation time and costs.
2. Materials and Methods
3. Dataset Preparation
The data and parameters used in this work were taken from [26]. While the carbon footprint values were taken from [27]. The mentioned data of predicted solar irradiance, wind speed, and the several demands in the aforementioned references were in one-hour resolution. Then all datasets were converted via Kalman filters to fifteen-minute resolution in order to increase the accuracy (as will be illustrated in the next section), as shown in Figure 1(a & b).
3.1. Data Resolution Conversion
The Kalman Filter applications are categorized into three main categories: prediction, estimation, and smoothing [28]. In this paper, the proposed fourth application of Kalman Filter was data interpolation. In this section, Kalman filter has been used to convert dataset resolution from hourly to quarter-hour base resolution instead of classic polynomial interpolation. The proposed system depends on holding the original input data over the sampling period. Then over-sampling of the data, i.e., increase the data sampling rate to four times as the desired resolution. After that, applying Kalman filtering after tuning the filter by the appropriate covariance input value to have a smoothed signal. Thus, the in-between values (fifteen-minute resolution values) can be estimated as shown in Figure 2.
3.2. Simulation and Results of Dataset Conversion
The produced results showed that by selecting the Kalman filter’s optimal input parameters (covariance and sampling rate), the output interpolated data error will be minimized (as shown in Table 3, Figure 3 and Figure 4). The repeating sequence unit in Figure 3 presents the electricity, heat, and cooling demand data.
The resulted standard deviation (normalized to the dataset average) are ± 2.69 %, ± 1.08 % and ± 0.92 % for EKF, UKF and KF, at filter tuning (covariance) of 0.11 %, 0.94% and 1.87 % respectively, as shown in Figure 4.
4. Proposed Energy Hub
The proposed model of a smart energy hub (SEH) comprises communication system for bidirectional transfer of data and control among all sources and loads. The SEH includes an EMS to monitor, control, and optimize performance and cost, fuel consumption and CO2 emissions reduction. The SEH has three outputs (heat, electricity, and cooling) and two inputs (grid electricity and natural gas). Besides, it contains RES such as WT, PV, and biomass, also a conventional CHP attached to a waste heat recovery steam generator. In addition, an electrical energy storage battery system is installed (Figure 5).
5. Optimization Scenarios
5.1. Carbon Footprint Optimization (Scenario One)
The carbon footprint objective function is formulated based on the values of the SEH assets and can be arranged to be:
where Cs and Ps are the carbon footprint factors, and the output power of generating unit number as shown in Table 4. Expanding (1) resulted in (2)
Subjected to:
Power balance constraints:
Energy balance constraints:
Technical limitation constraints:
Energy storage constraints:
(19)
Non-negativity constraints
where
| Total number of time slots = 96 (quarter hour per day) | |
| Output power of any source at t | |
| Wind turbine output power at t | |
| Solar energy output power at t | |
| Grid consumed power | |
| Exported power to the grid | |
| Absorption chiller output Power | |
| Storage charging/discharging power at time t | |
| Grid carbon footprint factor | |
| Wind turbine carbon footprint | |
| Solar module carbon footprint | |
| Biomass energy output power | |
| Biomass carbon footprint | |
| CHP Electrical output Power | |
| CHP carbon footprint | |
| Heat Pump output Power | |
| Heat pump carbon footprint | |
| Absorption chiller carbon footprint | |
| Storage charging/discharge footprint |

Table 4.
Energy hub suggested data and parameters [26].
Table 4.
Energy hub suggested data and parameters [26].
| Parameter | Name | Value | Unit |
| Grid carbon footprint | g/kW | ||
| CHP carbon footprint | 490 | g/kW | |
| Biomass carbon footprint | 230 | g/kW | |
| PV carbon footprint | 48 | g/kW | |
| WT carbon footprint | 11 | g/kW | |
| Heat pump footprint | 2 | g/kW | |
| Heat pump footprint | 1 | g/kW | |
| Maximum grid consumed power | 2000 | kW | |
| Maximum CHP output power | 1000 | kW | |
| Maximum Biomass output | 2000 | kW | |
| Maximum PV output power | 1000 | kW | |
| Maximum consumed gas | 2000 | kW | |
| Maximum WT output power | 400 | kW | |
| Maximum Heat pump output power | 300 Heat | kW | |
| Maximum Cooling pump output power | 300 Cooling | kW | |
| Maximum absorption chiller output power | 400 | kW | |
| Storage maximum charge discharge power | 400 | kW | |
| Storage Capacity | 4 | MWh | |
| Heat Pump Efficiency | 0.99 | - | |
| CHP Efficiency | 0.25 | - | |
| Li-ion battery Efficiency | 0.9 | - | |
| Biomass Efficiency | 0.99 | - | |
| Absorption chiller efficiency | 0.7 | – | |
| Wind Turbine Efficiency | 0.30 | - | |
| Biomass Efficiency | 0.99 | - | |
| Heat recovery boiler efficiency | 0.90 | - | |
| Solar Efficiency | 0.15 | - | |
| Heat pump output heat coefficient | 0.5 | - | |
| Heat pump output cooling coefficient | 0.5 | - | |
| CHP output electricity coefficient | 1 | - | |
| CHP output heat coefficient | 1 | - | |
| WT cost | 2 | cent/kW | |
| PV cost | 1 | cent/kW | |
| Biomass cost | 5 | cent/kW | |
| CHP cost | 12 | cent/kW | |
| Absorption Chiller cost | 1 | cent/kW | |
| Heat Pump cost | 1 | cent/kW | |
| Absorption Chiller cost | 1 | cent/kW | |
| Storage cost | 1 | cent/kW | |
| Grid dynamic Price | Figure 8. | cent/kW |
In the scenario one objective function, the output power values of the SEH assets are the decision variables. The terms are related to the carbon footprint value of SEH assets, as shown in Table 4. The constraints represent inequality equations for resources upper and lower technical limitations. In addition to energy equilibrium and power balance constraints
5.2. Simulation and Results of Scenario One
The results produced by solving the problem via MATLAB® and Cplex® for carbon footprint optimization function are presented in Figure 6. The results in Figure 6(a), show that no power delivered from the grid because the grid carbon footprint is the maximum value (820 g/kW). The heat, electricity and cooling loads were supplied from the RES as the least footprint source, i.e., from WT (11 g/kW), then the next and so forth. Thus, the SEH achieves self-sufficiency. The biomass boiler power satisfied most of the heat demand (Figure 6(c)). The CHP output power covers the peak demand (Figure 6(d)). The SEH controller can export extra power of RES to the network, during the off-peak (valley) demand hours of the day (Figure 6(b)). The total carbon emissions produced of the energy hub equal to 9.36 tons CO2/day, after 413 iterations.
The sensitivity analysis of the running cost of the energy sources in the energy hub is shown in Figure 7.
5.3. Economic Optimization (Scenario Two)
The economic problem is formulated under a mixed objective function. In the first objective function, a cost minimization for the proposed SEH is arranged. While in the second objective function a profit maximization for exporting power to the grid is formulated. The SEH will consume RES, then CHP and benefit the grid dynamic tariff via energy exchanging with the grid. The energy exchange is achieved by storing surplus power in the energy storage unit. Then exporting the stored energy to the grid during the highest price hours.
Figure 8.
Import/export hourly grid tariff in Cent/kWh throughout the day [26].
Figure 8.
Import/export hourly grid tariff in Cent/kWh throughout the day [26].
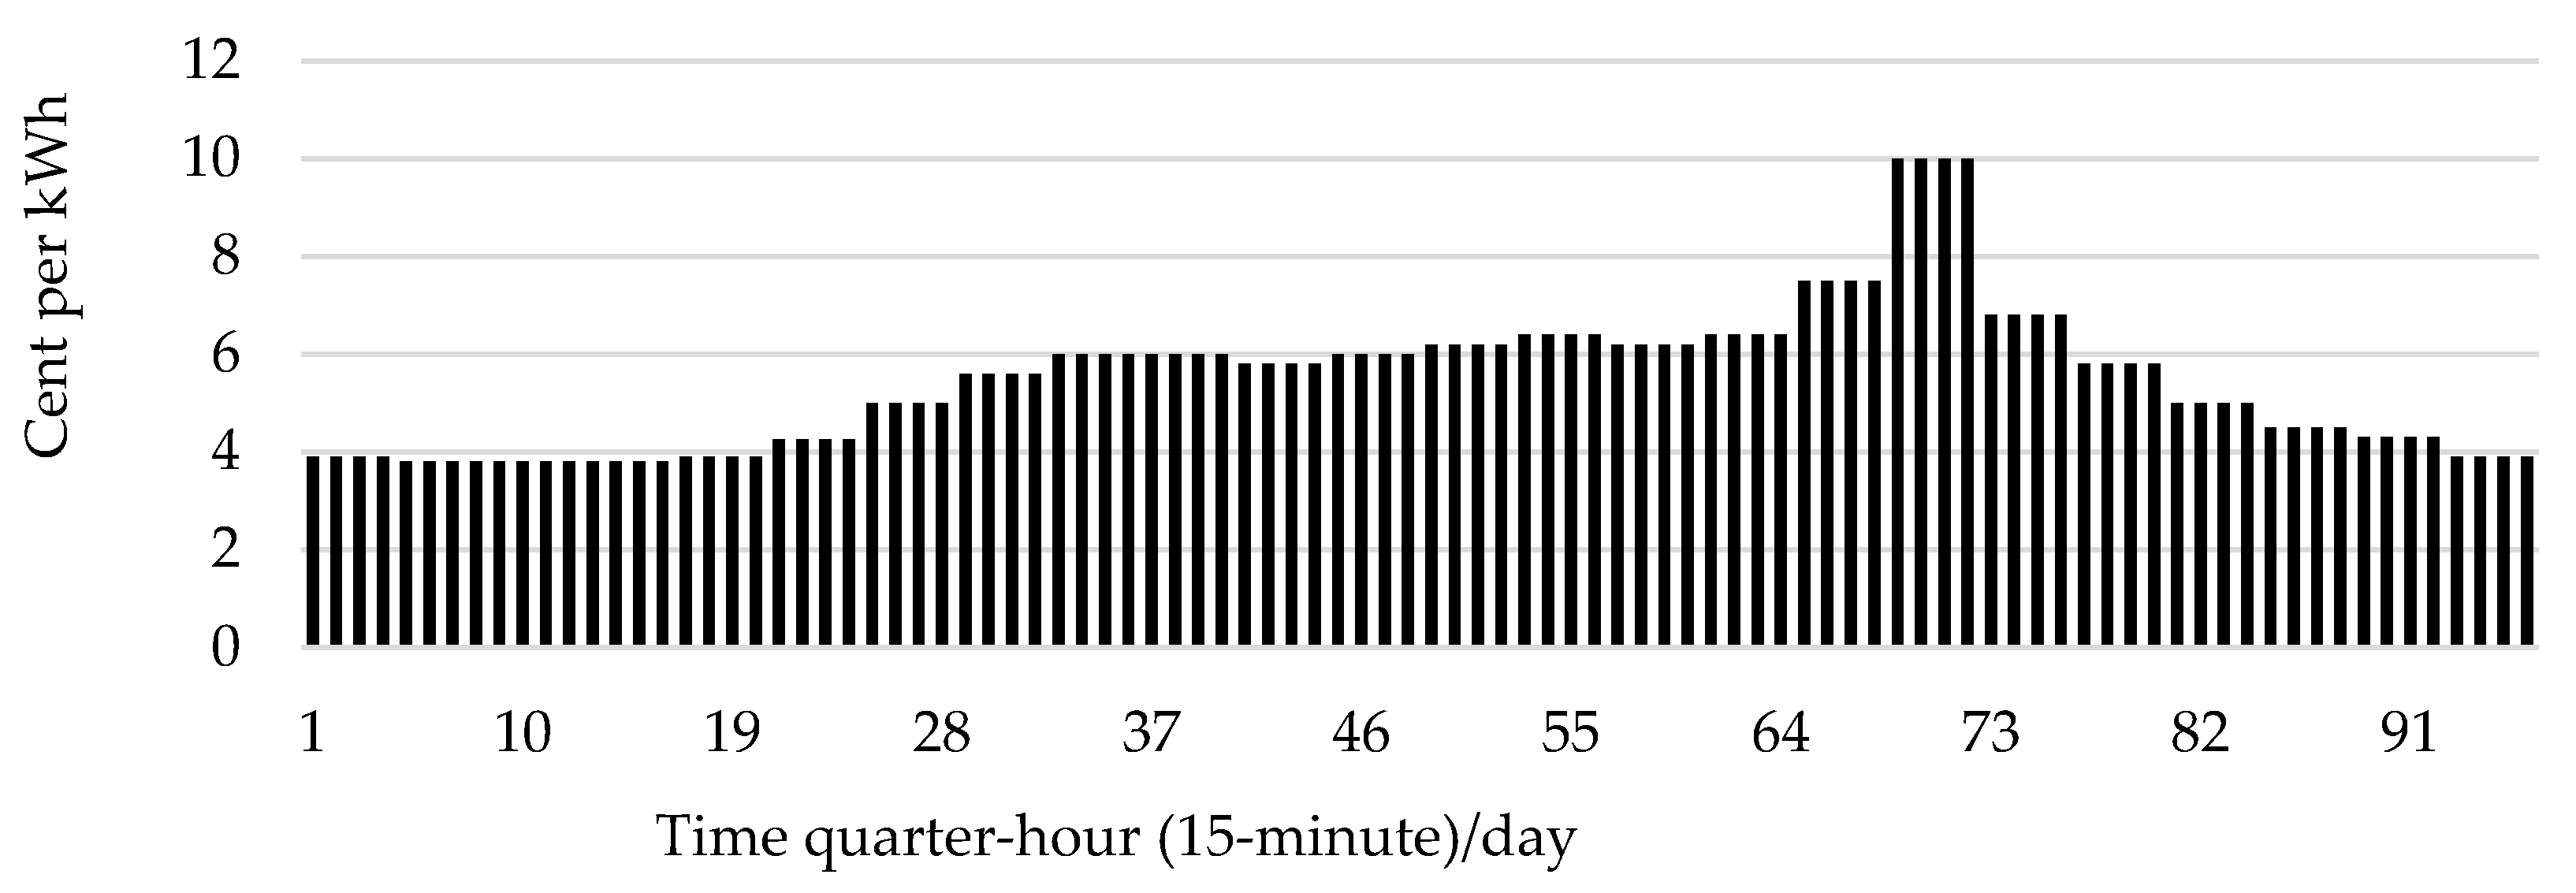
The coefficients of the decision variable of the objective function are the costs in cents per kilowatt. The costs of each source in the SEH are shown in Table 4 and Figure 8. The objective function is formulated for minimizing cost parameters and maximizing exporting power to the grid, and rearranged to be:
The constraints are the same as in scenario number one. The objective function is subjected to power balance constraints (3)-(9), energy balance constraints (10), technical limitation constraints (11)-(19), energy storage constraints (20)-(24), and non-negativity constraints (25).
5.4. Simulation and Results of Scenario Two
Solving the economic objective function via MATLAB® and Cplex® to obtain the results for cost minimization indicated that, the energy hub consumes power from the grid, during the lowest grid tariff, and the RES cannot meet the demand as shown in Figure 9(a). The biomass boiler power satisfied most of the heat demand (Figure 9(b)).
The RESs were totally consumed. The CHP is lightly loaded as it has the highest running cost. It runs to feed the unmet peak load, as shown in Figure 9(c). The result showed that the energy storage unit is charged during surplus WT and PV power periods. The energy storage unit is discharged during the peak-hour period at highest price (10 cent/hr) for exporting energy, as shown in Figure 8. and 10(a & b).
An optimal solution was found after 534 iterations, with a total cost of $2186.90 per day. The exported power to the grid gained $62.40, in the peak hour from the energy storage. There is no similar energy hub model in other papers to compare this result. The sensitivity analysis for running costs is shown in Figure 11. The sensitivity analysis shows how the total cost of the SEH changes with changing of the hourly cost of each generating unit.
5.5. Multi-Objective Function Model
In this work, the Weighted Sum Method was used to form the multi-objective function (carbon emissions and economic scenarios), due to its usability and simplicity in convex objective functions [10]. The multi-objective function can be arranged to be:
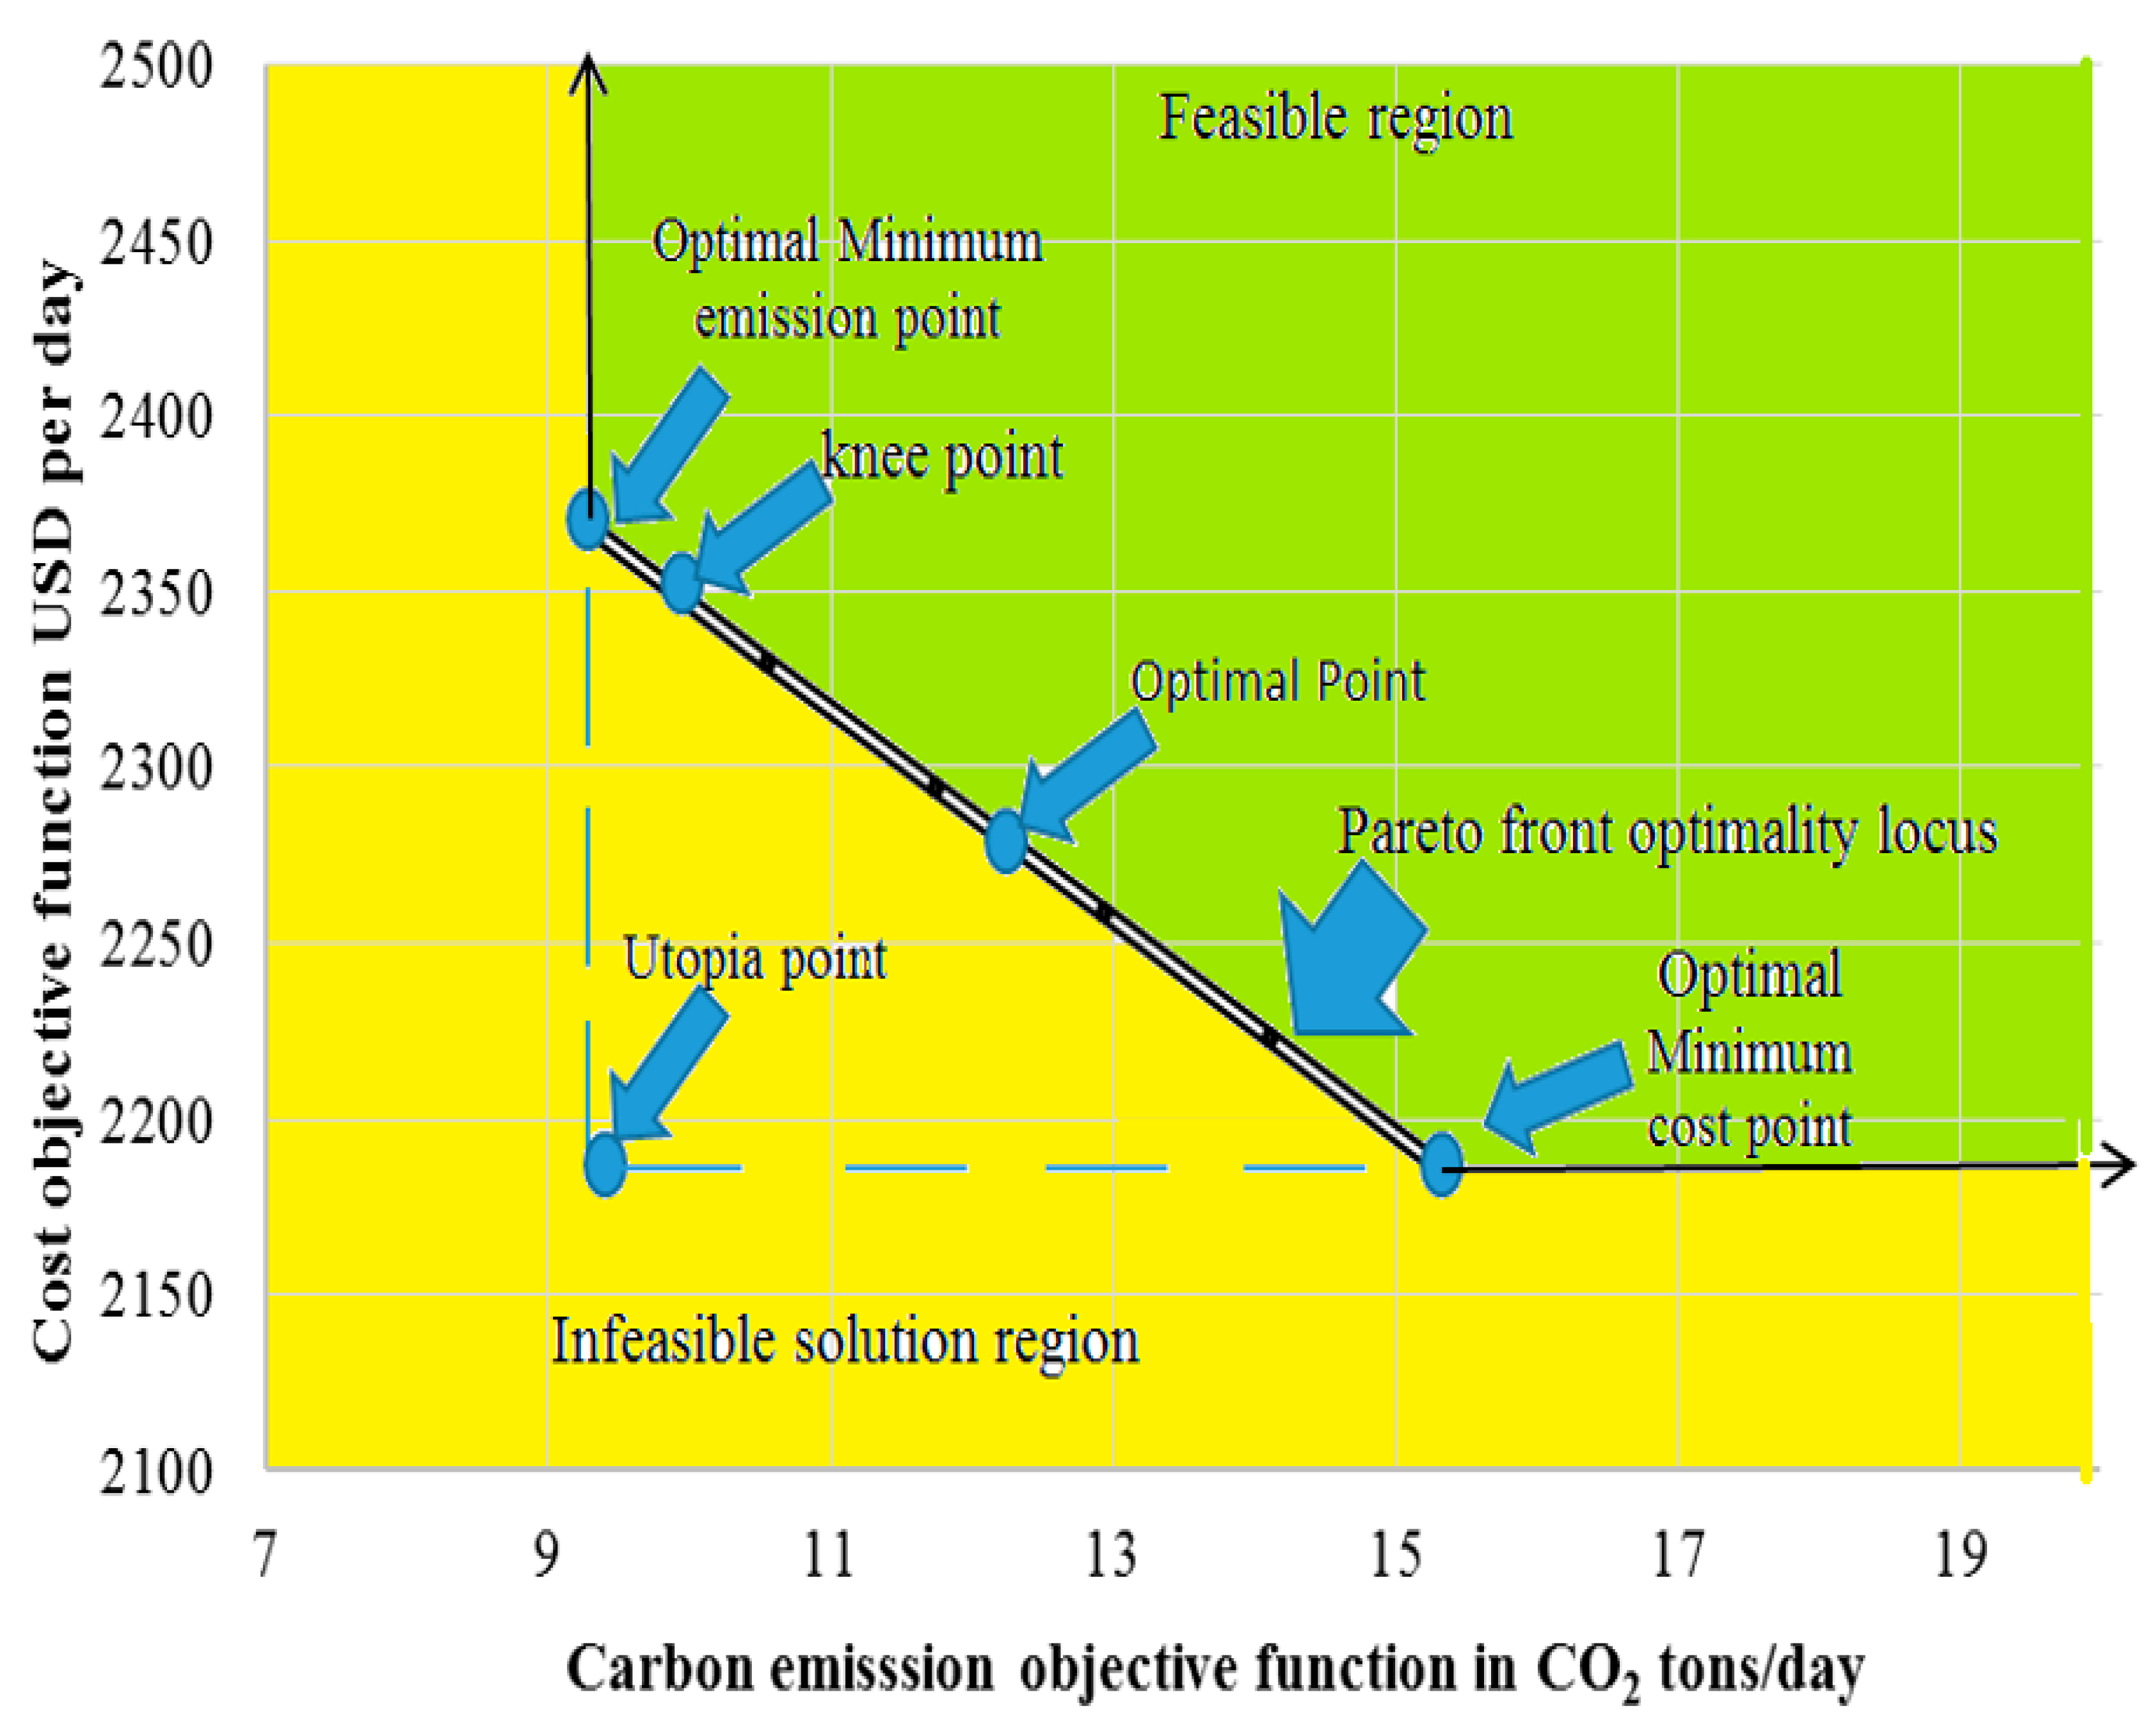
where ɷ determines the relative importance or the weight of the objective functions. It can be chosen from 0 to 1, in order to weight more or less the multi-objective functions. The Pareto’s front of the multi-objective function is as shown in Table 5 and Figure 13.
Figure 12.
Pareto’s front of the multi-objective function.
5.6. Result Comparison
The produced carbon emissions in the first scenario was 9.36 tons CO2/day, while it was 15.31 tons CO2/day in the second scenario. That means an increase in CO2 emissions by 63.57% in the second scenario compared with the first one. While the cost in the first scenario is $2366.20 more than the cost in the second scenario by $179.3, that means an increase of 8.20% in costs in the first scenario (as shown in Table 5). Generally, the data in Table 5 indicates that, any decrease in carbon emissions leads to an increase in the cost and vice versa. Based on the aforementioned results, the final optimal solution can be chosen as point 4 (the mid-point 50% of the minimum carbon emissions and 50% of the minimum cost) from Figure 13. Also, the final optimal solution is affected by the admissible limits of carbon emissions and carbon tax according to the country regulations and economic issues such as payback period.
5.7. The Energy Hub Simulation and Validation
The proposed SEH was built, simulated, and tested by the RTDS [25] to determine the design problems and to help in solving technical issues, besides testing the operation modes of the designed models as shown in Figure 12. All SEH components’ details have been fed into the simulator to confirm compatibility between components. The optimization algorithm was written in a “C” programming language. And the results showed that; the energy hub can be built and operated as a practical application. The optimized operation results are as shown in Figure 14 and Figure 15. The results are the same in MATLAB and CPLEX, as described in Figure 6,7,9 & 10.
6. Uncertainty Mitigation by Kalman Filter
For studying Kalman filter’s mitigation on uncertainty of the datasets, a simulation is achieved by combining a noise generator with the original data in a MATLAB program. Then solving the optimization problem with the noisy dataset, and after that solving the problem with the output data of the Kalman filter. Finally compare the results with the pure data. The results showed that KF improved the optimization results up to a noise level of 21.36% of the data average, after that, it began to diverge, as shown in Figure 16. and Table 5.
Table 4.
Improvement in optimization result by using kalman filter.
| Percentage noise to data average (%) | Optimization result of | Improvement percentage % | ||
|---|---|---|---|---|
| Noisy dataset | Kalman filtered dataset | Original dataset | ||
| 0 | 1 | 1 | 1 | - |
| 1.87 | 0.945 | 0.981 | 1 | 3.5 |
| 5.92 | 0.950 | 0.986 | 1 | 3.6 |
| 18.73 | 0.969 | 1.020 | 1 | 1.6 |
| 20.52 | 0.972 | 1.020 | 1 | 0.6 |
| 21.36 | 0.974 | 1.024 | 1 | 0.0 |
| 22.17 | 0.976 | 1.020 | 1 | -0.4 |
| 23.70 | 0.979 | 1.030 | 1 | -1.4 |
7. Conclusions
In this work, a smart energy hub is proposed with two optimization scenarios. The results based on the quarter-hour converted dataset showed that carbon footprint optimization has minimized carbon emissions by 38.86% of the proposed energy hub. While increasing the cost by 8.20%. The cost optimization has minimized the cost by 7.58%, while it increased the carbon emissions by 63.57%. It's concluded that carbon footprint optimization achieved minimum carbon emissions with a lower increase in cost rather than cost optimization for the proposed model. For this reason, carbon footprint optimization is expected to be the base optimization for all energy assets, as it can fulfill the requirements of several demands and lead to significant minimization of carbon emissions. The uncertainty mitigation by Kalman filter showed that Kalman filter improved the optimization results up to the noise level of 21.36% of the data average, after that, it became divergent due to dataset deformation by noise.
Also, the obtained results indicated that using quarter-hour resolution data improved the accuracy of the results by 0.64 and 0.40 % for scenarios one and two respectively, compared with using one-hour resolution.
This study proposed a novel approximate interpolation method for estimating the quarter-hour resolution dataset from the hourly one by deploying Kalman filters instead of old polynomial interpolation techniques. The linear Kalman filter has shown the most accurate result over the other types. This method can help in decreasing aggregation system and data log sizes, duties, calculation time, and costs compared with old methods of interpolation.
The expected future work is to apply other types of Kalman filters such as ensemble and constrained Kalman filters to achieve interpolation.
Funding
This research work was funded by Institutional Fund Projects under grant no. (IFPIP:1094-144-1443). The authors gratefully acknowledge technical and financial support provided by the Ministry of Education and King Abdulaziz University, DSR, Jeddah, Saudi Arabia.
References
- P. Asopa, P. Purohit, R. R. Nadikattu, and P. Whig, “Reducing carbon footprint for sustainable development of smart cities using IoT,” in 2021 Third International Conference on intelligent communication technologies and virtual mobile networks (ICICV), 2021.
- Mekhum, W. Smart cities: impact of renewable energy consumption, information and communication technologies and e-governance on CO2 emission. J. Secur. Sustain. Issues 2020, 9, 785–795. [Google Scholar] [CrossRef] [PubMed]
- Zhang, S.; Hu, W.; Du, J.; Bai, C.; Liu, W.; Chen, Z. Low-carbon optimal operation of distributed energy systems in the context of electricity supply restriction and carbon tax policy: A fully decentralized energy dispatch strategy. J. Clean. Prod. 2023, 396. [Google Scholar] [CrossRef]
- S. De Dutta and R. Prasad, “Cybersecurity for microgrid,” in 2020 23rd International Symposium on Wireless Personal Multimedia Communications (WPMC), 2020.
- Abdel-Majeed, M.S.; Eldeeb, H.M.; Metwly, M.Y.; Abdel-Khalik, A.S.; Hamad, M.S.; Hamdy, R.A.; Ahmed, S. Postfault Operation of Onboard Integrated Battery Charger via a Nine-Phase EV-Drive Train. IEEE Trans. Ind. Electron. 2020, 68, 5626–5637. [Google Scholar] [CrossRef]
- Gaber, M.; El-Banna, S.; Hamad, M.; Eldabah, M. Performance Enhancement of Ship Hybrid Power System Using Photovoltaic Arrays. 2020 IEEE PES/IAS PowerAfrica. LOCATION OF CONFERENCE, KenyaDATE OF CONFERENCE; pp. 1–5.
- Gaber, M.; El-Banna, S.H.; Eldabah, M.; Hamad, M.S. Model and Control of Naval Ship Power System by The Concept of All-Electric Ships Based on Renewable Energy. 2019 21st International Middle East Power Systems Conference (MEPCON). LOCATION OF CONFERENCE, EgyptDATE OF CONFERENCE;
- Gaber, M.; El-Banna, S.; El-Dabah, M.; Hamad, O. Designing and Implementation of an Intelligent Energy Management System for Electric Ship power system based on Adaptive Neuro-Fuzzy Inference System (ANFIS). Adv. Sci. Technol. Eng. Syst. J. 2021, 6, 195–203. [Google Scholar] [CrossRef]
- Azcona, K.U.; Sorensen, S.S.; Costa, P.M.; Abascal, I.F. Smart Zero Carbon City: key factors towards smart urban decarbonisation. DYNA 2019, 94, 676–683. [Google Scholar] [CrossRef]
- Salehi, N.; Martinez-Garcia, H.; Velasco-Quesada, G.; Guerrero, J.M. A Comprehensive Review of Control Strategies and Optimization Methods for Individual and Community Microgrids. IEEE Access 2022, 10, 15935–15955. [Google Scholar] [CrossRef]
- Maroufmashat, A.; Taqvi, S.T.; Miragha, A.; Fowler, M.; Elkamel, A. Modeling and Optimization of Energy Hubs: A Comprehensive Review. Inventions 2019, 4, 50. [Google Scholar] [CrossRef]
- E. Mokaramian, H. E. Mokaramian, H. Shayeghi, F. Sedaghati, A. Safari, and H. H. Alhelou, “A CVaR-Robust-based multi-objective optimization model for energy hub considering uncertainty and E-fuel energy storage in energy and reserve markets,” IEEE Access, vol. 9, pp. 109447–109464, 2021.
- T. Ding, W. Jia, M. Shahidehpour, O. Han, Y. Sun, and Z. Zhang, “Review of Optimization Methods for Energy Hub Planning, Operation, Trading, and Control,” IEEE Trans. Sustain. Energy, vol. 13, no. 3, pp. 1802–1818, 2022.
- Lu, X.; Liu, Z.; Ma, L.; Wang, L.; Zhou, K.; Feng, N. A robust optimization approach for optimal load dispatch of community energy hub. Appl. Energy 2020, 259. [Google Scholar] [CrossRef]
- M. Nozarian and A. Fereidunian, “Smart City as an Smart Energy Hub: A Bibliographic, Analytic and Structural Review,” Iran. Electr. Ind. J. Qual. Product., vol. 9, no. 4, pp. 62–82, 2020.
- Liu, Z.; Zeng, M.; Zhou, H.; Gao, J. A Planning Method of Regional Integrated Energy System Based on the Energy Hub Zoning Model. IEEE Access 2021, 9, 32161–32170. [Google Scholar] [CrossRef]
- Luo, Y.; Zhang, X.; Yang, D.; Sun, Q. Emission Trading Based Optimal Scheduling Strategy of Energy Hub with Energy Storage and Integrated Electric Vehicles. J. Mod. Power Syst. Clean Energy 2020, 8, 267–275. [Google Scholar] [CrossRef]
- Gadelrab, R.G.; Hamad, M.S.; Abdel-Khalik, A.S.; El Zawawi, A. Wind farms-fed HVDC system power profile enhancement using solid state transformer based flywheel energy storage system. J. Energy Storage 2015, 4, 145–155. [Google Scholar] [CrossRef]
- Liu, H.; Hu, F.; Su, J.; Wei, X.; Qin, R. Comparisons on Kalman-Filter-Based Dynamic State Estimation Algorithms of Power Systems. IEEE Access 2020, 8, 51035–51043. [Google Scholar] [CrossRef]
- Ginalih, C.T.; Jatmiko, A.S.; Darmakusuma, R. Simple Application of Kalman Filter On a Moving Object in Unity3D. 2020 6th International Conference on Interactive Digital Media (ICIDM). LOCATION OF CONFERENCE, IndonesiaDATE OF CONFERENCE; pp. 1–3.
- Yang, H.; Tao, G.; Wang, X.; Liu, W. Linear Optimal Kalman Predictor for Descriptor System With Packet Dropouts and Colored Measurement Noises. 2022 41st Chinese Control Conference (CCC). LOCATION OF CONFERENCE, ChinaDATE OF CONFERENCE;
- Khattab, M.M.; Abdelrahim, A.; Youssef, E.; Hamad, M.S. Footprint Optimization of Smart Energy Hub with Dataset Resolution Conversion Using Kalman Filter. 2023 24th International Middle East Power System Conference (MEPCON). LOCATION OF CONFERENCE, EgyptDATE OF CONFERENCE; pp. 1–9.
- Matlab, https://www.mathworks.com/products/matlab-online.
- ILOG CPLEX Optimization Studio—Overview. Available online: https://www.ibm.com/products/ilog-cplex-optimization-studio (accessed on 9 June 2021).
- Noureen, S.; Shamim, N.; Roy, V.; Bayne, S. Real-time digital simulators: A comprehensive study on system overview, application, and importance. Int. J. Res. Eng. 2017, 266–277. [Google Scholar] [CrossRef]
- M. Mohammadi, Y. Noorollahi, and B. Mohammadi-Ivatloo, “Impacts of energy storage technologies and renewable energy sources on energy hub systems,” Oper. planning, Anal. energy storage Syst. smart energy hubs, pp. 23–52, 2018.
- D. P. Stone, “The Intergovernmental Panel on Climate Change (IPCC),” The Changing Arctic Environment, 2015.
- Assimakis, N.; Adam, M. Kalman filter Riccati equation for the prediction, estimation, and smoothing error covariance matrices. Int. Sch. Res. Not. 2013, 2013. [Google Scholar] [CrossRef]
Figure 1.
a) The original several demands (one-hour resolution) [26] and (b) The Kalman interpolated dataset (quarter-hour resolution).
Figure 1.
a) The original several demands (one-hour resolution) [26] and (b) The Kalman interpolated dataset (quarter-hour resolution).
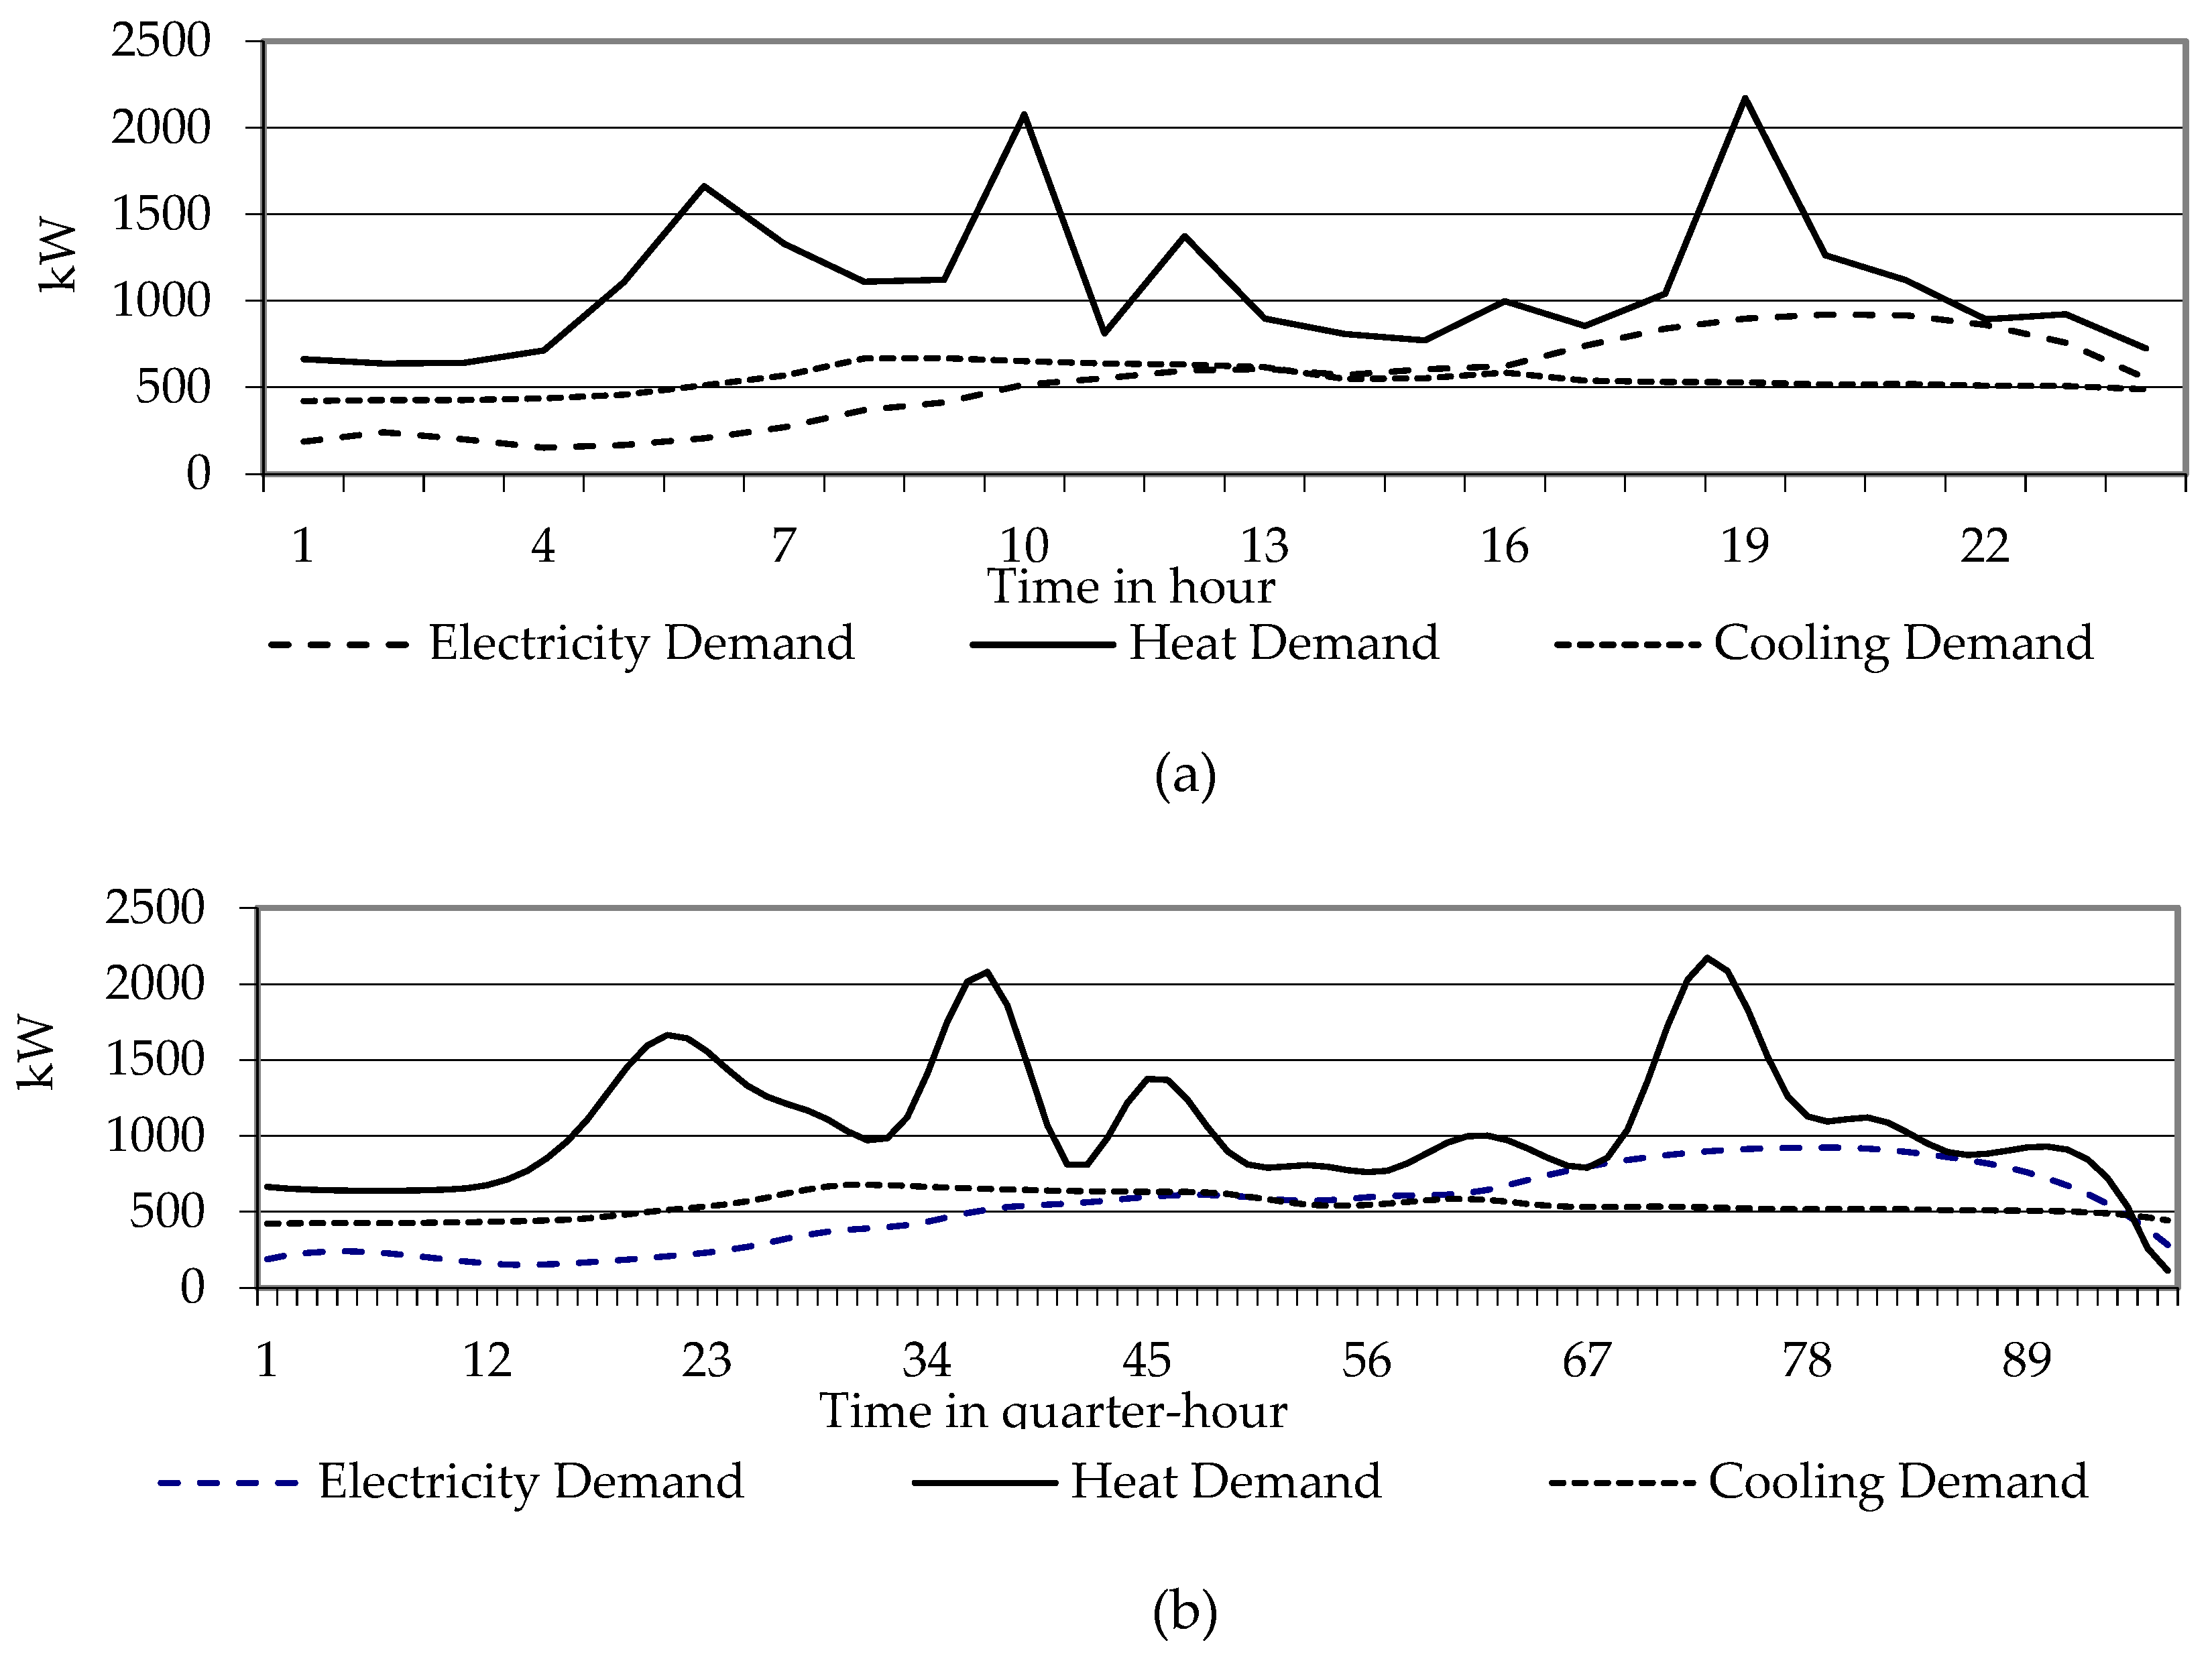
Figure 2.
The proposed novel Kalman interpolation system stages.
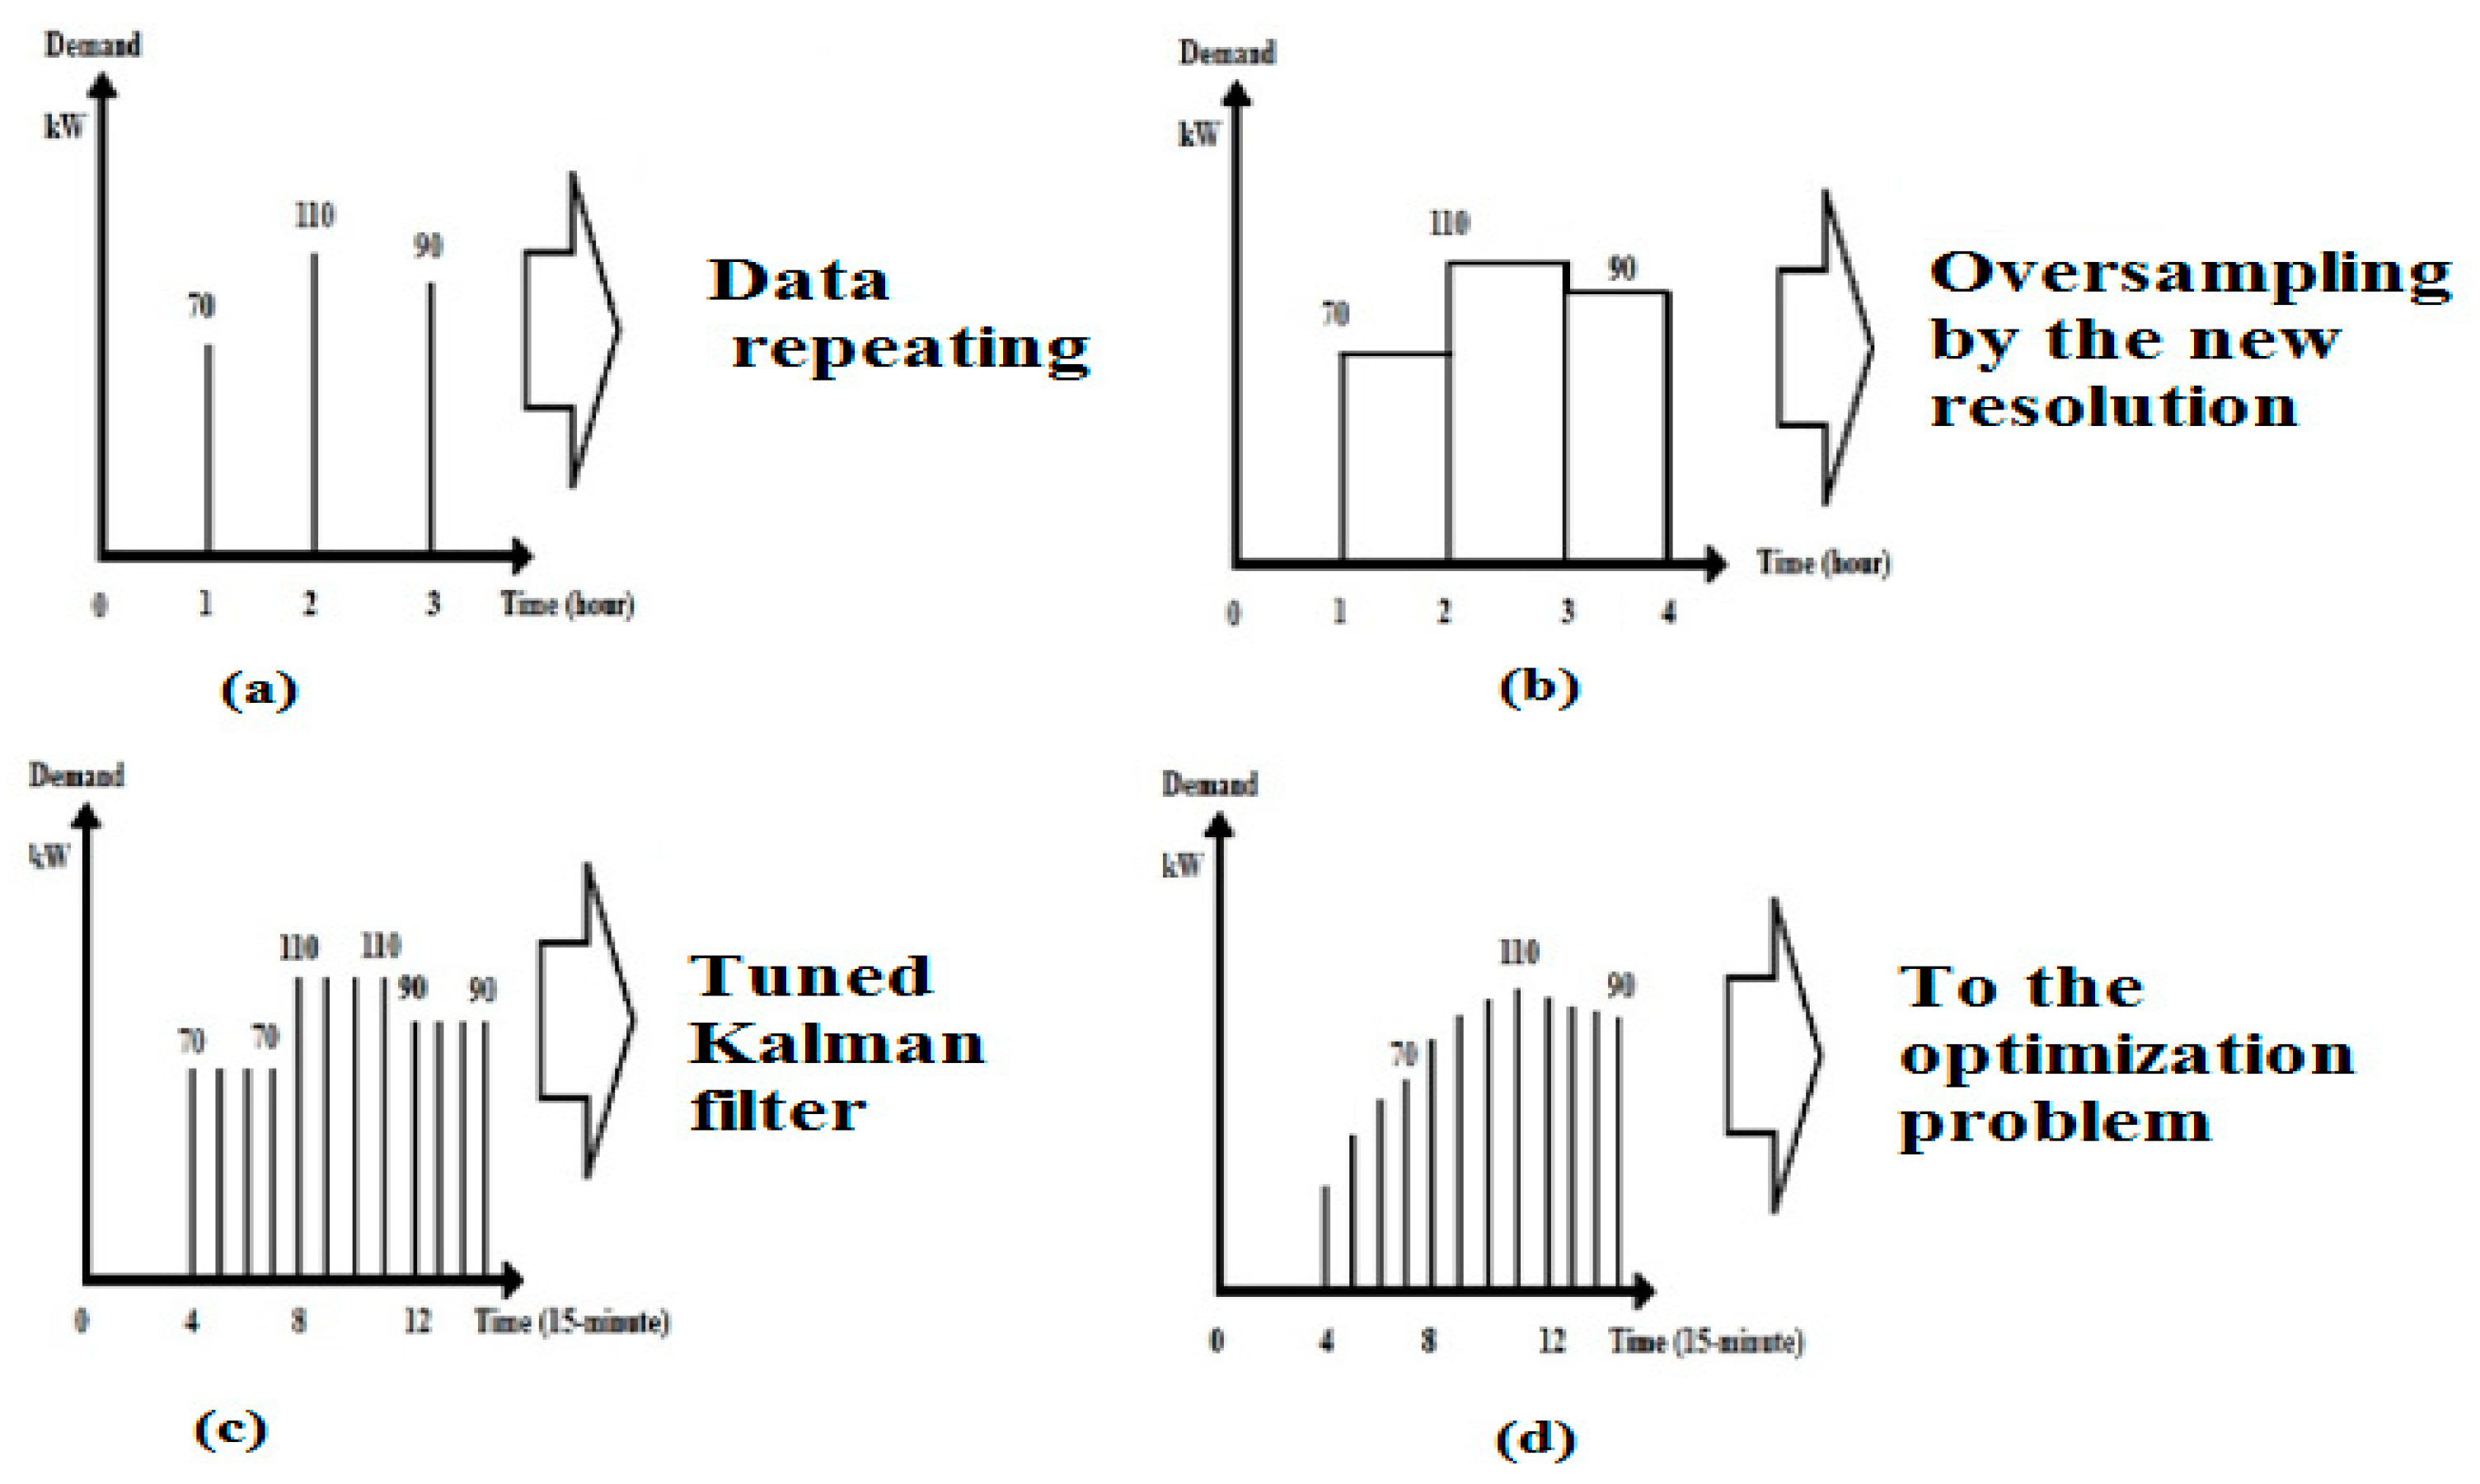
Figure 3.
The architecture of Kalman interpolation system by using MATLAB/SIMULINK toolbox.
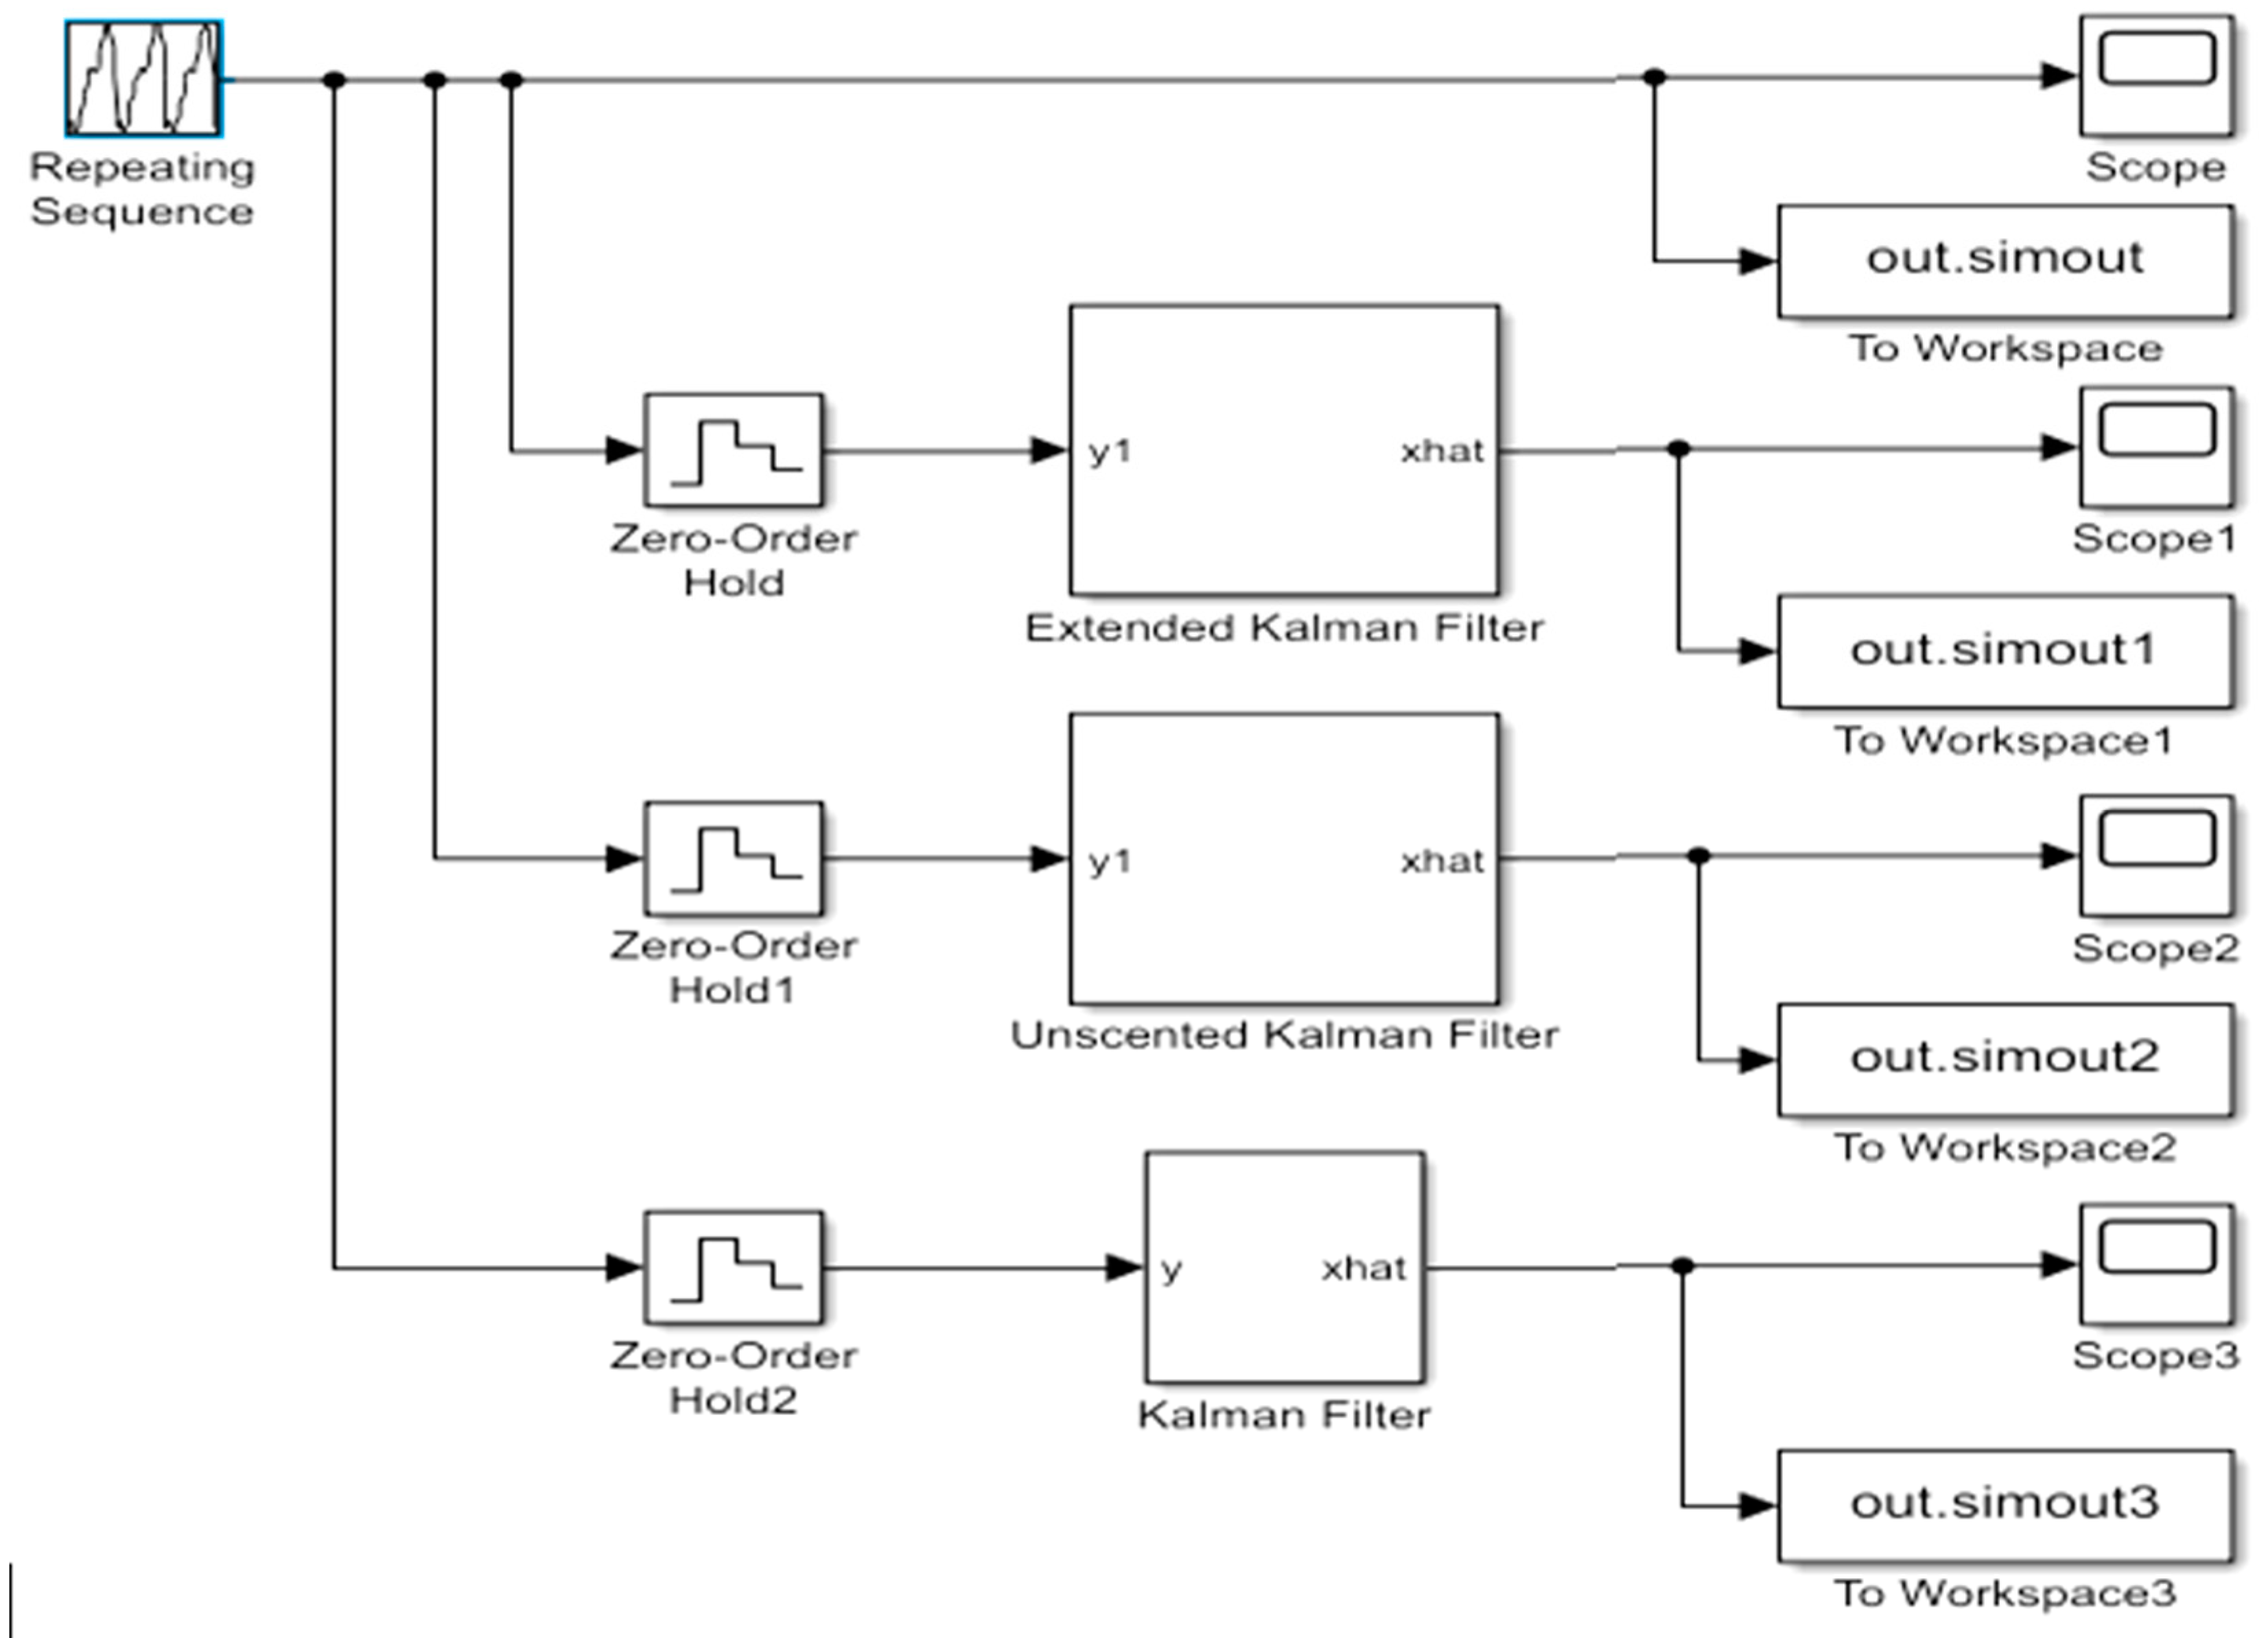
Figure 4.
Kalman filter types output (variance) with respect to filter tuning value.
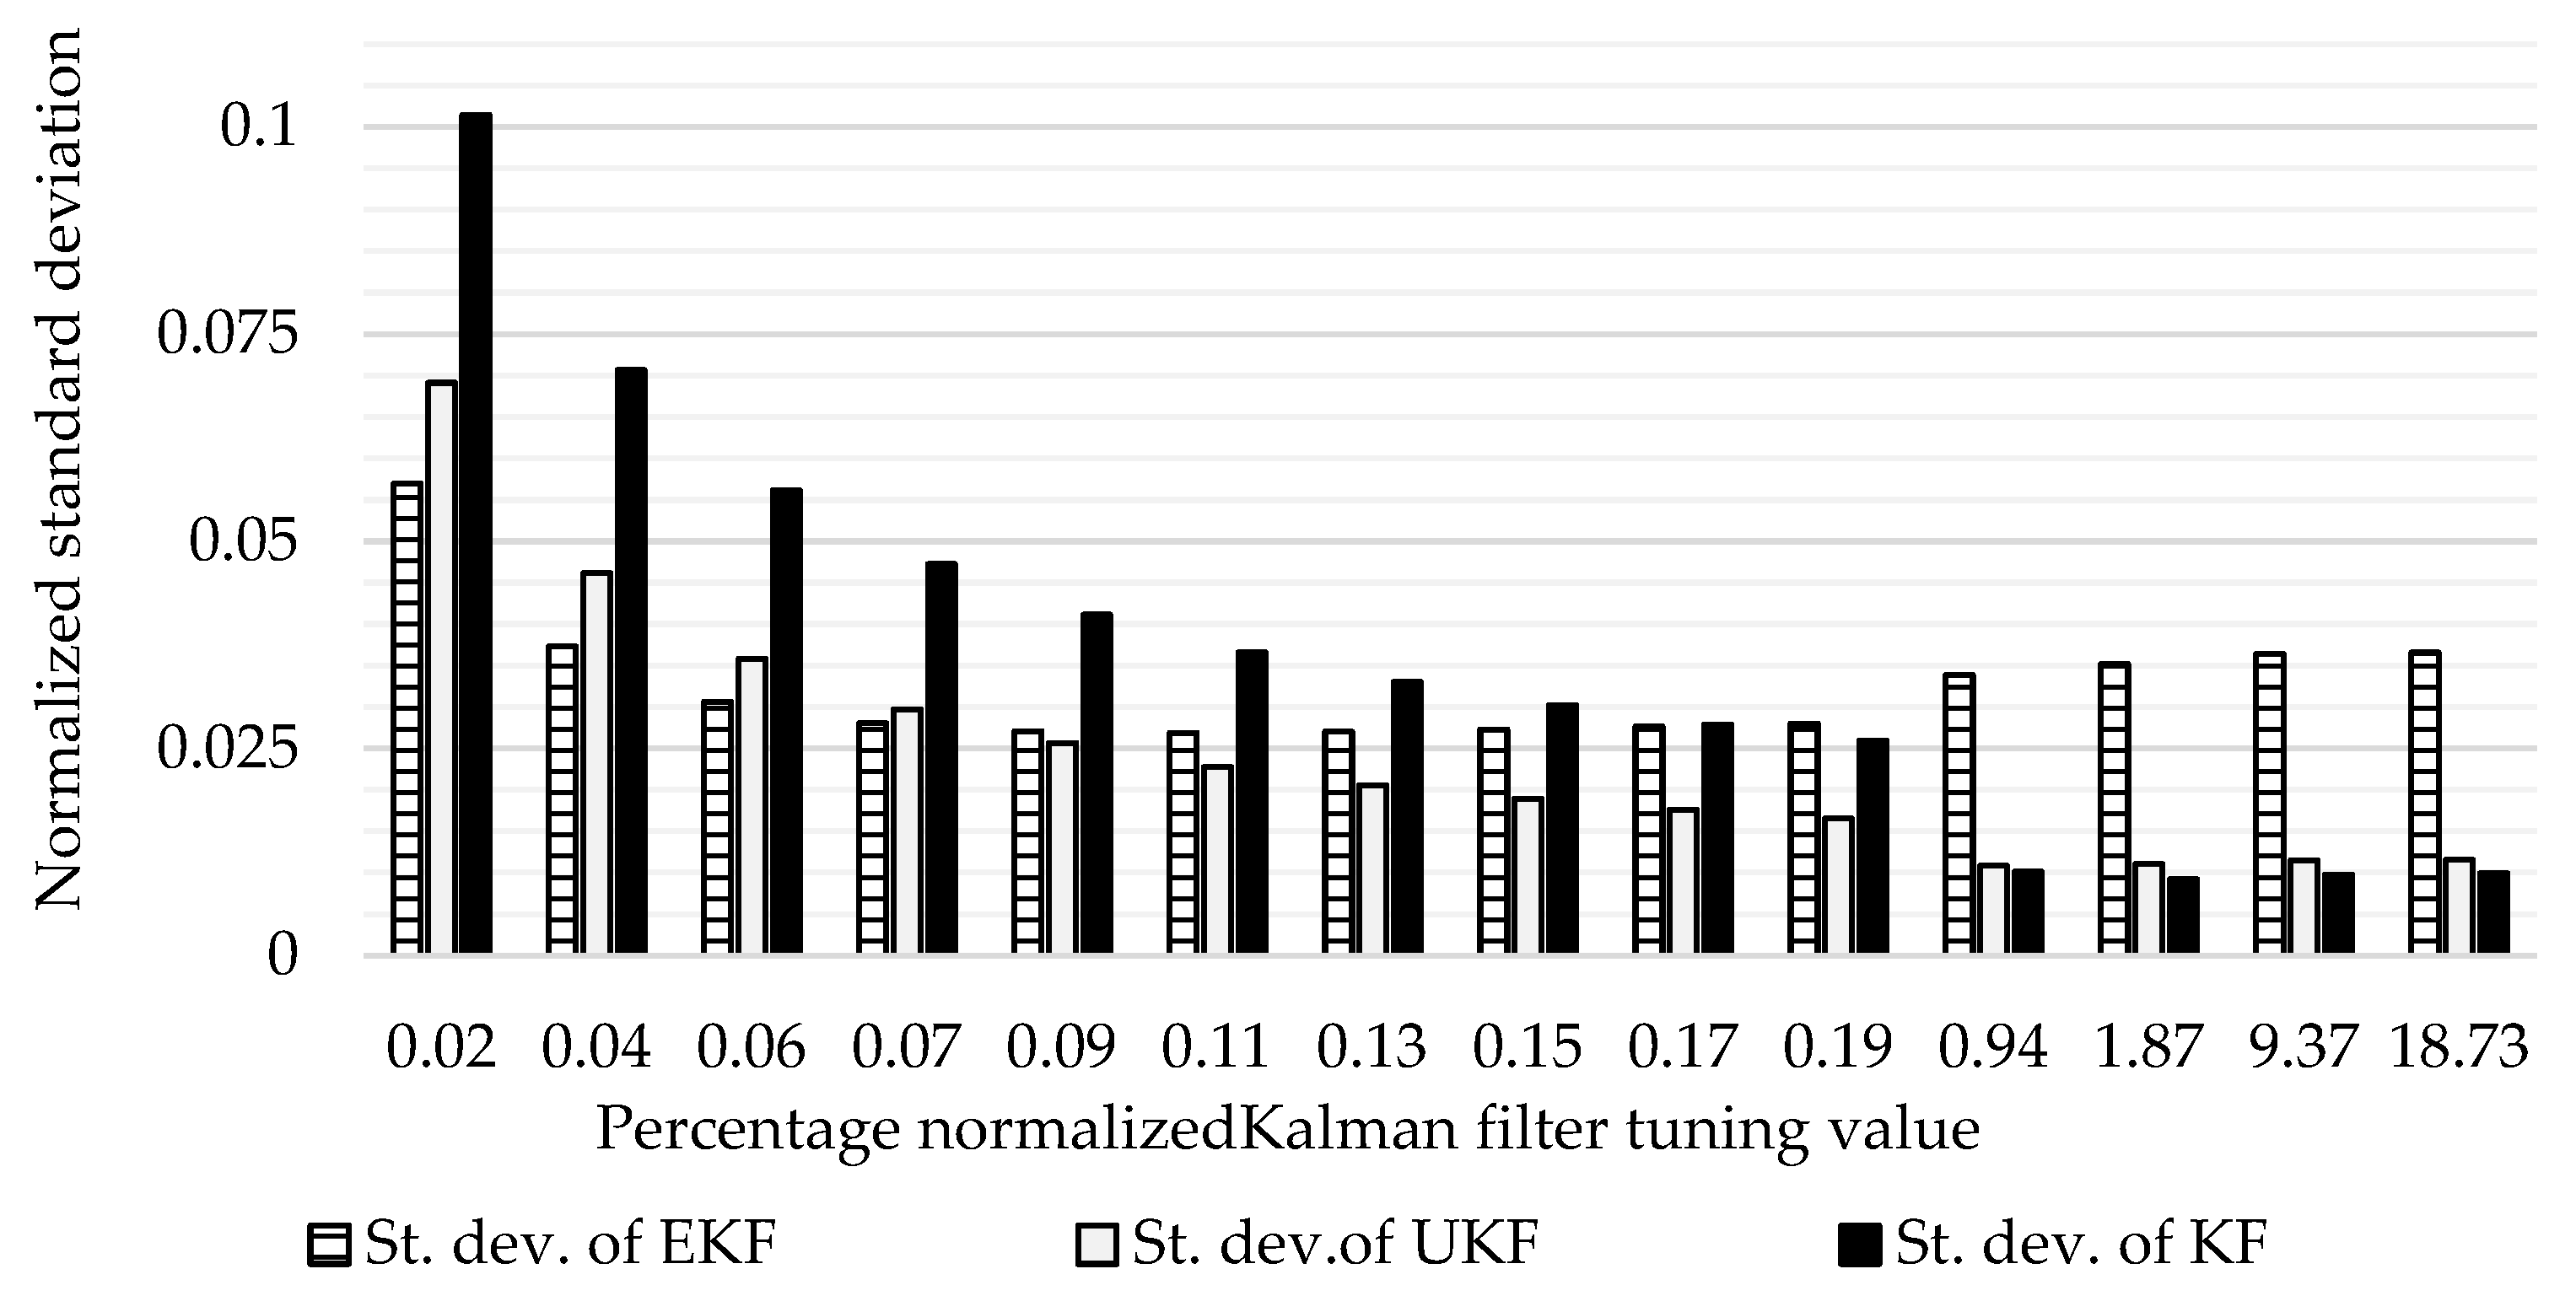
Figure 5.
The proposed smart energy hub.
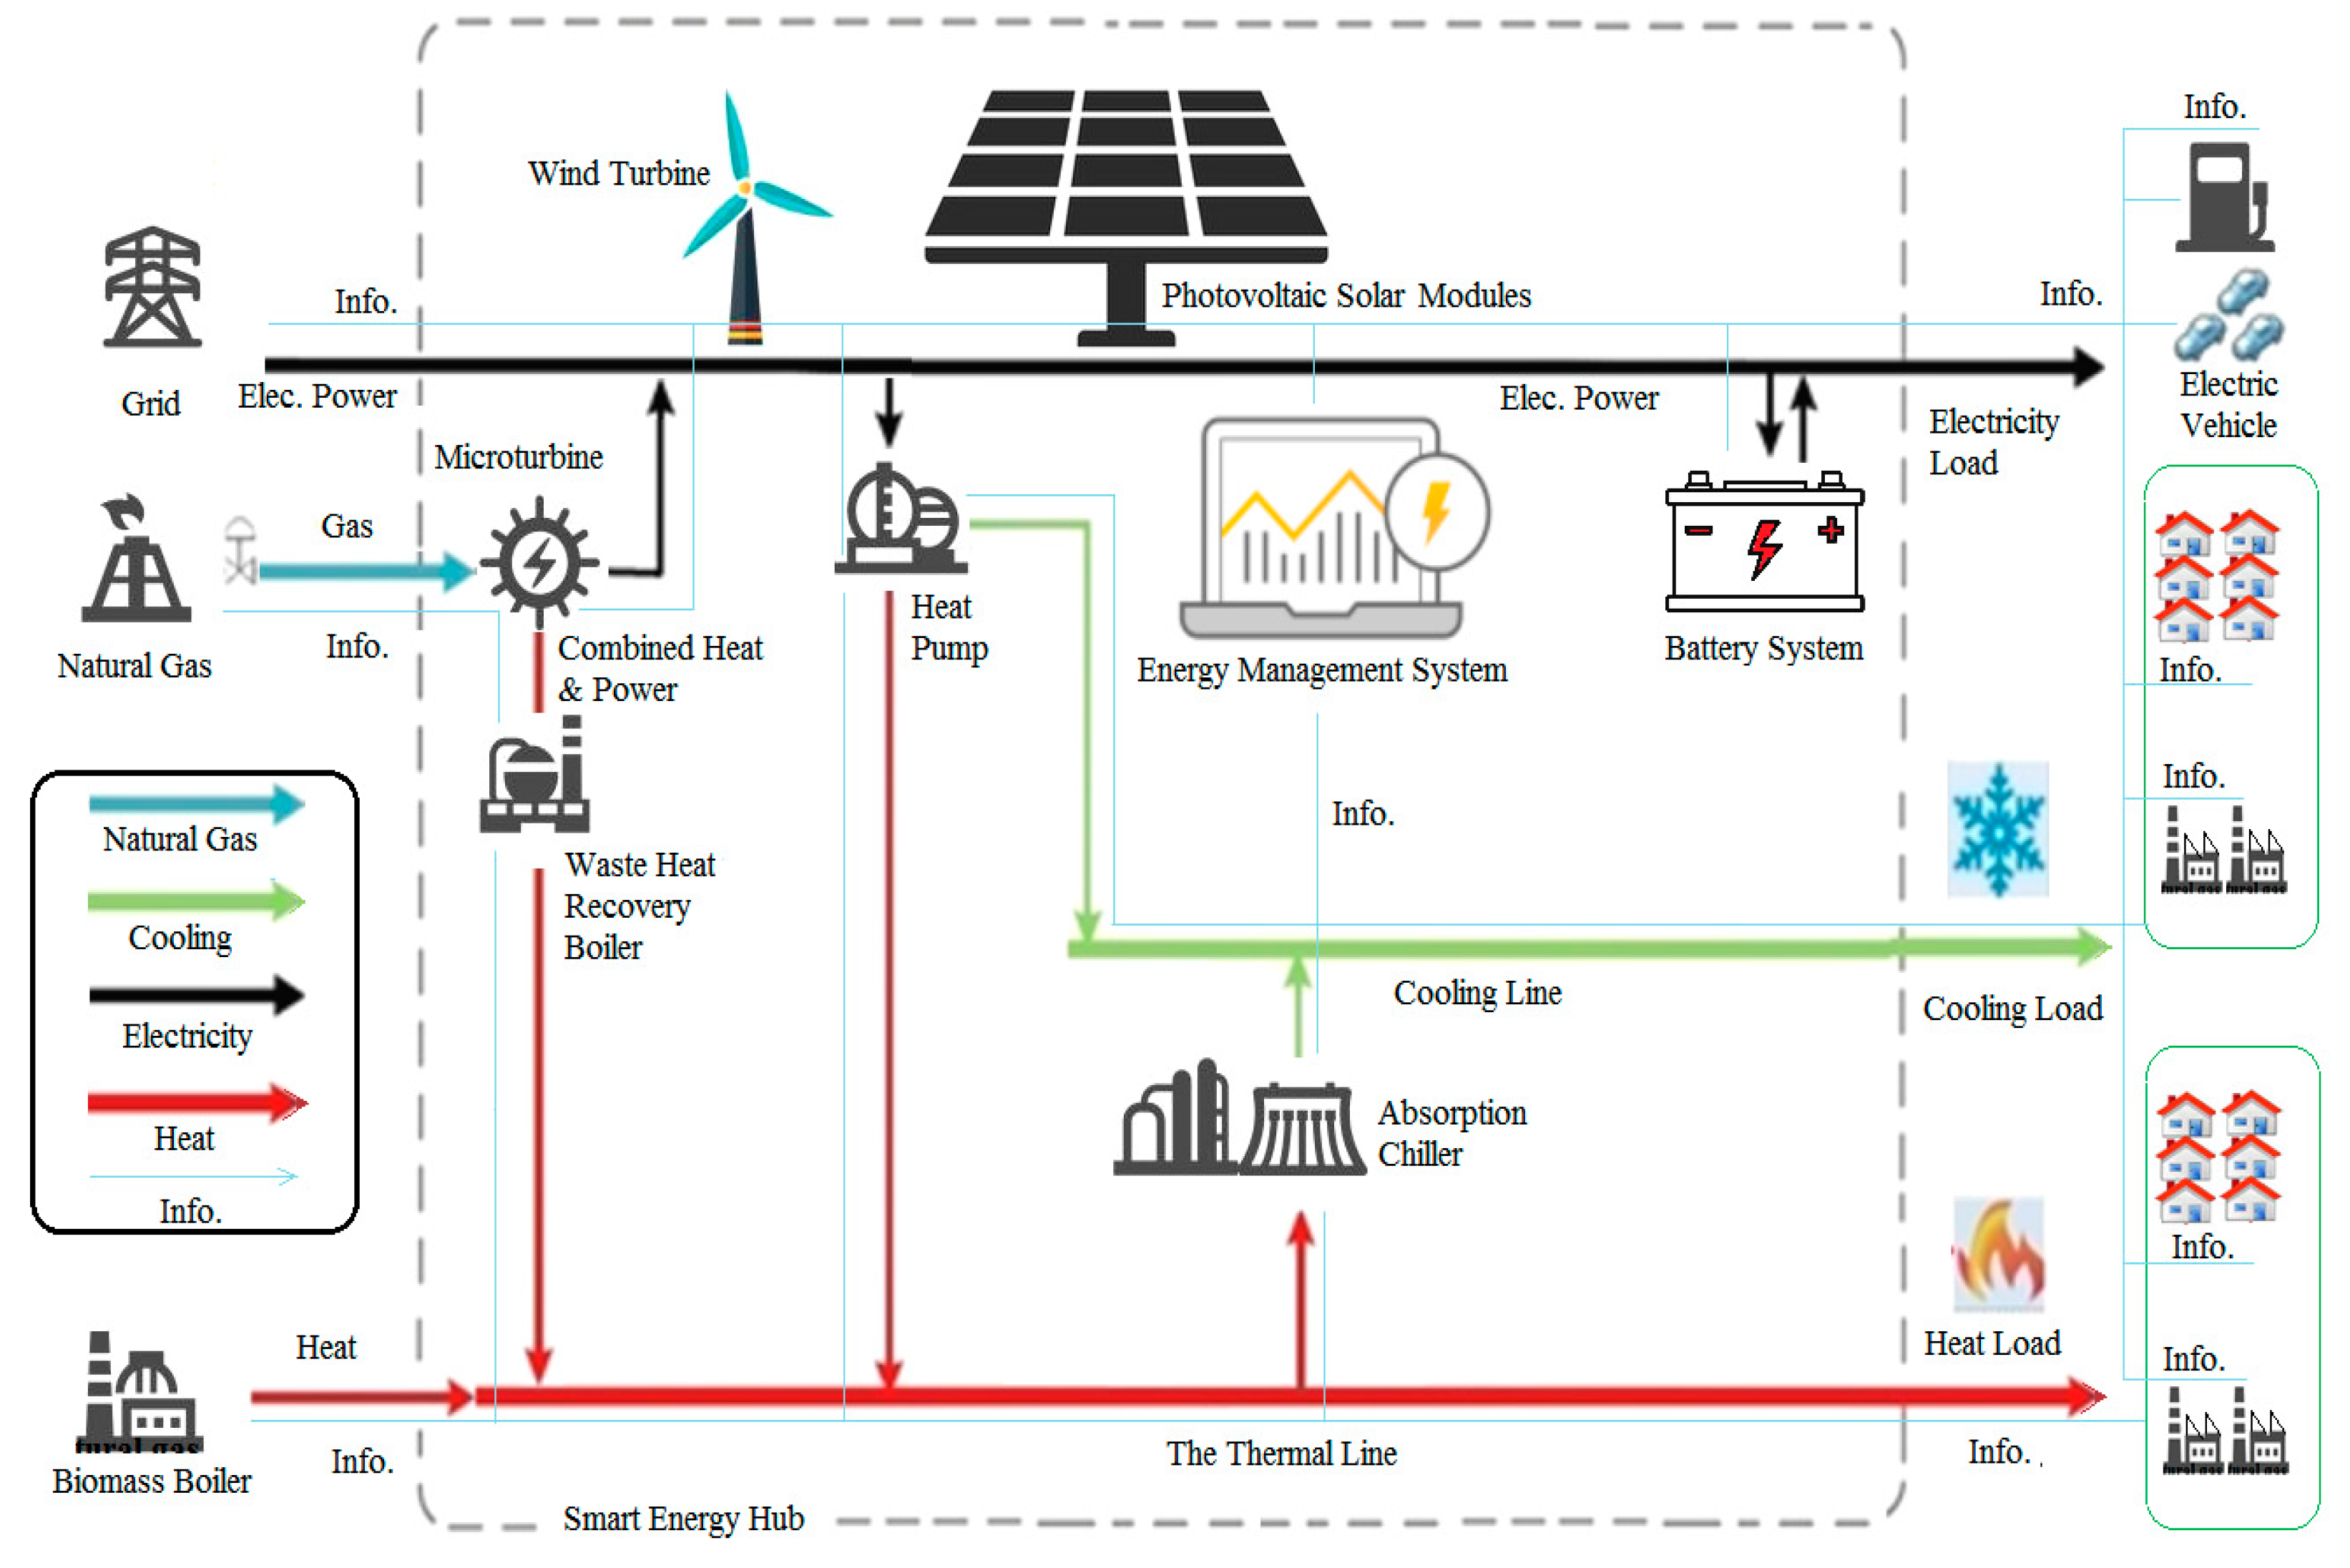
Figure 6.
(a) Grid consumed power, (b) Energy storage charged power, (c) Biomass output power, and (d) CHP output power.
Figure 6.
(a) Grid consumed power, (b) Energy storage charged power, (c) Biomass output power, and (d) CHP output power.
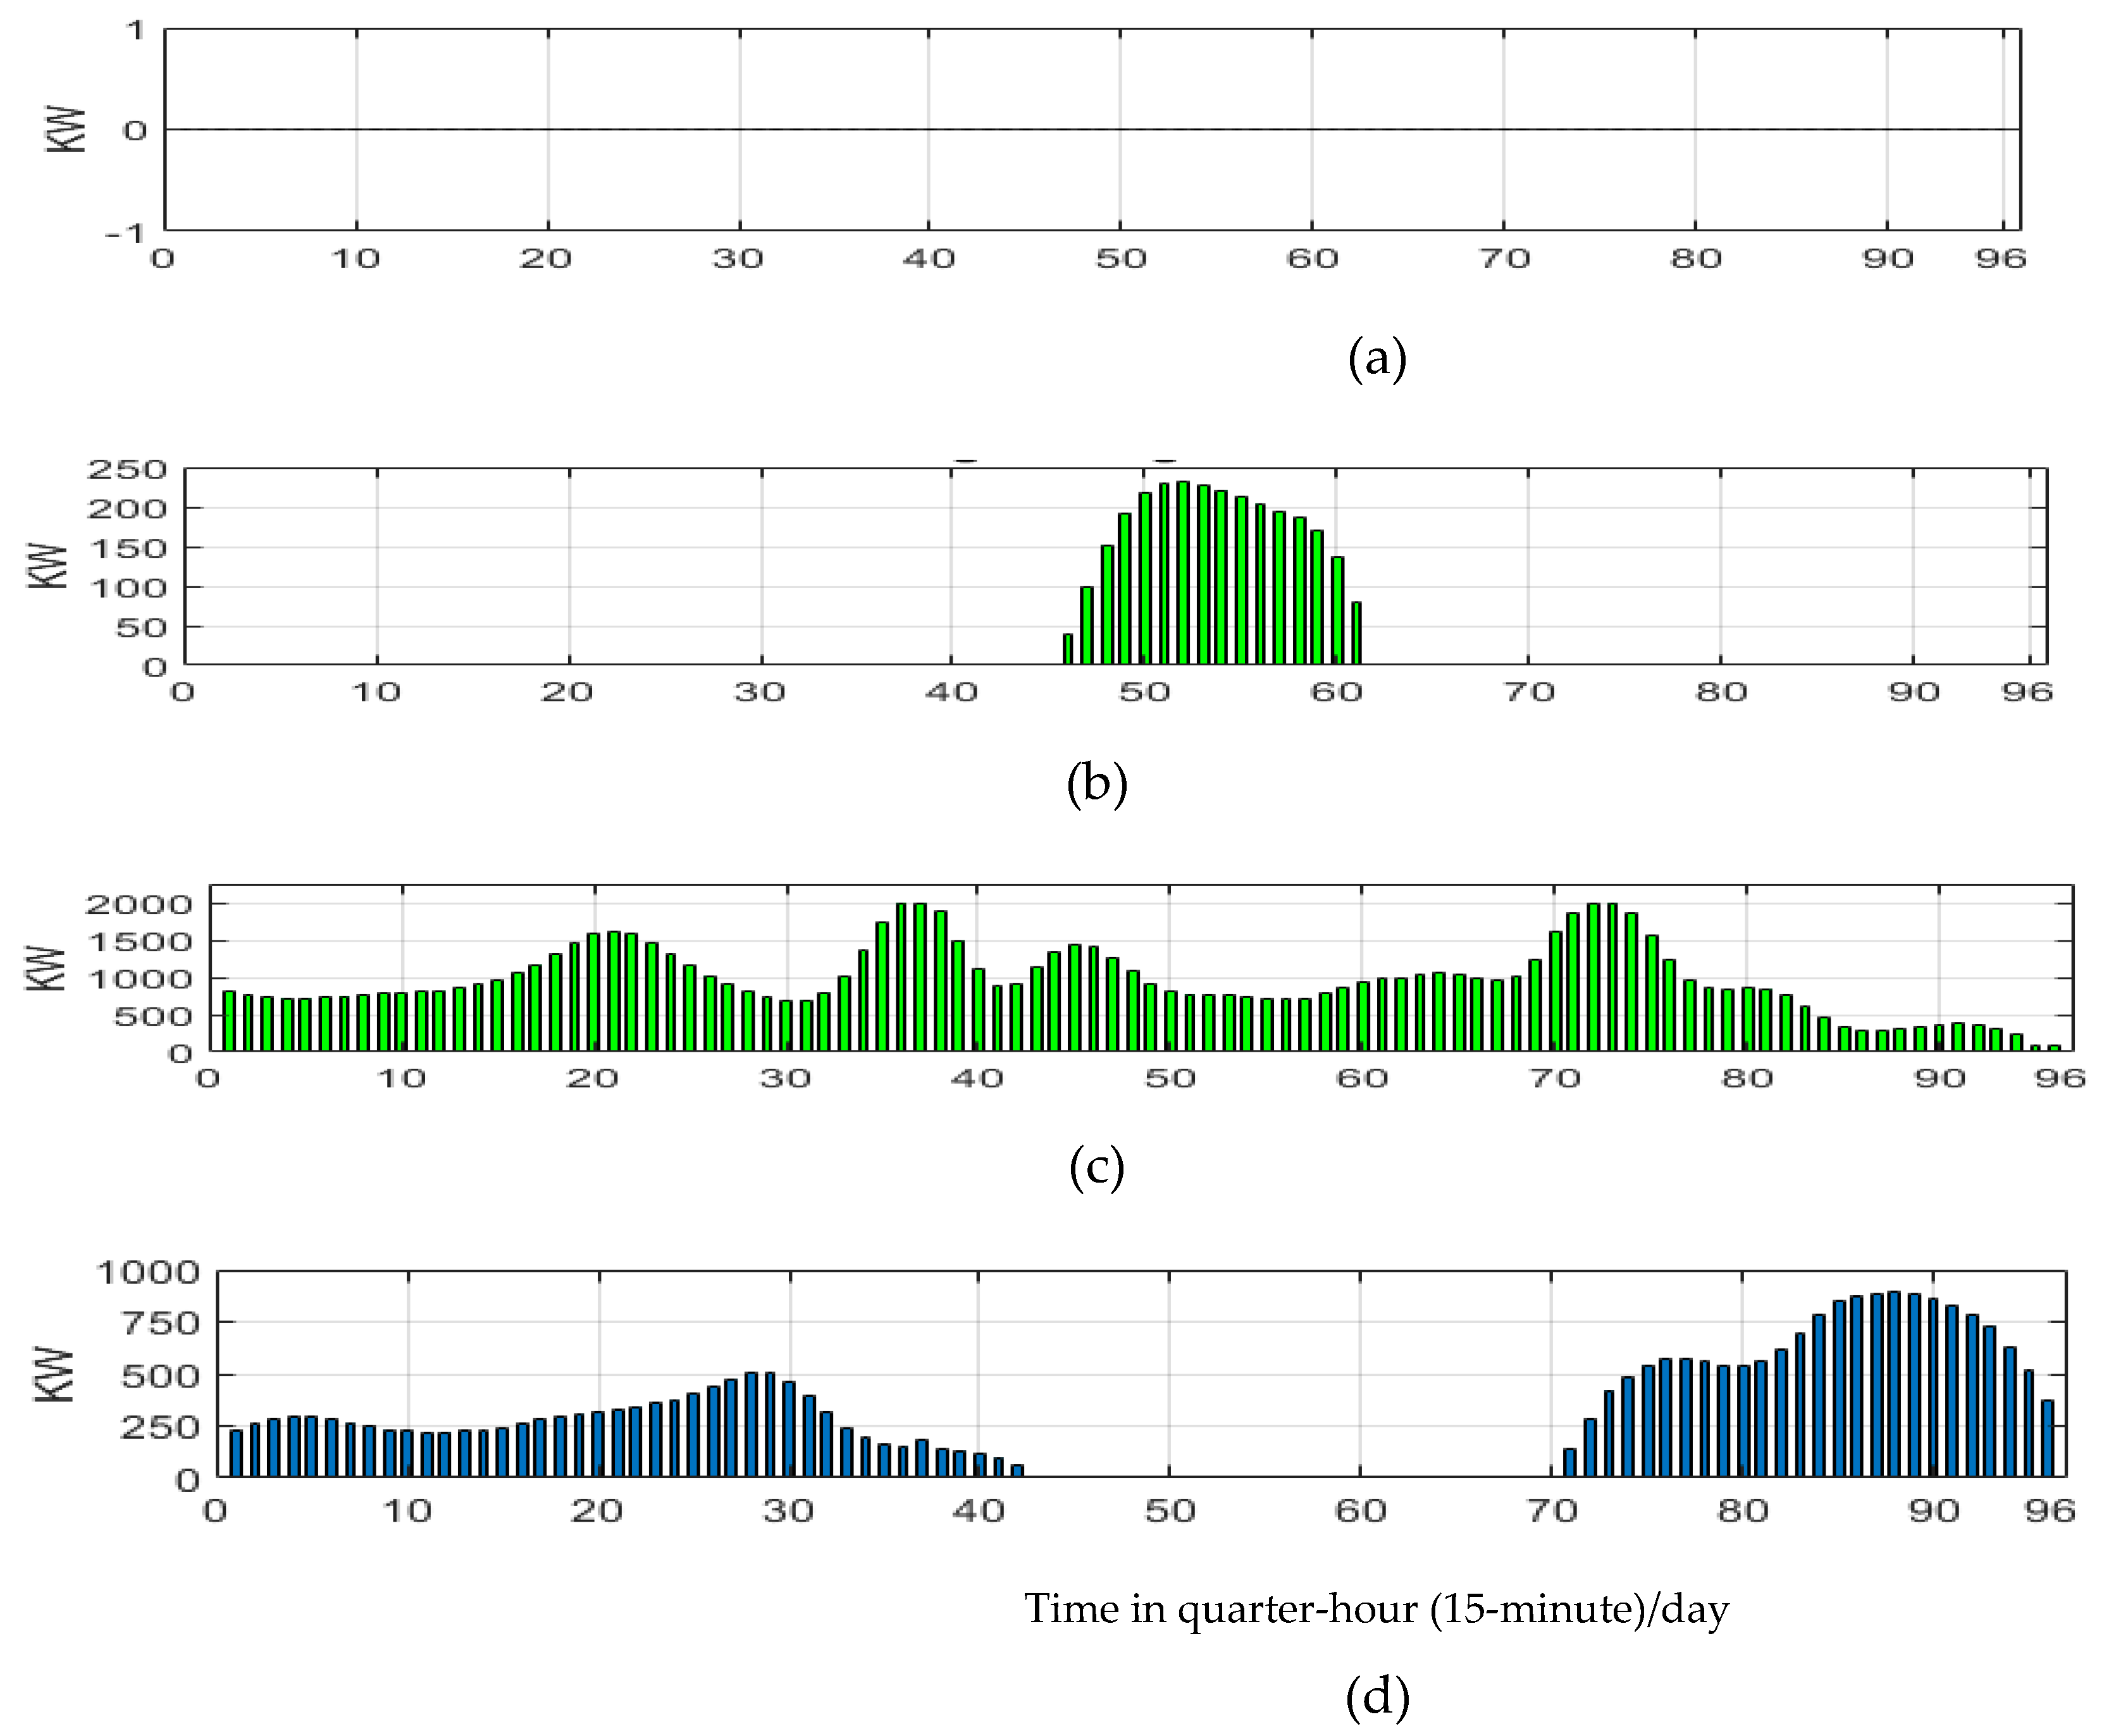
Figure 7.
Sensitivity of capacity power sources.
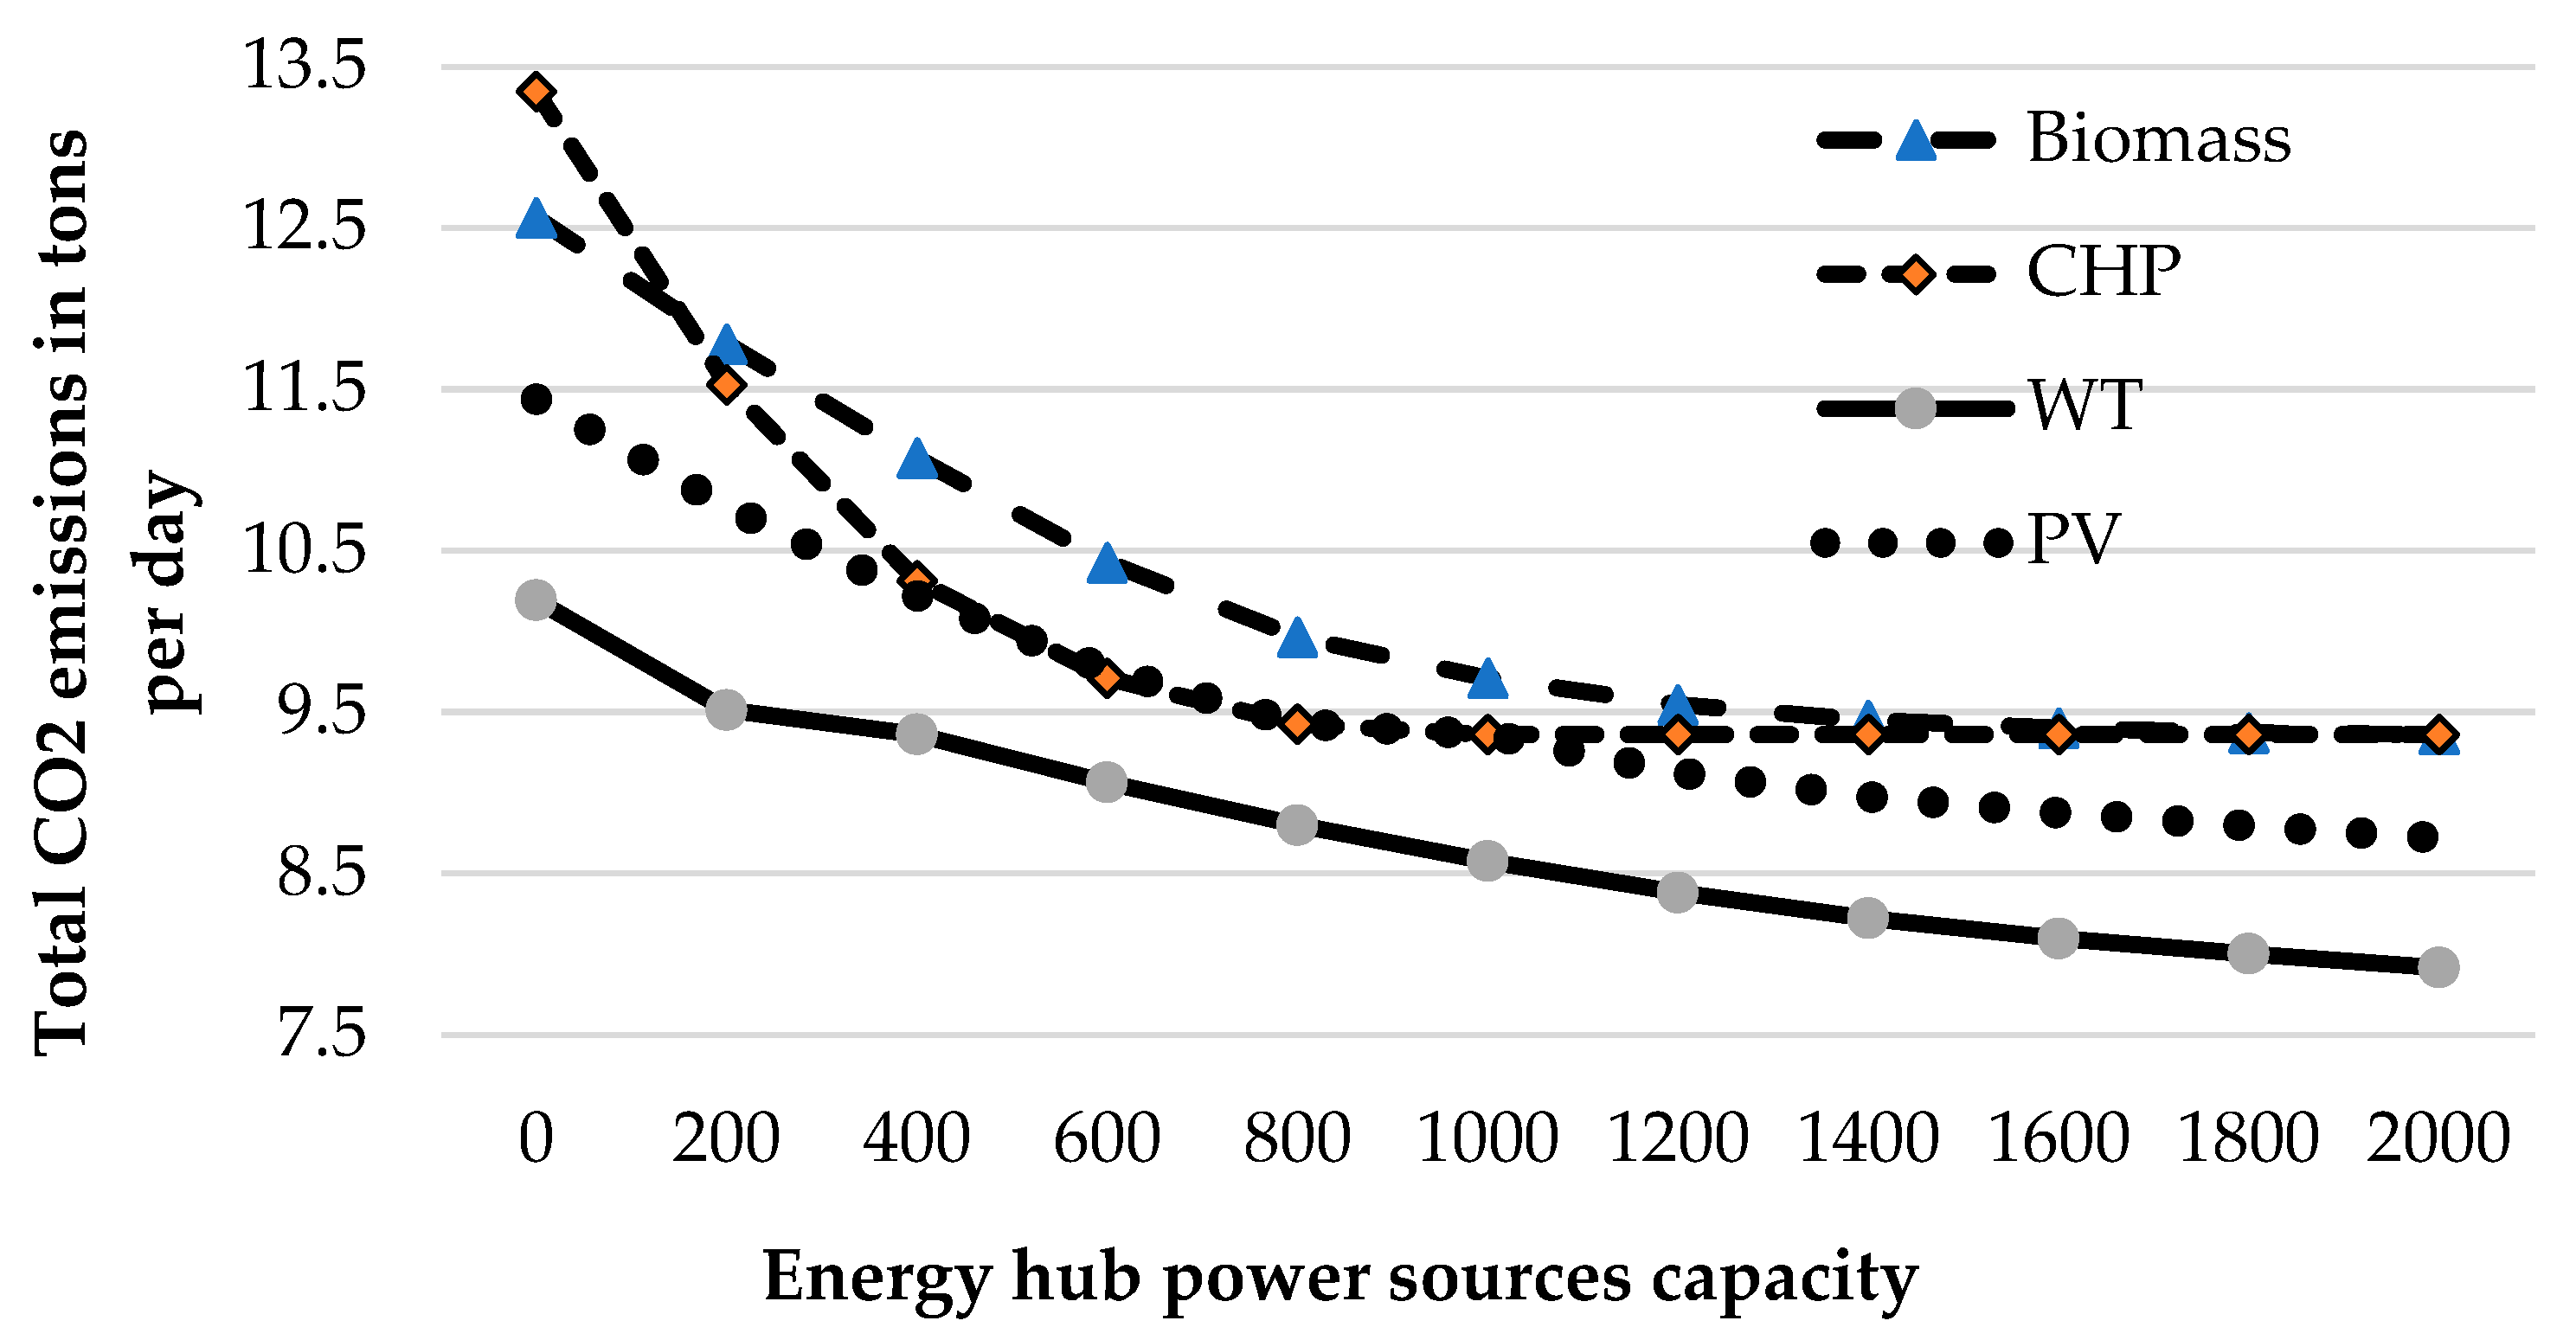
Figure 9.
Shows (a) The grid consumed power, (b) The biomass output power and (c) CHP output power.
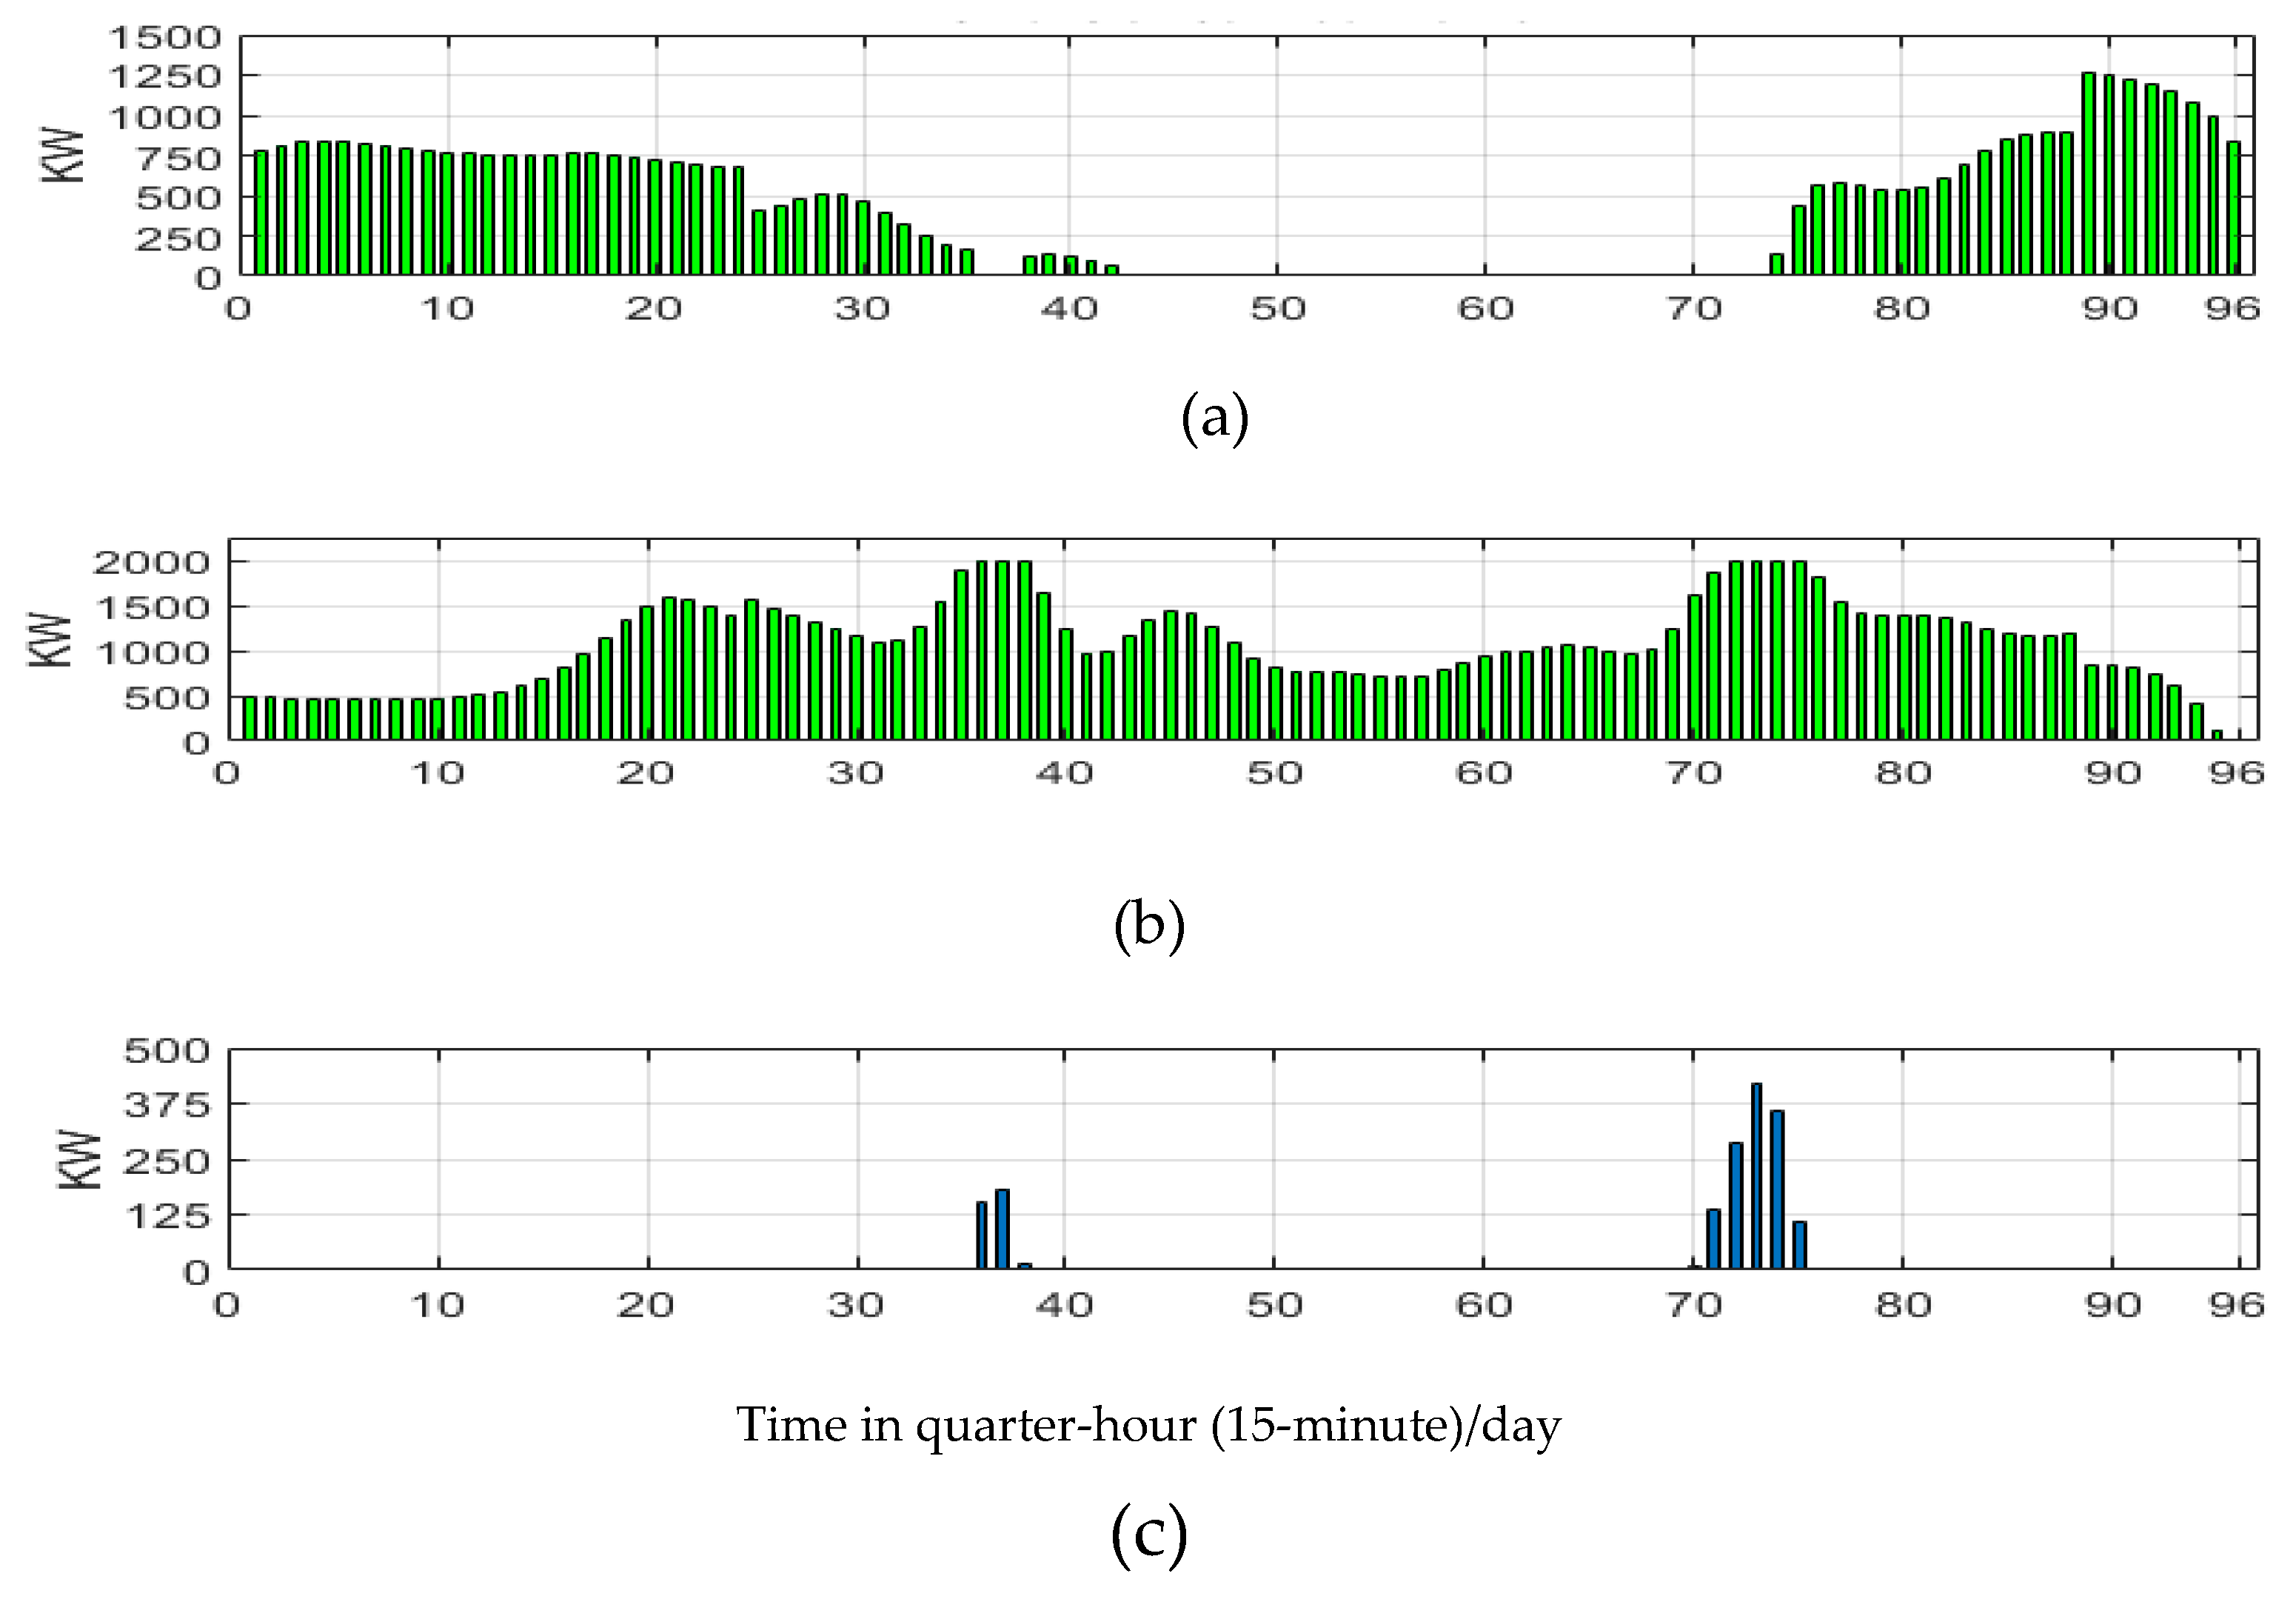
Figure 10.
Shows (a) Storage charged/discharge power, and (b) Grid import/export power.
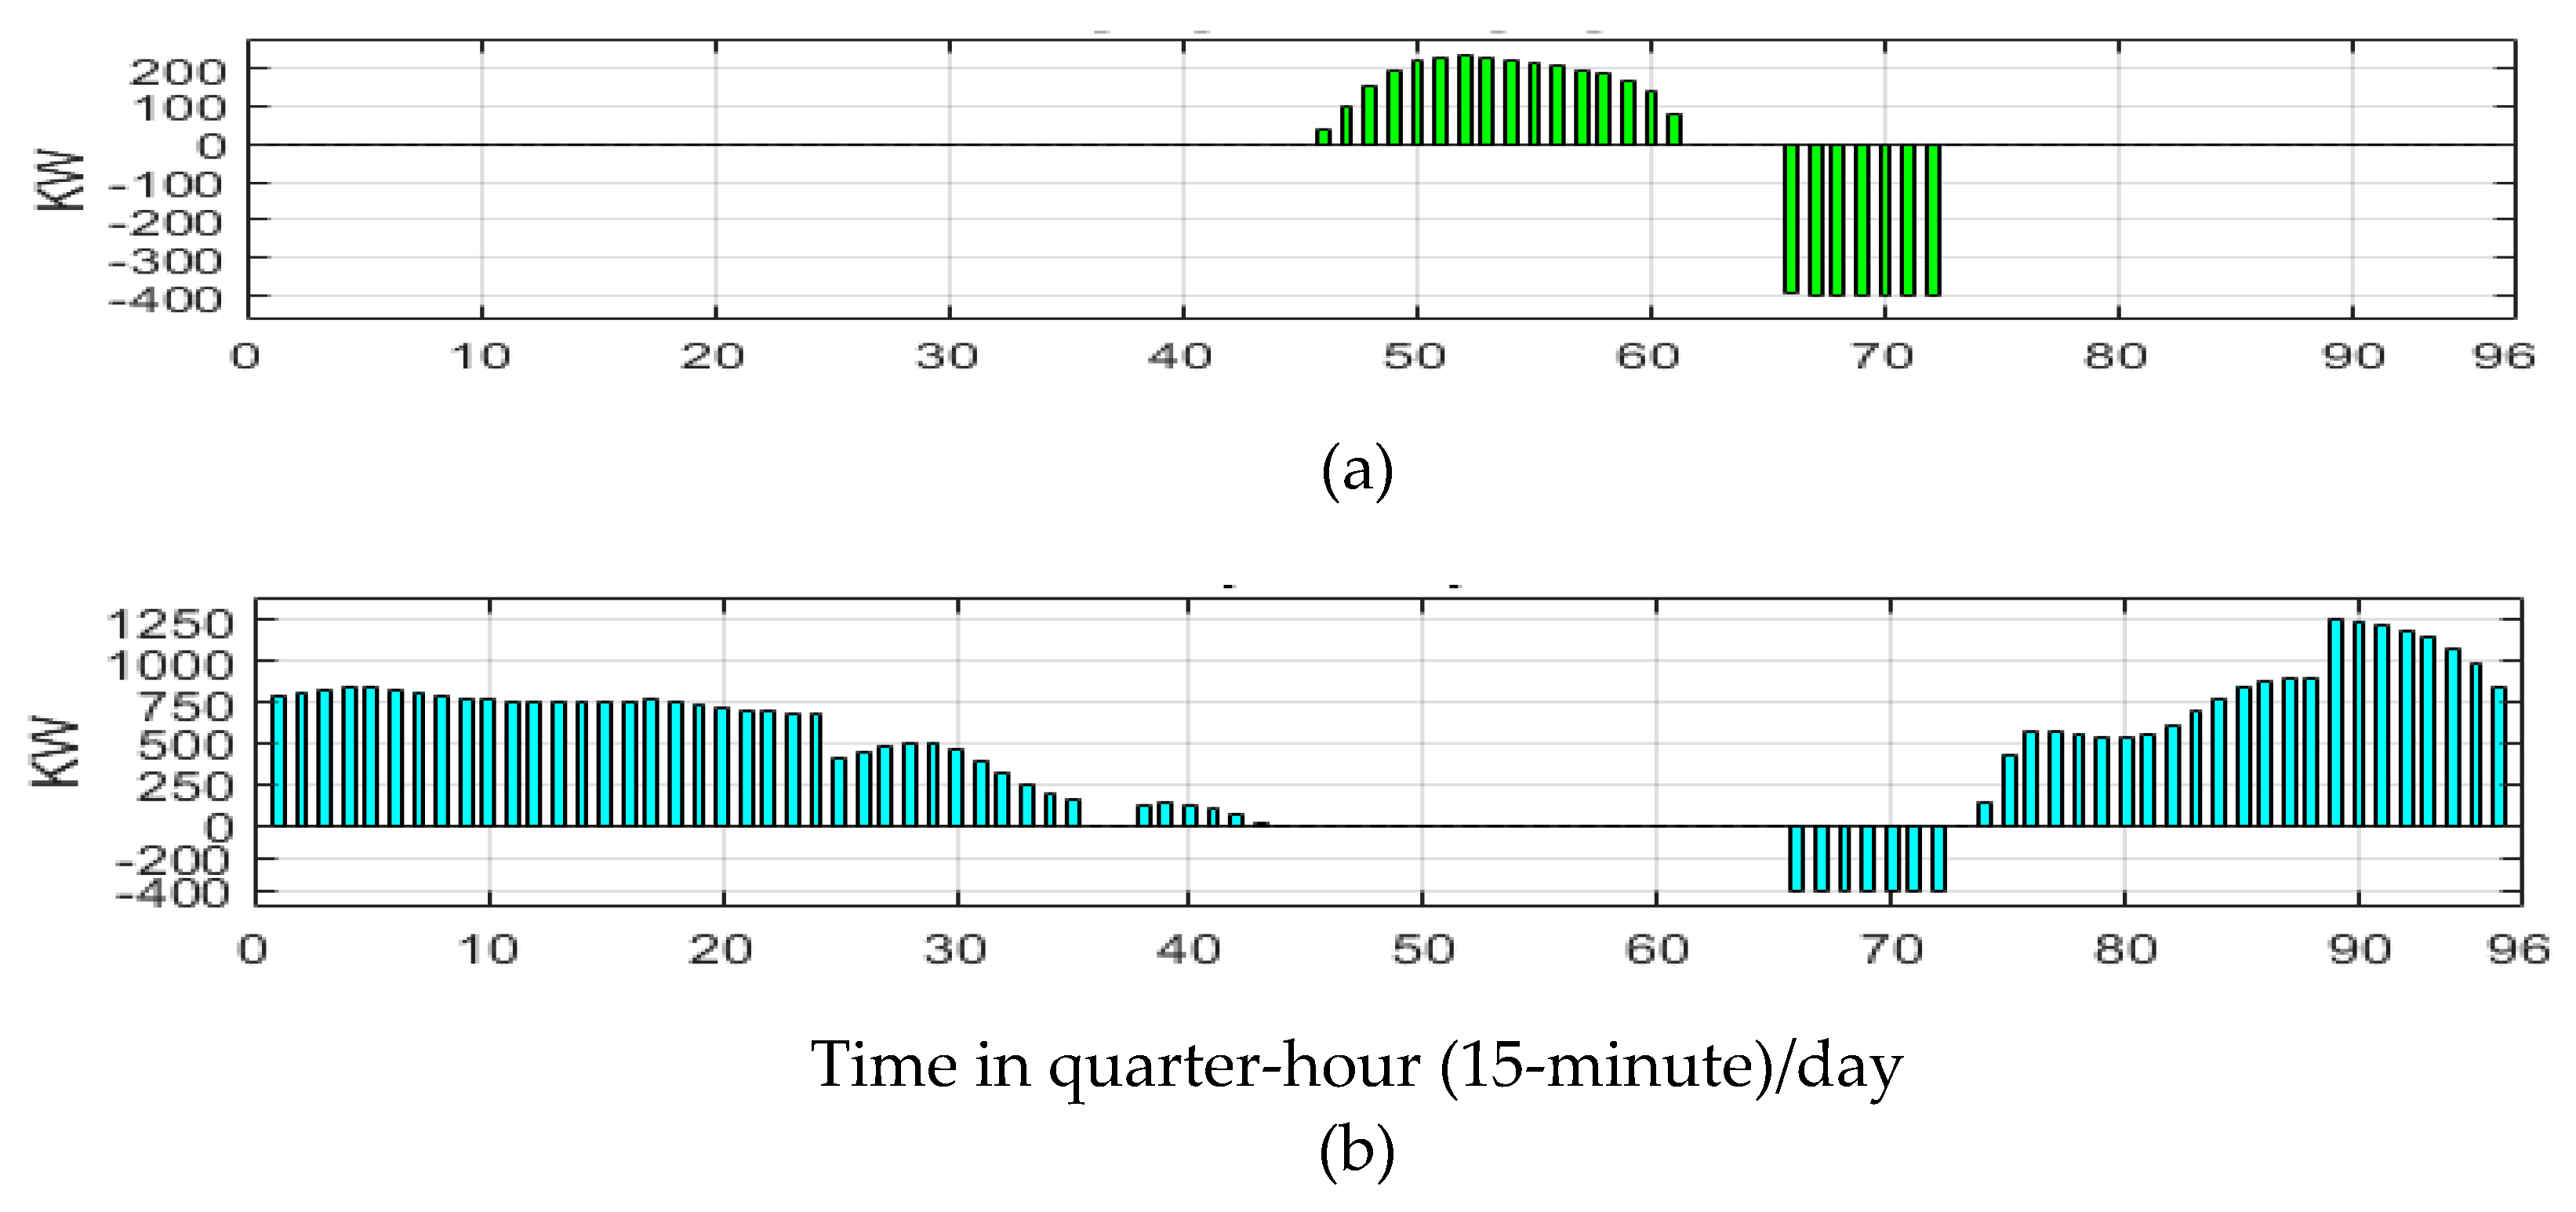
Figure 11.
Sensitivity of running cost of the power sources.
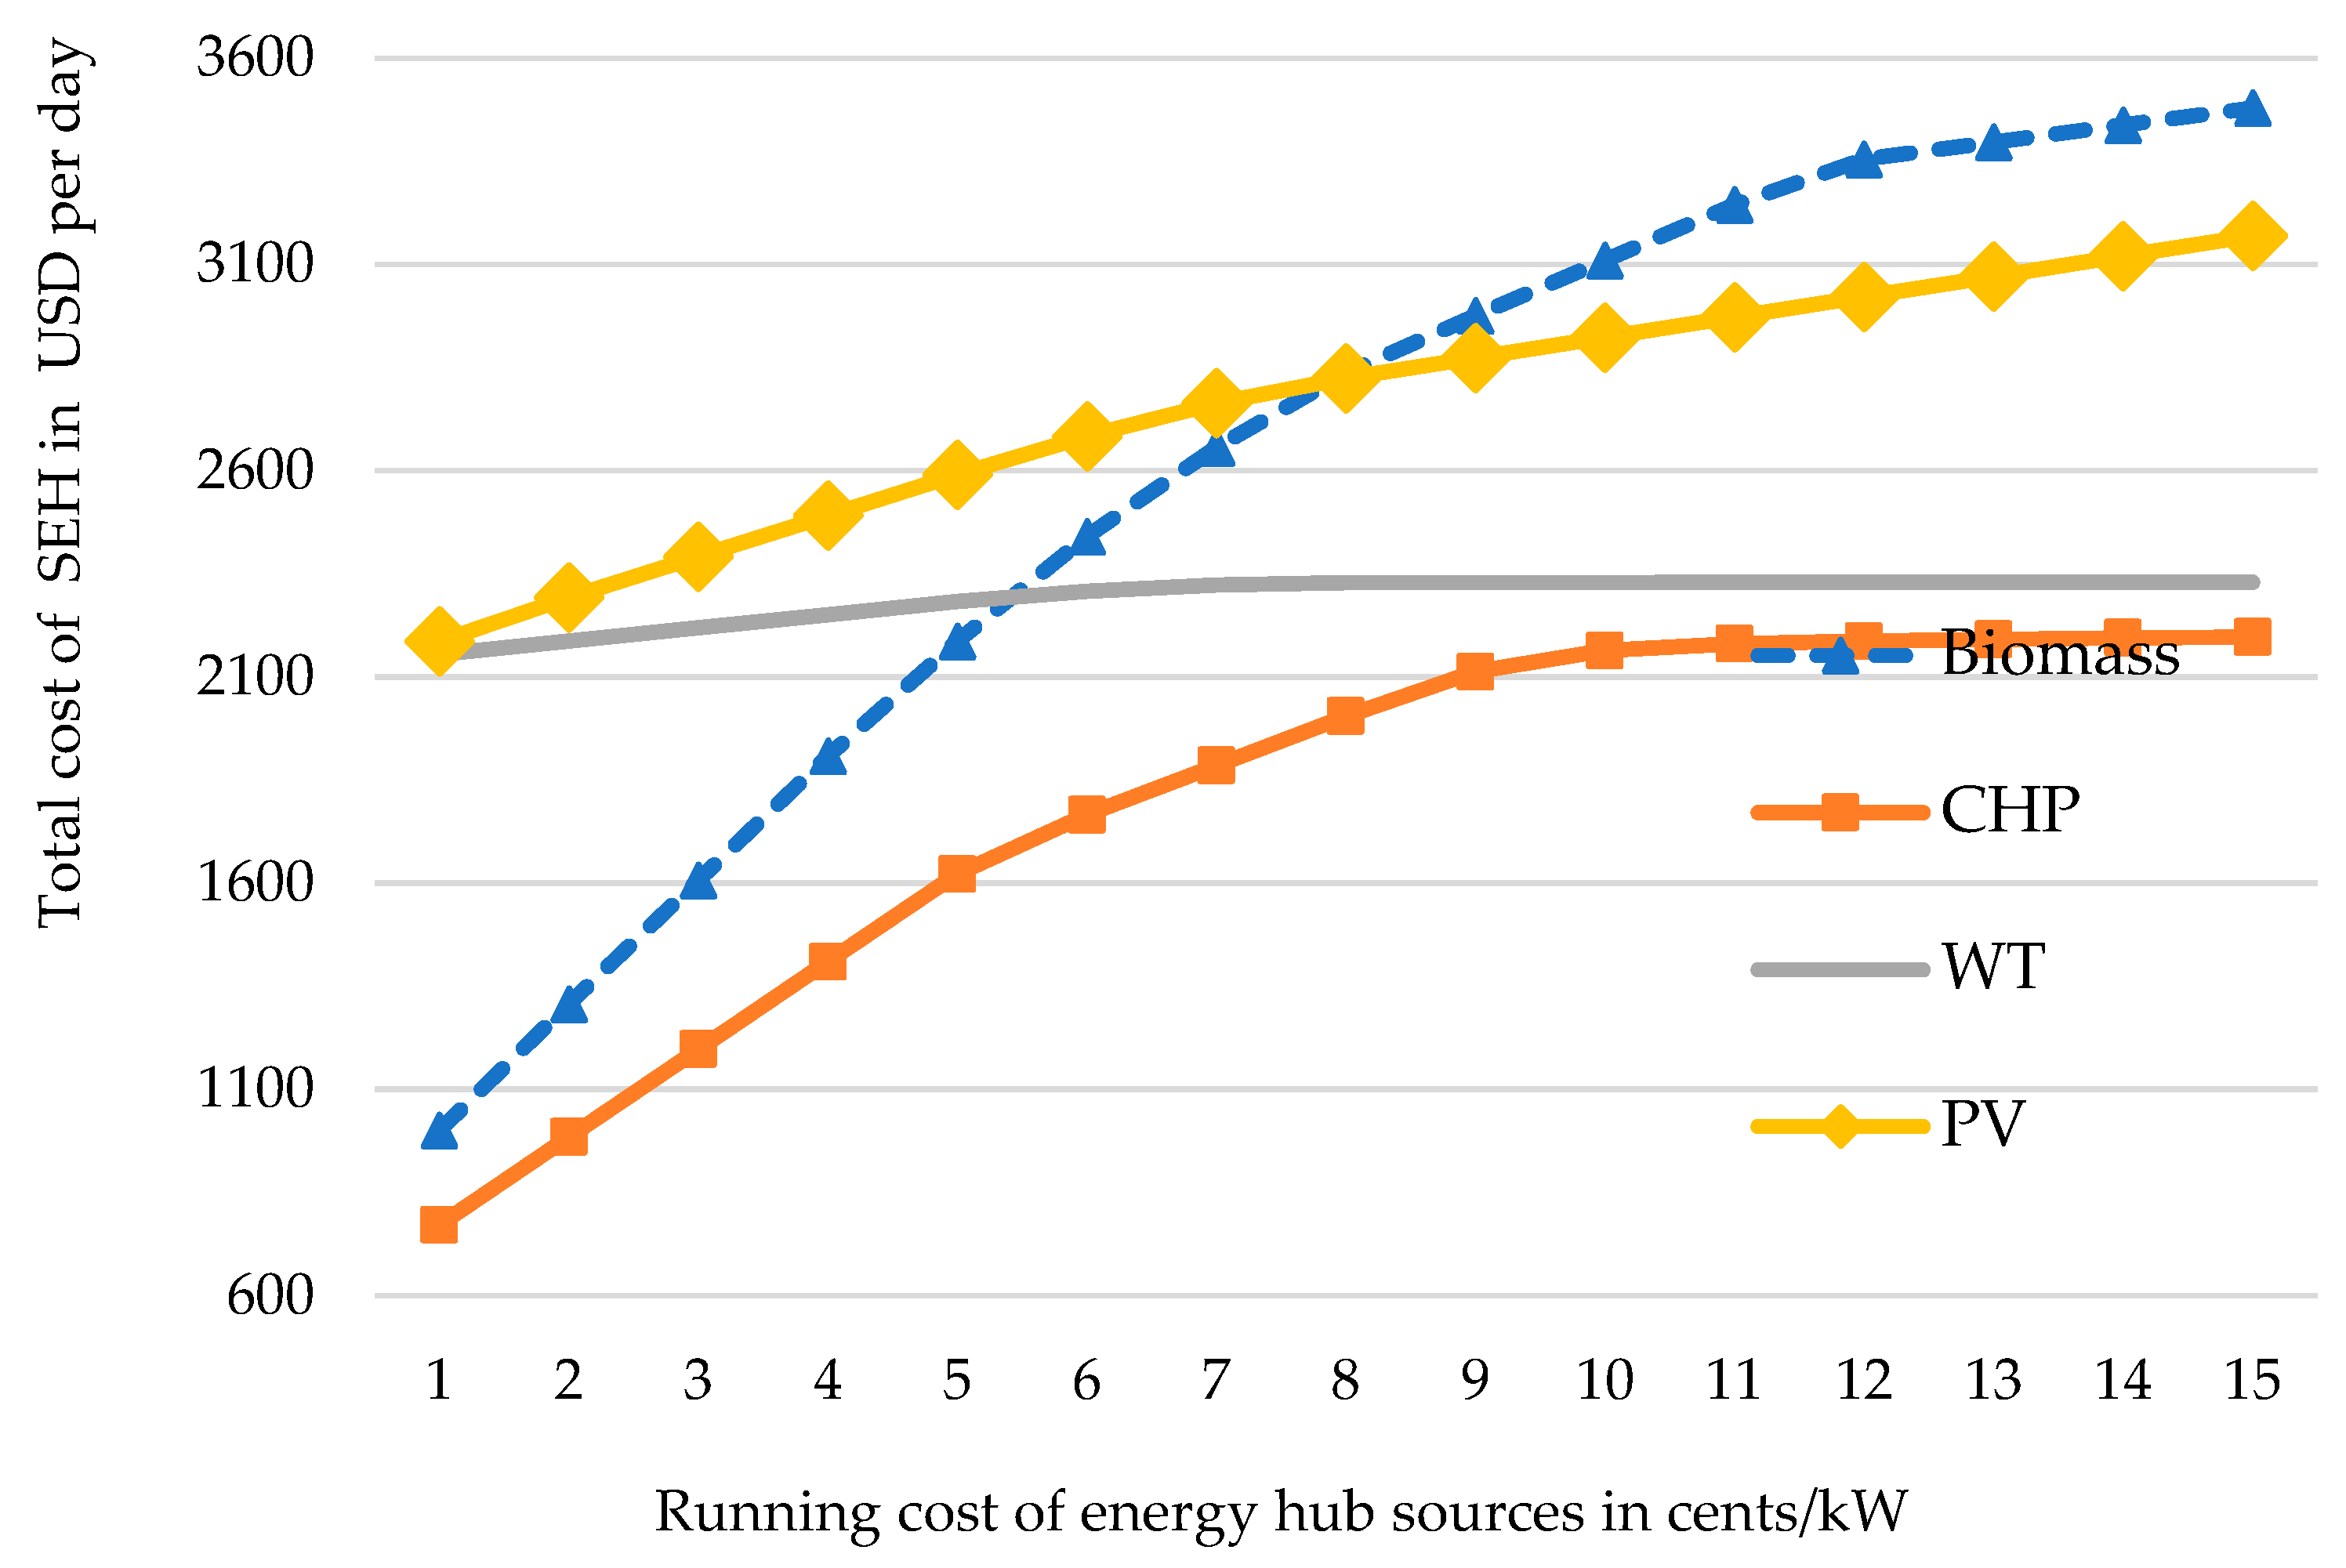
Figure 13.
RTDS simulation for the SEH.
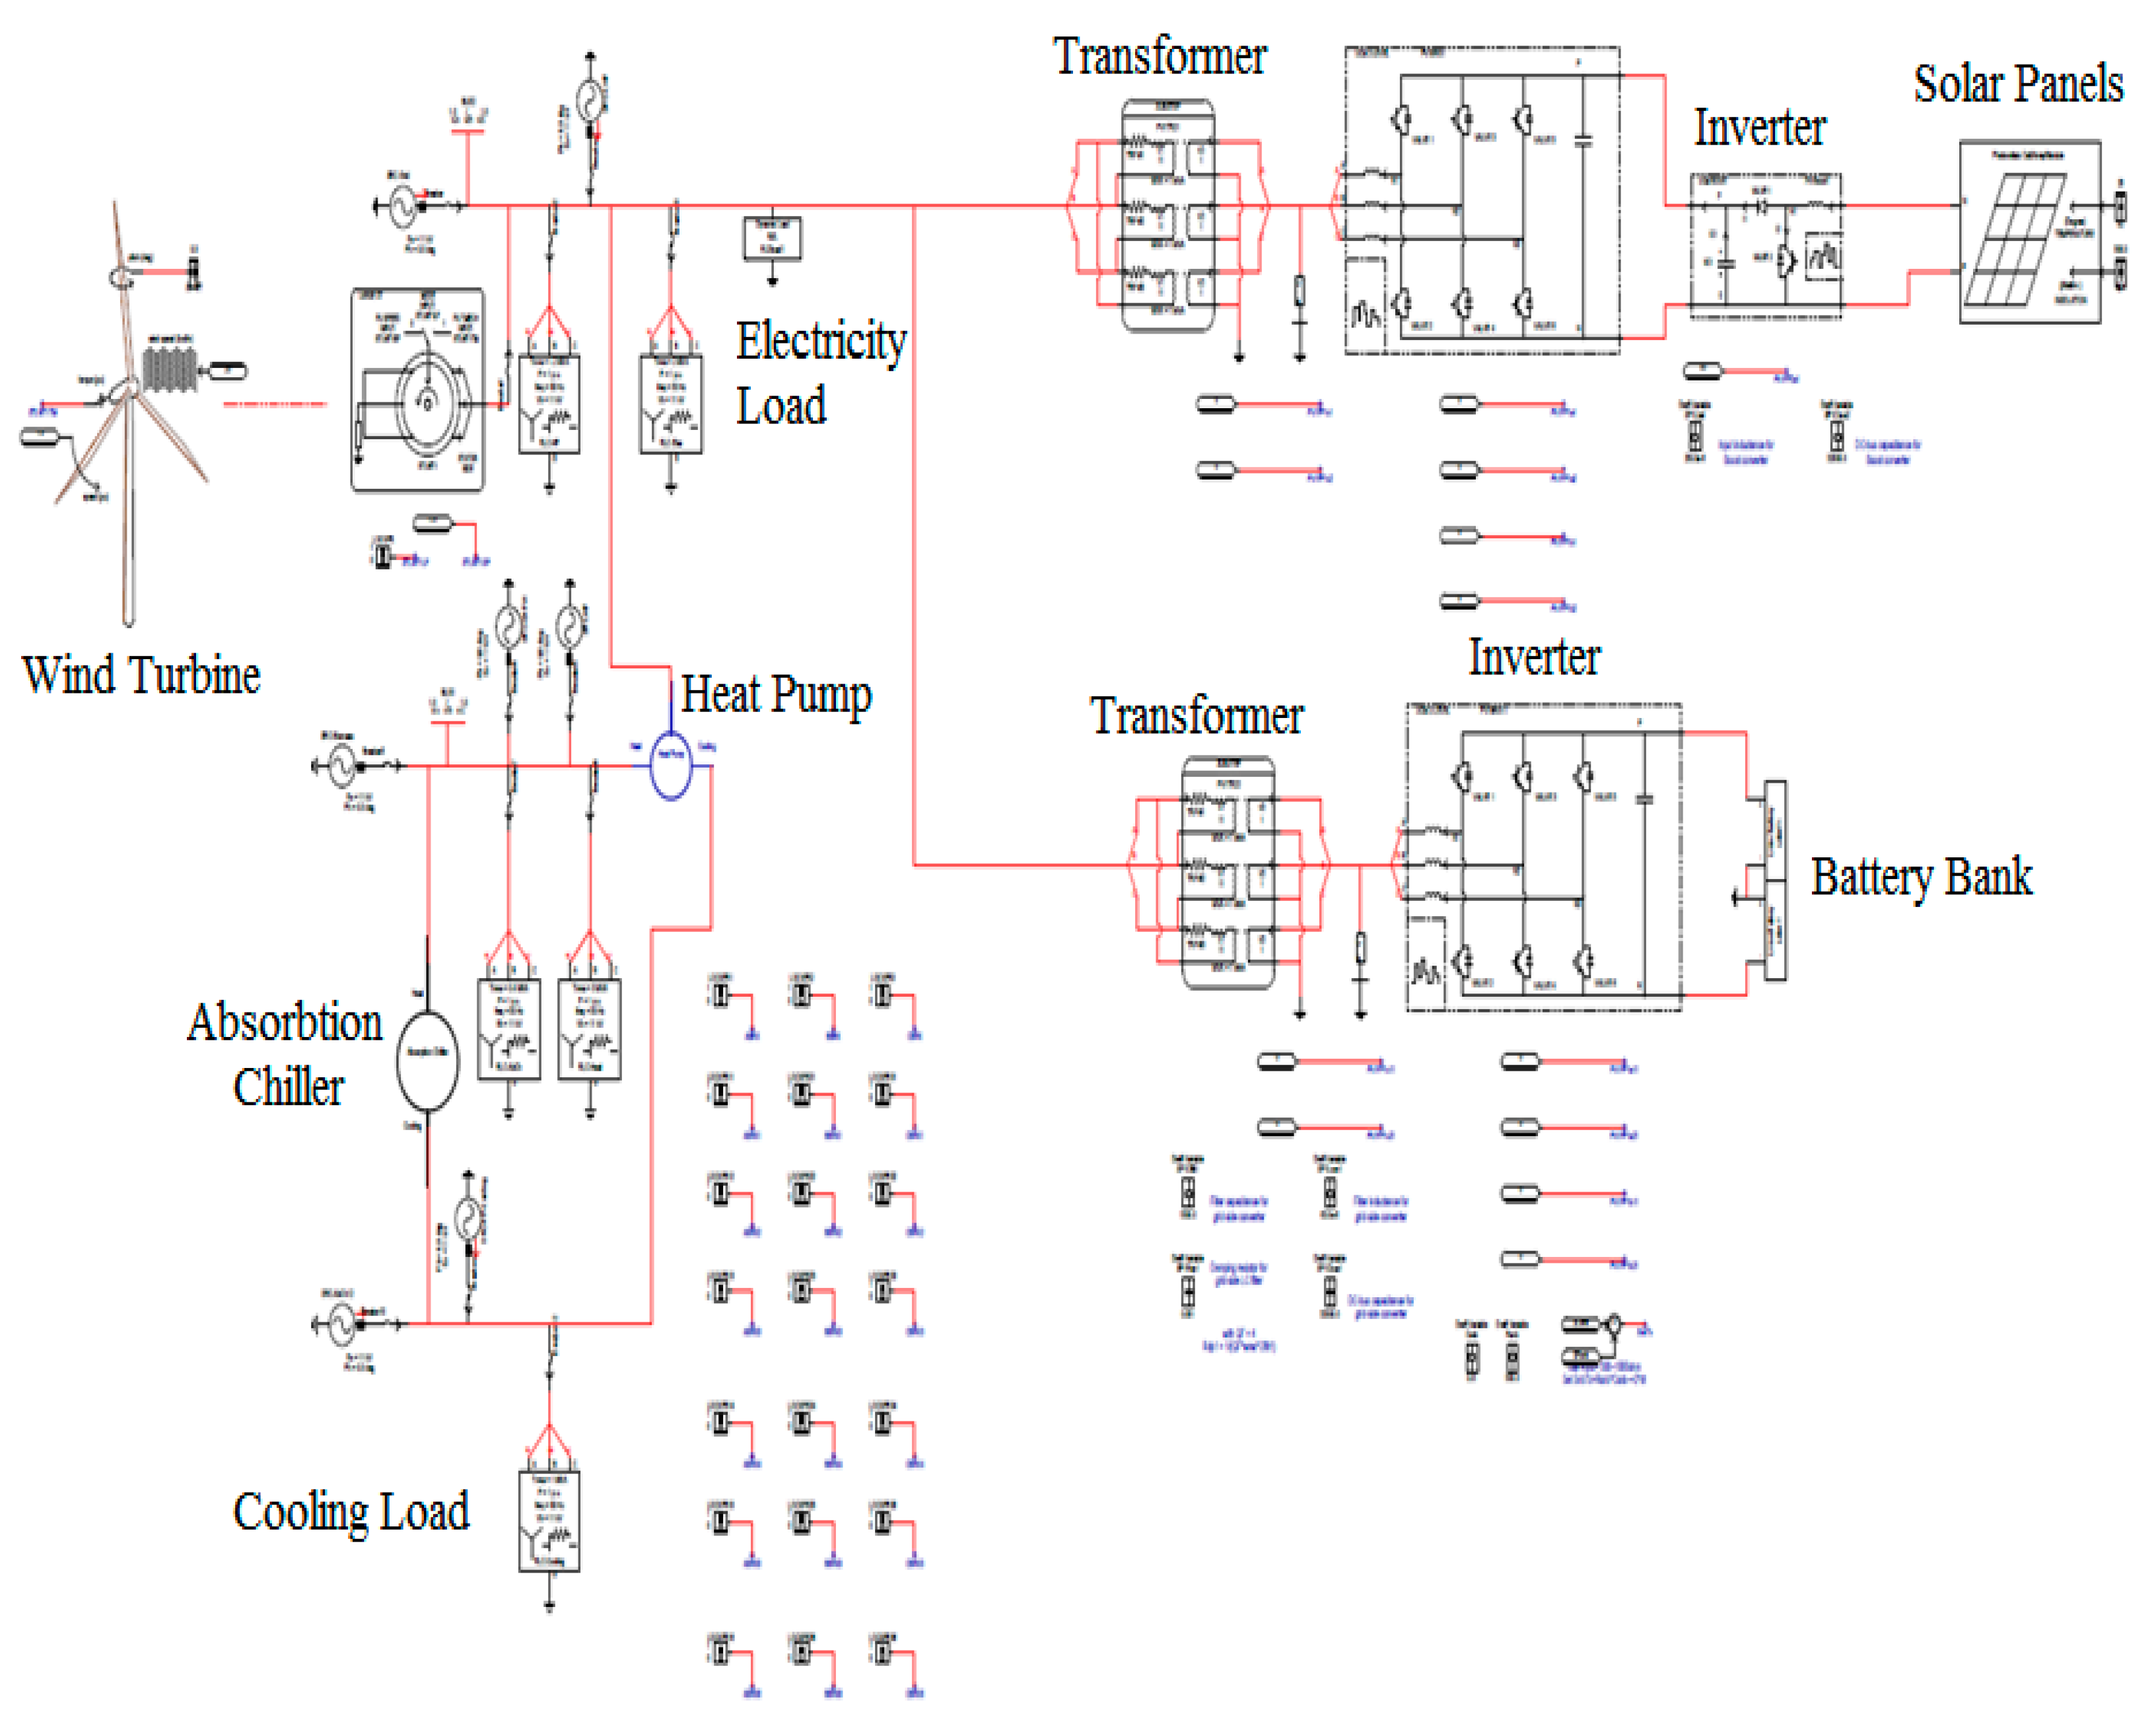
Figure 14.
RTDS results for carbon footprint optimization.
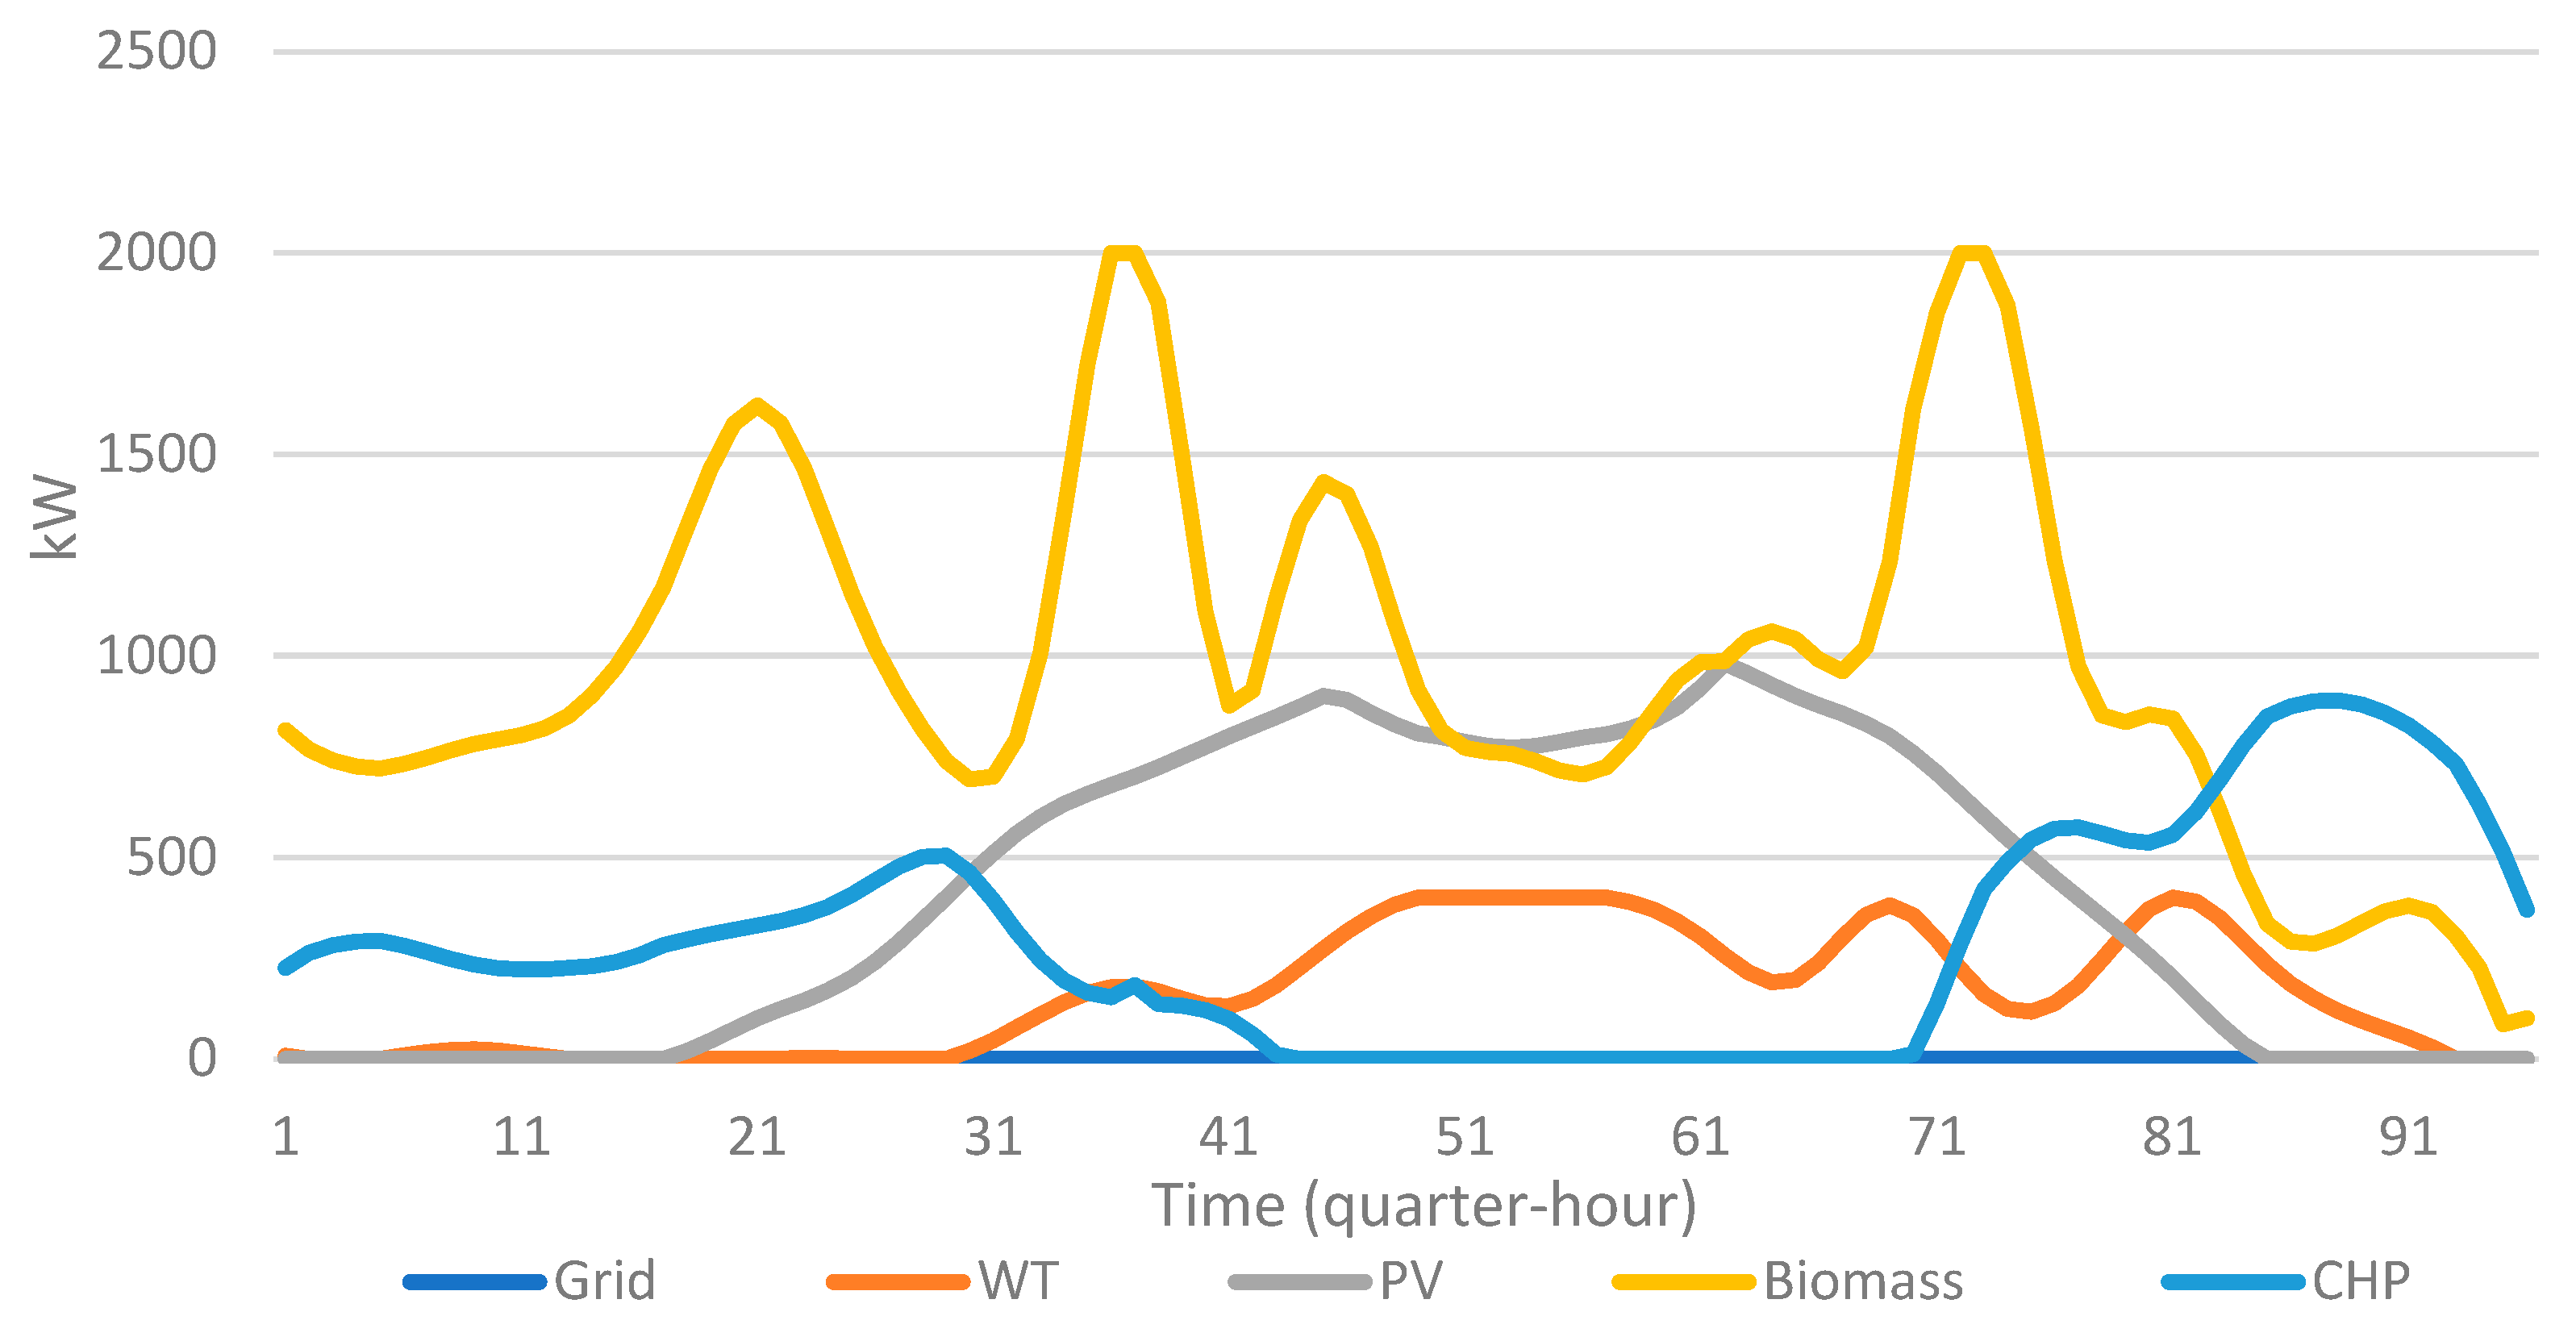
Figure 15.
RTDS results for economic optimization.
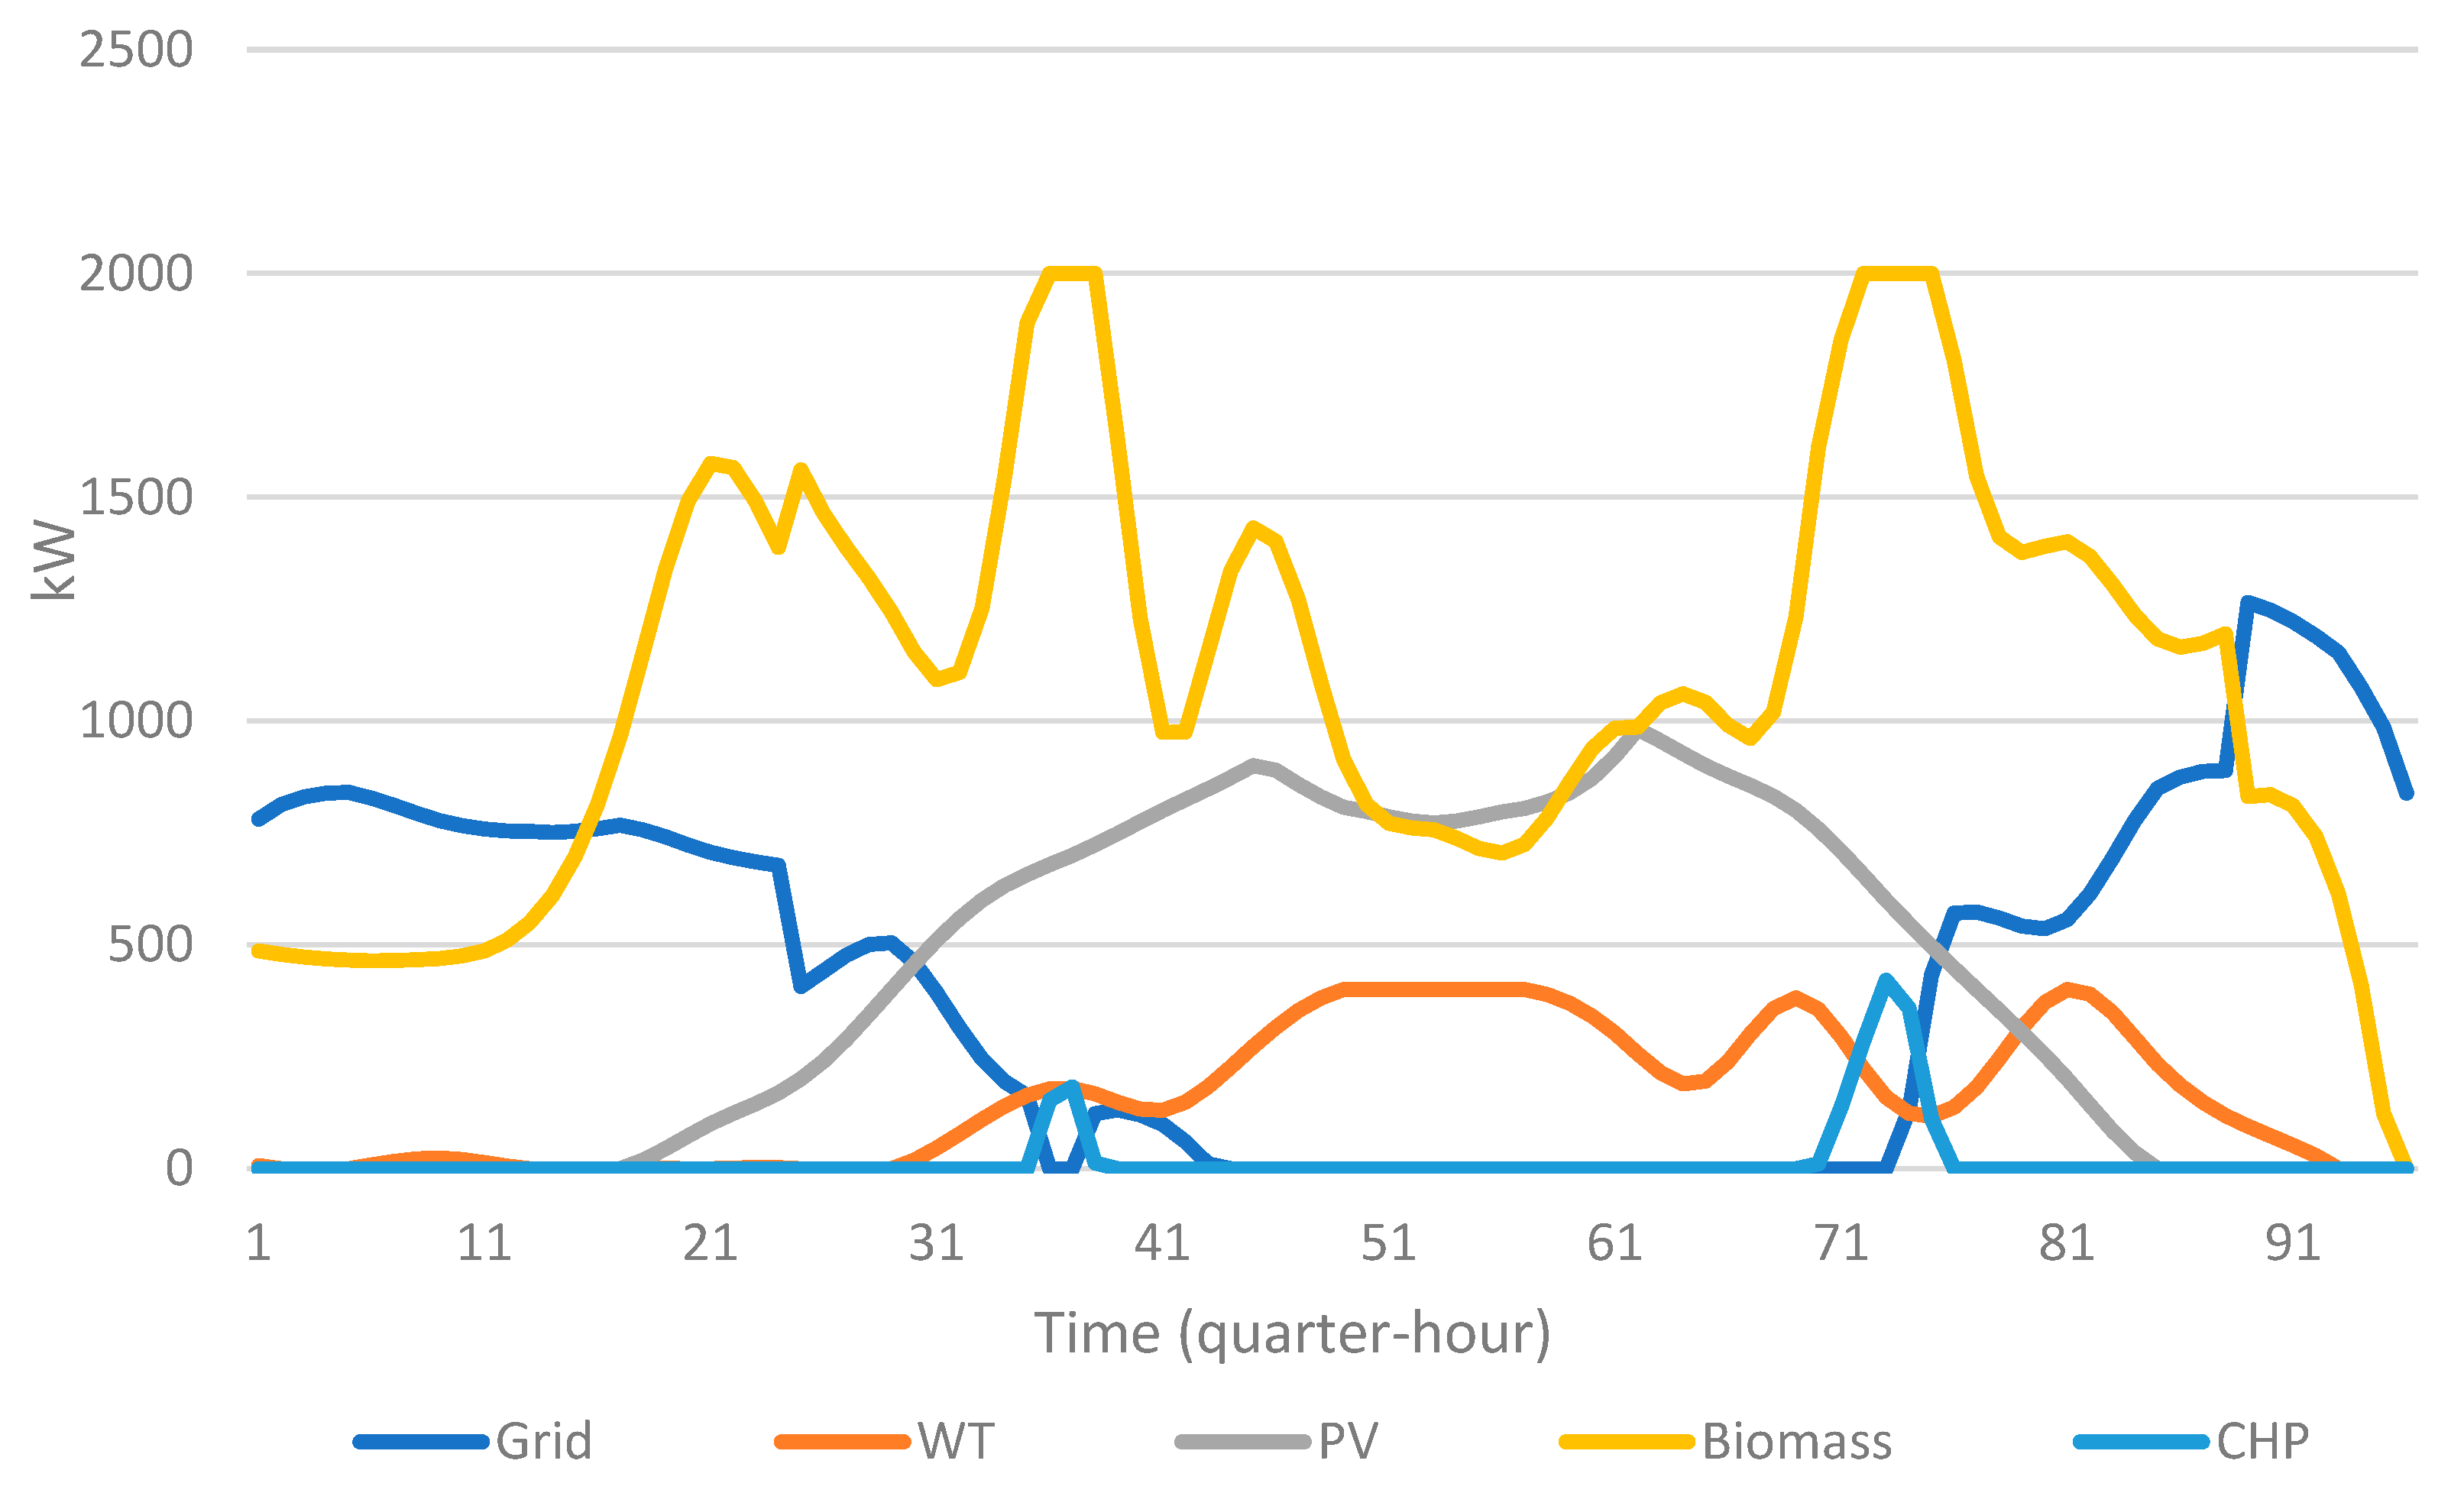
Figure 16.
Optimization results for original dataset, Kalman filter output, and noisy dataset.
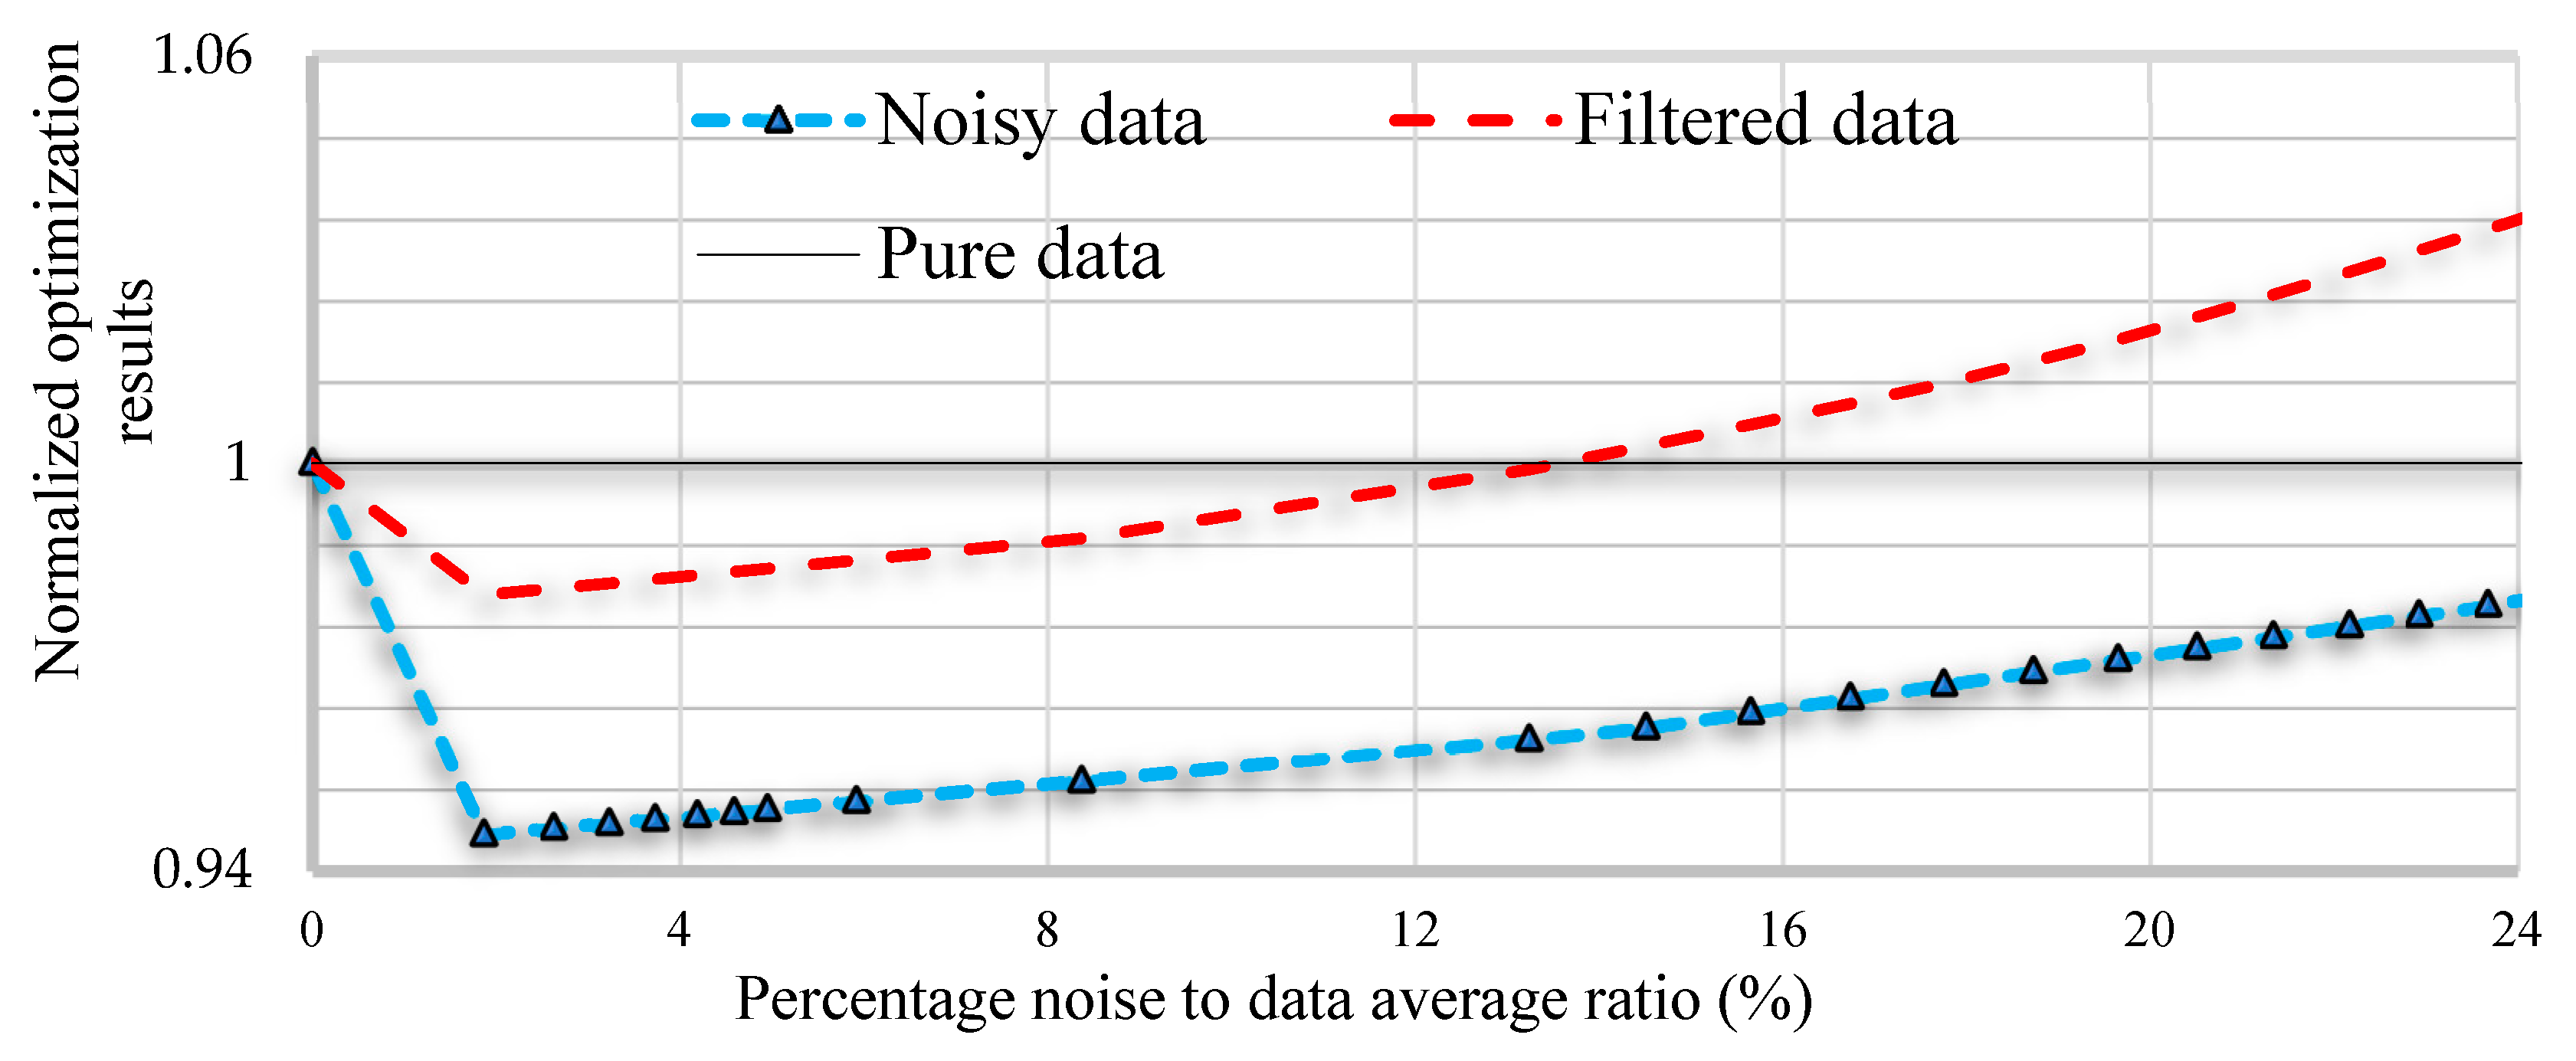
Table 1.
CO2 emission in kilograms to generate electricity of 1 kWh [9].
Table 1.
CO2 emission in kilograms to generate electricity of 1 kWh [9].
| Fuel | Coal | Petroleum oil | Natural gas |
|---|---|---|---|
| CO2 emitted in Kg/kWh | 0.95 to approx. 1 | 0.75 to approx. 0.80 | 0.55 |
Table 3.
A comparison among kalman types output variances for optimal output.
| Kalman filter type | Kalman filter KF | Extended KF | Unscented KF |
| Over Sampling | 4 times the original frequency | ||
| Optimal input covariance % of average | 4% | 0.24% | 2% |
| Optimal output normalized standard deviation % | ± 0.92 % | ± 2.68 % | ± 1.08 % |
Table 5.
Multi-objective function results.
| Pareto’s front points | Weight ɷ | Multi-objective function | |
| Cost USD per day | Carbon emissions tons CO2/day | ||
| Point 1 (scenario one) | 1.0 | 2366.20 | 9.36 |
| Point 2 | 0.8 | 2330.28 | 10.55 |
| Point 3 | 0.6 | 2294.46 | 11.74 |
| Point 4 (50%-50%)) | 0.5 | 2276.51 | 12.33 |
| Point 5 | 0.4 | 2258.57 | 12.93 |
| Point 6 | 0.2 | 2222.74 | 14.12 |
| Point 7 (scenario two) | 0.0 | 2186.90 | 15.31 |
Disclaimer/Publisher’s Note: The statements, opinions and data contained in all publications are solely those of the individual author(s) and contributor(s) and not of MDPI and/or the editor(s). MDPI and/or the editor(s) disclaim responsibility for any injury to people or property resulting from any ideas, methods, instructions or products referred to in the content. |
© 2024 by the authors. Licensee MDPI, Basel, Switzerland. This article is an open access article distributed under the terms and conditions of the Creative Commons Attribution (CC BY) license (http://creativecommons.org/licenses/by/4.0/).
Copyright: This open access article is published under a Creative Commons CC BY 4.0 license, which permit the free download, distribution, and reuse, provided that the author and preprint are cited in any reuse.


