Submitted:
01 August 2024
Posted:
01 August 2024
You are already at the latest version
Abstract
We introduce the Ising Network Opinion Formation (INOF) model and apply it for the analysis of networks of 6 Wikipedia language editions. In the model, Ising spins are placed at network nodes/articles and the steady-state opinion polarization of spins is determined from the Monte Carlo iterations in which a given spin orientation is determined by in-going links from other spins. The main consideration is done for opinion confrontation between capitalism, imperialism (blue opinion) and socialism, communism (red opinion). These nodes have fixed spin/opinion orientation while other nodes achieve their steady-state opinions in the process of Monte Carlo iterations. We find that the global network opinion favors socialism, communism for all 6 editions. The model also determines the opinion preferences for world countries and political leaders, showing good agreement with heuristic expectations. We also present results for opinion competition between Christianity and Islam, and USA Democratic and Republican parties. We argue that the INOF approach can find numerous applications for directed complex networks.
Keywords:
opinion formation
; directed networks
; Wikipedia
; Ising spins
; socialism
; capitalism
1. Introduction
The emergence of social networks, characterized by scale-free properties (see e.g. [1,2]), produced an important impact on human society. Thus opinion formation in such social media is argued to influence even political elections (see e.g. [3,4]). This implies that the understanding of opinion formation on social networks represents an important challenge. Various voter models on networks had been developed for the analysis of opinion formation as described in [1,6–12]. Recently the opinion formation on the world trade network has been argued to be linked with country preference to trade in one or another currency (e.g. US dollar or hypothetical BRICS currency) [13]. An important new element appeared in these studies is that opinion of certain countries (network nodes) is considered to be fixed since it is assumed that they prefer to trade always with fixed currency of USD or BRICS. This raises the question of how important is an influence of specific selected nodes with opposite opinions on a global opinion configuration in complex directed networks.
A network with N nodes and two opinions can be viewed as a generalized Ising model with spins . The total number of opinion (or spin) configurations in such a system is huge being . It is natural to assume that a given voter, or node, opinion is determined by the opinions of directly linked neighbors that makes the problem to be similar to a spin polarization (or magnetization) in the Ising model: if the neighboring spins of a specific spin, or a voter, are mainly up-oriented (red color) then this spin also turns up, or if the neighboring spins are down-oriented (blue color), then the spin turns down. Such an approach to opinion formation on various networks had been applied in many cases and analyzed in the above cited publications.
In this work we study the problem of opinion formation induced by a group of nodes with fixed polarization (opinion) in the Wikipedia networks of different languages (up to 6 ones, with English-EN, German-DE, Spanish-ES, French-FR, Italian-IT, Russian-RU). We use the network data sets of Wikipedia collected in 2017 and publicly available at [14]. The important advantage of Wikipedia networks is that the meaning of its nodes is well clear from the corresponding articles of Wikipedia. A number of features of WIKI2017 networks had been studied e.g. in [15,16]. A great variety of applications of Wikipedia in academic and society research was reviewed in [17–20].
In these WIKI networks we consider a confrontation and influence of groups of opposite fixed opinions (spins) given by nodes (articles) capitalism (blue color, ) and socialism (red color, ) and its extended case when each group is formed by two by two nodes capitalism, imperialism and socialism, communism (each language edition determines these articles by corresponding transcription). We also shortly consider interactions and influence of other two opposite groups with fixed opinions/spins given by articles Christianity and Islam, and also Democratic Party (United States) vs Republican Party (United States). The description of data sets, Monte Carlo procedure of spin interactions and obtained results are presented in next Sections.
After the seminal work of Karl Marx in 1867 [21] a great variety of research investigations appeared about the conflict between capitalism and socialism being based on economics and sociological science analysis (see e.g. [22,23] and Refs. therein). Here we use another purely mathematical and numerical analysis of Wikipedia networks of 6 language editions which allows us to determine the opinion preference to socialism or capitalism in global for a whole edition and also for specific articles of Wikipedia such as world countries, historical political figures. A clear meaning of each Wikipeadia article allows also to test the efficient and weak features of our INOF approach. Since Wikipedia accumulates a huge amount of human knowledge [17–20] we think that the obtained results are of general public interest.
The article is composed as follows: Section 2 describes the Ising Network Opinion Formation (INOF) model, data sets and numerical methods, Section 3 presents results for confrontation of opinions for capitalism and socialism, Section 3 considers interactions between Christianity and Islam, competition between US Democratic and Republican parties and studies in Section 4, statistical features of the proposed INOF model are discussed in Section 5, discussion and conclusion are given in Section 6.
2. Model description and data sets
We use Wikipedia networks of 2017 with their 6 language editions, data sets are taken from [14]. Thus EN-wiki network has about nodes, while others 5 networks have around million nodes; exact number of nodes and links are given in [15].
We characterize all network nodes by their PageRank vector probability [24–26] normalized to unity (); thus all nodes get the PageRank index K that orders nodes by a monotonically decreasing probability with highest probability at and smallest at . PageRank vector is the eigenvector of the Google matrix G [24–26] with the highest eigenvalue : and . Here is the matrix of Markov transitions between nodes constructed from adjacency matrix ; thus where is a number of out-going links from node j to node i; for dangling nodes without out-going links and . We use a standard value of the damping factor [24–26], it regularizes the network connecting all isolated communities.
To determine the steady-state configuration of spins on a given network we mainly follow an asynchronous Monte Carlo procedure describe in [13] with an additional important modification. The selected nodes (wiki-articles) have assigned fixed spin values ( blue for capitalism and red for socialism, this is called option-1 (OP1); or for capitalism and imperialism and for socialism and communism, this is called option-2 (OP2)). In a difference from [13] all other nodes supposed to have a white color (or spin ) at the initial stage of Monte Carlo process, we call this a white option. Such a choice of initial state of all spins corresponds to a situation when all other spins, those which are not fixed, have no definite opinion at initial stage. Then by random we choose a spin i, which is not fixed, and compute its influence score from in-going links j:
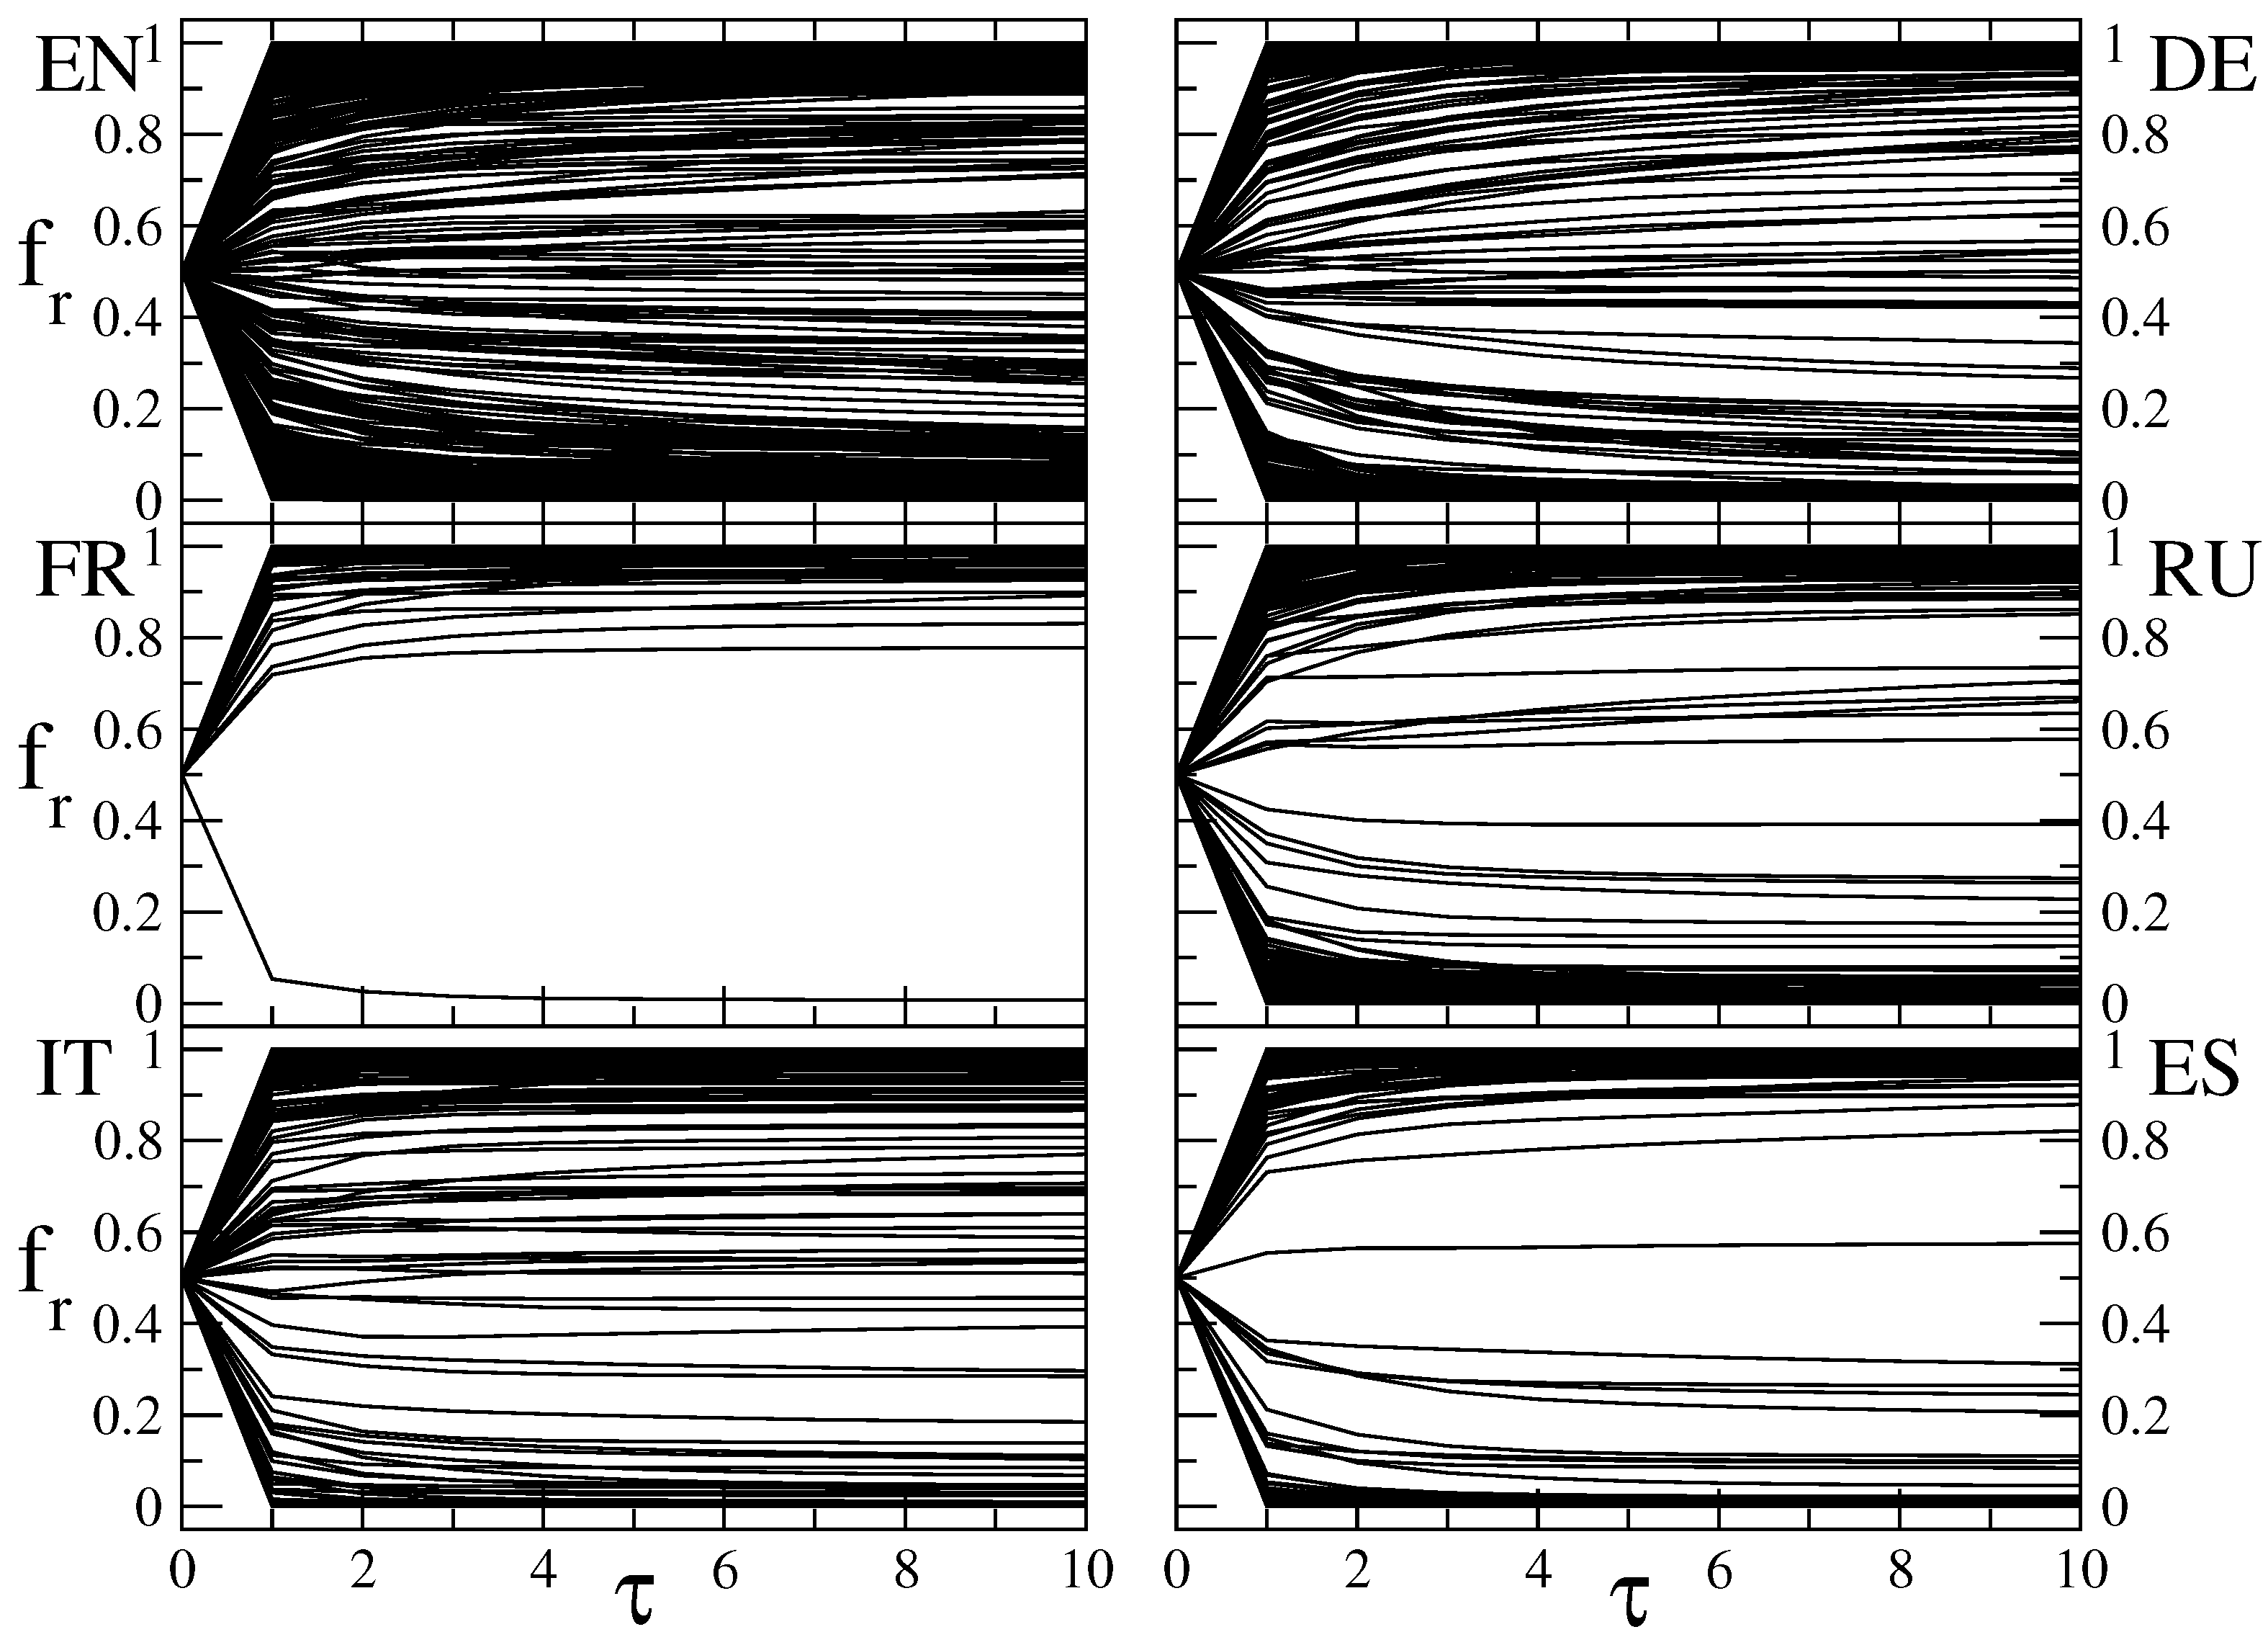
where the sum is performed over all nodes j pointing to i; is the matrix of Markov transitions where the columns of dangling nodes have zero elements (dangling nodes give no contribution to ). Also if spin of j node oriented up or if it is oriented down or if node j has no opinion (belongs to initial set of white option). After the computation of value a spin of node i takes value if or if or stay unchanged if . Then such a random iteration is done for another random node , without repetition for previously visited nodes. We use a random shuffle to perform this operation. Thus after N such random iterations (fixed nodes remain fixed) we make a full time step with time and then all procedure is repeated going to . The process of convergence to a steady-state is shown in Figure 1. We find that at the process is converged to a steady-state distribution of spins with a fixed final fraction of red nodes with spins up and a final of blue nodes with spins down. There is a small fraction of nodes that remains white at that we attribute to a presence of isolated communities [26]. However, a number of such nodes is relatively small (e.g. for OP2 we have for EN; DE; FR; RU; IT; ES Wikipedia editions respectively). We do not take into account these final white nodes from isolated communities considering only red and blue nodes in the final steady-state with a natural normalization of their fractions . We also characterize the final state by its polarization (or magnetization) of spins given by .
However, we should note that in the Monte Carlo process one can choose various random ordering of spin flip defined by the rule (1) and thus we obtain various random realisations of pathway ordering of spins forming various random pathways leading to a finial steady-state distribution. In fact we find that different random pathways lead generally to different final configurations of spins as it is shown in Figure 1. Due to that we perform an averaging over random pathway realisations (we call this 1000 pathways as a slot). The histograms of fractions of red nodes obtained from realisations are shown in Figure 2 and Figure 3 for Wikipedia editions and options OP1 and OP2 respectively. By making average over these random realisations we obtain the steady-state values of for each node (spin) i. By definition . Thus after averaging over all realisations each node i is characterized by its average values (we will speak mainly about fraction of red nodes), and deviation from global polarization . After averaging over all nodes we obtain global network values of red and blue node and global network polarization . We checked that the probability distributions of Figure 2 and Figure 3 remain unchanged if we increase the time from to . Thus all the realists are take from the steady-state at . The results with increased number of realisations, up to are discussed in Section 6.
We note that in the relation for in (1) we use only matrix elements without dangling nodes. The reason for this choice is due to a fact that matrix elements (or their part) that are the same for all nodes in a column or in the whole matrix (as in G matrix with term) act similar to a certain external magnetic (polarization) field that gives a contribution proportional to a difference of red and blue node fractions while we aim to analyze interactions between node spins without external fields. In the sum of (1) we include only contributions of in-going links given by since in Wikipedia networks in-going links are more robust while out-going links are characterized by significant fluctuations [26]. In this sense this is different from trade networks where both in-going and out-going links are important corresponding to import and export [13]. In our case (1) all are positive or zero that corresponds to some kind ferromagnetic interactions between spins. However, a presence of fixed spins of opposite orientations makes possible to have big configurations of spins oriented up or down. It is useful to note that a similar type of relation (1) is used in models of associative memory however there the elements take random values corresponding to some kind of anti-ferromagnetic interactions [27,28]; but fixed spins and white option for nodes are not considered there.
We call the above approach of opinion formation on directed networks as Ising Network Opinion Formation (INOF) model.
3. Results for capitalism vs. socialism
In Figure 1 we show a convergence with time to a steady-state values of fraction of red nodes ( corresponds to preference to socialism, communism and spin up orientation, to capitalism, imperialism). Data are given for 500 random pathway realisations for each of 6 language editions of Wikipedia of year 2017. The results show that the steady-state values are reached at , to be completely sure we show in further the steady-state values taken at .
The realisations shown in Figure 1 indicate that the red-preference to socialism, communism is different for each of 6 Wikipedia editions: thus EN case has a comparable number of cases with final close to unity or zero while FR case has mainly close to unity with close to zero.
Figure 1.
Evolution of the fraction of red nodes for 500 random pathway realisations. An initial condition has fixed 2 red nodes (socialism,communism) and 2 blue nodes (capitalism,imperialism), they remain fixed during the Monte Carlo evolution with the relation (1), all other nodes are initially white. Each panel corresponds to one of the six language editions of Wikipedia: EN (English), DE (German), FR (French), RU (Russian), IT (Italian), and ES (Spanish). The x-axis represents time , where each unit of indicates one complete update of all nodes/spins following the opinion model based on relation (1).
3.1. Statistical properties of opinion polarization
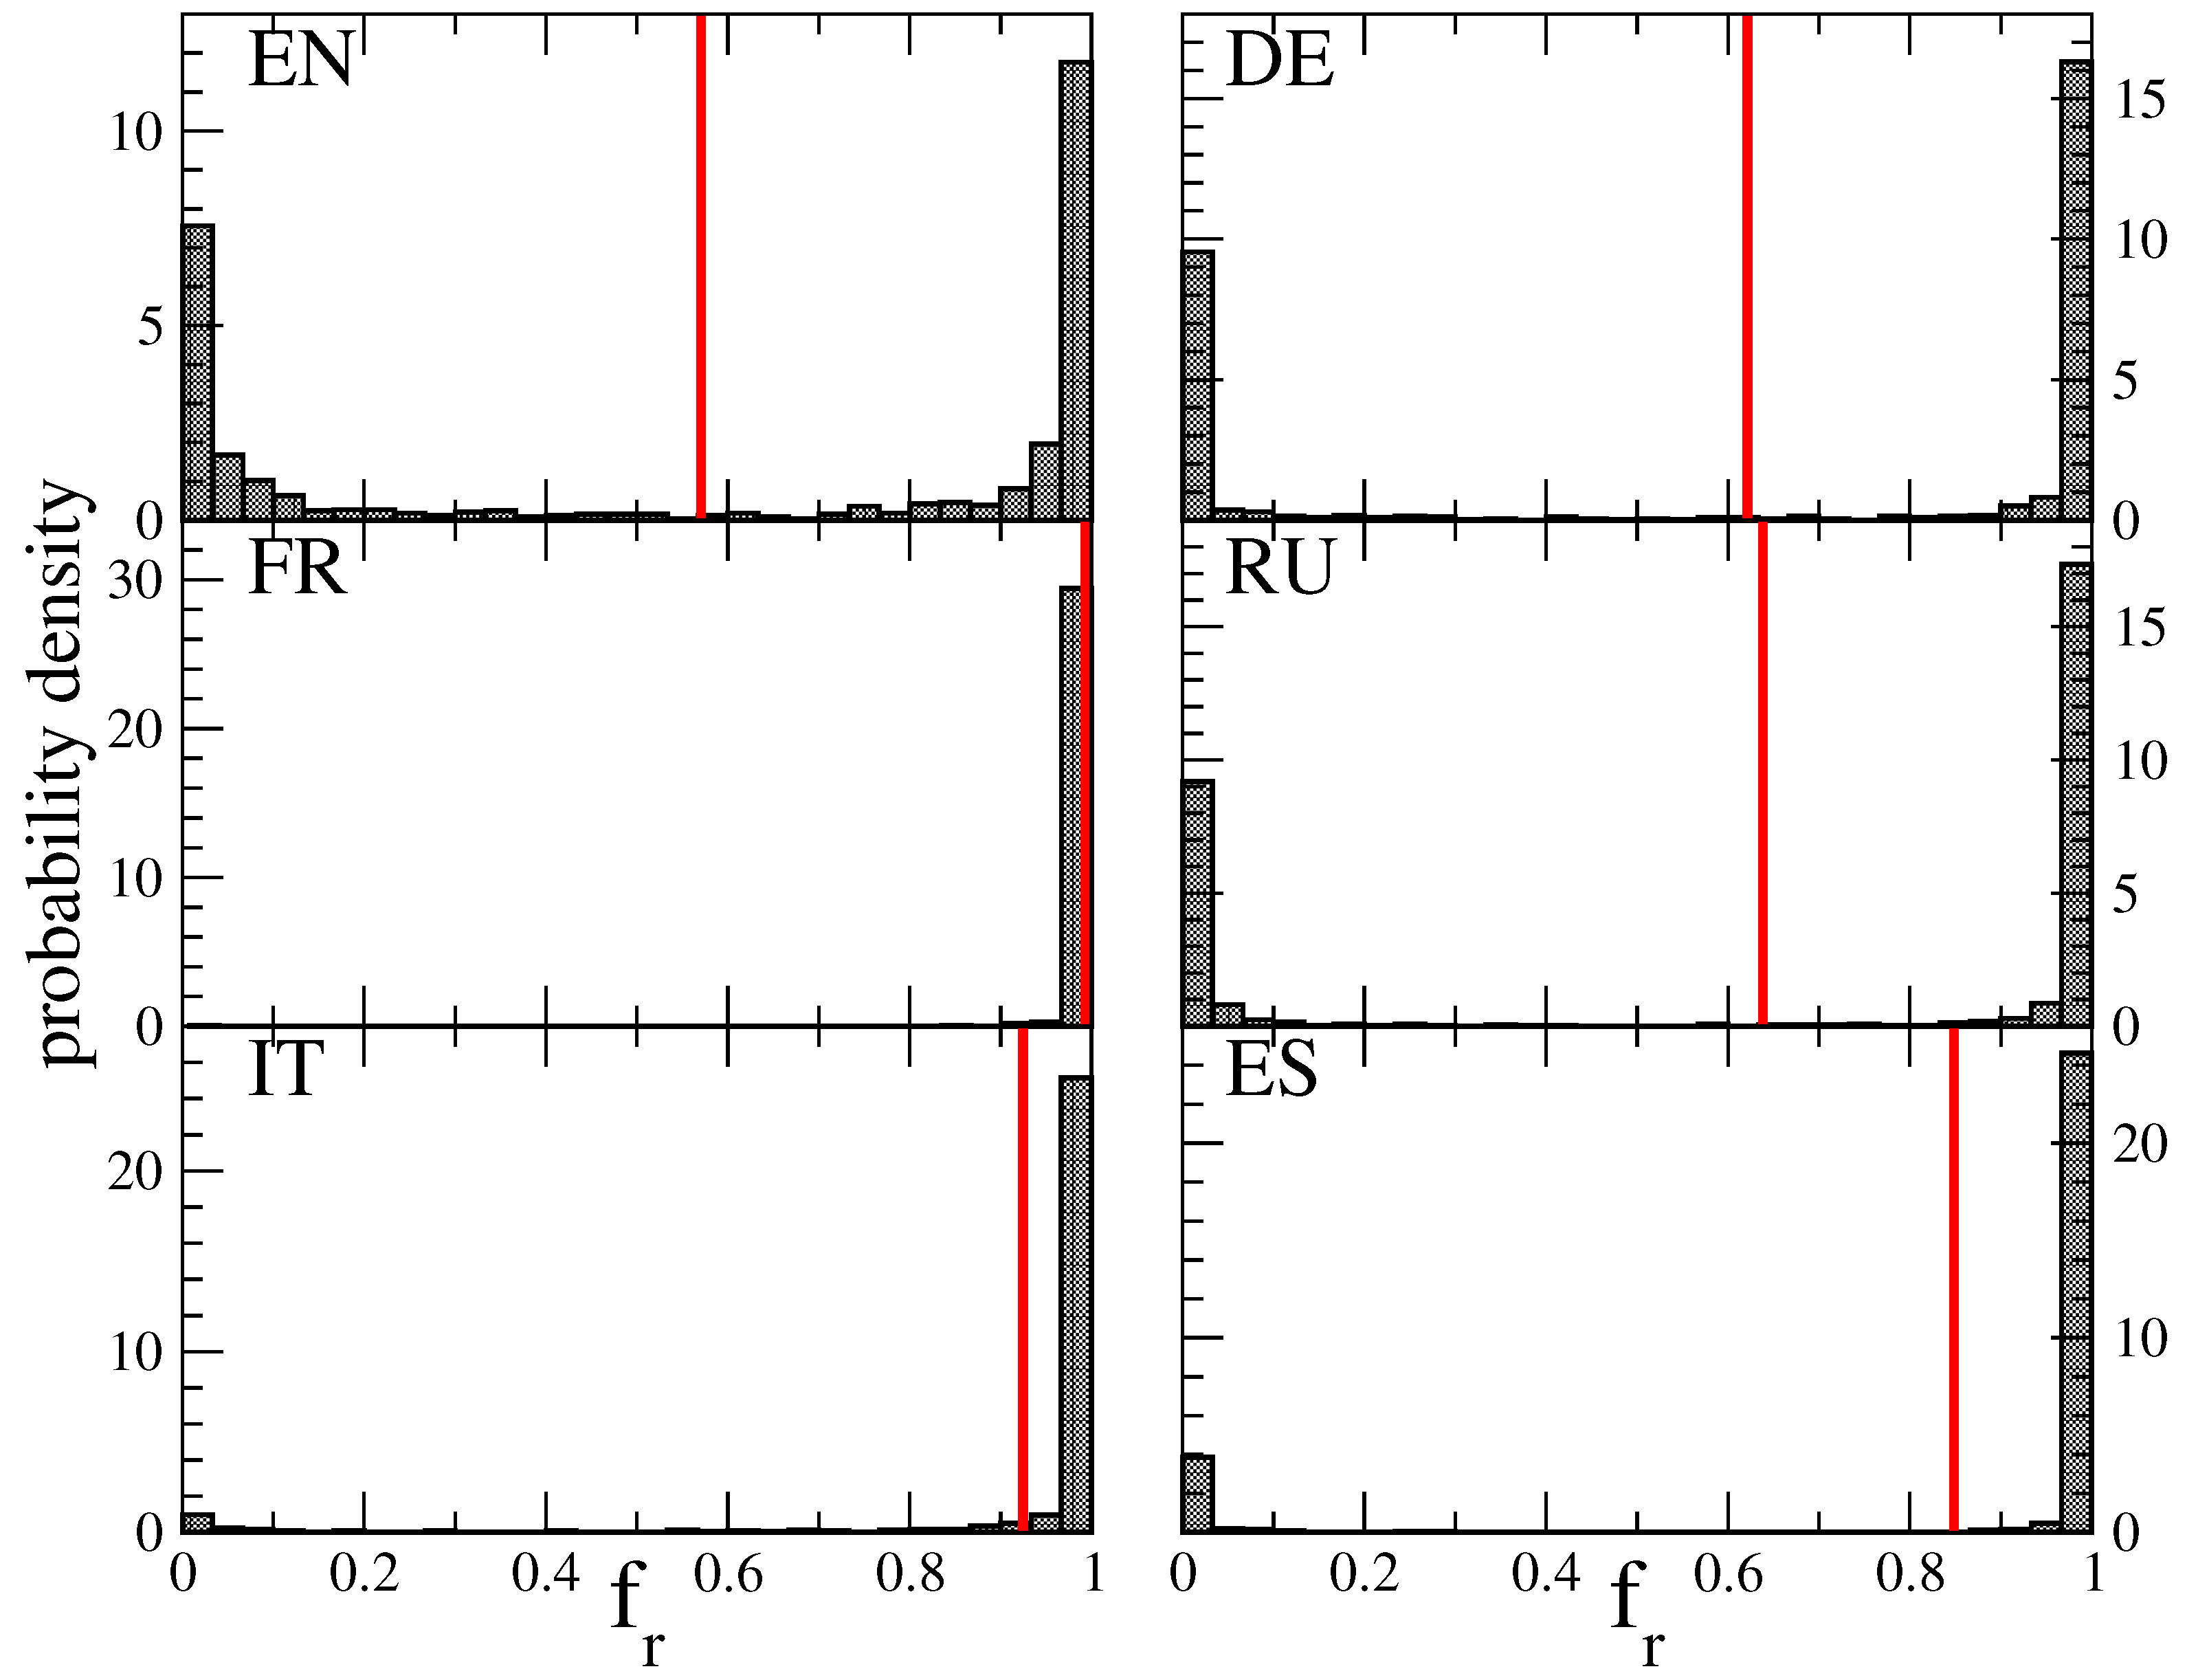
To understand the statistical properties of various configurations we present in Figure 2 and Figure 3 the histograms showing the frequency of appearance of final steady-state values of obtained from one slot of realisations. At first we stress that almost all final configurations have all nodes being red for FR-wiki with average (). Vary similar situation takes place for IT and ES editions with average red fractions given in Figure 2 and Figure 3 captions. The situation is more balanced for EN, DE, RU editions. Thus the results of Figure 3 show that EN, DE, RU editions have certain preference to capitalism, imperialism even if their preference to socialism, communism is stronger. In contrast the Wikipedia editions ES, FR, IT have their preference almost completely for socialism, communism. We should note that the steady-state almost for each realisation is composed only from all red or all blue nodes (only for EN there is relatively small number of final configurations which have both red and blue nodes; a number of such mixed configurations i very small for other editions). Such a situation is very different from results obtained for the world trade networks [13] where stead-state configurations had high fractions of red and blue nodes. We attribute this to a different internal structures of Wikipedia and trade networks.
It is interesting to compare the results for the case OP1 of Figure 2 with fixed socialism (red) and capitalism (blue) with the case of OP2 in Figure 3 when we have fixed socialism, communism (red) and capitalism, imperialism (blue). For 5 editions OP1 case has significantly higher red fractions comparing to the OP2 case. Thus addition of fixed red node communism and blue one imperialism plays against red opinion. However, the situation is drastically different for RU-wiki: for OP1 it has very strong preference for capitalism while for OP2 case it has stronger preference for socialism, communism. We attribute this result to the fact that from 1917 till 1992 Russia (or USSR) was ruled by the Communist party which had an official aim to built communism. We note that in EN edition the article Russia has in-going link from communism and imperialism, but not from socialism and capitalism. In RU edition it has no in-going from socialism, communism. capitalism, imperialism that probably makes it more influenced by other longer pathways from fixed nodes. Thus probably the imperial period of Russian history, being significantly longer comparing to Soviet period, produces a certain trend to blue fraction (see discussion for China below).
In fact Russian Wikipedia was established after disappearance of USSR and thus it has not so strong stress on political formations. Also the period followed after USSR in 1991-2000 is known in Russia as a period of “wild capitalism” that is probably at the origin of strong preference to capitalism for OP1 in RU edition.
Figure 2.
Probability density p of the fraction of red nodes () for 1000 realisations after . Each panel for OP1 corresponds to one of the six different languages of Wikipedia for the initial condition with fixed one red node (socialism) and one blue node (capitalism). Red vertical lines mark the mean value of with average global polarization . The values of mean polarization are: for EN, for DE, for ES, for FR, for IT and for RU. The histogram is built with cell size and normalized to 1 ().
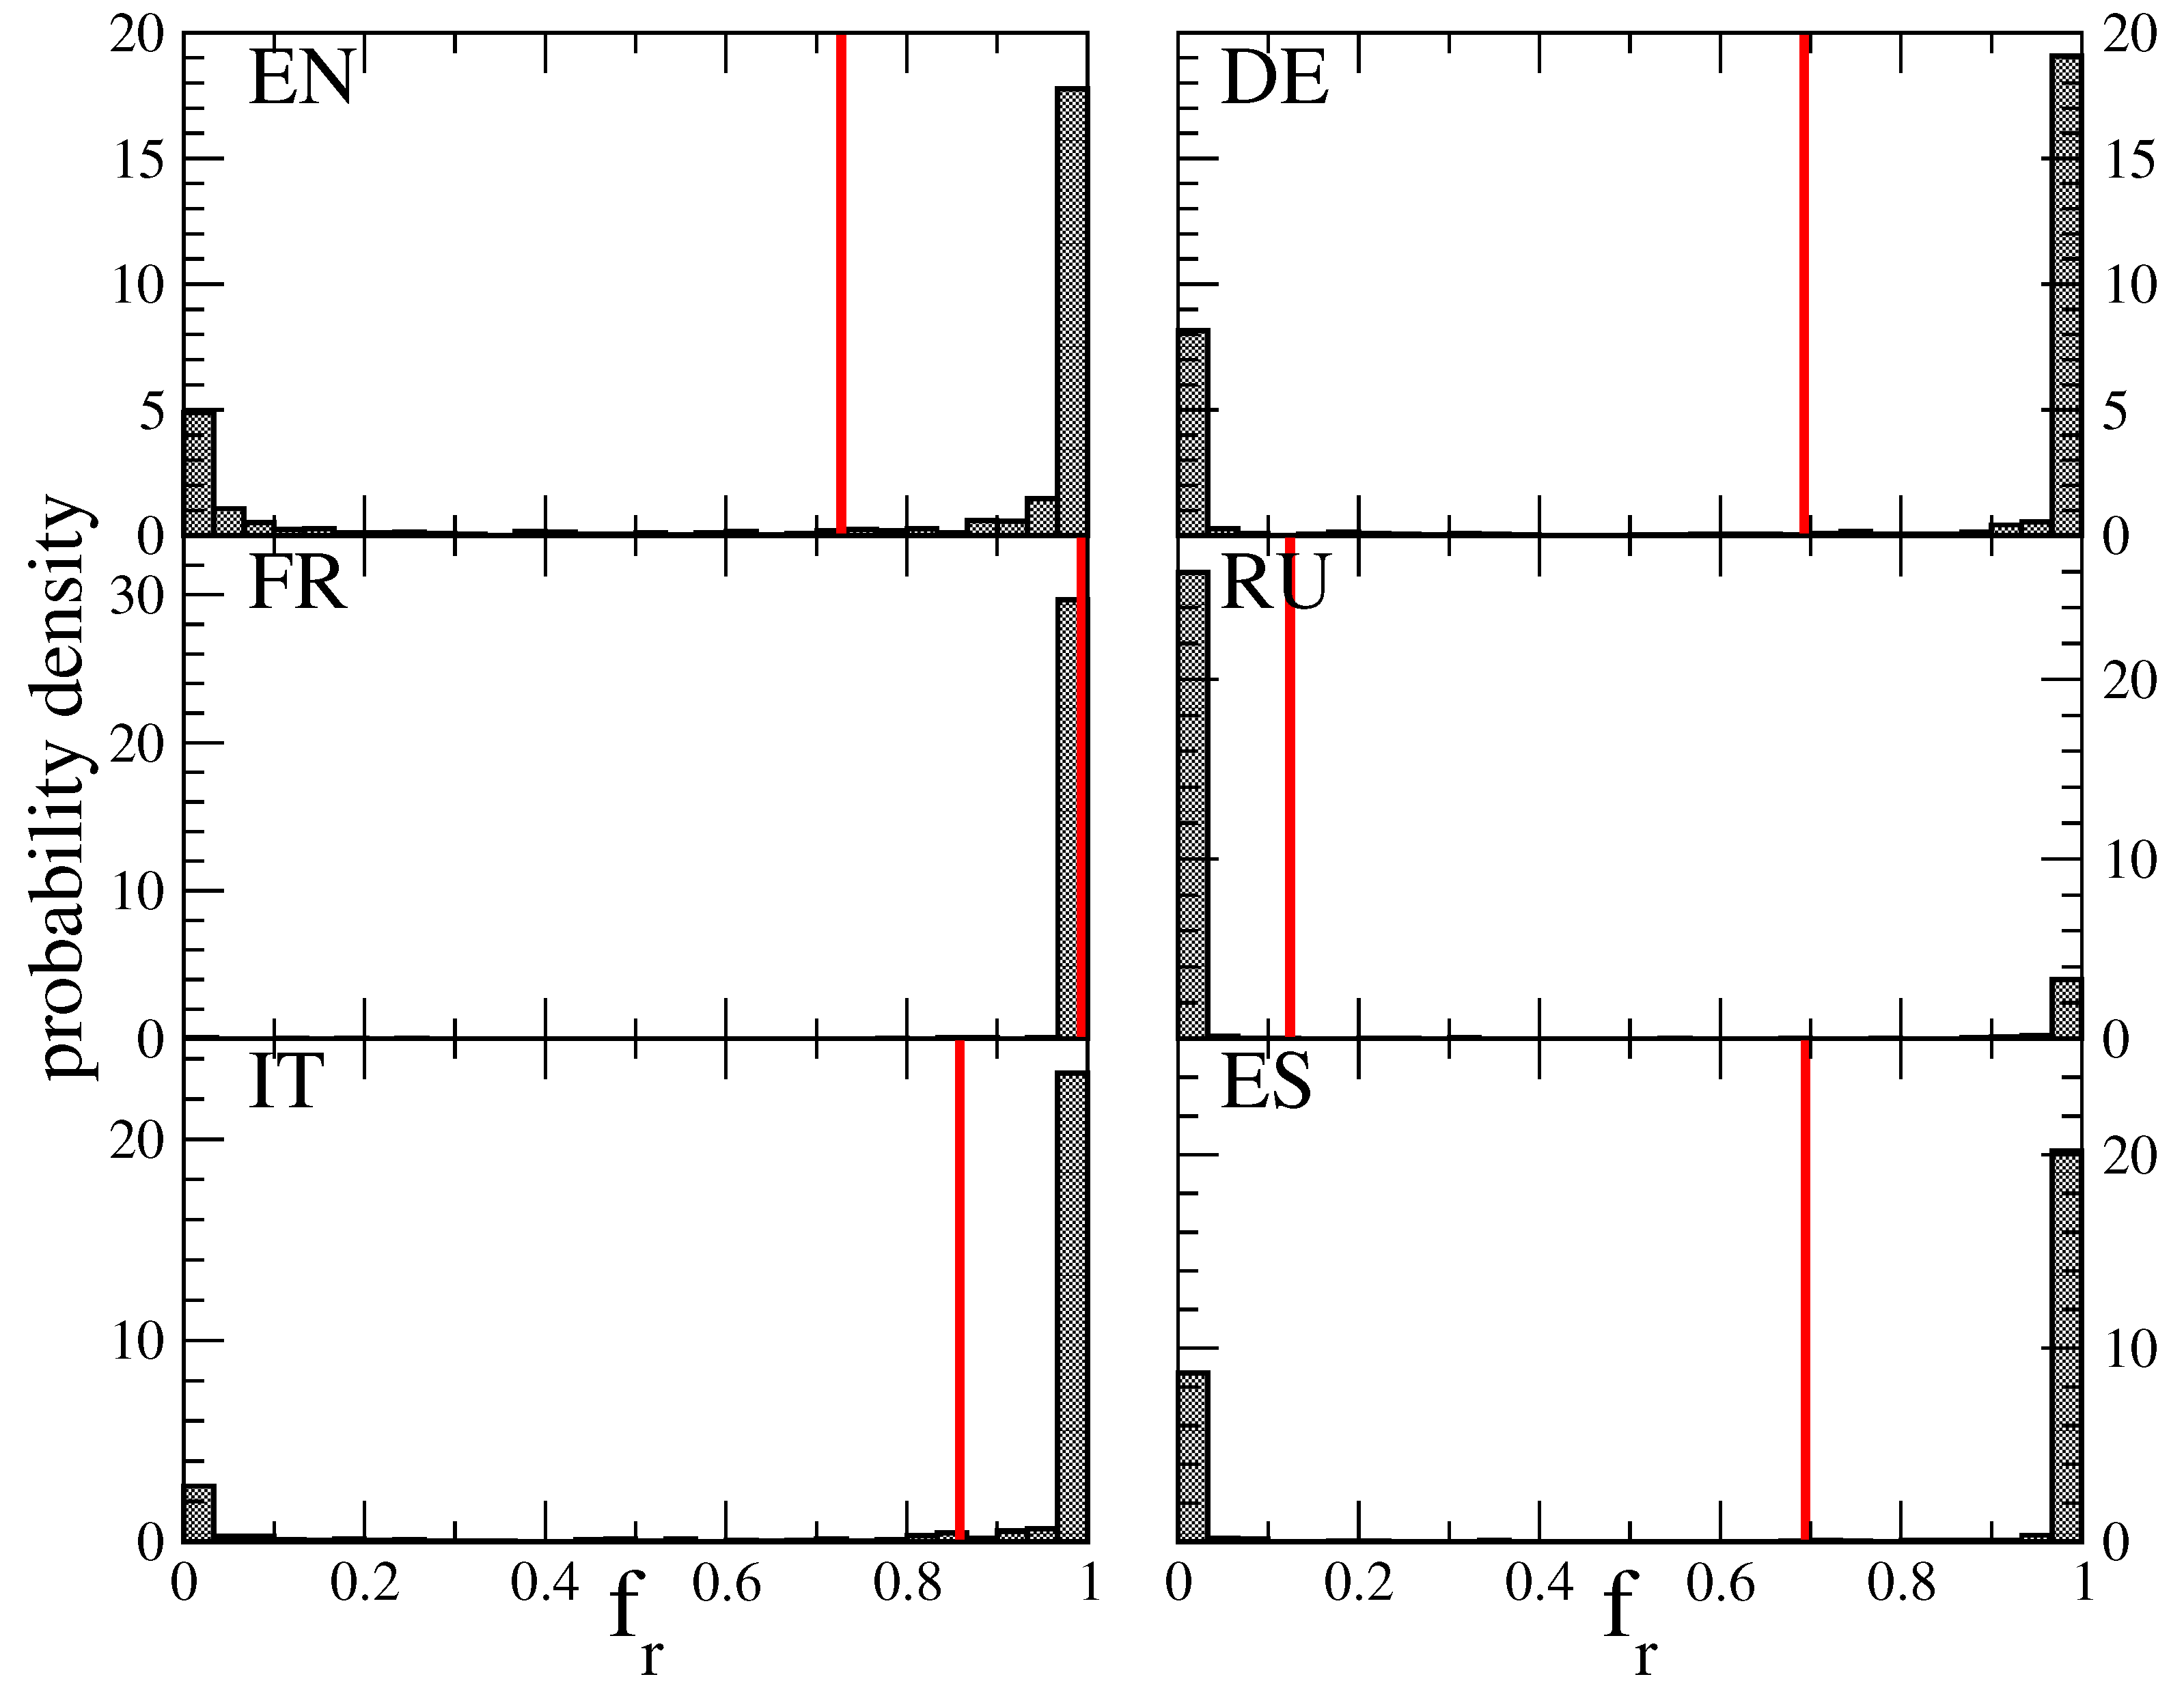
Figure 3.
Same as in Figure 3, each panel for OP2 corresponds to one of the six different languages of Wikipedia for the initial condition with fixed two red nodes (socialism, communism) and two blue nodes (capitalism, imperialism). The values of mean polarization are: for EN, for DE, for ES, for FR, for IT and for RU. The histogram is built with cell size and normalized to 1 ().
By averaging spin of each article/node i over reslisations we obtain average polarization of node i. Ordering all nodes i by the PageRank index K we obtain dependence of polariization on K. For EN Wikipedia this dependence is shown in Figure 4 for OP2 for top PageRank indexes (top panel) and for the range which contains articles socialism, communism located at ; capitalism, imperialism are located at . Comparing to the average global polarization each article has its own deviation shown in Figure 4. Typically we have these deviations in the range with some exceptional deviations (of course fixed 4 nodes have higher absolute values). We discuss these deviations for specific articles (nodes) below in next subsection.
It can be possible to expect that an average opinion polarization for a give edition is related with PageRank probabilities and of fixed red and blue nodes (with rescaled sum equal to unity ) with . For our 6 editions and OP2 case the values of are located in a relatively narrow range while the values of are dispersed in the range without any clear correlation with values. For OP1 case we have the range and again without any clear correlation between and values. Thus we conclude that there is no correlation between and .
After averaging over random pathway realisations we obtain opinion polarization for all Wikipedia articles. The distribution histogram or probability density p for these N polarization values is shown in Figure 5 for EN edition and OP2. The main density if concentrated in the range centered around the global average polarization . We discuss specific articles with extreme positive or negative values below in next subsection.
Similar to the case of EN edition with Figure 5 we show such histograms for RU edition for both options OP1 and OP2 in Figure 6. These histograms clearly demonstrate the drastic difference between OP1 and OP2 cases which we attribute to the ruling Communist party of Russia as we pointed above.
It is natural to expect that the Erdös number [2] or Erdös link distance (number of links) from red and blue groups of fixed nodes (we discuss OP2 case for EN edition) should significantly influence the opinion formation on the Wikipedia network. To analyze this feature we show in Figure 7 a number of network nodes (or frequency) located on distances from two fixed red nodes socialism, communism and from two fixed blue nodes capitalism, imperialism. The number of such nodes grows exponentially with distance up to values where there are up to million nodes ; for larger values decreases since due to the small world effect [2] majority of network nodes can be reached in links (degree of separation). The interesting feature of Figure 7 is that all nodes are located on three diagonals with . We argue that both groups of fixed red and blue nodes describe the human society and thus there are close relations (small number of links) between these two groups. Indeed, for EN edition the Erdös distance between these two groups is 1 . We find the same three diagonal structure as in Figure 7 for other 5 editions.
In Figure 8 we show the average polarization for each cell located at Erdös distances along the three diagonals for all 6 editions. The results show that on average for moderate d distance () we have being larger when the distance to the red group is shorter than to blue group. This is also well visible for ED,DE, ES, IT editions while for FR and RU editions this difference is less pronounced.
3.2. Opinion polarization of specific articles
We discuss now the opinion polarization of specific articles concentrating mainly on EN edition of Wikipedia. Thus in Table 1 we present top 20 PageRank articles with their polarization opinions for two options OP1, OP2 of fixed nodes. In fact the average global opinion polarization of the whole network gives the average polarization background (see e.g. Figure 4) and thus it is more informative to present the deviations from this background given by .
There are only 3 articles with negative values for PageRank top 20 articles in Table 1 for OP1 while for OP2 case there 8 such cases. This approximately corresponds to a significantly higher peak at for OP2 in Figure 3 compared to OP1 case in Figure 2 for EN edition. The main part of this top 20 PageRank list in Table 1 is composed with world countries. Among other type of articles we note that Association football, World War I, II have positive values comparing to the global positive value of EN edition network, while has a negative . Due to many in-going links to top PageRank articles it is difficult to identify the origins of such polarization opinion for these articles.
For the case of world countries we present an additional Table 2 for OP2 case showing top 20 countries from the PageRank global list. Here we find that all European countries from this list of 20 have positive (including Russia). In contrast to that other countries outside of this area have negative (except Canada and Mexico). We suppose that positive for European countries is related to the fact that socialism concept was developed in these countries. The reasons of negative values for Japan and Brazil requires mode deep analysis of network link structure. For China and India we explain negative in the following way.
Thus for China we note from Table 1 that is positive for OP1 case and negative for OP2 case that seems to be somewhat surprising in view of strong influence of Communist party in China. We argue that this appears due to the fact that the word imperialism becomes in Wikipedia linked with words imperium, empire, emperor, imperator. Indeed, the articles in Figure 5 at an extreme negative values with is a serviteur Li Yong (chancellor) of China Emperor Xianzong in 8 century AD. Thousands of years China was a powerful empire that, in our opinion, shifts China to negative value. Also China is directly pointed by articles imperialism, capitalism but also by socialism, communism. We not that it happens rather often that an article is pointed by fixed articles of opposite opinions.
For India we find that this article is directly pointed by imperialism but not by capitalism, socialism, communism. We attribute such a difference in links to imperialism and colonisation of UK in respect to India. We also note that for OP1, without imperialism, the value of is still negative but it is significantly smaller in absolute value comparing to OP2 case with imperialism and . Thus we think this is the reason of highly negative value for India.
The opinion preference of all world countries to capitalism, imperialism or socialism, communism, expressed by of countries, is shown in the world map of Figure 9. Positive opinions for socialism, communism with are located mainly in Europe, Russia, Canada and Mexico. The highest positive values are for Bosnia and Herzegovina (), Romania (), Ireland (), Poland (), Croacia () and Serbia (). The most strong opinions for capitalism, imperialismh with lowest negative are for India (), Bangladesh (), Cameroon (), Pakistan () and Madagascar ().
We also consider preference opinion for a group of historical figures, mainly politicians, presented in Table 3 for EN edition. They are composed of two groups of 12 figures in each group; the left group in Table 3 is composed by socialist-communist active leaders and politicians (left column) and the right group lists the capitalist political leaders (right column). Indeed, the obtained results show that for all socialist leaders in the left column we obtain (enhanced preference for socialism) (left column in Table 3, except Mao Zedong for whom is only slightly negative being close to zero). In opposite, to capitalist leaders we obtain negative corresponding to enhanced preference for capitalism (see right column of Table 3 with exception for Winston Churchill and Charles de Gaulle. We attribute these 3 exceptions to the fact all of them are influenced by their countries: Mao Zedong is linked with China having ; Winston Churchill and Charles de Gaulle are linked with UK and France with . We also note that other leaders in Table 3 are linked with Russia with (left column; except Karl Marx) and with USA with . Thus the proposed method correctly determines preference opinion of leaders of socialism and capitalism.
From Table 3 we note that 7 from 12 political leaders in right column have exactly the same value. We attribute this to the fact that all of them are presidents of USA that probably is at the origin of this feature. Other 3 USA presidents (Roosevelt, Kennedy, Carter) have different values that we relate to extraordinary events during their time slot in office while Carter has value being not so different from 7 above presidents.
In Table 1, Table 2 and Table 3 there are data for obtained with a significantly higher number of realisations . We discuss this data in Section 6.
It is interesting to consider what are the articles with extreme values from Figure 5 for OP2 case of EN edition. These articles are listed in Table 4. To understand the reasons for such extreme values we consider a few examples of such articles with their in-going links. Thus Étienne Clavier, who lived in 1762-1817 and was a French Hellinist and magistrate, is directly pointed only by capitalism article, since he referred in French to capitalises at very early 1788, four yeas before English usage by A.Young. This leads to extreme value .
Li Yong (chancellor) with was an official of the Chinese Tang dynasty who lived around 800 AD. This article has such in-going link articles as Index of China-related articles, Emperor Xianzong of Tang, Chancellor of the Tang dynasty and 8 more in-going links of other articles related to China of this period. Here we see that due to links between imperialism and imperium, empire, emperor, imperator our approach leads to such an extreme value. Thus links between similar or related words can produce somewhat artificial links between imperialism and a person who lived in far 8 century. But such concepts as imperium, empire, emperor, imperator are very ancien and explains such an influence by the more modern concept imperialism.
For extreme positive values we consider Giliana Berneri who lived in 1919-1998 and was French doctor of medicine and libertian communist activist. She was also among the founders of French Anarchist Federation, which included Maurice Laisant. Its articles has in-going links from articles about other people linked to socialist-communist movements (Camillo Berneri, Berneri, Georges Vincey, Aurelio Chessa, Giovanna Berneri) that leads to . The article Maurice Laisant is ponted only by articles Giliana Berneri, Georges Vincey that leads to .
From these examples we see that extreme values appear for articles which have a small number of in-going links directly coming from fixed opinion articles or by a short path from them.
4. Results for Christianity vs. Islam
Our Monte Carlo approach to opinion formation in Wikipedia networks can be also used for another competing articles. To illustrate such another example we consider the case of Christianity (red) and Islam (blue) in EN and RU editions. The histograms of steady-state probability distribution of red nodes is shown in Figure 10. These distributions are essentially composed of two peaks at and . The histograms for opinion polarization are shown in Figure 11. These results show that the fraction of opinion in favor to Islam is about by factor 3-4 higher (for ) in RU edition comparing to EN one. We attribute this to a significantly higher percent of muslim population in Russia (10-12%) comparing to USA (1%), UK (5%), Canada (5%), Australia (3%) (even if these percents are approximate) [29].
The world map of countries characterized by their opinion polarization in shown in Figure 12 for English Wikipedia. The countries with extreme positive and negative opinion polarization, expressed by , are in favor of Christianity: Ireland (), Bosnia and Herzegovina (), Croatia () and Poland (); and in favor of Islam: India (), Pakistan (), Bangladesh () and Nepal (). We find that the values of country are well correlated with the percent of muslim population of countries M taken from [29]. Thus, the correlation coefficients between and M values are rather high: (Pearson), (Spearman) and (Kendall); see definitions of coefficients at Wikipedia.
For the leading historical figures of Christianity and Islam we obtain for EN edition values: Jesus (0.019), Saint Peter (0.027), Paul the Apostle (0.029) and Muhammad (-0.005), Ali (-0.005), Abu Nakr (-0.005).
For Russia edition for the same articles we have: Jesus (0.00195), Saint Peter (0.00195), Paul the Apostle (0.00195) and Muhammad (-0.006), Ali (-0.006), Abu Nakr (no such article in 2017).
We consider that these results qualitatively correspond to a natural expectation of opinion preference being more on the side of Christianity for Jesus, Saint Peter, Paul the Apostle and on the side of Islam for Islam for Muhammad, Ali, Abu Nakr. This confirms the validity of our approach for opinion formation on Wikipedia networks.
Thus the outcomes of this Section confirm that our INOF model leads to reliable results.
5. Results for Democratic Party vs. Republican Party in USA
As an another example of competition between two opinions we inside the case of two articles in EN edition: Republican Party (United States) (red) and Democratic Party (United States) (blue). In this case the histogram analogous to one of Figure 2 is still essentially composed of 2 peaks of different heights at and , with red and blue fractions being and . The article United States has with . Thus the EN edition is significantly more favorable for Democratic Party.
In global, on the basis of obtained results for directed networks of 6 Wikipedia editions we conclude that our INOF model gives reliable understated for confrontations of two opposite opinions in such systems.
6. Statistical features of INOF model
Fir a given edition the value of average opinion polarization is determined from realisations and N spins of a given realisation (we mark this as a slot 1 discussed in previous Sections). Thus e.g. for EN edition is obtained from summation over approximately spin orientations while values of articles are obtained from 1000 spins. Thus one would expect that the values of global polarization and polarization of individual article are statistically very stable. However, when we perform a comparison with another slot 2 with other random pathways we obtain a notable change of and values. At the same time, the fractions of white nodes in the steady-state, related to isolated communities, remain the same for different slots. Also the extreme values of , as those in Table 4, have little changes or nothing for different slots in a difference from the articles in the main part of probability distribution. We attribute this to the fact that such extreme articles have short links to the fixed nodes and hence are only weakly affected by pathway realisations.
As an example, we show in Figure 13 the probability distributions for 5 random slots with for EN edition and 5 slots with for RU edition. There is a visible modification of form of distribution. The values of 5 are approximately varying in a range of 25%-30% for RU and EN editions comparing to the average of these 5 values of .
The effect of variations for specific articles of 194 world countries is shown in Figure 14 as the world map of countries for slot 5 to be compared with the result of Figure 9 for slot 1. We see that the individual values of countries are changed in these two Figures but the global features of opinion polarization remain similar.
To characterize the similarity between values in presented 5 slots of EN and RU editions in Figure 13 we compute correlators between values of these 5 slots. There are 10 different correlators from 5 slots of EN (and 10 for 5 of RU). These 10 correlators have similar values C and due to that we give here only their average value and the standard deviation obtained from these 10 correlators. Thus for correlators of only articles of 194 countries we obtain (Spearman); (Pearson); (Kendall) for OP2 case of EN edition. If we compute these 10 correlators for all N articles of OP2 case of EN edition then we find (Spearman); (Pearson); (Kendall), thus for all articles the correlators are even higher. The definitions of the used three correlators of Spearman, Pearson, Kendall can be find in Wikipedia.
For 5 slots of RU edition of Figure 13 with all articles we have similar values of correlators being (Spearman); (Pearson); (Kendall).
Thus the correlator analysis shows that different slots have highly correlated values but the fluctuations of values from slot to slot are still significant for number of realisations used in previous Sections.
With the aim to reduce these fluctuations of opinion polarization we significantly increased the number realisation going up to . This allows to obtain a significant reduction of fluctuations of values of individual articles as it is shown in Figure 15 for EN and RU editions of OP2 case. We note that a run with realisations for EN edition takes 5 days of CPU time on 40 core processor.
To illustrate a difference between two slots we show the density of articles in a plane of their values, averaged over realisations, for slot 1 and slot 2 of EN edition (OP2 case) shown in Figure 16. The width of the distribution characterizes the fluctuations of values being maximal near the global average values being , for slot 1 where the density of articles is the highest. For articles at the extreme values the fluctuations are reduced that we attribute to short pathways between these articles and the fixed ones of red or blue color.
To obtain a quantitative characterization of fluctuations and their dependence on the value, we define an average variation of as , where is the average polarization of slot j, is the number of slots, and is the average for slots. We also define the average dispersion of individual article polarization as , where two different slots (1 and 2) are compared in each of the N articles, and the result is averaged over different slot pairs.
The dependences of and on are presented in Figure 17 for Wikipedia editions. For the dependence on is well described by an expression with (for FR case , that can be attributed to that it has being very close to 1). The fits of decay exponent give from 5 editions; this value is very close to corresponding to the inverse square root decay. For the exponent is also close to for EN, ES editions while for RU edition flustuations with are too high to get a reliable value of . At present we have no theoretical explication for the exponent being close to for the main part of editions.
In Table 1, Table 2 and Table 3 for specific articles we compare the values of obtained with and realisations. Practically for all articles presented in these tables the difference of values is only in the third digit that approximately corresponds to standard deviation from Figure 17. Thus the small values of should be taken with a caution. As an example of changes in at higher statistics of we may note e.g. United States, Brazil, Turkey in Table 2 that are getting positive values at higher statistics. But still the changes of are in the third digit. In Table 3 the high number of moves Mao Zedong to positive value, from the capitalistic side of this Table all politicians with negative at are moved to positive values at ; but still their values remain by a factor 3 smaller compared to the case of politicians with the socialistic orientation in the left column.
Finally in Figure 18 we show the opinion polarization for world countries for OP2 case of EN edition obtained with realisations (slot 1 in Figure 15). There is a clear dominance of socialistic orientation for a main number of countries especially in Europe and Russia. The global feature of this world map are similar to those shown in Figure 9 and Figure 14 obtained with . But it is clear that results of Figure 18 are much more stable in respect to fluctuations.
An interested reader can find the map of world countries opinion polarization for all 6 Wikipedia editions at high in [31]. For all articles of these 6 editions the opinion polarization values for OP2 case are also available at [31].
7. Discussion and conclusion
We developed the Ising Network Opinion Formation (INOF) model and applied it to analysis of opinion formation in Wikipedia networks of 6 language editions of year 2017. In this model Ising spins with fixed opposite directions present certain fixed opinions, red or blue, of selected network nodes. All other nodes have initially zero spin of white opinion. Then the Monte Carlo step procedure determines inversion of spins determined by their in-going links until a steady-state polarization of all network spins is reached. This allows to determine the global opinion preference of the whole network as well as opinion polarization of individual nodes.
We mainly considered the confrontation of capitalism, imperialism and socialism, communism. We find that for 6 Wikipedia editions (EN, DE, ES, FR, IT, RU) a majority opinion is in favor of socialism, communism. The variations of opinion preferences for the world countries, political leaders and other Wikipedia articles are determined being in a good agreement with simple heuristic expectations. We give also arguments for certain deviations from such expectations.
In addition we consider the opinion formation given by interactions between Christianity and Islam for EN and RU editions. The INOF model naturally gives a significant preference for Christianity in EN Wikipedia while the preference of RU Wikipedia is significantly more balanced. The INOF model determins the preference balance for the world countries which has a high correlation coefficient with the muslim population of countries for EN and RU editions.
We also consider the competition of US Democratic and Republican Parties in EN Wikipedia of 2017. The global opinion preference is found to be significantly in favor of Democrats.
We note that the INOF model may have some uncertain situations, like for example the case of article China which has in-going direct links from capitalism, imperialism and from socialism, communism. However, in great majority of studied cases the model gives good realistic opinion preferences.
On the basis of obtained results we expect that the proposed INOF model will find various applications for opinion formation in numerous directed networks.
Author Contributions
All authors equally contributed to all stages of this work.
Funding
The authors acknowledge support from the grant ANR France project NANOX N° ANR-17-EURE-0009 in the framework of the Programme Investissements d'Avenir (project MTDINA).
Acknowledgments
We thank K.M.Frahm for useful discussions.
Conflicts of Interest
The authors declare no conflict of interest.
References
- Castellano, C.; Fortunato, S.; Loreto, V. Statistical physics of social dynamics. Rev. Mod. Phys. 2009, 81, 591–646. [CrossRef]
- Dorogovtsev, S. Lectures in Complex Networks; Oxford University Press, 2010.
- Wikipedia contributors. Social media use in politics — Wikipedia, The Free Encyclopedia. https://en.wikipedia.org/wiki/Social_media_use_in_politics, 2024. [Online; accessed 31-May-2024].
- Fujiwara, T.; Muller, K.; Schwarz, C. The Effect of Social Media on Elections: Evidence from The United States J. Eur. Economi Ass.. 2023, jvad058. [CrossRef]
- Galam, S. Majority rule, hierarchical structures, and democratic totalitarianism: A statistical approach. Journal of Mathematical Psychology 1986, 30, 426–434. [CrossRef]
- Sznajd-Weron, K.; Sznajd, J. Opinion evolution in closed community. International Journal of Modern Physics C 2000, 11, 1157–1165. [CrossRef]
- Sood, V.; Redner, S. Voter Model on Heterogeneous Graphs. Phys. Rev. Lett. 2005, 94, 178701. [CrossRef]
- Watts, D.J.; Dodds, P.S. Influentials, Networks, and Public Opinion Formation. Journal of Consumer Research 2007, 34, 441–458. [CrossRef]
- Galam, S. Sociophysics: a review of Galam models. International Journal of Modern Physics C 2008, 19, 409–440, [. [CrossRef]
- Schmittmann, B.; Mukhopadhyay, A. Opinion formation on adaptive networks with intensive average degree. Phys. Rev. E 2010, 82, 066104. [CrossRef]
- Kandiah, V.; Shepelyansky, D. PageRank model of opinion formation on social networks. Physica A 2012, 391, 5779. [CrossRef]
- Eom, Y.H.; Shepelyansky, D.L. Opinion formation driven by PageRank node influence on directed networks. Physica A: Statistical Mechanics and its Applications 2015, 436, 707–715. [CrossRef]
- Coquide, C.; Lages, J.; Shepelyansky, D.L. Opinion Formation in the World Trade Network. Entropy 2024, 25(2), 141. [CrossRef]
- Frahm, K.M.; Shepelyansky, D.L. Wikipedia network data sets for 24 language editions collected in 2017. https://www.quantware.ups-tlse.fr/QWLIB/24wiki2017/index.html, 2017. [Online; accessed 31-May-2024].
- Coquide, C.; Lages, J.; Shepelyansky, D.L. World influence and interactions of universities from Wikipedia networks. Eur. Phys. J. B 2019, 92, 3. [CrossRef]
- Demidov, D.; Frahm, K.M.; Shepelyansky, D.L. What is the central bank of Wikipedia? Physica A 2020, 542, 123199. [CrossRef]
- Reagle, J.M. Good faith collaboration: the culture of Wikipedia.; MIT Press, 2010.
- Nielsen, F.A. Wikipedia Research and Tools: Reviews and Comments. SSRN Electronic Jourmal 2012. [CrossRef]
- Ball, C. Defying easy categorization: Wikipedia as primary, secondary and tertiary resource. Insights 2023, 7, 1. [CrossRef]
- Arroyo-Machado, W., Diaz-Faes, A.A., Herrera-Viedma, E, Castas, R. From academic to media capital: To what extent does the scientific reputation of universities translate into Wikipedia attention? J. Assoc. Inf. Sci. Technol 2024, 75, 423. https://asistdl.onlinelibrary.wiley.com/doi/full/10.1002/asi.24856.
- Marx, Karl Das Kapital: Kritik der politischen Oekonomie. Vol. 1: Der Produktionsprozess des Kapitals (1 ed.).; Hamburg, Verlag von Otto Meissner, 1867. [CrossRef]
- Schumpeter, J.A. Capitalism, Socialism and Democracy; Routledge, London UK, 1976. [CrossRef]
- Chavance, B. Chapter 2: The historical conflict of socialism and capitalism, and the post-social ist transformation. in "Trade and Development, Ed. Toyem J.; Edward Elgar, Cheltenham, UK, p.16, 2003. [CrossRef]
- Brin, S.; Page, L. The anatomy of a large-scale hypertextual Web search engine. Computer Networks and ISDN Systems 1998, 30, 107.
- Langville, A.; Meyer, C. Google’s PageRank and beyond: the science of search engine rankings; Princeton University Press: Princeton, 2006.
- Ermann, L.; Frahm, K.M.; Shepelyansky, D.L. Google matrix analysis of directed networks. Rev. Mod. Phys. 2015, 87, 1261. [CrossRef]
- Hopfield, J.J. Neural networks and physical systems with emergent collective computational abilities. Proc. Nat. Acad. Sci. 1982, 79(8), 2554. [CrossRef]
- Benedetti, M.; Carillo, L.; Marinari, E.; Mezard, N. Eigenvector dreaming J. Stat. Mech. 2024, 013302. [CrossRef]
- Wikipedia contributors. Islam by country — Wikipedia, The Free Encyclopedia. https://en.wikipedia.org/wiki/Islam_by_country, 2024. [Online; accessed 1-July-2024].
- Wikipedia contributors. List of U.S. state and territory abbreviations — Wikipedia, The Free Encyclopedia. https://en.wikipedia.org/wiki/List_of_U.S._state_and_territory_abbreviations, 2024. [Online; accessed 1-July-2024].
- Ermann, L.; Shepelyansky, D.L.. Additional data for this article. https://www.quantware.ups-tlse.fr/QWLIB/isingwiki/, 2024. [Online; accessed 28-July-2024].
Figure 4.
Average polarization values for the top K nodes () for EN edition and OP2 case; here . Positive and negative are represented by red and blue circles, respectively. The top panel shows the case for the top 300 PageRank ranks (K), while the bottom panel displays ranks from 375 to 675, where the "Communism" and "Socialism" nodes appear in English language. The average is computed over 1000 iterations after .
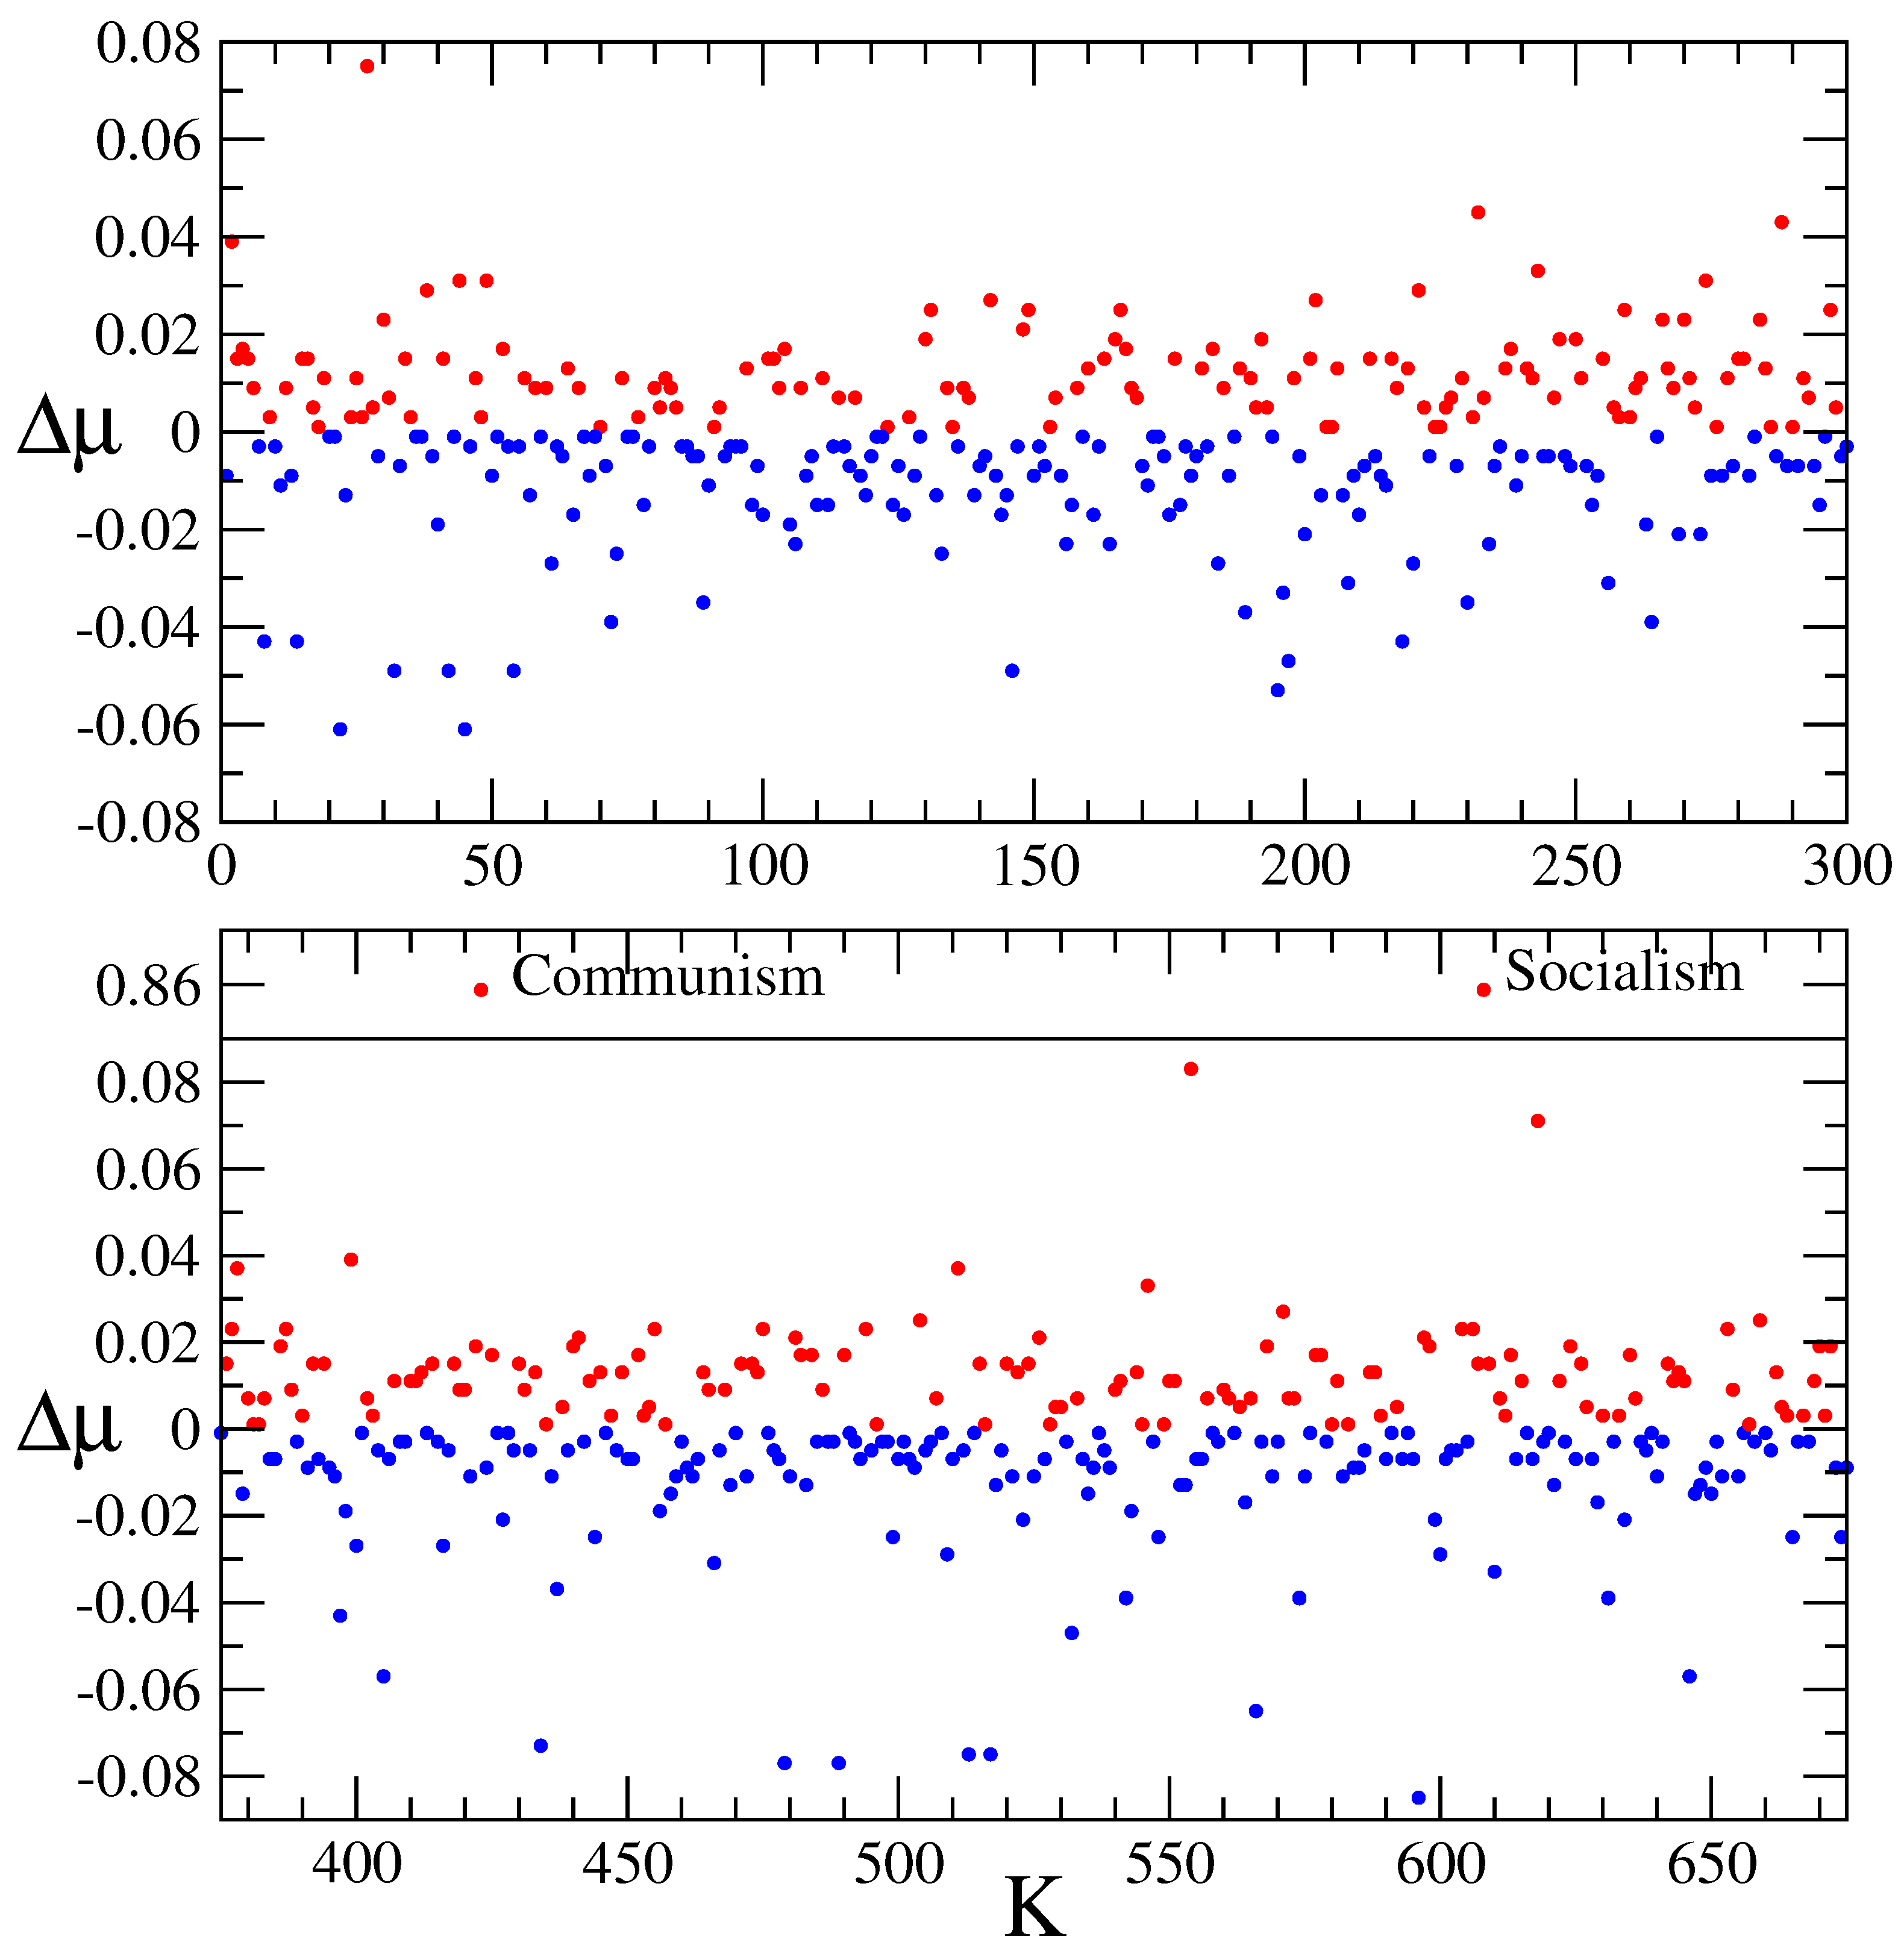
Figure 5.
Probability density of the average polarization value for the English edition for OP2 case; here . The main panel displays the probability density on a logarithmic scale, while the inset panel shows it on a linear scale. The average is computed over 1000 realisations and .
Figure 5.
Probability density of the average polarization value for the English edition for OP2 case; here . The main panel displays the probability density on a logarithmic scale, while the inset panel shows it on a linear scale. The average is computed over 1000 realisations and .
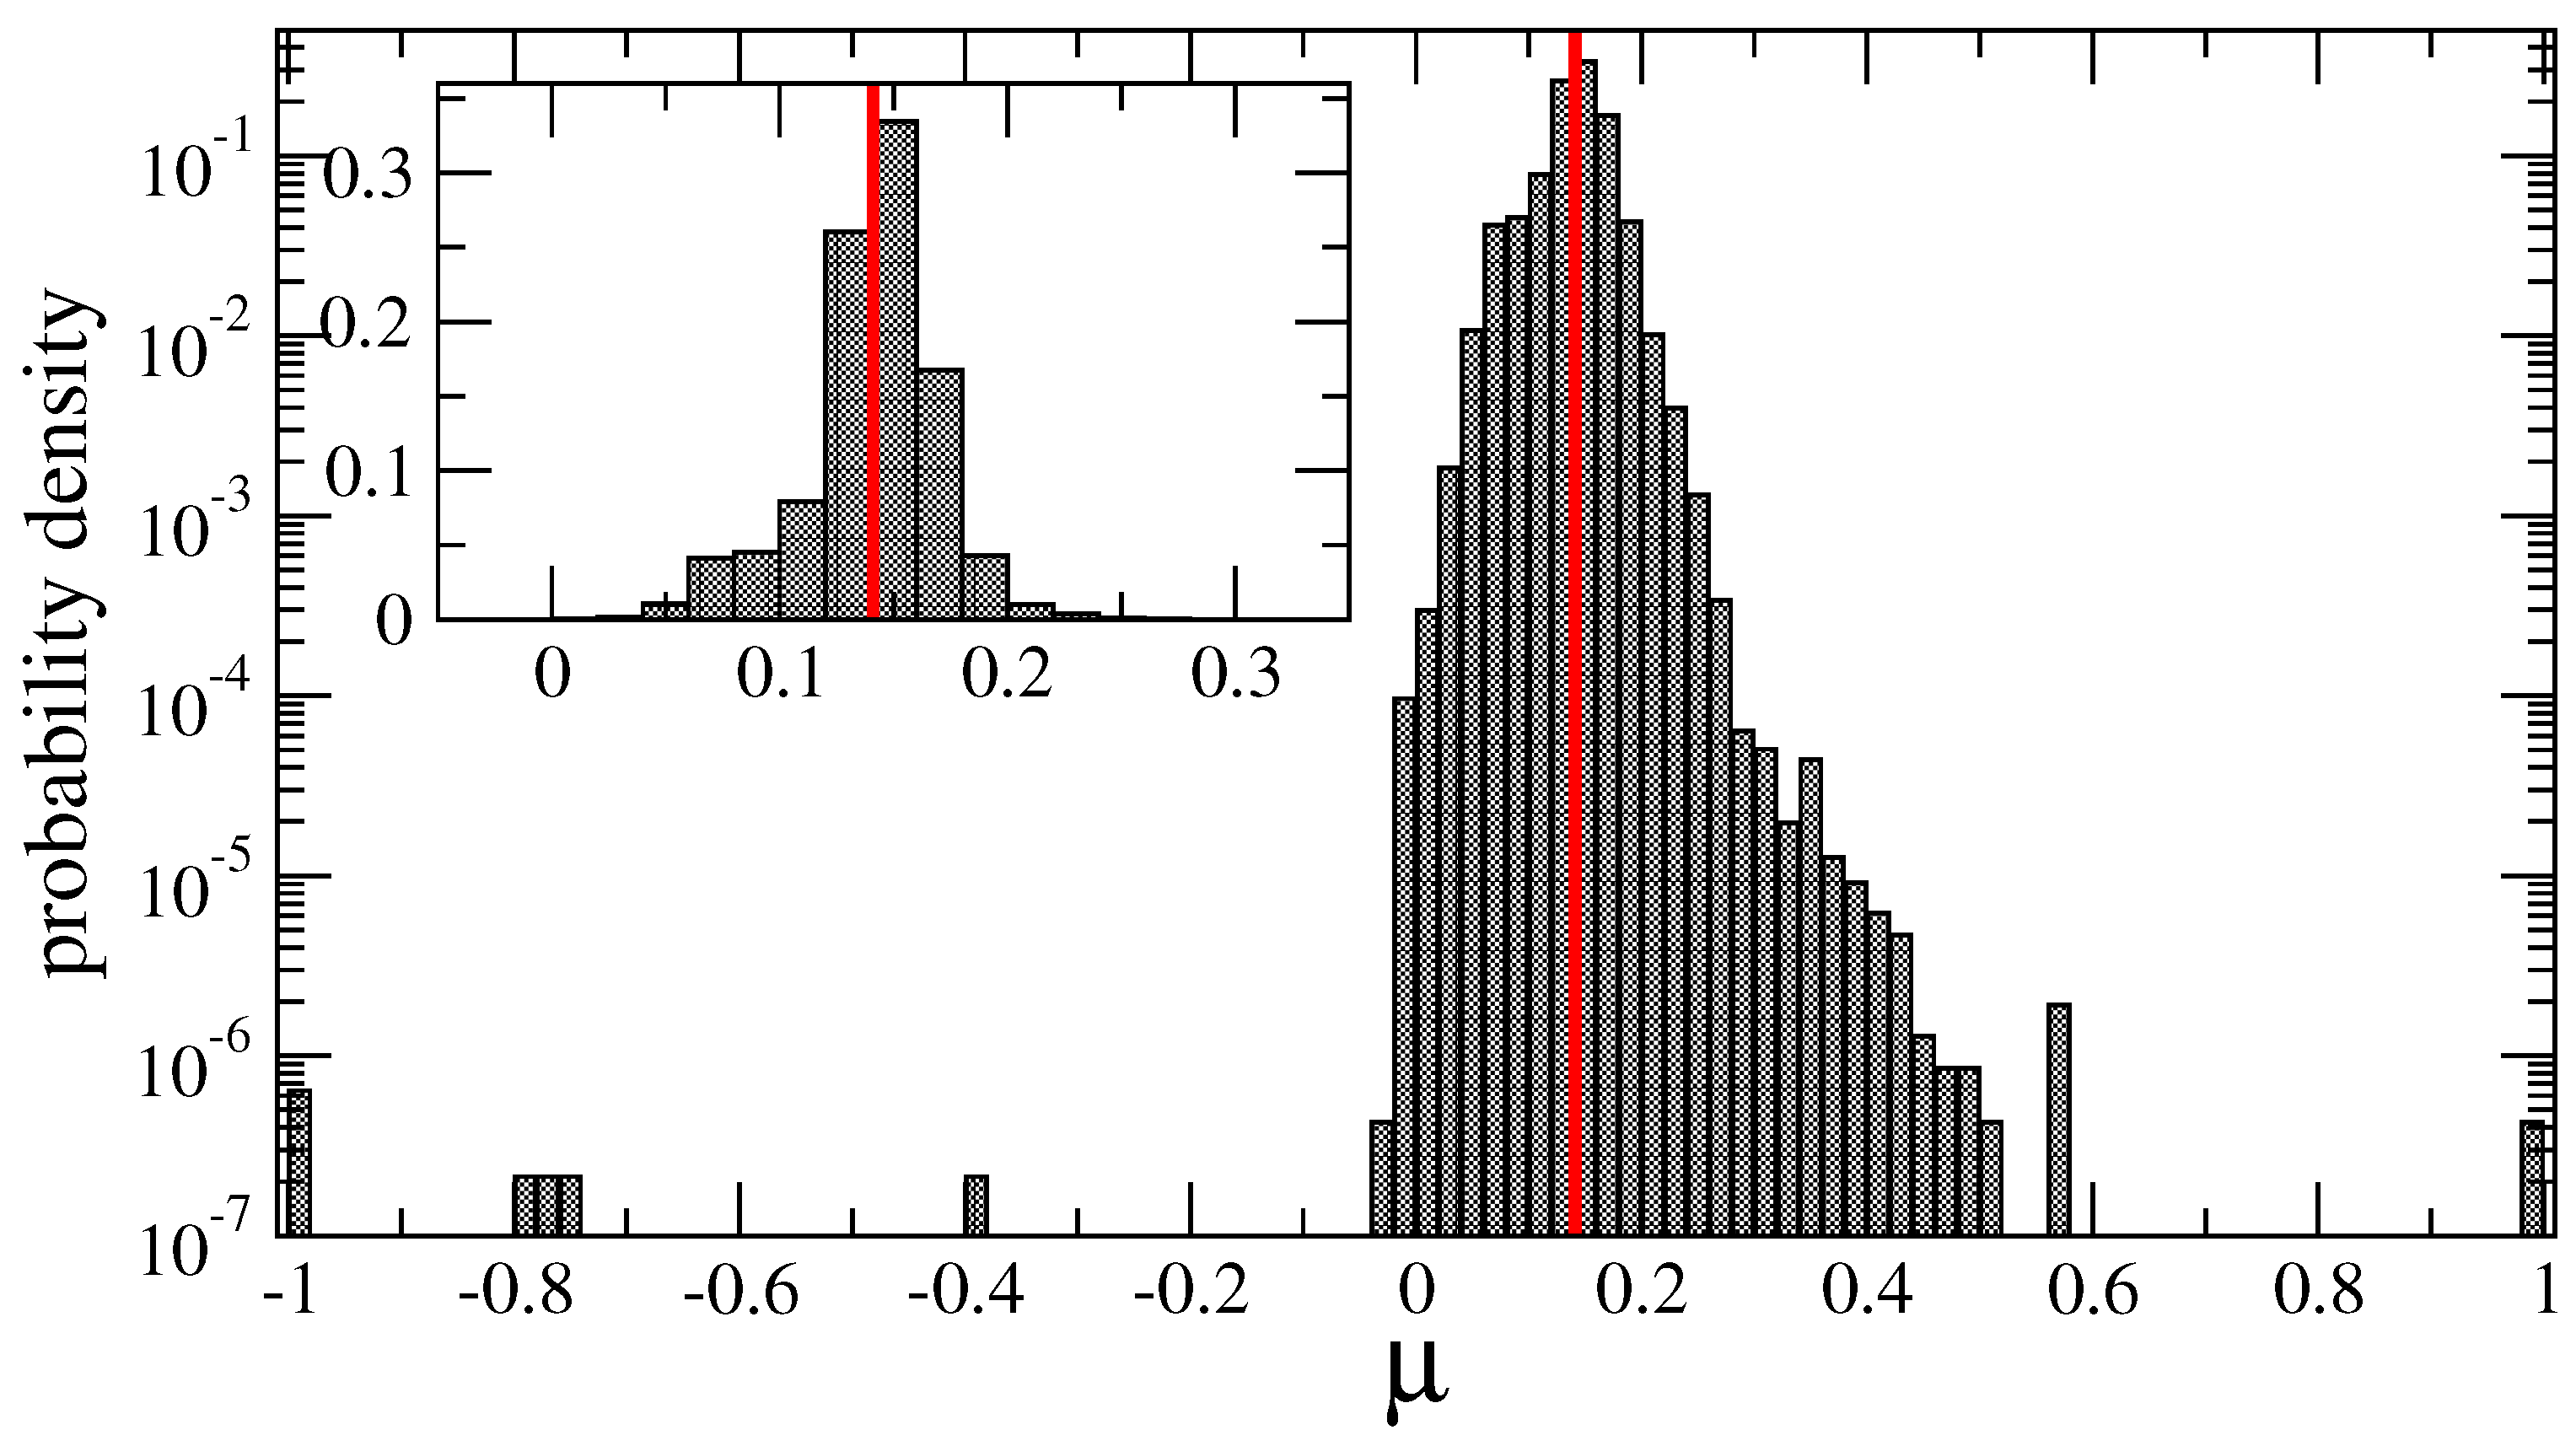
Figure 6.
Probability density of the average magnetization value for the Russian edition for OP1 (top panel) and OP2 (bottom panel) OP2 case; here respectively. The main panels display the probability density on a logarithmic scale. Top panels represent the initial condition with one fixed red node (socialism) and one fixed blue node (capitalism) on top panels, while bottom panels show the initial condition with 2 fixed red nodes (socialism,communism) and with 2 fixed blue nodes (capitalism,imperialism), The corresponding inset panels show the same probability density but on a linear scale. The average is computed over 1000 realisations and .
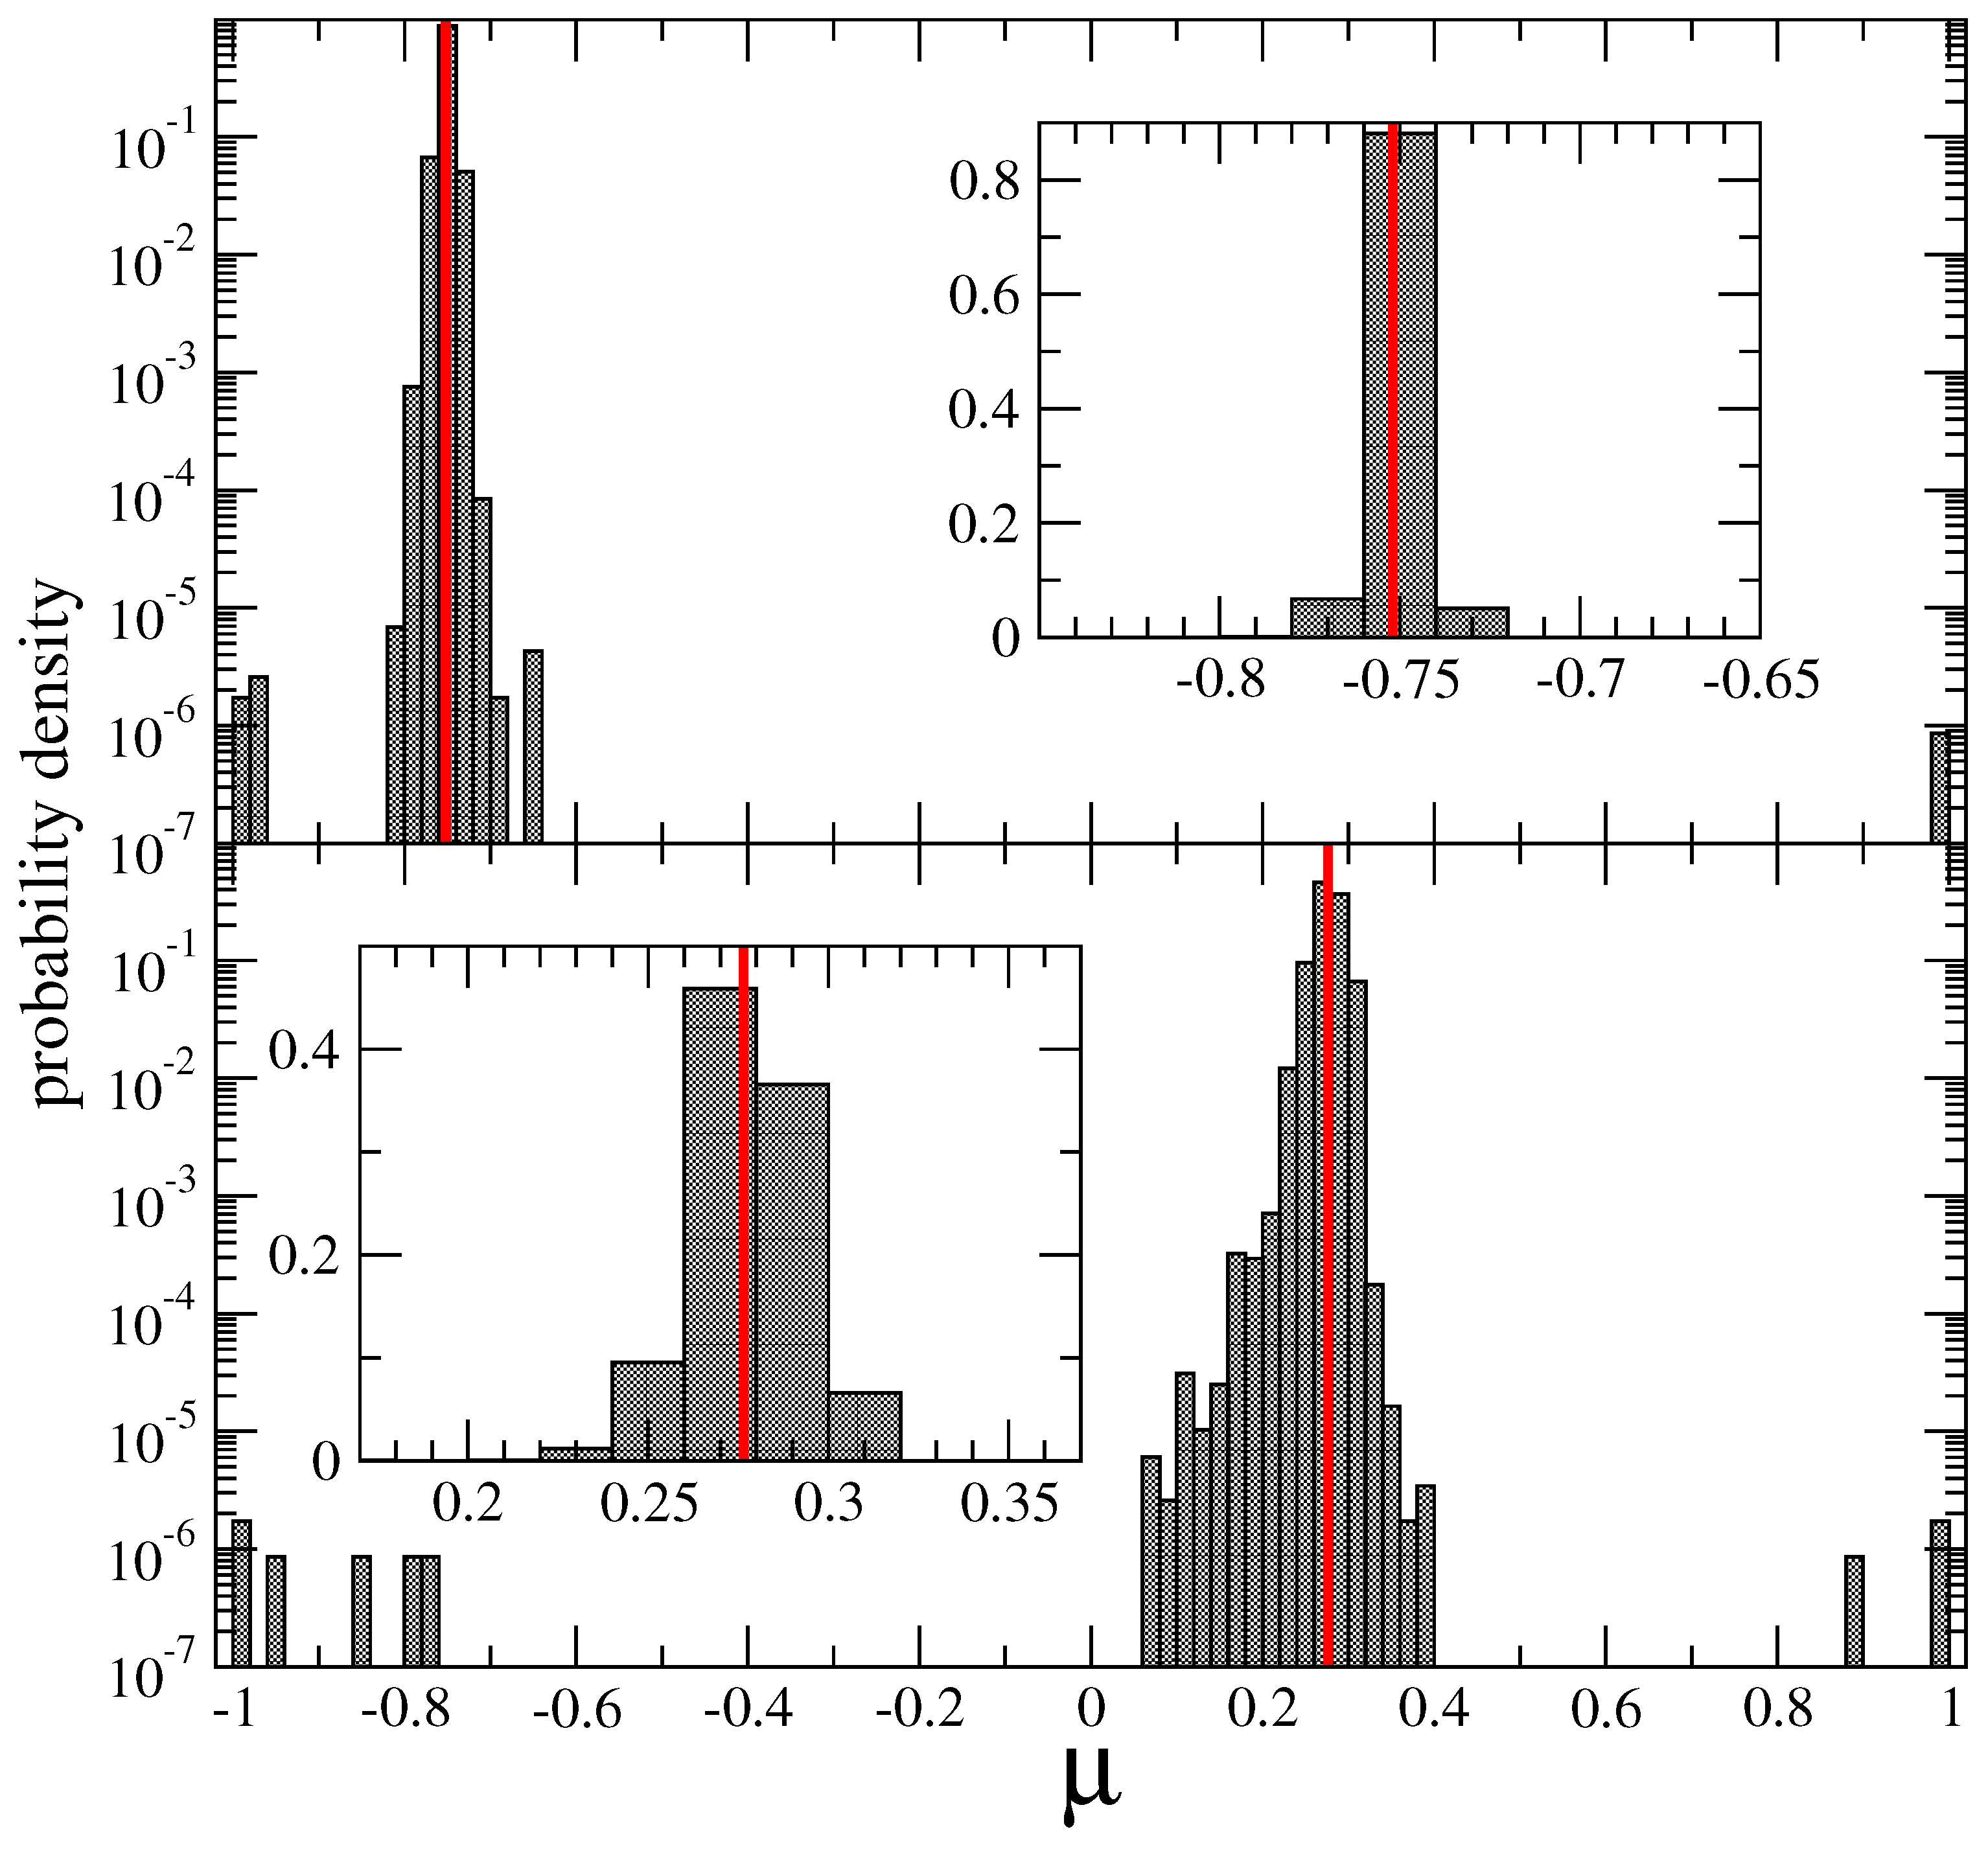
Figure 7.
Distribution of English Wikipedia articles based on their distance to red nodes socialism, communism and blue nodes capitalism, imperialism. Color represents the frequency/number of articles as a function of .
Figure 7.
Distribution of English Wikipedia articles based on their distance to red nodes socialism, communism and blue nodes capitalism, imperialism. Color represents the frequency/number of articles as a function of .
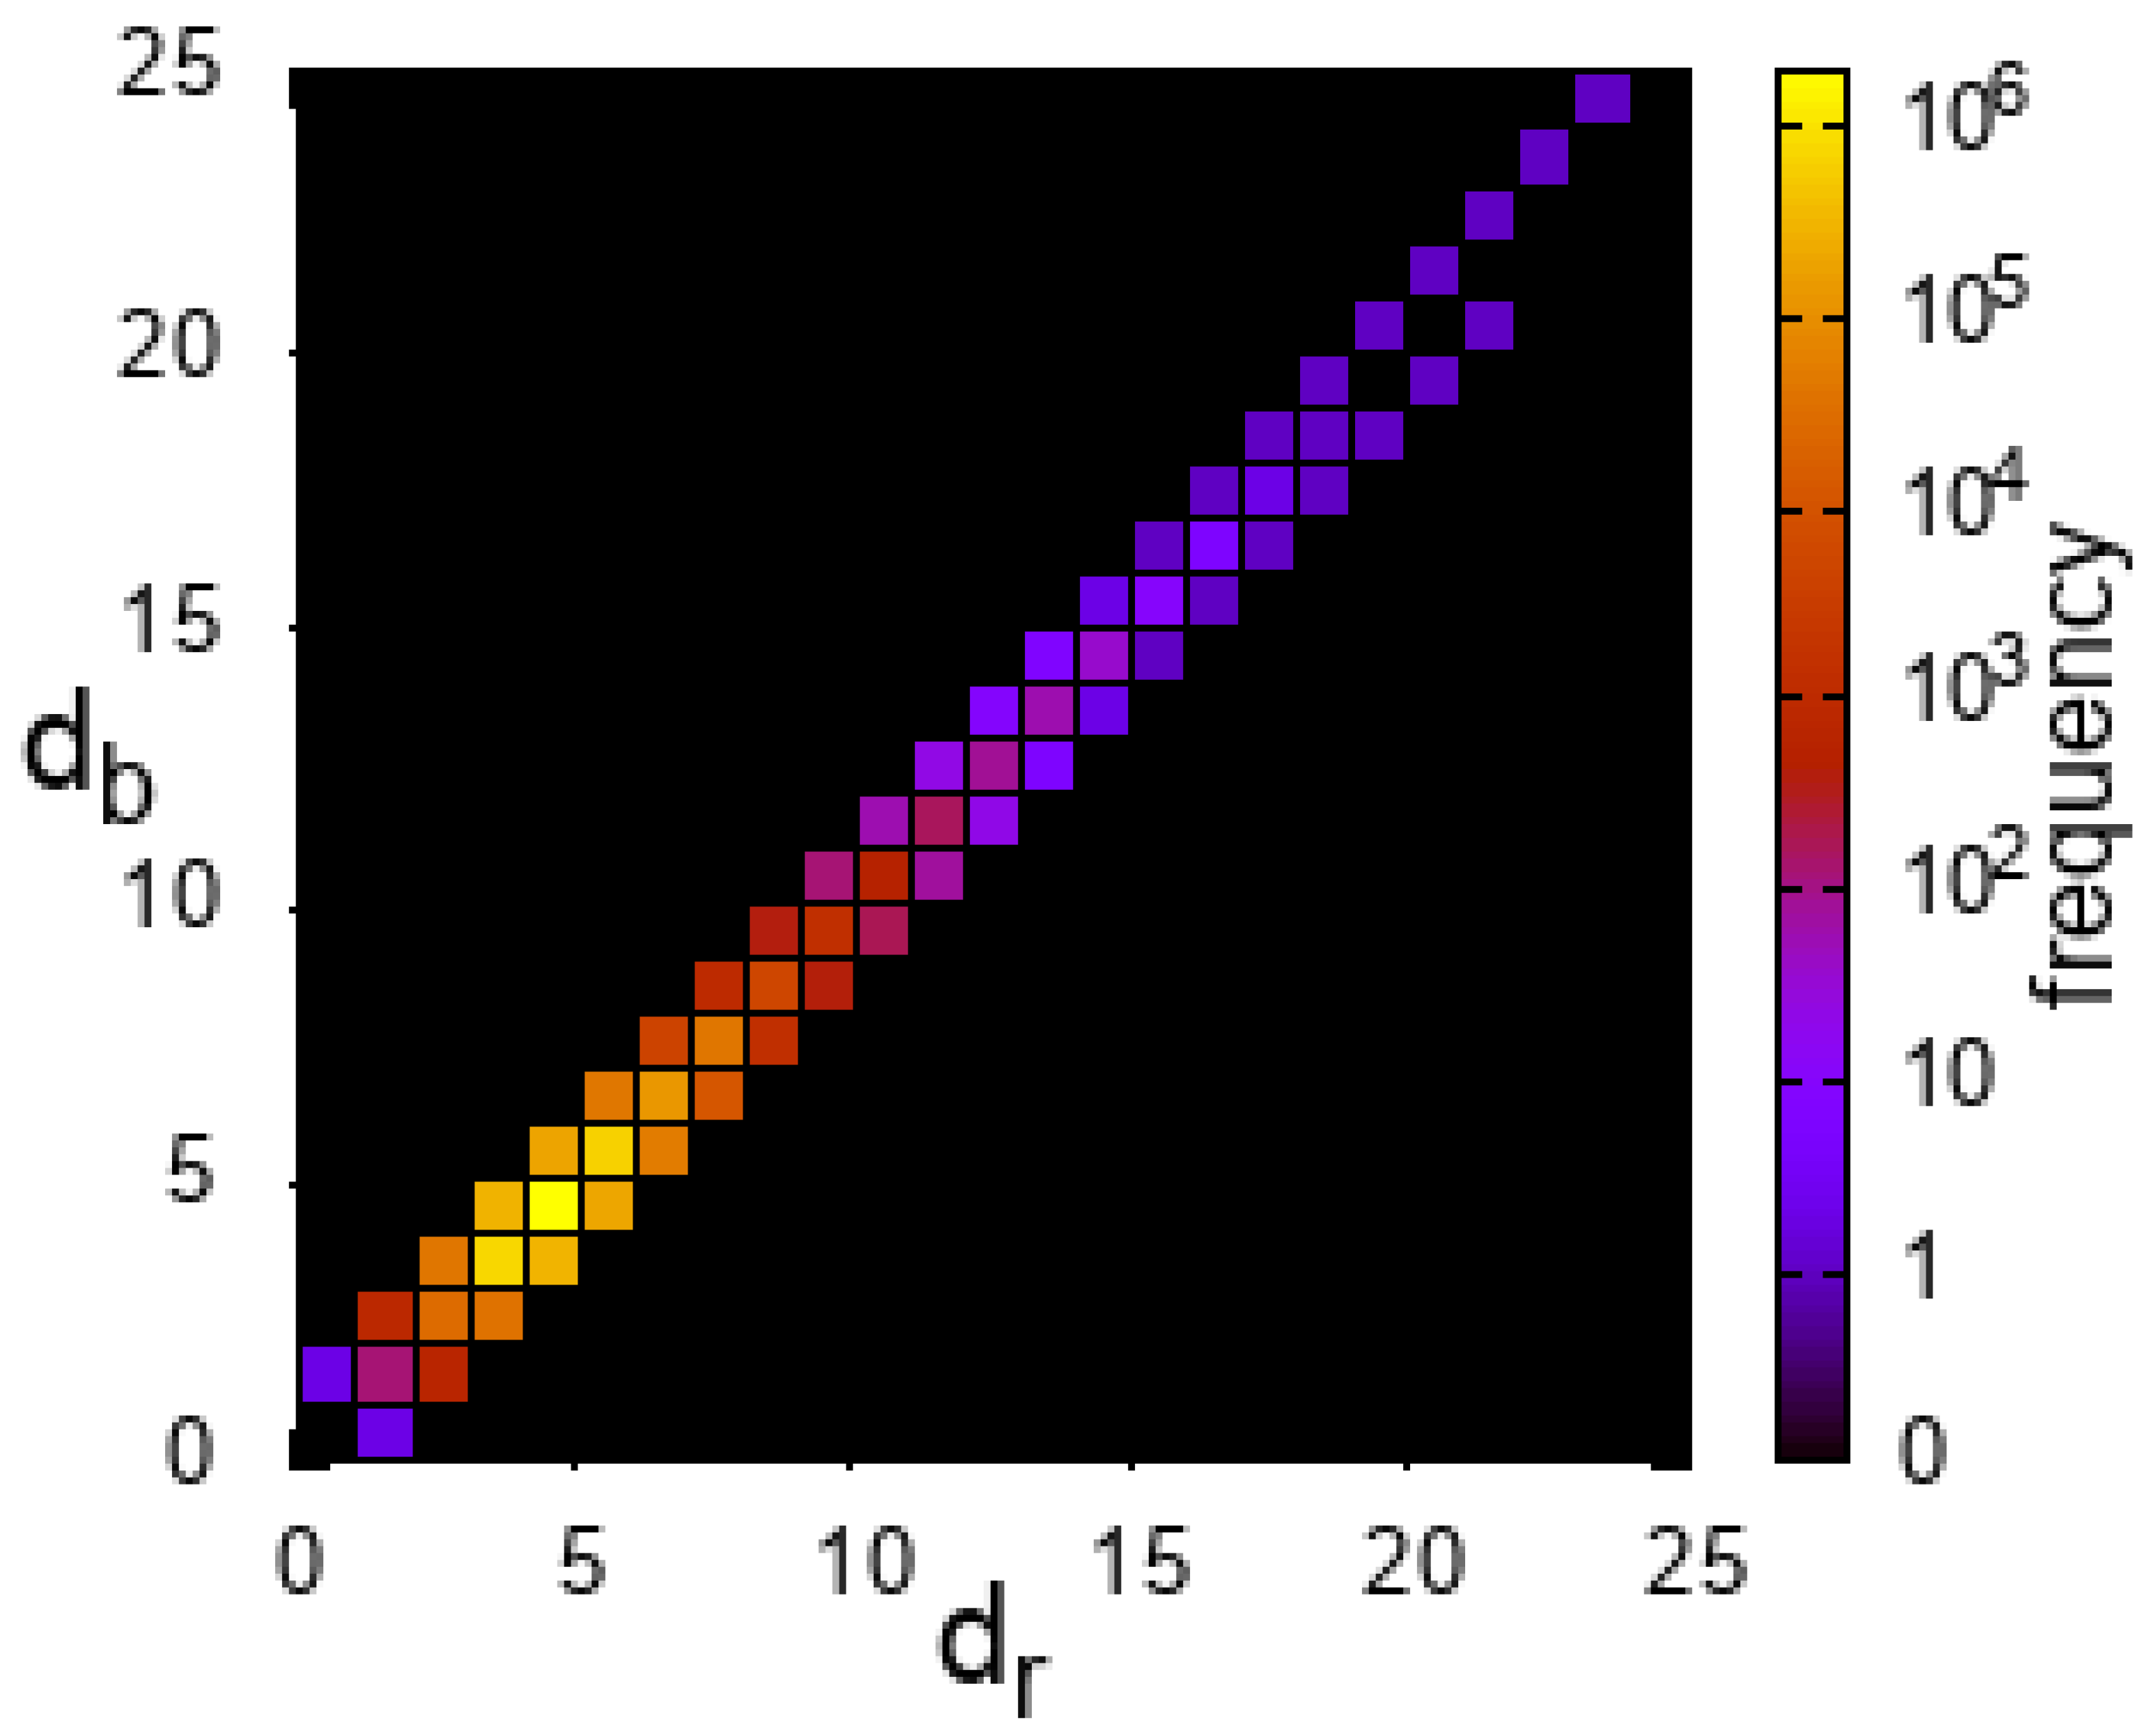
Figure 8.
Average polarization as a function of Erdös distance d for OP2 case. Each panel corresponds to one of the six different languages of Wikipedia: EN (English), DE (German), ES (Spanish), FR (French), IT (Italian) and RU (Russian). Red circles represent nodes that are one step closer to red nodes than to blue nodes (), black circles represent nodes that are equidistant from red and blue nodes (), and blue circles represent nodes that are one step closer to blue nodes than to red nodes (). The average values are given in caption of Figure 3.
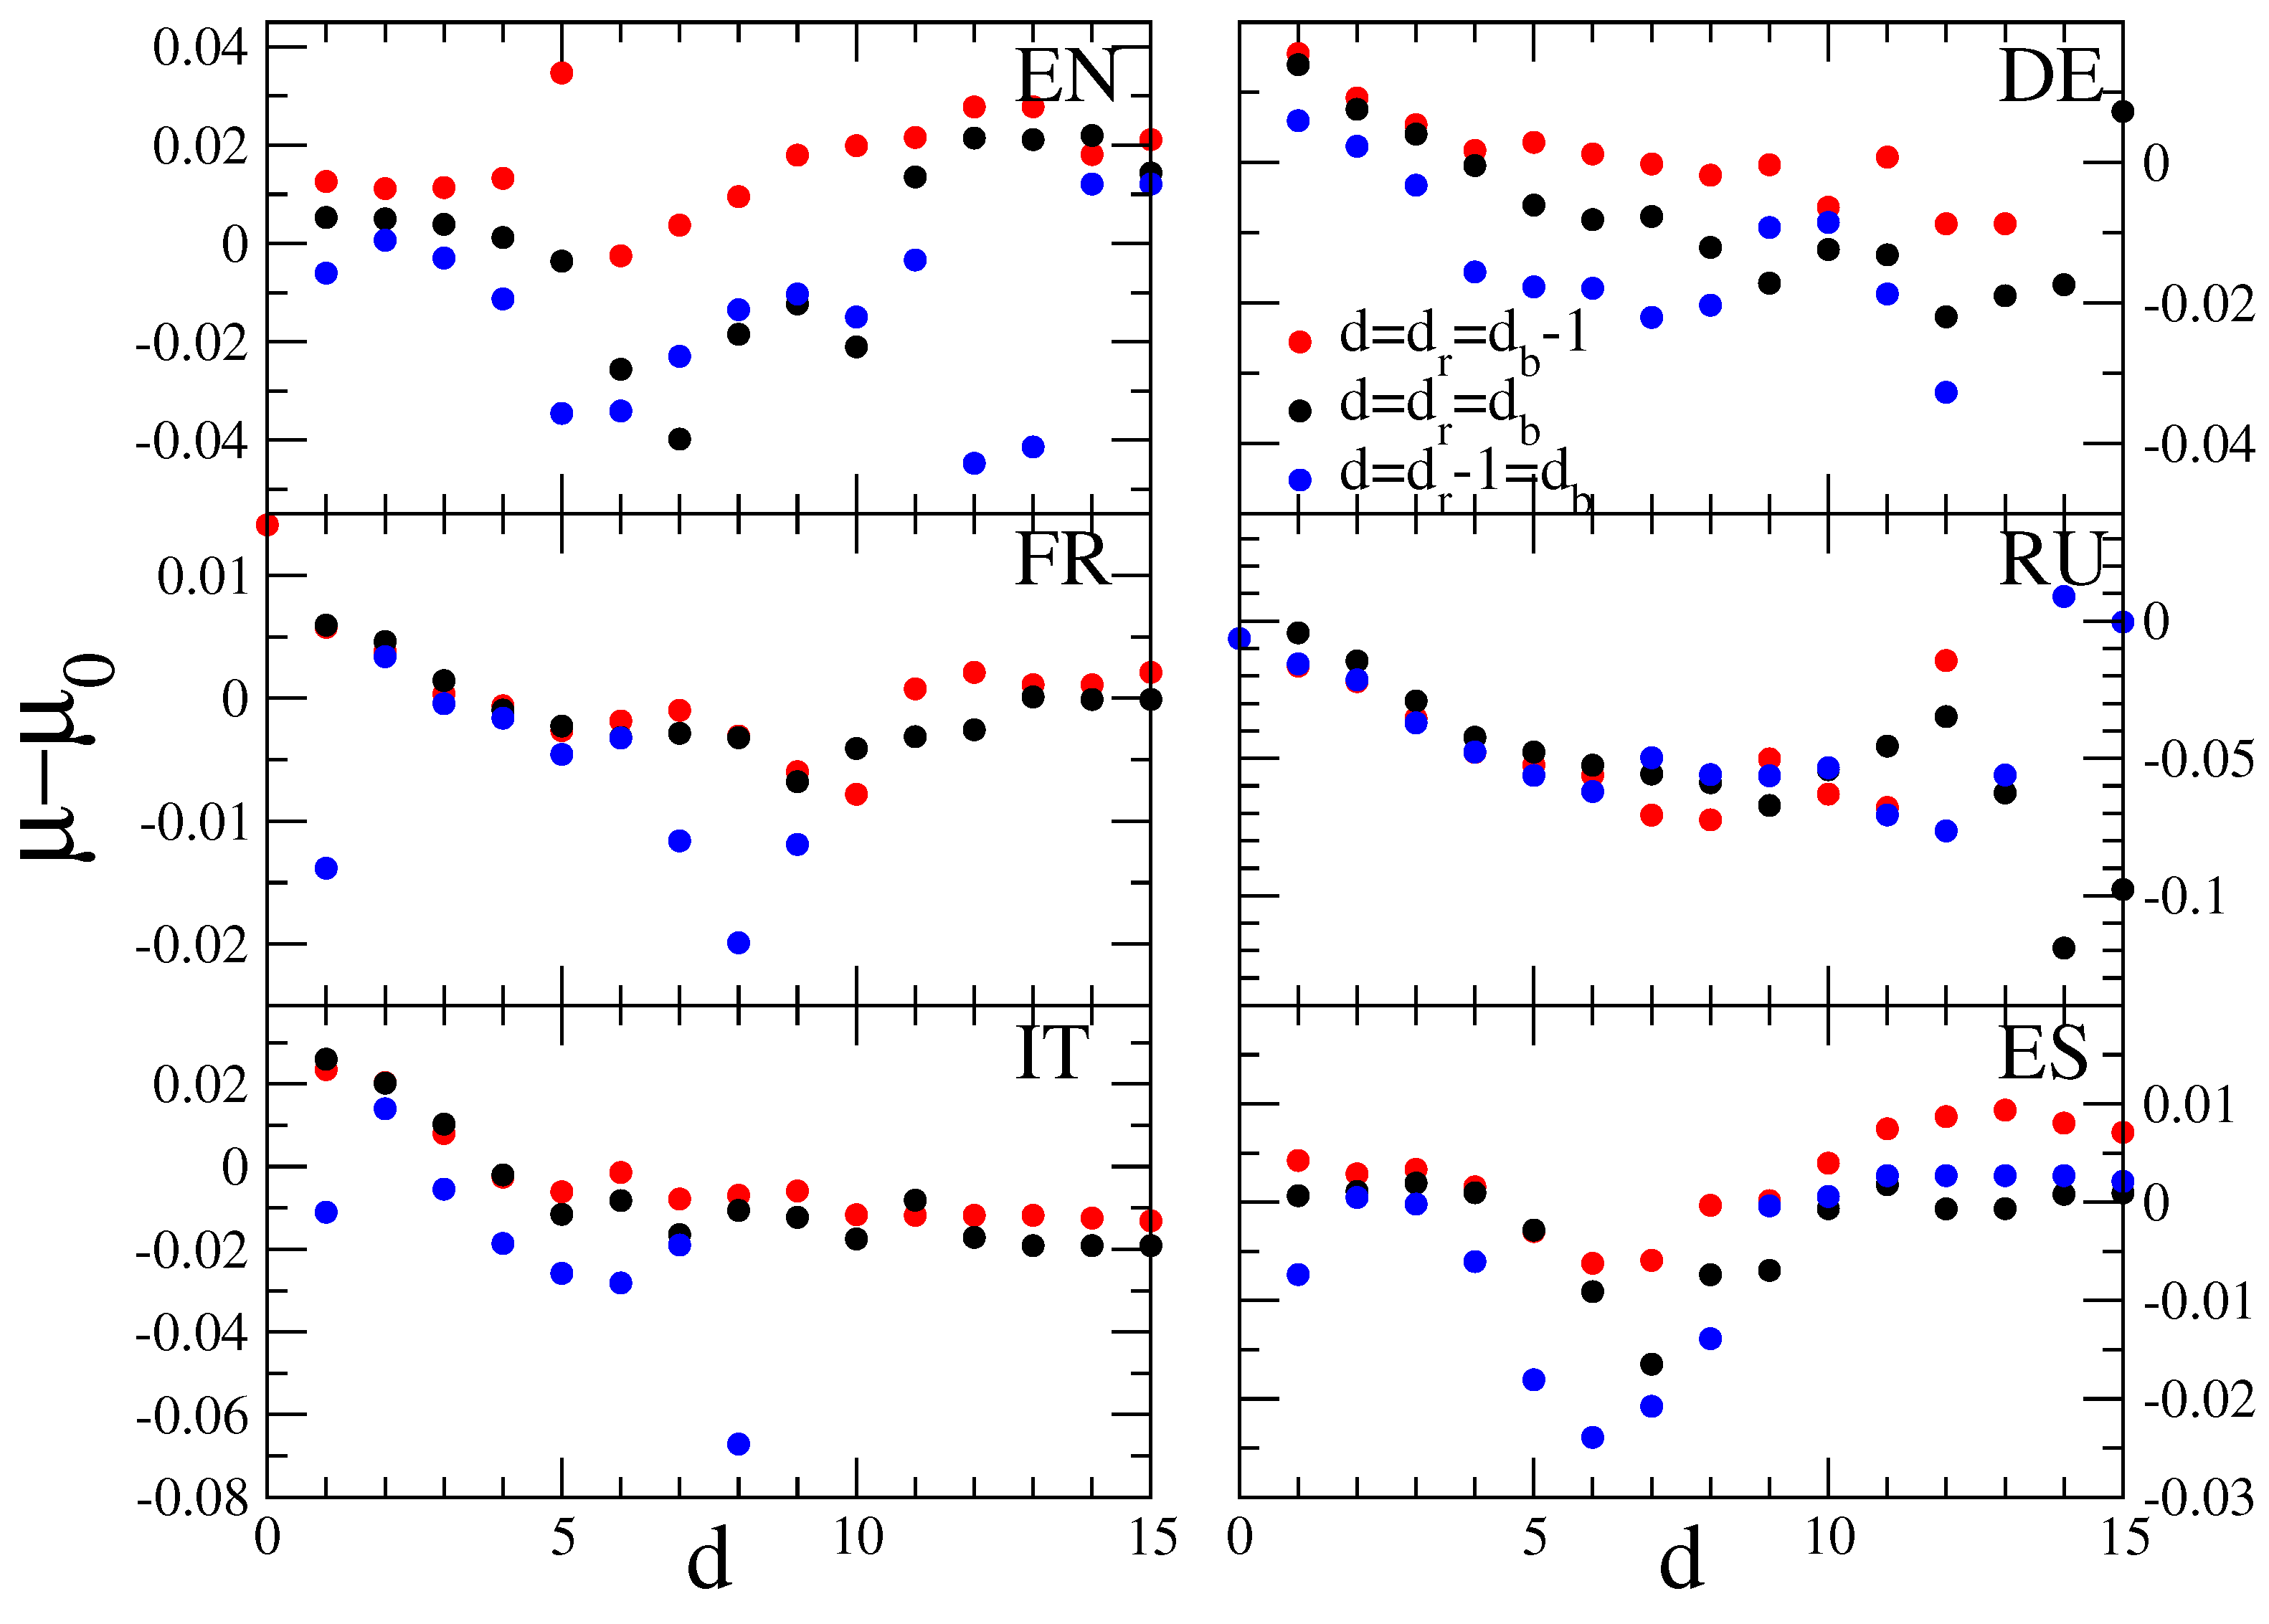
Figure 9.
Geographical distribution of opinion polarization to socialism, communism () or (capitalism, imperialism) () expressed by for English Wikipedia. Color legend shows the scale for .
Figure 9.
Geographical distribution of opinion polarization to socialism, communism () or (capitalism, imperialism) () expressed by for English Wikipedia. Color legend shows the scale for .
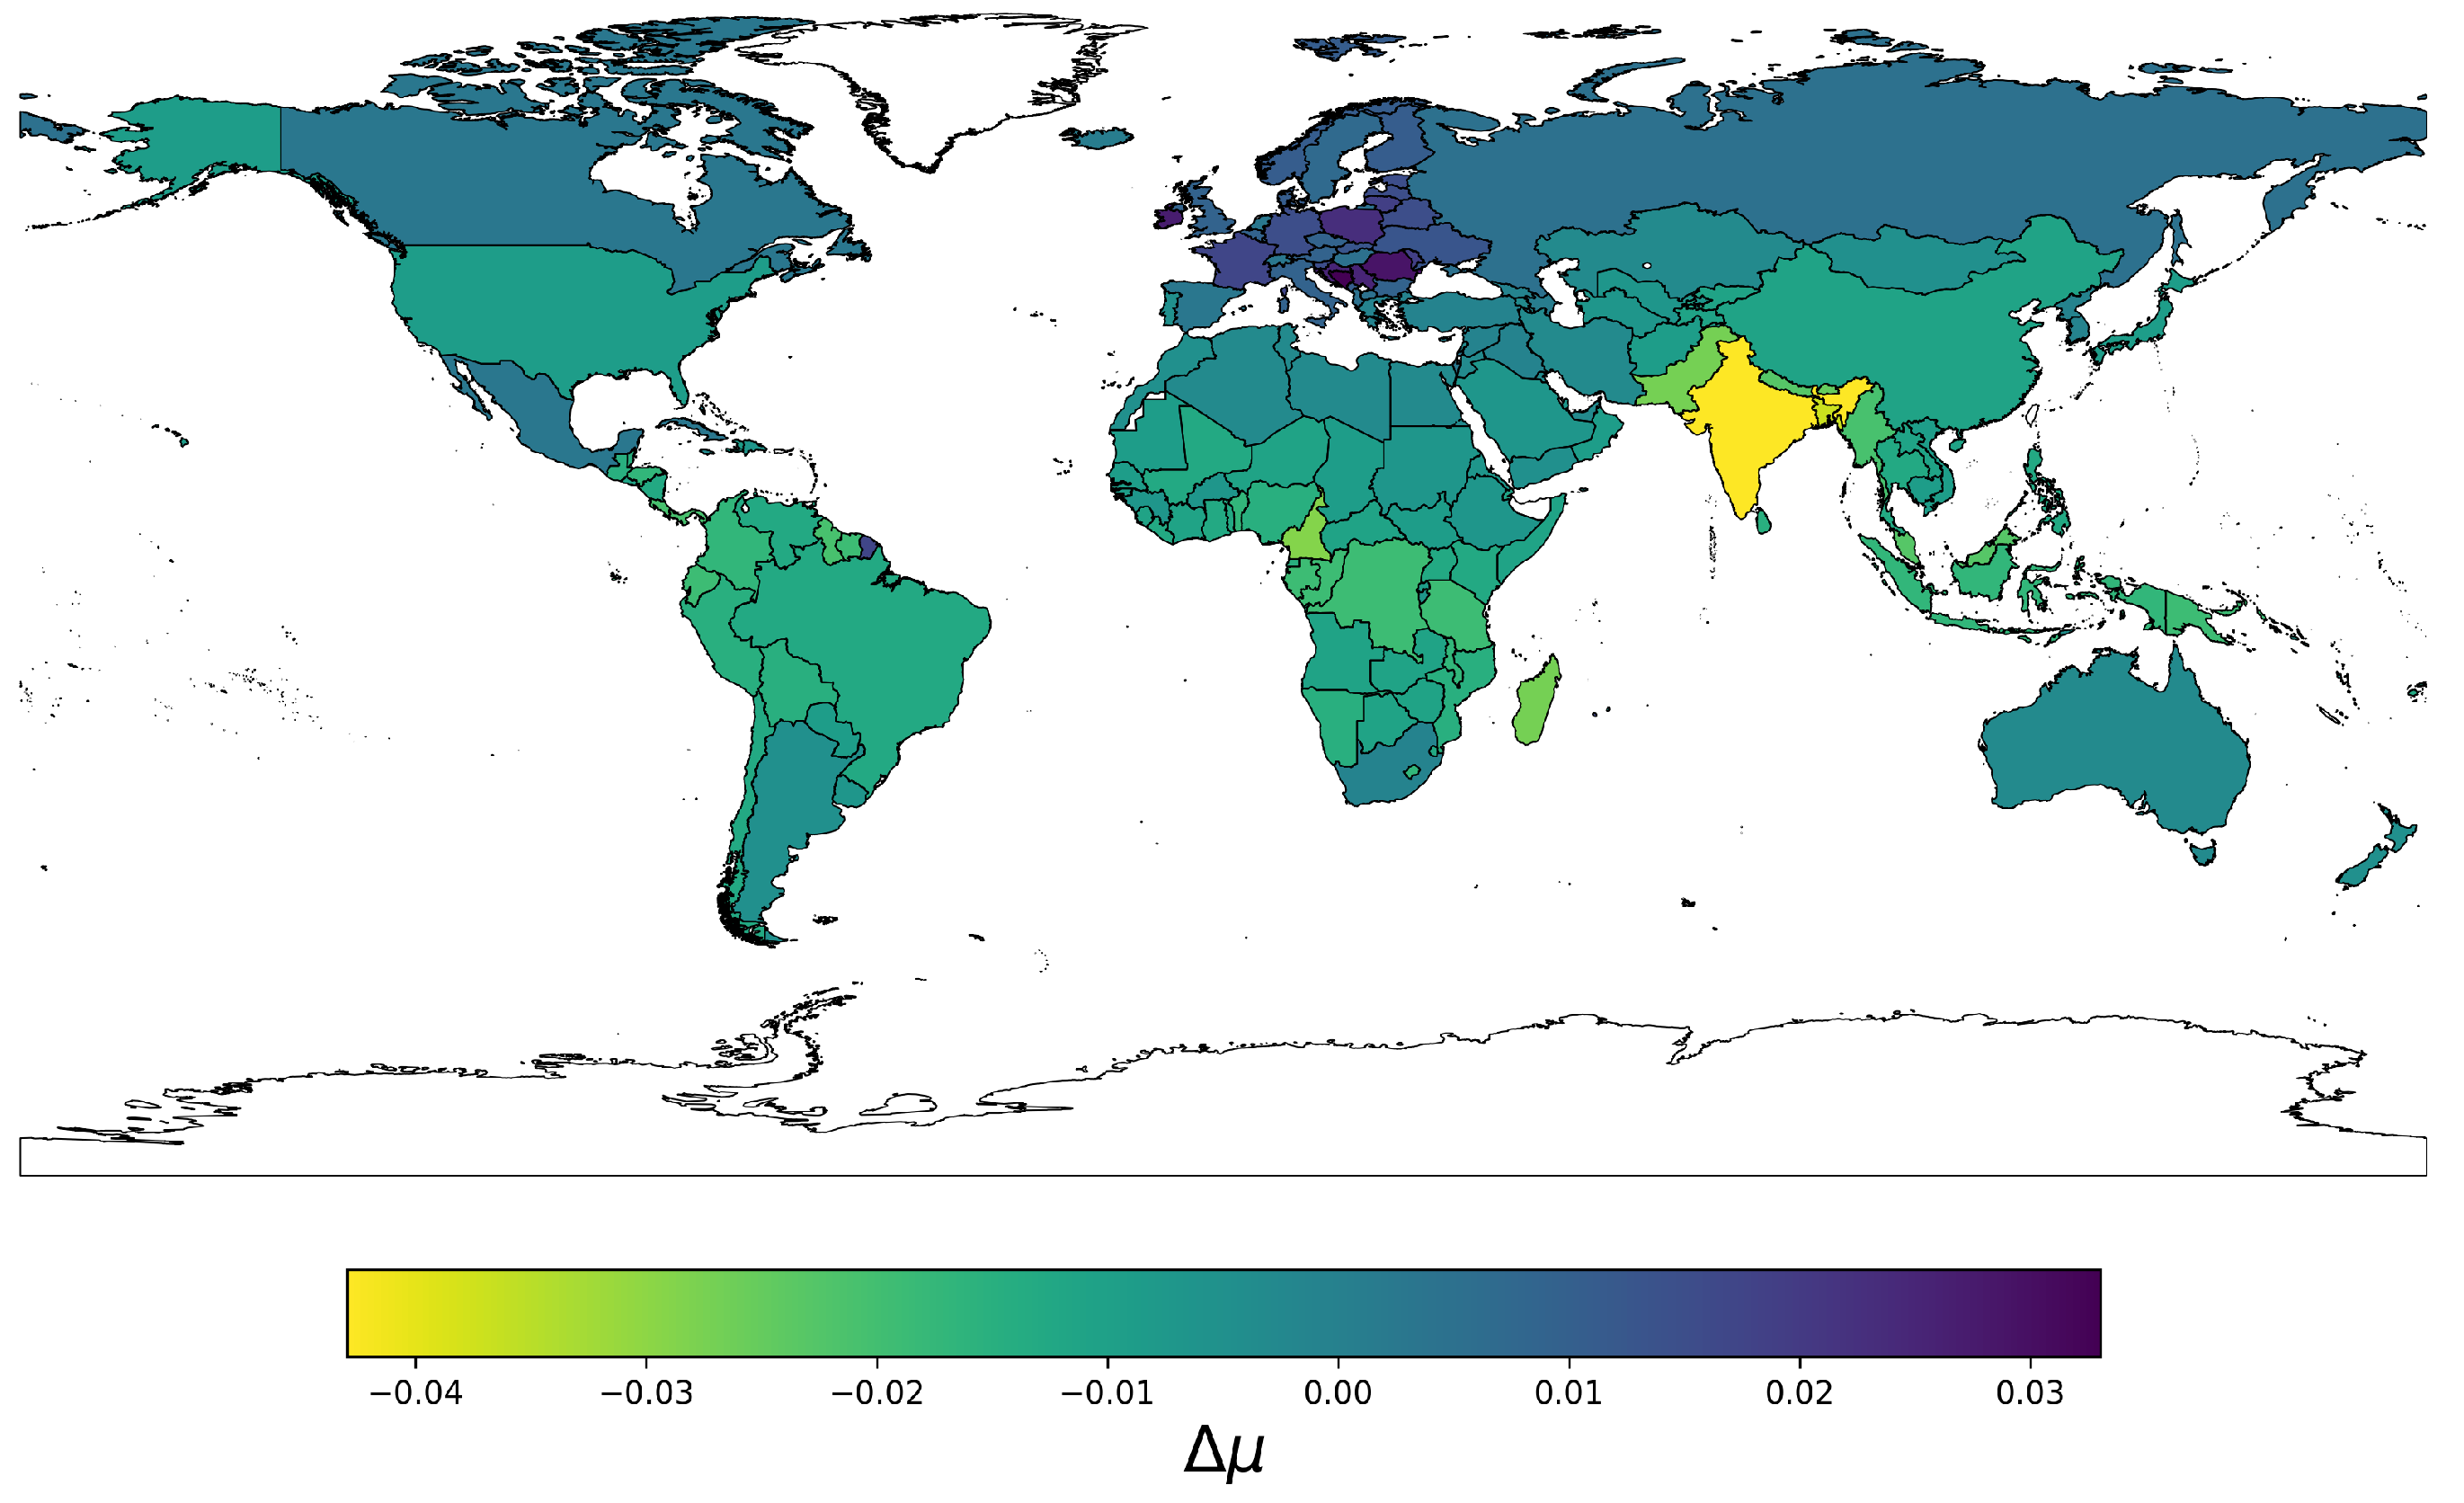
Figure 10.
Same histogram as in Figure 2 but for another pair of fixed nodes (articles) being Christianity (red) and Islam (blue) for EN (top) and RU (bottom) Wikipedia editions; here average opinion polarization is (EN), (RU) being marked by red lines; .
Figure 10.
Same histogram as in Figure 2 but for another pair of fixed nodes (articles) being Christianity (red) and Islam (blue) for EN (top) and RU (bottom) Wikipedia editions; here average opinion polarization is (EN), (RU) being marked by red lines; .
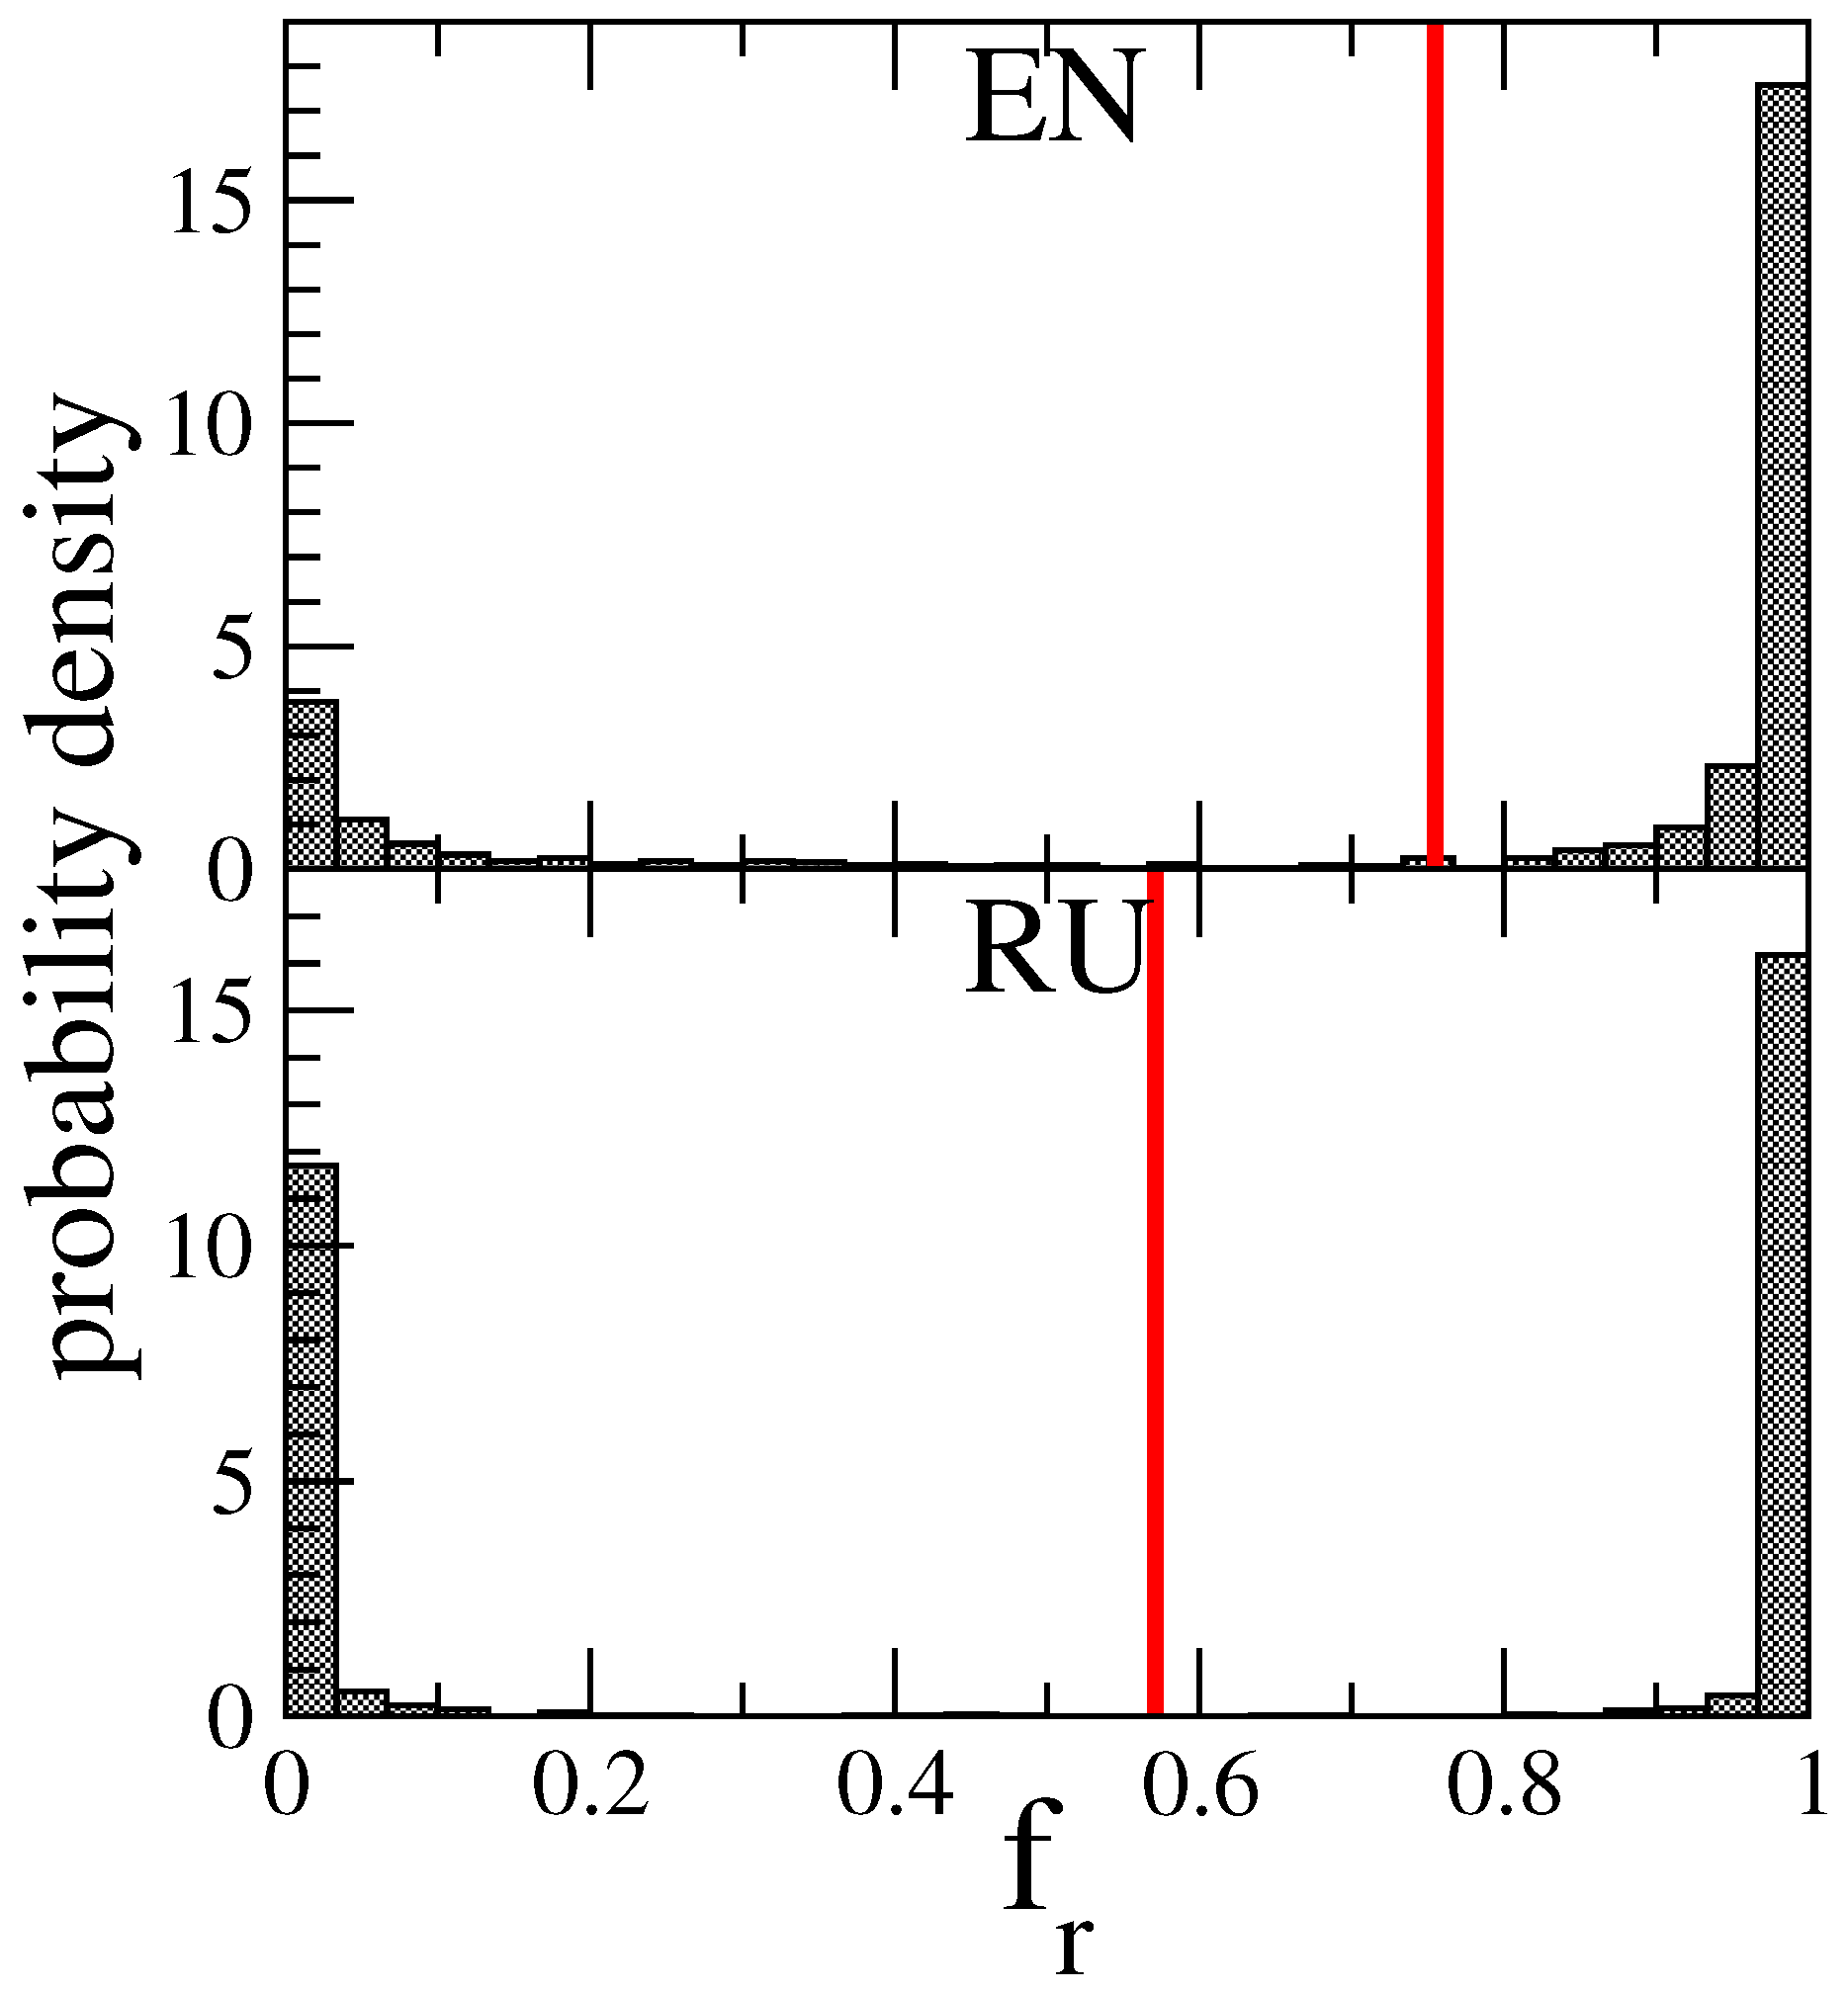
Figure 11.
Same probability histogram as in Figure 5 but but for another pair of fixed nodes (articles) being Christianity (red) and Islam (blue) for EN (top) and RU (bottom); red lines mark values of average global polarization opinion (EN), (RU)
Figure 11.
Same probability histogram as in Figure 5 but but for another pair of fixed nodes (articles) being Christianity (red) and Islam (blue) for EN (top) and RU (bottom); red lines mark values of average global polarization opinion (EN), (RU)
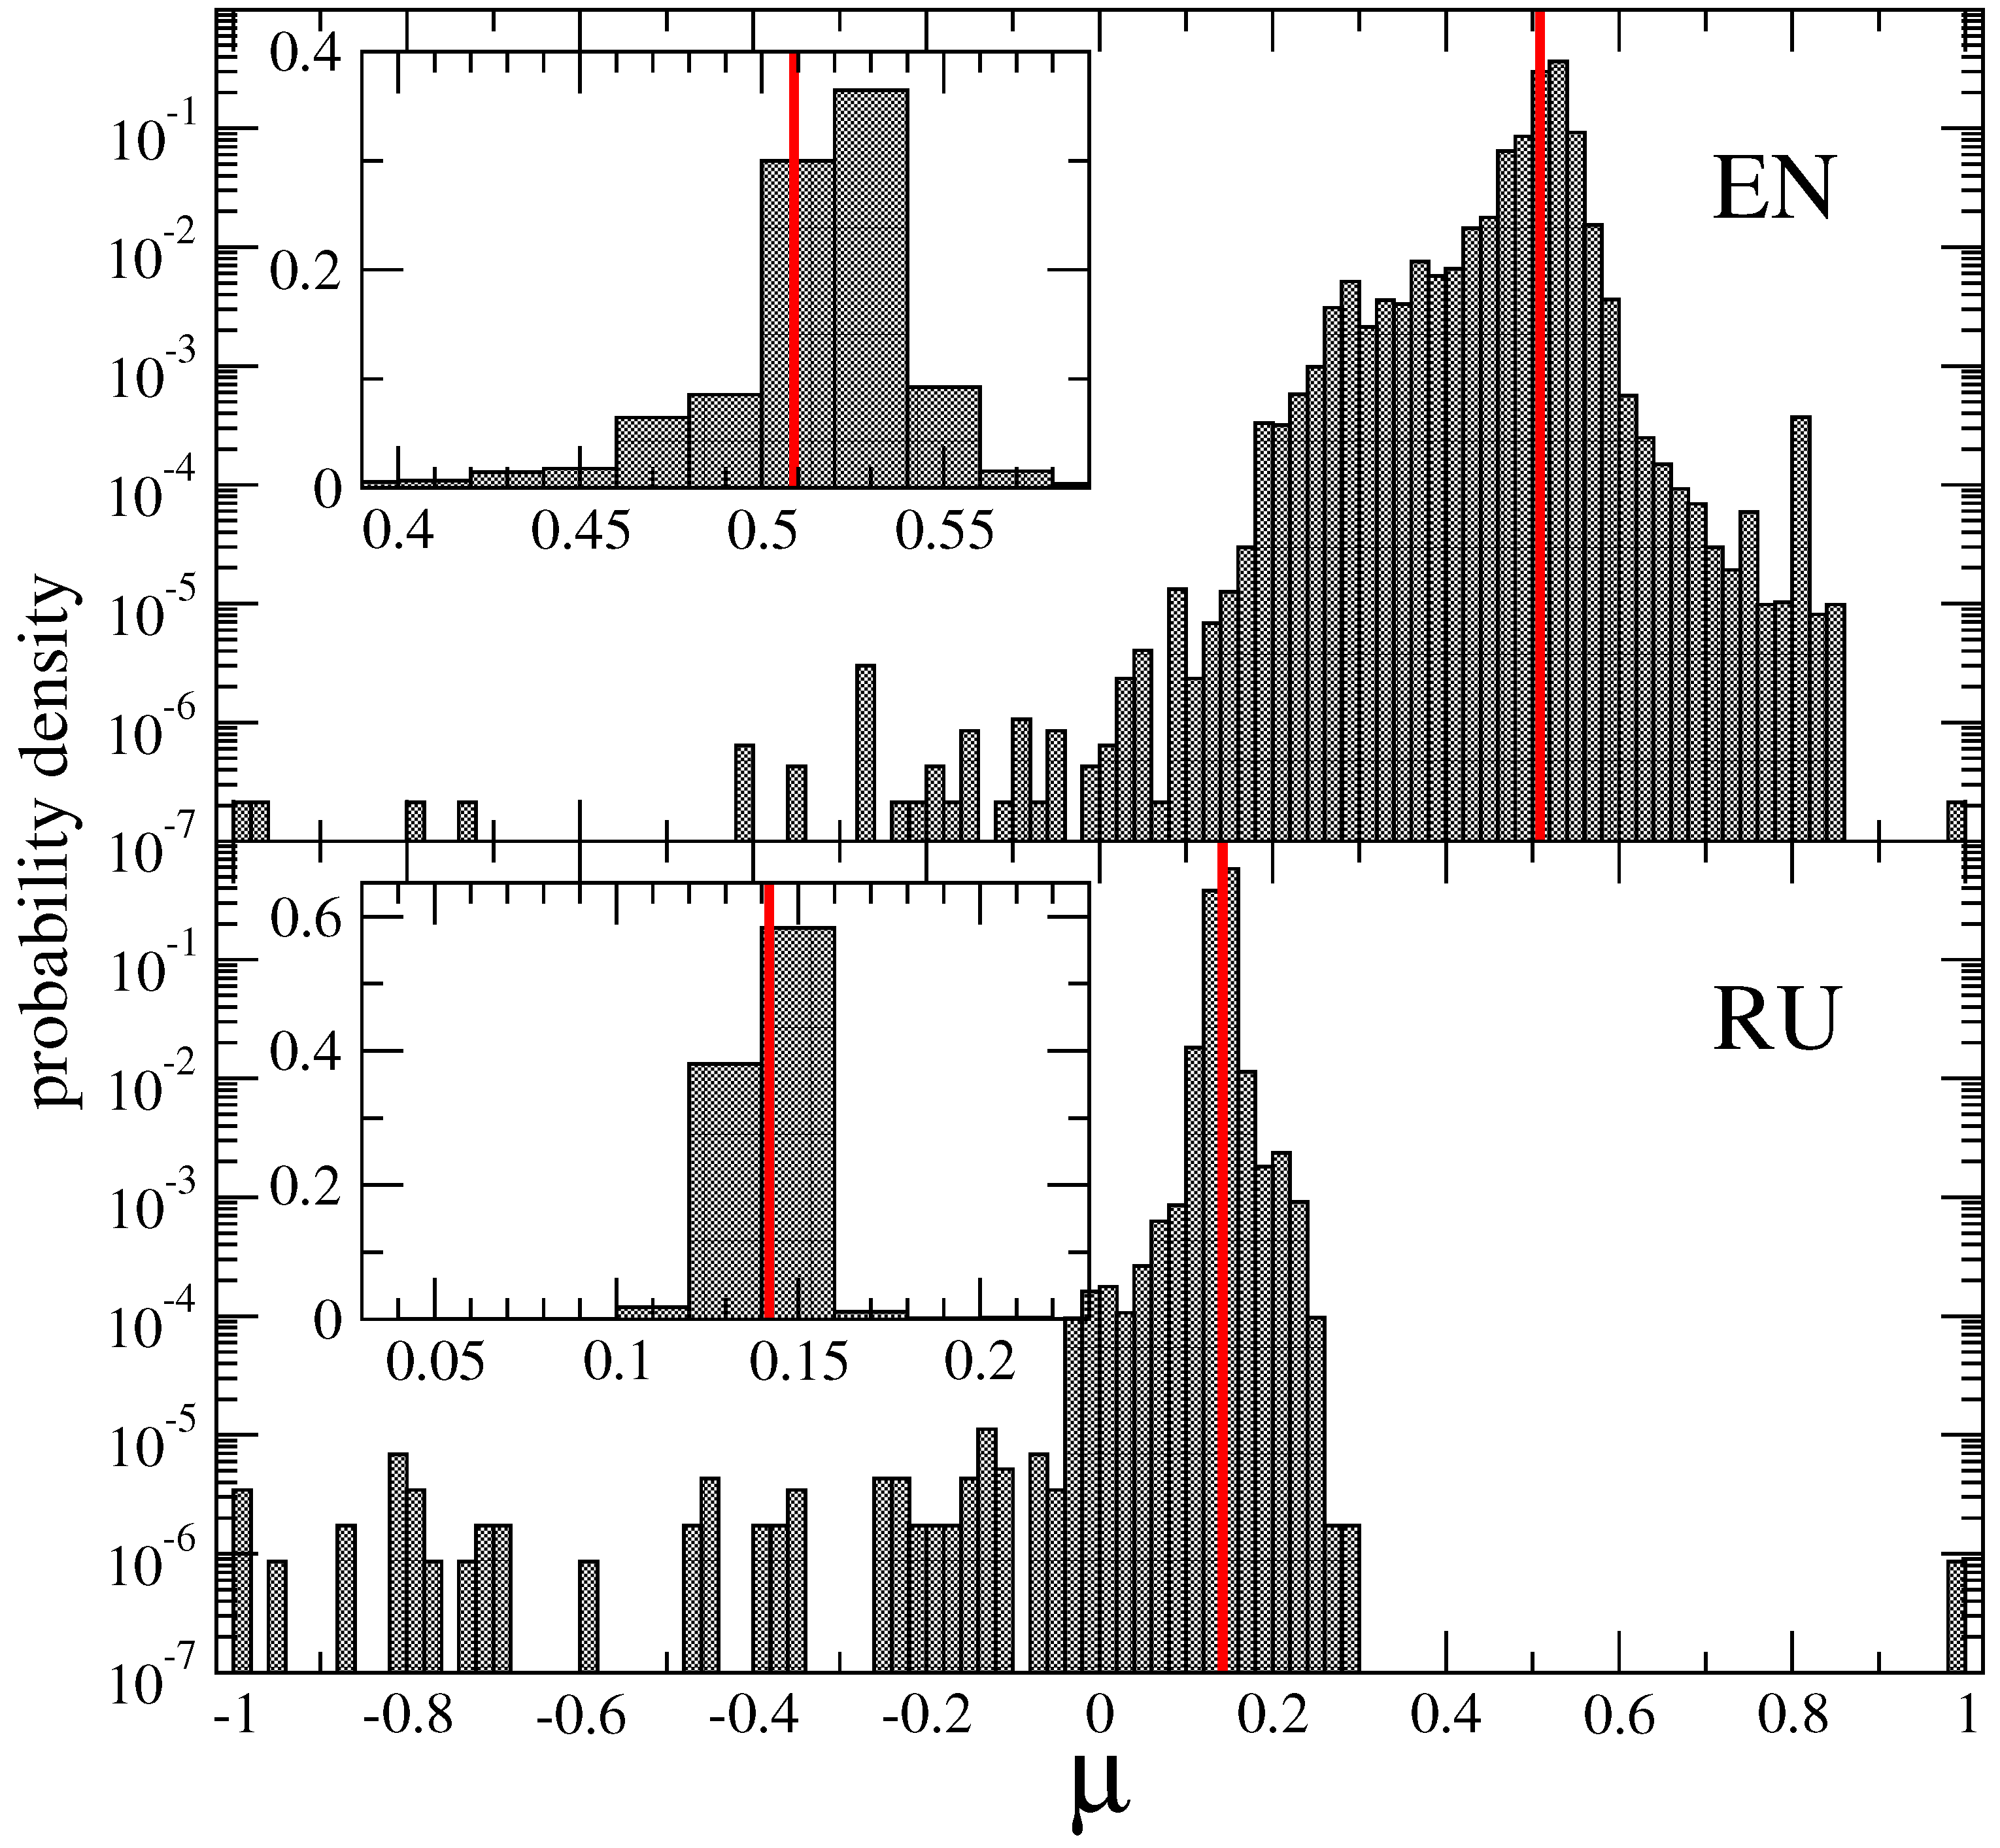
Figure 12.
Geographical distribution of opinion polarization to Christianity () or (Islam) () expressed by for English Wikipedia. Color legend shows the scale for .
Figure 12.
Geographical distribution of opinion polarization to Christianity () or (Islam) () expressed by for English Wikipedia. Color legend shows the scale for .
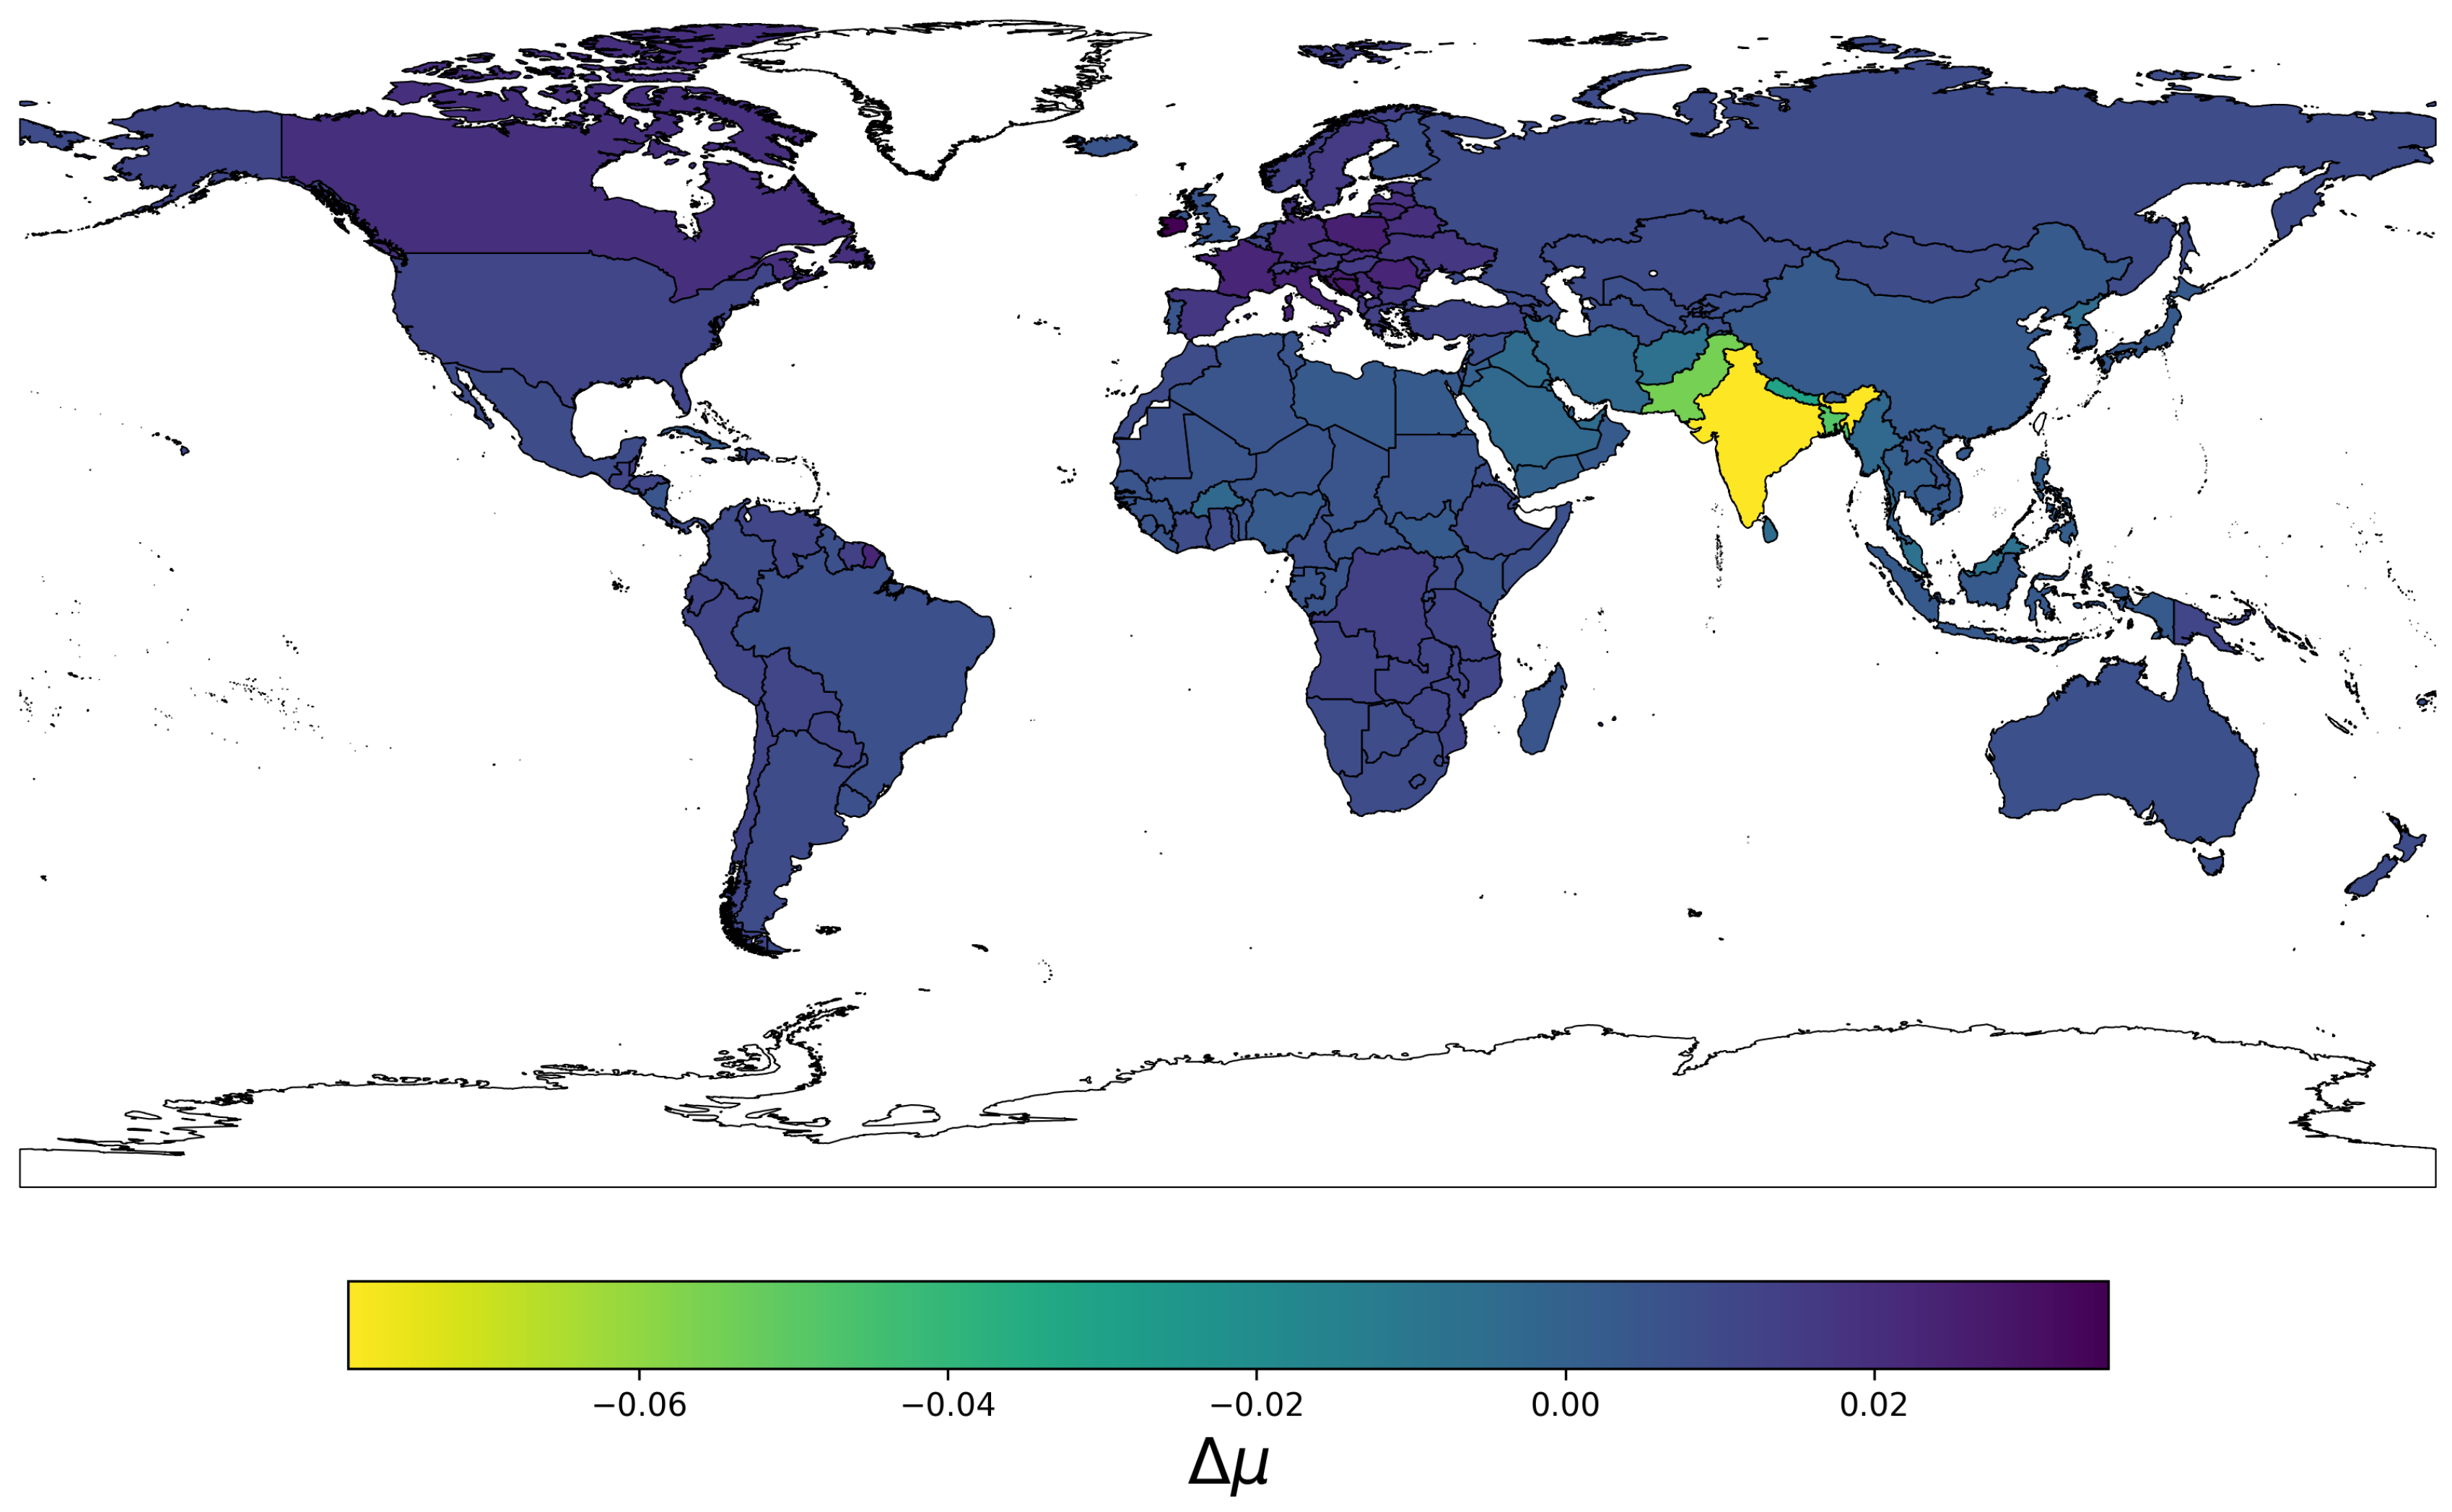
Figure 13.
Probability density of the average opinion polarization value for the English edition for OP2 (top panel) and for the Russian edition for OP2 (bottom panel). The five slots of the model are represented by curves of different colors, with 1000 realisations per slot for EN and 2000 for RU. The slot 1 discussed in previous Sections has black color. The bin width in is , and values of slots are represented by dashed vertical lines corresponding to the same color as the distribution.
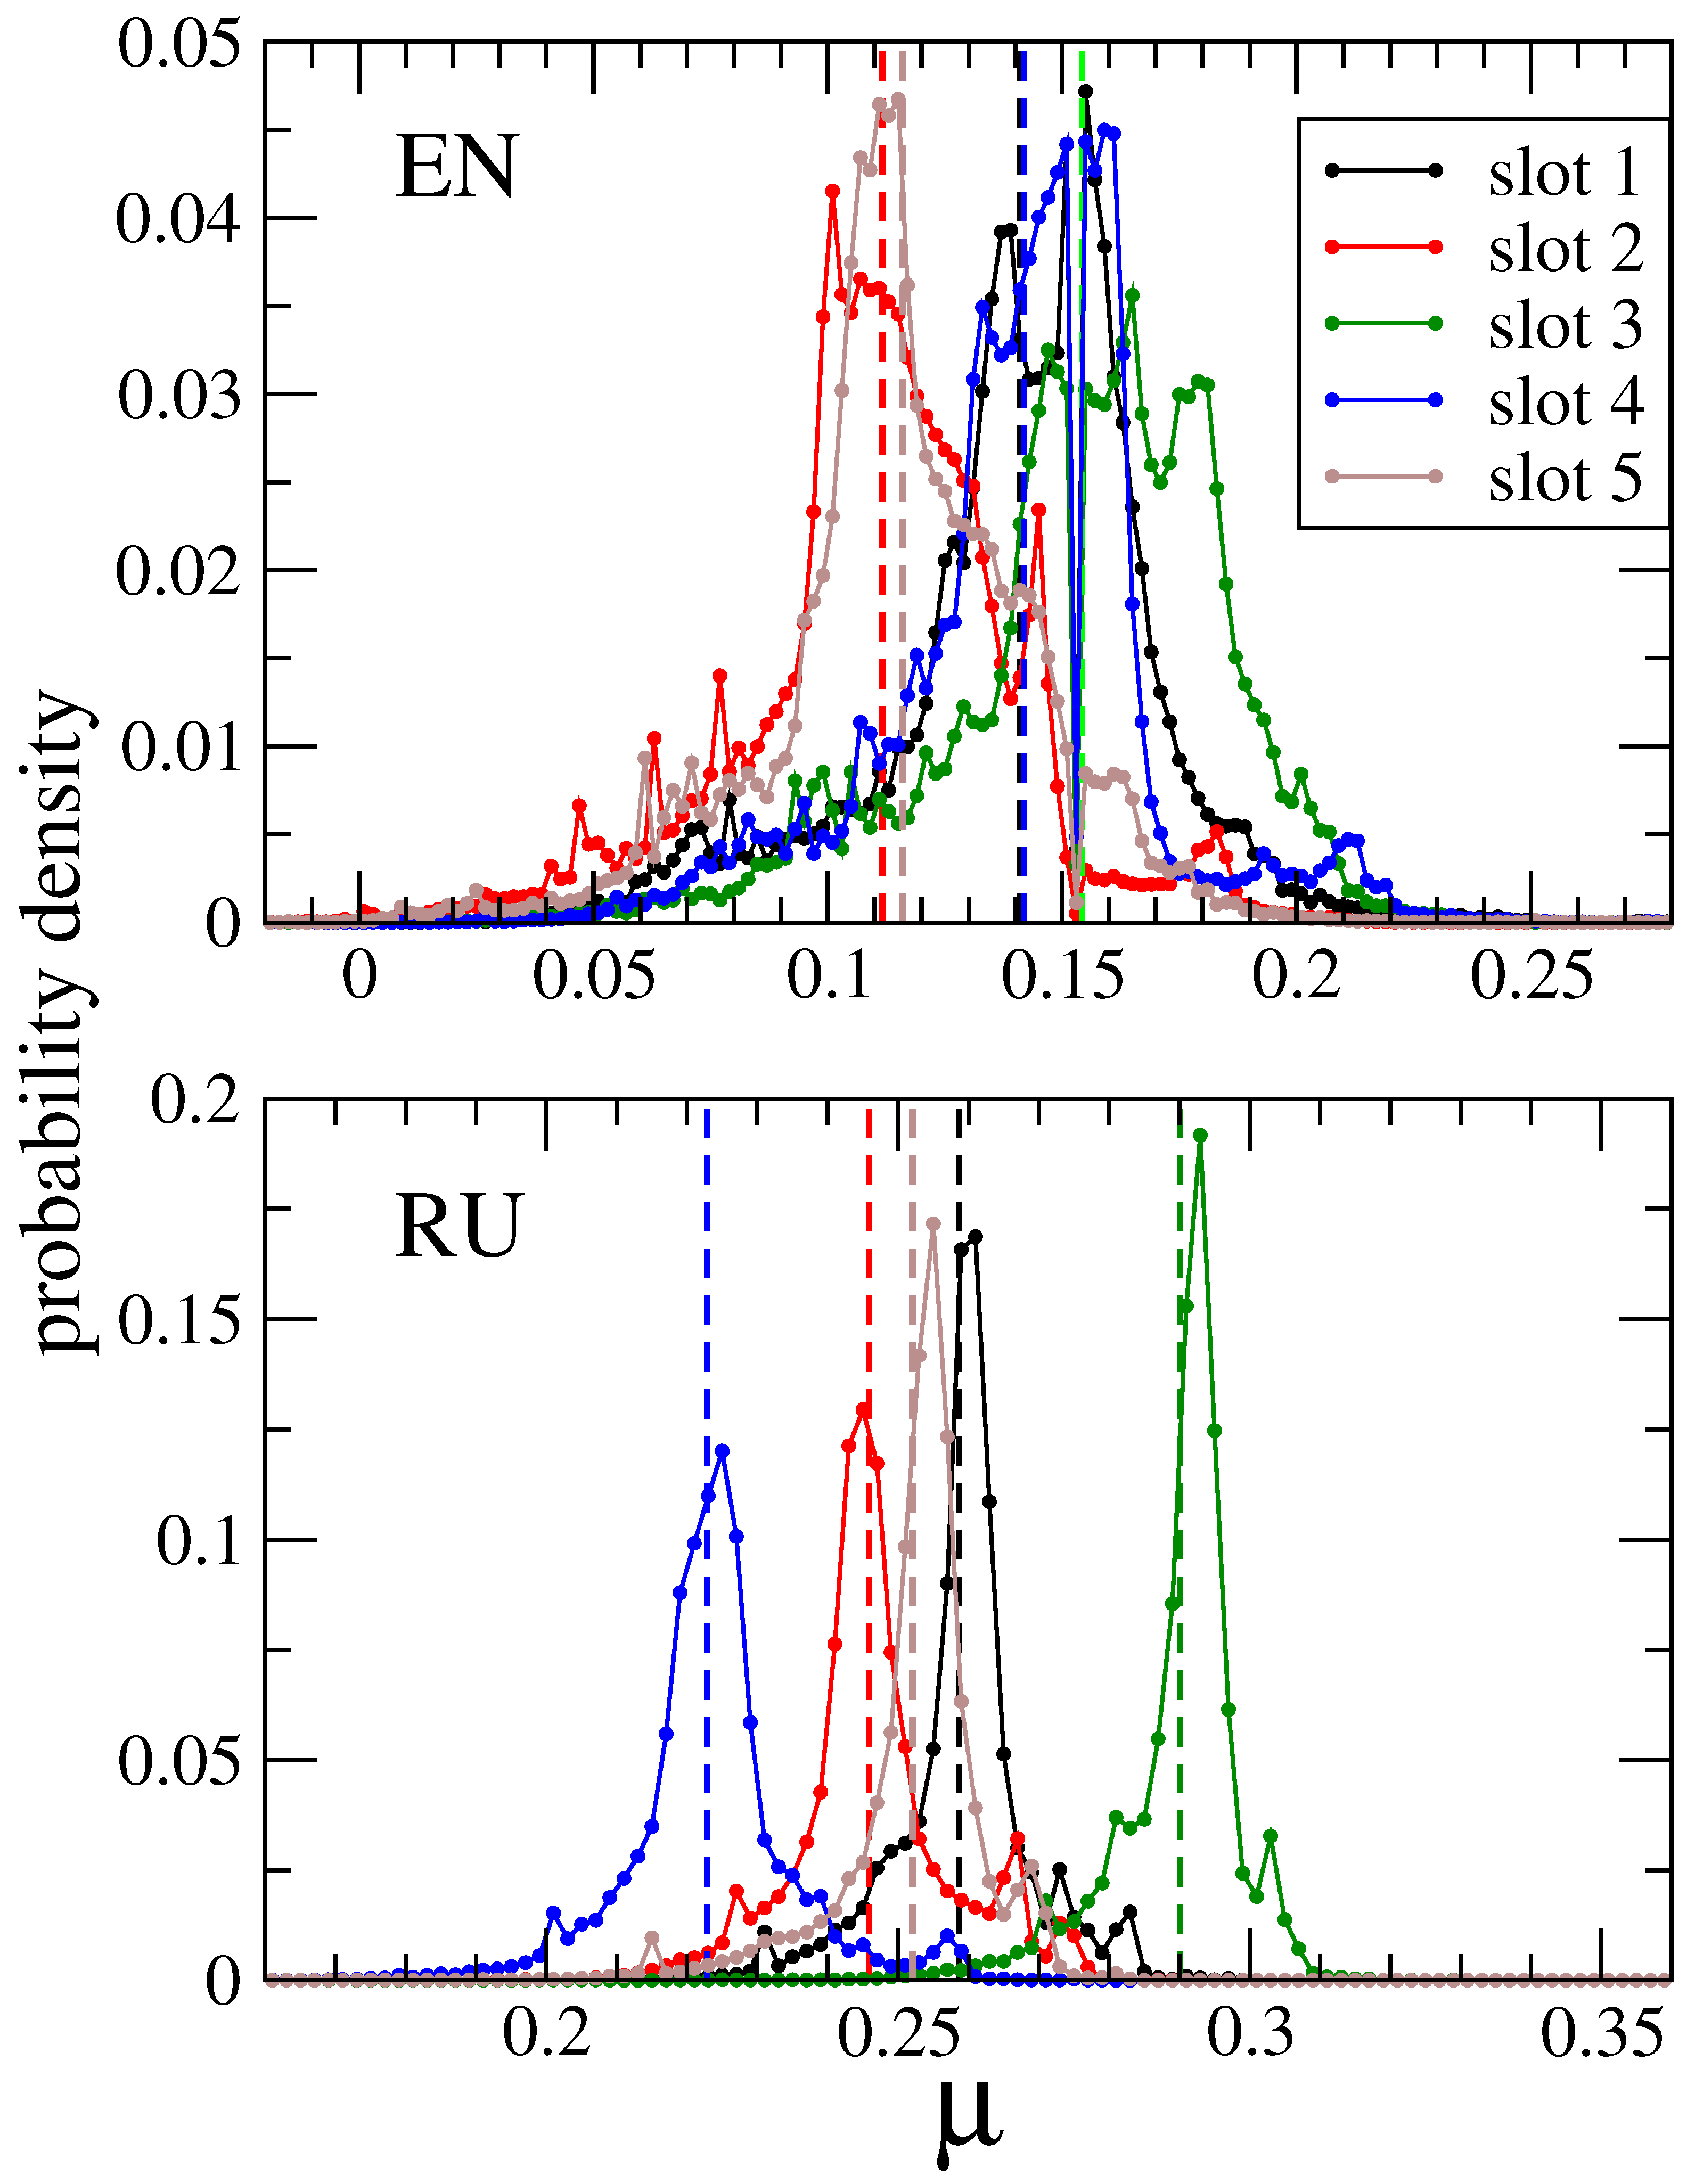
Figure 14.
Same as in Figure 9 for the slot 5 of EN edition marked by light brown color in Figure 13.
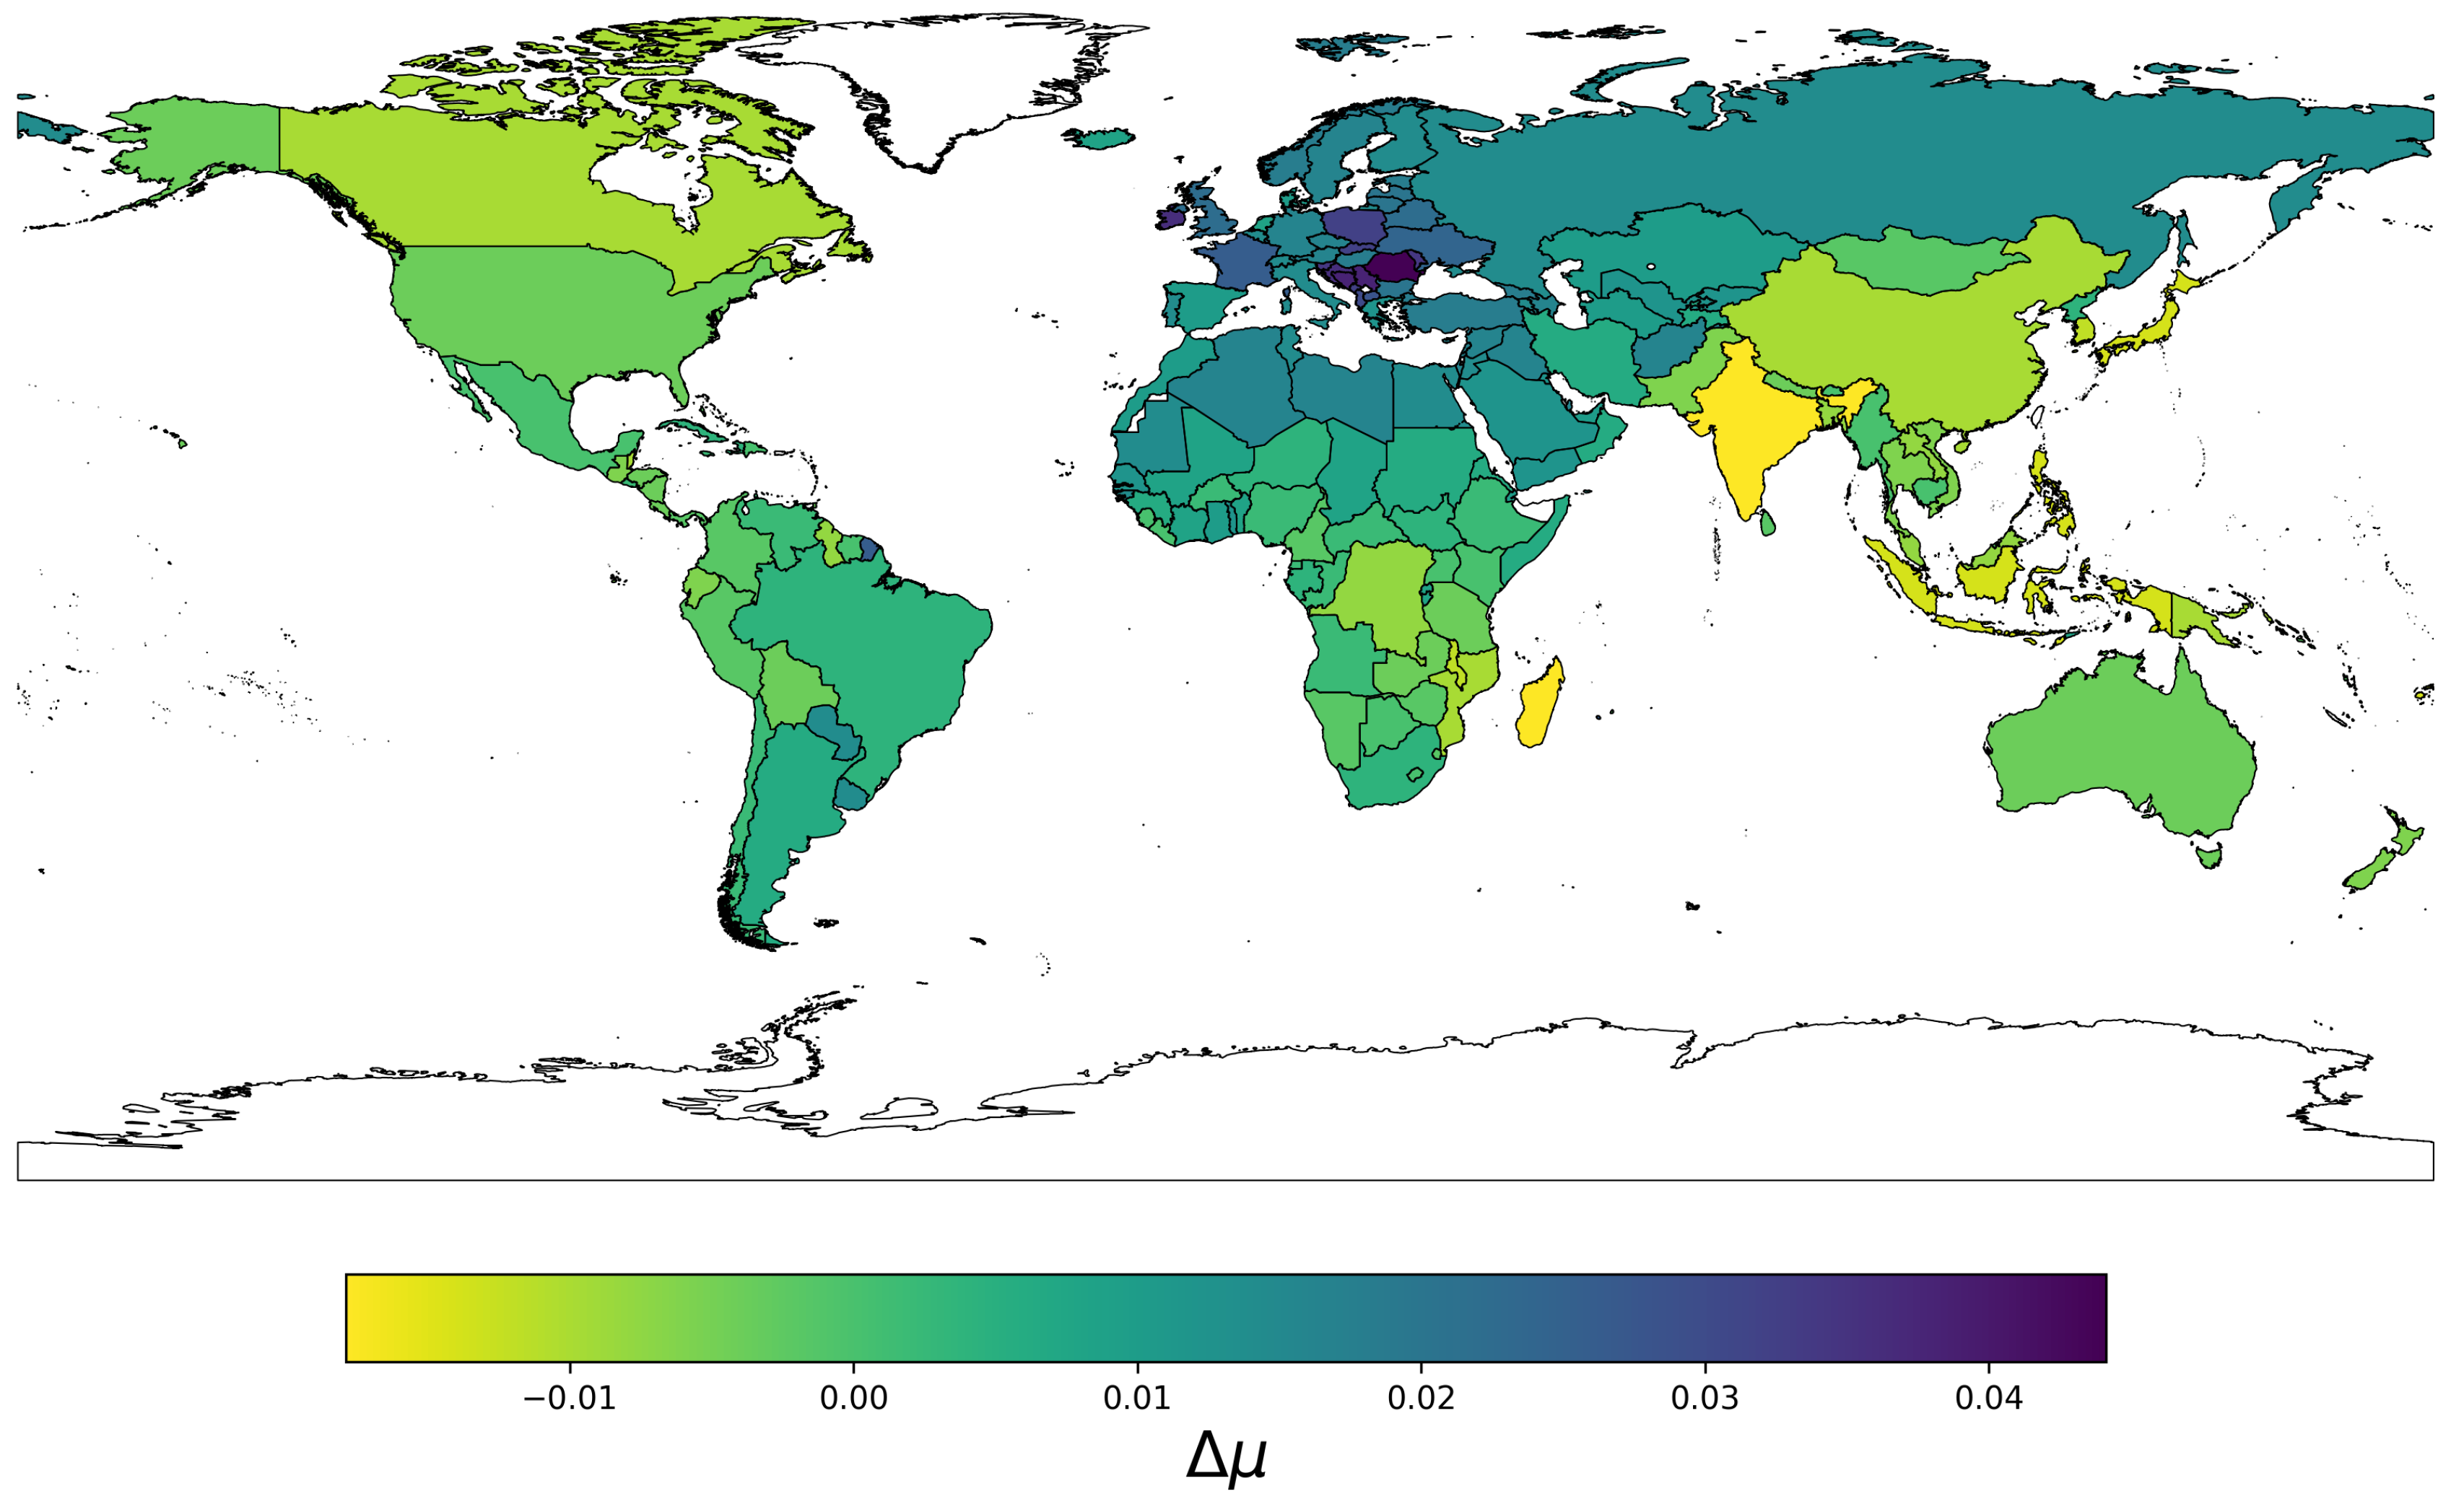
Figure 15.
Probability density of the average opinion polarization value for the English edition for OP2 (top panel) and for the Russian edition for OP2 (bottom panel). The two slots of the model are represented by black and red curves, with realisations per slot for EN and RU. The bin width in is , and values of slots are represented by dashed vertical lines corresponding to the same color as the distribution. The data of slot 1 are marked by black color, they are used in Table 1, Table 2 and Table 3.
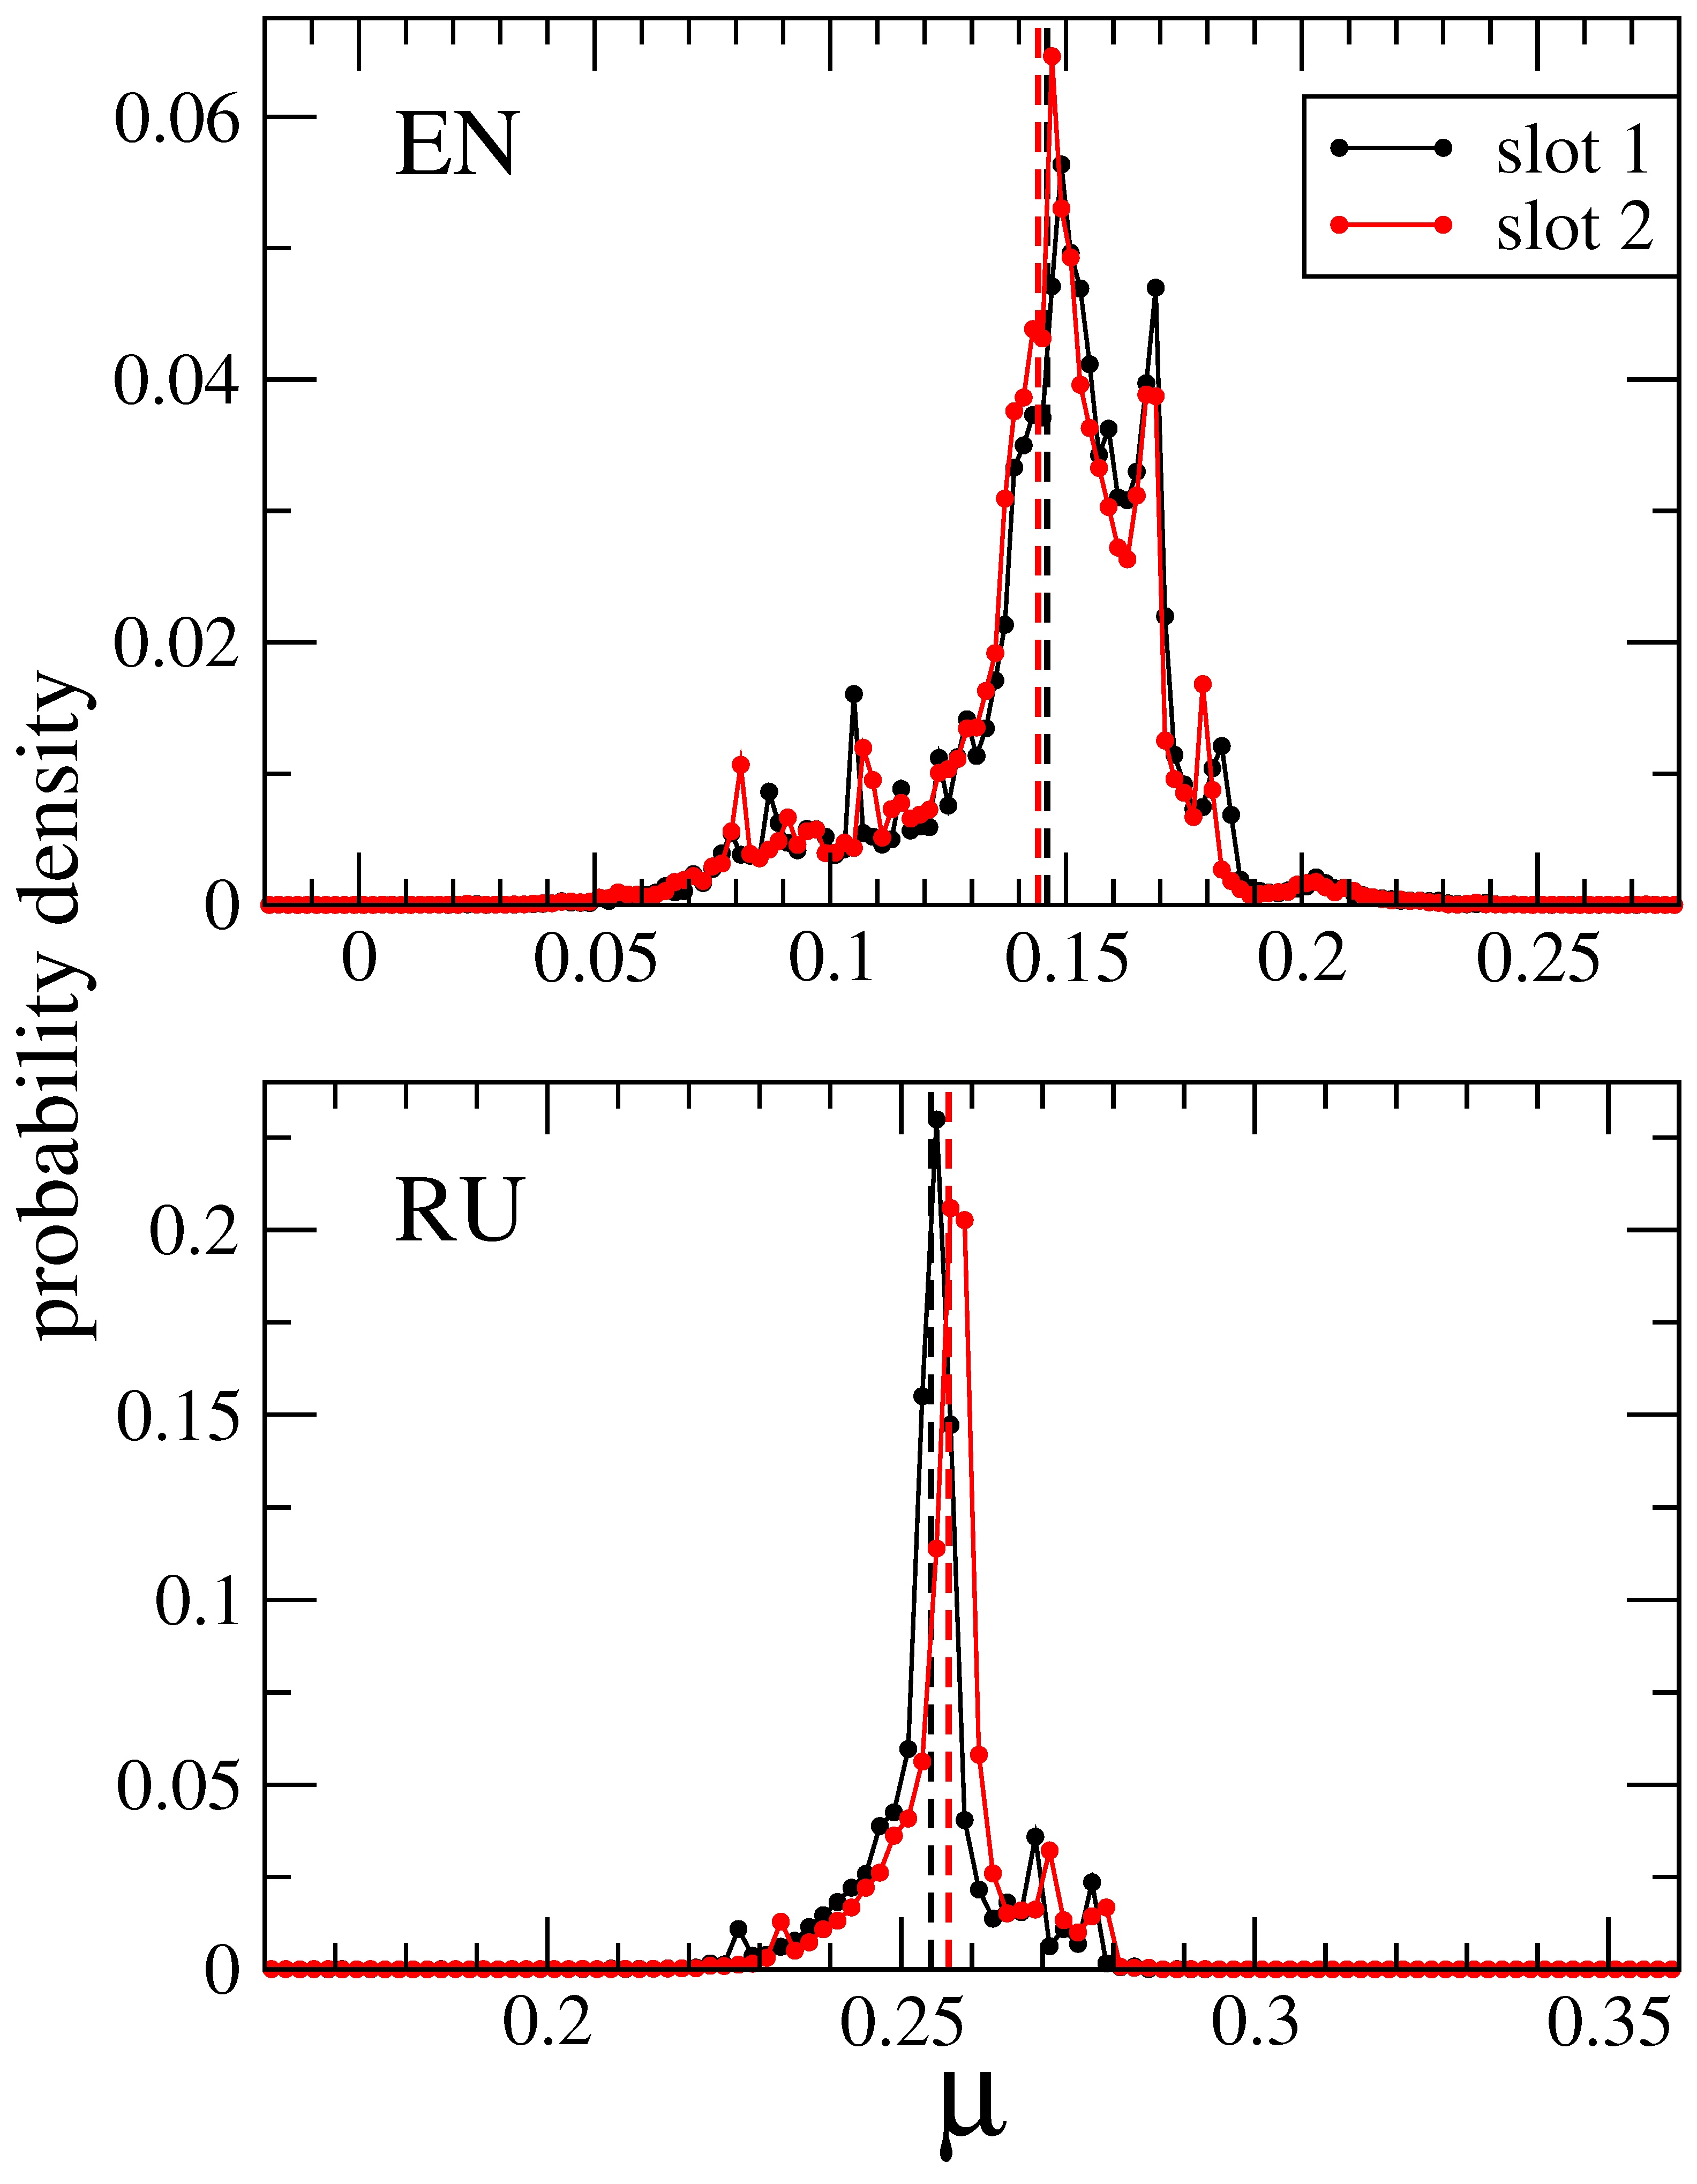
Figure 16.
Density distribution of number of articles in the plane of values for the INOF model across two slots with realisations each. Each article has a value, given in axes, for slot 1 and slot 2, and the number of articles in this plane is represented by a color scale in the density distribution using a logarithmic scale. White indicates regions without articles.
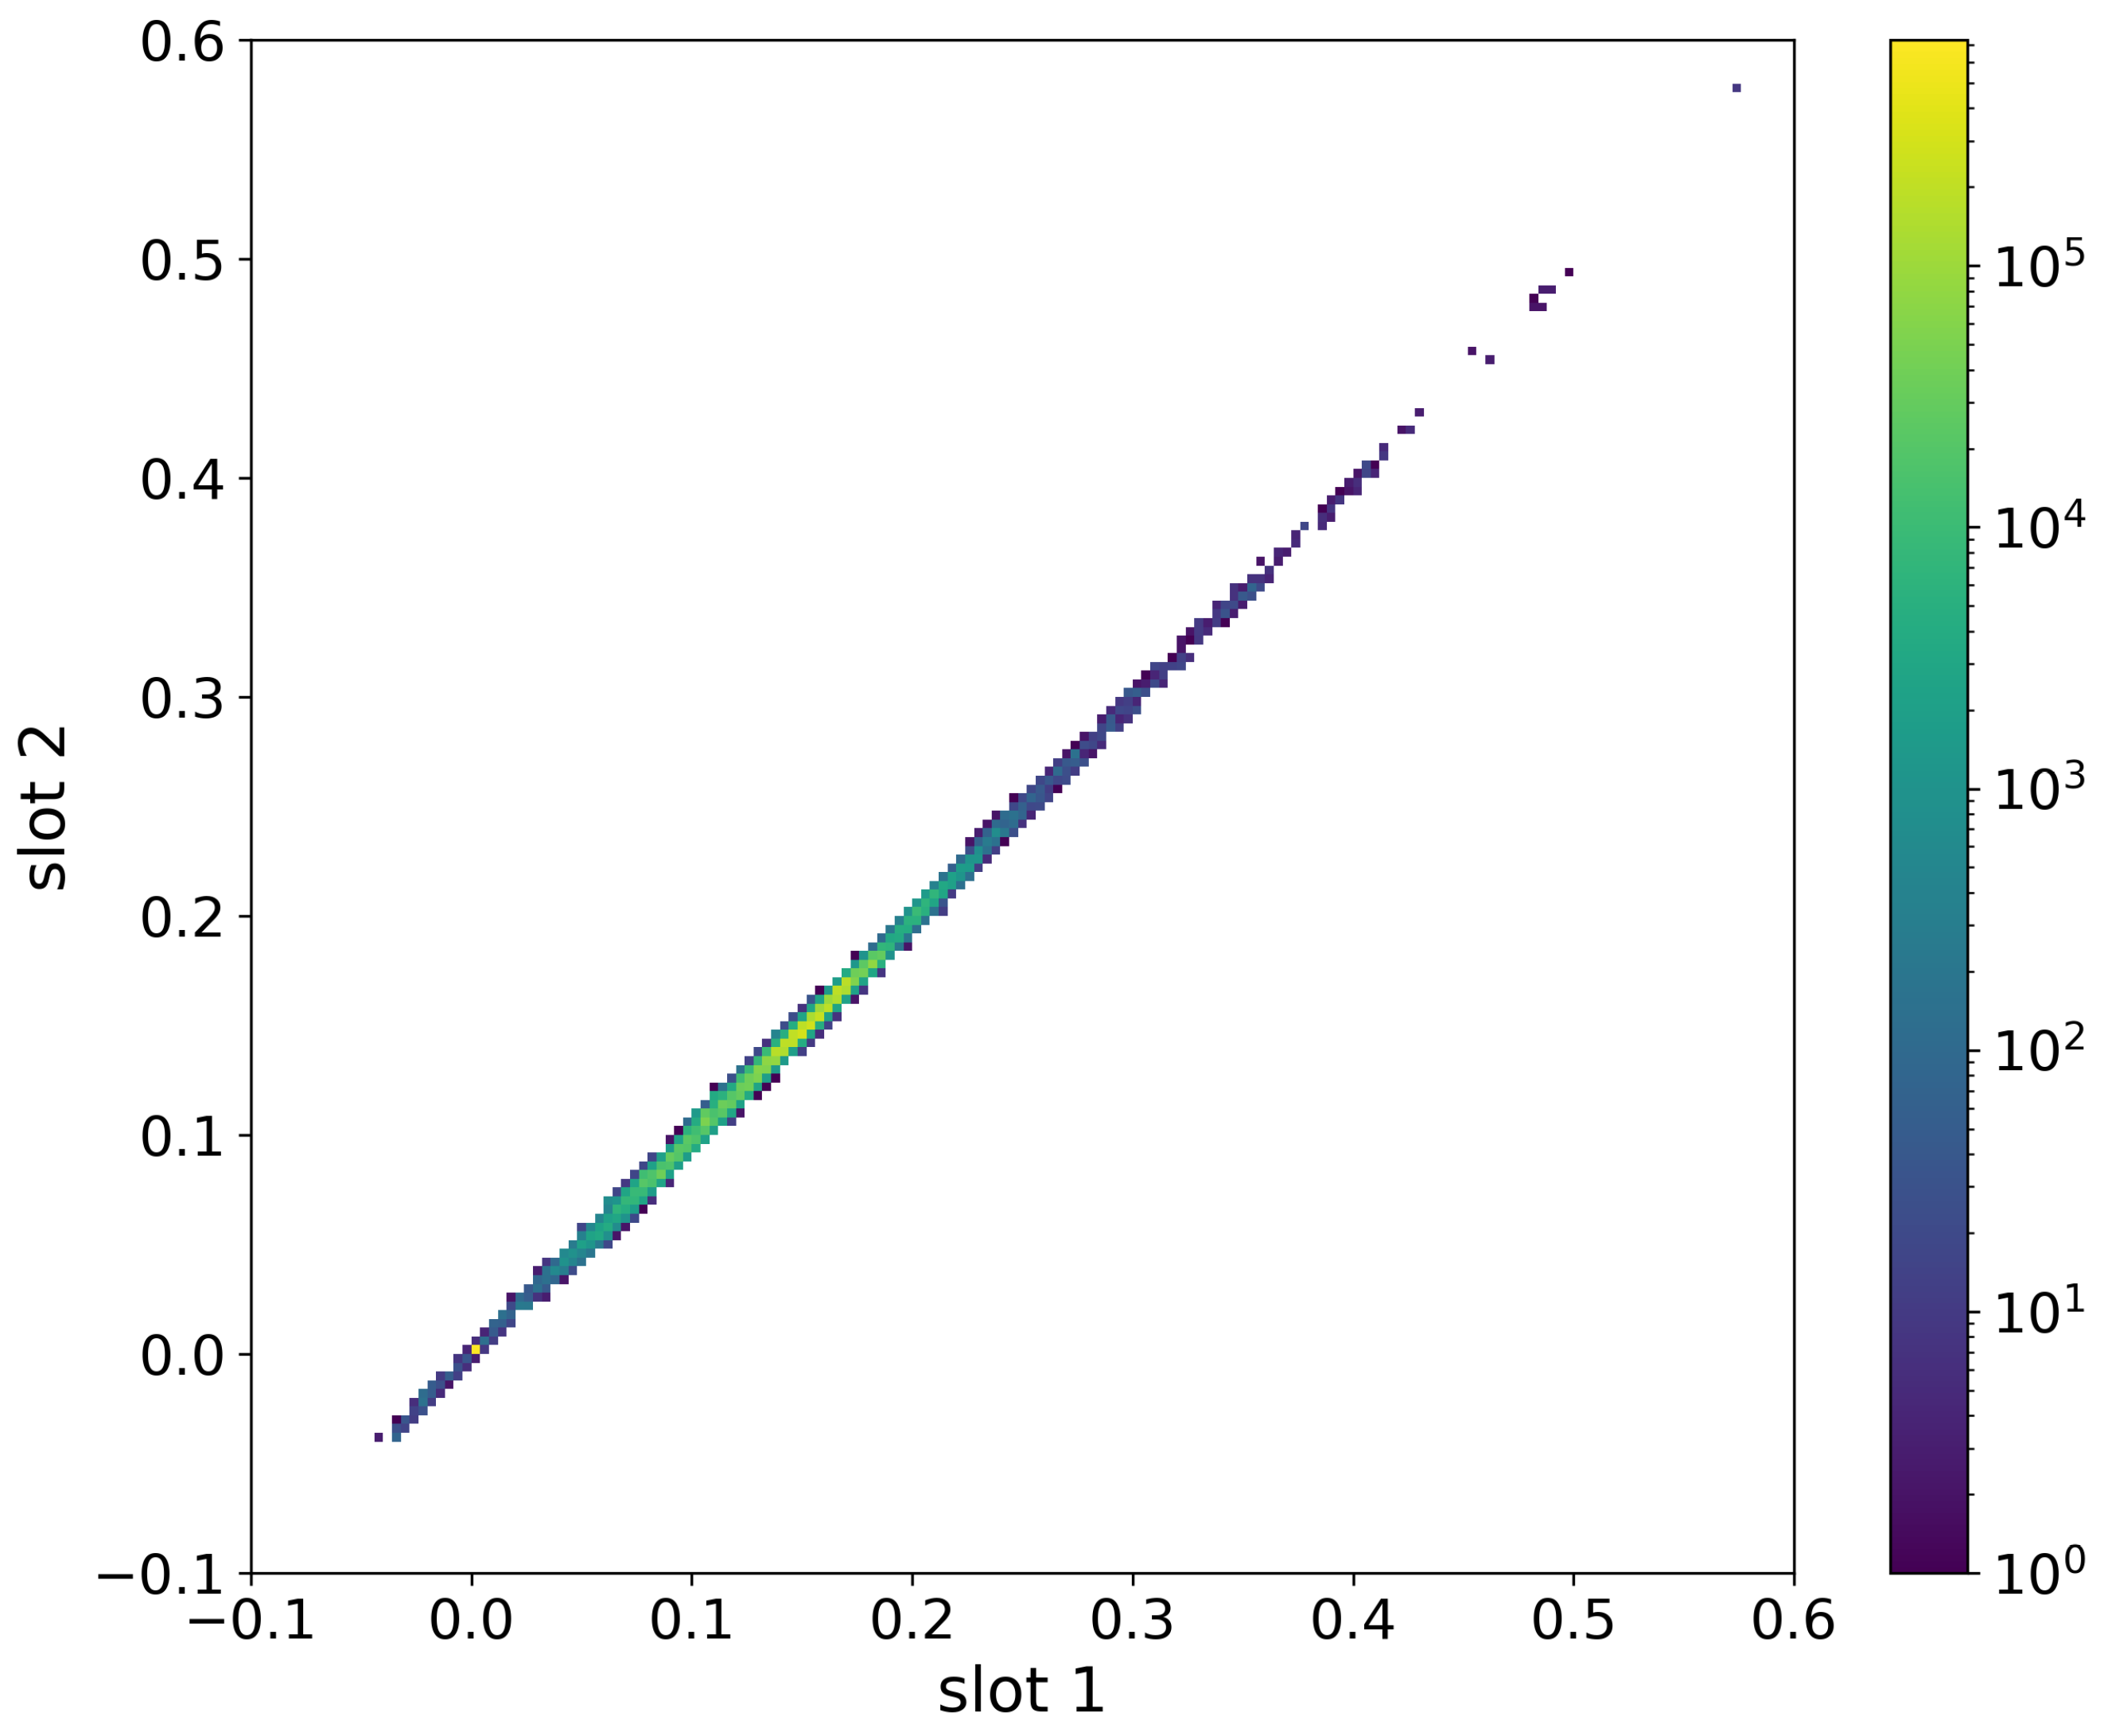
Figure 17.
Top panel shows the average variation of for different slots as a function of the number of realisations per slot (). The power law fit for EN, ES, RU, FR and IT languages have exponents being , , , and respectively. Bottom panel represents the average dispersion of individual article polarization vs. The power law fit for EN, ES and RU languages have exponents being , and respectively. Red line in both panels illustrates the power law with exponent with . The number of slots used to compute varies from 40 for to 2 for .
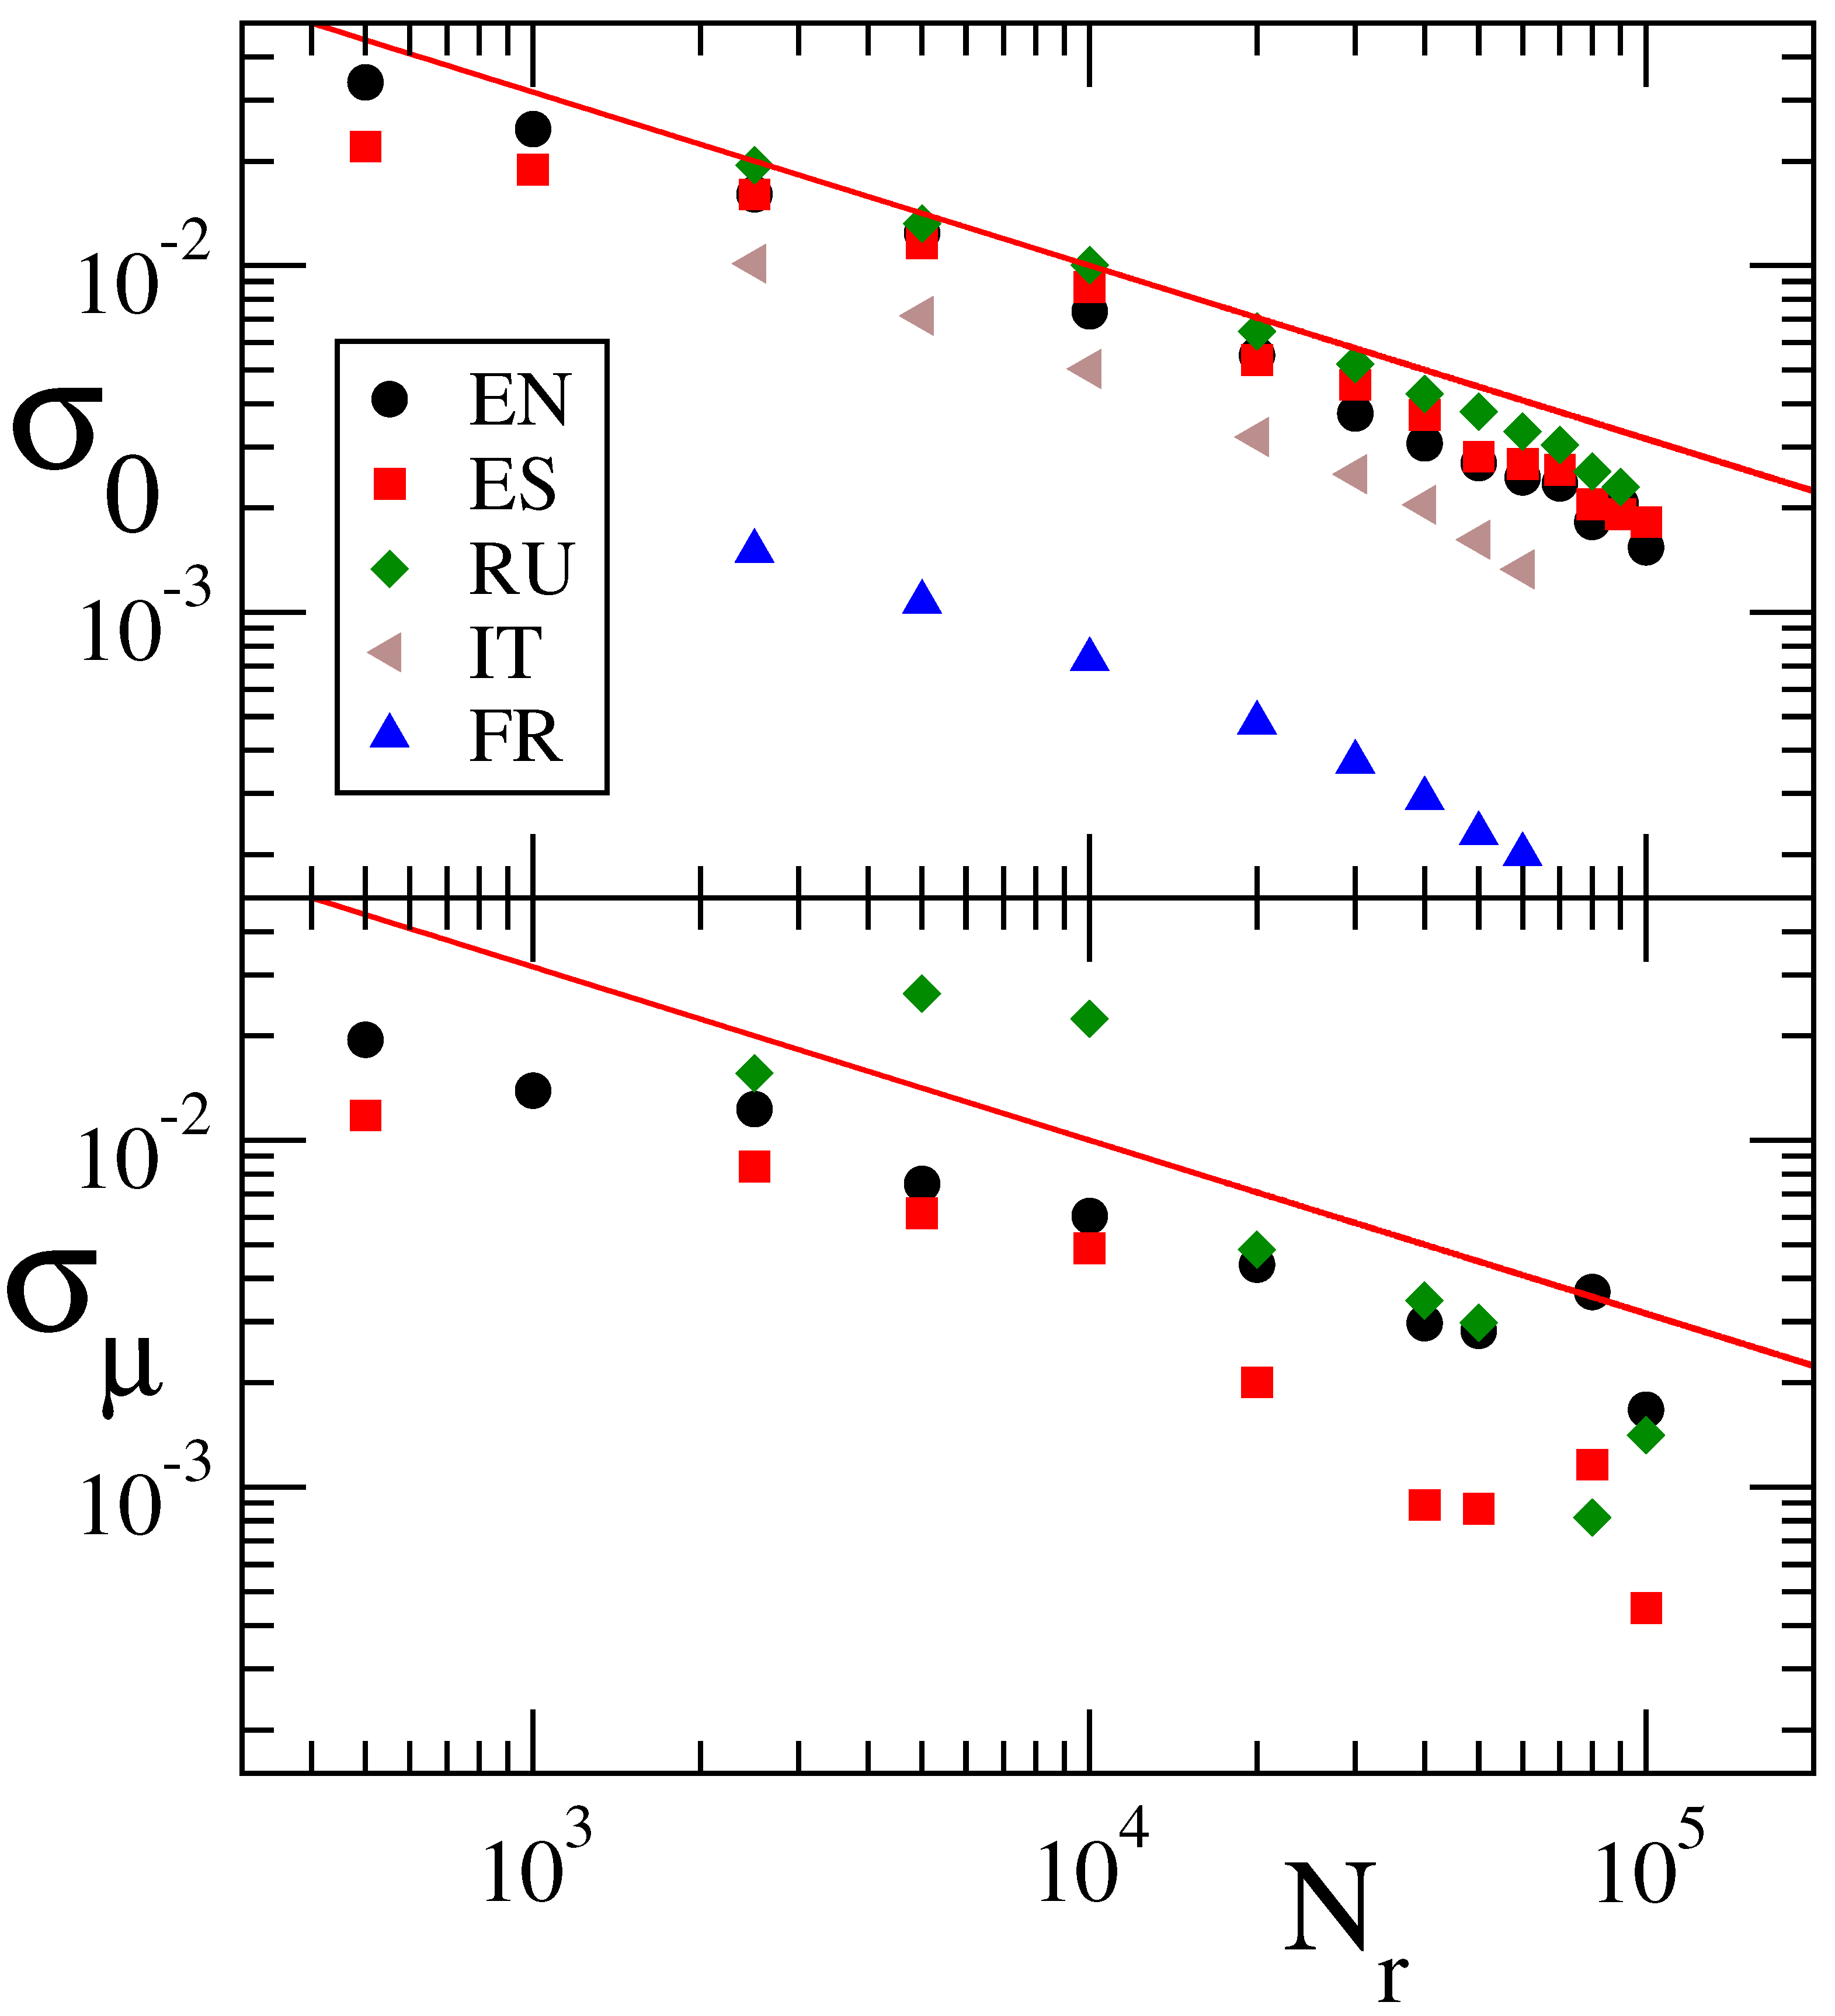
Figure 18.
Geographical distribution of opinion polarization preference to socialism, communism () or (capitalism, imperialism) () (OP2) expressed by for English Wikipedia and long run of realisations (slot 1 in Figure 15). Color bar shows the scale for .
Figure 18.
Geographical distribution of opinion polarization preference to socialism, communism () or (capitalism, imperialism) () (OP2) expressed by for English Wikipedia and long run of realisations (slot 1 in Figure 15). Color bar shows the scale for .
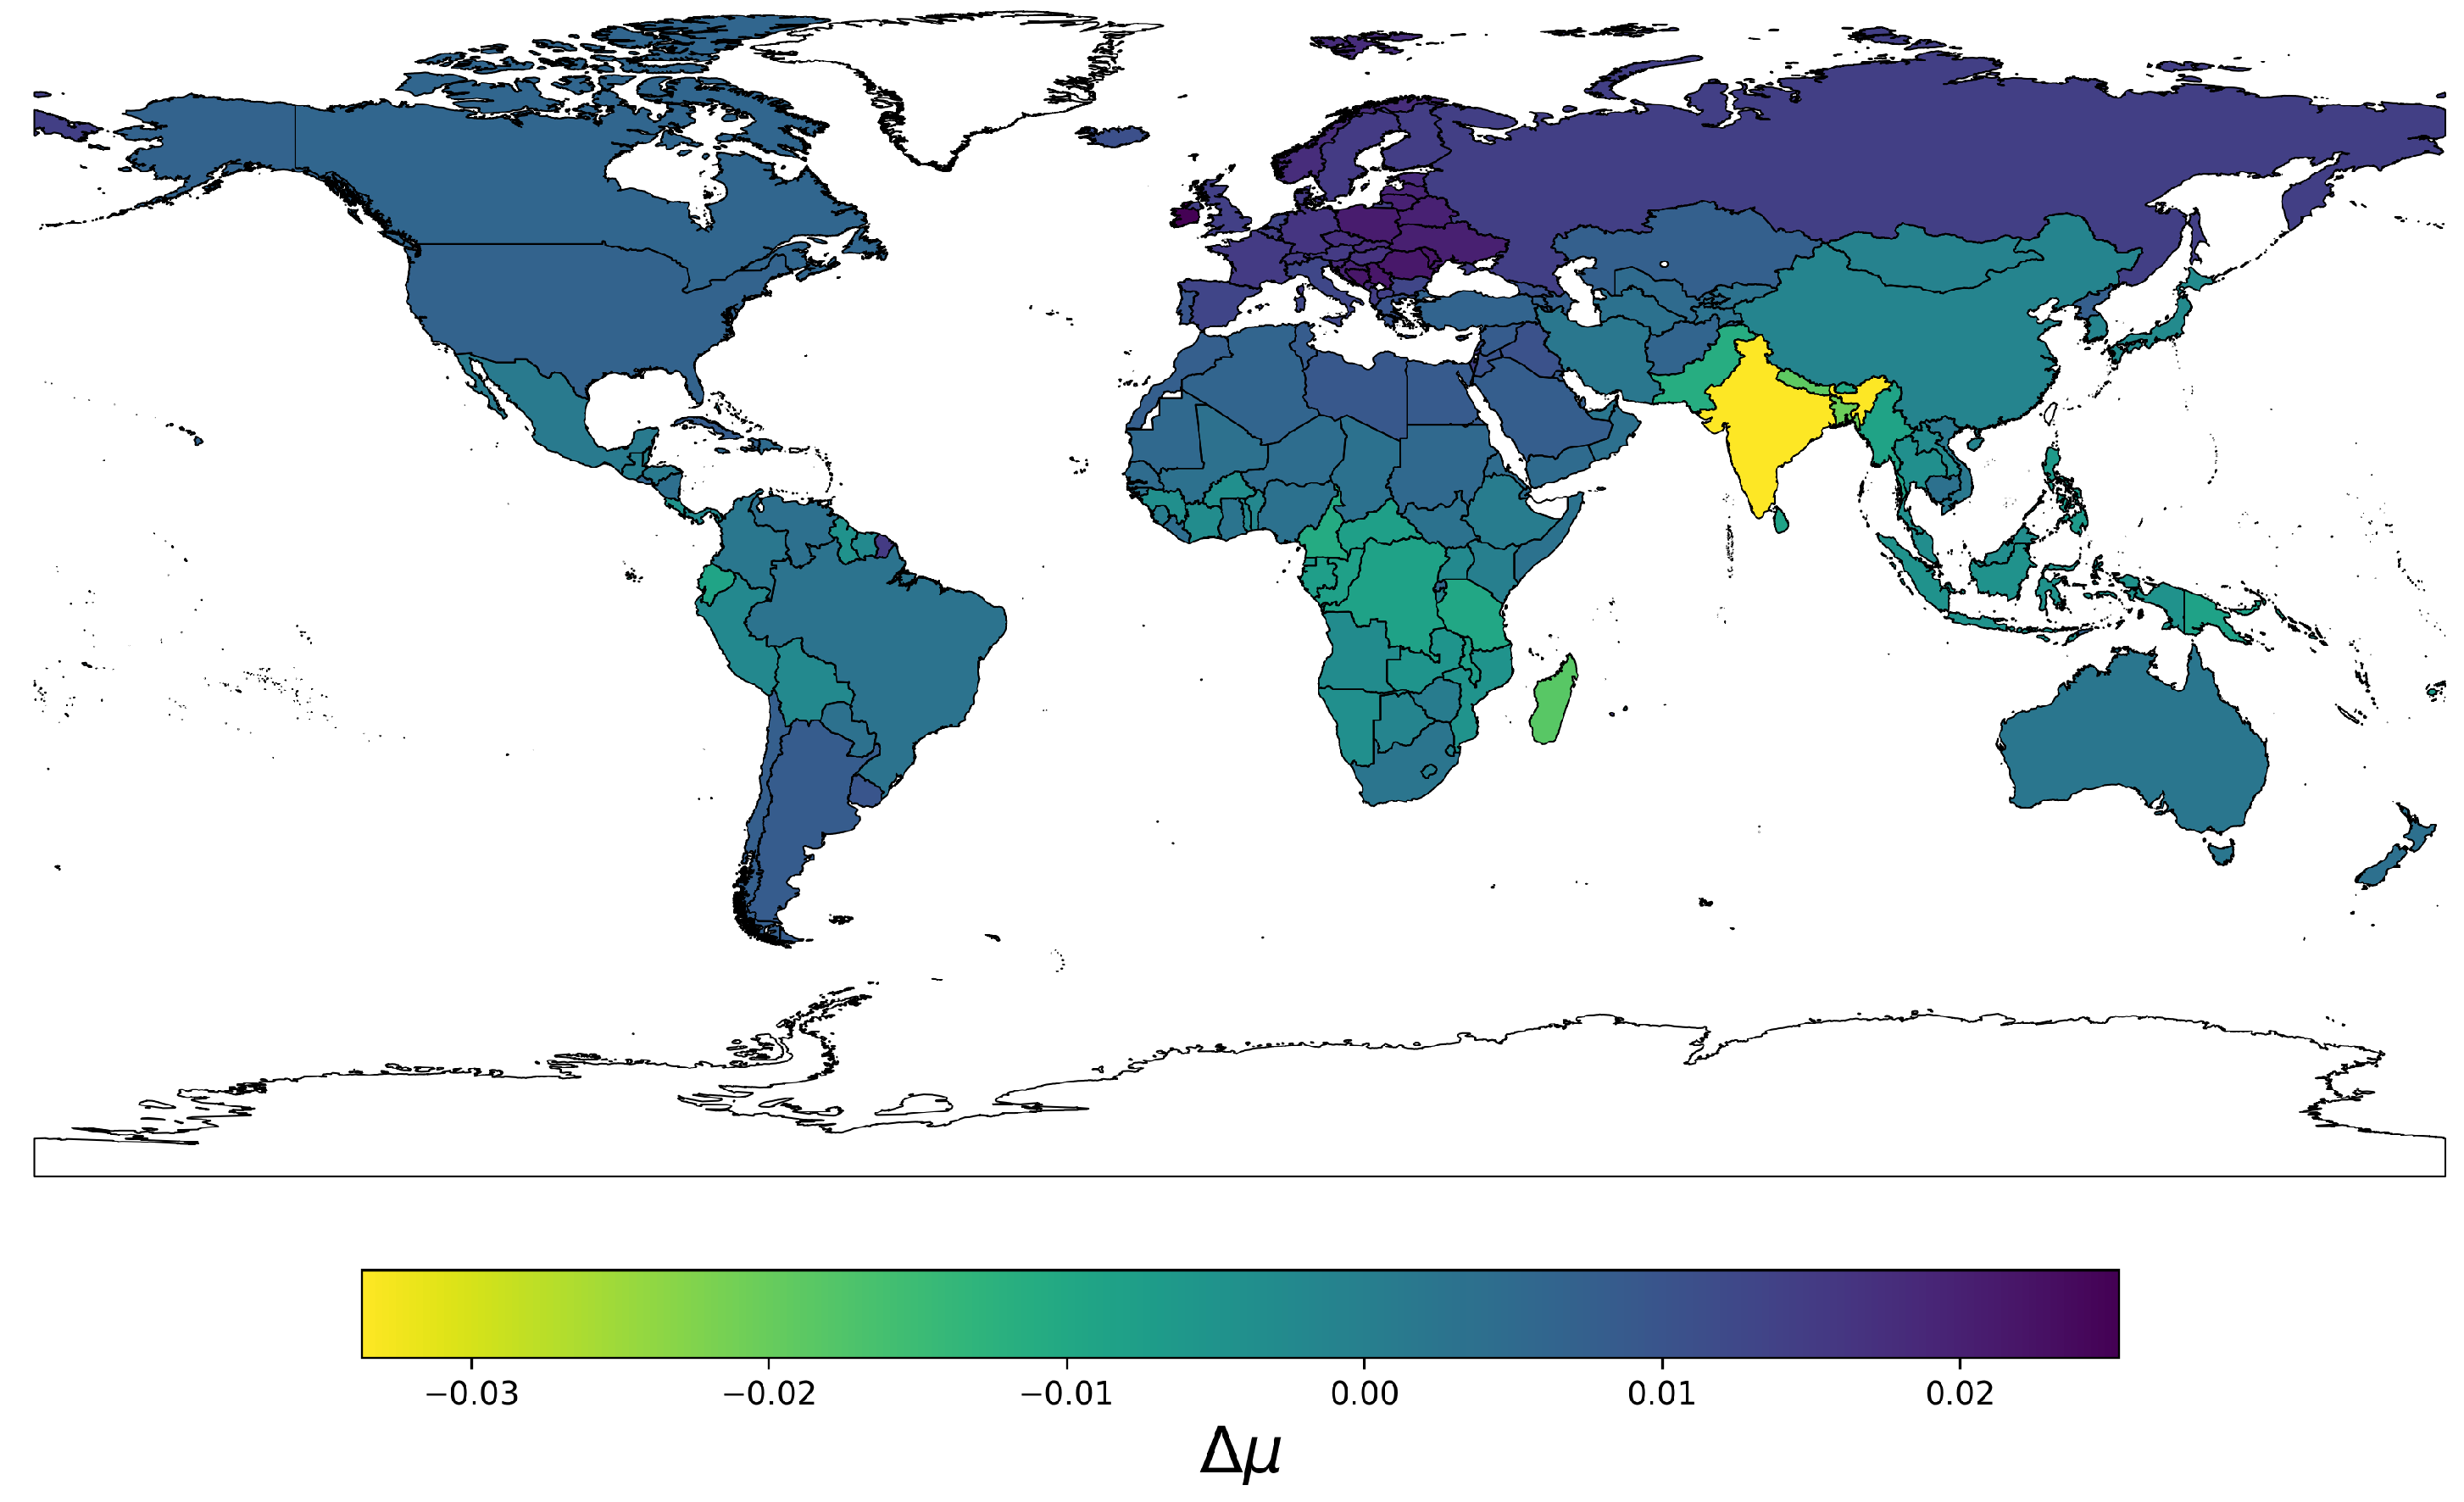

Table 1.
Top 20 PageRank index K articles of English Wikipedia and for fixed one red node (socialism) and one fixed blue node (capitalism) (OP1); and for fixed two red nodes (socialism,communism) and two blue nodes (capitalism,imperialism) (OP2) with a slot of realisations, and for OP2 long run of realisations . Here where is polarization of given article and is the average global polarization of EN Wikipedia 2017 for OP1 and OP2 respectively. The values of are discussed in Section 6.
| K | Title | (OP1) | (OP2) | (OP2) |
|---|---|---|---|---|
| 1 | United States | -0.0086 | -0.009 | 0.002 |
| 2 | Association football | 0.013 | 0.039 | 0.034 |
| 3 | World War II | 0.021 | 0.015 | 0.013 |
| 4 | France | 0.023 | 0.017 | 0.015 |
| 5 | Germany | 0.019 | 0.015 | 0.016 |
| 6 | United Kingdom | 0.025 | 0.009 | 0.014 |
| 7 | Iran | 0.027 | -0.003 | 0.002 |
| 8 | India | -0.0066 | -0.043 | -0.034 |
| 9 | Canada | 0.0014 | 0.003 | 0.006 |
| 10 | Australia | 0.0094 | -0.003 | 0.002 |
| 11 | China | 0.021 | -0.011 | -0.001 |
| 12 | Italy | 0.025 | 0.009 | 0.013 |
| 13 | Japan | 0.017 | -0.009 | -0.003 |
| 14 | Moth | -0.0046 | -0.043 | -0.039 |
| 15 | England | 0.023 | 0.015 | 0.016 |
| 16 | World War I | 0.023 | 0.015 | 0.013 |
| 17 | Russia | 0.025 | 0.005 | 0.014 |
| 18 | New York City | 0.0014 | 0.001 | 0.009 |
| 19 | London | 0.017 | 0.011 | 0.014 |
| 20 | Latin | 0.025 | -0.001 | 0.007 |
Table 2.
Top 20 Countries () given by PageRank index (K) in English Wikipedia and for the case of fixed two red nodes (socialism,communism) and two blue nodes (capitalism,imperialism) (OP2) for realisations and realisations: and . The values of are discussed in Section 6.
Table 2.
Top 20 Countries () given by PageRank index (K) in English Wikipedia and for the case of fixed two red nodes (socialism,communism) and two blue nodes (capitalism,imperialism) (OP2) for realisations and realisations: and . The values of are discussed in Section 6.
| K | Country | (OP2) | (OP2) | |
|---|---|---|---|---|
| 1 | 1 | United States | -0.009 | 0.002 |
| 2 | 4 | France | 0.017 | 0.015 |
| 3 | 5 | Germany | 0.015 | 0.016 |
| 4 | 6 | United Kingdom | 0.009 | 0.014 |
| 5 | 7 | Iran | -0.003 | 0.002 |
| 6 | 8 | India | -0.043 | -0.034 |
| 7 | 9 | Canada | 0.003 | 0.006 |
| 8 | 10 | Australia | -0.003 | 0.002 |
| 9 | 11 | China | -0.011 | -0.001 |
| 10 | 12 | Italy | 0.009 | 0.013 |
| 11 | 13 | Japan | -0.009 | -0.003 |
| 12 | 17 | Russia | 0.005 | 0.014 |
| 13 | 23 | Brazil | -0.013 | 0.003 |
| 14 | 24 | Spain | 0.003 | 0.013 |
| 15 | 26 | Netherlands | 0.003 | 0.013 |
| 16 | 30 | Poland | 0.023 | 0.021 |
| 17 | 31 | Sweden | 0.007 | 0.015 |
| 18 | 35 | Mexico | 0.003 | 0.001 |
| 19 | 36 | Turkey | -0.001 | 0.006 |
| 20 | 38 | Romania | 0.029 | 0.022 |
Table 3.
Historical figures of English Wikipedia, mainly linked to political and social aspects of human society. Left column presents names more linked to socialism and right column those more linked to capitalism; their polarization opinion is shown for the case of two fixed red nodes (socialism, communism) and two blue nodes (capitalism, imperialism) (OP2) for realisations and realisations: and . The values of are discussed in Section 6.
| Name | Name | ||||
|---|---|---|---|---|---|
| Karl Marx | 0.007 | 0.018 | Winston Churchill | 0.017 | 0.015 |
| Vladimir Lenin | 0.017 | 0.021 | Franklin D. Roosevelt | -0.003 | 0.006 |
| Leon Trotsky | 0.023 | 0.023 | John F. Kennedy | -0.001 | 0.007 |
| Joseph Stalin | 0.019 | 0.020 | Richard Nixon | -0.007 | 0.006 |
| Nikita Khrushchev | 0.015 | 0.019 | Jimmy Carter | -0.005 | 0.006 |
| Leonid Brezhnev | 0.017 | 0.020 | Ronald Reagan | -0.007 | 0.006 |
| Yuri Andropov | 0.017 | 0.021 | George H. W. Bush | -0.007 | 0.005 |
| Mikhail Gorbachev | 0.013 | 0.019 | Bill Clinton | -0.007 | 0.006 |
| Boris Yeltsin | 0.017 | 0.022 | George W. Bush | -0.007 | 0.006 |
| Vladimir Putin | 0.013 | 0.020 | Barack Obama | -0.007 | 0.006 |
| Mao Zedong | -0.003 | 0.006 | Donald Trump | -0.007 | 0.006 |
| Xi Jinping | 0.003 | 0.005 | Charles de Gaulle | 0.013 | 0.018 |
Table 4.
Top 20 negative and positive values of of articles for the case of two fixed red nodes (socialism, communism) and two blue nodes (capitalism, imperialism) (OP2). The articles of this table belong to Figure 5
Table 4.
Top 20 negative and positive values of of articles for the case of two fixed red nodes (socialism, communism) and two blue nodes (capitalism, imperialism) (OP2). The articles of this table belong to Figure 5
| i | negative | Name | positive | Name |
|---|---|---|---|---|
| 1 | -1.000 | Étienne Clavier | 0.572 | Giliana Berneri |
| 2 | -0.786 | Theory of imperialism | 0.572 | Maurice Laisant |
| 3 | -0.777 | Community capitalism | 0.572 | Renée Lamberet |
| 4 | -0.751 | Supercapitalism: The Transform... | 0.572 | Georges Vincey |
| 5 | -0.399 | Sustainable capitalism | 0.572 | Aurelio Chessa |
| 6 | -0.022 | Li Yong (chancellor) | 0.572 | Giovanna Berneri |
| 7 | -0.022 | Cheng Yi (chancellor) | 0.572 | Pio Turroni |
| 8 | -0.020 | Yu Di | 0.572 | Maurice Fayolle |
| 9 | -0.020 | Emperor Wenzong of Tang | 0.572 | Louis Mercier-Vega |
| 10 | -0.020 | Consort Shen | 0.508 | Federación Deportiva Obrera |
| 11 | -0.020 | Wu Shaocheng | 0.508 | Labour Gathering Party |
| 12 | -0.020 | Wang Zhixing | 0.499 | Oneworld (disambiguation) |
| 13 | -0.020 | Shi Yuanzhong | 0.498 | One World 1964 |
| 14 | -0.020 | He Jintao | 0.498 | Nash Mir 1968 |
| 15 | -0.020 | Wang Yuankui | 0.498 | Our World |
| 16 | -0.020 | Li Deyu | 0.474 | Socialist Association |
| 17 | -0.020 | Liu Zhen | 0.474 | Socialista |
| 18 | -0.020 | Wang Zai | 0.474 | Indep. Radical Social Democratic Party |
| 19 | -0.020 | Shi Xiong | 0.468 | Indep. Socialist Workers Party |
| 20 | -0.020 | He Hongjing | 0.456 | Spanner (journal) All-Union Communist Party |
Disclaimer/Publisher’s Note: The statements, opinions and data contained in all publications are solely those of the individual author(s) and contributor(s) and not of MDPI and/or the editor(s). MDPI and/or the editor(s) disclaim responsibility for any injury to people or property resulting from any ideas, methods, instructions or products referred to in the content. |
© 2024 by the authors. Licensee MDPI, Basel, Switzerland. This article is an open access article distributed under the terms and conditions of the Creative Commons Attribution (CC BY) license (http://creativecommons.org/licenses/by/4.0/).
Copyright: This open access article is published under a Creative Commons CC BY 4.0 license, which permit the free download, distribution, and reuse, provided that the author and preprint are cited in any reuse.


