
Submitted:
26 July 2024
Posted:
01 August 2024
You are already at the latest version
Abstract
A corporate head office for large construction firms, holds more of a staffing role and facilitates, controls and manages subsidiaries. According to studies, little awareness of how to manage affairs, the unfavorable business environment, the lack of necessary rules and the structure of capital, form the most critical management areas to be thoughtful of. In dynamic systems, complex subject, refers to a problem in which the number of factors and relations in between are very high and sometimes unknown. In managing large construction firms, a similar situation prevails. Controlling and evaluating organization and management based on the correct information is something that is difficult to accomplish. This research seeks to provide a comprehensive review on construction firms performance measurements methods by using qualitative methods and necessary software tools. For this purpose, a summary is made of studies on areas such as construction companies, performance assessment solutions and content analysis methods. Then, considering the research gap, the research methodology will be developed, which will provide the optimal result for gathering different assessment methods suitable for construction firms in study. This article offers a step-by-step description of how qualitative data analysis software can be used for quantifying data and decision making. As illustrated in this research, using Nvivo shows how software tools can facilitate analytical flexibility and how they can enhance effectiveness of the qualitative research process. The article, aside from proposing the optimum performance assessment method for companies in study, concludes that while qualitative data analysis software will not do the analysis for the researcher, it can make the analytical process more flexible, transparent and ultimately more trustworthy.
Keywords:
construction firm
; content analysis
; performance assessment
; modeling
1. Introduction
Literature review is a common feature of all research endeavors, regardless of discipline or area of study, however, it is usually overlooked from qualitative analysis perspective. The processes involved in qualitative research methodology includes reading and reflecting, interacting with the commenting on literature, identifying and coding key themes, extracting gold dust from the codes, linking similar ideas from different articles, identifying contradictions in arguments, comparing dissimilarities in articles, and building one's own analysis with links to supporting evidence in the data. In the next paragraph, qualitative literature review tools will be presented to illustrate how research gap studies are carried out in this paper.
Researchers have developed various strategies to deal with the amount of material a literature review generates. In the past, card index systems were used as tools but in the past few years, bibliographical software has emerged as the favored tool to organize literature. Packages such as EndNote, Reference Manager, Pro Cite etc. have excellent tools to manage references. It is possible to download abstracts and, in some, whole articles to be included in the bibliographic database. They offer flexible ways to search and sort references. They have direct links with word-processing packages, making it easy to insert the correct citation in the text. They also have the ability to generate bibliographies in house styles, appropriate to a wide range of journals. It is also possible to do some of the tasks similar to analyzing qualitative data mentioned above. It is feasible to comment and reflect on an article, code it with certain key words etc., however, these packages were not designed for the analysis of data, so these processes can be carried out with limited capabilities.
Software packages such as NVIVO, Atlas.ti, N4 Classic, N5, Win Max etc. can be used to support the analysis processes involved in a literature review. These tools do not replace the bibliographic software mentioned above, as they do not have the bibliographic tools that those packages have. But their analytical tools can be used in addition to the bibliographic tools to support the whole literature review process. Of all the qualitative analysis software packages, only NVIVO (to date) has a particular set of tools that is ideal for analyzing literature. It is also useful to analyze literature in the other packages mentioned, but their tools are not as flexible as NVIVO's are for this purpose. By integrating these tools properly, it would be possible to break down the components of the argument to better understand it, pointing out reflections of a document, start building one's own critique of it, support critique by linking to quotes extracted from the proxy document and so on [1].
NVIVO has features that are well suited to aid in a literature review as well. To summarize, Proxy Documents (which are created directly in NVIVO) are used to write summaries of a particular author's argument and direct quotations. These can be coded themes to be able to retrieve later. Memos can have reference to other articles by using Doc Links and Node Links. Documents can be organized by using attributes and sets. This enables, later on, to restrict searches to particular documents by author, date, discipline or whatever is relevant to research. It is possible to keep a literature review Journal in NVIVO and write directly in it. By using a software tool like this for literature review, a literature archive would be created, which anyone will be able to dip into and add to for future reference and research [2,4].
2. Research Gap
There are various management software tools in the marker, each of these methods has its own advantages and disadvantages and the critical point is selecting the most appropriate method for achieving the desired goals of each firm. Previous studies have not focused on the systematic performance management of large construction firms to present a framework to choose across different tolls. Various research on organizational management, performance measurement and performance enhancement has been conducted; by studying them and analyzing the characteristics of construction firms, it is feasible to choose optimum and better manage these firms.
In traditional performance assessment models, attention is focused on financial evaluation and gathering reports or results. This view emphasizes solely on the past period and has been shaped by the need to analyze what has happened in the firm. New perspectives however, dive into growth, education parameters, development of capacities, improvement of individuals, organization and its operation, providing consulting services and public participation of stakeholders, motivating and accountability for improving quality, and optimizing activities and operations. The scope covered by measuring performance can be at the macro level of a firm, one unit, a process, or a staff member. The staff level of performance assessment, so that today is common in human resources management departments, is done with different criteria in organizations. Organizations, individuals, or organizational units, although seemingly doing their job, are only part of the whole system, and the conditions of other components of it must also be considered [5].
Attention to the comprehensive criteria and the strategies and goals of the firm is an integral part of a comprehensive performance management system. Such an approach to performance assessment will be a real, fair, reliable and dynamic assessment. The question arises whether these different performance assessment models are of the same value to firms in study, or each bring a different outcome. Which model has the most and which one is less beneficial for us. In this regard, steps are taken for gathering, choosing and combining performance assessment tools with respect to the information and conditions of each containment, with optimization of resources.
3. Research Methodology
Scientific research is a systematic effort to answer the questions posed by the motivation to start an investigation. Selection of appropriate research methods and the use of statistical methods to assess the validity of the hypotheses raised, will ensure the accuracy of scientific research. literature review done for presenting the statement of problem includes studies of large construction firms, performance indexes, performance assessment models and literature review methods. This section focuses on library resources, relevant articles, books, related dissertations and corporate websites have been used for data gathering to support the model presented. This research seeks to provide a new model for gathering and introducing performance measurements in large construction firms using content analysis.
Content analyses is a computer-based method which helps to gather data. In this research we will use this technique with a suitable software in an innovative way for making an accurate literature review and data preparation. The data could be analyzed by matrices or technical methods. The advancement of computer technology has led to an increase in data volumes and the creation of large databases. As a result, various methods for discovering knowledge of them have been introduced or are being introduced. In this regard, one of the relatively new scientific branches of data mining is of great interest. Data matrices in data mining applications are often non-negative, which has limitations in the use of classical matrix methods. Although using these methods can reduce the dimension of large data, they do not get the correct interpretation of the unprotected data [3,6]. As illustrated in Figure 1, research methodology of this research starts with date gathering structure design. Content analysis along with traditional literature review helps to highlight the performance assessment tools and rating then. By collecting information, implementing case studies and teaching the model, control indicator and rating for these assessment models will be enhanced and Operational business excellence (OBI) can be achieved.
4. Statement of Problem
Due to the wide range of performance assessment models, the use of analytical and qualitative methods over the literature of the subject is superior to other methods. The extraction of information into structured data extraction operations is referred to as unstructured or semi-structured readable documents. Most of the extraction exercise involves the processing of texts by natural language processing. Today, activities related to the processing of multimedia documents, such as automated annotation, the extraction of texts and contents from images, audio files and video clips, are considered as information extraction techniques. The background to information extraction dates back to the mid-1980s. The system was designed to provide financial data to financial traders in real-time. In this regard, the use of computers for the more comprehensive processing of information is essential [7]. Different frameworks were used for evaluating construction firms, neglecting scientific procedure to prioritize these firm’s structure. The challenging part would be defining a model to tailor a performance-measuring framework for construction firms. [8]
Content analysis is a special case in observational research and historical documentary research, and in terms of nature, there is little research through which the qualitative content of the sources examined is transformed into quantitative data through statistical manipulations. This method has a long history, the effects of which can be seen in the analysis of religious books like the Gospel and the Qur’an but has been scientifically pursued in the last century with the analysis of the press and has spread to various scientific domains. The application of this method can be categorized in three general parts [9]:
- When access to problem information and researcher information is restricted to documentary evidence.
- The researcher has direct access to information on the research topics.
- To complete the researcher's information for comparison with other methods such as questionnaires
Considering the applications of this method, utilizing this will be favorable for the research. This method defines the objective, quantitative and systematic study of communication products (the explicit content of the message) to reach the interpretation of the message. Its main objectives can be summarized in the analysis of the message characteristics, the historical analysis of the message, and the analysis of the message's results. One of the most important phases of content analysis is the part in which the text are first divided into components, then by dividing the components into different classes, the frequency of each class count and the percentage is calculated and analyzed at the end [10]. This article pursues to introduce researchers to this method. The most popular types of research using content analysis are:
- Content analysis of the category
- Content evaluation analysis
- Analysis of the content of understanding or solidarity
In below paragraph, we dive into how we can take advantage of QCA for date gathering and analysis of next chapter.
5. Qualitative Content Analysis (QCA)
Unlike quantitative content analysis with its long history as "a research technique for the objective, systematic and quantitative description of the manifest content of communication" QCA is context specific. It treats context as "center to the interpretation and analysis of the material ". QCA moves away from the focus on objectivity as maintained by traditional quantitative content analysis in an attempt to allow for "the subjective interpretation of the content of text data" while maintaining "the systematic classification process of coding and identifying themes or patterns" [3]. Both a quantitative analysis of qualitative data, as well as a qualitative analysis of quantitative data, are possible [4]. Thus, there is no reason to suspect a deep divide between the qualitative and quantitative perspectives." For instance, subject to the research question, QCA can include quantitative elements such as word frequency analysis. In other words, QCA allows a focus on quantitative aspects of the research data that are most relevant to the research question [4].
The first step of our software-assisted analysis was to select the software. This is easier said than done, as the growing list of available options, such as MaxQDA, NVivo or Dedoose can be daunting, and particularly as each option comes with its specific advantages and limitations. During a comparison of software options, it is important to keep in mind that the software cannot provide the researcher with a theoretical or analytic framework. It can "merely" provide tools to facilitate data management and analysis. Furthermore, selection must also take into account practicalities, such as whether or which software programs are available for your institution and the license fees. Additional factors that need to be taken into consideration at the stage of choosing the software are whether specific functionality is required. For example, NVivo (from version 10) comes with a web browser extension (NCapture) through which social media data, such as Twitter tweets and public Facebook messages can be collected and analyzed. While not immediately relevant for the research presented here, we considered this functionality of high potential for a follow-up study [2,11]. Considering all factors, NVivo got the most points for the purpose of this research.
6. Data Gathering, Analysis and Visualization
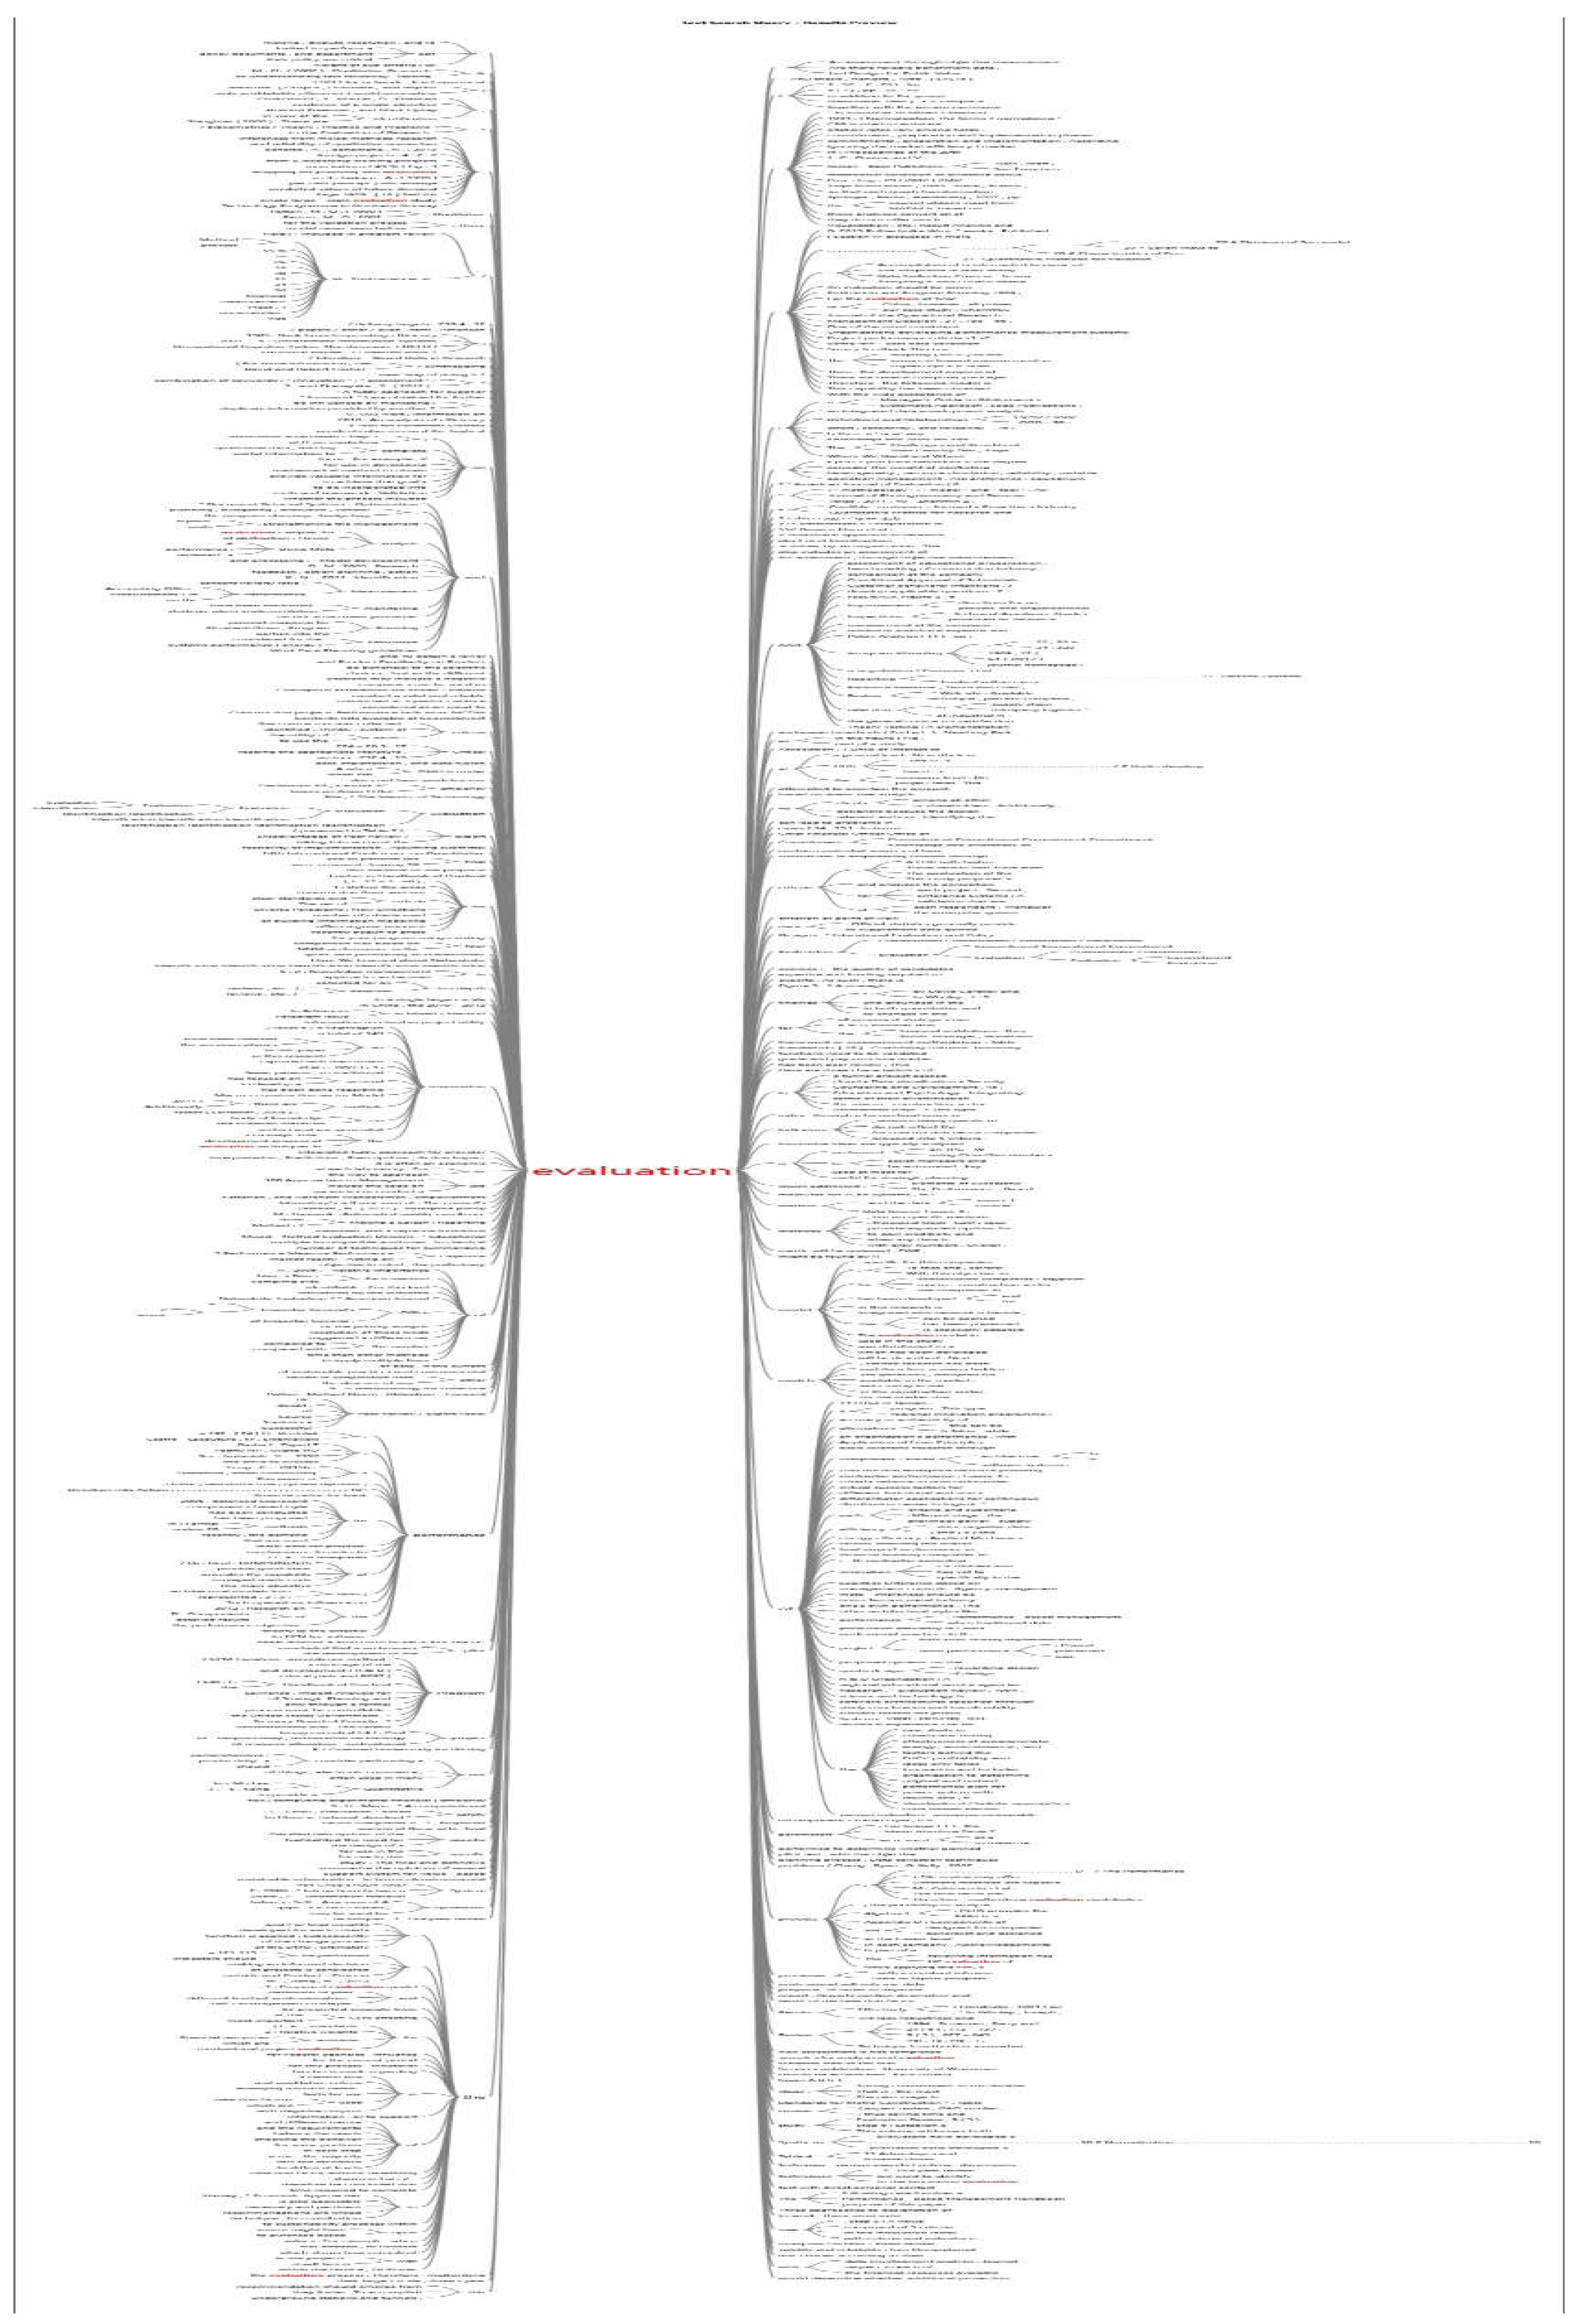
At the stage of data gathering, two outputs are required from the software. The first output is to depict the results using software tools such as charts, tree species maps and models. In general, the software provides a general overview of what is included in the subject of the research, how they are related and how relative they are. It helps to rank the performance assessment methods and complete the matrix of the value of the models in each domain, with reference to experts’ studies. After revising the terms and using first stage outputs, the second output is the rating table of the performance assessment methods in the form of a vector [12,13]. Dividing analysis units into programming units can be interpreted as cutting your text into pieces. The word tree such as figure 1 helps to identify permanent words and group words with common references. From this tree, important phrases are generated. Then, these terms would be studied in the markup text to gather beneficial insights about each method, that can not be reviewed in traditional methods due to time constraints.
Figure 1.
Mind map, word hierarchy.
7. References Used for QCA Analysis
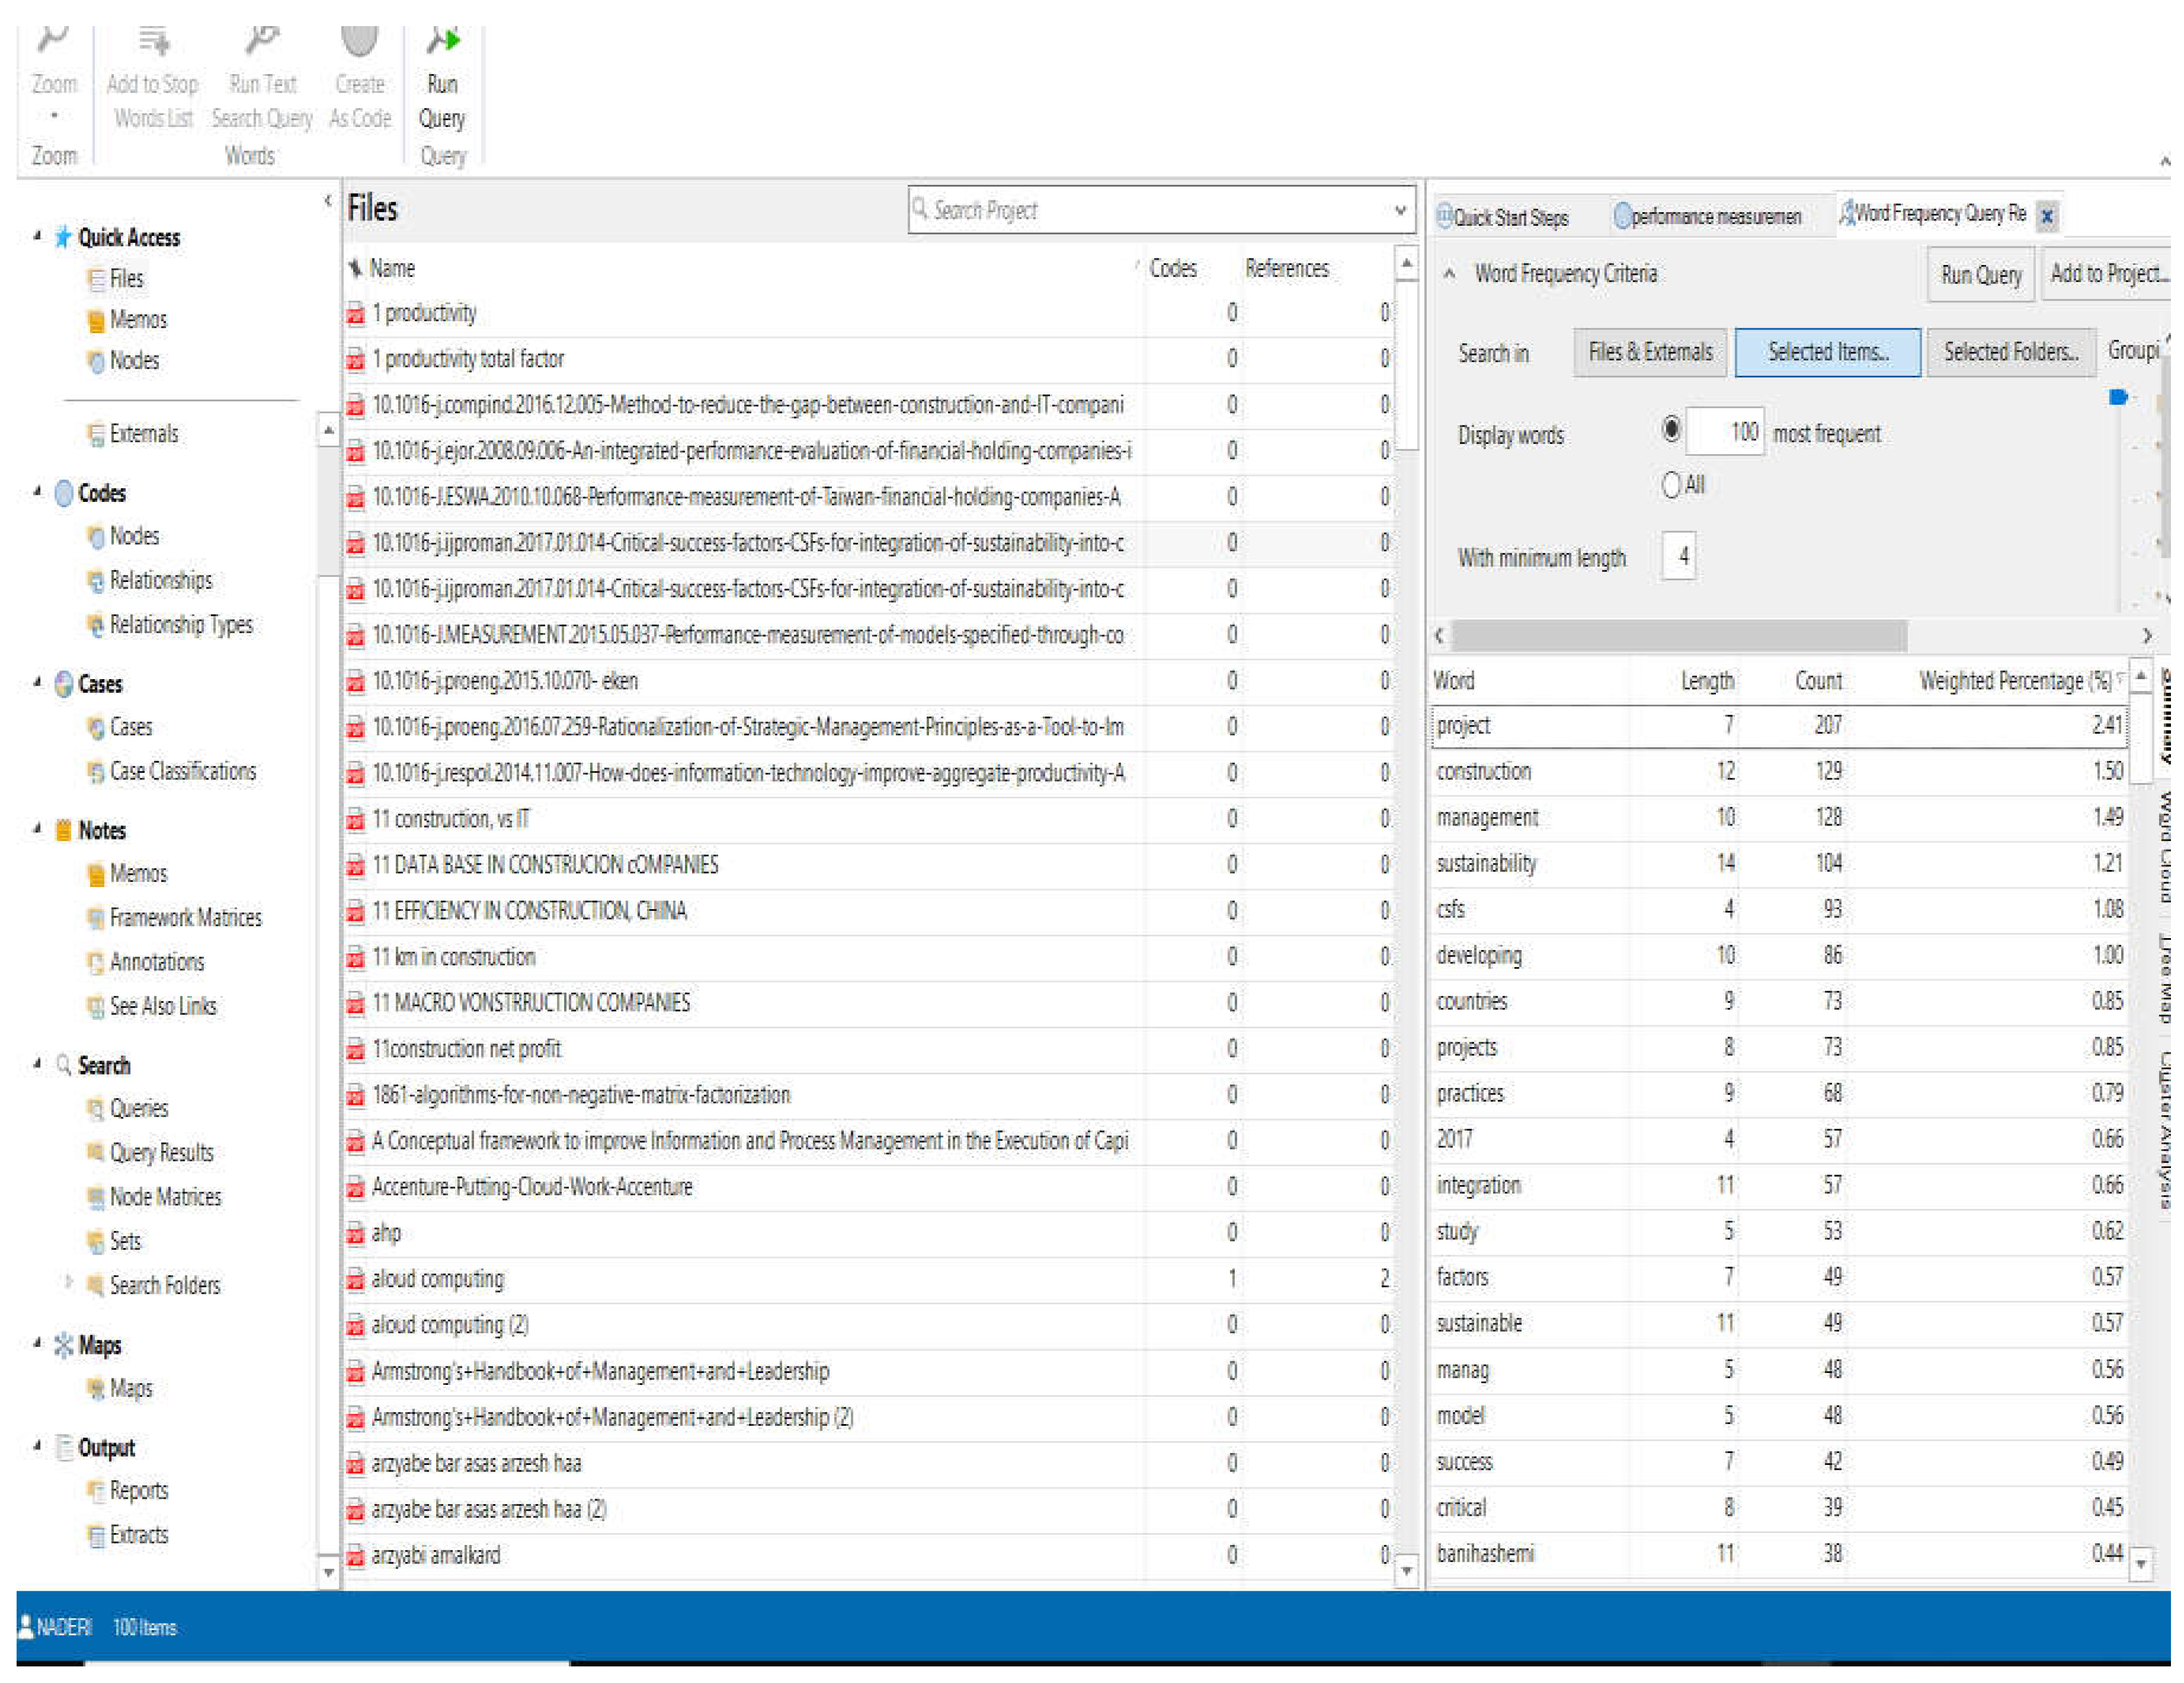
More Than 300 references of articles, books and web pages are inserted in software such as what is shown figure 2. The scope of these references includes "Performance measurement methods in construction firms" and whatever the tree result in previous part, could find [14,15].
Figure 2.
Literature data input in software.
8. Performance Measurement Review by Keyword Analysis
Different key word analysis can be used to improve the result of content analysis. When categories are high in number, soring methods can be used. These programs examine raw or unprocessed text, will specify the position and characteristics of the text, count and tabulate. The vocabulary dictionary is the interface between theoretical setting of the problem of research and machine operations. For example, each word has positive or negative labels, thus counting and meaningful words using a computer. The computer is able to do things that the researcher could provide a clear instruction for. Keywords are important outputs in content analysis. In Table 1, for example, more than 60 widely used words in a text that has more than 4 characters are tabulated. To continue the analysis, the applied vocabulary for the continuation of the research should be extracted from this table and, with the techniques introduced in the word tree, the content analysis nodes in the software are developed. Table 2 is a table of words corrected with the techniques incorporated in analysis [16,17,18].
The steps taken and the weights generated by the vector for the generated performance assessment models are [13,17,19]:
Step 1: Extract the list of searched words
Step 2: Expert Query for keywords using word processing
Step 3: Extract around 100 keywords for each search
Step 4: Generate the programmed table of information loading in Excel or Matlab.
Step 5: Complete the table with word processing information
Step 6: Modify the weights at the same time as completing the information in the expert system
9. Conclusion and Presentation of Findings
Considering the results of Table 2, different optimum performance assessment methods used and introduced in large construction firms’ performance measurement, will be presented in Table 3.
After investigating on Performance assessment methods, rating of each method will be presented in Table 4, using content analyses and Triston questionnaires for reliability control.
10. Ensuring Trustworthiness and Reliability of Findings
Since processes of organizing, coding and analyzing data in qualitative research are largely invisible to the reader, a high degree of faith in the presented research results is required. Insufficient transparency and trustworthiness of the qualitative data analysis process have repeatedly been stressed as limiting factors of qualitative inquiries. As mentioned, qualitative studies often lack a detailed account of data collection procedures, steps involved in the analysis process, and how those lead to specific results and conclusions. Clearly, making the research process transparent can enhance its trustworthiness and perceived quality. The results shown in Table 5 approves the software's outcomes.
Acknowledgments
This research did not receive any specific grant from funding agencies in the public, commercial, or not-for-profit sectors.
References
- Yuguo Zhang, Wenshun Wang, Lingyun Mi, Ying Liu, Lijie Qiao, Guodong Ni, Xiang yang Wang, Deconstructing the organizational resilience of construction firms in major emergencies: A text mining analysis of listed construction companies in China, International Journal of Disaster Risk Reduction, Volume 106, 104473, ISSN 2212-4209, 2024. [CrossRef]
- Silvana di Gregorio, Using Nvivo for your literature review, SDG associates, 2000.
- Florian Kaefer, Juliet roper, Paresha Sinha, A software assisted qualitative content analysis of new articles: examples and reflections, 2015.
- Jenine Beekhuysen, putting the pieces of the puzzle together: using Nvivo for a literature review, 2007.
- Ali Nawaz Khan, Khalid Mehmood, Ho Kwong Kwan, Green knowledge management: A key driver of green technology innovation and sustainable performance in the construction organizations, Journal of Innovation & Knowledge, Volume 9, Issue 1, 100455, ISSN 2444-569X, 2024.
- Galbraith J.R, “The Multi-Dimensional and Reconfigurable Organization”, Organizational Dynamics, 2016.
- Kliuchnikova, O.A. Pobegaylov, " Rationalization of Strategic Management Principles as a Tool to Improve a Construction Company Services", Procedia Engineering 150 (2016) 2168 – 2172, 2017.
- Naderi, A., Shakeri, E. & Golroo, A. Performance-based management for construction holdings by integration of measurement frameworks. Asian Journal of civil engineering, 22, 751–758, 2021. [CrossRef]
- Yuguo Zhang, Wenshun Wang, Lingyun Mi, Ying Liu, Lijie Qiao, Guodong Ni, Xiang yang Wang, Deconstructing the organizational resilience of construction firms in major emergencies: A text mining analysis of listed construction companies in China, International Journal of Disaster Risk Reduction, Volume 106, 104473, ISSN 2212-4209, 2024. [CrossRef]
- 2016; Zhen-Zhong Hu, Jian-Ping Zhang, Fang-Qiang Yu, Pei-Long Tian, Xue-Song Xiang, "Construction and facility management of large MEP projects using a multi-Scale building information model", Advances in Engineering Software, 2016. [CrossRef]
- Management and Economics 25th Anniversary Conference, 16-18 July, University of Reading, United Kingdom, 2015.
- McLeod, R; "Management information systems", Prentice Hall, Seventh ed, New Jersey, 1998.
- Robert S. Kaplan, David P. Norton, The Pursuit of Striving: Linking Strategies and Operations to Create a Competitive Advantage, Translator: Masoud Chitgarah, Rasa Publications, 2010.
- Hyunbae Chun, Jung-Wook Kim, Jason Lee, "How does information technology improve aggregate productivity? A new channel of productivity dispersion and reallocation", Research Policy journal, 2014. [CrossRef]
- Shakeri, Naderi, Golroo, Systematic project management using controlling indicators, Journal of applied environmental science 250-255, 2015.
- Yan Q. You, Tao Jie, A study of the operation efficiency and cost performance indices of power-supply companies in China based on a dynamic network slacks-based measure model", OMEGA JOURNAL, 2014. [CrossRef]
- Shakeri, Naderi, Golroo, investigating for best fitted performance measurement method focusing on analytical approaches in mega companies, Journal of Organizational Behavior Research, 1-14, 2019.
- Shakeri, Naderi, Golroo; Construction Holdings Systematic management, using key performance indicators for consecutive improvement, Journal of Organizational Behavior Research, 81s2418, 2018.
- Chen Wang, Yutong Tang, Yiyi Mo, Merit M. Huang, Hamzah Abdul-Rahman, Structured mathematical modelling on innovation management in project-oriented small construction firms, Heliyon, Volume 9, Issue 2, e13386, ISSN 2405-8440, 2023.
Figure 1.
Research methodology.
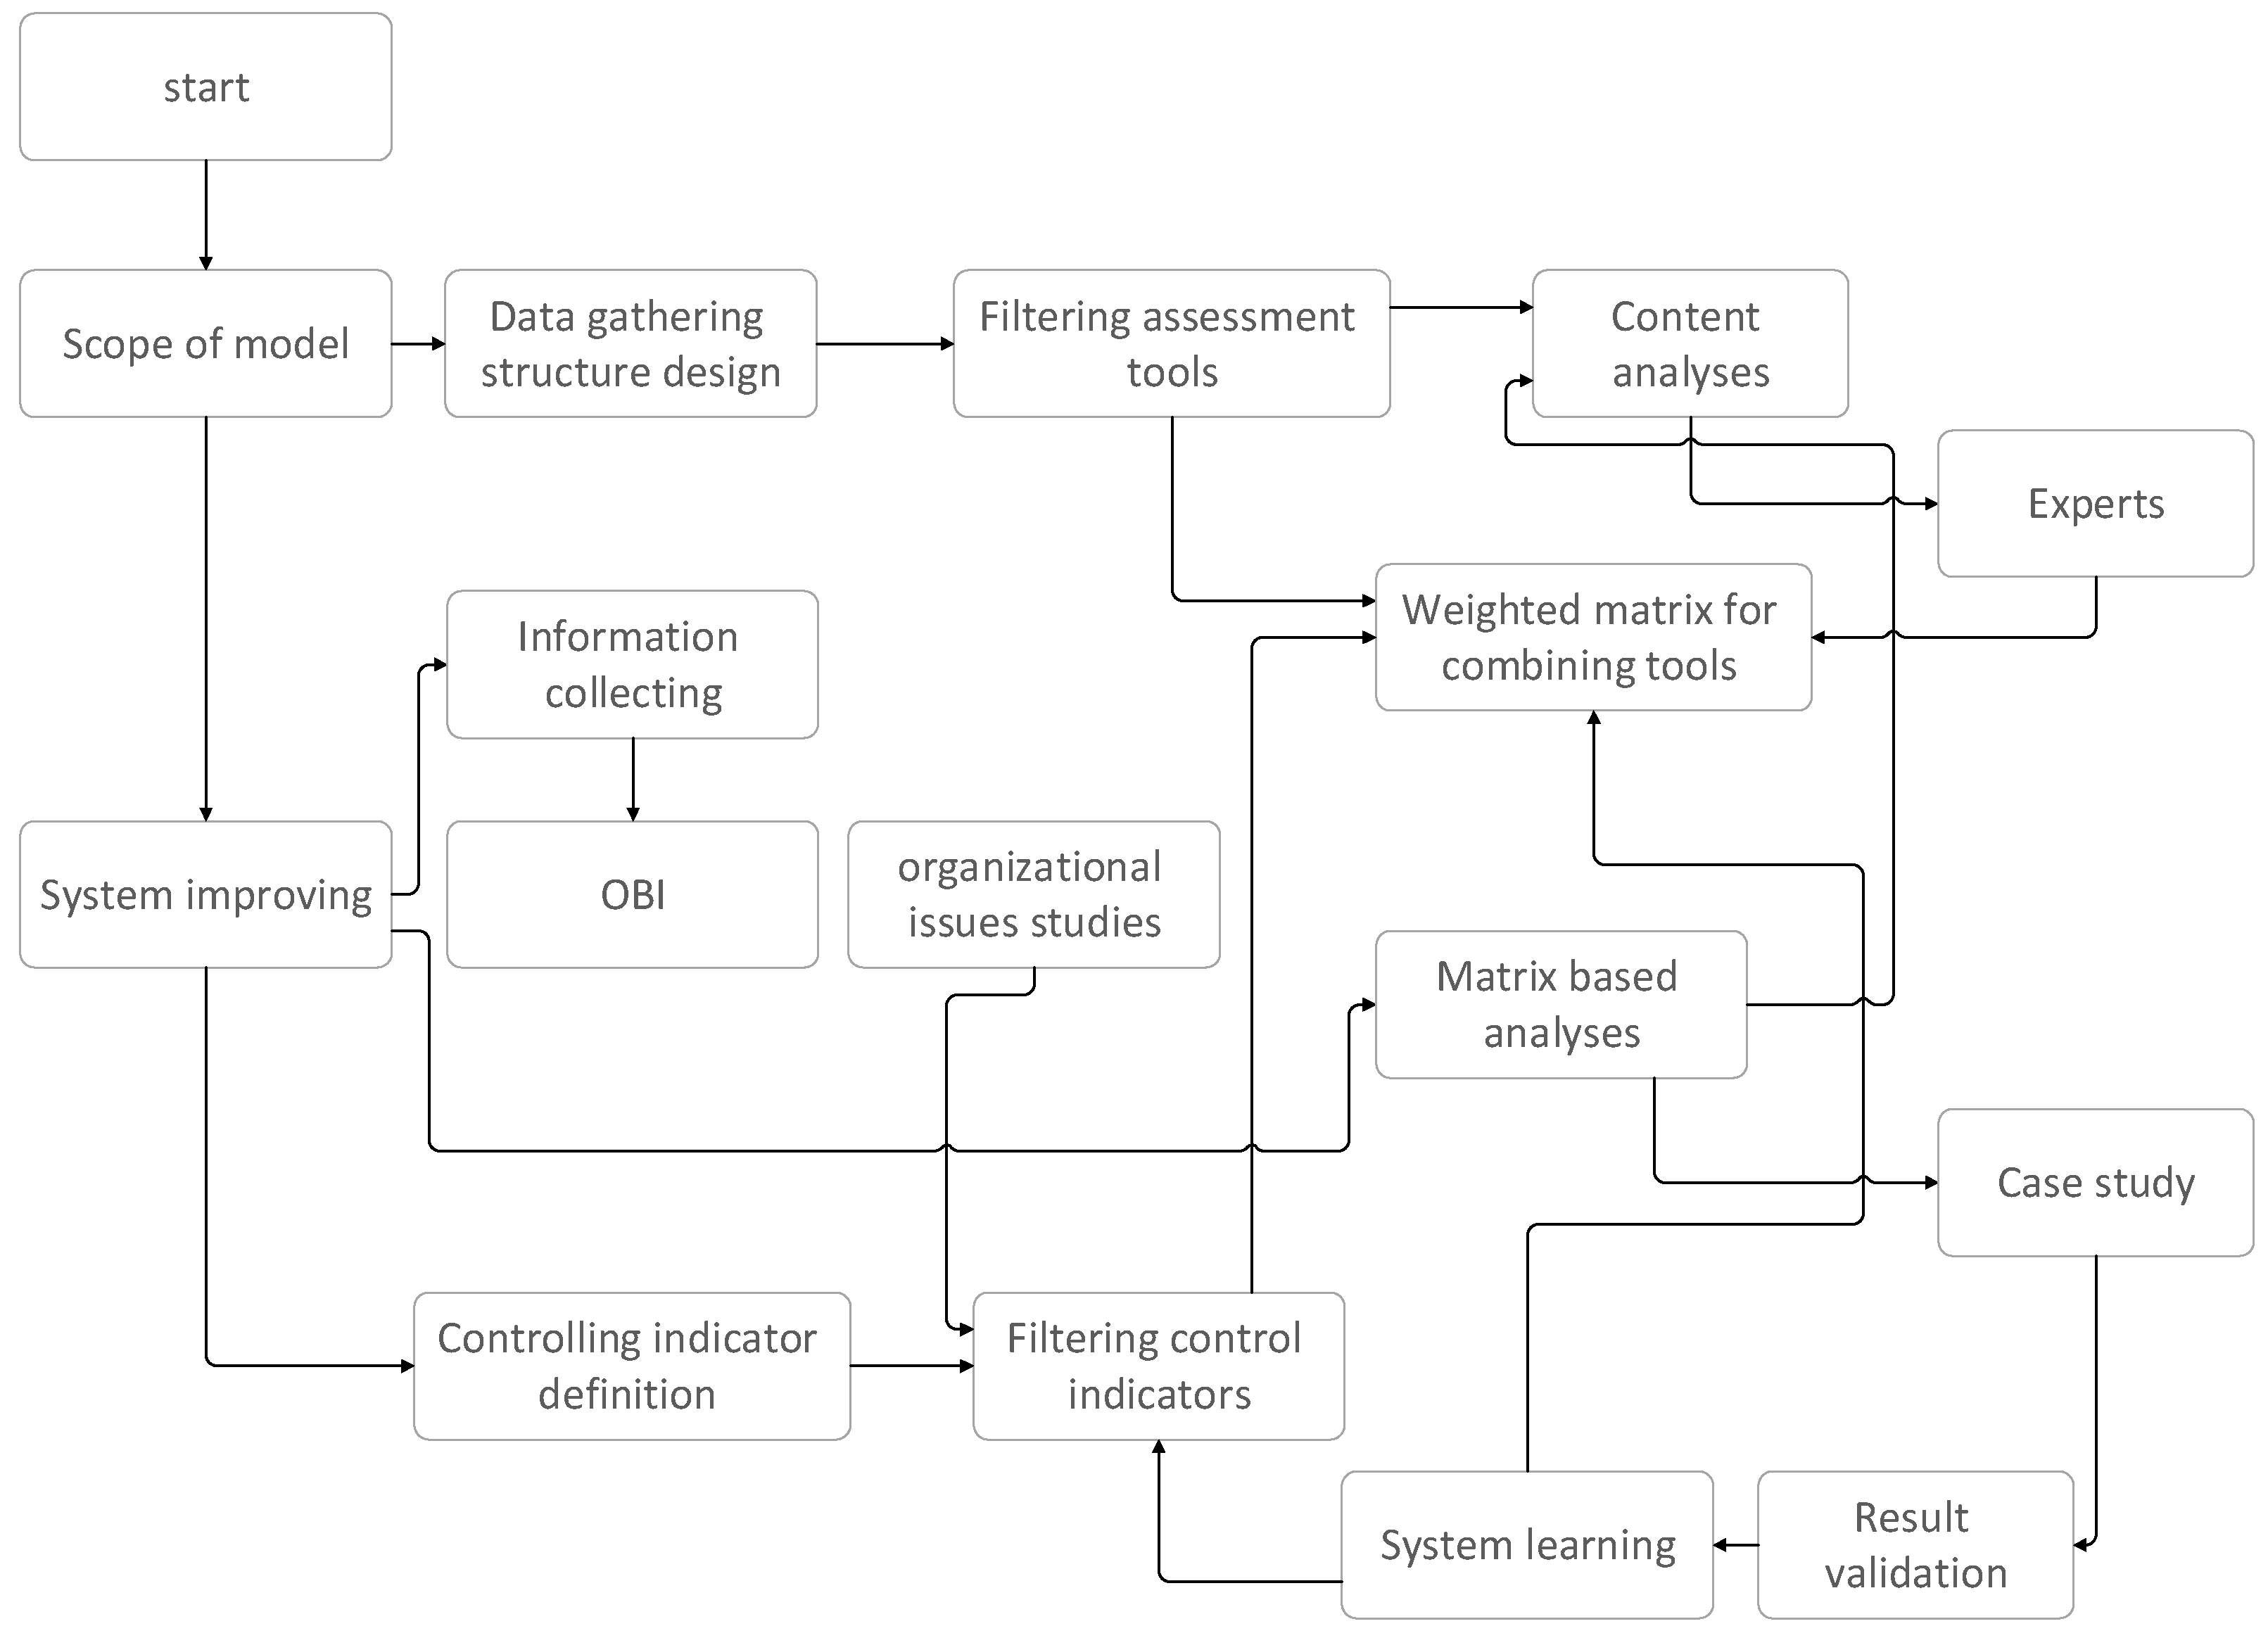

Table 1.
Software Key words.
| Word | Length | Count | Weighted Percentage (%) |
| Performance | 11 | 6769 | 0.74 |
| Management | 10 | 6059 | 0.66 |
| Construction | 12 | 3728 | 0.41 |
| Project | 7 | 3012 | 0.33 |
| Information | 11 | 2924 | 0.32 |
| Process | 7 | 2861 | 0.31 |
| Interface | 9 | 2320 | 0.25 |
| Organization | 12 | 2233 | 0.24 |
| System | 6 | 2184 | 0.24 |
| Research | 8 | 2101 | 0.23 |
| Model | 5 | 1791 | 0.19 |
| Analysis | 8 | 1738 | 0.19 |
| Quality | 7 | 1636 | 0.18 |
| Results | 7 | 1480 | 0.16 |
| Measures | 8 | 1445 | 0.16 |
| Business | 8 | 1415 | 0.15 |
| Design | 6 | 1411 | 0.15 |
| Measurement | 11 | 1395 | 0.15 |
| Change | 6 | 1376 | 0.15 |
| Customer | 8 | 1372 | 0.15 |
| Systems | 7 | 1328 | 0.14 |
| Methods | 7 | 1246 | 0.14 |
| People | 6 | 1214 | 0.13 |
| Cloud | 5 | 1209 | 0.13 |
| Projects | 8 | 1195 | 0.13 |
| Service | 7 | 1181 | 0.13 |
| Improvement | 11 | 1121 | 0.12 |
| Processes | 9 | 1105 | 0.12 |
| Development | 11 | 1048 | 0.11 |
| Managers | 8 | 1017 | 0.11 |
| Approach | 8 | 982 | 0.11 |
| Number | 6 | 970 | 0.11 |
| Strategic | 9 | 950 | 0.10 |
| Value | 5 | 949 | 0.10 |
| Study | 5 | 947 | 0.10 |
| Organizations | 13 | 929 | 0.10 |
| Factors | 7 | 922 | 0.10 |
| Program | 7 | 921 | 0.10 |
| Planning | 8 | 899 | 0.10 |
| Engineering | 11 | 890 | 0.10 |
| Industry | 8 | 881 | 0.10 |
| Control | 7 | 877 | 0.10 |
| Safety | 6 | 864 | 0.09 |
| Review | 6 | 859 | 0.09 |
| Knowledge | 9 | 853 | 0.09 |
| Activities | 10 | 848 | 0.09 |
| Measure | 7 | 841 | 0.09 |
| Needs | 5 | 822 | 0.09 |
| Handbook | 8 | 817 | 0.09 |
| Accountability | 14 | 808 | 0.09 |
| Resources | 9 | 790 | 0.09 |
| Customers | 9 | 757 | 0.08 |
| Provide | 7 | 749 | 0.08 |
| Method | 6 | 732 | 0.08 |
| Figure | 6 | 731 | 0.08 |
| Technology | 10 | 731 | 0.08 |
| Decision | 8 | 730 | 0.08 |
| Company | 7 | 718 | 0.08 |
| Group | 5 | 711 | 0.08 |
| Matrix | 6 | 711 | 0.08 |
| Services | 8 | 710 | 0.08 |
| Companies | 9 | 708 | 0.08 |
| Objectives | 10 | 701 | 0.08 |
| Building | 8 | 691 | 0.08 |
| Environment | 11 | 646 | 0.07 |
| Requirements | 12 | 646 | 0.07 |
| Models | 6 | 640 | 0.07 |
| Interfaces | 10 | 635 | 0.07 |
Table 2.
Software revised Key words.
| Word | Length | Count | Weighted Percentage (%) |
| Performance | 11 | 6769 | 0.74 |
| Management | 10 | 6059 | 0.66 |
| Construction | 12 | 3728 | 0.41 |
| Information | 11 | 2924 | 0.32 |
| Process | 7 | 2861 | 0.31 |
| interface | 9 | 2320 | 0.25 |
| Organization | 12 | 2233 | 0.24 |
| Measurement | 11 | 1395 | 0.15 |
| Change | 6 | 1376 | 0.15 |
| Customer | 8 | 1372 | 0.15 |
| Cloud | 5 | 1209 | 0.13 |
| Improvement | 11 | 1121 | 0.12 |
| Processes | 9 | 1105 | 0.12 |
| Knowledge | 9 | 853 | 0.09 |
| Productivity | 12 | 601 | 0.07 |
| Benchmarking | 12 | 580 | 0.06 |
| Strings of words populated by Software | |||
| Integrated Performance Measurement | |||
| Knowledge Management | |||
| Information Analyses | |||
| Cloud Computing | |||
| Change Management | |||
| Performance Measurement | |||
Table 3.
Software Modified Assessment Methods.
| No | Performance Assessment Method |
| 1 | Balanced Score Card Assessment |
| 2 | Standard Systematic Evaluation |
| 3 | Results and determination Model |
| 4 | Performance Pyramid model |
| 5 | Stakeholder Analysis Model |
| 6 | MAKE, Standard Assessment method |
| 7 | Organizational Excellence Evaluation Model |
| 8 | Model of Quality Management System |
| 9 | Management System Based on Purpose Model |
| 10 | Ideal Evaluation Program Model |
| 11 | Fisher Evaluation Model |
| 12 | Management Valuation Model Based on Values |
Table 4.
Rating Software Modified Assessment Methods.
| No | Weighted score (%) | Performance Assessment Method |
| 1 | 16.7 | Balanced Score Card Assessment |
| 2 | 10.8 | Standard Systematic Evaluation |
| 3 | 7.8 | Results and determination Model |
| 4 | 7.65 | Performance Pyramid model |
| 5 | 9.9 | Stakeholder Analysis Model |
| 6 | 8.6 | MAKE, Standard Assessment method |
| 7 | 6.9 | Organizational Excellence Evaluation Model |
| 8 | 9.1 | Model of Quality Management System |
| 9 | 8.3 | Management System Based on Purpose Model |
| 10 | 8.6 | Ideal Evaluation Program Model |
| 11 | 8.7 | Fisher Evaluation Model |
| 12 | 8.55 | Management Valuation Model Based on Values |
Table 5.
Reliability control of findings.
| No | Value (1 To11) | Performance Assessment Method |
| 1 | 8.3 | Balanced Score Card Assessment |
| 2 | 7.3 | Standard Systematic Evaluation |
| 3 | 7.8 | Results and determination Model |
| 4 | 7.65 | Performance Pyramid model |
| 5 | 7.95 | Stakeholder Analysis Model |
| 6 | 8.6 | MAKE, Standard Assessment method |
| 7 | 7.1 | Organizational Excellence Evaluation Model |
| 8 | 9.1 | Model of Quality Management System |
| 9 | 8.3 | Management System Based on Purpose Model |
| 10 | 8.6 | Ideal Evaluation Program Model |
| 11 | 8.7 | Fisher Evaluation Model |
| 12 | 8.55 | Management Valuation Model Based on Values |
Disclaimer/Publisher’s Note: The statements, opinions and data contained in all publications are solely those of the individual author(s) and contributor(s) and not of MDPI and/or the editor(s). MDPI and/or the editor(s) disclaim responsibility for any injury to people or property resulting from any ideas, methods, instructions or products referred to in the content. |
© 2024 by the authors. Licensee MDPI, Basel, Switzerland. This article is an open access article distributed under the terms and conditions of the Creative Commons Attribution (CC BY) license (http://creativecommons.org/licenses/by/4.0/).
Copyright: This open access article is published under a Creative Commons CC BY 4.0 license, which permit the free download, distribution, and reuse, provided that the author and preprint are cited in any reuse.


