Submitted:
26 July 2024
Posted:
29 July 2024
Read the latest preprint version here
Abstract
Countless disasters have resulted from climate change, with severe damage to infrastructure and the economy. Their societal impacts require mental health services for the millions affected. To prepare for and respond effectively to these events, it is important to understand people’s emotions and incidents both before and after a disaster strikes. The emotions and other life incidents expressed on Twitter during the 2017 Hurricane Harvey were mined in this case study. Between August 20 and August 30, we collected a dataset of approximately 400,000 public tweets that related to the storm. Using a BERT-based model, we predicted the emotions attached to each tweet. After that, we used various natural language processing techniques to analyze the tweets themselves to understand what kind of ’topics’ were being discussed when people expressed certain ’emotions’. Applying the Latent Dirichlet Allocation (LDA) technique for topic modeling sidesteps the need for manual content analysis and allows us to find meaningful patterns in the data. Results show that there is a significant change of emotions occurred when the hurricane is at most devastating and many of life incidents become pressing demands/concerns from population such as evacuation plan, animal safety, safety update, public policy, helps, flood, and fake news.
Keywords:
emotional health
; climate change
; life incidents
; natural language processing
; topic modeling
; social media
1. Introduction
Climate change has caused many serious natural disasters around the world, like strong hurricanes, long droughts, higher temperatures, and heavy snowstorms. These extreme weather events damage buildings and the economy, affecting society deeply. Hurricanes, in particular, have become more frequent and severe. For example, Hurricane Harvey in 2017 brought massive amounts of rain to Texas and Louisiana, causing record-breaking floods. The National Hurricane Center estimated the damage at $125 billion. Also, 738,000 people asked for help from the Federal Emergency Management Agency (FEMA), and at least 3,900 homes lost electricity [1]. The huge number of 911 calls overwhelmed emergency services, leading many people to use social media to share their problems, worries, and requests for help.
Research by Cooper et al. demonstrated a strong connection between environmental conditions and emotional health through group discussions and interviews. Their study revealed that water shortages caused significant worry and fatigue among participants [2]. These findings were corroborated by other research, which showed that negative emotions are directly linked to immediate environmental conditions such as water shortages [3,4], food shortages [5], and environmental changes [6]. Hickman et al. conducted a study that highlighted the anxiety felt by many young people (aged 16-25 years) worldwide regarding climate change, with many participants expressing negative emotions towards their governments’ inaction on climate issues [7]. These studies employed various methodologies, including large surveys and group studies, to minimize bias. Despite providing valuable insights into the impact of climate change on daily life, these studies face several challenges. Primarily, such research is often costly and time-consuming, requiring significant resources for data collection and analysis. This process involves recruiting participants, organizing data collection sessions, and compensating participants, particularly in group studies. Furthermore, these studies are limited by the amount of data they can collect, which may not fully represent the broader population’s experiences.
In today’s world of fast technological progress and growing environmental concerns, social media platforms have become a powerful tool for investigating and understanding the different impacts of climate change. This research aims to use the vast real-time data available on social media during hurricanes to understand the complex relationship between these natural disasters and public reactions when they occur. By analyzing the digital traces left during Hurricane Harvey, this study seeks to find valuable insights into how society sees, responds, and how information spreads during hurricanes. The findings of this research could help improve disaster management communication strategies and contribute to the global conversation on climate change resilience.
We picked this approach for a few key reasons. First, we’re focusing on emotions and specific life incidents instead of just general mental health, which helps us see how environmental factors impact people’s feelings during disasters. Second, we use a BERT model to predict emotions and LDA to identify life incidents, combining the power of modern NLP models and topic modeling to get accurate results. Third, by manually checking and naming the incidents, we make sure our findings are reliable, even if there’s some human bias. Lastly, using real-time social media data lets us capture public reactions and feelings right away, giving us timely insights that are important for managing disasters and public health. Based on the result of the previous work [8], our current study goes in different directions in scope and contributions. While [8] focuses on broader stressors related to climate change, we concentrate on immediate emotional reactions and specific life incidents during disasters. This approach allows us to provide more detailed insights into how specific incidents affect emotional health during disasters.
In this study, we use social media data from Hurricane Harvey as a case study to analyze emotional health and identify life incidents during this disaster. We use natural language processing (NLP) and transfer learning techniques to achieve this. The collected tweets undergo data cleaning and stop word removal. In addition to regular English stop words, we include an expanded stop word list to filter out common words related to general disaster information and locations, as well as terms that don’t add much meaning to our analysis. The tweets are then broken down and vectorized using term frequency-inverse document frequency (TF-IDF) before being processed by our emotion prediction model [9]. From the identified emotions in each tweet, we isolate those expressing negative emotions and create a negative-emotion group for the incident factor extraction process. The emotion prediction algorithm uses a BERT-based model to analyze the emotions behind each tweet. For incident factor extraction, we use Latent Dirichlet Allocation (LDA) topic modeling to identify key topics. This approach allows us to extract climate change-related incident factors by analyzing the identified topics and the significant terms within each topic. This paper makes several important contributions. Firstly, it shows the successful use of advanced transformer technology, specifically a BERT-based model, to predict emotions in a large number of tweets. Additionally, we conduct an emotional health analysis and show how emotions changed throughout the disaster event. The results suggest that emotions can be a useful way to study health outcomes caused by disasters and understand climate change impacts better. Furthermore, another key contribution of this paper is identifying 20 climate change-related incident factors that cause anxiety among people. We hope that these findings will catch the attention of policymakers, encouraging them to allocate more resources not only to fix infrastructure damage but also to address other vulnerable areas that affect daily life. This should be done through a thorough and complete disaster management plan.
2. Related Work
In this section, we review recent studies related to addressing climate change and public health. These studies are categorized into two main scientific areas: topic modeling for public health and the use of social media for disaster relief.
2.1. Topic Modeling for Public Health
Topic modeling helps find patterns and make sense of unstructured collections of documents [10]. This technique connects social and computational sciences. Topic models use probabilistic methods to uncover the hidden semantic structures of a group of texts through hierarchical Bayesian analysis. These texts can include emails, scientific papers, and newspaper articles. For example, Grassia et al. [11] used non-negative matrix factorization (NMF) to identify main themes in newspaper articles, pinpointing topics used for propaganda. Grootendorst [12] used BERTopic to create document embeddings with pre-trained transformer-based language models, clustering these embeddings and generating topic representations with a class-based TF-IDF procedure to build neural networks. Karas et al. [13] applied the Top2Vec model with doc2vec as the embedding model to extract topics from the subreddit "r/CysticFibrosis." Many studies use Latent Dirichlet Allocation (LDA) because it is popular and simple. For instance, Man et al. [14] used LDA to adapt an HPV transmission model to data on sexual behavior, HPV prevalence, and cervical cancer incidence. They predicted the effects of HPV vaccination on HPV and cancer incidence and the lifetime risk of cervical cancer over 100 years after vaccination. Asmundson et al. [15] replicated a study to examine the factor structure, reliability, and validity of the COVID-19 Incident Scales, showing how topic modeling can reveal fear and anxiety-related distress responses during pandemics. Mental health is a particular area where the importance of emotional and practical support, as well as self-disclosure, has been increasingly acknowledged. Manikonda et al. [16] aimed to understand the language features, content characterization, driving factors, and types of online disinhibition seen in social media, focusing on mental health.
2.2. Social Media for Disaster Relief
Social media, as explained by Kaplan, includes Internet-based applications that are built on the foundations of Web 2.0, allowing the creation and sharing of user-generated content [17]. This term covers platforms like Reddit, Twitter, Flickr, Facebook, and YouTube, which let users communicate and share information and resources. These tools are being used more and more for disaster relief efforts. For example, Gao et al. suggested using social media to create a crowdsourcing platform for emergency services during the 2010 Haiti earthquake [18]. Social media can also be combined with crisis maps to help organizations find places where supplies are needed the most. A 2011 study by the American National Government looked into using social media for disaster recovery, discussing how it can be used, future possibilities, and policy considerations [19]. Twitter, a popular social media platform, works as both a social network and a microblogging service, allowing users to post short messages called tweets. Du et al. suggested a social media-based system to analyze people’s concerns, see how important they are, and track how they change over time [20]. Their study compared the flow of concerns between Twitter and news outlets during the California mountain fires. Other studies have also used social media to engage communities in water resource management [21], coordinate volunteer rescue efforts [22], and predict people’s needs for better extreme weather planning [23]. Lu et al. visualized social media sentiment during extreme weather incidents, exploring trends in positive and negative feelings and their geographical distribution using Twitter data [24]. Additionally, social media can quickly assess damage from extreme weather incidents. Kryvasheyeu et al. developed a multiscale analysis of Twitter activity before, during, and after Hurricane Sandy to monitor and assess the disaster through the spatiotemporal distribution of disaster-related messages [25]. Our work focuses on using social media to understand emotions and incidents extractions, helping policymakers create better plans for disaster management and mitigation.
3. Methods
3.1. Study Design
To analyze the emotional responses to Hurricane Harvey, we meticulously cleaned and processed our collected tweet data at various stages of our pipeline. Initially, we removed emojis, hexadecimal characters, images, special characters, hyperlinks, and irrelevant words. Our data was then deployed in an emotion classification model to categorize tweets into positive, negative, or neutral sentiments. To reduce redundancy, we applied lemmatization, ensuring that words with the same meaning but different forms (e.g., "be," "being," "been") were standardized. We also created a list of English stopwords, common words like "a," "an," and "the" that add little contextual value and removed them from our dataset.
Subsequently, we processed the text data multiple times using an unrefined Latent Dirichlet Allocation (LDA) model, refining our topics by continuously updating our stopwords list. We then calculated the term frequency-inverse document frequency (TF-IDF) score for each token before running a fine-tuned LDA model to identify underlying topics in the tweets. We constructed an LDA model starting with 20 topic components, filtering out tokens that were prevalent in each topic, such as disaster-related terms ("hurricane," "Harvey," "storm"), locations ("Texas," "Houston," "Antonio"), and any remaining unwanted tokens. To minimize overlap between topics and reduce the occurrence of unwanted tokens, the filtering process was repeated, with the initial model serving as a preliminary filtering layer.
Finally, we refined the LDA model by fine-tuning its hyperparameters (the number of topics) to extract specific life incidents more accurately. This process is illustrated in Figure 1.
3.2. Data Pre-Processing and Feature Engineering
Our Hurricane Harvey dataset includes tweets collected from January 11, 2017, to August 29, 2017, and is publicly available on Kaggle [26]. The original dataset contains approximately 400,000 tweets about Hurricane Harvey. After initial filtering, we identified around 98,000 tweets expressing negative emotions. These extracted tweets then underwent data cleaning and text preprocessing to reduce redundancy and remove unwanted keywords for the topic modeling process. Specifically, we eliminated Twitter-specific characters from a defined range of Unicode characters, URLs, and hyperlinks by removing tokens containing "http." This standardization process also involved removing icons such as emojis and hex-images. Lastly, we excluded all single-character tokens from the tweets.
To classify the tweets into three distinct emotion categories, we used a BERT-based model, a Bidirectional Encoder Representations from Transformers (BERT) model with a state-of-the-art pre-built emotion detection capability. This approach resulted in 28 tags, each representing a specific emotion, then later grouping each tweet as positive, negative, or neutral.
3.3. Emotion Prediction and Life Incident Extraction
3.3.1. Text Vectorization
To expedite data processing, we employ Term Frequency-Inverse Document Frequency (TF-IDF). TF-IDF is a widely used text vectorization algorithm that creates a word frequency vector. The term frequency, inverse document frequency, and their product are computed as follows:
Here, denotes the frequency of the word t in document d, and D represents the entire collection of documents. In this study, each document corresponds to a tweet. D is a corpus with a size of N. To princident division by zero when t is absent in d, a value of one is added to the denominator in the formula.
3.3.2. Emotion Prediction Model
Introduced by Devlin et al. in 2019, BERT has achieved widespread recognition and application across various Natural Language Processing (NLP) domains, especially in text classification tasks. Previous studies have highlighted BERT’s superior performance compared to its predecessors in text embedding, particularly in detecting hate speech on social media platforms [27,28,29], performing sentiment analysis [30,31], and functioning as a chatbot [32]. Additionally, BERT has found applications in fields such as education [33], healthcare [34,35], and cybersecurity [36]. These diverse applications demonstrate BERT’s vast potential and its ability to enhance our understanding in an information-rich era.
We utilized the EmoRoBERTa model to analyze the emotions in each tweet. EmoRoBERTa is built on the RoBERTa (Robustly Optimized BERT Approach) framework [37] and trained on the GoEmotions dataset [38], which consists of 58,000 Reddit comments annotated with 28 different emotions. The RoBERTa framework, developed from the original BERT model introduced by Devlin et al. at Google [39], was designed to capture contextual meanings in English text. RoBERTa’s training on a larger dataset enhances its efficiency and competitive performance compared to traditional BERT. EmoRoBERTa leverages transfer learning, inheriting pre-trained word vectors from RoBERTa and adapting them for emotion classification tasks. We implemented this model using the HuggingFace Transformer package, employing a GPU to accelerate processing with a batch size of 8. EmoRoBERTa assigns each tweet a vector score indicating the likelihood of each emotion being associated with that tweet. We then extracted the highest scores from the predicted vectors and the corresponding emotions for each tweet in the Hurricane Harvey dataset. The detailed parameters of the model we used are listed in Table 1.
To meet the input requirements of the EmoRoBERTa model, each sentence was adjusted to a fixed length of 50 tokens, which ensures uniform sequence lengths. Sentences exceeding 50 tokens were truncated, while those with fewer than 50 tokens were padded. The EmoRoBERTa model contains a total of 124,667,164 trainable parameters. We used RobertaTokenizerFast to align the tokens in tweets with the pre-trained words. For the RoBERTa layer, we selected TFRobertMainLayer, which produced 768 output dimensions. These outputs were fed into a fully connected layer with a Gaussian Error Linear Unit (GELU) activation function. We experimented with various activation functions, and GELU showed superior performance compared to the sigmoid, particularly with the GoEmotions dataset. For model evaluation, we chose the macro F1 score due to the uneven distribution of data across emotion tags. There is a significant disparity in the number of documents within higher frequency emotions (such as admiration, approval, and annoyance) compared to lower frequency ones (like relief, pride, and grief).
3.3.3. LDA Topic Modeling Based Life Incident Extraction
[40] demonstrates the technique of Latent Semantic Indexing (LSI) for indexing and retrieval, which helps understand the document’s content by finding the relationship between words and documents. [41] introduced the improvement of LSI, called probabilistic LSI (pLSI), which uses the likelihood method (e.g., Bayes method). The nature of pLSI is to help with finding the words’ models in a document where each word belongs to a specific topic. Both techniques ignore the words’ order in a document. In addition, the problem with time complexity occurs in both techniques, leading to overfitting, which Latent Dirichlet Allocation addressed well [42].
In the details of LDA, we assume that we have a document (d) that contains a set of words. In addition, we have a topic (z) that has several significant keywords (w). Knowing that each word can relate to many topics with various probabilities and that the amount of topics is the LDA parameter.
By estimating the confidential variables (, , ) by calculating the allocation in documents, LDA discovers the topics (Z) of each document and the significant words of each topic.
We define N as the words’ number in document d. Dirichlet prior parameters at the corpus level parameters are and . In addition, we choose the topic of each word from multinomial distribution for each word . We represent as below a word from :
Furthermore, we represent the probability of a corpus as below:
Topics Identification for Optimal Number:
In order to examine the optimal amount of topics for the LDA model, we use Umass coherence score, [43]. This technique estimates the frequency of two words, which are and :
In this equation, denotes the frequency with which and co-occur in the same document, while indicates the number of documents that contain the word . To avoid division by zero, we add a value of 1 to the denominator. The UMass coherence value is calculated as the sum of the top N pre-determined terms. Typically, is much smaller than , which results in a negative UMass score. The quality of the LDA model improves as the UMass score approaches zero. However, adding more topics can increase the score, which leads to topics with very few documents. To mitigate this, we use the elbow method [44], which helps determine the optimal number of topics by identifying the point where the rate of improvement in the UMass coherence score diminishes. After defining the topics, we manually extract the life incidents from the representative terms of each topic.
Life Incident Extraction from the Identified Topics:
After establishing the optimal number of topics for the LDA model, we use a Python-based LDA visualization tool to illustrate each topic and identify the key terms that influence them. This visualization helps us interpret the topics through their distinct sets of keywords. From these common terms, we manually derive themes for the life incidents. Two researchers then review and unanimously agree on the descriptions for these life incidents to finalize the labels. Our focus is specifically on life incidents associated with climate change, which select the most prominent ones within the identified topics for a more detailed analysis.
4. Results
4.1. Emotion Prediction Results
To categorize tweets with emotion tags, we ran the EmoRoBERTa model on a system featuring an Intel i7-11700 processor, 32 GB of RAM, and an NVIDIA RTX 2060 Super. For each tweet, we selected the highest-scoring emotion tag. The whole procedure, encompassing processing and annotation, exceeded 14 hours. In the results, about 280,000 tweets were marked as "neutral." This was expected, as many tweets likely provided updates on Hurricane Harvey’s progress or issued safety warnings. The emotion distribution of the tweets is illustrated in Figure 2.
Negative sentiments, such as "grief," "nervousness," "sadness," and "confusion," were prevalent, reflecting the anxiety and sorrow caused by the hurricane’s devastation. Neutral sentiments, dominated by terms like "realization" and "curiosity," indicate the role of social media in critical updates and factual information. Positive sentiments, including "joy," "gratitude," and "relief," highlight moments of community support, successful rescues, and appreciation for aid efforts.
4.2. Tweets Summary by Emotions
Figure 3.
Overview of all tweets and emotions tweets through out hurricane Harvey.
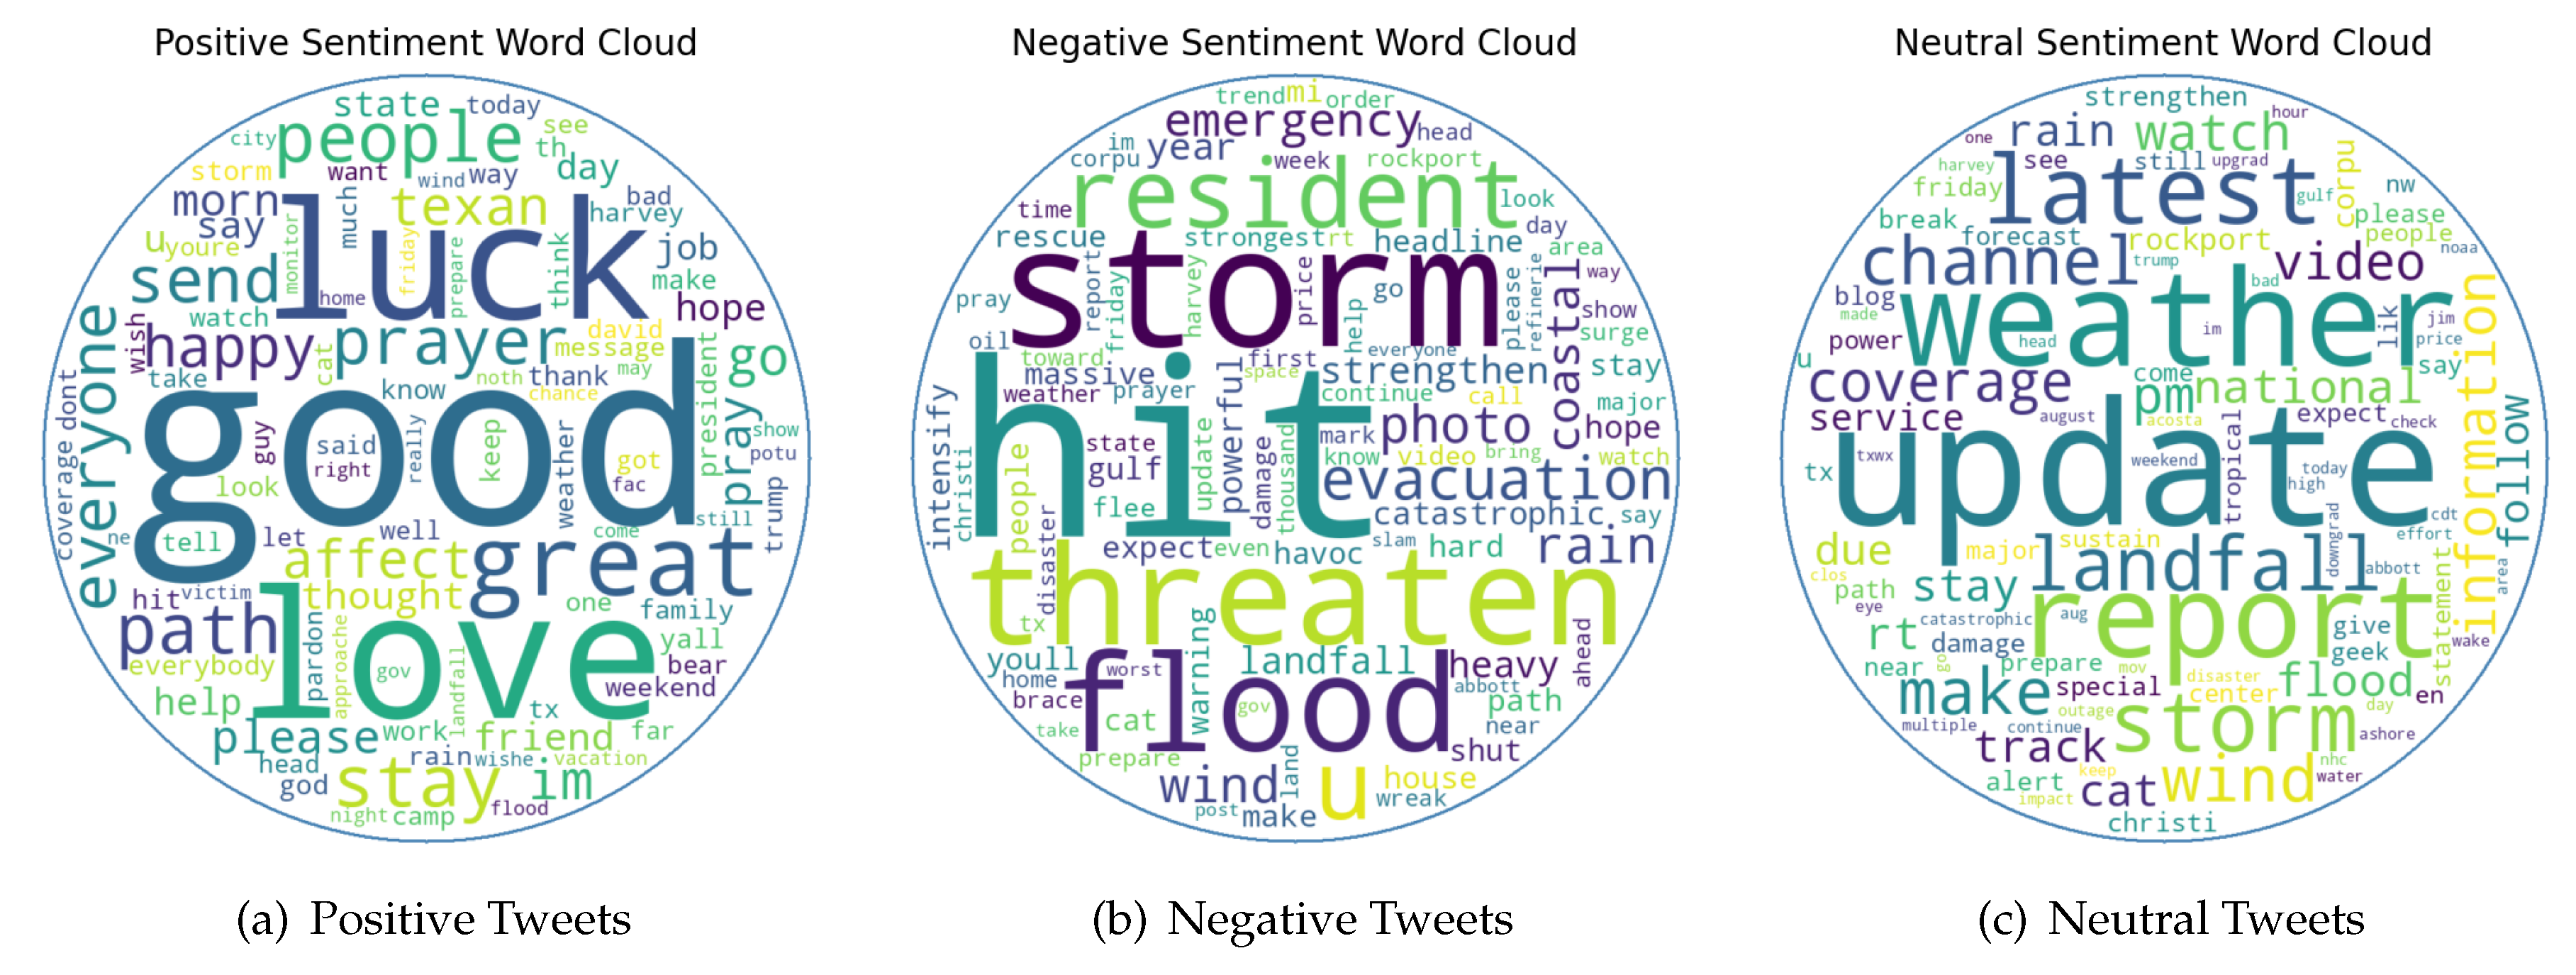

Table 2.
Top 20 Words for Each Sentiment Category in Hurricane Harvey Tweets based on their frequency and relevance in the tweets.
Table 2.
Top 20 Words for Each Sentiment Category in Hurricane Harvey Tweets based on their frequency and relevance in the tweets.
| Positive | Neutral | Negative |
|---|---|---|
| good | update | hit |
| love | weather | storm |
| luck | report | threaten |
| great | latest | flood |
| stay | storm | resident |
| people | landfall | u |
| path | channel | evacuation |
| prayer | wind | photo |
| send | make | rain |
| everyone | information | wind |
| happy | coverage | emergency |
| im | watch | coastal |
| texan | pm | strengthen |
| go | video | year |
| affect | national | heavy |
| safe | hurricane | warning |
| wonderful | track | horrible |
| blessed | system | damage |
| joy | gov | destruction |
| support | cnn | disaster |
The positive sentiment word cloud prominently features words such as “love,” “great,” “happy,” “good,” “wonderful,” “blessed,” “safe,” and “joy.” These words reflect a general sense of optimism and positivity among Twitter users. The presence of “love” and “happy” suggests expressions of care, solidarity, and relief, possibly directed toward successful rescue operations or the safety of loved ones. These words indicate that amidst the challenges posed by the hurricane, people found moments of emotional support and happiness. The terms “great” and “good” highlight commendations and satisfaction for the effective response by emergency services or the supportive actions taken by the community. In addition, this suggests that users acknowledged and appreciated the efforts made to mitigate the disaster’s impact and ensure public safety. The word “wonderful” conveys a strong sense of positivity, which might be related to successful evacuations, community support, or the resilience shown by individuals during the crisis. The appearance of “blessed” reflects a deep sense of gratitude and thankfulness, which might be in response to avoided dangers, received help, or the overall sense of being protected during the storm. This sentiment is crucial as it underscores the human aspect of the disaster response which helps with highlighting moments of kindness and support that were experienced. “Safe” and “joy” further emphasize the positive outcomes and feelings of security that were felt despite the adverse conditions. These words suggest that people were able to find comfort and happiness in the safety of their surroundings or in the knowledge that their loved ones were unharmed. In general, the positive sentiment word cloud reveals a prevailing sentiment of appreciation, relief, and encouragement, reflecting the community’s resilience and the successful measures taken to ensure safety and support. The positive emotions captured in these tweets highlight the human capacity to find light even in the darkest times, celebrating the small victories and the collective strength of the community.
In contrast, the primary negative words appearing in the negative sentiment word cloud were “storm,” “hit,” “resident,” “threaten,” “flood,” “wind,” “emergency,” “evacuation,” “intensify,” “photo,” “heavy,” “havoc,” “massive,” “coastal,” and “warning.” This suggests a widespread anxiety among Twitter users regarding the impending danger of the storm striking residential zones, the significant flooding, and the fierce winds anticipated to cause extensive damage. Words like “emergency” and “evacuation” highlight the urgency and need for prompt measures to ensure safety. Additionally, terms such as “intensify” and “heavy” underscore the severe conditions linked to the storm, which relates the potential for chaos and destruction. The use of “photo” indicates that users were likely sharing images depicting the damage or seeking vital information to assist in rescue and safety efforts. The word “resident” underscores the focus on individuals affected by the storm, emphasizing the human impact and the community’s reaction. Recurrent words like “coastal” and “warning” point to an increased awareness of the most vulnerable areas and the necessary precautions to lessen damage. This sentiment highlights the public’s concern about the storm’s effects on property, infrastructure, and the welfare of those impacted.In general, the negative sentiment word cloud reflects the serious and potentially hazardous nature of the storm, emphasizing the need for preparedness and effective action from emergency responders.
The neutral sentiment word cloud includes frequently mentioned words such as “update,” “news,” “information,” “report,” and “weather.” These terms indicate a strong focus on the reception of factual updates related to the hurricane. Words like “update” and “news” highlight the continuous flow of information being shared, possibly regarding the storm’s progress, safety advisories, or logistical details about relief efforts. This suggests that users were keen on staying informed and ensuring that others were kept up-to-date with the latest developments. “Information” and “report” suggest a reliance on structured communication and official sources to provide clarity and accuracy about the situation. These terms indicate that the public valued credible information to understand the unfolding incidents and make informed decisions. The prominence of these words shows that during the hurricane, there was a high demand for reliable data and transparent reporting to navigate the crisis effectively. The word “weather” underscores the central topic of interest, which reflects the discussions around meteorological conditions, forecasts, and the impact of the hurricane. This term likely encompassed a range of updates from weather forecasts to real-time reports on the storm’s intensity and path. The focus on weather indicates that people were closely monitoring the environmental conditions to prepare and respond appropriately. Additionally, the neutral sentiment word cloud may include words like “map,” “location,” “update,” “timeline,” “details,” and “status,” which further emphasizing the need for precise information. These words show that users were interested in the spatial aspects of the hurricane to understand its trajectory to better protect themselves and their communities. The neutral sentiment word cloud indicates that the primary focus among users was on receiving and sharing objective updates and essential information. The neutral sentiments captured in these tweets highlight the critical role of communication and information dissemination during a disaster. By staying informed, people were able to make timely decisions, coordinate their responses, and support each other through the crisis. The emphasis on neutrality and factual information underscores the importance of clarity and accuracy in managing public perception and response during emergencies.
4.3. Emotions Distribution and Evolution
Figure 4 show the number of tweets for each emotion tag and how these emotions changed over time. In Figure 4, ’caring’ was the most common emotion in tweets about this natural disaster for most of the time. ’Caring’ increased a lot between August 24, closely followed by ’curiosity’ and ’fear.’ By noon on August 25, ’curiosity’ became more common than ’fear’ and stayed that way. On August 26, many Twitter users felt ’surprise,’ which was almost as common as ’fear,’ the third most common emotion. But the data for this day also showed a mix of emotions, with ’anger,’ ’disgust,’ ’annoyance,’ ’disappointment,’ and ’disapproval’ showing frustration with how local, state, and federal agencies, as well as neighbors and fellow residents, handled evacuation and safety measures. The four phases of emergency management by FEMA and other agencies—mitigation, preparedness, response, and recovery—highlight the importance of understanding public feelings before, during, and after a disaster. This understanding is crucial for evaluating the performance of emergency agencies at all levels of government and for non-profit efforts.
From this line plot, we can tell that users were mostly caring, fearful, and curious as the disaster approached. While most people continued to show care, there was also a lot of curiosity about the hurricane’s path and the status of life and property, which are common concerns during such incidents. Additionally, some people felt surprise and negative emotions during and after the hurricane’s landfall. This shows that many were unhappy with the speed, effectiveness, and overall performance of the disaster response efforts. As people understood what had happened and news reports kept coming in, the main feelings during the early recovery phase were ’caring,’ ’curiosity,’ ’sadness,’ and ’fear.’ Although ’disgust’ and ’disappointment’ were also present, they were less common compared to the main emotions, which matched the community’s effort to recover after the disaster.
4.4. Life Incident Extraction Results
To find the best number of topics for our Latent Dirichlet Allocation (LDA) model, we used the scikit-learn library with a learning rate of 0.7 [45]. We created several LDA models, changing the number of topics from 20 to 70 in steps of 5. Then, evaluation is done via comparing UMass coherence score [43] for selection of optimal number of topics in datasets. Figure 5 shows an example of selection of optimal number of topics for negative sentiment. At 55 topics, we noticed a big drop in the improvement rate of the UMass score, suggesting that 55 topics is the best number for our LDA model. There is a minor improvement at 65 topics but it causes more computing resources. Thus, we chose 55 topics for the final version of our LDA model. Similarly, we get 30 toics for neutral sentiments and 20 topics for positive sentiments.
Having determined these optimal topic numbers, we manually identified life incidents and their representative terms for each sentiment category. This involved naming the life incidents represented by each topic and selecting representative terms from the most frequently occurring terms within each topic. To ensure consistency and accuracy, two researchers independently reviewed and named the life incidents and representative terms. Disagreements were resolved through discussion and mutual consensus, with new definitions being proposed and agreed upon before finalizing the terms. This process ensured that our extracted life incidents and their representative terms accurately reflected the data for each sentiment category.
Life Incidents Insight Analysis
The extracted life incidents and their associated terms are listed in Table 3, Table 4 and Table 5 representing negative, neutral, and positive sentiments, respectively. These tables, having 20 topics each as examples, present a lexicon defining life incidents, which include both psychosocial and incident-focused aspects. The negative sentiment analysis highlights various life incidents derived from the context of Hurricane Harvey, emphasizing the community’s challenges and the emotional toll during the disaster. Psychosocial life incidents include ’Care of Family & Friend,’ ’Safety Update,’ and ’Climate Change Policy,’ emphasizing social bonds, the importance of timely information, and discussions on broader climate concerns. Incident-focused life incidents, such as ’Evacuation Plan,’ ’Concerns for Animals,’ ’Flood,’ ’Danger,’ ’Warnings,’ ’Response,’ and ’Heavy Rain,’ reflect structured efforts to manage evacuations, provide necessary aid, and address immediate threats. These incidents highlight the severe impact of flooding, the importance of accurate information, and the community’s compassionate response to safeguarding animals. Life incidents like ’Oil and Gas Price Rise’ underscore the economic impact of disasters on fuel prices, while ’Fake News’ addresses the spread of misinformation, emphasizing the need for accurate reporting. ’Praying’ reflects the community’s emotional responses and personal actions during the disaster. ’Catastrophe,’ ’Evacuation News,’ ’Landfall Preparedness,’ ’Mindsets,’ and ’Downgrade’ emphasize the severe impact of the hurricane and the need for significant recovery efforts and adjustments to threat levels.
Table 4 lists the extracted life incidents and their associated terms for neutral sentiment. This table presents a lexicon defining various factual life incidents, focusing on updates, reports, and objective information without strong emotional connotations. For example, ’Updated Report’ includes terms such as "report," "update," "video," and "track," highlighting the emphasis on providing updated information and tracking developments. ’Weather Update’ reflects the neutral reporting and dissemination of weather-related information with terms like "weather," "update," and "report." Life incidents such as ’Channel,’ ’Statement,’ ’Hurricane Report,’ ’Weather Channel,’ and ’Updates’ emphasize the role of media in reporting events, official statements, and the continuous flow of the latest information and developments. These incidents highlight the importance of accurate and timely information during the disaster. ’National Updates,’ ’Weather Report,’ ’Statement Report,’ ’Latest Information,’ ’Damages Updates,’ ’Latest Report,’ ’Landfall Updates,’ ’Storm Report,’ ’Safety Statement,’ and ’Alerts’ focus on providing detailed and accurate information, national-level updates, forecasts, and official safety statements. These neutral life incidents are crucial for effective communication, preparedness, and response strategies.
The extracted life incidents and their associated terms for positive sentiment are listed in Table 5. This table defines various positive life incidents, emphasizing psychosocial aspects and positive outcomes. Psychosocial life incidents include ’Great Day,’ ’Relief,’ and ’happy Friday,’ reflecting sentiments of positivity, happiness, and gratitude that form an essential part of the community’s morale. Positive interactions, support, and expressions of gratitude are highlighted in life incidents such as ’Great Day,’ ’Relief,’ ’Happy Friday,’ ’Luck,’ ’Good Coverage,’ ’Wishes,’ ’Farewell,’ and ’Good Vacation.’ These incidents emphasize the community’s appreciation for pleasant days, companionship, support, effective communication, and well-wishes. Life incidents like ’Great Government,’ ’Good Job/Help,’ ’Helping,’ ’Good Camp,’ ’Prayer,’ ’Good Message,’ ’Blessing,’ ’Birthday,’ ’Good Luck,’ ’Happy Weekend,’ ’Wind,’ and ’Praying’ highlight the community’s resilience, gratitude, spiritual support, and positive communication. These incidents reflect the community’s support efforts for victims, positive experiences, and the importance of celebrations and special occasions.
In conclusion, the combined analysis of negative, neutral, and positive life incidents provides a comprehensive understanding of the community’s challenges, factual information, and positive interactions during and after Hurricane Harvey. Monitoring these life incidents is vital for organizations like FEMA and state agencies to improve their preparedness, response, and recovery efforts, and to foster positivity and support during disaster response and recovery efforts.
5. Limitation
We recognize specific limitations in our study. Firstly, the information is self-reported by Twitter users, which might introduce biases towards socially desirable responses. Secondly, focusing only on Twitter data might not fully capture the emotional well-being of people across various online platforms or in real life, which limits how broadly our results can be applied. This research shows our ability to get insights from a limited dataset, but future work will involve using larger, more comprehensive datasets related to climate change life incidents. Additionally, manually identifying life incidents based on major themes discussed on social media may introduce human bias and depend heavily on the identified themes, potentially overlooking less frequently discussed life incidents. To address this, we will need more extensive disaster datasets and objective methods for extracting life incidents. Further validation through interviews or surveys will help confirm our findings. Lastly, more research is needed to better understand the benefits and limitations of using social media for assessing emotional health and extracting life incidents during disaster event. Specifically, younger people may use Twitter more frequently than older adults, and our data is solely related to hurricanes, which could introduce bias. Our findings might vary across different age groups or types of disasters, such as earthquakes and heatwaves. A broader disaster dataset is necessary to address these issues effectively.
6. Conclusion
This paper presents a case study on predicting public emotions and identifying life incidents using tweets from Hurricane Harvey. We use a BERT-based model for emotion prediction and LDA topic modeling to identify life incidents. Unlike existing studies that apply NLP techniques on social media data to examine the mental health impacts of climate change, our study specifically targets emotions and life incidents during disaster rather than general mental health conditions. The results show that various life incidents influence the emotions expressed by people during the hurricane. This research highlights the potential of using NLP techniques and readily available social media data to investigate emotional health and identify life incidents.We aim for our findings to offer critical insights for healthcare professionals and policymakers, aiding them in addressing emotional health and life incident needs to formulate thorough disaster management strategies.
In future research, we intend to expand the algorithm to encompass various types of disasters and create a broad lexicon for the automatic identification of life incidents during disasters. This will mitigate the constraints of manual extraction, facilitating the automated monitoring of disaster impacts on daily life and emotional well-being.
Author Contributions
Thomas Hoang: Methodology, formal analysis, software, project administration, writing, and editing. Quynh Anh Nguyen: Software, formal analysis, writing and editing. Long Nguyen: Conceptualization, writing review, editing, supervision, funding acquisition, and project administration. All authors have read and agreed to the published version of the manuscript.
Funding
This work was partially supported by NSF - USA CNS-2219614 and CNS-2302274.
Data Availability Statement
Source code and data is available at https://github.com/litpuvn/event-extraction-disaster (Accessed Date: July 21, 2024).
Conflicts of Interest
The authors declare no conflict of interest.
References
- Amadeo, K. Hurricane Harvey facts, damage and costs. The Balance 2018. [Google Scholar]
- Cooper, S.; Hutchings, P.; Butterworth, J.; Joseph, S.; Kebede, A.; Parker, A.; Terefe, B.; Van Koppen, B. Environmental associated emotional distress and the dangers of climate change for pastoralist mental health. Global Environmental Change 2019, 59, 101994. [Google Scholar] [CrossRef]
- Aihara, Y.; Shrestha, S.; Sharma, J. Household water insecurity, depression and quality of life among postnatal women living in urban Nepal. Journal of water and health 2016, 14, 317–324. [Google Scholar] [CrossRef] [PubMed]
- Stevenson, E.G.; Greene, L.E.; Maes, K.C.; Ambelu, A.; Tesfaye, Y.A.; Rheingans, R.; Hadley, C. Water insecurity in 3 dimensions: an anthropological perspective on water and women’s psychosocial distress in Ethiopia. Social science & medicine 2012, 75, 392–400. [Google Scholar]
- Ojala, M. Young people and global climate change: Emotions, coping, and engagement in everyday life. Geographies of global issues: Change and threat 2016, 8, 1–19. [Google Scholar]
- Friedrich, E.; Wüstenhagen, R. Leading organizations through the stages of grief: The development of negative emotions over environmental change. Business & society 2017, 56, 186–213. [Google Scholar]
- Hickman, C.; Marks, E.; Pihkala, P.; Clayton, S.; Lewandowski, R.E.; Mayall, E.E.; Wray, B.; Mellor, C.; van Susteren, L. Climate anxiety in children and young people and their beliefs about government responses to climate change: A global survey. The Lancet Planetary Health 2021, 5. [Google Scholar] [CrossRef]
- Bui, T.; Hannah, A.; Madria, S.; Nabaweesi, R.; Levin, E.; Wilson, M.; Nguyen, L. Emotional Health and Climate-Change-Related Stressor Extraction from Social Media: A Case Study Using Hurricane Harvey. Mathematics 2023, 11. [Google Scholar] [CrossRef]
- Ramos, J. Using tf-idf to determine word relevance in document queries. Proceedings of the first instructional conference on machine learning. Citeseer, 2003, Vol. 242, pp. 29–48.
- Blei, D.M.; Lafferty, J.D. Topic models. Text mining: classification, clustering, and applications 2009, 10, 34. [Google Scholar]
- Grassia, M.G.; Marino, M.; Mazza, R.; Misuraca, M.; Stavolo, A. Topic modeling for analysing the Russian propaganda in the conflict with Ukraine. ASA 2022, 2023; 245. [Google Scholar]
- Grootendorst, M. BERTopic, Topic Modeling with a class-base for TF-IDF procedure. Frontiers in Sociology 2022. [Google Scholar]
- Karas, B.; Qu, S.; Xu, Y.; Zhu, Q. Experiments with LDA and Top2Vec for embedded topic discovery on social media data—A case study of cystic fibrosis. Frontiers in Artificial Intelligence 2022, 5, 948313. [Google Scholar] [CrossRef]
- Man, I.; Georges, D.; de Carvalho, T.M.; Saraswati, L.R.; Bhandari, P.; Kataria, I.; Siddiqui, M.; Muwonge, R.; Lucas, E.; Berkhof, J.; others. Evidence-based impact projections of single-dose human papillomavirus vaccination in India: a modelling study. The Lancet Oncology 2022, 23, 1419–1429. [Google Scholar] [CrossRef] [PubMed]
- Asmundson, G.J.; Taylor, S. Coronaphobia: Fear and the 2019-nCoV outbreak. Journal of anxiety disorders 2020, 70, 102196. [Google Scholar] [CrossRef] [PubMed]
- Manikonda, L. Analysis and Decision-Making with Social Media; Arizona State University, 2019.
- Kaplan, A.M. Social Media, Definition, and History. In Encyclopedia of Social Network Analysis and Mining; Alhajj, R., Rokne, J., Eds.; Springer New York: New York, NY, 2018; pp. 2662–2665. [Google Scholar] [CrossRef]
- Gao, H.; Barbier, G.; Goolsby, R. Harnessing the crowdsourcing power of social media for disaster relief. IEEE intelligent systems 2011, 26, 10–14. [Google Scholar] [CrossRef]
- Lindsay, B.R. Social Media and Disasters: Current Uses, Future Options, and Policy Considerations. Technical report, Library of Congress. Congressional Research Service, 2011.
- Du, H.; Nguyen, L.; Yang, Z.; Abu-Gellban, H.; Zhou, X.; Xing, W.; Cao, G.; Jin, F. Twitter vs news: Concern analysis of the 2018 california wildfire event. 2019 IEEE 43rd Annual Computer Software and Applications Conference (COMPSAC). IEEE, 2019, Vol. 2, pp. 207–212.
- Nguyen, L.H.; Hewett, R.; Namin, A.S.; Alvarez, N.; Bradatan, C.; Jin, F. Smart and connected water resource management via social media and community engagement. 2018 IEEE/ACM International Conference on Advances in Social Networks Analysis and Mining (ASONAM). IEEE, 2018, pp. 613–616.
- Yang, Z.; Nguyen, L.; Zhu, J.; Pan, Z.; Li, J.; Jin, F. Coordinating disaster emergency response with heuristic reinforcement learning. 2020 IEEE/ACM International Conference on Advances in Social Networks Analysis and Mining (ASONAM). IEEE, 2020, pp. 565–572.
- Nguyen, L.; Yang, Z.; Li, J.; Pan, Z.; Cao, G.; Jin, F. Forecasting people’s needs in hurricane events from social network. IEEE Transactions on Big Data 2019, 8, 229–240. [Google Scholar] [CrossRef]
- Lu, Y.; Hu, X.; Wang, F.; Kumar, S.; Liu, H.; Maciejewski, R. Visualizing social media sentiment in disaster scenarios. Proceedings of the 24th international conference on world wide web, 2015, pp. 1211–1215.
- Kryvasheyeu, Y.; Chen, H.; Obradovich, N.; Moro, E.; Van Hentenryck, P.; Fowler, J.; Cebrian, M. Rapid assessment of disaster damage using social media activity. Science advances 2016, 2, e1500779. [Google Scholar] [CrossRef] [PubMed]
- Hurricane Harvey Tweets. https://www.kaggle.com/datasets/dan195/hurricaneharvey, 2017 (Accessed Aug 06, 2023).
- Hind Saleh, A.A.; Moria, K. Detection of Hate Speech using BERT and Hate Speech Word Embedding with Deep Model. Applied Artificial Intelligence 2023, 37, 2166719. [Google Scholar] [CrossRef]
- Gupta, S.; Lakra, S.; Kaur, M. Study on BERT Model for Hate Speech Detection. 2020 4th International Conference on Electronics, Communication and Aerospace Technology (ICECA), 2020, pp. 1–8. [CrossRef]
- D’Sa, A.G.; Illina, I.; Fohr, D. BERT and fastText Embeddings for Automatic Detection of Toxic Speech. 2020 International Multi-Conference on: “Organization of Knowledge and Advanced Technologies” (OCTA), 2020, pp. 1–5. [CrossRef]
- Hoang, M.; Bihorac, O.A.; Rouces, J. Aspect-Based Sentiment Analysis using BERT. Proceedings of the 22nd Nordic Conference on Computational Linguistics; Hartmann, M., Plank, B., Eds.; Linköping University Electronic Press: Turku, Finland, 2019; pp. 187–196. [Google Scholar]
- Pota, M.; Ventura, M.; Catelli, R.; Esposito, M. An Effective BERT-Based Pipeline for Twitter Sentiment Analysis: A Case Study in Italian. Sensors 2021, 21. [Google Scholar] [CrossRef]
- Gu, J.C.; Li, T.; Liu, Q.; Ling, Z.H.; Su, Z.; Wei, S.; Zhu, X. Speaker-Aware BERT for Multi-Turn Response Selection in Retrieval-Based Chatbots. Proceedings of the 29th ACM International Conference on Information & Knowledge Management; Association for Computing Machinery: New York, NY, USA, 2020; CIKM’20; pp. 2041–2044. [Google Scholar] [CrossRef]
- Xu, Z.; Zhu, P. Using BERT-Based Textual Analysis to Design a Smarter Classroom Mode for Computer Teaching in Higher Education Institutions. International Journal of Emerging Technologies in Learning (iJET) 2023, 18, 114–127. [Google Scholar] [CrossRef]
- To, Q.G.; To, K.G.; Huynh, V.A.N.; Nguyen, N.T.Q.; Ngo, D.T.N.; Alley, S.J.; Tran, A.N.Q.; Tran, A.N.P.; Pham, N.T.T.; Bui, T.X.; Vandelanotte, C. Applying Machine Learning to Identify Anti-Vaccination Tweets during the COVID-19 Pandemic. International Journal of Environmental Research and Public Health 2021, 18. [Google Scholar] [CrossRef] [PubMed]
- Zhu, J.; Weng, F.; Zhuang, M.; Lu, X.; Tan, X.; Lin, S.; Zhang, R. Revealing Public Opinion towards the COVID-19 Vaccine with Weibo Data in China: BertFDA-Based Model. International Journal of Environmental Research and Public Health 2022, 19. [Google Scholar] [CrossRef] [PubMed]
- Rahali, A.; Akhloufi, M.A. MalBERT: Using Transformers for Cybersecurity and Malicious Software Detection, 2021, [arXiv:cs.CR/2103.03806].
- Liu, Y.; Ott, M.; Goyal, N.; Du, J.; Joshi, M.; Chen, D.; Levy, O.; Lewis, M.; Zettlemoyer, L.; Stoyanov, V. Roberta: A robustly optimized bert pretraining approach. arXiv preprint arXiv:1907.11692 2019.
- Demszky, D.; Movshovitz-Attias, D.; Ko, J.; Cowen, A.; Nemade, G.; Ravi, S. GoEmotions: A Dataset of Fine-Grained Emotions, 2020, [arXiv:cs.CL/2005.00547].
- Devlin, J.; Chang, M.W.; Lee, K.; Toutanova, K. BERT: Pre-training of Deep Bidirectional Transformers for Language Understanding, 2019, [arXiv:cs.CL/1810.04805].
- Chen, T.H.; Thomas, S.W.; Hassan, A.E. A survey on the use of topic models when mining software repositories. Empirical Software Engineering 2016, 21, 1843–1919. [Google Scholar] [CrossRef]
- Hofmann, T. Probabilistic latent semantic indexing. Proceedings of the 22nd annual international ACM SIGIR conference on Research and development in information retrieval, 1999, pp. 50–57.
- Blei, D.M.; Ng, A.Y.; Jordan, M.I. Latent dirichlet allocation. Journal of machine Learning research 2003, 3, 993–1022. [Google Scholar]
- Mimno, D.; Wallach, H.M.; Talley, E.; Leenders, M.; McCallum, A. Optimizing Semantic Coherence in Topic Models. Proceedings of the Conference on Empirical Methods in Natural Language Processing; Association for Computational Linguistics: USA, 2011; EMNLP’11; pp. 262–272. [Google Scholar]
- Thorndike, R. Who belongs in the family? Psychometrika 1953, 18, 267–276. [Google Scholar] [CrossRef]
- Pedregosa, F.; Varoquaux, G.; Gramfort, A.; Michel, V.; Thirion, B.; Grisel, O.; Blondel, M.; Prettenhofer, P.; Weiss, R.; Dubourg, V.; Vanderplas, J.; Passos, A.; Cournapeau, D.; Brucher, M.; Perrot, M.; Duchesnay, E. Scikit-learn: Machine Learning in Python. Journal of Machine Learning Research 2011, 12, 2825–2830. [Google Scholar]
Figure 1.
Overview of the research framework for climate change related life incidents extraction.
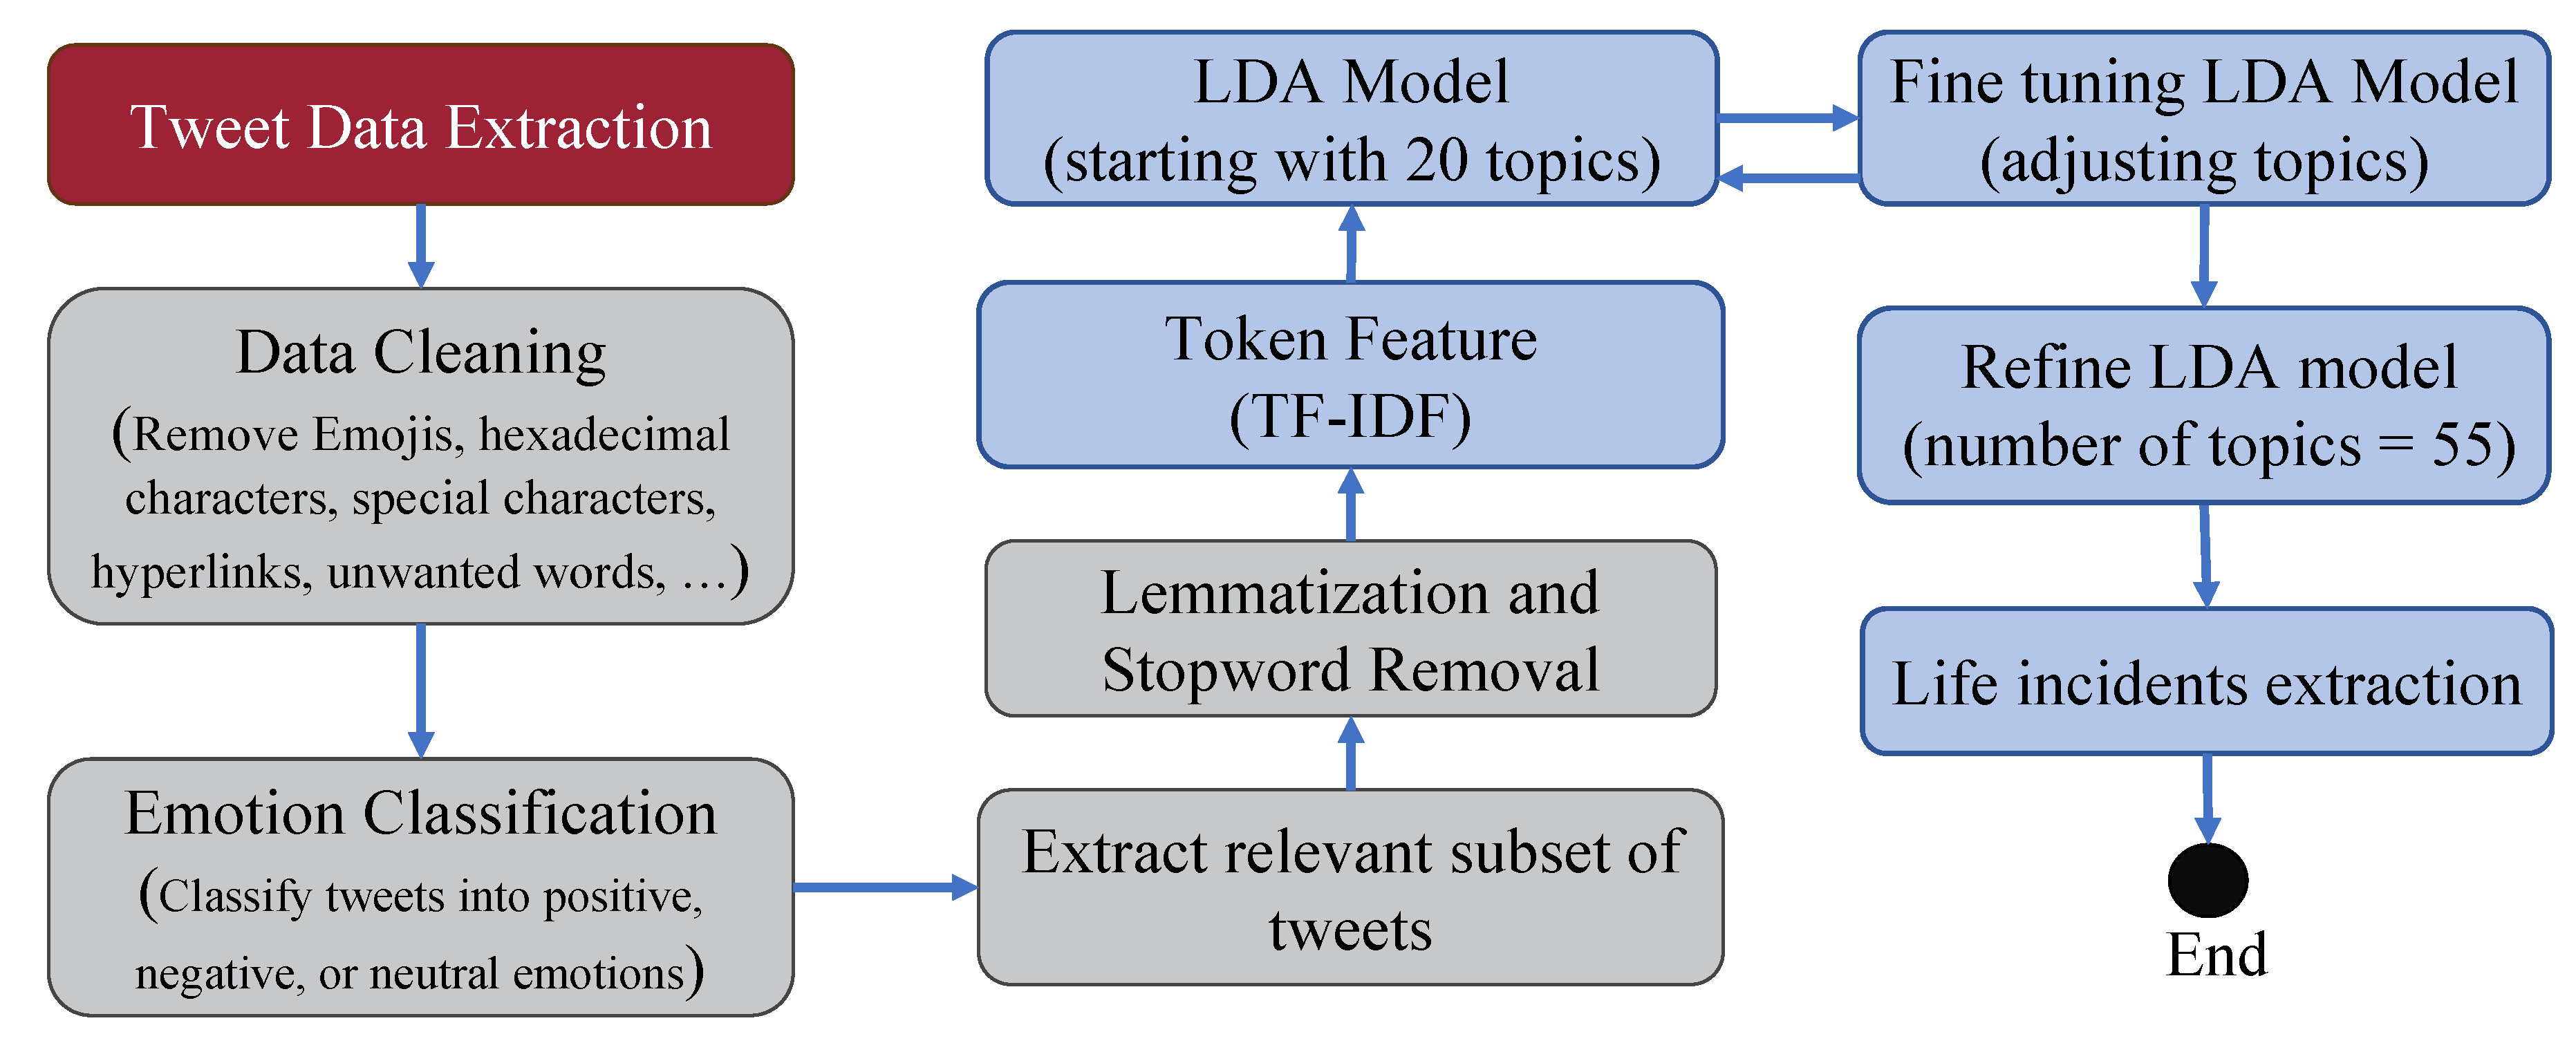
Figure 2.
Distribution of predicted emotion tags in the hurricane Harvey dataset.
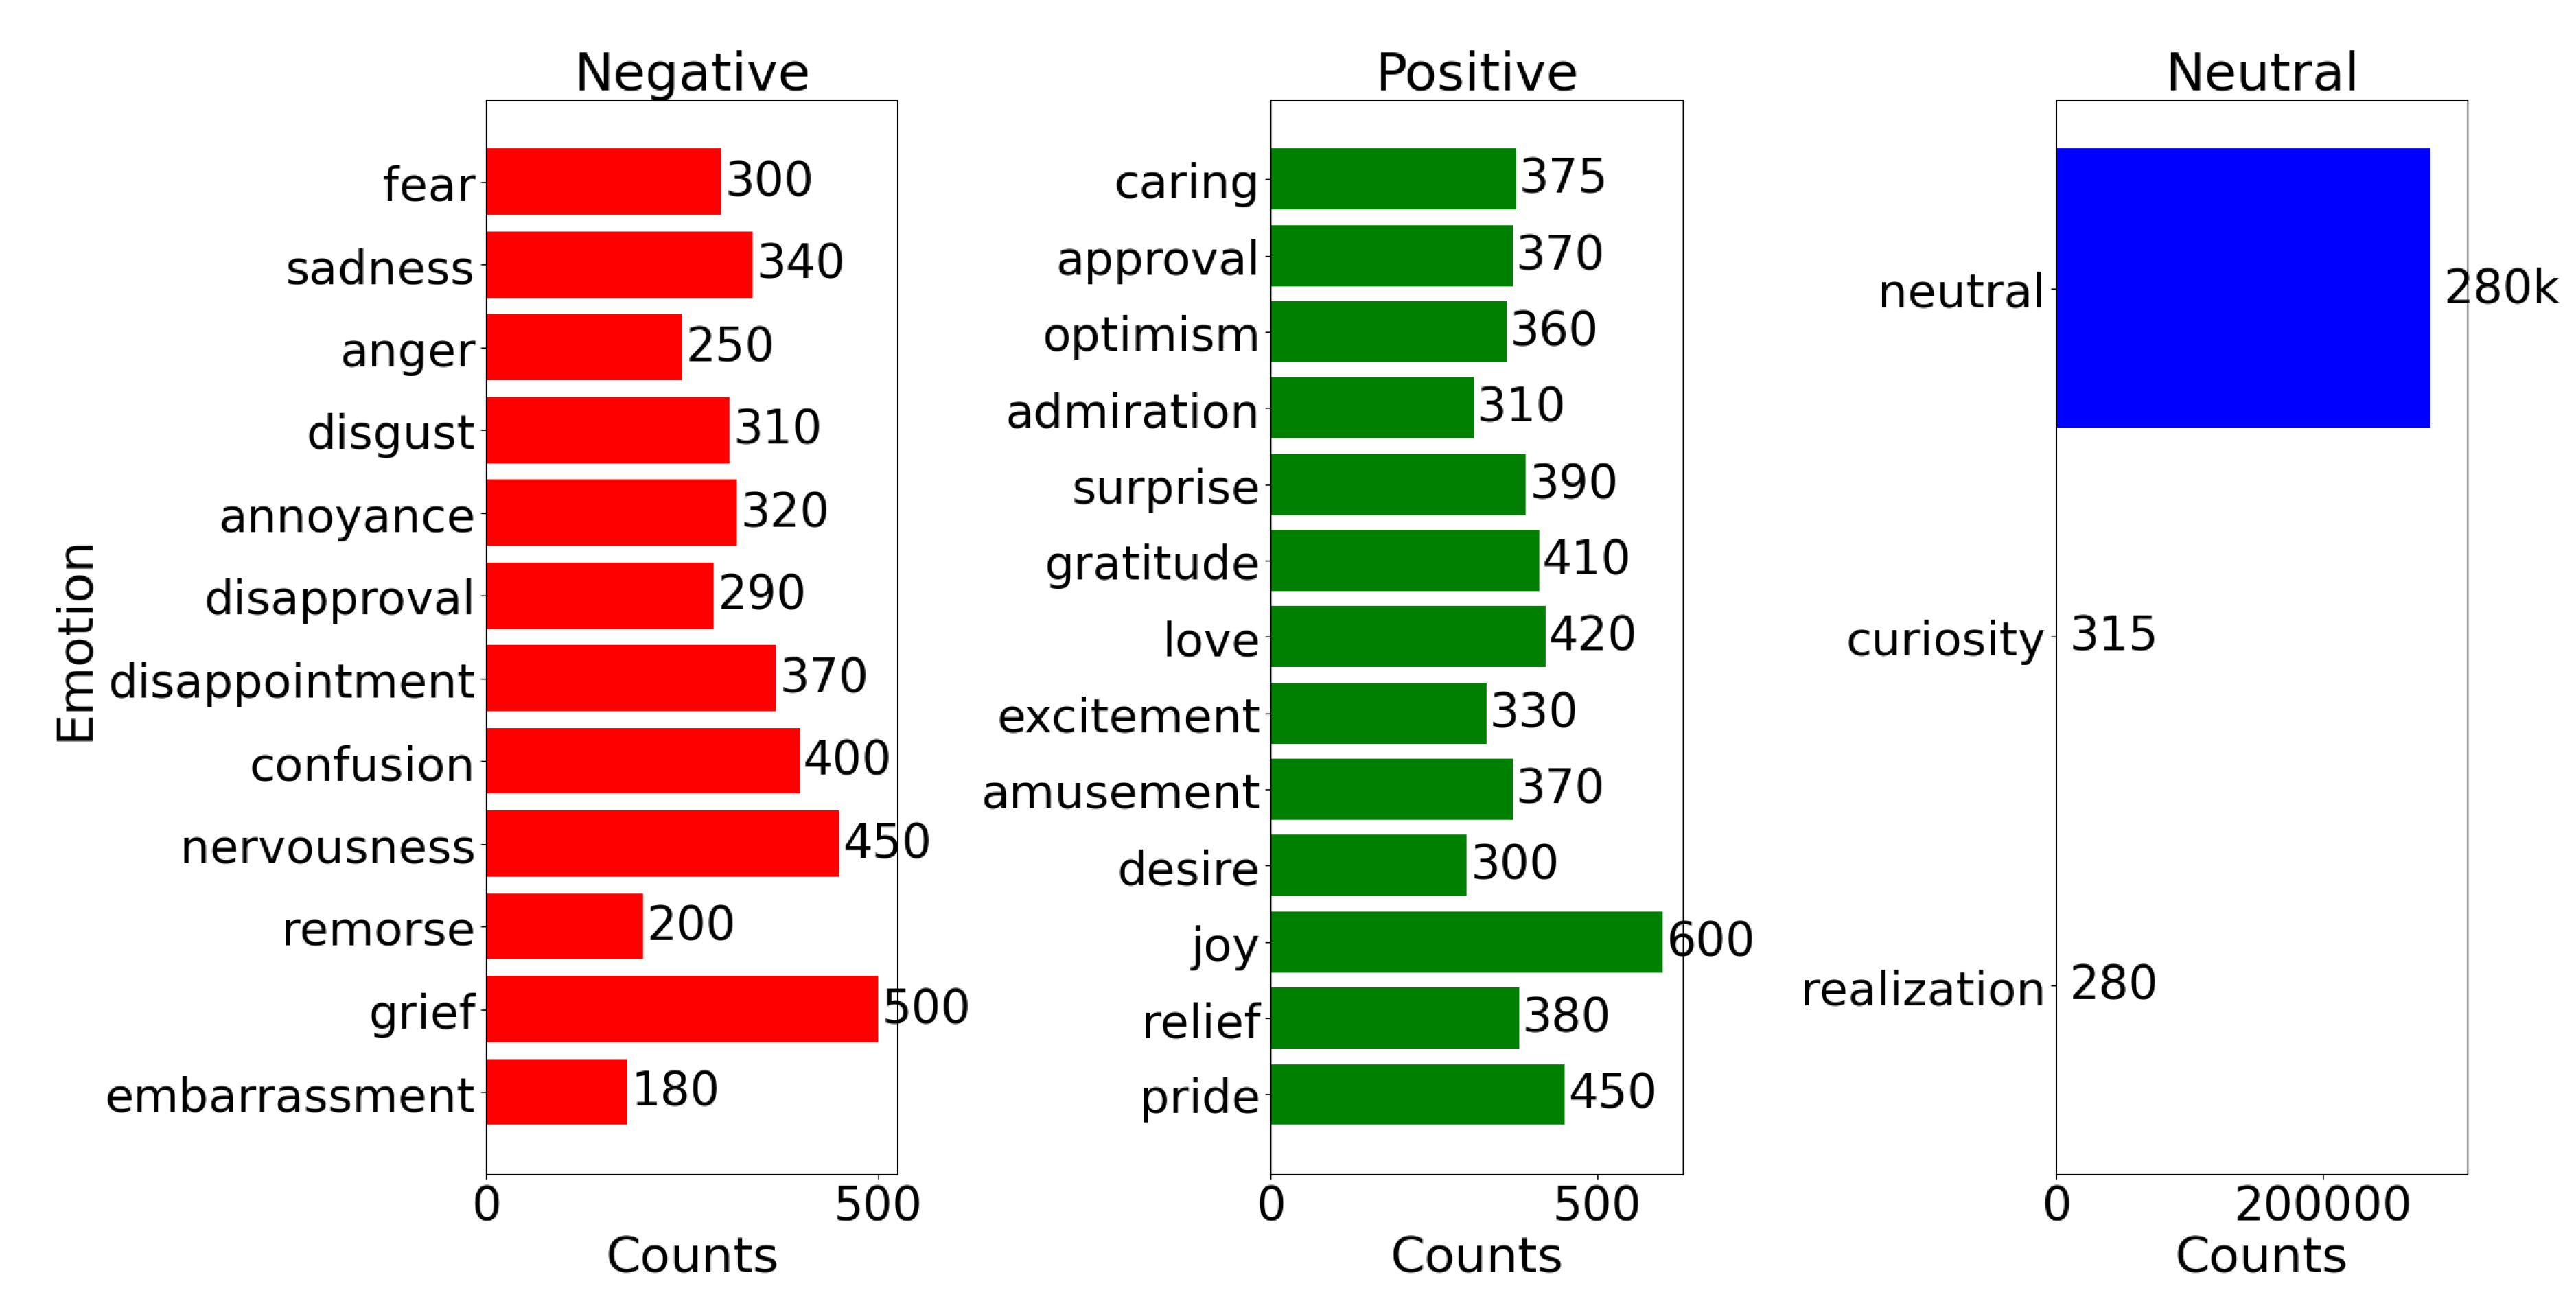
Figure 4.
Trend of public emotions during hurricane Harvey.
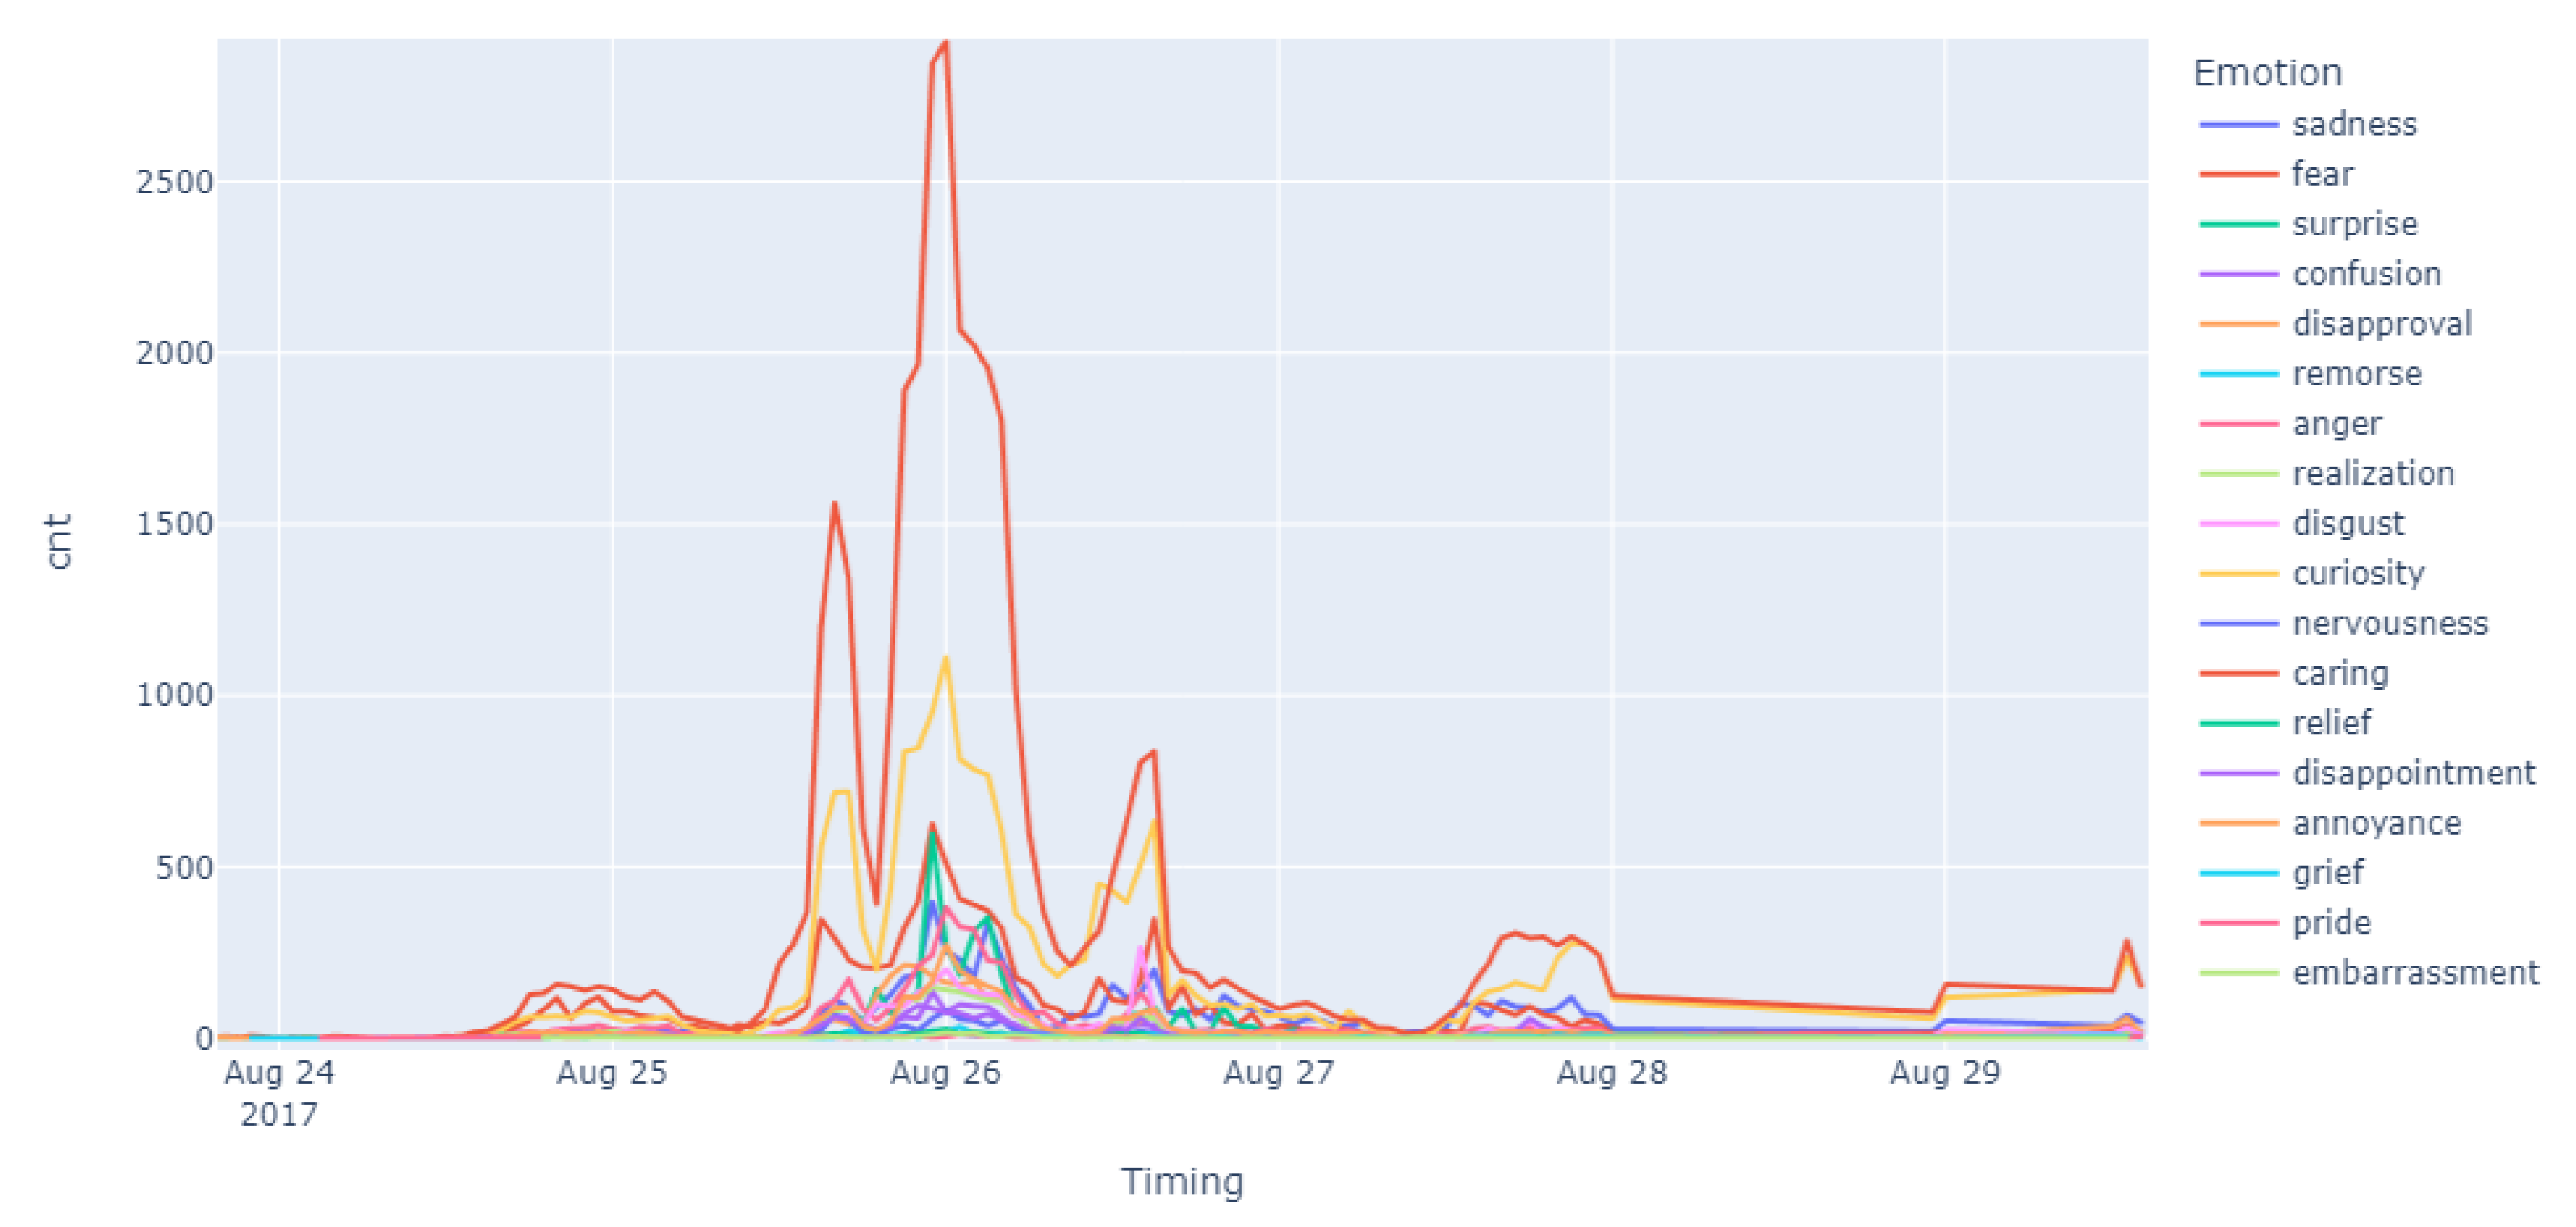
Figure 5.
Number of Topics for LDA topic modeling and life incidents extraction for negative sentiments.
Figure 5.
Number of Topics for LDA topic modeling and life incidents extraction for negative sentiments.
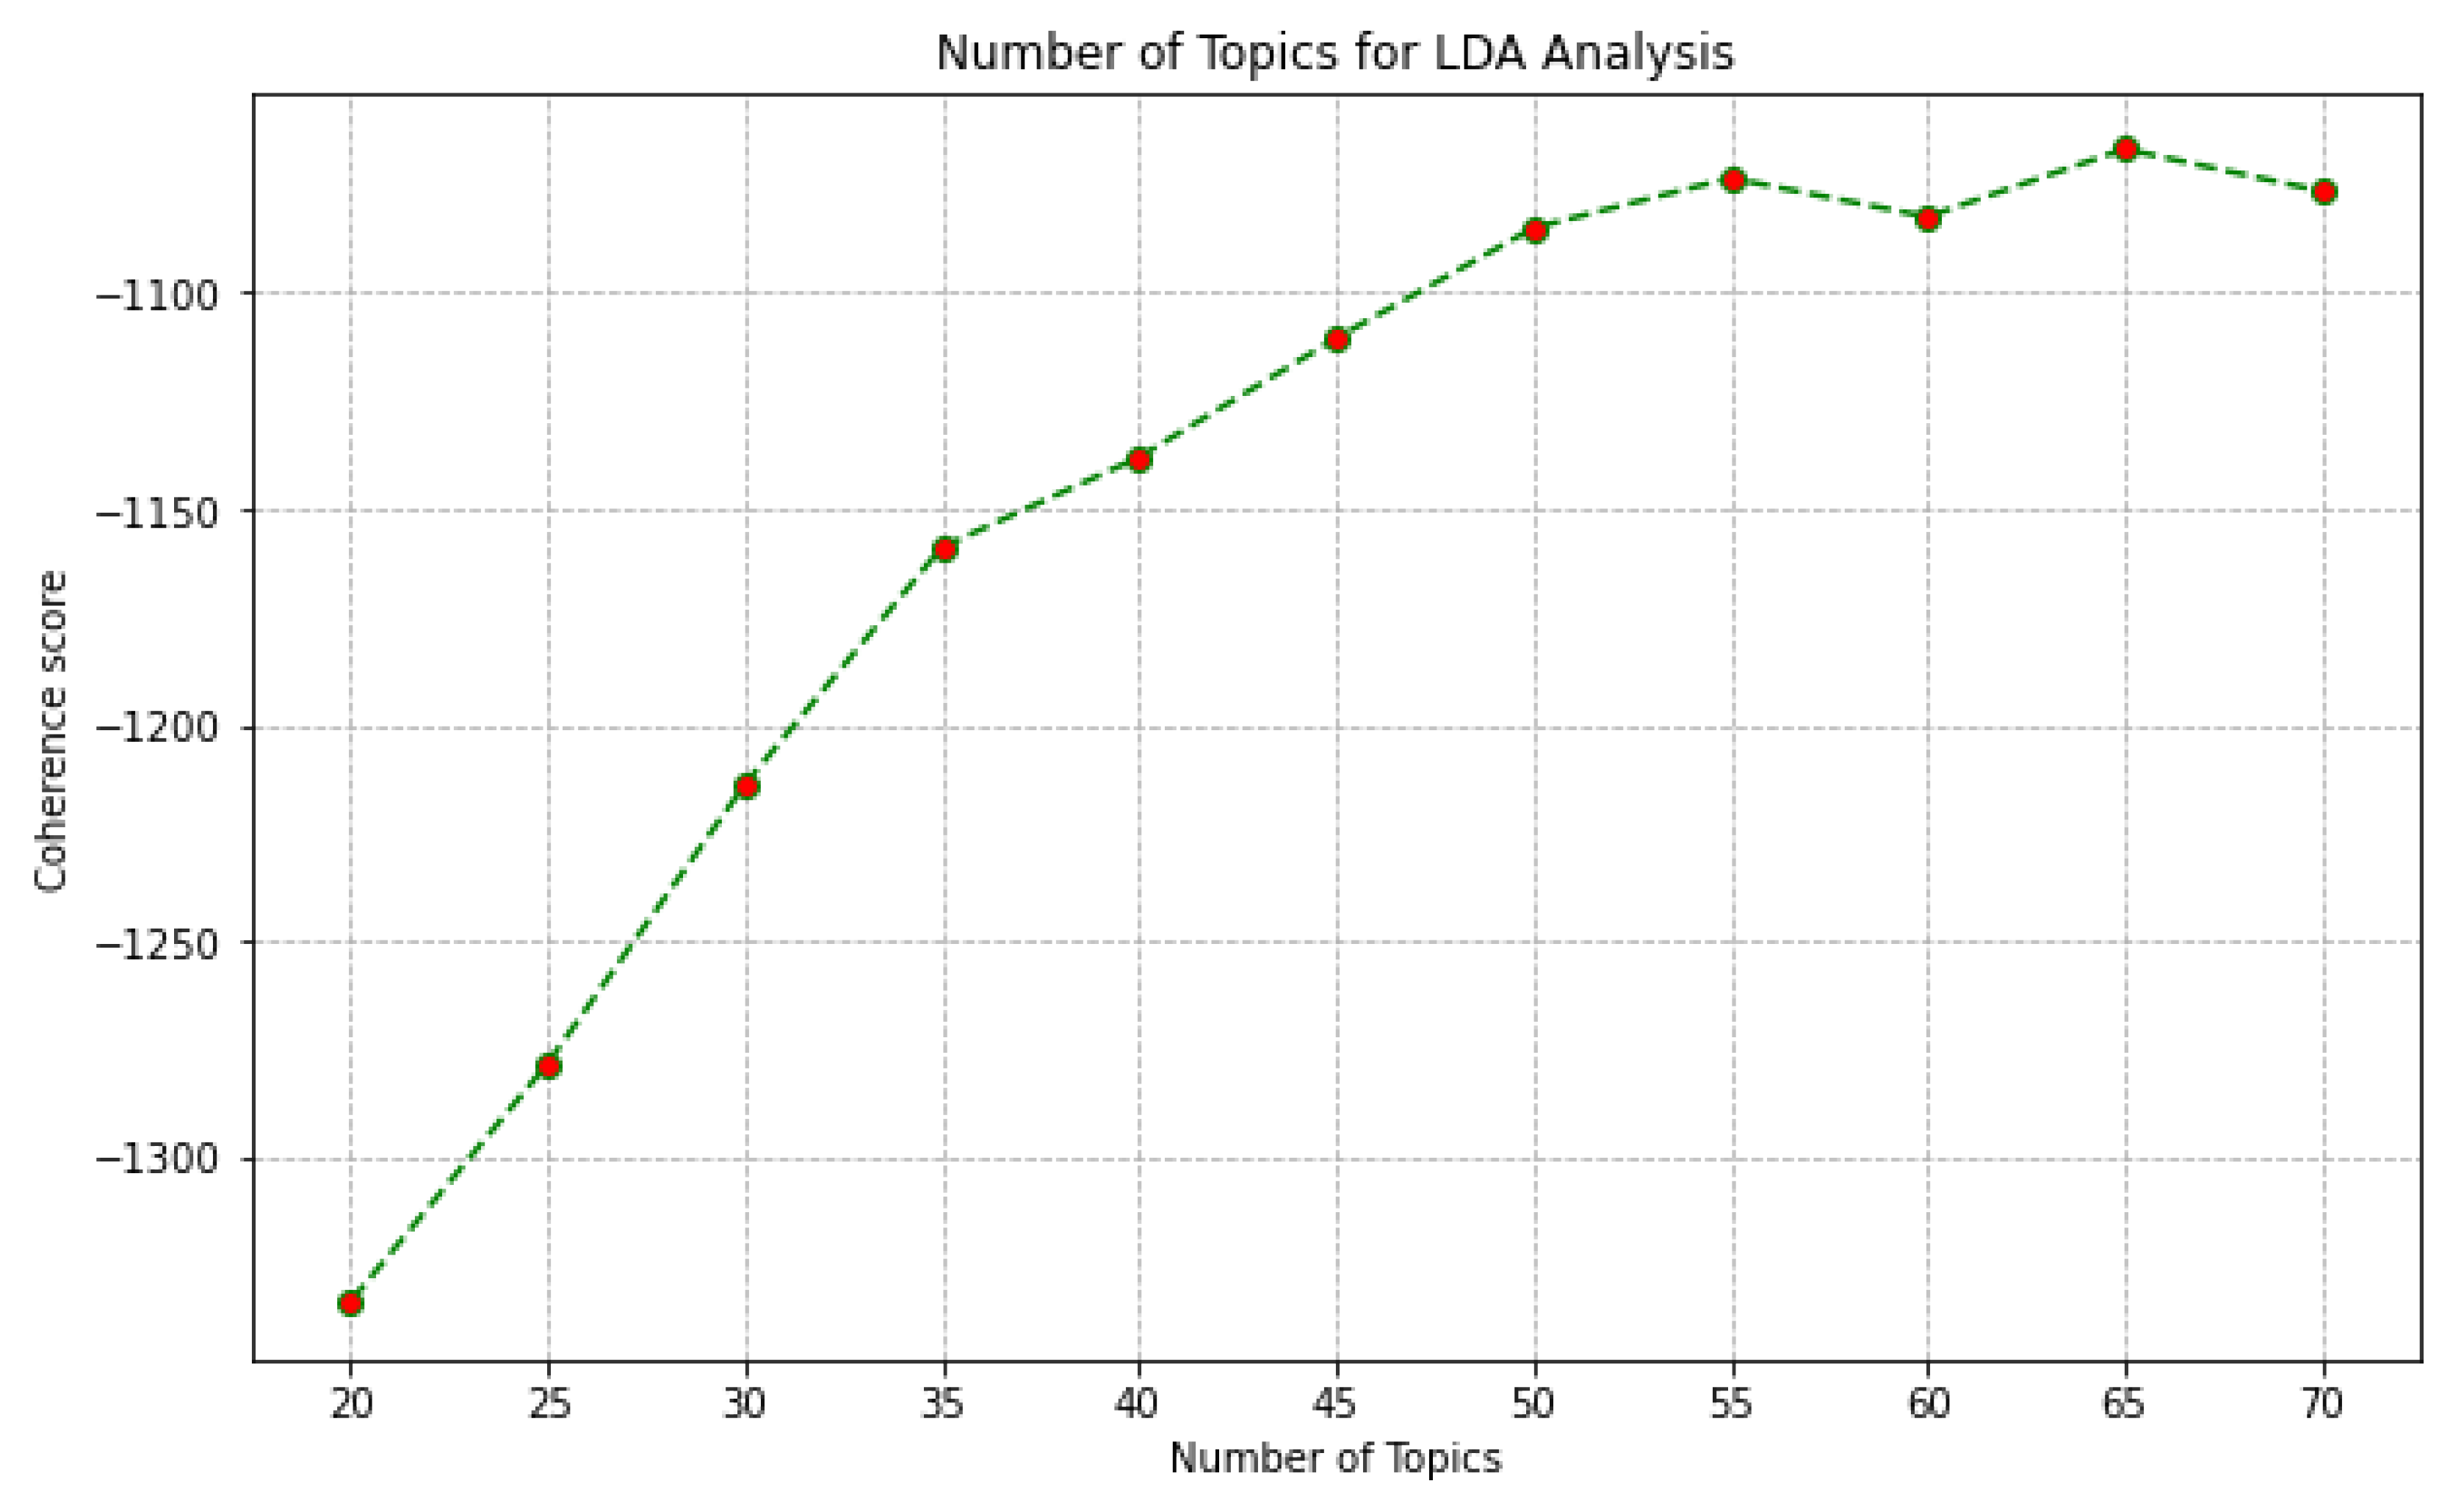
Table 1.
EmoRoBERTa model’s structure and parameters.
| Layer (Type) | Output Shape | Number of Parameter |
|---|---|---|
| input_ids | (None, 50) | 0 |
| token_type_ids | (None, 50) | 0 |
| roberta | (32, 50, 768) | 124,055,040 |
| emotion | (28, 1) | 612,124 |
Table 3.
Extracted life incidents for negative sentiment group and its representative terms.
| Life Incidents | Important Terms |
|---|---|
| Evacuation Plan | shelter, emergency, evacuee, free, offer, flood, help, continue, rescue, order |
| Concerns For Animals | help, dog, relief, food ,donate, cross, bag, support, away, affect |
| Climate Change Policy | video, like, change, climate, show, Twitter, en, satellite, stream, approach |
| Safety Update | update, latest, report, president, disaster, city, head, wake, great, state |
| Danger | wind, periscope, gust, day, damage, crazy, got, last, cat |
| Warnings | power, track, follow, story, top, without, bear, potential, map, update |
| Disaster response | disaster, gulf, open, border, first, patrol, brace, major, face, natural |
| Heavy Rain | rain, watch, tx, eye, Rockport, water, bring, wind, barrel, wall |
| Care of Family and Friends | stay, everyone, please, hope, friend, good, path, ready, family, roar |
| Oil and Gas Price Rise | price, prepare, gas, oil ,damage, major, san, governor, rise, cause |
| Help | space, station, seen, nasa, international,cupola, victim, help, view, donation |
| Fake News | path, look, like, monitor, David,camp, closely, fake, reporter, arrive |
| Flood | flood, hit, coverage, weather, house, week, channel, miss, hope, next |
| Praying | prayer, pray, affect, path, thought, everyone, people, god, go, know |
| Catastrophe | flood, catastrophic, post, due, flee, thousand, storm, rainfall, intensifies, upgrade |
| Evacuation news | center, national, say, pm, forecast, dog, number, one, threat, evacuate |
| Landfall Preparedness | landfall, make, corpus, storm, christi, near, made, hit, could, southeast |
| Mindsets | people, pardon, dont, Arpaio, evacuate, think, racist, good, would, coldplay |
| Hurricane Downgrade | storm, wind, strengthen, cat, break, toward, threaten, downgrade, year, high |
Table 4.
Extracted life incidents for neutral sentiment group and its representative terms.
| Life Incidents | Important Terms |
|---|---|
| Updated report | report, update, video, track, special, alert, lik, price, satellite, watch |
| Weather Update | weather, see, update, bad, report, could, story, rain, top, latest |
| Channel | weather, channel, coverage, blog, geek, video, lik, due, condition, severe |
| Statement | power, en, weather, update, outage, report, wake, el, statement |
| Hurricane Report | report, weather, storm, hurricane, damage, rain, southeast, lash, help, wind |
| Weather Channel | weather, report, stay, channel, people, watch, go, pray, due, reporter |
| Updates | report, prepare, effort, jim, multiple, acosta, ignore, apparently, update, continue |
| Catastrophic Flood Updates | update, report, follow, latest, catastrophic, flood, expect, rockport, damage, due |
| Information | update, pm, strengthen, storm, aug, report, cdt, information, wind, cat |
| Weatherforecast | weather, information, forecast, best, track, last, predict, update, aug, know |
| National Updates | update, report, txwx, weather, periscope, jeffpiotrowski, center, beach, national, add |
| Weather Report | update, wind, weather, report, cat, kt, stay, mov, tonight, mb |
| Statement Report | update, latest, statement, pm, watch, report, day, gulf, et, without |
| Latest Information | report, corpus, information, christi, near, tx, landfall, latest, make, update |
| Damages Updates | update, latest, major, please, water, damage, stay, br, wind, weather |
| Latest Report | update, storm, downgrade, tropical, report, latest, Saturday, flood, head, toward |
| Landfall Updates | update, landfall, latest, make, weather, service, national, storm, expect, made |
| Storm Report | wind, weather, sustain, report, update, storm, max, maximum, cat, eye |
| Safety Statement | update, come, center, storm, ashore, upgrade, weather, noaa, safety, statement |
| Alerts | update, give, Friday, abbot, break, greg, school, alert, August, gov |
Table 5.
Extracted life incidents for positive sentiment group and its representative terms.
| Life Incidents | Important Terms |
|---|---|
| Great Day | good, weather, great, dog, show, food, day, side, many, bag |
| Relief | great, would, love, help, could, relief, storm, change, climate, like |
| Happy Friday | good, day, pardon, friday, happy, great, arpaio, real, im, though |
| Luck | good, morn, luck, gulf, people, wish, cat, storm, love, rain |
| Good Coverage | good, far, im, happy, coverage, great, watch, power, get, keep |
| Wishes | good, luck, everybody, bear, wish, like, love, hit, bad, im |
| Farewell | good, luck, prepare, ahead, heartless, bid, farewell, shareblue, love, hear |
| Good Vacation | head, good, vacation, fac, luck, great, yell, crassly, love, stay |
| Great Government | great, state, work, city, noth, gov, monitor, chance, federal, closely |
| Good Job/Help | love, job, great, good, director, handle, bug, laud, agency, help |
| Helping | good, luck, love, help, victim, better, dont, deserve, near, go |
| Good Camp | good, luck, great, tell, camp, david, way, president, watch, doesnt |
| Prayer | love, prayer, stay, send, path, everyone, thought, affect, good, people |
| Good Message | good, luck, path, message, people, everybody, approach, say, said, word |
| Blessing | god, love, great, good, hit, bless, help, thank, die, pray |
| Birthday | happy, love, thank, birthday, take, keep, great, ill, wait, away |
| Good Luck | good, luck, get, corpu, go, th, look, people, like, say |
| Happy Weekend | weekend, great, good, im, love, happy, let, go, cover, look |
| Wind | good, great, make, landfall, go, love, impact, still, morn, wind |
| Praying | pray, good, everyone, love, affect, hop, first, day, great, night |
Disclaimer/Publisher’s Note: The statements, opinions and data contained in all publications are solely those of the individual author(s) and contributor(s) and not of MDPI and/or the editor(s). MDPI and/or the editor(s) disclaim responsibility for any injury to people or property resulting from any ideas, methods, instructions or products referred to in the content. |
© 2024 by the authors. Licensee MDPI, Basel, Switzerland. This article is an open access article distributed under the terms and conditions of the Creative Commons Attribution (CC BY) license (http://creativecommons.org/licenses/by/4.0/).
Copyright: This open access article is published under a Creative Commons CC BY 4.0 license, which permit the free download, distribution, and reuse, provided that the author and preprint are cited in any reuse.


