
Submitted:
26 July 2024
Posted:
30 July 2024
You are already at the latest version
Abstract
Groundnut is an important cash crop and a diet component for rural households in sub-Saharan Africa. However, Aflatoxin contamination remains a barrier to promoting groundnut-based food products as food levels above maximum limit (ML) can adversely affect human health. Three objectives were set, namely, (i) to characterize the post-harvest operations and risk factors affecting aflatoxin contamination, (ii) to assess aflatoxin incidence in on-farm stores and, iii) to assess agronomic practices that can be integrated to improve yield and reduce aflatoxin contamination. The average aflatoxin levels in on-farm stores were 11.3-16.4μg/kg, in which the proportions of ML were 25.7% at 4μg/kg, 56.3% at 15μg/kg, and 80% at 20μg/kg (~5-7 months after harvest). The application of Aflasafe® resulted in safe or no aflatoxin contamination across the locations. Significant hazards identified during postharvest operations include intermittent rain at harvest and drying (6.5), insect pests attacks after harvest (6), prolonged harvest to stripping interval (6.6), drying on bare ground (6.2), storing on bare floor (6.9), use of poorly efficient shelling machines (6.5), and re-use of rejected nut (6.1). This study provides solutions to minimize aflatoxin risk if appropriate technologies (e.g. improved variety, fertilizer, rhizobia inoculant, and Aflasafe®) and policies are deployed.
Keywords:
Management practices
; Aflasafe® treatment
; Rhizobia inoculant
; Risk analysis
; food safety
Sustainable Development Goals: SDG 2: Zero Hunger
1. Introduction
In Ghana, groundnut (Arachis hypogaea L, Fabaceae) production plays an essential role in the livelihoods of farm households, particularly among women farmers in rural communities (Abudulai et al., 2020; Nboyine et al., 23). In 2018, groundnut contributed 4.3% of the agricultural sector's gross domestic product (GDP), translating to 0.7% of Ghana's national GDP (Kleih et al., 2020). It is an important cash crop and a source of protein for many rural households (Kleih et al., 2020). About 20% of farmers in northern Ghana rank groundnut among their two most important crops. Another study projects groundnut as the number one grain legume for about 90 % of farm families in the Guinea-savannah zone (Naab et al., 2005). There is a high demand for the haulms as livestock feed. National per capita consumption is estimated at 0.61 kg/week (Awuah, 2000), and about 80% of Ghanaians consume groundnut products at least once a week and 32% thrice a week (Jolly et al., 2008). Informal small-scale processing into paste, oil, and cake is widespread, particularly among rural women (Posey et al., 2024). The crop is cultivated on a small scale, mainly in pure stands and sometimes intercropped with other cereals (Naab et al., 2005; Tsigbey et al., 2003).
However, mycotoxin contamination (particularly aflatoxins) remains a major challenge in the groundnut value chain in most parts of Africa (Omari et al., 2020; Kotei et al., 2019; Kyei-Baffor et al., 2023; Nboyine et al., 2023). Aflatoxins (B1, B2, G1, G2) are produced by Aspergillus flavus and A. parasiticus, and have been considered as the most potent mycotoxins, especially aflatoxin B1 (AFB1). AFB1 has been recognized as a class I human carcinogen by the International Agency for Research on Cancer (WHO Report, 2016). Significant levels of aflatoxin can lead to health problems such as liver cancer, growth impairment in children, and acute aflatoxicosis in humans in developing countries (Wu et al., 2014). In developed countries, the average dietary exposure to aflatoxin is generally below 1 ng/kg body weight per day. At the same time, those of sub-Saharan African nations are above 100 ng/kg body weight per day (Awuchi et al., 2020). In addition to the health risk, it has been reported that at least 25% of global food crop production per annum is not utilised for food consumption due to aflatoxin contamination (Eskola et al., 2020). Owing to the health implications and economic losses, more than 60 countries have embraced the need to regulate the aflatoxin content in foods. The aflatoxin threshold is 20 μg/kg in the USA and 4 μg/kg in Europe (Min et al., 2011). Due to this limitation, African countries lose about 670 million dollars per annum on exporting cereals, dried fruits, and nuts since they cannot meet the EU regulatory standards. In addition, close to 5 billion people worldwide are still at risk from aflatoxin exposure (Emmott, 2013).
The climatic conditions in Africa, such as drought, excessive rainfall, and extreme temperatures, favour fungal proliferation which exacerbate the risk of aflatoxin contamination. The presence of highly toxigenic fungal strains, low-input farming practices, sub-standard post-harvest handling practices as well as weak quality control systems, and limited access to testing laboratories are additional challenges (Sugri et al., 2017; Abudulai et al., 2020; Omari et al., 2020). Other limiting factors include poor crop husbandry practices, mechanical damage to pods, insect damage, poor soil fertility, and host-plant susceptibility, significantly influence aflatoxin contamination. Intrinsically, pod/seed characteristics such as pod filling, shell strength, and the seed coat protect the grain during pre- and post-harvest stages from biotic and abiotic stresses. For instance, Commey et al. (2021) showed that the seed coat acts as a physical and biochemical barrier against A. flavus infection and can be used to mitigate aflatoxin contamination. The seed coat contains phenolic compounds such as hydroxycinnamic and hydroxybenzoic acid derivatives, which inhibit A. flavus growth.
Several production and post-harvest technologies have been tested to reduce aflatoxin risk (Bandyopadhyay et al., 2016; Sugri et al., 2017; Agbetiameh et al., 2020; Appaw et al., 2020; Abudulai et al., 2020). Integrating best practices (i.e., improved seed, fertilizer, spacing, plant population, drying, storage, etc.) provides the opportunity to produce groundnuts with minimum risk of aflatoxin contamination. However, the adapting these practices requires significant investment beyond the reach of the largely smallholder farmers. Many quality attributes are hard to observe, making it difficult for farmers to appreciate the economic value (Magnan et al., 2021). Another barrier is lack of premium pass-through quality and the cost of quality-enhancing inputs in most parts of SSA. In this study, the performance of improved production practices was assessed to develop integrated management strategies to reduce pre- and post-harvest aflatoxin contamination. Three objectives were set, namely, (i) to characterize the groundnut post-harvest operations and risk factors affecting aflatoxin contamination, (ii) to assess aflatoxin incidence in on-farm stores and, iii) to assess a set of agronomic management practices that can be integrated to improve yield and reduce aflatoxin contamination
Literature Review
Challenges in groundnut production in Ghana
In Ghana, groundnut is the most important legume crop, followed by cowpea (Vigna unguiculata (L. Walp) and soybean (Glycine max). However, there has been a decline in production due to a myriad of challenges, and stiff competition from soybean production. Groundnut yields are currently low due to the negative impacts of arthropods, diseases, nematodes, and weeds (Abudulai et al., 2007; Dzomeku et al., 2019; Walker et al., 2014). Yield losses can approach 70% in West Africa when effective pest management is not achieved (Ajeigbe et al., 2014; Nutsugah et al., 2007; Subrahmaniyan et al., 2002). Monocotyledonous weeds, including annual and perennial grasses and sedges as well as dicotyledonous weeds, are prevalent in groundnut and can cause yield loss of between 50% and 80% in West Africa (Dzomeku et al., 2019). Groundnuts is very susceptible to early-season weed interference because of their slow initial growth characteristics, allowing many weed species to grow above the canopy (Subrahmaniyan et al., 2002). Other essential limitations are the effects of prolonged droughts, soil fertility management, pre-and post-harvest factors that predispose the crop to mycotoxins, limited access to improved cultivars, and wide plant spacings which affects optimum plant population (Njorogae, 2018; Sugri et al., 2017). Poor post-harvest management practices increase losses and reduce the groundnuts' quality and value, thereby limiting market opportunities. The use of indigenous methods of planting, harvesting, drying, and shelling still dominate due to the large number of smallholders in the production chain. Such indigenous operations are less efficient, time-consuming, labour-intensive, costly, and may increase the risk of aflatoxins in grain. Poor postharvest practices such as poor harvest, drying and storage practices can increase microbial contamination and pests (insects and rodents) attacks. Postharvest losses due to pests and poor management practices can reach 70% after six months of storage (Oaya et al., 2012) in some cases. Other losses include grain biochemical changes (flavour change, rancidity, viability loss), physical changes (shrinkage and weight loss), and absorption of odours and chemicals during storage.
Post-harvest risk Analysis
Risk is defined as the likelihood of a food hazard occurring at any stage from production to consumption. Risk analysis involves the process by which potential health hazards are scientifically evaluated by (i) hazard identification, (ii) hazard characterization, (iii) exposure assessment, and (iv) risk management. The analysis of risks involves a three-pronged approach - risk assessment (application of science in the evaluation), risk management (policy aimed at containing the risk), and risk communication (relating the identified and evaluated risks to stakeholders) (Achterbosch, 2007; Soman and Raman, 2016.). This approach guarantees the safety of food instead of relying on end-product testing. For this reason, measures such as good agricultural practice (GAP), good manufacturing practices (GMP), and good hygiene practices (GHP) if adopted to control hazards at the production and handling stages, achieve desirable quality. A robust approach is a systematic and preventative approach called the Hazard Analysis and Critical Control Point (HACCP) that identifies and controls hazards from the “farm to fork”. In general, the assessment of significant hazards through the HACCP approach as being recommended by the Codex Alimentarius Commission to be most appropriate. Hazards, as defined by the Codex Alimentarius Commission (2003), are any physical, biological, or chemical agent in the food or condition of the food that has the potential to cause harm to the consumer. Common hazards include physical hazards (soil, stones, broken twigs or sticks and weed seeds); chemical hazards (pesticide residue, bio toxins such as aflatoxin); and biological hazards (insect pests and pathogens such as Escherichia coli, Salmonella, Listeria, Campylobacter, Cryptosporidium, and Norovirus). Since HACCP system is preventive, the identification and prevention of hazards should be considered throughout the produce supply chain from the “farm to fork”. A study to assess fungal and multi-mycotoxin profiles of groundnuts sold in domestic markets in Nigeria and the associated risk to consumers showed 400 fungal isolates of mainly Aspergillus spp (58.6%), Penicillium spp (40.9%) and Fusarium spp (0.5%) (Oyedele et al., 2017). The incidence of aflatoxin-producing A. flavus isolates (71%) was significantly higher in the groundnuts compared to non-aflatoxigenic isolates (29%). Another study to evaluate the presence of fungi and mycotoxins (aflatoxins and cyclopiazonic acid) in Brazil nut (Bertholletia excelsa) found Aspergillus spp., Fusarium spp., and Penicillium spp as the most prevalent fungi in the nuts and shells. In that study, low water activity of the substrate was associated with the absence of aflatoxin. The high frequency of isolation of aflatoxigenic Aspergillus section Flavi strains, mainly A. flavus, and their persistence during storage increased the chances of aflatoxin production in nuts. Both studies indicated the need for good management practices to reduce mycotoxin contamination (Baquião et al., 2013; Oyedele et al., 2017).
2. Materials and Methods
2.1. Study Area
This study was conducted in twelve districts of northern Ghana to characterize and assess production practices that can be integrated into the cropping systems to minimize the risk of aflatoxin. The predominant crops in this area are maize, millet, sorghum, rice groundnut, yam, cassava, soybean, Bambara beans, and vegetables. Groundnuts, soybeans, and cowpea are the important legumes that households cultivate. The study area has alternating wet and dry seasons, with the wet season between May and October; about 95% of rainfall occurs during this period. Maximum rainfall occurs from August to September, and severe dry conditions typically exist between November and April. Annual rainfall ranges from 800-1200 mm. There is wide fluctuation in temperature (12 – 45 oC) and relative humidity with as low values as 30% in the dry season (November to April) and above 75% in the wet season (June to October). About 97% of households in the study areas are engaged in crop-livestock farming (Ghana Statistical Service, GSS, 2014a-d).
2.2. Production practices
Focus group discussions (FGD) and key informant interviews were conducted to identify the communities’ attitudes, knowledge and experiences in groundnut production that influence grain quality. The FGD processes help to identify and clarify shared knowledge among groups and communities, which would otherwise be difficult to obtain with individual interviews. Using FGD and key informant interviews, analysis of the strengths, weakness, opportunities, and threats (SWOT) of factors affecting groundnut harvesting, drying, storage, and shelling operations were mapped to identify value chain up-grading opportunities which can be integrated to improve grain quality. In addition, the problem tree analysis approach was employed to identify the main causes and formulate management strategies to improve groundnut production operations. The process ensures that both present and emerging technologies are mapped for action by the actors
2.3. Postharvest risk analysis
A field survey was conducted to characterize groundnut postharvest operations and risk factors influencing aflatoxin contamination. The data sets were generated from 12 communities from January to April 2022 in which 300 respondents were interviewed (Table 1). The minimum sample size was 246 farmers (equation 1) since the districts and communities were sampled due to their groundnut production level and the respondents were randomly interviewed. A study unit was defined as a farmer who lives and cultivates groundnut during the previous 2 years. The sample size was determined using the following formula:
Where: Z: confidence level of 95% (standard deviation of 1.96); P: estimated prevalence of farmers in the project area (80%), i.e., the proportion of the target population with a given characteristic (groundnut farmers in the community); Q: 1-P; D: margin of error of 5 %.
The questionnaire generated information on production operations, farm size, type of variety, time of planting and harvesting, yield, postharvest operations, factors influencing the use of threshing machines, and associated challenges. The HACCP analysis approach was adapted to identify critical control points in groundnut postharvest operations that influence grain quality. All possible hazards at any postharvest operation (maturation, harvesting, stripping, drying, storage, shelling, and transport) were characterized. For each possible hazard, a score of 1-10 (where score 1: least hazard to score 10: highest hazard) was assigned. The respondents were tasked to score each hazard regarding their relative influence on groundnut grain quality. For each postharvest operation and hazard, Kendall’s Coefficient of Concordance (W) statistical procedure was employed to test data significance and strength of agreement among the responses. Kendall’s coefficient of concordance (W) measures the agreement among several (m) quantitative or semi-quantitative variables that are assessing a given set of n objects of interest (Teles, 20212). The analysis provides a distribution-free test of independence and measures the relationship between the two variables being compared. The mean score for each hazard was computed, and the higher ones were ranked as the most constraining factor. The coefficient of concordance (W) was estimated by using the relation in equation (2):
Where S denotes the sum of squares of deviations from rank means. S is expressed as:
where: Rj= The sum of ranks for the jth hazard; K= The number of ranking panel (respondents); N= the number of hazards being ranked.
Equation (4) is the maximum possible sum of squared deviations, expected to occur in the case of perfect agreement among K ranking criteria.
2.4. Shelling operations
Shelling/threshing efficiency and services provided in selected districts (Binduri, Kassena Nankana East, Savelugu and Karaga) were assessed in October to February in both 2021 and 2022. Sampling at the community level involved casual interviews of farmers who were threshing/shelling their groundnut at the spot or employed threshing services in previous two years. Data sets were generated on throughput capacity, threshing efficiency, grain physical purity, grain moisture content, threshing losses, and benefit cost ratios.
2.5. Survey of aflatoxin incidence
The survey was conducted from February to June 2021 in 20 communities selected from four districts (Savelugu, West Mamprusi, Talensi and Nabdam) (Table 3). The study assessed the incidence of aflatoxins in on-farm stores to facilitate the development of matching technologies to reduce aflatoxin contamination. At each community, 21–25 households were randomly sampled for the enumeration, and 447 households were interviewed using a structured questionnaire which captured the demographic and socio-economic factors; cropping systems and scale of production; postharvest operations; integrated pest management strategies; farmers’ knowledge of aflatoxin; and challenges in groundnut storage. We determined significant differences in the qualitative and quantitative socioeconomic variables using the Chi-square and student’s t-test, respectively, computed as (StataCorp, 2017):
where is the number of observations of type i and is the expected count of type i. from equation (6), the student’s t-test can be expressed as (StataCorp, 2017);
where is the mean difference between two continuous variables, with the number of observations being and , respectively, while is the pooled standard deviation.
2.6. Assessment of crop management practices
Two on-station experiments were conducted on sandy loam soils (common in northern Ghana) during the 2021 cropping seasons in fields at Nyankpala (9.389980, -1.004723) in the Tolon District of Northern Region and at Manga (11.014618, -0.263667) in the Binduri District of the Upper East Region. Soils at Nyankpala are Voltaian sandstone, typically deep to moderately deep and well-drained, varying in texture from coarse sands to loams. The soils at Manga are Plinthic lixisols developed from granite and stones (FAO-UNESCO, 2002). Planting was done on July 3, 2021, and July 7, 2021, respectively, and harvesting was done in the 2nd to 3rd week of October 2021. The experimental design was a 2 × 3 × 3 factorial in a randomized complete block design with three replications. The treatments were i) variety (SARINUT 2 and Yenyawoso), ii) mineral fertilizer (Yara Legume, Triple Super Phosphate and control) and iii) microbial amendments (Rhizobia inoculant, Aflasafe® and control).
Certified seed was obtained from an agro-input vendor, and commercial rhizobia inoculant (SARIFix) was obtained from the CSIR-SARI inoculant laboratory, Tamale. For treatments requiring inoculant application, the seeds were coated with the inoculant after the application procedure provided on the label for treatment involving Rhizobia inoculant. Plot sizes of 4 x 4 m were used, and treatments were replicated thrice. The planting distance was 15 x 50 cm at Nyankpala and 10 x 75 cm at Manga. Two weeks after planting, Yara Legume fertilizer (0% N, 18% P2O5, 13% K2O, 29% CaO) was applied at the rate of 570 kg/ha, and Triple Super Phosphate (TSP) (46% P2O5 and 17% CaO) was applied at 250 kg/ha. A commercial brand of Aflasafe® obtained from a vendor (Callighana Lim. Accra) was broadcasted on field at the manufacturer's recommended rate (i.e., 10 kg/ha at 45 days after planting). All recommended agronomic management in groundnut (i.e., land preparation, plant population, weed management, and postharvest drying and storage) were applied. Data were collected on plant count, plant height, number of branches, canopy spread, incidence of late leaf spot disease, nodule count, biomass yield, number of pods per plant, and pod yield.
2.7. Sample extraction and aflatoxin determination
A total of 80 samples (~ 0.5–1 kg) were obtained from on-farm stores (granaries, barns, bags and silos) of the respondents from February to April 2021, approximately 5–7 months after harvest. The second batch of samples (108) was obtained from on-farm demonstrations in which harvesting and drying occurred in October 2021, and the samples were analysed in April 2022. For each sample, the pods were shelled and reduced to working samples through the coning and quartering method and analysed for total aflatoxins at the Biochemistry Laboratory of Kwame Nkrumah University of Science and Technology, Kumasi, Ghana. The grain physical indices measured were total inert, mouldy grain, standard whole grain, shrivelled grain, moisture content, and 100 grain weight. Aflatoxin was extracted using the methods described by Ouakhssase et al. (2019) with modifications. Samples were milled and homogenized using a Preethi Mixer Grinder. Sample weights of 2 g were put in 15 ml centrifuge tubes, 5 ml of distilled water was added, and a vortex was used for 1 min. The solution was allowed to rest for 5 min. and 5 ml 1% (v/v) acetic acid in acetonitrile solution was added. The resultant mixture was vortexed using a Genie Vortex machine for 3 min. and 1.32 g of anhydrous MgSO4 and 0.2 g of NaCl were added to the mixture and vortexed for 1 min. The tubes were centrifuged for 5 min. at 4000 rpm, the upper organic layer was filtered through a 0.45 µm nylon syringe before injection. Then 50 µl of the filtered extract was injected into the HPLC, and aflatoxin was determined using the HPLC with Photochemical Reactor for Enhanced Detection (PHRED) used for post-column derivatization (Agilent 1200 series HPLC Cecil-Adept Binary Pump HPLC with a fluorescence detector (Ex: 360nm, Em: 440nm) with Phenomenex® C18 Column (150 x 4.60mm, 5um). The ratio of the mobile phase was methanol: water (40:60 v/v) at a flow rate of 1 ml/min, at column temperature of 40 °C. Aflatoxin Mix (G 1, G 2, B 1, B 2) standards (ng/g) were prepared from Romer Labs® aflatoxin standard of 5.02 ng/μL in acetonitrile. Aflatoxins in samples were detected by using the retentions of the standard solution run, and quantification was done using the calibration curves of each respective toxin. Limits of detection and quantification were established at 0.5 ng/g and one ng/g, respectively.
Aflatoxin Calculation
where A = ng of aflatoxin as eluate injected, T = final test solution eluate volume (µl), I = volume of eluate injected into LC (µl), w = mass (g) of a commodity represented by the final extract.
2.8. Data analysis
The socio-demographic data were analysed using Statistical Package for Social Sciences (SPSS 16). In reporting, descriptive statistics involving frequencies, minimum, maximum, mean and confidence interval were employed. Data sets on aflatoxin levels were subjected to Analysis of Variance (ANOVA) to determine significant differences among samples using the GenStat (12th Edition) statistical package. Translation of the aflatoxins data was based on maximum limits (ML) of 4, 12, 20 and >20 µg/kg; the ML adopted in most countries. A report on contaminants in cereals and cereal-based foods concluded that enforcing an ML of 10, 8 or 4 µg/kg for ready-to-eat groundnut would have little further impact on dietary exposure to aflatoxin for the general population, compared with setting an ML of 15 µg/kg or above (WHO, 2016). The agronomic data sets were analysed using a general factorial design with genotypes over fertilizer application and microbial amendments. Fischer Least Significant Difference separated differences between treatment means at a 5% probability level.
3. Results
3.1. Value chain analysis
3.1.1. Socio-demographic and production characteristics
Table 4 indicates that 53% of the sampled farmers are male, with female farmers representing 47%. Land holdings for groundnut cultivation ranged from 1-20 hectares per household. Specifically, 51.7% of respondents cultivated approximately 0.5 hectares, 44.7% had farm sizes of 1-3 hectares and 3.3% or less operated on more 4 hectares. Regarding the sources of seed for planting, 84% of farmers reported recycling their seed each production season, while 15% used certified seed. The primary planting period was May for 58.6% to 78% of respondents in the Northern and Upper West regions, and June to July for 37.6% to 50.5% in the Upper East Region.
3.1.2. Postharvest operations
Table 5 describes the postharvest operations such as quantity harvested, method, volume and length of storage, peak period of harvest, method of drying, among others. About 20 to 67% of grain drying in Northern Region, and 26.3 to 57.6% in Upper West Region occur in August to September; which poses a challenge on drying since maximum rainfall occur around this period. In Upper East Region, the peak harvest period (63.4%) occurs in October, which coincides with the cessation of rain in the area. Majority of the growers (51.5%) harvest up to 1-5 bags, 26% of growers harves about 6-10 bags, and 23% harvest above 10 bags. The prevalent methods of drying are bare ground (36.1%), drying vines at homestead before stripping (28%), concrete floor (13%), drying vines and pods in-situ before stripping (windrowing) (10.4%), and use of tarpaulin (9.7%). Majority of the respondents (80%) store the unshelled pods in polypropylene bags (poly-bags) which is predominant in the communities due to its low cost and availability.
3.1.3. Postharvest threshing services
Harvesting operations are often classified as moderately heavy work, but these operations can be lightened by employing threshing machines. If efficient practices are missing in the link, 10 to 50% of grain quantity and quality losses can occur in developing countries. Overall, the drudgery post-harvest operations are harvesting according to 55.5% of respondents, stripping by 20%, and shelling by 24.4% (Table 6). Time spent in manual harvesting operations (harvesting, stripping and drying) was estimated at 30 to 35 man-days/ha (240 to 280 hours/ ha). Grain moisture content of on-farm samples was 7 to 9%, which is within safe limits. The use of shelling machines recorded shelling losses of 9 to 19.7%, and physical purity of 80 to 89% compared to manual shelling (93 to 98%). Grain physical purity has implications on price, aflatoxins and subsequent pest infestation. Although, the traders carried out sorting and grading, the downgrades (shrivelled, split and broken nuts) still found way into the food chain. As farmers transition to medium and large-scale production, mechanized post-harvest operations is necessary to improve timely operations and reducing drudgery. There is need to mobilize public-private partnerships to invest in post-harvest mechanization and identify flexible payment models to increase access by the resource-poor farmers.
3.1.4. Constraints to groundnut production
Figure 1 provided a problem tree analysis that identified the causes, challenges and mitigating technologies to improve efficiency. The constraints can be classified into biotic and abiotic factors, limiting post-harvest technologies, poor agronomic practices, and policy limitations. The most prioritised constraints were poor access to improved varieties, high cost of certified seed, climate variability, poor adoption of improved production practices, limited access to agricultural credit and finance, and poor soil fertility. A cocktail of emerging production technologies to mitigate these challenges include the use of improved varieties, early duration varieties, stress tolerance (drought, pest and diseases, nutrient use efficiency, etc), rhizobia inoculants, Aflasafe, special legume fertilizers, and foliar fertilizers, among others to boost yield and build resilience towards climate variability.
3.1.5. SWOT analysis at post-harvest operations
Analysing the strengths, weaknesses, opportunities and threats (SWOT) of post-harvest operations was highlighted (Figure 2). Five critical weaknesses requiring attention were: drudgery at harvesting, manual stripping and shelling, drying on bare ground, scarcity of shelling machines, risk of aflatoxins, and access to post-harvest infrastructure (drying platforms, storage vessels, tarpaulins, moisture meters, PICS bags, etc.). Post-harvest losses, both quantity (grain impurities) and quality (i.e., aflatoxin contamination) potentially deprive farmers of some market opportunities and better prices. In this study, five opportunities to improve efficiency include i) adapting best agronomic practices ii) mechanizing harvesting, stripping and shelling operations, iii) identifying drying techniques adapted to the communities, iv) developing the technical capacity of the actors on best production and post-harvest management practices and, v) policy and regulatory interventions to manage food safety and aflatoxin risk.
3.1.5. Characterization of post-harvest risk factors
Table 7 identifies the hazards in the post-harvest operations of groundnuts that influence grain quality. Three main hazards at harvest are delay in harvesting (7.1), intermittent rain at harvest (6.5), and insect pests attacks before stripping (6). At stripping, the critical hazards are prolonged harvest to stripping interval (6.6), intermittent rain before stripping (6.4), and insect pests attack before stripping (6.1). The hazards at drying are intermittent rains during drying (7.2), drying on bare ground (6.2), drying both vines and nuts (5.4), and drying on the farm (5.4). The hazards at storage are storing on the bare floor (6.9), storing the shelled nuts (4.7), use of indigenous storage method (4), and prolonged storage (4). During the shelling, the hazards are the use of inefficient shelling machines (6.5), re-wetting of pods to facilitate shelling (5.3), damage from mechanical shelling (5), and re-drying of nuts after shelling (3.8). Manual shelling posed the least risk (2.6). For sorting and grading operations, the hazards are the re-use of discarded nuts (6.1), conducting no or minimal sorting after shelling (5.5), and prolonged storage of shelled nuts (5). At the processing stage, the hazards are the packaging method (3.1), moisture content of grain and products (3), and hygienic practices in the processing line (2.9). The auxiliary services requiring attention are the availability of post-harvest facilities such as drying platform, moisture meter, PICS bags, storage vessels, etc. (4.6), capacity training on post-harvest management (4.4), and access to information (eg. media program on radio, television, technical leaflets, etc) (4).
3.2. Survey of aflatoxin prevalence
Grain from on-farm stores recorded drier grain moisture content (4.6-6.2%) across the districts, which may be attributed to the dry weather conditions prevailing in northern Ghana from November to April (Table 8). Standard whole grain ranged from 84 to 91.3% across the districts, with higher whole grain found from the Nabdam district (91.3%) and the least from the West Mamprusi district (86.1%). Storage losses ranged from 5.4% to 9% across the districts, with higher losses occurring from the Savelugu district (9%) and least from Nabdam district (5.4%). Comparing the districts for aflatoxin incidence, wide variations in total aflatoxin contamination (0 to 99.5 μg/kg) exist, but the incidence was not significantly (P<0.05) different (Figure 3). The average aflatoxin levels were 11.3 to 16.4 μg/kg, with the maximum limits being 25.7% at 4 μg/kg, 56.3% at 15 μg/kg, and 80% at 20 μg/kg; at 5-7 months after harvest (Table 9).
3.3. Effect of Crop management practices
3.3.1. Effect on yield performance
Table 10 shows the growth and yield parameters as affected by variety, fertilizer application, and microbial amendments at location Nyankpala. Pod yield was generally low (0.72 to 1.13 t/ha) compared with average groundnut yield (1.6 t/ha) in Ghana. The main focus of the study was to establish the link among integrated production practices, pod yield and aflatoxin risk reduction. Except for plant height and biomass, the growth and yield performance of SARINUT 2 and Yenyawoso were similar (P<0.05). Comparing the varieties, SARINUT 2 had higher biomass (2.6 t/ha) compared to Yenyawoso (1.6 t/ha). The application of TSP recorded a higher pod yield (1.13 t/ha), followed by YaraLegume (0.93 t/ha) and control (0.74 t/ha), which represents a 25.6 to 52.7% pod yield increase over the control. The application of Rhizobia inoculant significantly (P< 0.05) increased nodule count, plant biomass, number of pods per plant, and pod yield. Pod yield (1.1 t/ha) was higher (41.9%) when Rhizobia inoculant was applied compared to the control (0.72 t/ha t/ha).
Comparing the varieties at the location Manga, SARINUT 2 was superior to Yenyawoso for plant count, plant height, number of pods per plant, stover yield, and pod yield (P<0.001) (Table 11). The average pod yield was 0.66 t/ha for SARINUT 2 and 0.36 t/ha for Yenyawoso. Comparing the effect of fertilizer application, YaraLegume gave a higher yield (0.7 t/ha) followed by TSP (0.45 t/ha) and control (0.38 t/ha) (P<0.001), which represents 18.4 to 84.2 % increase in pod yield over the control. The application of Rhizobia inoculant increased pod yield (0.51t/ha), which is 14.6% increase over the control (0.48 t/ha), but no significant yield difference (P<0.05) was observed between the application of Rhizobia inoculant and Aflasafe®.
3.3.2. Effect of crop management practices on aflatoxin content
Table 12 presents the interaction effect of agronomic practices on total aflatoxin content at locations Nyankpala and Manga. At both locations, safe or no incidence of aflatoxins was recorded in grain from Aflasafe® treatment. No significant differences (P<0.05) existed between the varieties (SARINUT 2 and Yenyawoso) concerning aflatoxin incidence. The farmers’ standard practice (i.e., no fertilizer application) showed the risk of aflatoxin incidence (0.7-0.8 μg/kg). At location Nyankpala, only grain from the standard farmer practice showed much aflatoxins contamination (0.7 μg/kg for SARINUT 2 and 0.8 μg/kg for Yenyawoso), albeit at safe levels of < 4 μg/kg. No incidence of aflatoxin was noticed across the treatments at Manga location.
4. Discussion
4.1. Aflatoxin incidence
Aflatoxin contamination remains a challenge among interventions targeted at upgrading the groundnut value chain in sub-Saharan Africa (Sugri et al., 2017; Abudulai et al., 2020; Appaw et al., 2020; Omari et al., 2020; Kotei et al., 2019; Kyei-Baffor et al., 2023; Nboyine et al., 2023). This is critical considering that 60–85% of smallholder farmers in developing countries are not protected by commercial food safety regulations (Wild, 2007). They cannot protect crops against aflatoxin contamination, and awareness about the risk of aflatoxin is poor (Magnan et al., 2021; Kortei et al., 2019). Additional evidence reveals that the global health burden attributable to unsafe food compares to that of malaria and tuberculosis, which poses dire effects in developing countries (Havelaar et al., 2015). In the report of Magnan et al. (2021), aside the income opportunities high-value markets provide, food quality attributes such as micronutrient content and food safety are critical in the production chain. Thus, overcoming the barriers to attaining quality standards can support both economic growth in rural areas and reduce the risk of exposure by consumers. Some barriers to quality compliance include a lack of information on standards and compliance, the cost of technologies to achieve standards, and the lack of premium pass-through in most developing countries (Magnan et al., 2021; Kortei et al., 2019). Whereas there is no national policy that exclusively addresses aflatoxin issues in Ghana, there are food safety-related, health, nutrition, agricultural, science, technology, and innovation policies, that implicitly or explicitly support aflatoxin research and address health, nutritional, and trade effects as well as their application for the management of food contaminants and toxins (Omari et al., 2020).
This study builds on other studies on perception, prevalence, and health risks related to aflatoxins in groundnuts in Ghana (Sugri et al., 2017; Abudulai et al., 2020; Omari et al., 2020; Kortei et al., 2019; Kyei-Baffor et al., 2023). For instance, Sugri et al. (2017) recorded wide variations of aflatoxin from 0 to 1,546 μg/kg, but at 20 μg/kg permissible level, 92.9% of samples from farm stores and 98.7% of samples from the on-farm demonstrations were classified as safe at 4 to 8 weeks after harvest. A similar trend was found in the study of Florkowski and Kolavalli (2013). They reported that freshly harvested groundnuts usually contain low levels of aflatoxin. However, because groundnuts are stored for future use, the level of contamination rises significantly over time and may exceed permissible limits. This requires strengthening the post-harvest hazard points (eg. access to tarps, drying on the platform, storage in hermitic bags, etc.) to keep the contamination abase (Darko et al., 2018; Jordan et al., 2018; Abudulai et al., 2020; Magnan et al., 2021).
Commenting on the low aflatoxin levels in this study (Table 12), several studies recorded minimum aflatoxin when improved practices were compared with the farmers’ best practices (Abudulai et al. 2020; Appaw et al. (2020). Huge discrepancies often exist between aflatoxin levels in on-farm stores compared to experimental field samples, likely due to smaller quantities handled in the latter, which accelerates quick drying. Appaw et al. (2020) recorded increased yield and financial returns when one extra weeding was performed, and local soaps and calcium were applied compared with the farmer's practice in Ghana. Other research by Jordan et al. (2018), Darko et al. (2018) and Abudulai et al. (2020) found the benefit of drying groundnuts on a tarpaulin versus on soil and storing in hermitic bags to reducing aflatoxin contamination. The availability of labour, inputs, and access to financial credit to purchase inputs remain the primary challenges to adopting such improved technologies (Quartey et al., 2012; Yahaya et al., 2022).
4.2. Application of Aflasafe
Aflasafe® is a biocontrol product that utilizes atoxigenic A. flavus genotypes to displace aflatoxin producers, thereby limiting aflatoxin contamination in susceptible crops. The International Institute of Tropical Agriculture (IITA), in collaboration with the US Department of Agriculture – Agricultural Research Service (USDA–ARS) and partners, optimized the aflatoxin biocontrol technology for use in SSA (Bandyopadhyay et al., 2016). Aflatoxin biocontrol products have been utilized in the USA for over 20 years, owing to the significant reductions in aflatoxins following treatment (Weaver et al., 2019; Ortega-Beltran and Bandyopadhyay, 2019). Several biocontrol products under the trade name Aflasafe® have been developed in various SSA countries. Aflasafe® products contain four active ingredients of atoxigenic A. flavus isolates, each belonging to distinct atoxigenic African A. flavus VCGs (AAVs) native to and widely distributed in the target nation (Moral et al., 2020; Bandyopadhyay et al., 2022). Country-specific Aflasafe® products have been effective at limiting aflatoxin contamination of chili peppers (Ezekiel et al., 2019), maize, and groundnut (Bandyopadhyay et al., 2019; Moral et al., 2020; Agbetiameh et al., 2020). A 10-year study showed that Aflasafe® product effectively reduces aflatoxin contamination in farmers’ fields at harvest and during the post-harvest period when used on a commercial scale (Bandyopadhyay et al., 2019). Maize treated with Aflasafe® consecutively for 2 or 3 years in Nigeria had significantly less aflatoxin than grain from untreated fields, regardless of application regime (Atehnkeng et al., 2022). The application of Aflasafe® in maize and groundnut in Ghana significantly reduced aflatoxins by about 76% to 100% compared to the untreated crops (Agbetiameh et al., 2020). Currently, access and cost of Aflasafe® remain a deterrent in disseminating their benefits to farmers. Information on other aspects of Aflasafe® application remains blur to most growers, including how often fields must be treated. The current recommendation is to treat groundnut with Aflasafe® at 6 weeks after planting, once every cropping cycle. A study on willingness to pay (WTP) for Aflasafe® showed positive appreciation for the product and provide basis for pricing and investment decision although access to credit and information from crop extension services were key factors influencing the WTP (Migwi et al., 2020).
4.3. Postharvest risk assessment
The risk assessment provides: i) a minimum guide on postharvest practices that can be integrated to enhance quality at no/low cost; ii) essential information at select critical control points to invest to achieve matching results and, iii) a model for postharvest risk analysis in other crops toto reduce losses. In most cases, limitations in any management practice adversely affect yield, grain quality and the profitability of production. To minimize consumer health risk to aflatoxin contamination, preventive approaches are preferred to regulatory and end-product testing. Eleven hazards which showed above average score are intermittent rain at harvest (6.5), pests attacks after harvest (6), prolonged harvest to stripping interval (6.6), insects attacks before stripping (6.1), intermittent rain prior to stripping (6.4), intermittent rain during drying (7.2), drying on bare ground (6.2), storage on bare floor (6.9), use poor efficient shelling machines (6.5), and re-use of rejected grain (6.1). Since, these hazards are consequential in nature, there should be equal emphasis on the management practices at any production operation.
5. Conclusions
This study some solutions to address aflatoxin risk in Ghana if the necessary technologies and policies are deployed. Management options that emphasize linkages among the actors (such as research, extension service, policy, regulatory agencies, agri-services providers, farmers and traders) are significant to achieving progress. Already, some interventions targeting technical capacity, detection and incentives to adopt control measures for the primary actors (e.g., farmers, traders, warehouse operators, processors, FBOs, Department of Agriculture, etc.) are being tackled, but many efforts are required. Crop management strategies such as resistant genotypes, improved seed, soil amendments, integrated pest management, and the application of Aflasafe® should be demonstrated widely to the growers. Emphasis on low-cost strategies such as improved seed, clean farm operations, quick-drying, sorting, and use of improved storage methods, which are within the management capacity of farmers, should be prioritized for dissemination. In conclusion, significant aflatoxin contamination exists in farm stores, but 80% of the samples were safe at maximum limit of 20 μg/kg. Both fertilizer application and rhizobia inoculation had significant effects on pod yield, but the application of Aflasafe® was most significant at reducing the risk of aflatoxin contamination. In addendum, good drying and storage conditions are significant to optimize the benefits from good pre-harvest technologies. Interventions to address cost limitations which hinder the adoption of these technologies require critical policy consideration.
Funding
Part of this work was funded by the European Union Horizon 2020 project [862848] “Linking East and West African farming systems experience into a belt of sustainable intensification” (EWA BELT) through the University of Sassari, Italy, and IITA-Africa RISING Program funded by the United State Agency for International Development [grant number ARG#: AID-BFS-G-11-00002].
Data Availability Statement
The original contributions presented in the study are included in the article/supplementary material, further inquiries can be directed to the corresponding author/s.
Acknowledgments
The authors wish to acknowledge the European Union Horizon 2020 project [862848] “Linking East and West African farming systems experience into a belt of sustainable intensification” (EWA BELT) through the University of Sassari, Italy, for supporting part of the data field collection. Similar appreciation to the IITA-Africa RISING Program funded by United State Agency for International Development [grant number ARG#: AID-BFS-G-11-00002]. All claims expressed in this article are solely those of the authors and do not necessarily represent those of their affiliated organizations, or those of the publisher, the editors and the reviewers..
Conflicts of Interest
No potential conflict of interest was reported by the author(s).
References
- Abudulai, M.; Mahama, G.; Dzomeku, I.; Seidu, A.; Sugri, I.; Nboyine, J.A.; Opoku, N.; Alhassan, M.; Appaw, W.; Ellis, W.; et al. Evaluation of Agricultural Practices to Increase Yield and Financial Return and Minimize Aflatoxin Contamination in Peanut in Northern Ghana. Peanut Sci. 2020, 47, 156–162. [Google Scholar] [CrossRef]
- Abudulai, M.; Naab, J.; Seini, S.S.; Dzomeku, I.; Boote, K.; Brandenburg, R.; Jordan, D. Peanut (Arachis hypogaea) response to weed and disease management in northern Ghana. Int. J. Pest Manag. 2017, 64, 204–209. [Google Scholar] [CrossRef]
- Achterbosch, T.J. 2007. Between Safety and Commerce: How Sanitary Measures Affect Global Dairy Trade. IPC Issue Brief . International Food & Agricultural Trade Policy Council. pp1-47. 24 August.
- Agbetiameh, D.; Ortega-Beltran, A.; Awuah, R.T.; Atehnkeng, J.; Elzein, A.; Cotty, P.J.; Bandyopadhyay, R. Field efficacy of two atoxigenic biocontrol products for mitigation of aflatoxin contamination in maize and groundnut in Ghana. Biol. Control. 2020, 150, 104351. [Google Scholar] [CrossRef]
- Ajeigbe, H. A. , Waliyar, F., Echekwu, C. A., Ayuba, K., Motagi, B. N., Eniayeju, D., and Inuwa, A. 2015. A farmer’s guide to groundnut production in Nigeria. Patancheru. 502(324):36.
- Appaw, W.; Ellis, W.O.; Akromah, R.; Mochiah, M.B.; Dankyi, A.; Abudulai, M.; Jordan, D.L.; Brandenburg, R.L.; Jelliffe, J.; Bravo-Ureta, B.E.; et al. Minimizing Aflatoxin Contamination in the Field, During Drying, and in Storage in Ghana. Peanut Sci. 2020, 47, 72–80. [Google Scholar] [CrossRef]
- Atehnkeng, J.; Ojiambo, P.S.; Ortega-Beltran, A.; Augusto, J.; Cotty, P.J.; Bandyopadhyay, R. Impact of frequency of application on the long-term efficacy of the biocontrol product Aflasafe in reducing aflatoxin contamination in maize. Front. Microbiol. 2022, 13, 1049013. [Google Scholar] [CrossRef]
- Awuah, R.T. , Agyemang, K.O., Fialor, S.C. and Jolly, C.M., 2009. Are Ghanaians aware of the aflatoxin menace? In: Leslie, J.F., Bandyopadhyay, R. and Visconti, A. (Eds.), Mycotoxins: Detection Methods, Management, Public Health and Agricultural Trade. CABI, Cromwell Press, UK, pp. 327–333.
- Awuah, R.T. 2000. Aflatoxigenic fungi and aflatoxin contamination of peanut and peanut-based products in Ghana: Implications and concerns. In, R. T. Awuah & W. O. Ellis (Eds.), Proceedings of a national workshop on peanut and peanut aflatoxins, (pp. 17–26). Kumasi: Kwame Nkrumah University of Science and Technology. 19–21 September.
- Awuchi, C.G. , Amagwula, I.O., Priya, P., Kumar, R., Yezdani, U. and Khan, M.G. 2020. Aflatoxins in foods and feeds: A review on health implications, detection, and control. Bull. Environ. Pharmacol. Life Sci. 9, 149–155.
- Bandyopadhyay, R.; Ortega-Beltran, A.; Akande, A.; Mutegi, C.; Atehnkeng, J.; Kaptoge, L.; Senghor, A.; Adhikari, B.; Cotty, P. Biological control of aflatoxins in Africa: current status and potential challenges in the face of climate change. World Mycotoxin J. 2016, 9, 771–790. [Google Scholar] [CrossRef]
- Mattsson, M.O.; Simkó, M. Grouping of experimental conditions as an approach to evaluate effects of extremely low-frequency magnetic fields on oxidative response in in vitro studies. Front. Public Health 2014, 2, 132. [Google Scholar] [CrossRef]
- Bandyopadhyay, R.; Ortega-Beltran, A.; Akande, A.; Mutegi, C.; Atehnkeng, J.; Kaptoge, L.; Senghor, A.; Adhikari, B.; Cotty, P. Biological control of aflatoxins in Africa: current status and potential challenges in the face of climate change. World Mycotoxin J. 2016, 9, 771–790. [Google Scholar] [CrossRef]
- Bandyopadhyay, R. , Ortega-Beltran, A., Konlambigue, M., Kaptoge, L., Falade, T.D.O., and Cotty, P.J. 2022. “Development and scale-up of bioprotectants to keep staple foods safe from aflatoxin contamination in Africa” in Microbial Bioprotectants for Plant Disease Management. eds. J. Köhl and W. J. Ravensberg (Cambridge, UK: Burleigh Dodds Science Publishing), 1–41. [CrossRef]
- Baquião, A.C.; de Oliveira, M.M.M.; Reis, T.A.; Zorzete, P.; Atayde, D.D.; Correa, B. Polyphasic approach to the identification of Aspergillus section Flavi isolated from Brazil nuts. Food Chem. 2013, 139, 1127–1132. [Google Scholar] [CrossRef] [PubMed]
- Alameri, M.M.; Kong, A.S.-Y.; Aljaafari, M.N.; Ali, H.A.; Eid, K.; Sallagi, M.A.; Cheng, W.-H.; Abushelaibi, A.; Lim, S.-H.E.; Loh, J.-Y.; et al. Aflatoxin Contamination: An Overview on Health Issues, Detection and Management Strategies. Toxins 2023, 15, 246. [Google Scholar] [CrossRef] [PubMed]
- Eskola, M.; Kos, G. , Elliott, C.T., Hajšlová, J., Mayar, S. and Krska, R. 2020. Worldwide contamination of food-crops with mycotoxins: Validity of the widely cited ‘FAO estimate’of 25%. Crit. Rev. Food Sci. Nutr. 60: 2773–2789.
- Darko, C.; Mallikarjunan, P.K.; Kaya-Celiker, H.; Frimpong, E.A.; Dizisi, K. Effects of packaging and pre-storage treatments on aflatoxin production in peanut storage under controlled conditions. J. Food Sci. Technol. 2018, 55, 1366–1375. [Google Scholar] [CrossRef]
- Dzomeku, I. K. , Baba, S., Abudulai, M., Mohammed, A. M., and Abdulai, A. L. 2019. Groundnut (Arachis hypogaea L.) response to phosphorus and weed management in the Guinea Savannah Zone of Ghana. Tropicultura. [CrossRef]
- Florkowski, W.J. , & Kolavalli, S. (2013). Aflatoxin control strategies in the peanut value chain in Ghana. Ghana Strategy Support Program (IFPRI Working Paper 33). Washington, DC: International Food Policy Research Institute (IFPRI). Retrieved from http://ebrary.ifpri.org/cdm/ref/collection/p15738coll2/id/127749.
- Emmott, A. 2013. Market-led aflatoxin interventions: Smallholder groundnut value chains in Malawi; International Food Policy Research Institute (IFPRI): Washington, DC, USA, 2013. [Google Scholar]
- Ezekiel, C.N.; Ortega-Beltran, A.; Oyedeji, E.O.; Atehnkeng, J.; Kössler, P.; Tairu, F.; Hoeschle-Zeledon, I.; Karlovsky, P.; Cotty, P.J.; Bandyopadhyay, R. Aflatoxin in Chili Peppers in Nigeria: Extent of Contamination and Control Using Atoxigenic Aspergillus flavus Genotypes as Biocontrol Agents. Toxins 2019, 11, 429. [Google Scholar] [CrossRef]
- Fafchamps, M. , Hill, R.V. and Minten, B. 2008. Quality control in non-staple food markets: Evidence from India. Agric. Econ. 38, 251–266. FAOSTAT, 2016. FAOSTAT Online Database.
- Havelaar, A.H. , Kirk, M. 2015. World Health Organization global estimates and regional comparisons of the burden of foodborne disease in 2010. PLoS Med. 12 e100 1923.
- Jolly, C.M. , Awuah, R.T.; Fialor, S.C.; Agyemang, K.O.; Kagochi, J.M., Binns, A.D. 2008. Peanut consumption Frequency in Ghana. Internat. J. Consumer Studies 32:675-686.
- Jordan, D.L.; Dunne, J.; Stalker, H.T.; Shew, B.B.; Brandenburg, R.L.; Anco, D.; Mehl, H.; Taylor, S.; Balota, M. Risk to sustainability of pest management tools in peanut. Agric. Environ. Lett. 2020, 5. [Google Scholar] [CrossRef]
- Kortei, N.K.; Agyekum, A.A.; Akuamoa, F.; Baffour, V.K.; Alidu, H.W. Risk assessment and exposure to levels of naturally occurring aflatoxins in some packaged cereals and cereal based foods consumed in Accra, Ghana. Toxicol. Rep. 2018, 6, 34–41. [Google Scholar] [CrossRef]
- Kleih, U., S.; Bosco, S. , Kumar, R., Apeeliga, J., Lalani, B. and Yawlui, S. 2020. Groundnut value chain analysis in Ghana. Report for the European Union, DG-DEVCO. Value Chain Analysis for Development Project (VCA4D CTR 2016/375- 804). Available at: https://www.google.com/url?sa=i&rct=j&q=&esrc=s&source=web&cd=&cad=rja&uact=8&ved=0CAMQw7AJahcKEwiA38XFoO_7AhUAAAAAHQAAAAAQAw&url=https%3A%2F%2Feuropa.eu%2Fcapacity4dev%2Ffile%2F10709%2Fdownload%3Ftoken%3DqGj4C8YO&psig=AOvVaw0nCG3DB4bbM2xGvh3LODo4&ust=16707686915041 29.
- Kyei-Baffour, V.O.; Ketemepi, H.K.; Brew-Sam, N.N.; Asiamah, E.; Gyasi, L.C.B.; Amoa-Awua, W.K. Assessing aflatoxin safety awareness among grain and cereal sellers in greater Accra region of Ghana: A machine learning approach. Heliyon 2023, 9, e18320. [Google Scholar] [CrossRef]
- Magnan, N.; Hoffmann, V.; Opoku, N.; Garrido, G.G.; Kanyam, D.A. Information, technology, and market rewards: Incentivizing aflatoxin control in Ghana. J. Dev. Econ. 2021, 151, 102620. [Google Scholar] [CrossRef]
- Manyo, E.S. , Waliyar, F., Osiru, M., Siambi, M. and Chinyamunyamu, B. 2009. Assessing occurrence and distribution of aflatoxins in Malawi. Technical report by ICRISAT/ The McKnight Foundation, USA/ NASFAM Malawi, pp. 1–40.
- Migwi, B.; Mutegi, C.; Mburu, J.; Wagacha, J.; Cotty, P.; Bandyopadhyay, R.; Manyong, V.M. Assessment of willingness-to-pay for Aflasafe KE01, a native biological control product for aflatoxin management in Kenya. Food Addit. Contam. Part A 2020, 37, 1951–1962. [Google Scholar] [CrossRef]
- Min, W.-K.; Kweon, D.-H.; Park, K.; Park, Y.-C.; Seo, J.-H. Characterisation of monoclonal antibody against aflatoxin B1 produced in hybridoma 2C12 and its single-chain variable fragment expressed in recombinant Escherichia coli. Food Chem. 2011, 126, 1316–1323. [Google Scholar] [CrossRef]
- Moral, J.; Garcia-Lopez, M.T.; Camiletti, B.X.; Jaime, R.; Michailides, T.J.; Bandyopadhyay, R.; Ortega-Beltran, A. Present Status and Perspective on the Future Use of Aflatoxin Biocontrol Products. Agronomy 2020, 10, 491. [Google Scholar] [CrossRef]
- Naab, J.; Tsigbey, F.; Prasad, P.; Boote, K.; Bailey, J.; Brandenburg, R. Effects of sowing date and fungicide application on yield of early and late maturing peanut cultivars grown under rainfed conditions in Ghana. Crop. Prot. 2005, 24, 325–332. [Google Scholar] [CrossRef]
- Naab, J.; Tsigbey, F.; Prasad, P.; Boote, K.; Bailey, J.; Brandenburg, R. Effects of sowing date and fungicide application on yield of early and late maturing peanut cultivars grown under rainfed conditions in Ghana. Crop. Prot. 2005, 24, 325–332. [Google Scholar] [CrossRef]
- Nboyine, J.A.; Oteng-Frimpong, R.; Arthur, S.; Sugri, I.; Puozaa, D.K.; Mahama, G.Y.; Agrengsore, P.; Mochiah, M.B.; Abudulai, M.; Dzomeku, I.K.; et al. Managing Risk: a Decision Tool to Enhance Yield and Quality of Peanut (Arachis hypogaea) in Ghana. Peanut Sci. 2023, 50, 65–84. [Google Scholar] [CrossRef]
- Njoroge, S.M.C. A Critical Review of Aflatoxin Contamination of Peanuts in Malawi and Zambia: The Past, Present, and Future. Plant Dis. 2018, 102, 2394–2406. [Google Scholar] [CrossRef]
- Nutsugah, S.K.; Oti-Boateng, C.; Tsigbey, F.K.; Brandenburg, R.L. Assessment of yield losses due to early and late leaf spots of groundnut (Arachis hypogaea L.). Ghana J. Agric. Sci. 2008, 40, 21–27. [Google Scholar] [CrossRef]
- Oaya, C.S. , Malgwi, A.M. and Samaila, A.E. 2012. Damage potential and loss caused by the groundnut bruchid, Caryedon serratus Olivier (Coleoptera: Bruchidae) on stored groundnut and tamarind in Yola. Journal of Agriculture and Veterinary Science 1(6): 58-62.
- Omari, R. , Tetteh, E.K., Baah-Tuahene, S., Karbo, R., Adams, A., Asante, I.K. 2020. Aflatoxins and their Management in Ghana: A Situational Analysis. FARA Research Report 5(20): PP 80.
- Agbetiameh, D.; Ortega-Beltran, A.; Awuah, R.T.; Atehnkeng, J.; Elzein, A.; Cotty, P.J.; Bandyopadhyay, R. Field efficacy of two atoxigenic biocontrol products for mitigation of aflatoxin contamination in maize and groundnut in Ghana. Biol. Control. 2020, 150, 104351. [Google Scholar] [CrossRef]
- Molo, M.S.; Heiniger, R.W.; Boerema, L.; Carbone, I. Trial Summary on the Comparison of Various Non-Aflatoxigenic Strains of Aspergillus flavus on Mycotoxin Levels and Yield in Maize. Agron. J. 2019, 111, 942–946. [Google Scholar] [CrossRef]
- Ortega-Beltran, A.; Cotty, P.J. Frequent Shifts inAspergillus flavusPopulations Associated with Maize Production in Sonora, Mexico. Phytopathology® 2018, 108, 412–420. [Google Scholar] [CrossRef]
- Ouakhssase, A.; Chahid, A.; Choubbane, H.; Aitmazirt, A.; Addi, E.A. Optimization and validation of a liquid chromatography/tandem mass spectrometry (LC-MS/MS) method for the determination of aflatoxins in maize. Heliyon 2019, 5, e01565. [Google Scholar] [CrossRef]
- Oyedele, O.A.; Ezekiel, C.N.; Sulyok, M.; Adetunji, M.C.; Warth, B.; Atanda, O.O.; Krska, R. Mycotoxin risk assessment for consumers of groundnut in domestic markets in Nigeria. Int. J. Food Microbiol. 2017, 251, 24–32. [Google Scholar] [CrossRef]
- Posey, S.; Magnan, N.; McCullough, E.B.; Hoffmann, V.; Opoku, N.; Alidu, A.-H. Challenges to groundnut value chain development: lessons from an (attempted) experiment in Ghana. J. Dev. Eff. 2024, 1–17. [Google Scholar] [CrossRef]
- Shanahan, H. , Carisson-Kanyama, A., Offei-Ansah, C., Ekström, M.P., Potapova, M. 2003. Family meals and disparities in global ecosystem dependency—Three examples: Ghana, Russia and Sweden. Int. J. Consumer Studies 27(4):283–293.
- Soman, R. and Raman, M. 2016. HACCP system – hazard analysis and assessment, based on ISO 22000:2005 methodology. Food control 69: 191-195. [CrossRef]
- Subrahmaniyan, K.; Kalaiselvan, P.; Arulmozhi, N. Weed control in groundnut (Arachis hypogaea L.) with polyethylene film mulching. Int. J. Pest Manag. 2002, 48, 261–264. [Google Scholar] [CrossRef]
- Sugri, I.; Osiru, M.; Abudulai, M.; Abubakari, M.; Asieku, Y.; Lamini, S.; Zakaria, M. Integrated peanut aflatoxin management for increase income and nutrition in Northern Ghana. Cogent Food Agric. 2017, 3. [Google Scholar] [CrossRef]
- Teles, J. Concordance coefficients to measure the agreement among several sets of ranks. J. Appl. Stat. 2012, 39, 1749–1764. [Google Scholar] [CrossRef]
- Tsigbey, F.K. , Brandenburg, R.L., Clottey, V.A. 2003. Peanut production methods in northern Ghana and some disease perspectives. Online Journal of Agronomy. 34(2): 36-47.
- Walker, S. C. , Culbreath, A. K., Gianessi, L., and Godfrey, L. D. 2014. The contributions of pesticides to pest management in meeting the global need for food production by 2050. Issue Paper-Council for Agricultural Science and Technology. 55:28.
- Waliyar, F. , Kumar, P.L., Traore, A., Ntare, B.R., Diarra, B. and Kodio, O. 2008. Pre-and post-harvest management of aflatoxin contamination in peanuts. In Leslie, J.F., Bandyopadhyay, R & Visconti, A, (eds), Mycotoxins: Detection methods, management, public health and agricultural trade. CAB International, pp. 209–218.
- Weaver, M.A.; Abbas, H.K. Field Displacement of Aflatoxigenic Aspergillus flavus Strains Through Repeated Biological Control Applications. Front. Microbiol. 2019, 10, 1788. [Google Scholar] [CrossRef] [PubMed]
- WHO Report, 2016: Evaluations of the Joint FAO/WHO Expert Committee on Food Additives (JECFA). Retrieved on 14-Dec.2023: https://apps.who.int/food-additives-contaminants-jecfa-database/Home/Chemical/5639.
- Wu, F.; Groopman, J.D.; Pestka, J.J. Public Health Impacts of Foodborne Mycotoxins. Annu. Rev. Food Sci. Technol. 2014, 5, 351–372. [Google Scholar] [CrossRef]
- Yahaya, I. , Dankyi, A. , Nboyine, J.A., Abudulai, M., Mahama, G.; et al. Adoption of post-harvest strategies to minimize aflatoxin contamination in groundnut (Arachis hypogaea) in Ghana. Arch. Agri. Res. Technol. 2022, 3, 1042. [Google Scholar]
Figure 1.
A problem tree analysis of groundnut production systems in northern Ghana.
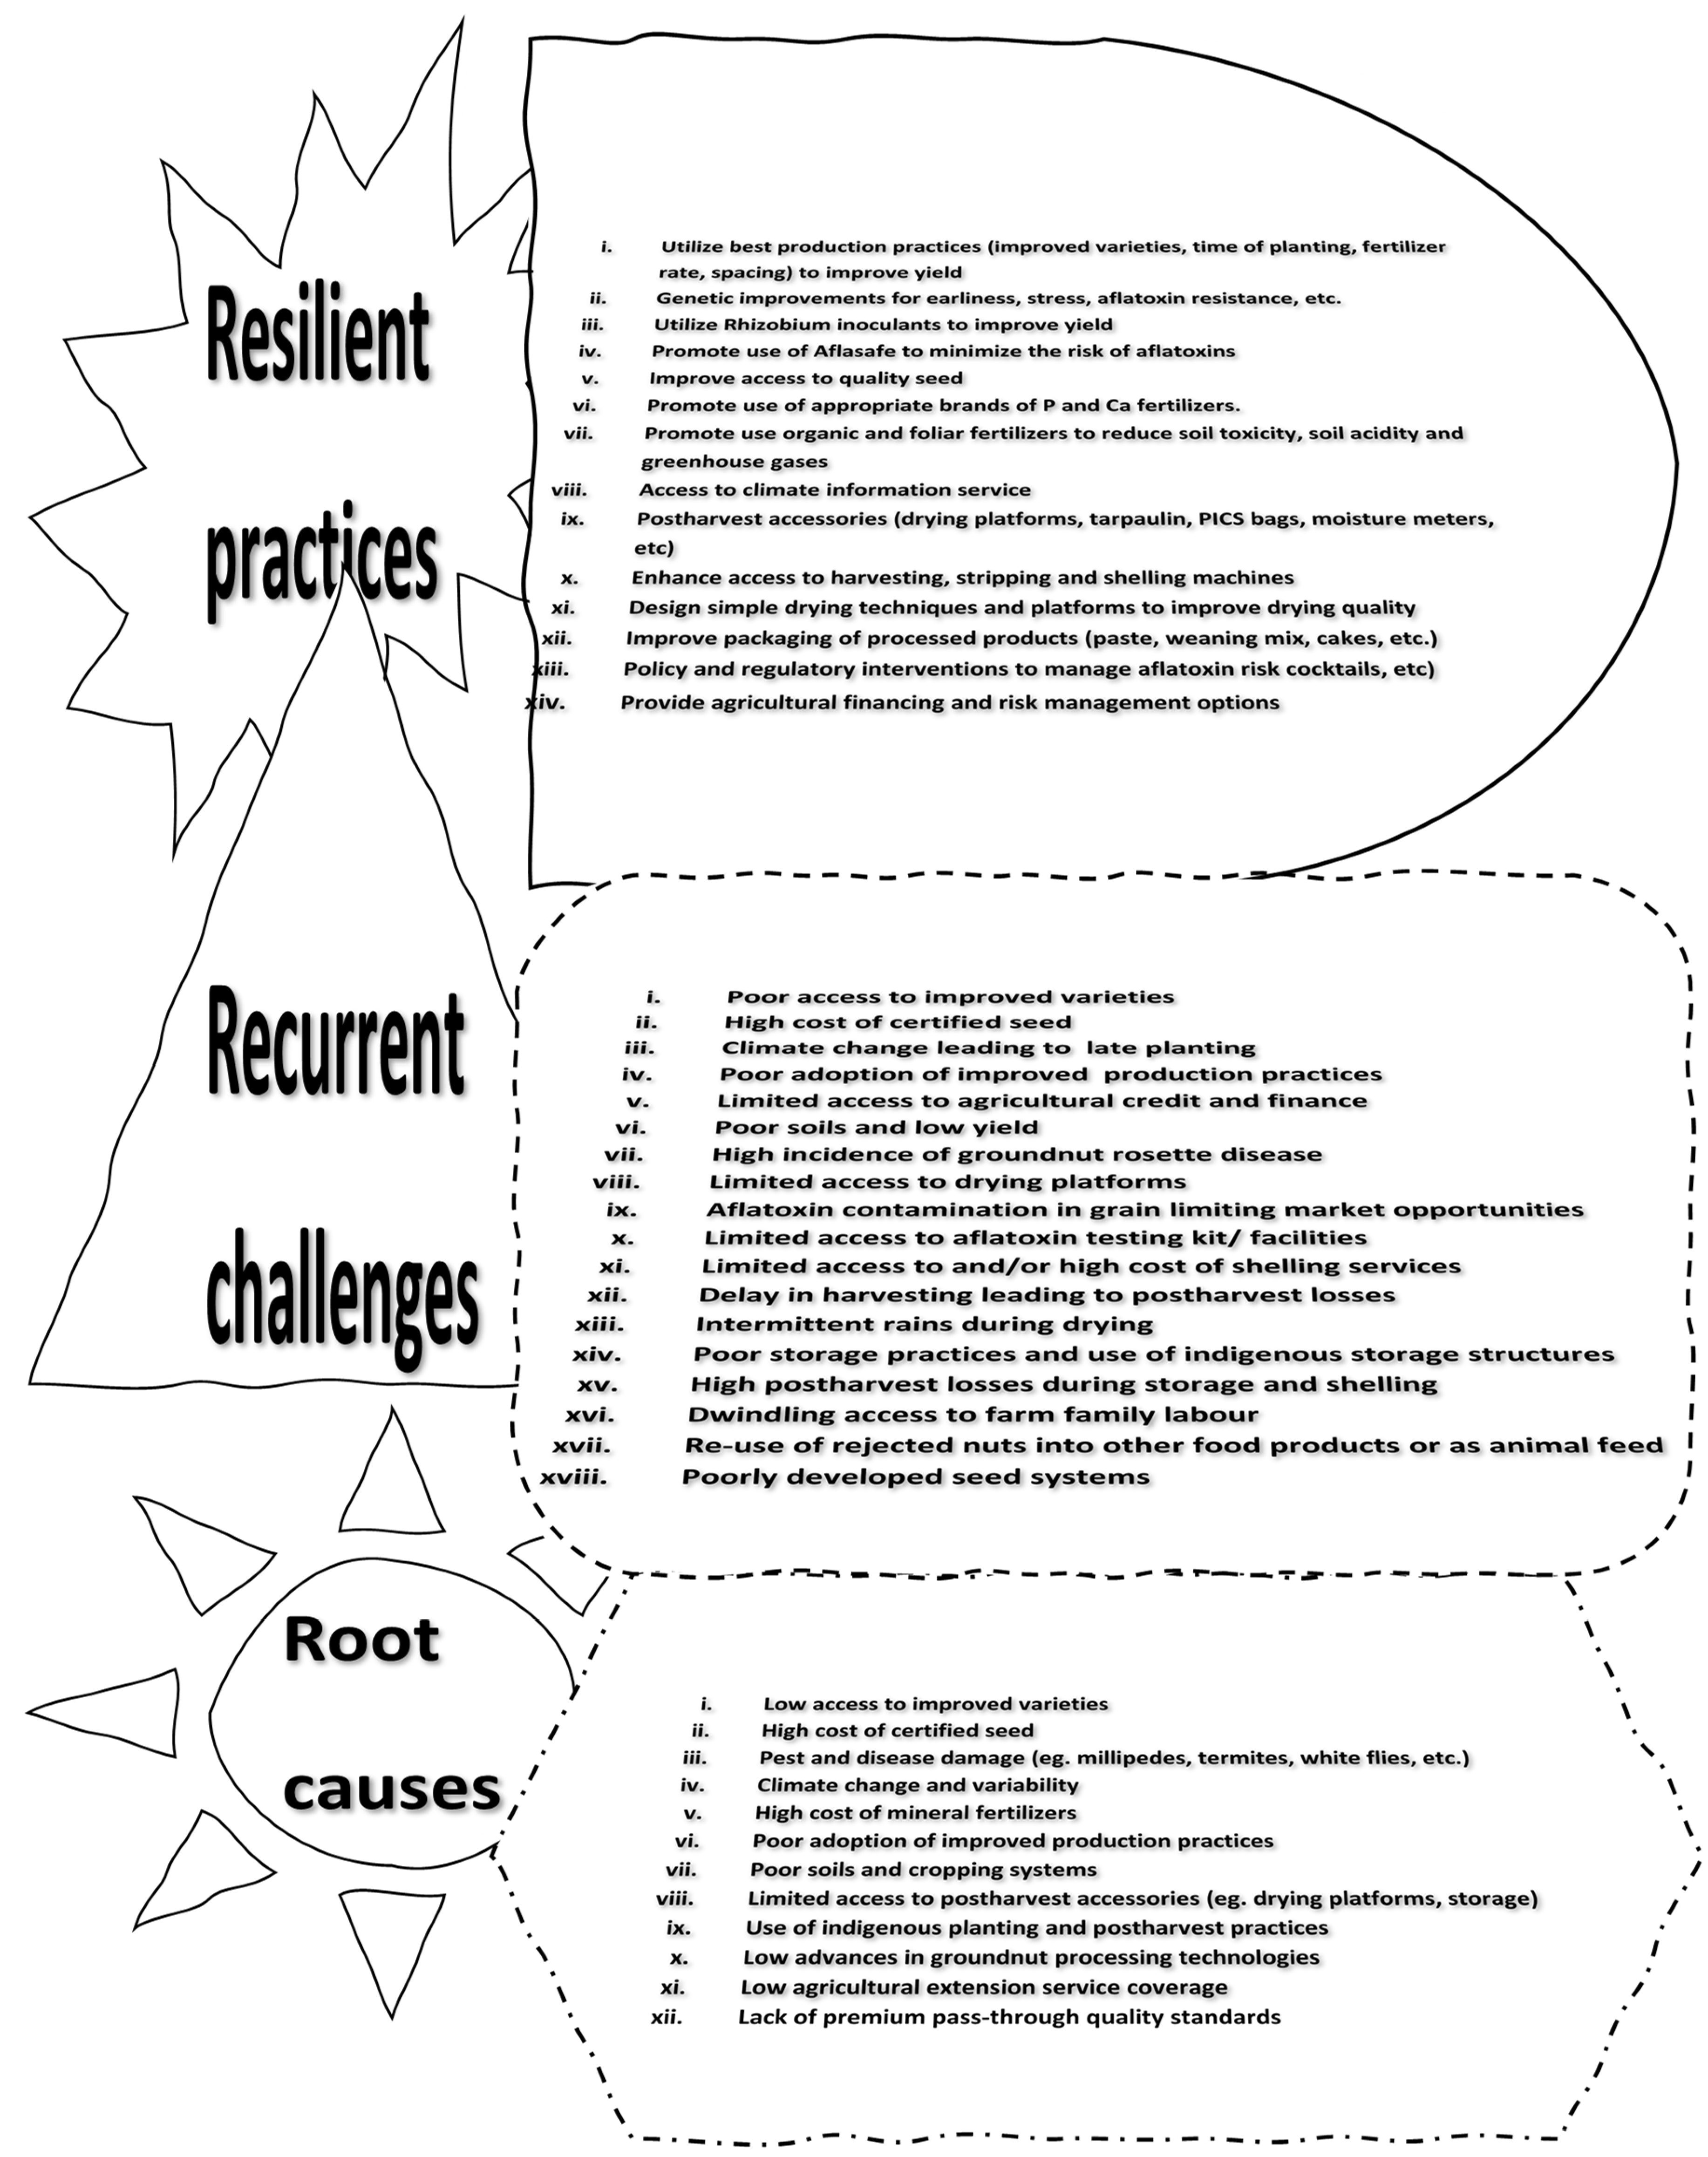
Figure 2.
SWOT analysis of postharvest operations with high risk on groundnut grain quality.
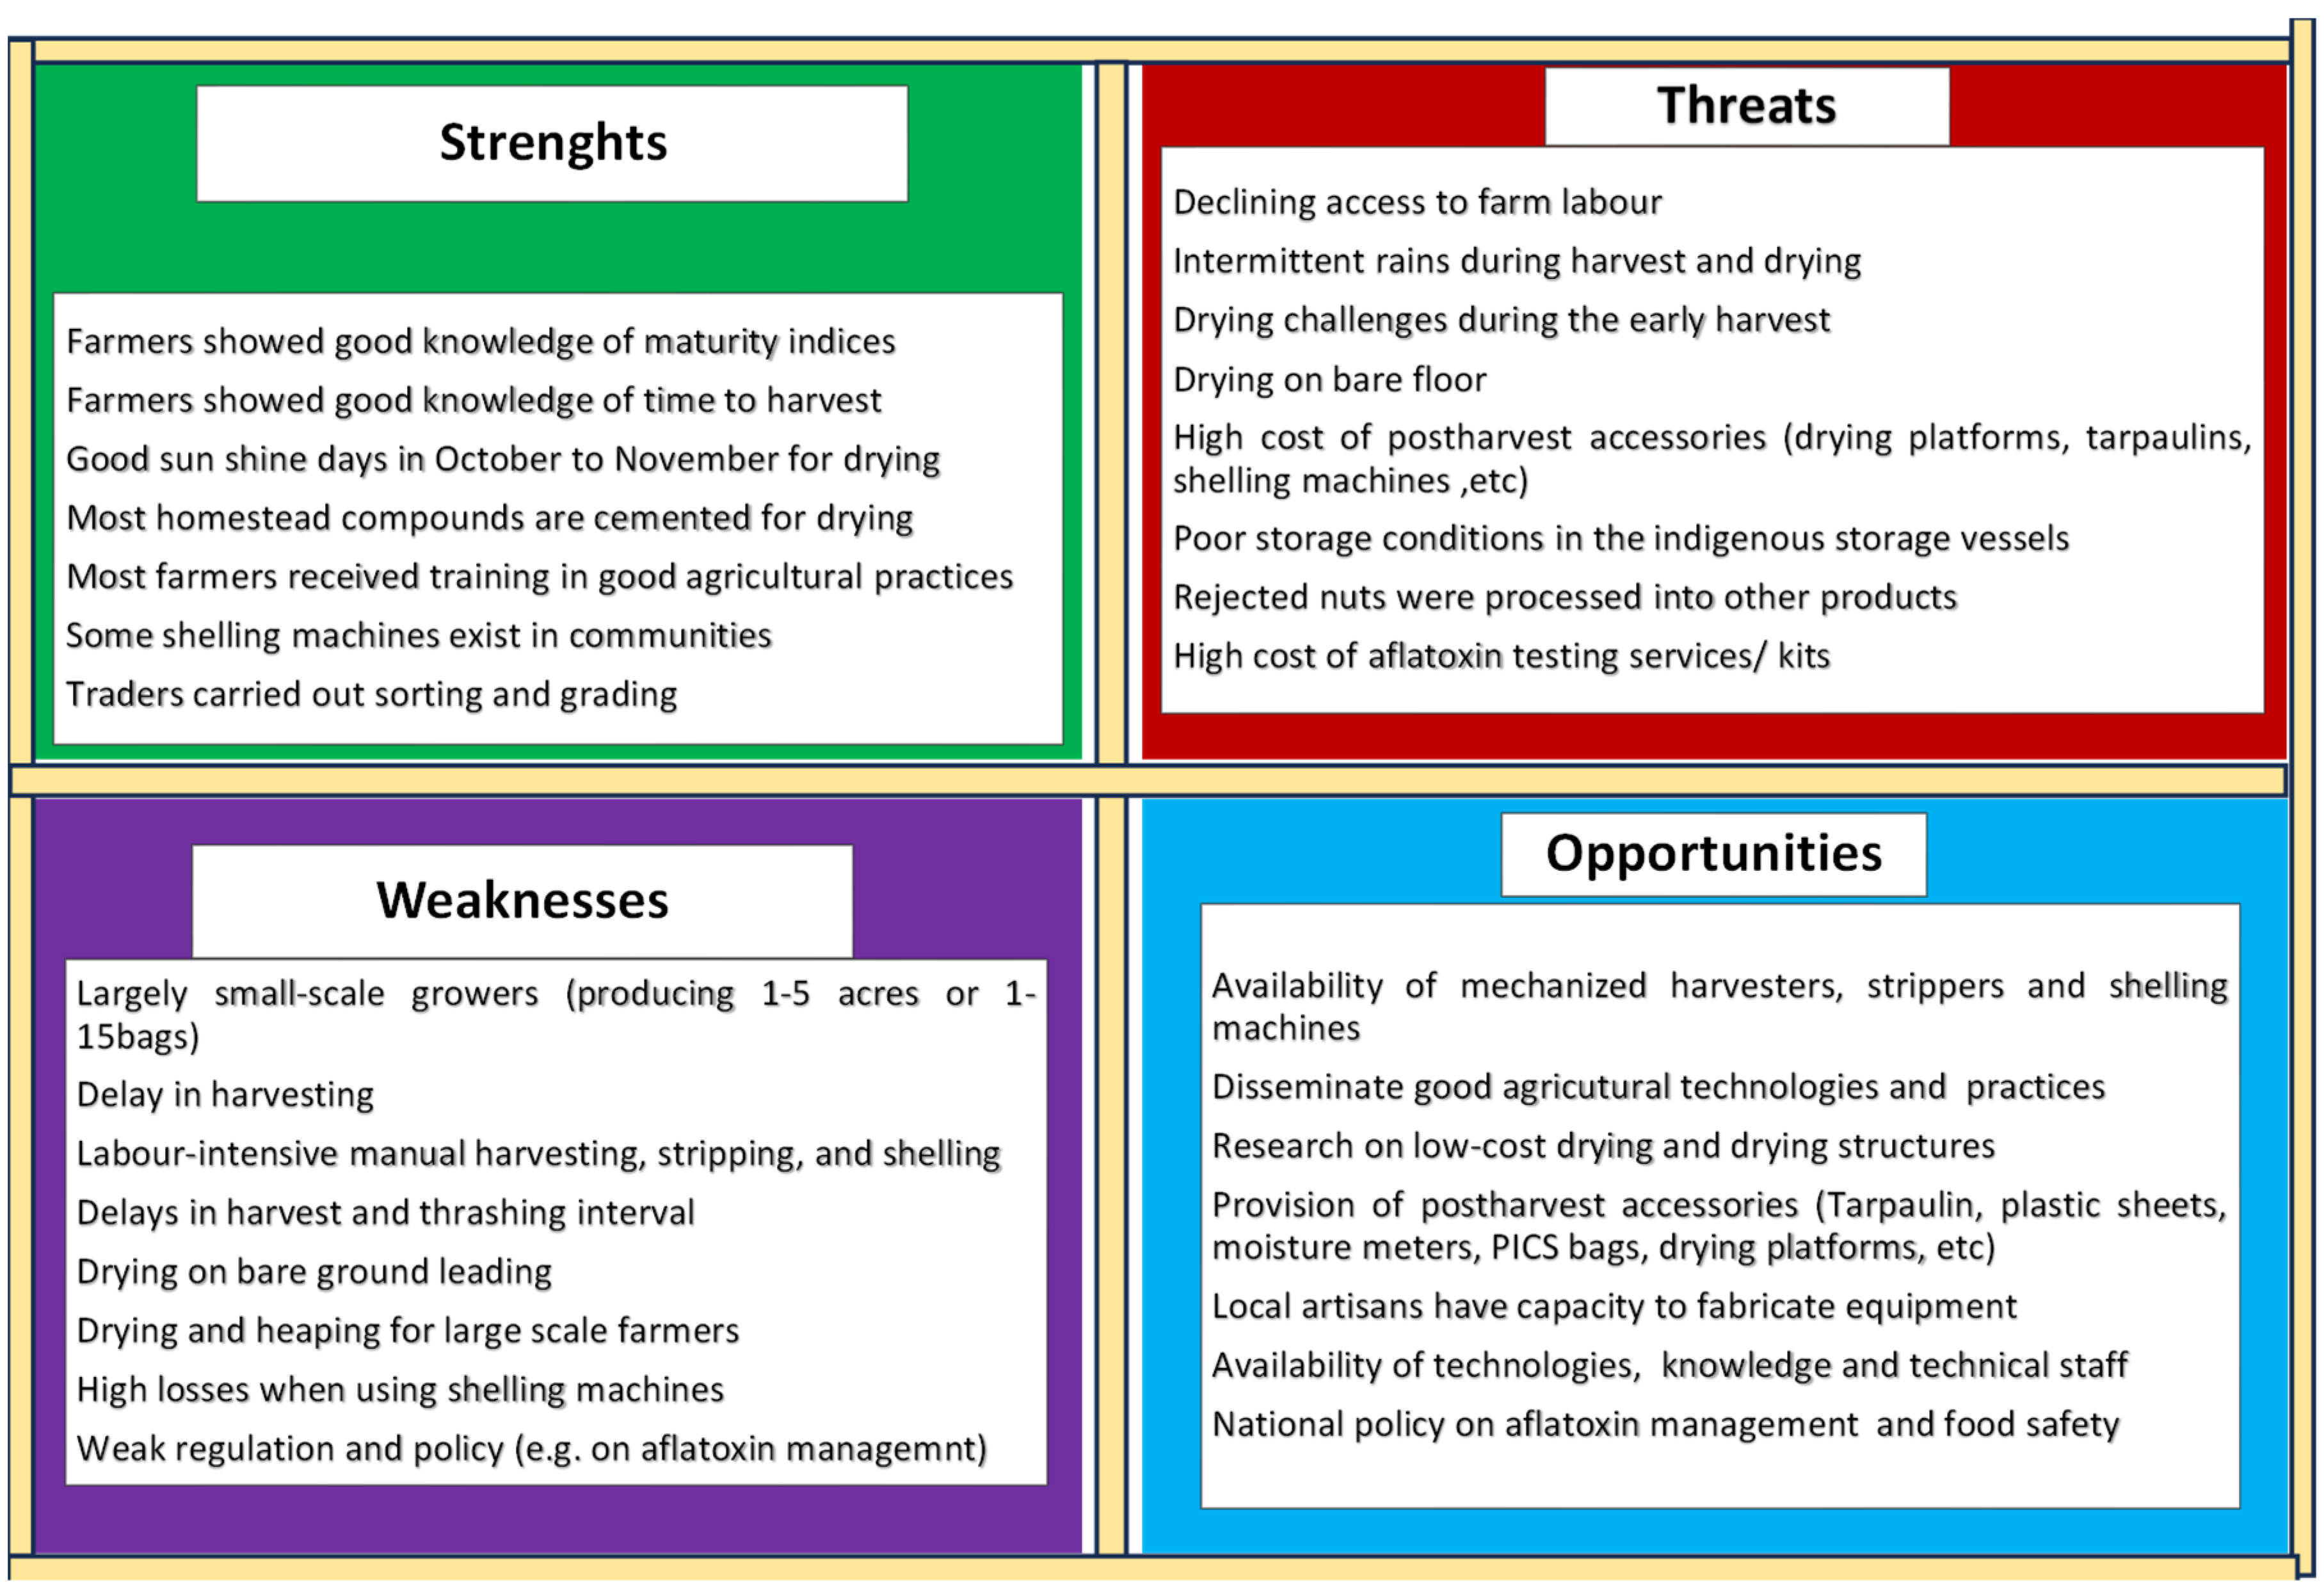

Table 1.
Description of the districts and communities covered in the value chain analysis in northern Ghana.
Table 1.
Description of the districts and communities covered in the value chain analysis in northern Ghana.
| Region | District | Communities | Total respondents |
|---|---|---|---|
| Northern | Savelugu, | Tibali, Doku | 50 |
| Tolon | Cheyohi, Tingoli | 50 | |
| Upper East | Kassena Nankane East Municipal | Bonia, Gia, Tekuru | 75 |
| Bongo | Sambligo | 25 | |
| Upper West | Wa West | Nyagli, Siriyili | 50 |
| Nadowli | Goriyili, Papu | 50 |
Table 2.
Characterization of hazards in the postharvest operations of groundnut in northern Ghana.
| Postharvest operations | Sources of risk (hazards) | Score of 1-10 (where score 1: no hazard to score10: the highest hazard on grain quality |
| Maturation | Knowledge of maturity signs, late harvesting, sprouting on the farm, drought at maturity | |
| Harvesting | Time of harvest, delay in harvest, soil particles on pods, intermittent drought at harvest, intermittent rain at harvest, insect pests attack, gleaning for pods after harvest | |
| Stripping | Delay in harvest to stripping interval, insect pests attack before stripping, poor shaking to remove soil particles, intermittent rain before stripping, physical damage on pods | |
| Drying | Intermittent rains during drying, drying on the farm, drying both vines and nuts, drying on bare ground, drying on tarpaulin, drying on concrete floor, drying to safe moisture content, access to moisture meter | |
| Conveying | Poor ventilation in vehicles, no tarpaulin to cover produce | |
| Storage | Type of storage method, storage in jute or poly bags, storage in pics bags, place of storage, storage duration, storage of bags bare floor, storage unshelled pods, storage of shelled nut | |
| Shelling | Re-wetting of nuts to facilitate shelling, re-drying of nuts after shelling, risk from manual shelling, risk from mechanical shelling, risk from efficient shelling machines | |
| Sorting and grading | No or minimal sorting after shelling, re-use of downgrade nuts, prolonged storage of shelled nuts | |
| Processing | Processing at the right moisture content, good hygiene practices, appropriate packaging method | |
| Auxiliary services | Training on postharvest management, availability of postharvest facilities, access to information via mass media |
Table 3.
Description of districts and communities covered in a survey of aflatoxin incidence in northern Ghana.
Table 3.
Description of districts and communities covered in a survey of aflatoxin incidence in northern Ghana.
| Region | District | Communities | Total samples for aflatoxin analysis |
|---|---|---|---|
| Northern | Savelugu | Napkanzoo, Pong Tamale, Diare, Moglaa, Langa | 20 |
| North East | West Mamprusi | Zangum, Tinguri, Kparigu, Kukua, Nayoku | 20 |
| Upper East | Talense | Pwalugu, Gorogo, Wakii, Sheaga, Datoku | 20 |
| Upper East | Nabdam | Kontintaabig, Zanlerigu, Asonge, Nangodi, Daaliga | 20 |
Table 4.
Some socio-demographic and production characteristics of groundnut farmers in northern Ghana.
Table 4.
Some socio-demographic and production characteristics of groundnut farmers in northern Ghana.
| Variables | Description | Region of study | Total | Chi-Value | ||
|---|---|---|---|---|---|---|
| Northern | Upper East | Upper West | ||||
| Gender | Male Female |
69.0 31.0 |
45.5 54.5 |
46.5 53.5 |
53.7 46.3 |
14.2*** |
| Age (years) | 18-35 36-45 46-60 Above 60 |
19.0 41.0 36.0 4.0 |
32.7 48.4 14.9 4.0 |
25.3 44.4 19.2 11.1 |
25.7 44.6 23.3 6.3 |
20.2*** |
| Educational level | No formal education Basic education Tertiary education |
71.0 26.0 3.0 |
14.9 79.2 5.9 |
59.6 33.3 7.1 |
57.7 33.0 9.3 |
74.0 |
| Name of variety | Chinese I do not know Improved/Agric Other local names |
76.0 17.0 3.0 4.0 |
14.9 75.2 5.9 4.0 |
10.1 55.6 22.2 12.1 |
33.7 49.3 10.4 6.7 |
143.0 |
| Sources of seed for planting | Own seed Recycled improve seed Certified seed |
91.0 7.0 2.0 |
- 76.2 23.8 |
84.8 13.2 2.0 |
84.1 14.7 1.3 |
213.7 |
| Farm of size | <1 ha 1-3 ha 4-10 ha >10 ha |
64.0 23.0 13.0 - |
42.6 55.4 2.0 - |
48.5 45.5 5.0 1.0 |
51.7 44.7 3.3 0.3 |
29.8 |
| Peak period of planting | April May June July August |
19.0 76.0 5.0 - - |
2.0 5.9 37.6 50.5 4.0 |
17.2 58.6 21.2 3.0 - |
12.7 46.7 21.3 18.0 1.3 |
193.6 |
The p-value are represented by ⁎⁎⁎ρ < 0.01; ⁎⁎ρ < 0.05; ⁎ ρ < 0.1.
Table 5.
Description of some post-harvest operations and practices in northern Ghana.
| Variables | Description | Region of study | Total | Chi-Value | ||
|---|---|---|---|---|---|---|
| Northern | Upper East | Upper West | ||||
| Quantity harvested during last season | 1-5 bags 6-10 bags Above 10 bags |
25.0 33.0 42.0 |
81.2 15.8 3.0 |
46.5 29.3 24.2 |
51.5 26.0 23.0 |
7 |
| Peak period of harvesting | July August September October November |
5.0 20.0 67.0 8.0 0.0 |
0.0 5.0 25.7 63.4 5.9 |
3.0 57.6 26.3 12.1 1.0 |
2.7 28.3 39.7 28.0 2.3 |
163.5 |
| Method of drying | Wind rowing on farm Drying vines and pods Drying on bare ground Drying on concrete floor Drying on tarpaulin Drying at local platform |
20.0 55.0 7.0 4.0 13.0 1.0 |
2.0 4.0 78.2 8.8 5.0 2.0 |
9.2 24.2 23.2 26.3 11.1 6.0 |
10.4 28.0 36.1 13.0 9.7 3.0 |
169.9 |
| Method of determining grain moisture content | Visual/sound method Hand feel Number of drying days Use moisture meter Crack and chew |
72.0 1.0 27.0 0.0 0.0 |
71.2 13.9 1.0 1.0 12.9 |
36.4 15.1 48.5 0.0 0.0 |
60.0 9.7 25.5 0.3 29.3 |
98.2 |
| Method of storage | Jute bags Poly bags PICS bags Mud silo |
20.0 75.0 5.0 0.0 |
23.8 74.2 1.0 1.0 |
4.0 90.9 5.1 0.0 |
16.1 80.0 3.7 0.3 |
21.1*** |
| Method of shelling | Hand shelling Machine |
100.0 - |
100.0 - |
97.0 3.0 |
99.0 1.0 |
6.1** |
| Knowledge of harvesting practices affecting groundnut quality | No awareness Some little knowledge Enough knowledge Very good knowledge |
73.0 27.0 0.0 0.0 |
60.4 24.7 13.9 1.0 |
14.2 54.5 19.2 12.1 |
49.3 35.3 11.0 4.3 |
93.0 |
The p-value are represented by ⁎⁎⁎ρ < 0.01; ⁎⁎ρ < 0.05; ⁎ ρ < 0.1.
Table 6.
Description of grain moisture content, physical purity and threshing losses in northern Ghana.
Table 6.
Description of grain moisture content, physical purity and threshing losses in northern Ghana.
| District | Grain moisture (%) | Threshing losses (%) |
Grain physical purity (%) |
|---|---|---|---|
| Kassena Nankane East Binduri Savelugu Karaga |
7.6 7.4 7.4 7.1 |
9.5 11.1 15.8 17.1 |
89.4 88.4 82.0 82.2 |
| Grand mean Sig. level LDS(P<0.05) CV (%) |
7.4 Ns 0.7 13 |
13.0 0.01 4.2 44 |
85.5 0.01 4.1 6 |
Table 7.
Analysis of hazards in the post-harvest operations in northern Ghana.
| Postharvest operations | Sources of hazards | Mean score | SD | Mean rank | Overall rank | Kendall’s | Chi-Value |
|---|---|---|---|---|---|---|---|
| Maturation | Knowledge of maturity signs Late harvesting Sprouting on the farm Drought at maturity |
3.0 2.9 2.1 2.1 |
2.1 2.1 1.8 1.1 |
2.3 1.9 1.5 1.6 |
1 2 4 3 |
0.011 | 6.65 |
| Harvesting | Time of harvest Delay in harvest Soil particles on pods Intermittent drought at harvest Intermittent rain at harvest Insect pests attack Gleaning for pods after harvest |
4.5 7.1 5.0 5.6 6.5 6.0 4.1 |
3.3 2.7 2.7 3.0 3.0 2.5 2.8 |
3.2 5.2 3.6 4.3 4.6 4.4 2.7 |
6 1 5 4 2 3 7 |
0.19 | 334.0*** |
| Stripping | Harvest to stripping interval Insect pests attack Shaking to remove soil particles Intermittent rain before stripping Physical damage on pods |
6.1 4.7 6.4 4.2 |
2.8 2.7 3.0 2.8 |
3.5 2.5 3.4 2.1 |
1 3 4 2 5 |
0.226 | 267*** |
| Drying | Intermittent rains during drying Drying in the farm Drying both vines and nuts Drying on bare ground Drying on tarpaulin Drying on concrete floor Drying to safe moisture content Access to moisture meter |
7.2 5.4 5.4 6.2 2.1 2.4 2.5 2.5 |
2.7 2.9 2.7 2.9 1.9 2.3 2.3 2.4 |
6.9 5.5 5.6 6.1 2.8 3.0 3.2 2.9 |
1 4 3 2 8 6 5 7 |
0.526, | 1094.6*** |
| Conveying | Poor ventilation in vehicles No tarpaulin to cover produce |
4.5 5.0 |
2.8 3.1 |
1.5 1.6 |
2 1 |
0.007 | 2.19 |
| Storage | Type of storage method Storage in jute or poly bags Storage in pics bags Place of storage Storage duration Storage of bags bare floor Storage unshelled pods Storage of shelled nut |
4.0 3.1 2.2 3.9 4.0 6.9 3.1 4.7 |
3.0 2.1 2.2 2.8 2.8 2.7 2.1 2.6 |
4.5 3.9 2.8 4.3 4.5 6.7 4.0 5.4 |
3 6 7 4 3 1 5 2 |
0.243 | 499.8*** |
| Shelling | Re-wetting prior to shelling Re-drying of nuts after shelling Risk from manual shelling Risk from mechanical shelling Poor efficient shelling machines |
5.3 3.8 2.6 5.0 6.5 |
3.8 2.8 2.0 2.9 2.8 |
3.4 2.6 2.0 3.1 3.9 |
2 4 5 3 1 |
0.233 | 278.6*** |
| Sorting and grading | Low or no sorting after shelling Re-use of downgrade nuts Prolong storage of shelled nuts |
5.5 6.1 5.0 |
2.9 2.6 2.6 |
2.0 2.2 1.8 |
2 1 3 |
0.044 | 26.1*** |
| Processing | Processing at safe moisture content Good hygiene practices Appropriate packaging method |
3.0 2.9 3.1 |
2.3 2.1 1.8 |
2.0 1.9 2.1 |
2 3 1 |
0.011 | 6.65** |
| Auxiliary services | Training on postharvest Access to postharvest facilities Information access |
4.4 4.6 4.0 |
2.9 3.0 2.6 |
2.0 2.2 1.9 |
2 1 3 |
0.033 | 19.61*** |
The p-value is represented by ⁎⁎⁎ρ < 0.01; ⁎⁎ρ < 0.05; ⁎ ρ < 0.1.
Table 8.
Physical characteristics of grain sampled from on-farm stores in four districts of northern Ghana (sampling at ~5-7 months after harvest).
Table 8.
Physical characteristics of grain sampled from on-farm stores in four districts of northern Ghana (sampling at ~5-7 months after harvest).
| District | Inert materials (%) | Shrivelled grain (%) | Mouldy grain (%) | Average standard whole grain (%) | 100 grain weight (g) | Grain moisture content (% wb) |
Germination (%) | Storage losses (%) |
Total impurity (%) |
|---|---|---|---|---|---|---|---|---|---|
| West-Mamprusi Savelugu Nabdam Talense |
0.40 0.20 0.10 0.10 |
9.10 9.20 6.00 7.90 |
4.0 4.4 3.4 1.9 |
84.0 86.1 91.3 89.7 |
37.4 37.1 36.6 34.0 |
4.6 4.8 6.2 5.1 |
81.5 82.6 81.1 74.7 |
7.5 9.0 5.4 6.5 |
17.4 18.4 12.0 9.6 |
| Sig. level Grand mean CV (%) LSD(p<0.05) |
0.01 0.2 23.4 0.09 |
ns 8.0 21.4 3.2 |
ns 3.9 40.3 2.6 |
ns 87.9 5.8 9.6 |
ns 36.3 11.9 3.1 |
0.01 5.2 9.8 0.36 |
ns 79.9 14.7 8.3 |
ns 7.1 56.5 2.9 |
0.05 14.4 21.3 5.8 |
Table 9.
Total aflatoxin levels in groundnut sampled from on-farm stores in four districts of northern Ghana (sampling at ~5-7 months after harvest).
Table 9.
Total aflatoxin levels in groundnut sampled from on-farm stores in four districts of northern Ghana (sampling at ~5-7 months after harvest).
| District | Total aflatoxin levels (μg/kg) | % of samples at maximum limit of (μg/kg) | |||||||
|---|---|---|---|---|---|---|---|---|---|
| Mean | Min. | Max. | Confidence interval (@95%) | 0 | 4 | 15 | 20 | >20 | |
| Savelugu West Mamprusi Nabdam Talensi |
11.3 13.6 16.4 14.6 |
1.3 0.0 0.0 1.3 |
34.2 36.0 99.5 36.9 |
6.6-16.1 8.8-19.1 2.7-30.2 9.3-19.9 |
- 20 20 - |
30 20 40 20 |
65 40 70 50 |
80 80 80 80 |
20 20 20 20 |
| Grand mean Sign. level CV (%) |
14.0 ns 123.7 |
0.0 | 99.5 | 2.7-19.9 | 10 | 27 | 56 | 80 | 20 |
Table 10.
Growth and yield parameters as affected by variety, fertilizer application, and microbial amendments at location Nyankpala in northern Ghana.
Table 10.
Growth and yield parameters as affected by variety, fertilizer application, and microbial amendments at location Nyankpala in northern Ghana.
| Treatment | Plant count | Plant height (cm) |
Number of branches | Canopy spread (cm) |
Nodule count | Number of pods per plant | Late leaf spot score | Stover yield (t/ha) |
Pod yield (t/ha) |
|---|---|---|---|---|---|---|---|---|---|
| Variety | |||||||||
| SARINUT 2 Yenyawoso Sig. level |
79.2 73.9 ns |
36.4 27.5 0.05 |
6.0 6.3 ns |
44.9 44.8 ns |
94.4 81.9 ns |
32.1 32.2 ns |
1.6 1.6 ns |
2.6 1.6 0.05 |
0.93 0.94 Ns |
| Mineral Fertilizer | |||||||||
| Control Yara Legume TSP Sig. level |
80.8 74.6 74.2 ns |
32.3 31.6 32.0 ns |
6.3 5.9 6.3 ns |
45.1 44.2 45.2 ns |
83.0 89.2 92.2 ns |
32.9 31.5 31.9 ns |
1.5a 1.5a 1.8b 0.05 |
2.1 2.0 2.3 ns |
0.74 0.93(25.6) 1.13(52.7) 0.05 |
| Microbial amendments | |||||||||
| Control Rhizobia inoculant Aflasafe® Sig. level |
76.3 80.4 72.8 ns |
32.2 31.6 32.1 ns |
6.1 6.0 6.2 ns |
44.5 46.4 43.7 ns |
74.8 102.6 87.0 0.05 |
33.6 31.1 31.7 0.05 |
1.4 1.7 1.7 ns |
2.3 2.4 1.7 0.05 |
0.72 1.05(45.8) 1.03(43.1) 0.01 |
| Grand mean CV |
76.5 4.3 |
32.0 0.2 |
6.2 3.7 |
44.8 2.3 |
88.1 16.0 |
32.1 6.1 |
1.59 10.50 |
2.1 0.6 |
0.93 3.1 |
Table 11.
Growth and yield parameters as affected by variety, fertilizer application, and microbial amendments at location Manga in northern Ghana.
Table 11.
Growth and yield parameters as affected by variety, fertilizer application, and microbial amendments at location Manga in northern Ghana.
| Treatment | Plant count | Plant height (cm) |
Number of branches | Canopy spread (cm) |
Nodule count | Number of pods per plant | Late leaf spot score | Stover yield (t/ha) |
Pod yield (t/ha) |
|---|---|---|---|---|---|---|---|---|---|
| Variety | |||||||||
| SARINUT 2 Yenyawoso Sig. level |
78.8 59.8 0.001 |
38.4 28.9 0.001 |
7.3 5.8 0.01 |
47.6 46.2 ns |
53.7 50.2 ns |
14.9 10.4 0.01 |
1.6 1.7 Ns |
1.8b 0.85 0.001 |
0.66.9 0.36 0.01 |
| Mineral fertilizer | |||||||||
| Control TSP YaraLegume Sig. level |
70.6 71.1 66.2 ns |
31.1 35.3 34.5 0.05 |
6.1 7.1 6.4 ns |
44.7 46.8 49.3 ns |
44.6 58.2 35.1 0.01 |
12.1 12.6 13.1 ns |
1.7 1.5 1.8 Ns |
1.2 1.7 1.0 0.05 |
0.38 0.45(18.4) 0.70(84.2) 0.01 |
| Microbial amendments | |||||||||
| Control Rhizobia inoculant Aflasafe® Sig. level |
74.3 68.6 65.0 ns |
35.2 32.5 33.3 ns |
6.7 6.8 6.1 ns |
46.8 47.0 47.0 ns |
47.4 60.1 48.4 0.01 |
13.6 13.0 11.2 ns |
1.6 1.9 1.4 Ns |
1.3 1.5 1.2 ns |
0.48 0.55(14.6) 0.51(5.3) Ns |
| Grand mean CV |
69.3 17.0 |
33.6 12.8 |
6.5 20.9 |
45.9 13.5 |
52 27.7 |
12.6 36.9 |
1.7 46.7 |
1.3 55.2 |
0.51 54.4 |
Table 12.
Effect of integrated management practices (variety, fertilizer application and microbial amendments) on aflatoxin incidence in northern Ghana.
Table 12.
Effect of integrated management practices (variety, fertilizer application and microbial amendments) on aflatoxin incidence in northern Ghana.
| Variety | Fertilizer type | Application of microbial amendments | Total aflatoxins (μg/kg) (8 months after harvest) | |
|---|---|---|---|---|
| Nyankpala | Manga | |||
| Yenyawaso | Control YaraLegume TSP |
- - - |
0.7 Not detected Not detected |
Not detected ” ” |
| Sarinut 2 | Control YaraLegume TSP |
- - - |
0.8 Not detected Not detected |
” ” ” |
| Yenyawaso | Control YaraLegume TSP |
Rhizobia inoculant Rhizobia inoculant Rhizobia inoculant |
” ” ” |
” ” ” |
| Sarinut 2 | Control YaraLegume TSP |
Rhizobia inoculant Rhizobia inoculant Rhizobia inoculant |
0.8 Not detected |
” ” ” |
| Yenyawaso | Control YaraLegume TSP |
Aflasafe® Aflasafe® Aflasafe® |
” ” ” |
” ” ” |
| Sarinut 2 | Control YaraLegume TSP |
Aflasafe® Aflasafe® Aflasafe® |
” ” ” |
” ” ” |
Disclaimer/Publisher’s Note: The statements, opinions and data contained in all publications are solely those of the individual author(s) and contributor(s) and not of MDPI and/or the editor(s). MDPI and/or the editor(s) disclaim responsibility for any injury to people or property resulting from any ideas, methods, instructions or products referred to in the content. |
© 2024 by the authors. Licensee MDPI, Basel, Switzerland. This article is an open access article distributed under the terms and conditions of the Creative Commons Attribution (CC BY) license (https://creativecommons.org/licenses/by/4.0/).
Copyright: This open access article is published under a Creative Commons CC BY 4.0 license, which permit the free download, distribution, and reuse, provided that the author and preprint are cited in any reuse.


