Submitted:
26 July 2024
Posted:
26 July 2024
You are already at the latest version
Abstract
Logistic Regression and Random Forest are used to identify risk factors that influence traffic accident fatalities in the United Kingdom. The mean decrease accuracy was used to measure variable importance. The speed limit, police attendance and quarter had an increasing influence on accident fatalities. They had a mean decrease of 102.1669, 221.5322, and 120.894 respectively. The speed limit, had a parameter estimate of 0.0046902 and a standard deviation of 0.0004875. Light Conditions: Night had a parameter estimate of 1.2657635 and a standard deviation of 0.0118409. Road Type Round About had a parameter estimate of -0.4055796 and a standard deviation of 0.0210848. Police Attendance classified as Yes had a parameter of 0.8546232 and a standard deviation of 0.0151043. The best predictors were speed limit, police attendance and quarter since they had p values that were less than 0.05. The findings of the study indicated that logistic Regression had a higher accuracy rate 79.85% as compared to 64.00% for Random Forest. A split test was used and a standard deviation of 0.0010486 was obtained for the Logistic Regression model.
Keywords:
traffic fatalities
; logistic regression
; random forest
1. Introduction
According to [1] road traffic accidents occurring in the world today have resulted in many deaths. The increase in injuries and fatalities caused by road traffic accidents affects the economy as well as socially impacts the individuals and governments. Additionally, traffic injuries are among the top 10 causes of death and it is anticipated to be the leading cause of human death by 2030 [2]. Additionally, [3] found that road traffic sustained injuries rank eighth among the world’s leading causes of death and there has been a 46% increase since the 1990s. Loss of life resulting from traffic accidents indicates the need of evaluating methods that have been used to analyse traffic accidents and see if there is a decline in death caused by traffic accidents. It is therefore important to look at numerous studies that used statistical methods and machine learning methods in an attempt to save human life.
There are numerous studies that have looked at modeling traffic accident fatalities using statistical methods. For instance, [4] used the ordered probit model. Factors such as driver characteristics, roadway features, vehicle types and pedestrian characteristics were used to find out how they influence crash severity. Additionally, [5] used a negative binomial crash model to find the effect of weather conditions on roadway crashes. The study shows that drivers had higher chances of getting involved in fatal injuries in rollover crashes occurring under weather conditions. On the other hand, [6] used Poisson and Negative Binomial Regression to identify how traffic condition factors affect the number of deaths and serious injuries caused by truck traffic accidents. [7] used a binomial regression model to investigate the impact of vehicle and crash characteristics on injury severity in two-vehicle side-impact crashes. [8] used Logistic regression to analyse crash fatality rates for sport utility vehicles, pickup trucks and passenger cars in the United States between the years 1997 and 2003.
Machine learning methods have become very popular for analysing traffic accident fatality data. In transportation safety, they have been used to outline significant factors contributing to crash severity [9]. Also, [10] used data mining methods such as clustering algorithms, classification, and association rule mining. The study focused on factors that had a huge impact on road accidents. Furthermore, [11] have done a research almost similar to the one proposed in this study. They forecast the severity of traffic accidents, using Multinomial Logit (MNL), Nearest Neighbor Classification (NNC), Support Vector Machine (SVM), and Random Forests (RF) analysis methods.
This study departs from the study of [12] who used the multivariate logistic regression to determine the independent contribution of crash, driver and vehicular characteristics that lead to increasing driver’s fatality risk. The study uses logistic regression and random forest to identify the importance of the independent variables in predicting traffic accident fatalities. The primary reason for undertaking Logistic Regression and Random Forest is to identify relationships among variables in the dataset selected. The rising number of road accidents and the resulting injuries and deaths reinforces the need for frequent examination of road traffic fatalities, as does the necessity for this study. Although there are existing sources of modelling traffic fatalities by vehicle type, they do not model using random forest and logistic regression. [13] argued that statistical methods such as Poisson regression cannot be able to handle multidimensional datasets. This necessitated the use of the random forest method as it is capable of handling large datasets. The shortcoming of the above-mentioned research used to analyse traffic accident mortality is that the negative binomial and Poisson distributions operate best when the sample size is small. It has also been difficult to apply Poisson models as variables that show a number of accidents are categorical [14]. Considering all of these methods, Logistic Regression and Random Forest were found to be the best fit for this study because accident data is discrete and categorical.
1.1. Statement of the Problem
The motivation for this study is loss of life due to road accidents. This has also increased the concern for safety and the necessity for the study to focus on human factors because of their impact on the United Kingdom roads. Statistical methods that have been used to analyse traffic accident fatalities include Poisson distribution and Negative Binomial Regression. However, Poisson distribution cannot be able to handle multidimensional datasets. Methods that can handle multidimensional datasets which is Random Forest and Logistic regression are compared. The performance of Random Forest and Logistic regression is compared using evaluation metrics such as accuracy, sensitivity and specificity. In addition, the prediction of traffic accident fatalities is achieved using Gini index and area under ROC curve used predominantly as the measure of model performance. The study seeks to find the most contributing factors from such factors as road type, light conditions, weather conditions, and road surface conditions drawn from an accident dataset from the United Kingdom and how they influence traffic accident fatalities using Random Forest and Logistic Regression. It also seeks to evaluate variable importance when predicting the target variable. This helps to identify variables that have an impact on predicting traffic accident fatalities.
1.2. Research Aim and Objectives
This study aims to compare statistical methods to machine learning methods in traffic accidents modelling. The study objectives are as follows:
- To identify the risk factors that influence accident severity in traffic accidents in the United Kingdom.
- To compare the performance of Random Forest and Logistic Regression in the prediction of traffic accident fatalities using an accident dataset from the United Kingdom.
- Determine whether or not there are differences in traffic accident fatalities using factors such as road type, light conditions, weather conditions, and road surface conditions drawn from an accident dataset from the United Kingdom.
2. Theoretical Background
Statistical methods such as logistic regression, multinomial logistic regression, ordinal logistic regression, and linear discriminant analysis rely on restrictive assumptions that may not be always true to the datasets in question which may cause misleading results. The relationship between the logit of the outcome and each continuous independent variable must be linear under logistic regression. In addition, there must be minimum outlier data points to avoid twisting the outcome and accuracy of the model. The independent variables should not be correlated with each other in order to give a valid result. Multicollinearity leads to biased coefficient estimates and inaccurate standard errors [15]. Therefore, it is crucial to check that there is no multicollinearity among explanatory variables. The type of logistic regression used should match the dependent variable in the dataset. In this study a binary logistic regression is used since the dependent variable has two outcomes. On the other hand machine learning methods can be used to analyse multiple independent variables since they do not rely on assumptions. A brief discussion of commonly used statistical learning methods such as Binary logistic regression, Multinomial Logistic Regression, Ordinal Logistic Regression and Baseline Category Logit Model is given next. Machine learning methods such as Random forest and Artificial neural network will also be discussed.
2.1. Logistic Regression
Logistic regression is a statistical method used for analyzing a dataset in which there are one or more independent variables that determine an outcome. The outcome is measured with a dichotomous variable [16]. Logistic regression provides a method for modeling a binary response variables, which takes values 1 (success) and 0 (failures). The goal of logistic regression is to find the best fitting model to describe the relationship between the dichotomous characteristic of interest dependent variable and a set of independent variables.
2.1.1. Binary Logistic Regression
Logistic regression has had wide applications in traffic accident modelling. It is very useful when predicting accident fatalities using probabilistic systems to classify the probability as fatal or non fatal event. According to [17], the aforementioned are probability models independent of the distributions of predictors or explanatory variables. When p is the probability of the person being involved in a fatal accident and stands for regression coefficients having the feature . The intercept is denoted by . The logistic response function [17] is given as:
This is referred to as the logistic regression function [18]. This gives a likelihood of the response variable to be 1, given several predictor variables. Since it is non-linear, it is linearised by applying the logit response function. A formula for the logistic response function then becomes:
The term in equation (2.2) is called the odds ratio of the event. Placing the natural logarithm on both sides, results in
Since, the left hand side is a function of , ⋯ , so equation (2.3) can be written as:
Equation can be used to establish the relationship between variables of interest. Maximum likelihood method is used to obtain coefficients in logistic regression. Hence a brief discussion is given. This technique evaluates the variables for a given statistic that results in a maximum likelihood distribution for the known likelihood distribution [16]. Equation is found by taking the exponential of an equation . The log-likelihood function is produced by taking the natural log of an equation . The critical endpoint of the log-likelihood function is obtained by equating the first derivative to zero.
When Equation is equated to zero, it produces nonlinear equations, each with unknown variables [19]. Iteration is the method for resolving this problem.
2.1.2. Multinomial Logistic Regression
Multi-nomial logistic regression is an important method for analysing categorical data. It considers a nominal or ordinal response variable. Additionally, the model permits the approximation of three or more log odds [20]. Let K corresponds to the predictors for a dependent variable Z denoted by , the model for log odds is [18]:
The alternative formula is given by:
where indicates the impact of on the log odds that Z = 1. Let represent the multinomial probability that belongs to the jth category. The multiple logistic regression model is given by :
with j = , i = . When the ’s add to unity, this gives the result [18]:
2.1.3. Ordinal Logistic Regression
This type of regression has a dependent variable with at least three order levels. This differs from the binary logistic regression that takes only two values 0 and 1. The advantage of ordinal logistic regression is that it is capable of modelling at least two regression curves at the same time. The assumption in modelling with ordinal logistic regression is that the relationship between independent variables and logits are the same [21]. The coefficients of the independent variables do not differ significantly given that the logits are the same. The constant term for each equation is different.
2.1.4. Baseline Category Logit Model
When = for a fixed setting t for independent variables, with , for observations at that setting, the study considers the numbers at the J categories of Z as multinomial with probabilities, . logit models pair each dependent category with a baseline category given by :
where j = , explain the effects of t on these (J-1) logits, the impact varies in line with the response paired with the baselines [18]. Since
with categorical predictors, Pearson chi-square statistic and the likelihood ratio chi-square statistic goodness-of-fit statistics provide a mode check when data are not sparse [22].
2.1.5. Confidence Intervals for Logistic Regression
The odds ratio in logistic regression for the shortest width confidence interval was developed by [23]. The shortest width confidence interval has a smaller probability of covering the wrong odds ratio value compared with the standard confidence interval. Let the coefficient of logistic regression be estimated by maximum likelihood so that = (, ) in a big sample. To achieve the shortest confidence interval for odds ratio = using assuming the variance is known. The % confidence interval for is given by:
and then exponentiates to obtain % confidence interval for OR given by :
where is the th quantile of the standard normal cdf, = where is the cdf of the standard normal distribution. If = 0.05 then = . The Wald CI with symmetric z values for OR is given by:
where < are such that - = 1- . The standard CI has the form with = - . The following optimisation is obtained min. According to [23], this optimisation problem reduces to the solution of the following system of equations for and :
To overcome this system, they used Newton’s algorithm by updating the z-values as follows: , , where:
starting from the standard values, = - and = and where denotes the density of the standard variable. After and are determined the % confidence interval for is computed as .
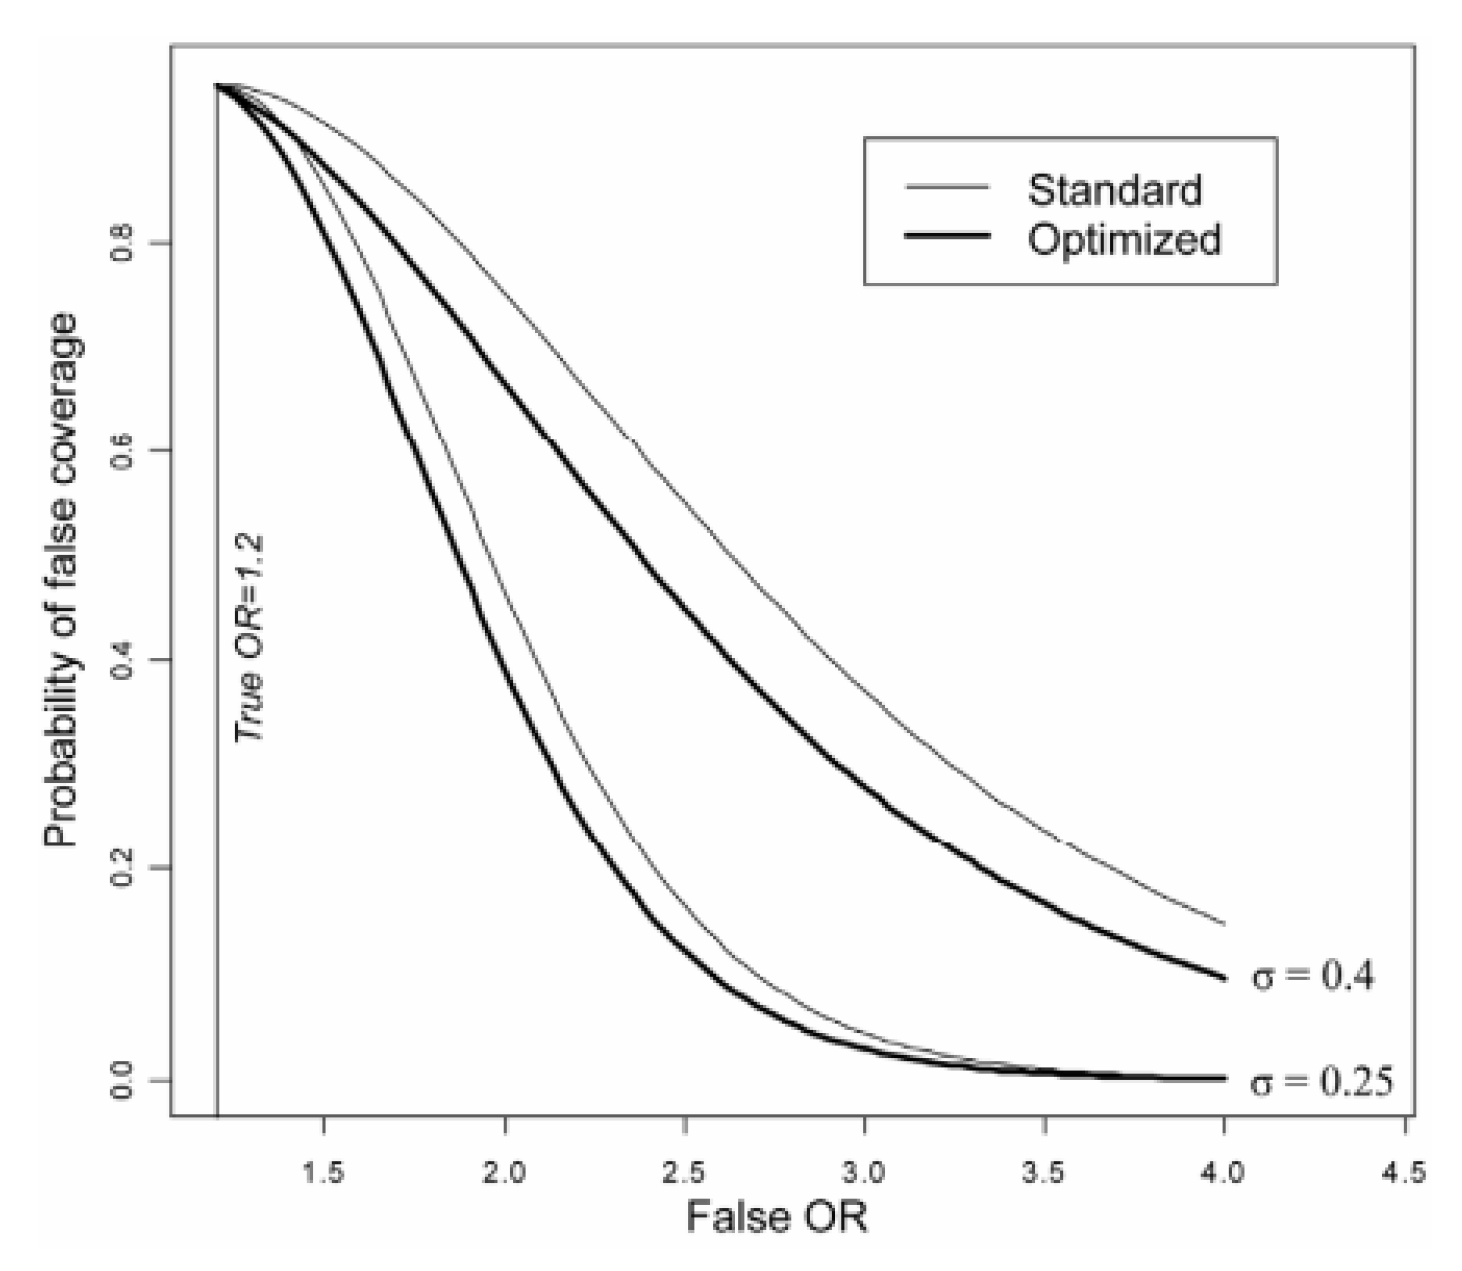
For the standard confidence interval = and = , and for optimal CI and are computed via iterations as a solution to an optimization problem. The result of the comparison of wrong coverage probabilities for standard and optimised 95% CI is shown in Figure . Two scenarios are used one with = 0.25 and the other with = 0.4. The value of = 1.2 in both cases. For the range of OR values the coverage of the wrong OR is smaller for the shortest with CI.
Figure 1.
The probability of false coverage for the traditional Wald CI and the CI with shortest width: [23].
Figure 1.
The probability of false coverage for the traditional Wald CI and the CI with shortest width: [23].
Confidence intervals can be determined using standard errors.
2.2. Model Adequacy Checks
Model adequacy can be tested through a goodness of fit test which measures how well observed data relate to the model fitted by comparing the values observed to expected values or through analysis of deviance residuals. The most commonly used statistics to assess model adequacy are coefficient of determination, Deviance, Wald test, and Akaike information criterion. A brief discussion about them is given next.
2.2.1. The Coefficient of Determination
A pseudo is an indicator of the quality of fit. Its value lies between 0 and 1. It assesses the degree to which the response and the predictor variables are linked. The generalised coefficient of determination is given as follows:
where is the likelihood of the model with just intercept. The likelihood of the calculated model is , and the sample size is n. The numerator of the ratio is the variability in the dependent variable that is not predicted by the model, while the denominator represents total variance in the dependent variable [24]. Cox and Snell is given by:
For the intercept model, represents the dependent variable’s conditional probability.
2.2.2. Wald Test
This is a test used to determine the significance of particular model coefficients. The following is the formula for computing the Wald test [25] given by:
where b is the explanatory variable’s estimate coefficient , and is the standard error. The hypotheses are and . Every wald statistic is compared to a one-degree-of-freedom chi-square distribution. With p < 0.05, a significant chi-squared value implies a poor match. Additionally, a p value near 1, a modest chi-squared value suggests a good logistic regression model fit.
2.2.3. Deviance
When Z is a binary variable the expression given in the equation provides a conditional probability that Z equals one given t, denoted as . The quantity 1 - gives the conditional probability that Z equals zero given t denoted as [26]. In addition, [26] stated that for the pairs , for =1, the likelihood function is . For the pairs = 0, the likelihood function is 1 - . The quantity indicates the value of at . The test statistic D is called deviance.
where = . Deviance is a measure of how much a model deviates from its perfect condition which is the saturated model. This is used in logistic regression to measure the goodness of fit. The change in D caused by including the independent variable in the model is obtained as :
Under the null hypothesis, if is equal to zero, G will follow a distribution with one degree of freedom.
2.3. Akaike Information Criterion
To determine whether a given model fits the data concerning the candidate models, the Akaike information criterion is used. The quality of every model relative to other models can be evaluated based on the method. The AIC is given by:
where l is the log-likelihood, the parameters in the model are represented by k and the sample size by n. A model having the smallest AIC value is the best model for the data [27].
2.4. Other Statistical Methods
There are several classification techniques that one might use to predict a qualitative response. Some of these such as logistic regression has been discused in section . In the next section linear discriminant analysis and Bayes theorem is briefly discussed.
2.4.1. Bayes Theorem for Classification
When K is greater or equal to 2, an observation can be classified into K classes that have a response variable Z. The values of Z can assume K distinct and unordered values. Let stand for a probability obtained from the class. This is the probability that a given observation is associated with the category of the response variable Z. Let represent a density function of t. The Bayes theorem is given as [28]:
Using and substituting in estimates of and into bayes theorem. The probability that an observation belongs to the class is denoted by .
2.4.2. Linear Discriminant Analysis
It uses Bayes theorem to calculate the probabilities, hence an explanation of Bayes theorem is necessary. For linear discriminant analysis with one predictor the normal density in one dimensional setting [28] is given as:
where mean and variance are indicated by and . It is assumed that = ...= = . The variance is equal in all classes indicated by . By substituting the normal density into Bayes’ theorem we get:
where indicates a probability that is obtained from the class. Taking the log of equation (2.40) and rearranging terms, yields :
If is the largest, it represents the correct classification of observation to the class to which it belongs. When i = 2 and = , then an observation is allocated to class 1 if >, and to class 2 otherwise. Also, its decision boundary is equal to the point where
The Bayes classifier is approximated using linear discriminant by plugging estimates for , , into equation (2.42). These estimates are
Training observations have their sum indicated as n, whereas are training observations in the class. The average of training observations from the class are indicated by . is the mean of sample variances that are obtained classes. The linear discriminant analysis estimates is given as :
The estimates given in equation (2.43) and equation (2.44) are substituted into equation (2.41), and an observation is assigned to the class for which it is
biggest. The discriminant functions in equation (2.45) are linear functions of t.
For multiple predictors the linear discriminant analysis (LDA) assumes that is selected from a multivariate Gaussian distribution, with a class-specific multivariate mean vector and a common covariance matrix. A p-dimensional random variable T has a multivariate Gaussian distribution, we write . is the mean of which is a vector of p components, and is the covariance matrix of . The multivariate Gaussian density is defined as [28]:
The linear discriminant analysis classifier assumes that the observations in the class are drawn from a multivariate Gaussian distribution , where is a class-specific mean vector, and ∑ is a covariance matrix that is common to all classes. Substituting the density function for the class, , into equation (2.38) shows that the Bayes classifier assigns an observation to the class for which
is largest. The unknown parameters , ..., , , ..., , and ∑ are estimated in a way similar to one dimensional case in equation (2.43). To assign a new observation , LDA provides the estimates into equation (2.47) and classifies the class for which is the largest.
2.5. Machine Learning Methods
There are two main categories of machine learning, namely supervised learning and unsupervised learning. In supervised learning, the model learns patterns from a labelled dataset and the trained model is used to make predictions on unseen data. Unsupervised learning does not require a labelled dataset. The most commonly used machine learning include Random Forest and Artificial Neural Network. A brief discussion about them is given next.
2.5.1. Random Forest
According to [29], a random forest entails a predictor that consistitutes a collection of S randomised regression trees. For the j-th tree in the family, the value predicted at the query point is indicated by , for j = where are independent random variables. stands for the training sample. Finite forest estimate formed by joined trees [29] given by :
As S grows to infinity equation is obtained as:
[30] states that a random forest algorithm uses the following parameters:
- ∈ (1, ⋯, p), which is the number of preselected directions for splitting
- ∈ (1, ⋯, n), which is the number of sampled data points in each tree.
- ∈ (1, ⋯, ), which is the number of leaves in each tree.
Additionally, [30] implemented the following random forest algorithm with a predicted value at . It consists of the input and output. The input has the training set denoted by , with a number of trees , ∈ (1, ⋯, p), ∈ (1, ⋯, n), ∈ (1, ⋯, ) and ∈. For the output prediction of the random forest at for j= 1, ⋯, S, the following procedures are followed [30].
- Uniformly chose in without replacement
- Set = partition on associated with the root of the trees
- For all 1 ≤≤, set = ∅
- Set = 1 and level = 0.
- while < do if = ∅ ; then level = level + 1
- Let B be the first element in where B contains exactly one point then ← \ ←∪
- Calculate the predicted value ) at t equal to the average of the falling in the cell of t in partition ∪
- Calculate the random forest estimate at the query point
2.5.2. Artificial Neural Network
It has neurons that can be expressed as
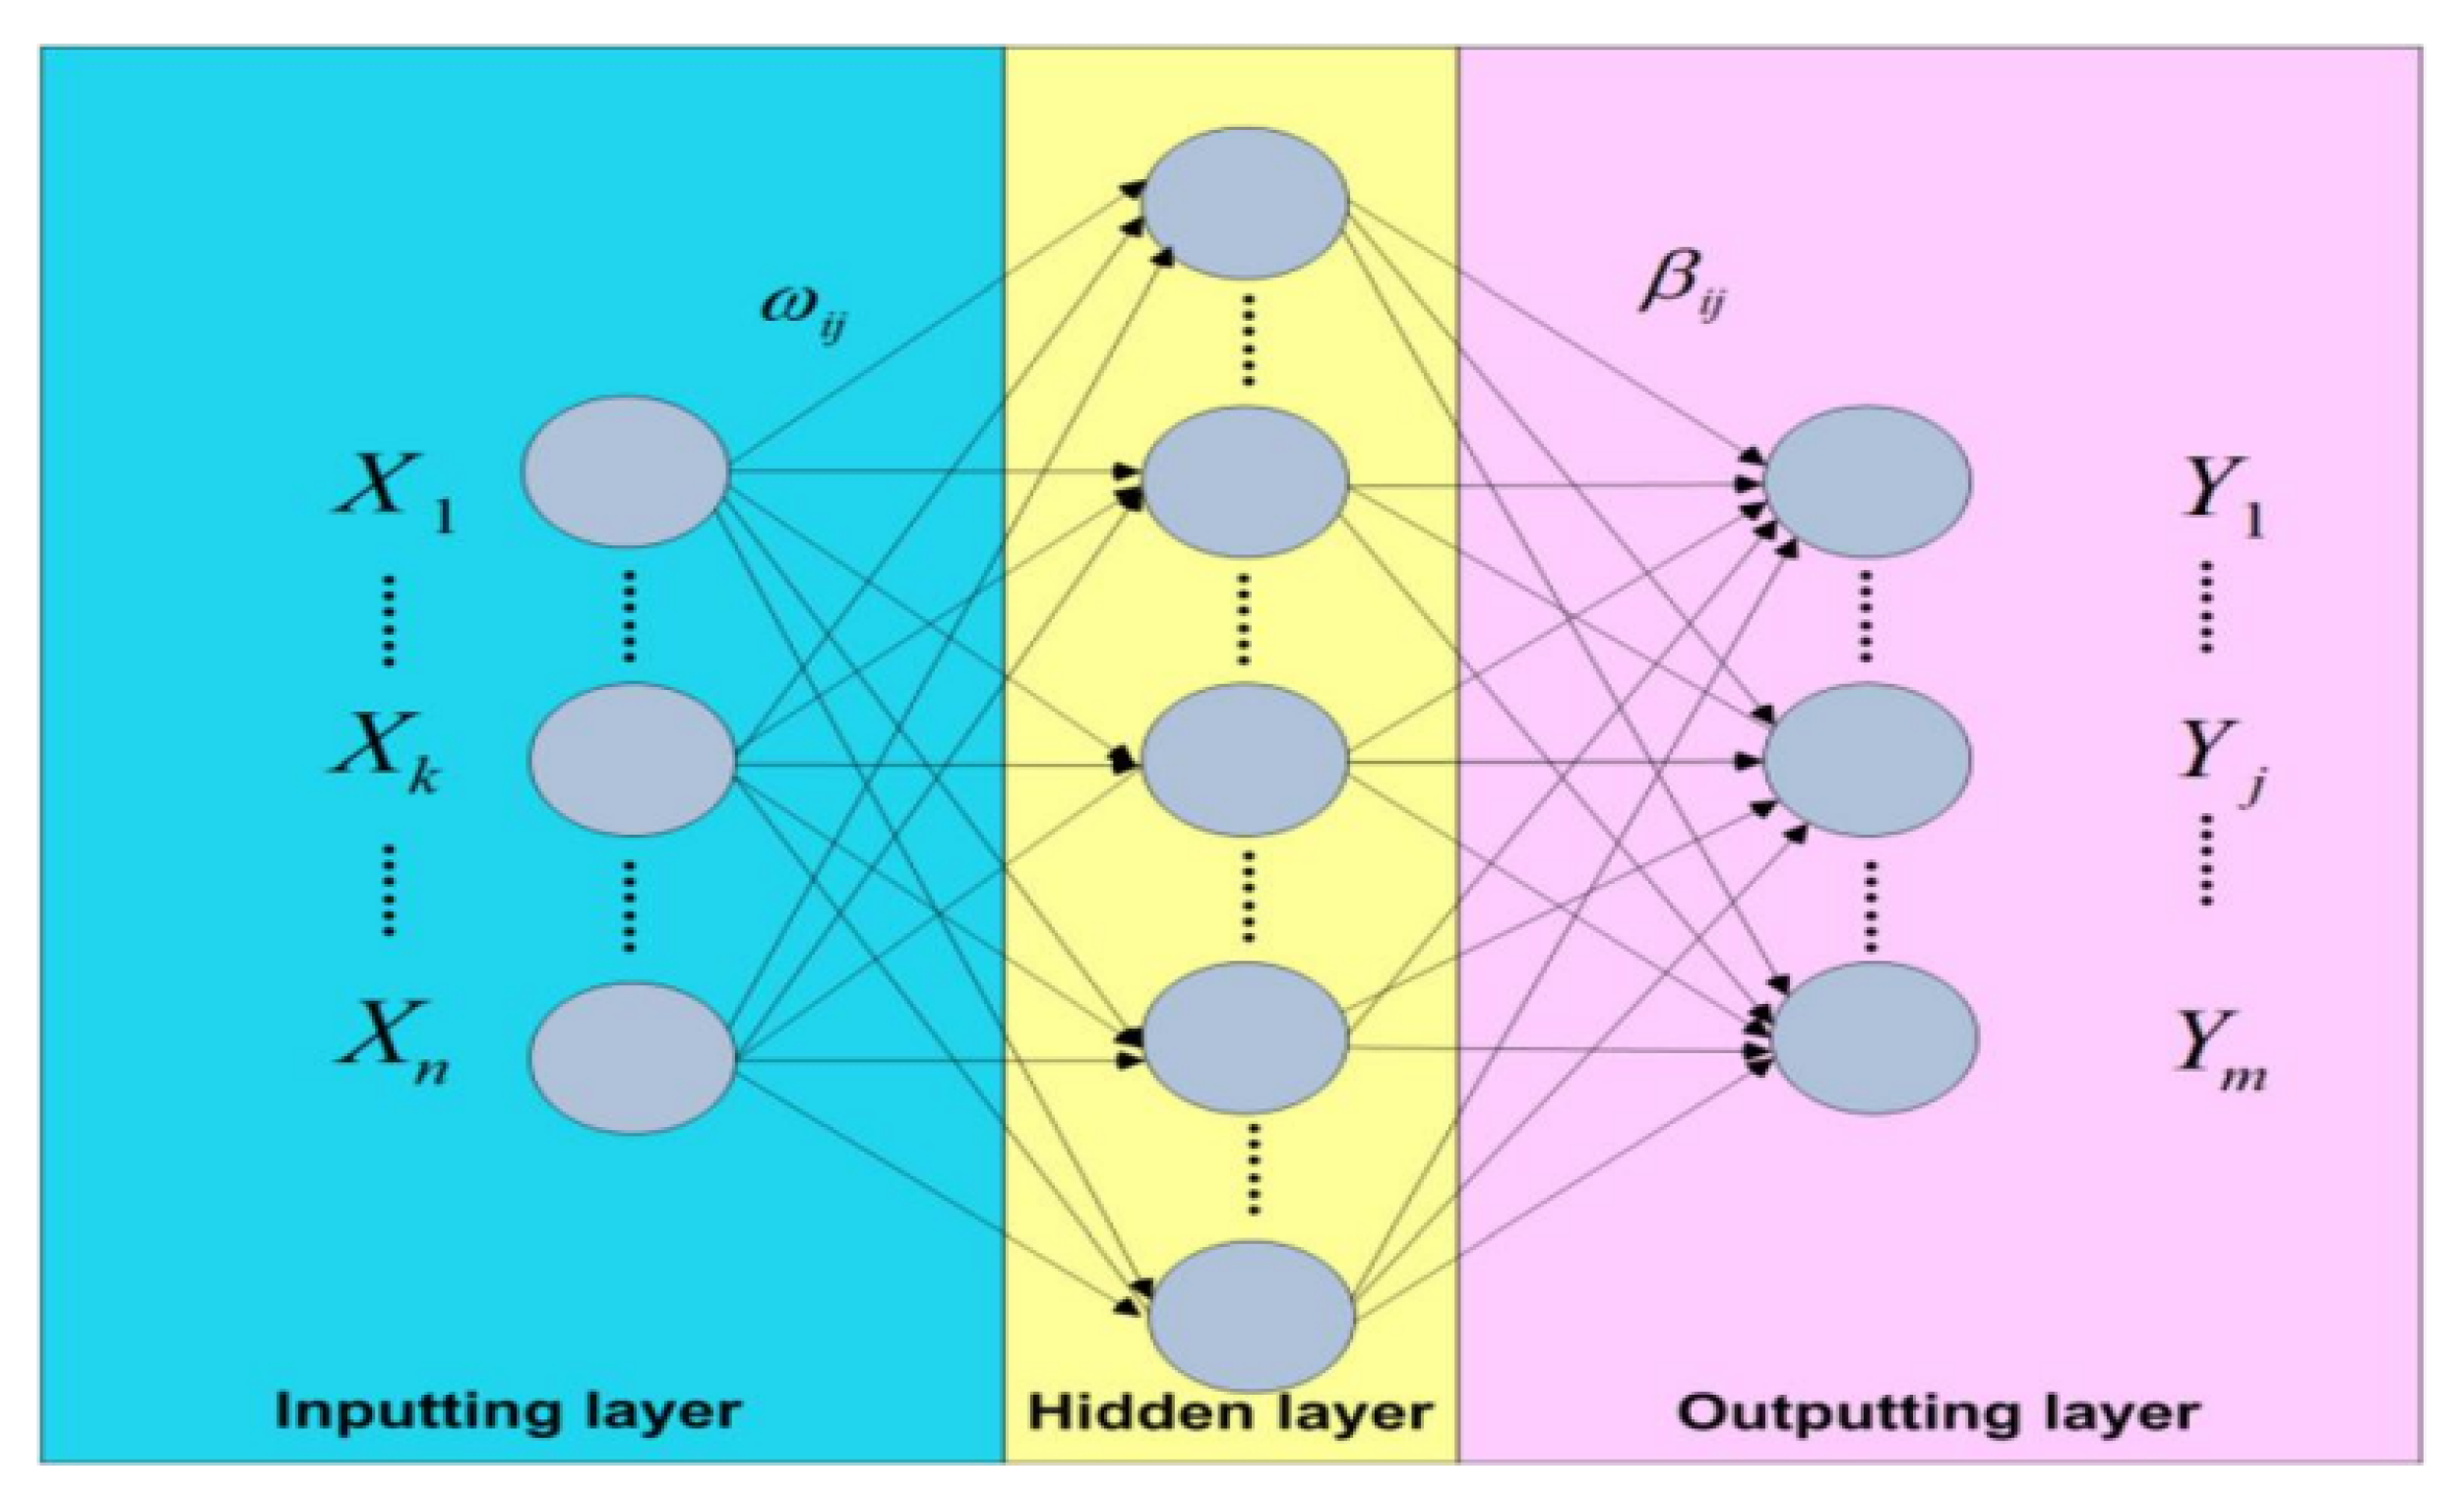
where stands for non-linear function activation, are the weights connecting neuron j to neuron i, is the bias and n is the total number of input nodes. A neural network that consists of three-layered is indicated in Figure . The input layer pass on values t = to the second layer. The second layer has activation units , and generates non-linear transformations as outputs. The third layer consists of an activation unit, and it makes use of weighted outputs obtained from the second layer and yields the predicted value which is the final output.
Figure 2.
Artificial neural network : [31].
Figure 2.
Artificial neural network : [31].
According to [32], perceptrons are used to design processing units of artificial neural networks. They are used to determine non-linear problems. Figure shows an input that has K nodes and a Node 0 representing the bias node. The J nodes stand for hidden layer and Node 0. I nodes stand for output layer with no bias node. A feedforward type network is used for the whole network. This means the network connections are allowed from a layer of a particular index to layers of a higher index [33]. Additionally, multilayer perceptron are often used in the testing phase and training phase. In the training phase, given a set of training data
Figure 3.
Structure of multilayer perceptron: Source: [33].
Figure 3.
Structure of multilayer perceptron: Source: [33].
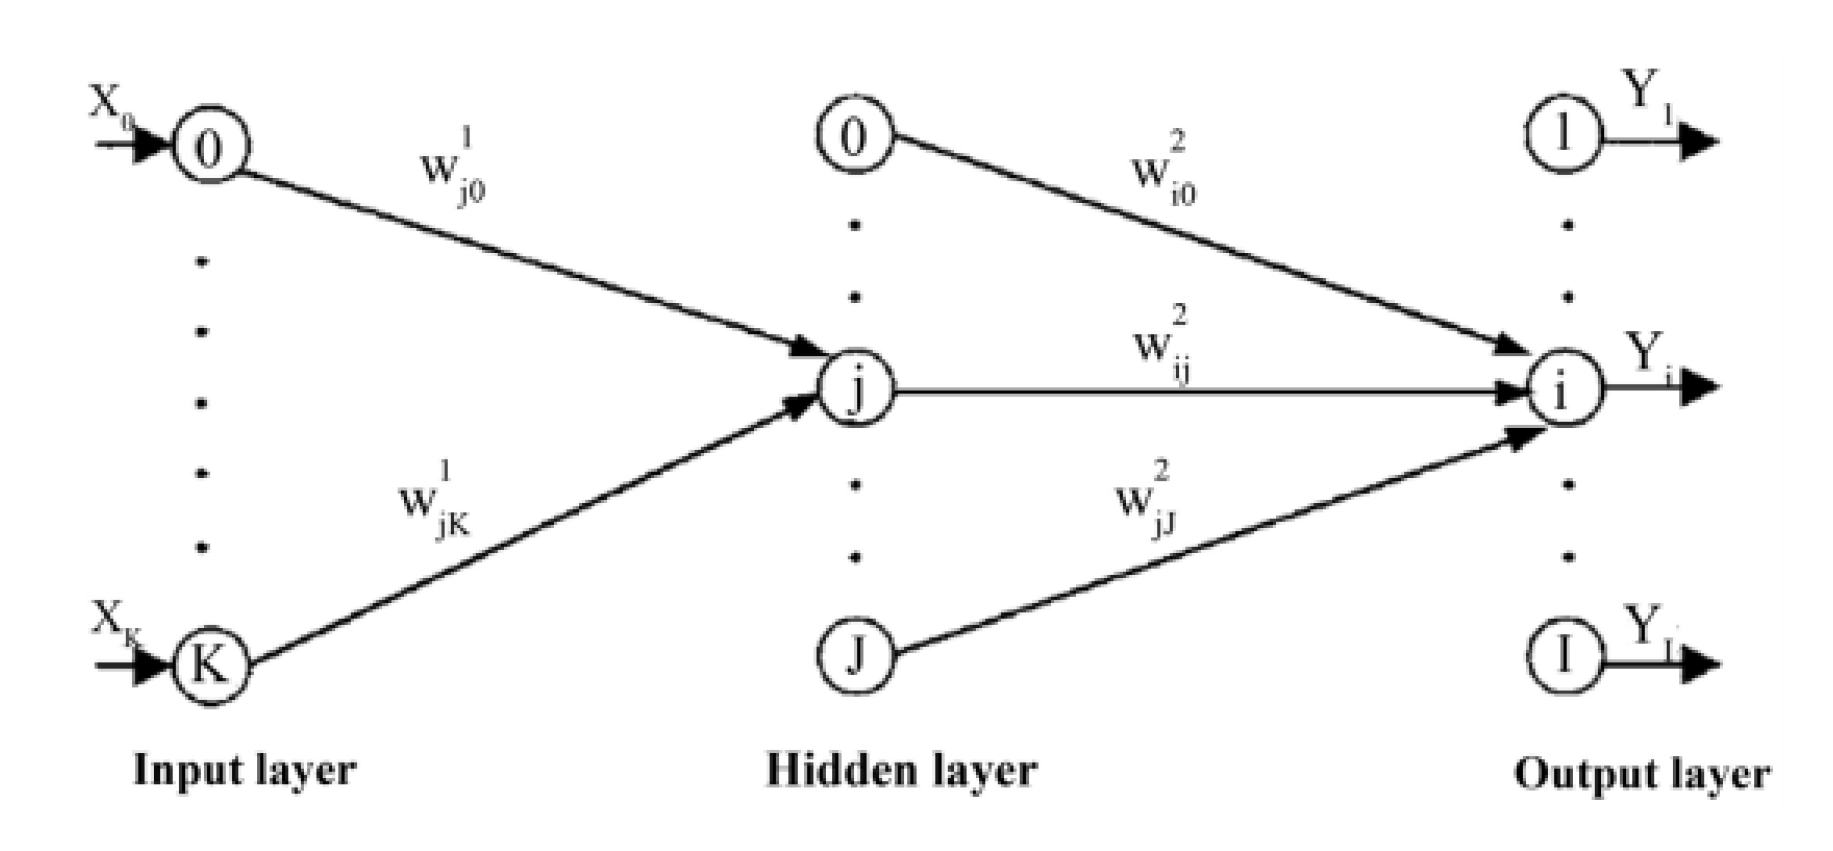
Figure 4.
How backpropagation works: Source: [33].
Figure 4.
How backpropagation works: Source: [33].
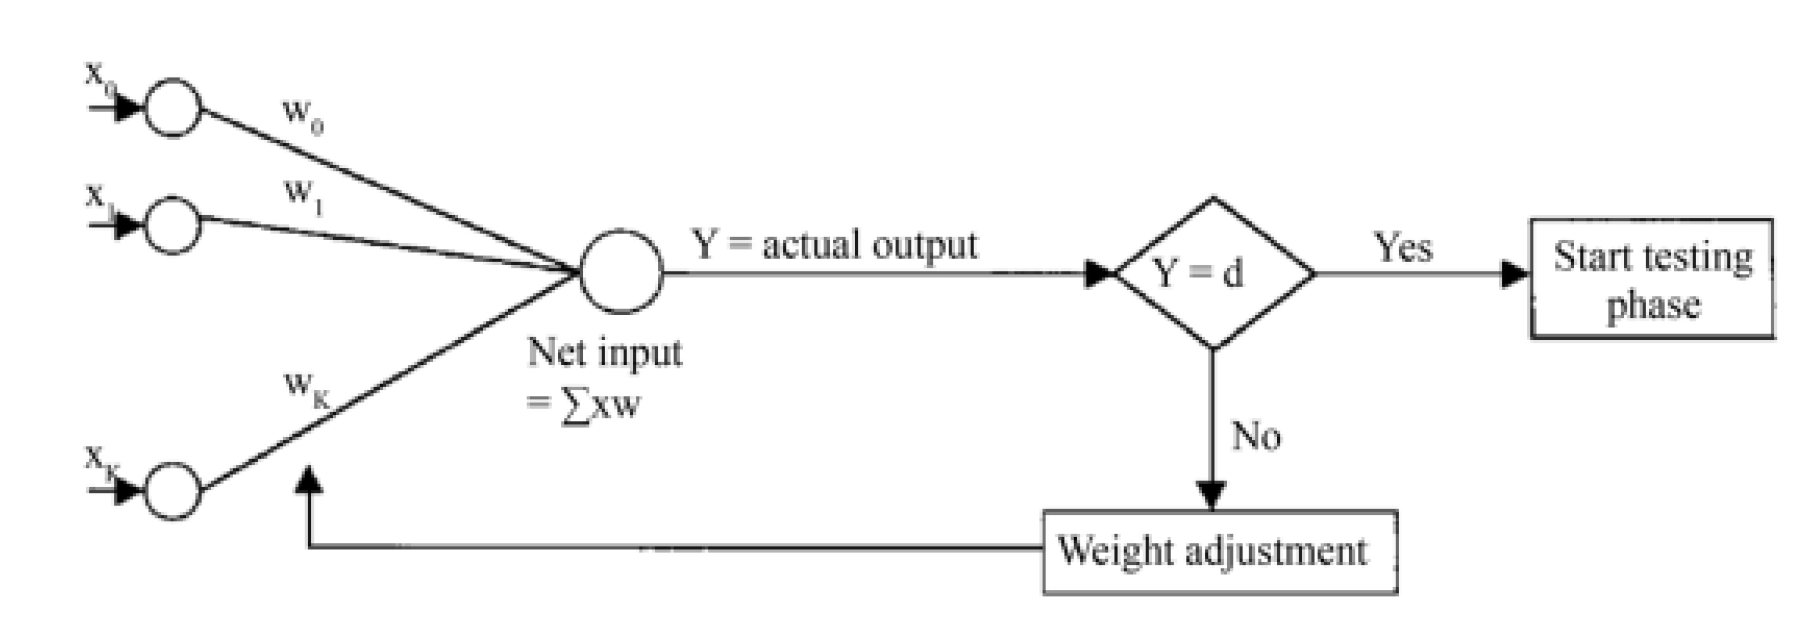
the target is to map to . The Backpropagation algorithm is used to train the multilayer perceptron. A simple representation of the algorithm is illustrated in Figure . From the figure, it could be considered that the output of the multilayer perceptron is equal to applied across the input layer of the multilayer perceptron. The output of the multilayer perceptron which is the same as an error function is constructed [33] and it can be written as:
where :
- = Error function to be minimised,
- W = the weight vector,
- = the number of training patterns,
- I = the number of output nodes,
- = the desired output of node i if the pattern p is introduced to the MLP,
- = the actual output of node i if pattern p is introduced to the MLP
The actual output is taken closer to the desired output when the error function is reduced. Equation (2.52) is differentiated and optimisation techniques applied to perform the minimisation task. Gradient descent technique is given by:
where
- = the change of weight vector,
- = the learning parameter and
- = the gradient vector concerning weight vector W
2.6. Classification Evaluation Metrics
2.6.1. Confusion Matrix
[34] defined the confusion matrix as a table that reveals the true and untrue frequency of cases classified under a defined target. It is used to find the accuracy of the prediction. The matrix has four kinds of instances. True positive (TP) and false positive (FP) are instances of correct and incorrect classifications per actual class, respectively. True negative (TN) and false-negative (FN) are instances of correct and incorrect classifications per actual class, respectively. The following description of the measures is used to compare the methods:
- Kappa is a measure of accuracy that accounts for the possibility that the agreement occurred by chance. The data is checked for balance, with 1 being a balanced value, therefore agreement, and 0 being an unbalanced value, thus disagreement.
- No information Rate (NIR) reveals the accuracy achievable when predicting the majority class label. The lower the better that will indicate equal representation.
- Accuracy is the frequency of true predictions divided by the total frequency of predictions. The higher the better.
- Balanced accuracy is calculated using the average of the true positive and true negative rates, hence again, the higher the better.
- The ability of a classifier to distinguish negative labels is measured by item specificity.
- The weighted average of recall and precision is used to calculate the item F-score.
2.6.2. Accuracy, Precision, and F-Score
2.7. Cohen’s Kappa
Cohen’s kappa statistic measures the accuracy and takes into account the possibility of the agreement occurring by chance [36].
stands for observed agreement, and stands for the probability of chance agreement. When , there is complete agreement that exists between the response variable and the independent variable. When the value of , there is no agreement between the response variable and the independent variable.
2.7.1. Receiver Operating Characteristic Curve
It is a graphical plot that reveals the performance of a classifier, for various thresholds. It shows the trade-off between sensitivity and specificity [37]. The formulars for finding sensitivity and specificity are given as :
When plotting the ROC graphs, specificity is labelled on the X-axis and the sensitivity on the Y-axis. A value of area under the ROC curve closer to one usually correlates with a better performance of the model. Additionally, a value of the area under ROC curve equal to 0.5 means that the two classes are statistically identical.
2.8. Class Imbalance
Class imbalance is one of the challenges of machine learning and data mining fields. Imbalance data hinders the performance of data mining and machine learning techniques as the overall accuracy and decision making are biased to the majority class, which lead to misclassifying the minority class samples. The imbalance problem heightens whenever the class of interest is relatively rare and has small number of instances compared to the majority class. According to [38] when training sample size increases, the error rate of the imbalanced class classification reduces. Furthermore, [39] findings were that a classifier with sufficient number of training data has less chance of being affected by high imbalance ratio. To reduce class imbalance [40] proposed for an adaptive over-sampling technique named SMOTE (Synthetic Minority Over-sampling Technique). It adds new examples to minority class by computing a probability distribution to model the smaller class thus making the decision boundary larger in order to capture adjacent minority class examples. Furthermore, Upsampling method is a method used to address the imbalance class. It helps to reduce errors and improves the accuracy of the model.
3. Literature Review
3.1. Statistical Learning Methods
The Poisson regression has proved to be a major tool that has been used in the analysis of accidents. This has resulted in many researchers implementing the Poisson regression in the analysis of traffic accidents. For instance, [41] used Poisson regression to analyze traffic accidents. Their main aim was to find out if the fatal crash rate was linked to the speed limit. The finding was that the fatal crash rate that happened on freeways in Washington state was influenced by an increase in speed limit. [42] used negative binomial distribution to model traffic accident fatalities. Functional forms were assigned to each variable in the model having both a multiplicative component and an additive component. The multiplicative component accounted for the effect of a variable that has a continuous role along the road such as lane width or shoulder type while the additive component accounted for the presence of hazardous points such as driveways or narrow bridges. [43] applied Tobit regression in order to identify the primary factors affecting accidents. The model results showed that factors related to the status and quality of the pavement and geometric infrastructure features affect the number of crashes.
[44] used Poisson regression and negative binomial model to fit a model on the number of people killed by road traffic accidents in Ghana during the period 2001-2010. However, because of overdispersion using the Poisson model, the negative binomial regression model had a lower dispersion and AIC indicating a better fit compared to the Poisson model. The number of fatalities anticipated in an accident was found to be correlated with vehicle type. Heavy-duty vehicles like bulldozers and trucks classified as others were recognized as the vehicle kinds that killed the least number of persons, whereas cars and buses were identified as the vehicle types that killed the most. [45] used negative binomial regression to analyse type of vehicles and its effect on traffic fatalities. Traffic fatalities were modeled as the truck ratio of a country’s vehicles and a set of variables in the function. The findings were that traffic fatalities tend to increase if the number of light trucks increase in the road. Light trucks also increased the risk of fatalities in motorcycle collisions. In addition, fatality rates were found to vary significantly by vehicle type.
On the other hand, [46] investigated how sample size affects the results of Multinomial Logit, Ordered Probit, and Mixed Logit. It was found that the Mixed Logit model required a larger sample size compared to an Ordered Probit model. [47] investigated the effect of rain-related factors on the frequency of multilane road crash occurrence by comparing Poisson, negative binomial and negative multinomial regression models. They discovered that wet-pavement surfaces were a highly significant variable that increased severe crashes. The use of statistical methods has been preferred as they have the strengths of identifying factors that contribute positively or negatively to accidents. Linear regression and Poisson regression work best under assumptions, based on the relationship between the independent and dependent variables. Assumptions need to be considered as failure to do so would lead to the error of estimation of accident occurrence. [48] argued that the Poisson or negative binomial regression is used for a specific roadway segment simply because of the distributional properties such as random, discrete, and non-negativity of the vehicle accidents. The major challenge that they discovered was that the mean and variance of the accident data, under Poisson distribution, are constrained to be equal.
Several findings were discovered that helped to overcome the challenges encountered. For instance, [49] findings were that accident data are overdispersed. This suggested that the variance was bigger than the mean. Further, [50] used zero-inflated Poisson and zero-inflated negative binomial models to deal with the issue of overdispersion. Zero-altered counting processes provide a model of a roadway section with accident frequencies split into two categories, zero-accident state and accident state. The accident state was considered as a place where accident frequencies assume a known distribution such as Poisson or negative binomial regression whereas the zero-accident state was viewed as a place where accidents are not observed. The results indicated that the zero-altered probability process yields flexibility in uncovering processes impacting accident frequencies on roadway areas with zero accidents and those observed with accidents. [51] argued that the Poisson regression must be considered as the initial model and if the overdispersion of accident data is detected, negative binomial and zero-inflated count models can be used.
The logistic regression model has a response variable that has only two values. It uses 1 for success and 0 for failure. Logistic regression, has been widely used in the study of accident data. [52] scrutinised the logistic regression to reveal driver characteristics and the relationship between injury severity. They concluded that the percentage of men involved in fatal accidents was higher compared to females. Additionally, motorcyclists and bicyclists had higher chances of having a fatal injury as compared to car drivers. It has been found in existing literature that accidents are predicted through binary logistic regression models or other prediction models. A few of these models include non-parametric models, such as classification and regression tree (CART), and decision tree, which are used to identify significant variables in traffic accident analysis [33]. They have proven to be effective in variable selection and crash outcome prediction. In addition, [53] proposed a pedestrian recognition model applicable to intelligent transportation systems based on AdaBoost algorithms to reduce pedestrian fatalities in traffic crashes. These models do not take into account the concept of road characteristics that may increase traffic accident fatalities. The disadvantage of logistic regression is that it employs the use of standardized coefficients, calculation of estimated probabilities, and odds ratio, which might be difficult for non-experts to interpret and explain [54]. Additionally, [55] mentioned that the assumptions related to data distribution and a linear relationship between explanatory and dependent variables can lead to inaccurate inferences. To overcome these limitations, machine learning techniques such as random forest will be implemented. They do not demand a relationship to exist between dependent and independent variables.
Linear discriminant analysis is an alternative method that can be used to predict accident severity where there are more than two responses. Where classes are fully split, the parameters assessed for the logistic regression are erratic. The linear discriminant analysis can overcome this. Additionally, it can be used in situations where training observations are not too large and the predictors X are approximately normal for all classes. Furthermore, logistic regression and linear discriminant analysis vary entirely in their fitting methods [28]. Multinomial Logistic Regression is also used where there are more than two responses. According to [20], Multinomial Logistic Regression permits the concurrent comparison of more than one contrast, that is, the log odds of three or more contrasts are estimated simultaneously. Many studies have looked at the causes of traffic fatal accidents, and the main focus was to come up with lasting solutions for reducing fatalities. The odds proportion of a fatal injury increases with old age, according to a study by [12] using multivariate logistic analysis. Gender was viewed as one of the characteristics that had an impact on fatality. Several fatalities were found to be among male drivers as compared to female drivers. The proportion of traffic fatalities for young male drivers was 26.6%, versus 5.6% for female drivers of the same age range [12]. The drivers’ actions before the accidents occur also play an important role like changing lanes. This might be a contributing factor to fatalities. [56] used the multinomial logit model, to identify leading factors in rural highways influencing accident intensity with information from the China Communications and Transportation Association. Multinomial logistic regression requires a large number of parameters and degrees of freedom. Besides, they do not account for the ordering of the response variable rendering its interpretation impractical [57].
3.2. Machine Learning Methods
Statistical learning methods, such as multinomial logistic regression have weaknesses as their performance can be affected by missing values and outliers. The artificial neural network is most suitable for overcoming this challenge since it does not require assumptions between the dependent and independent variables. They can associate input with output and are error-tolerant [58]. [55] used a neural network with three layers to determine the accident probability in Italy. The study findings were that carelessness and excessive speed were categorised as the main causes of deaths that occur due to traffic accidents. To figure out the extent of the crisis of urban junctions, [55] further used an artificial neural network. The findings were that an artificial neural network is a better model for scrutinising causes leading to junction accidents. On the other hand, [59] utilised artificial neural networks to estimate the occurrence of accidents with the intention of finding which of the methods work well. The findings were that a traffic accident prediction model constructed using Artificial Neural Network (ANN) to forecast traffic accidents using adequate data was accurate enough to predict real traffic accidents. They came to the conclusion that this may be used to forecast future traffic accidents. Furthermore, they found that the results gave more trustworthy findings than established methods such as Poisson regression and negative binomial distribution. [60] used random forests and rough set theory to explore fundamental factors related to vehicle crash severity. Also, [61] utilised neural networks to forecast the severity of 1 000 recorded clashes in Tehran. The findings were that the artificial neural network performed better than other methods used. The methods that were compared include a genetic algorithm used for solving both constrained and unconstrained optimization problems based on natural selection. The other method investigated is a model combining the genetic algorithm (GA) and pattern search (PS) models. The use of GA and PS models in transportation safety studies increases prediction accuracy. [62] used artificial neural networks to evaluate crash severity and to identify important crash-related factors on urban streets. The findings were that head-on collision, highway width, and speeding are the most important factors that increase crash severity in urban streets.
The artificial neural network can be utilised to solve non-algorithmic problems. They are capable of solving new and unexpected situations using experience. There is no need to know how the variables are related to one another when employing an artificial neural network [58]. Additionally, the neural network can be able to handle many variables and produce fewer mistakes. Artificial neural networks have certain limitations. According to [31], drawing the correct sequence of the estimate of components, layers, and types of activation functions remains a difficult task. Hence, neural networks are difficult to use for non-experts. On the other hand, [63] stated that there are many challenges encountered in designing and training multilayer perceptron networks. Firstly, identifying how many neurons are to be used in each hidden layer acts as a challenge. Additionally, validating a neural network to test for overfitting is a challenge when it comes to designing and training a neural network. This clearly, shows some major challenges associated with the use of the neural network.
[30] provided a familiar structure for tree ensembles called “random forests”. It is a classifier that has various decision trees and outputs. [64], used random forest and naive Bayes theorem to forecast and disclose the severity of injury and causes of traffic accidents. The findings were that the random forest performs better than the other methods that were employed. A study by [65] used Tree Net and random forest to forecast injury severity. It was found that the ensemble technique produced better results in forecasting injury severity than any other classifier methods. [66] used regression trees to analyse factors that are associated with injury severity using Iranian traffic data from 2006 to 2008. The findings of this study were that in most cases, not wearing a seat belt was a major contributing factor associated with injury severity.
Random forests are considered to be robust to noise and fast. They do not overfit and provide options for explaining and visualising the input, such as selecting features. They are used in identifying relevant variables, especially in data analysis [67]. According to [67], the algorithm of random forest is still not fully understood. Additionally, the algorithm remains heuristic rather than theoretically motivated. The implementation of the algorithm has proved to be a challenging task even though the steps of the algorithm are clearly outlined. On the other hand, interpreting the random forest model has been viewed as a difficult task, to such an extent that machine learning experts find it hard to give a clear explanation of the algorithm.
[68] recommended machine learning based on geospatial techniques. They employed geospatial analysis, support vector machines, and a coactive neuro-fuzzy inference system, to find out spatial and non-spatial factors in predicting crash severity in Iran. The findings of their study showed support vector machines performed better as compared to other methods that were employed. Furthermore, [69] stated that Support vector machines are the best models because they can handle large datasets. According to [28], support vector machines can only be used on data sets that are separated by linear boundaries. Support Vector Machines are considered to be generalised simple and intuitive classifiers called the maximal margin classifier. Additionally, they are used where there are only two classifications. They can be used in a range of situations, and they are regarded as one of the most effective ways for class methods for classifiers [28]. In addition, the loss function of support vector machines is zero but for logistic regression is not equal to zero. There is a similarity in the results produced by their loss functions. Further, [28] stated that support vector machines yield better results than logistic regression when classes are defined. When multiple regimes overlap, logistic regression is the best option. Support vector machines require a tuning parameter that determines under fitting or over fitting the data. Support vector machines, on the other hand, use kernels when expanding the feature space to accommodate non-linear class border [28].
[70] employed classification and regression trees (CART) and a multinomial logistic regression approach to compare the human factors role in predicting the crash severity of accidents recorded in Iran. The findings were that CART performed better as compared to other employed methods. [71] used supervised methods intended to find out if the environmentally independent factors are related to the severity of accidents that were provided by traffic accident datasets. The findings were that road conditions and road markings had a great influence on the injury severity of a pedestrians. The cyclist age group and month were revealed to be statistically significant predictors of injury severity. [72] used support vector machines in crash frequency prediction. They concluded that the SVM model has a lot of potential for dealing with problems involving classification. They further stated that support vector machines can be utilised for modelling traffic accident fatalities data, which are categorical. The disadvantage of the Support vector machines is that they work like black-boxes and for non experts, it is difficult to interpret the results. A discussion of important variables is discussed next.
3.3. Discussion of Important Variables
Researchers have conducted several studies to identify factors that influence accident severity. For instance, [73] came up with the conditional logistic regression to pinpoint causes aiding traffic accident fatalities in Turkey. The findings were that roadway type and condition, the time of day, collision type and location had a great influence on accident severity. Additionally, [74] used binary logistic regression and the findings were that factors affecting road accident severity only inside urban areas include young driver age, bicycles, intersections, and collision with fixed objects, whereas factors affecting severity only outside urban areas are weather conditions and head-on and side collisions. As an example, [75] researched the connection between traffic fatalities accidents in Palermo and the characteristics of drivers, road conditions, and the season in which they occur. The results of their analyses showed that non-fatal accidents were significantly associated with a driver’s age and seasonality. [9] reported that leading factors like behavioral factors, infrastructure factors, characteristics of the vehicle, and the effects of weather were seen as a major reasons for motorcycle crashes. In addition lighting conditions was also important factor when predicting traffic accident fatalities. According to [76], factors like head-on collisions, poor lighting conditions, and speeding were linked to greater accident severity. Moreover, other factors, including gender, the type of intersection, the surface of the road, the seating position, and the weather, did not produce consistent results [76].
Excessive speed contributed to the traffic accident fatalities as well as property damage [77]. Furthermore, [78] revealed that high speed contributed to the occurrence of traffic fatalities in China. [79] stated that increased vehicle speed significantly increased the odds of getting involved in severe crashes. [76] mentioned that passengers had high chances of being involved in fatal accidents when they travel on dry road surfaces. The variable weather condition, according to [80] accounted for the highest number of traffic fatalities in America that happened in pellucid weather from the year 2010 to 2014. [81] revealed that alcohol consumption had a huge impact on traffic fatalities that occurred during the weekends. [82] stated that liquor raises the probability of having a severe injury.
[83] stated that temporal variations had a huge impact on traffic accident fatalities. Travel patterns differ between weekends and weekdays. Their findings were that more traffic accident fatalities happened during weekends compared to weekdays. Additionally, [84] found that a huge number of traffic accidents that took place during weekends were more fatal as compared to weekdays. On the other hand, [85] compared traffic accident fatalities that took place on public holidays and regular weekends. The findings were that traffic accident fatalities were higher during public holidays compared to weekends.
4. Materials and Methods
4.1. The Data
In this study, an accident dataset downloaded from https://data.gov.uk/dataset/road-accidents-safety-data is used. lt was made available by the United Kingdom’s Department for Transport in the year 2014. The dataset has 146 322 traffic accident records and 32 variables. The study compares the performance of logistic regression with that of random forest for predicting traffic accident fatalities. The predictor variables that are selected are the day of the week, speed limit, light conditions, weather conditions, road surface conditions, road type, and accident severity. This study treats the accident severity as the response variable, which has been further divided into two categorical classes, that is fatal and non fatal. This was necessary so that logistic regression could be used. The connections between traffic fatalities and the independent variables is analysed. The main objective is to find out which variables are significant in predicting traffic fatalities. Data is divided into two parts, which are test dataset and training dataset. The split is 70% training dataset and 30% test dataset using K-fold cross validation and K is taken as 10. [86] found that using small values of k that are less than 10 will tend to produce results that are biased. If better results are produced, it justifies selecting the value of k since it gives better results.
To define the relationship between traffic fatalities and independent variables, odds ratio is used. The odds ratio measures the impact of a one-unit increase on the odds of having a fatal or non fatal injury. Confidence intervals are also used for identifying significant factors that affect traffic accident fatalities. To implement good modelling in this study, we create training and test splits to avoid under or overfitting when performing regression.
To obtain the most essential features, a stepwise regression is used to perform model selection using the . It assesses the model’s ability to fit the data. Using AIC enables a selection of the variables that contribute significantly to traffic accident fatalities. Additionally, predictor variables that have a great impact on traffic accident fatalities are evaluated using the p values. In addition to the methods discussed, Wald tests is used to select the important variables. Deviance measures how much a model deviates from the perfect model, which is the saturated model. This is used to measure the goodness of fit. The pseudo is used to establish the connection between the input variable and the output variables. Model summary provides values indicating how good the model fits the data and also for linear relationship between the accident severity and the independent variables. When the independent variables are correlated with each other it indicates the presence of multicollinearity. For Logistic regression it requires that little or no multicollinearity among the independent variables. Therefore, the independent variables do not need to be highly correlated with each other. Logistic regression assumes linearity of independent variables and log odds. It requires that the independent variables are linearly related to the log odds. Multicollinearity is tested using correlation matrix and the correlation coefficients should be smaller than 0.8.
The Random Forest is used to obtain important features and provides the rank of the features. The mean decrease accuracy is also used to select variables that are important in predicting accident severity. The mean decrease accuracy values of a variable tell us how much that particular variable reduces the accuracy of the model if removed.
The impact of association between dependent and independent variables is determined using a Chi-square. It identifies the variables, which significantly contributed to the increase or decrease of traffic fatalities. The variables significance is determined by the p values obtained from the Chi-square test. P values less than 0.05 are of signal importance. In addition, the analysis of variance for the logistic regression for accident severity is conducted. Each predictor is assessed using an ANOVA on the accident severity. It is used to establish variables that are important in predicting traffic accident fatalities.
For comparing logistic regression and random forest, different performance metrics are calculated from the confusion matrix. It is achieved by making a comparison of the accuracy, error rate, sensitivity, specificity, and no-information rate for logistic regression and random forest. Furthermore, kappa, Gini index, and F-score are used for comparison. Additionally, the assessment of the model is done by plotting the ROC curve for both logistic regression and random forest, and calculating the AUC (Area under the curve). On the same graph, the ROC curves are plotted so that a clear conclusion can be drawn.
5. Data Analysis
5.1. Introduction
Results of data analysis for the logistic regression and random forests are presented in this chapter. A comparison of logistic regression and random forests is implemented utilising the Receiver Operating Characteristic curve (ROC) by looking at the area under the curve. If the area is higher, the better the model. In addition, the confidence interval (CI) for odds ratio (OR) is computed to describe the association between the dependent variable and the independent variables.
5.2. Exploratory Data Analysis (EDA)
5.2.1. Handling Imbalances
The dependent variable, which is accident severity, was split up into non fatal and fatal classes. The fatal had 22 334 observations and the non fatal had 123 988 observations. There is a huge imbalance here. If one class has more observations than the other class, the results for classifying observations using probability will favour classes with more observations. To address the challenge of imbalance, the study employed the Upsampling method. The minority class size is increased by sampling with replacement and the size of classes will have an equal size. As a result, there will be fewer errors and the accuracy of the model will improve.
The exploration data analysis was conducted to evaluate associations among response variable and explanatory variables. The researcher adopted the accident dataset, which was recorded from the 1st of January 2014 until the 31st of December 2014. The total observation of the accident severity data was 146 322. The researcher used accident severity as the dependent variable and used, day of the week, number of vehicles (stands for vehicles involved in an accident in a given day), place of accident, road surface conditions, light conditions, weather conditions, speed limit, road type, and police attendance as the predictor variables. The days of the week were divided into two categories: weekends and weekdays. The variable light conditions was divided into day and night. The road surface conditions were classified as dry, snow, and wet. The time was categorised into four quarters. The types of roads were further classified into roundabouts, carriageways, one-ways/slips, and others.
On the other hand, weather conditions were divided into five categories: fine, rain, snow, fog/mist, and others. The urban or rural area variable was divided into two classes: urban and rural. The highest number of recorded traffic accident fatalities occurred on carriageways, which had 20 604 (92.25%). The weekdays accounted for 16 097 (72.07%) traffic accident fatalities. The variable weather conditions classified as fine had 18 869 (84.49%) traffic accident fatalities recorded. On the other hand, weather conditions classified as snowing recorded 40 (0.18%) traffic accident fatalities.

Table 1.
Descriptive and inferential statistics.
| Category | Fatal | Non-Fatal | Row Total | Chi-square |
| (f)(%) | (f)(%) | (f)(%) | P-value | |
| Weekdays | 16097(72.07%) | 95264(85.55%) | 111361(76.11%) | 0.000 |
| Weekends | 6237 (27.93%) | 28724 (82.16%) | 34961 (23.89%) | |
| Carriageway | 20604 (92.25%) | 110406 (84.27%) | 131010 (89.54%) | 0.000 |
| One way/Slip | 586 (2.62%) | 3891 (86.91%) | 4477 (3.06%) | |
| Roundabout | 1066 (4.77%) | 9263 (89.68%) | 10329 7.06% | |
| Others | 78 (0.35%) | 428 (84.59%) | 506 (0.35%) | |
| Day | 15595 (69.83%) | 92476 (85.57%) | 108071 (73.86%) | 0.000 |
| Night | 6739 (30.17%) | 31512 (82.38%) | 38251 (26.14%) | |
| Fine | 18869 (84.49%) | 101585 (84.34%) | 120454 (82.32%) | 0.000 |
| Fog/Mist | 140 (0.63%) | 613 (81.41%) | 753 (0.52%) | |
| Raining | 2718 (12.17%) | 17280 (86.41%) | 19998 (13.67%) | |
| Snowing | 40 (0.18%) | 265 (86.89%) | 305 (0.21%) | |
| Other | 567 (2.54%) | 4245 (88.22%) | 4812 (3.29%) | |
| Dry | 15658 (70.11%) | 86361 (84.65%) | 102019 (69.72%) | 0.038 |
| Snow | 6354 (28.45%) | 35567 (84.84%) | 41921 (28.65%) | |
| Wet | 322 (1.44%) | 2060 (86.48%) | 2382 (1.63%) | |
| Rural | 9760 (43.70%) | 40275 (80.49%) | 50035 (34.20%) | 0.000 |
| Urban | 12574 (56.30%) | 83713 (86.94%) | 96287 (65.81%) | |
| Police Absent | 1961 (8.78%) | 24754 (92.66%) | 26715 (18.26%) | 0.000 |
| Police Present | 20373 (91.22%) | 99234 (82.97%) | 119607 (81.74%) | |
| 1 Quarter | 5043 (22.58%) | 29738 (85.50%) | 34781 (23.77%) | 0.000 |
| 2 Quarter | 5666 (25.37%) | 30177 (84.19%) | 35843 (24.50%) | |
| 3 Quarter | 5879 (26.32%) | 31087 (84.10%) | 36966 (25.26%) | |
| 4 Quarter | 5746 (25.73%) | 32986 (85.17%) | 38732 (26.47%) |
The p-values of chi-square of independence were all less than 5% level of significance, which implies that there is an association between the dependent variable and predictors. The results suggest that the predictors are candidates for explaining the accident severity.
This study categorised accidents into four quarters in order to examine seasonality effects. Table indicates that the third quarter recorded the most fatal traffic accidents, with 5 879 (26.32%) accidents, followed by the fourth quarter with 5 746 (25.73%) accidents. There were 5 043 (22.58%) accidents in the first quarter, and 5 666 (25.37%) accidents in the second quarter. There is a difference of 623 accidents between the first and second quarters. Table shows that there has been an increase in traffic accident fatalities from the first to the third quarter. On the other hand, Road type-related traffic accidents are very concerning since they are avoidable. If strict measures are put in place to prevent road accidents that cause death, the number of traffic fatalities could be reduced. Results show that 20 604 (15.73%) fatal accidents occurred on carriageway roads, followed by 1 066 (10.32%) at roundabouts. One way or Slip had more accidents than the others, with 78 traffic accidents.
It can be seen from the traffic accident fatalities by urban or rural area in Table that accidents happen more commonly in cities than in rural areas. This is because there is more volume of traffic in cities than in rural settings. The chances of an accident occurring are high when the traffic volume is also high. The predictor variable light conditions play a crucial role in analysing traffic accidents. There were two categories of light conditions, day and night. It was found that traffic accident fatalities occurred more often during the day than during the night. There are fewer accidents recorded at night as there is less traffic on the road compared to day time. The introduction of good road lighting could also be a contributing factor. In addition, [87] agrees to this point as one of the findings in their study was that night accidents can be reduced by the use of good road lighting. Since more people are usually working during the day, traffic is generally high during this time. Nights are associated with a high number of fatalities, despite fewer accidents occurring. This might be due to drunk driving. On the other hand, [87] mentioned that traffic volume is higher during daylight as a result, more traffic accident fatalities are recorded.
Variable road surface conditions contribute to the increased number of traffic accidents and deaths. Dry surface conditions is associated with the most traffic accident fatalities, with 15 658 (15.35%). Snow road surface conditions accounted for the second highest number of traffic fatalities accidents, with 6 354 (15.16%), followed by wet conditions, with 322 (13.52%). Wet roads may lead to more cautious driving than roads with dry surfaces, based on the results. Weather conditions impact on traffic accident fatalities were examined. A total of 18 869 (15.67%) traffic accident fatalities occurred in fine weather conditions. In addition, there were 2 718 (13.59%) accidents caused by the weather conditions, when it was raining. The number of accidents associated with snowfall was the lowest, with 305 in total. Fog or mist was responsible for 40 (18.59%) traffic accident fatalities.
5.3. Logistic Regression Analysis
The researcher conducted the stepwise regression approach for selecting the significant variables in explaining the severity of accidents. After determining the significant covariates, we fitted the binomial logistic regression model since we had a binary response. The methods that were explored in assessing the covariates were deviance and Akaike information criteria (AIC). The variable with the highest univariate AIC value and smallest deviance was first included, that was quarter and the other variables are consequently added based on how they influence the AIC and deviance value. From this result, it was observed that quarter, speed limit, road surface condition, day of the week, road type, light conditions, place of accident, number of vehicles and police attendance were significant.
Table 2.
Stepwise regression approach for logistic regression model for traffic accident fatalities.
Table 2.
Stepwise regression approach for logistic regression model for traffic accident fatalities.
| Covariates | Df | Deviance | AIC |
| None | 230649 | 230687 | |
| Quarter | 3 | 230732 | 230764 |
| The Speed limit | 1 | 230742 | 230778 |
| The Road surface condition | 2 | 230788 | 230822 |
| The Weather conditions | 4 | 230819 | 230849 |
| The Day of week | 1 | 230848 | 230884 |
| The Road type | 3 | 231059 | 231091 |
| The Light conditions | 1 | 231046 | 231082 |
| Place of accident | 1 | 231304 | 231340 |
| The Number of vehicles | 1 | 232902 | 232938 |
| Police attendance | 1 | 234040 | 234076 |
5.4. Binomial Logistic Regression Model
Table shows the estimates, odds ratio, standard errors, z values and p-value for the predictor variables. The predictors for the logistic regression such as speed limit, and light conditions were statistically significant at 5% level since they had a p value less than . The variables road type classified as others and weather condition classified as snowing had p vaues of and , respectively. The p values are greater than , hence they are insignificant. The odds ratio of 0.7200 for number of vehicles involved in traffic accident fatalities suggests that for every unit increase in the number of vehicles involved in a car accident, the likelihood of a traffic fatal accident decreases by 28%. The odds ratio of a person experiencing a fatal accident during the weekends is times that of weekdays. Traffic accident fatalities that occur on a slippery road have 17% less chance of resulting in a fatal accident compared to an accident that occurred in carriageways.
Table 3.
Logistic regression for traffic accident fatalities.
| Covariates | Estimate | Odds Ratio | Sd | Z-Value | P-value |
| Intercept | -0.2110327 | 0.8097476 | 0.0326297 | -6.468 | 0.0000 |
| Number of Vehicles | -0.3284669 | 0.7200268 | 0.0070883 | -46.339 | 0.0000 |
| Day:Weekends | 0.1610077 | 1.1746941 | 0.0114158 | 14.104 | 0.0000 |
| Road Type:Slip | -0.1888540 | 0.8279073 | 0.0297239 | -6.354 | 0.0000 |
| Road Type Round About | -0.4055796 | 0.6665904 | 0.0210848 | -19.236 | 0.0000 |
| Road Type: Others | 0.1125592 | 1.1191385 | 0.0845239 | 1.332 | 0.182964 |
| Speed limit | 0.0046902 | 1.0047012 | 0.0004875 | 9.621 | 0.0000 |
| Light Conditions: Night | 1.2657635 | 3.5457989 | 0.0118409 | 19.904 | 0.0000 |
| Weather Conditions: Fog/Mist | -0.1769851 | 0.8377922 | 0.0674142 | -2.625 | 0.008656 |
| Weather Conditions: Raining | -0.2391297 | 0.7873128 | 0.0186169 | -12.845 | 0.0000 |
| Weather Conditions: Snowing | -0.0793410 | 0.9237249 | 0.1135330 | -0.699 | 0.484654 |
| Weather Conditions: Others | -0.1058903 | 0.8995233 | 0.0303448 | -3.490 | 0.000484 |
| Road Surface: Snow | -0.0155717 | 0.9845489 | 0.0147245 | -1.058 | 0.290266 |
| Road Surface: Wet | -0.5092450 | 0.6009491 | 0.0435462 | -11.694 | 0.0000 |
| Place of Accident: Urban | -0.3623045 | 0.6960704 | 0.0141845 | -25.542 | 0.0000 |
| Police Attendance Yes | 0.8546232 | 2.3504886 | 0.0151043 | 56.581 | 0.0000 |
| 2nd Quarter | 0.1260474 | 1.1343359 | 0.0148897 | 8.465 | 0.0000 |
| 3rd Quarter | 0.1066344 | 1.1125274 | 0.0148262 | 7.192 | 0.0000 |
| 4th Quarter | 0.0500855 | 1.0513610 | 0.0141083 | 3.550 | 0.000385 |
For every one unit increase in speed limit, we expect to see about 0.47% increase in the odds of experiencing a fatal accident. For light conditions, the parameter is equal to 1.2657635 and the odds occurring is 3.5457989. This means that the night travellers are 3.5457989 times more likely to be involved in a fatal accidents than those travelling during the day. There was an increase in traffic accident fatalities since the odds ratio was greater than one. Traffic accident fatalities that occurred in urban areas had an odds ratio of compared to rural areas. Since the odds ratio is less than one, this shows a decline in traffic accident fatalities as compared to rural area. The odds of experiencing a fatal accident in the presence of the police is times more likely to occur as compared to absence of police.
The Wald test was implemented to assess the achievement of the model. The null hypothesis assumes that there are no differences in accident severity using factors such as road type, light conditions, weather conditions, and road surface conditions drawn from an accident dataset. The alternative hypothesis is that there are differences in accident severity using factors such as road type, light conditions, weather conditions, and road surface conditions drawn from an accident dataset. The study rejects the null hypothesis since p < 0.05. The study concludes that there are differences in accident severity using factors such as road type, light conditions, weather conditions, and road surface condition drawn from an accident dataset since p = 0.000. The p values were less than 0.05 for the Wald test. Residuals and deviances were also used to assess models. The residual deviance obtained has a value of 230649 on 173565 degrees of freedom. On the other hand, the null deviance obtained has a value of 240639 on 173583 degrees of freedom. Since the residual deviance has a value less than the null deviance, this explains that the model is a better model compared to Random forest. The parameters are estimated using a method of maximum likelihood discussed under the theoretical background. Additionally, the pseudo value seems not to be good enough as the value is low.
5.5. Analysis of Variance (ANOVA) for Traffic Accident Fatalities
Table indicates the analysis of variance for accident severity. The ANOVA was conducted to assess the impact of each predictor on the regressor (accident severity). The results show that the explanatory variables are all statistically signficant since the corresponding p-values are less than 5% level of significance.
Table 4.
Analysis of variance for the logistic regression for traffic accident fatalities.
| Df | Deviance | Residual Df | P-value | |
| The Number of Vehicles | 1 | 1839.3 | 173582 | 0.000 |
| The Day of Week | 1 | 428.4 | 173581 | 0.000 |
| The Road Type | 3 | 588.9 | 173578 | 0.000 |
| The Speed limit | 1 | 2061.2 | 173577 | 0.000 |
| The Light Conditions | 1 | 262.3 | 173576 | 0.000 |
| The Weather Conditions | 4 | 414 | 173572 | 0.000 |
| The Road Surface | 2 | 128.3 | 173570 | 0.000 |
| Place of Accident | 1 | 750 | 173569 | 0.000 |
| Police Attendance | 1 | 3433.9 | 173568 | 0.000 |
| Quarter | 3 | 83.2 | 173565 | 0.000 |
5.6. Wald Test Results for Traffic Accident Fatalities
A Wald test was used to identify variables that contributed to traffic accident fatalities. The variable speed limit had a value of , with one degree of freedom, corresponding to a p value of . This explains that the speed limit is significant since the p value is less than . Light conditions classified as night had a = 396.2, with one degree of freedom corresponding to a p value of zero. Hence, it shows that it contributed significantly since the p value is less than . On the other hand, the road type classified as round about had a = 1.8. The value of p was higher than , showing that it is not significant.
5.7. Random Forest Model
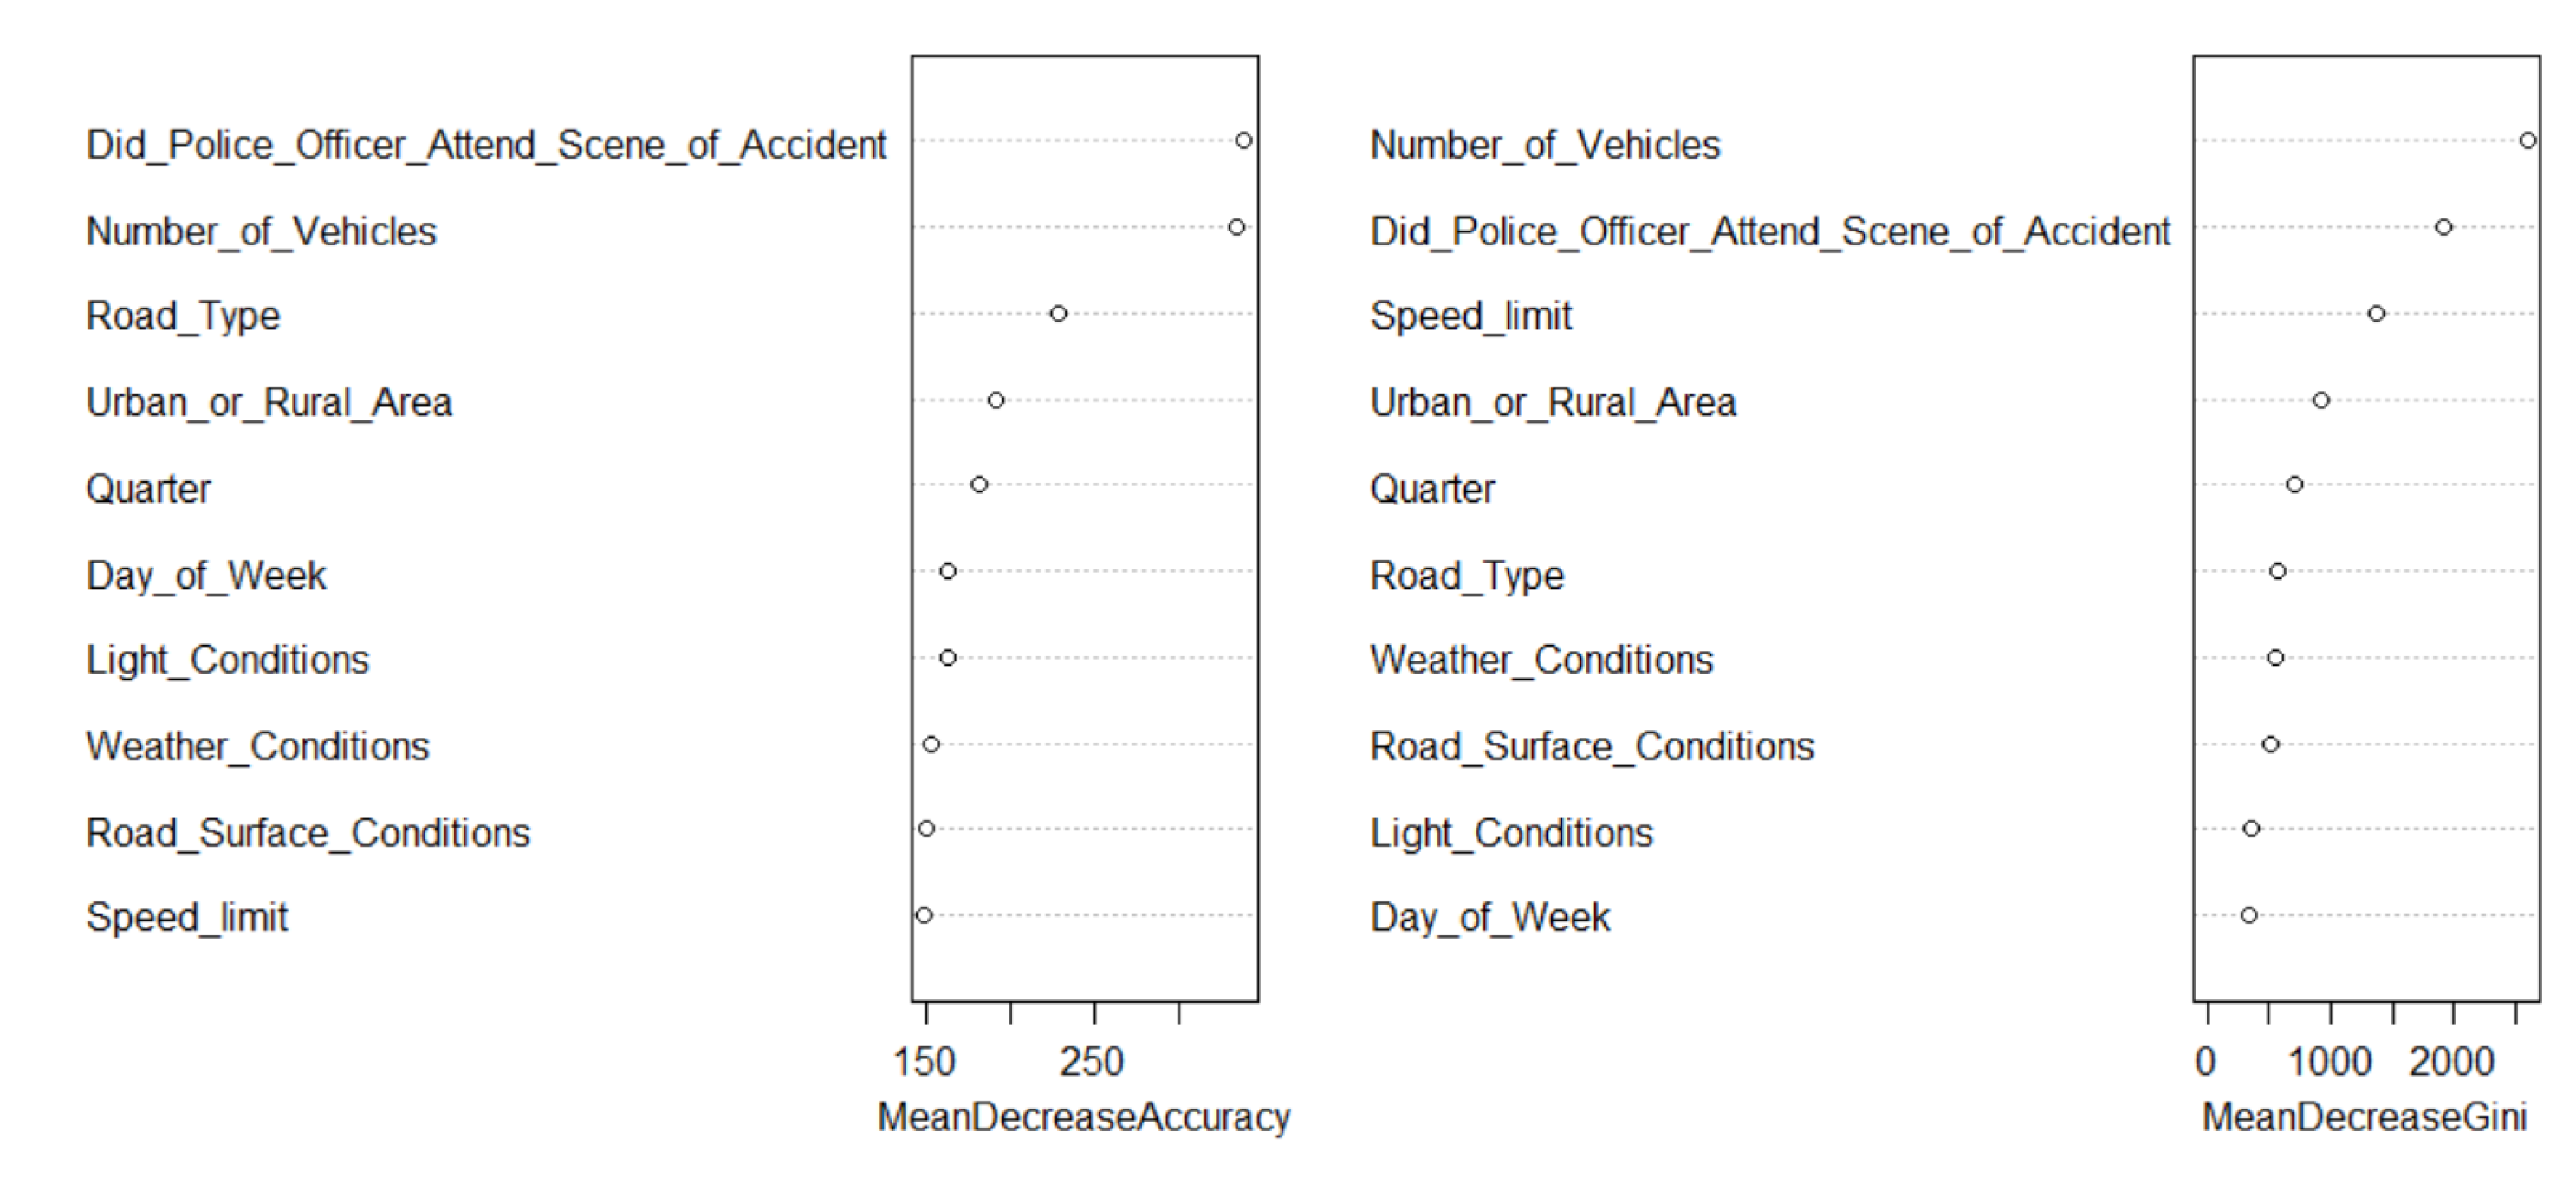
The random forest model of 500 trees was fitted with 10 variables being tried at each split. Table shows the mean decrease accuracy for each explanatory variable. The mean decrease accuracy expresses how much accuracy the model losses by excluding each explanatory variable. The variables number of vehicles, road type, police attendance, light conditions, place of accident and quarter are the top important variables. The speed limit and weather conditions were the least important variables. The speed limit had a mean decrease of , whereas weather conditions had a mean decrease of . Table shows the results of random forest model, including 500 number of trees. The Out Of Bag (OOB) performance error rate was 36.28%, suggesting that the random forest is a fair model.
Table 5.
Feature selection for random forest model for traffic accident fatalities.
| Covariates | Mean Decrease Accuracy |
| The Number of Vehicles | 248.5413 |
| The Day of week | 118.059 |
| The Road Type | 159.1584 |
| The Speed limit | 102.1669 |
| The Light Conditions | 119.8348 |
| The Weather Conditions | 103.2044 |
| The Road Surface Conditions | 108.9508 |
| The Place of Accident | 140.143 |
| The Police Attendance | 221.5322 |
| The Quarter | 120.894 |
Table 6.
Random forest model for traffic accident fatalities: Confusion matrix.
| Type of random tress: Classification | |||
| Number of trees : 500 | |||
| OOB: Estimate of Error Rate: 36.28% | |||
| Confusion Matrix | 0 | 1 | class.error |
| 0 | 55548 | 31244 | 0.3599871 |
| 1 | 31734 | 55058 | 0.3656328 |
Figure 5.
Top features found as most important features in analysing traffic accident fatalities data.
Figure 5.
Top features found as most important features in analysing traffic accident fatalities data.
5.8. Model Performance Comparison for Random Forests and Logistic Regression
The target class, accident severity had two labels (Fatal, Non Fatal). The predictors of this classifier such as road surface conditions were used to fit the random forest model. Data was cross-validated by dividing 70% of the training data into 5 folds, and keeping 30% for testing. The metric measures that were adopted for the study were; accuracy, no information rate, kappa, Mcnemar’s test, sensitivity, specificity, gini index and area under the curve.
Table 7.
Comparison of logistic regression and random Forests.
| Logistic Regression Model | Random Forest Model | |
| Accuracy | 0.7985 | 0.640 |
| Recall | 0.1935 | 0.6429 |
| 95% Confidence Interval | (0.7964, 0.8005) | (0.6376;0642 |
| No Information Rate | 0.8920 | 0.6021 |
| Kappa | 0.1147 | 0.1611 |
| Mcnemar’s Test P-Value | 0.0000 | 0.0000 |
| Sensitivity | 0.8620 | 0.9048 |
| Precision | 0.2736 | 0.9048 |
| Specificity | 0.2736 | 0.2395 |
| Prevalence | 0.8920 | 0.6021 |
| Balanced Accuracy | 0.5678 | 0.5721 |
| Gini Index | 0.2801 | 0.3179 |
| F1 Score | 0.2267 | 0.7517 |
| AUC | 0.64 | 0.6589 |
The logistic regression achieved an accuracy of 79.85%. This means 79.85% of the data is predicted correctly. The random forest achieved an accuracy of 64.01%. The results show that logistic regression is a better classifier for predicting accident severity since it had the highest accuracy percentage. The performance of the logistic regression was very close to random forest, with a small difference of 15.84%. However, the random forest model had higher sensitivity, 90.48%, Gini index of 31.79% and F1 Score, 75.17%. Logistic regression recorded both the highest specificity and no information rate with values of 27.36% and 89.20% respectively. Figure shows the receiver operating curve (ROC) comparing the two methods. When the area is big, mainly greater than 60% and the curve is above 50% diagonal line, it suggests that the model correctly predicts the accident severity.
Figure 6.
ROC for logistic and random forest models comparing traffic accident fatalities.
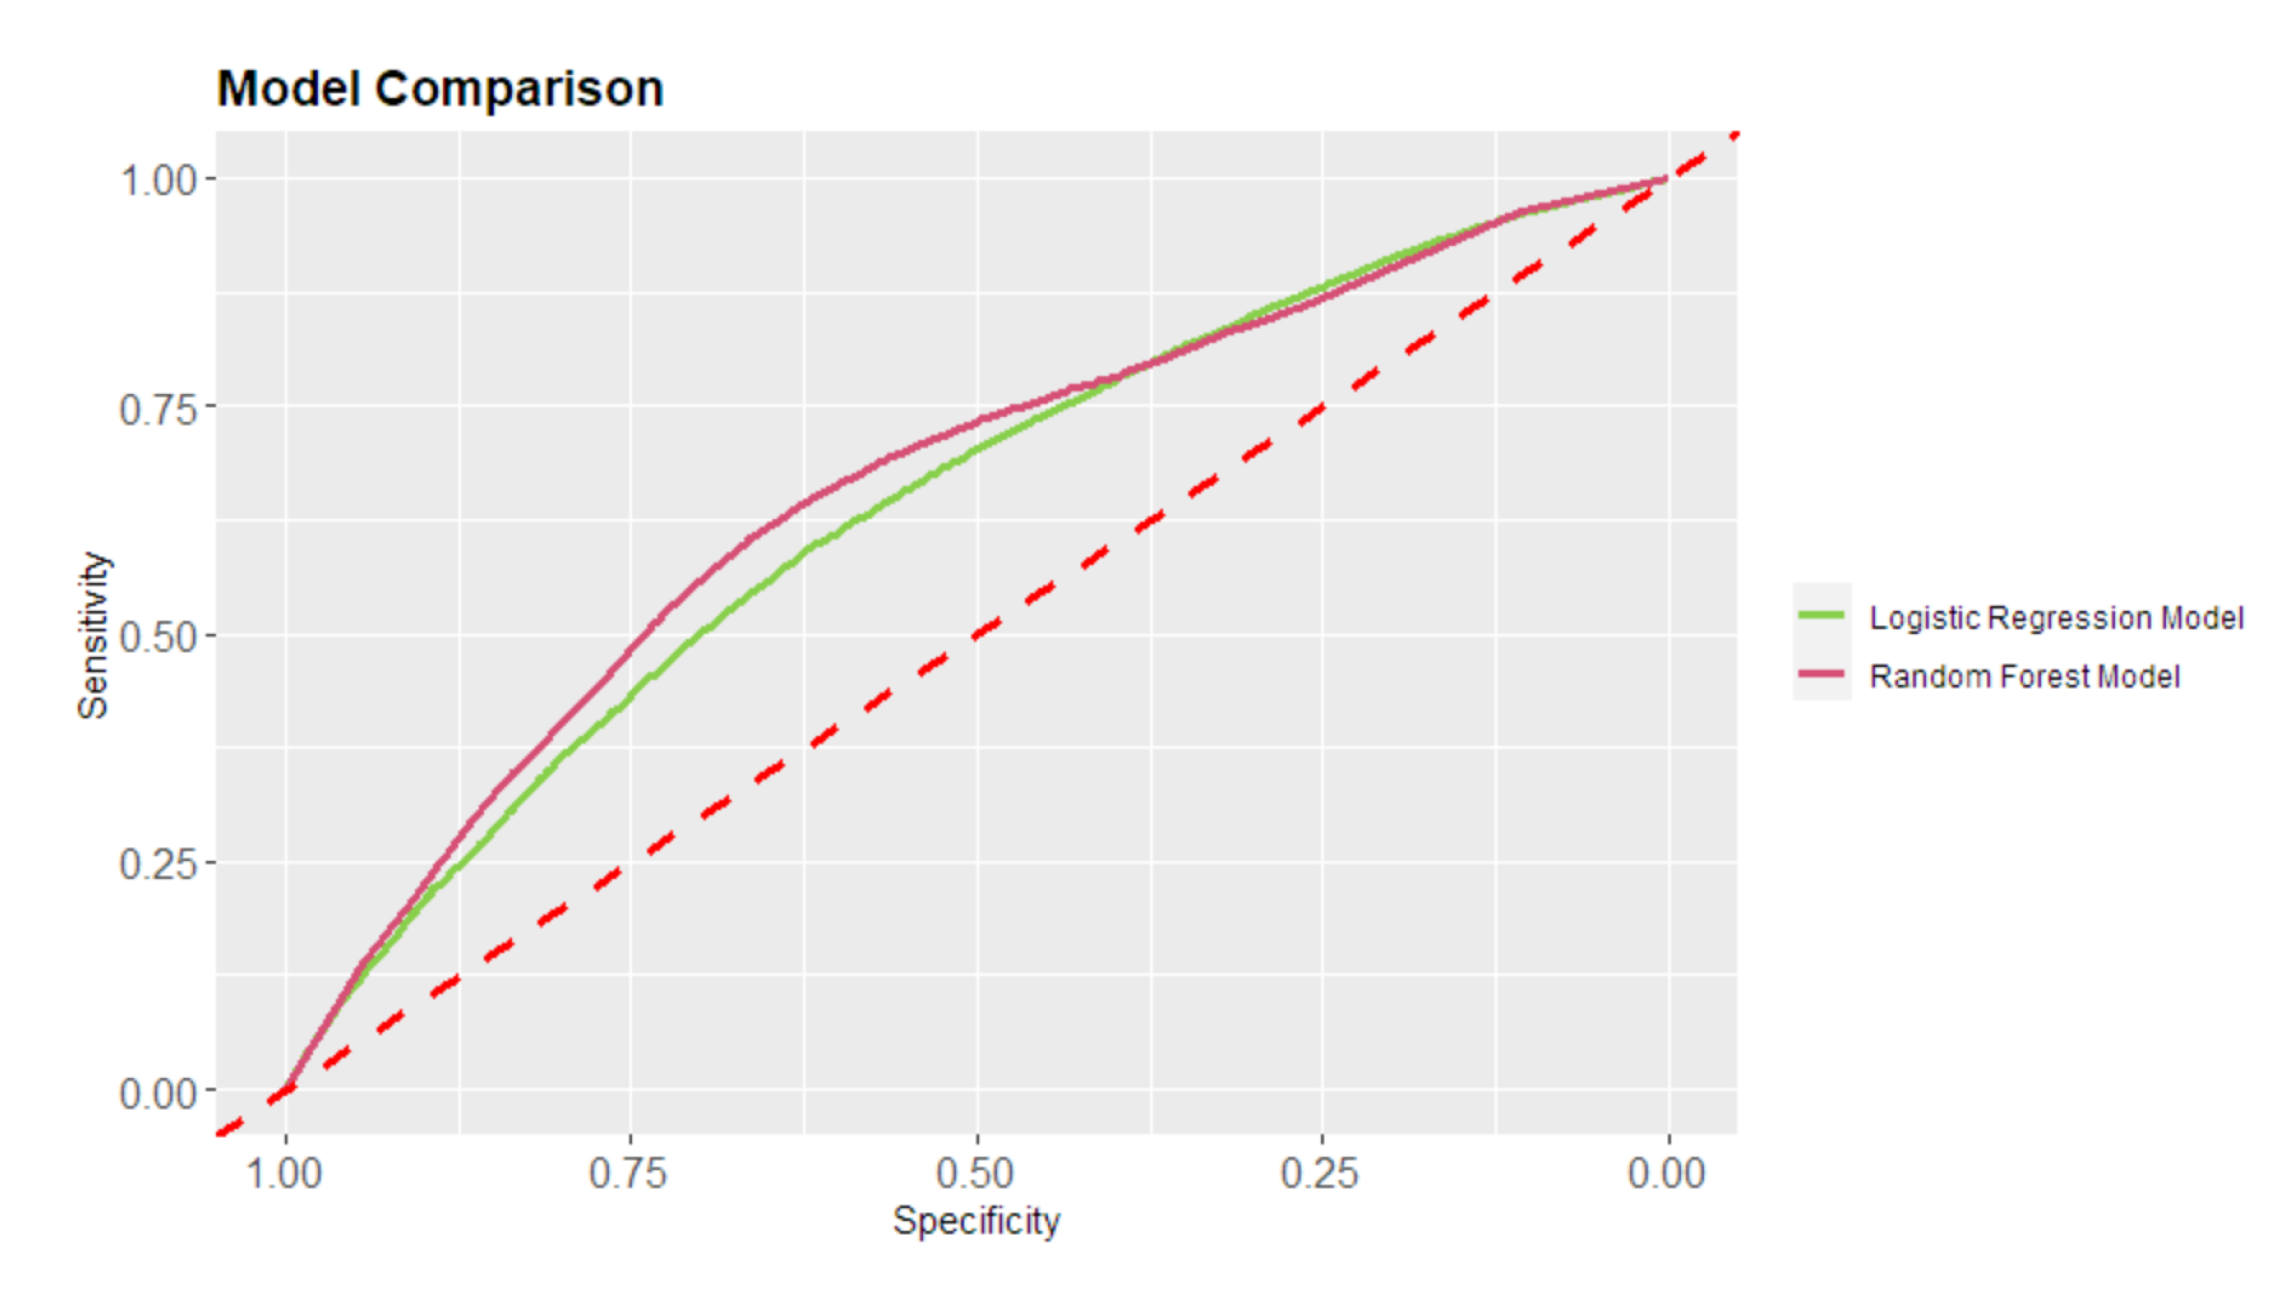
Table indicates that for logistic regression and random forest, the AUC was significantly higher than 0.5. The random forest had a higher area under the curve of 65.89% compared to the logistic regression. Logistic regression was the most accurate classifier with the highest prevalence of 89.20% and recall of 19.35%.
5.9. Confidence Intervals
Two methods were used to find confidence intervals from the dataset. Confidence intervals estimates were obtained using the standard method discussed under the theoretical background. The second method used the shortest width CI for odds ratio (OR) in logistic regression based on a theorem by [23]. The two methods were discussed in the theoretical background section. From Table , it can be seen that the predictors: number of vehicles, speed limit, and light conditions: Night do not contain 0. The 95% confidence intervals displayed show that light conditions had a minimum bound of and highest bound of . The null hypothesis is given as = There is no association between the light conditions variable and the traffic fatal accident. The alternative hypothesis is given as = There is an association between the light conditions variable and the traffic fatal accident. The lower bound and the upper bound are less than one. Hence, light conditions are significant and had an influence on the increase in traffic accident fatalities. The predictor weather conditions snowing include 0 since it has a minimum bound of and highest bound of . This shows the parameter is statistically insignificant.
Looking at the 95% confidence interval, the variable urban has a significant effect on the traffic fatalities since the lower and upper bounds are and , respectively. The 95% confidence interval for the variable "did the police officer attend the scene of the accident" had a minimum bound of and highest bound of . This does not include zero and the positive values demonstrate that there is a greater risk of traffic fatal accidents. In summary, the fourth quarter result seems to be significant as the lower bound is and the upper bound is . This is because zero is not included in this 95% confidence interval assuming normality. Looking at the variable speed limit with parameter estimate = 0.0046902 and = . The 95% CI intervals for shortest width for odds ratio (OR) in logistic regression are given by:
The confidence intervals for speed limit do not include 1. This indicates that the speed limit is statistically significant. Additionally, the variable light conditions had a lower bound of 3.4644550 and an upper bound of 3.629052751. It does not contain 1 and we conclude that it is statistically significant.
Table 8.
Wald CI and Shortest width CI results for traffic accident fatalities.
| Covaraites | Estimate | 95% Shortest width CI | Std.Error | 95% CI standard |
| Number of Vehicles | -0.3284669 | 0.7100925; 0.73010000 | 0.0070883 | -0.3424; -0.3146 |
| Day:Weekends | 0.1610077 | 1.148702141; 1.2021274009 | 0.0114158 | 0.1386; 0.1834 |
| Road Type:Slip | -0.1888540 | 0.7810525515; 0.8775729826 | 0.0297239 | |
| Road Type: Round About | -0.4055796 | 0.639604151; 0.6947151372 | 0.021084 | |
| Road Type: Others | 0.1125592 | 0.9482779306; 1.320784719 | 0.0845239 | -0.0531; 0.2782 |
| Speed limit | 0.0046902 | 1.003741683 ; 1.005661667 | 0.0004875 | 0.0037 ; 0.0056 |
| Light Conditions: Night | 1.2657635 | 3.46445501 ; 3.629052751 | 0.0118409 | 0.2125 ;0.2589 |
| Weather Conditions: Raining | -0.2391297 | 0.759102227 ;0.816571684 | 0.0186169 | |
| Weather Conditions: Snowing | -0.0793410 | 0.7394373794 ; 1.153941738 | 0.1135330 | -0.3019 ; 0.1432 |
| Road Surface conditionaal: Snow | -0.0155717 | 0.9565409105 ; 1.013377002 | 0.0147245 | -0.0444 ; 0.0133 |
| Road Surface: Wet | -0.5092450 | 0.551785689; 0.654492961 | 0.0435462 | |
| Place of Accident: Urban | -0.3623045 | 0.676985029; 0.7156937836 | 0.0141845 | -0.3901; -0.3345 |
| Police Attendance Yes | 0.8546232 | 2.281923601 ;2.42111366 | 0.0151043 | 0.8250 ;0.8842 |
| 4th Quarter | 0.0500855 | 1.022686749 ;1.080839191 | 0.0141083 | 0.0224 ;0.0777 |
Table 9.
Goodness of fit.
| McFadden psedo R square | Cox and snell r square | Nagelkerke R square |
| 0.04151248 | 0.05592391 | 0.07456521 |
Table 10.
Wald test results for traffic accident fatalities.
| Covaraites | Estimate | Wald | DF | P-value |
| Intercept | -0.2110327 | 41.8 | 1 | 0.00 |
| Number of Vehicles | -0.3284669 | 2147.3 | 1 | 0.0 |
| Day:Weekends | 0.1610077 | 198.9 | 1 | 0.00 |
| Road Type:Slip | -0.1888540 | 40.4 | 1 | 0.00 |
| Road Type Round About | -0.4055796 | 1.8 | 1 | 0.18 |
| Road Type: Others | 0.1125592 | 370.0 | 1 | 0.00 |
| Speed limit | 0.0046902 | 92.6 | 1 | 0.00 |
| Light Conditions: Night | 1.2657635 | 396.2 | 1 | 0.00 |
| Weather Conditions: Fog/Mist | -0.1769851 | 6.9 | 1 | 0.0087 |
| Weather Conditions: Raining | -0.2391297 | 12.2 | 1 | 0.00048 |
| Weather Conditions: Snowing | -0.0793410 | 165.0 | 1 | 0.00 |
| Weather Conditions: Others | -0.1058903 | 1 | 1 | 0.48 |
| Road Surface: Snow | -0.0155717 | 1.1 | 1 | 0.29 |
| Road Surface: Wet | -0.5092450 | 136.8 | 1 | 0.00 |
| Place of Accident: Urban | -0.3623045 | 652.4 | 1 | 0.00 |
| Police Attendance Yes | 0.8546232 | 3201.5 | 1 | 0.00 |
| 2nd Quarter | 0.1260474 | 71.7 | 1 | 0.0 |
| 3rd Quarter | 0.1066344 | 51.7 | 1 | 0.00 |
| 4th Quarter | 0.0500855 | 12.6 | 1 | 0.00039 |
6. Summary, Conclusions and Recommendations
The objective of this section is to provide a summary of all findings, to draw conclusions from the findings, and to propose possible recommendations to reduce road traffic fatalities in the United kingdom. Additionally, the study identifies areas for further study. Our study compared logistic regression with random forest on variables that were critical to increasing accident severity. This study employed logistic regression analysis instead of other statistical techniques used in past studies. Considering that the target variable, accident severity, had two categories, logistic regression was identified as the suitable method for the analysis of accident data.
In this study, statistical and machine learning methods for analysing traffic accident fatalities were compared. Based on a logistic regression model and a random forest, the study examined factors that influence traffic accident fatality. This study discussed at length the independent variables that were selected to analyse the traffic accident dataset. The logistic regression method was found to provide better results than the random forest as it had a higher accuracy rate than that of the random forest. Data was analysed using the R software package. Independent variables such as Road Type: Slip, whether a police officer attended the scene of the accident, and quarter had an effect on increasing traffic accident fatalities. They had p values that were less than 0.05. The study found the speed limit and quarter to be the most important variables in increasing the traffic accident fatalities since both recorded p values less than 0.05.
The speed limit variable plays a great role in increasing traffic accident fatalities. Lower speeds resulted in fewer fatalities. There are several factors that influence the speed limits. For instance, drivers tend to reduce the speed they travel at if it is raining. In this study, the results are consistent with those of [88], who argued that drivers would take more care in wet conditions by adjusting their speed and driving habits accordingly. Additionally, [89] noted that a reduction in speed limits achieves low crash rates and reduces severe injuries and fatalities.
The variable Day: Weekends had an odds ratio 1.1746941 indicating that fatal accidents are 1.1746941 times more likely to occur as compared to Day Weekdays. In addition, it had a p value 0.0000 which means that it had an influence on increasing accidents fatalities during Weekends. Research done by other researchers does not concur with this finding. For instance, [83] stated that most fatal accidents occur during the weekdays rather than on weekends. The number of fatal accidents is generally higher during the weekdays since more people travel to work, increasing the chance of accidents. For night light condition had odds ratio 3.5457989, which means fatalities are 3.5457989 more likely to occur as compared to the day light condition. This indicate that it had an influence on increasing traffic accident fatalities. These results seem to be consistent with our studies. According to [76], light condition is associated with greater severity. Moreover, the Weather Conditions: Raining had a p value of 0.0000 and Road Type: Slip had a p value of 0.0000. This indicates that there was an increase in traffic accident fatalities since the p values are less than .
There is a small difference in the performance of statistical and machine learning methods in traffic accident fatalities. Based on Table , the random forest model had an accuracy of 64.01 %, while the logistic regression model had an accuracy of 79.85%. This shows a slight difference of 15.84%. A random forest error rate of 35.99% was observed, compared to 20.15% error rate for logistic regression. The results proved that the logistic regression model performed better in predicting the accident severity (fatal and non-fatal). Despite the fact that Logistic Regression had an area, F1 score and gini index lower than the Random forest it still remains a better fit model since it had a higher accuracy rate.
The variables that were used to predict the traffic accident fatalities are displayed in Table . It can be seen that the variable Road Surface: Wet is significantly associated with a fatal accident since it has p value 0.0000 which is less than 0.05. Also, Table indicates the importance of the variables that were used. It can be seen that the variables speed limit, police presence and quarter had an increasing influence on accident fatalities. The speed limit, police presence and quarter had a mean decrease accuracy 102.1669, 221.5322 and 120.894 respectively. Table 5.3 shows that speed limit, police presence and quarter had p values that were less than 0.05. This means they had an influence on increasing accident fatalities. Additionally, the variables, light conditions and Day: Weekends, had a high association with accident fatatlities since they had p values equal to 0.0000. Traffic fatalities are significantly related to the speed limit. By using the odds ratio, the study explored the relationship between traffic fatalities and explanatory factors. From the findings of the study, the predictor number of vehicles had odds ratio 0.7200268 which means traffic fatalities are 0.7200268 times less likely to occur. This indicate that it did not increase traffic accident fatalities. Furthermore, the variable police attendance at the scene of the accident, had the odds ratio of 2.350, suggesting that it was 2.350 times likely to occur compared to police non attendance. This indicate that it had an influence on increasing traffic accident fatalities.
In light of the previous comparison on traffic accident fatalities, this study recommends that two statistical learning methods: ordered probit model and multinomial logistic regression be compared with support vector machines and artificial neural networks which non parametric. This is because support vector machine and artificial neural networks are non parametric methods with less research work done on their comparison with traditional methods. For all people using the roads, regardless of whether they use public transportation or not, there is still a need for more policy developments to make the roads safer. For example, breaking road rules should lead to fines or a ban on driving to reduce traffic fatalities. Training should be provided to drivers to prevent accidents since many accidents are caused by human error. The study was conducted in a developed country. The accuracy of statistical as well as machine learning methods in estimating traffic fatalities needs to be compared with accident records from developing countries. Comparing the results between developing and developed countries should provide insight into where improvement can be made.
References
- Andeta, J.A. Road-traffic accident prediction model: Predicting the Number of Casualties, 2021.
- Olsen, J.R.; Mitchell, R.; Ogilvie, D.; Team, M.S. Effect of a new motorway on social-spatial patterning of road traffic accidents: A retrospective longitudinal natural experimental study. PloS one 2017, 12, e0184047. [Google Scholar] [CrossRef] [PubMed]
- Abubakar, I.; Tillmann, T.; Banerjee, A. Global, regional, and national age-sex specific all-cause and cause-specific mortality for 240 causes of death, 1990-2013: a systematic analysis for the Global Burden of Disease Study 2013. Lancet 2015, 385, 117–171. [Google Scholar]
- Duncan, C.; Khattak, A.; Council, F. APPLYING THE ORDERED PROBIT MODEL TO INJURY SEVERITY IN TRUCK-PASSENGER CAR REAR-END COLLISIONS. Transportation Research Record 1998. [Google Scholar] [CrossRef]
- Shankar, V.; Mannering, F.; Barfield, W. Effect of roadway geometrics and environmental factors on rural freeway accident frequencies. Accident Analysis & Prevention 1995, 27, 371–389. [Google Scholar]
- Chen, M.; Zhou, L.; Choo, S.; Lee, H. Analysis of Risk Factors Affecting Urban Truck Traffic Accident Severity in Korea. Sustainability 2022, 14, 2901. [Google Scholar] [CrossRef]
- Farmer, C.M.; Braver, E.R.; Mitter, E.L. Two-vehicle side impact crashes: the relationship of vehicle and crash characteristics to injury severity. Accident Analysis & Prevention 1997, 29, 399–406. [Google Scholar]
- Subramanian, R. Passenger vehicle occupant fatality rates by type and size of vehicle; Citeseer, 2006.
- Anvari, M.B.; Kashani, A.T.; Rabieyan, R. Identifying the most important factors in the at-fault probability of motorcyclists by data mining, based on classification tree models. International Journal of Civil Engineering 2017, 15, 653–662. [Google Scholar] [CrossRef]
- Kumar, S.; Toshniwal, D. A data mining approach to characterize road accident locations. Journal of Modern Transportation 2016, 24, 62–72. [Google Scholar] [CrossRef]
- Iranitalab, A.; Khattak, A. Comparison of four statistical and machine learning methods for crash severity prediction. Accident Analysis & Prevention 2017, 108, 27–36. [Google Scholar]
- Bedard, M.; Guyatt, G.H.; Stones, M.J.; Hirdes, J.P. The independent contribution of driver, crash, and vehicle characteristics to driver fatalities. Accident Analysis & Prevention 2002, 34, 717–727. [Google Scholar]
- Chang, L.Y.; Wang, H.W. Analysis of traffic injury severity: An application of non-parametric classification tree techniques. Accident Analysis & Prevention 2006, 38, 1019–1027. [Google Scholar]
- KIM, S.H.; CHUNG, S.B.; SONG, K.H.; CHON, K.S. Development of an Accident Prediction Model using GLIM (Generalized Log-linear Model) and EB method: A case of Seoul. Journal of the Eastern Asia society for Transportation studies 2005, 6, 3669–3682. [Google Scholar]
- Kim, J.H. Multicollinearity and misleading statistical results. Korean journal of anesthesiology 2019, 72, 558–569. [Google Scholar] [CrossRef] [PubMed]
- Ahmed, L.A. Using logistic regression in determining the effective variables in traffic accidents. Applied mathematical Sciences 2017, 11, 2047–2058. [Google Scholar] [CrossRef]
- Harrell, F.E. Regresión modeling strategies: whit applications to linear models, logistic regression, and survival analysis. Technical report, 2001.
- Chatterjee, S.; Hadi, A.S. Regression analysis by example; John Wiley & Sons, 2015.
- Czepiel, S.A. Maximum likelihood estimation of logistic regression models: theory and implementation. Available at czep. net/stat/mlelr. pdf 2002, 83. [Google Scholar]
- Garson, D. Logistic Regression with SPSS. North Carolina State University. Public administration Program 2009. [Google Scholar]
- Norušis, M.J. SPSS statistics 17.0: Statistical procedures companion; Prentice Hall/Pearson Education, 2008.
- Agresti, A. Categorical Data Analysis. John Wiley & Sons. Inc., Publication 2002, 15, 24. [Google Scholar]
- Dahiya, R.C.; Guttman, I. Shortest confidence and prediction intervals for the log-normal. The Canadian Journal of Statistics/La Revue Canadienne de Statistique 1982, pp. 277–291.
- Mbachu, H.; Nduka, E.; Nja, M. Designing a pseudo R-Squared goodness-of-fit measure in generalized linear models. Journal of Mathematics Research 2012, 4, 148. [Google Scholar] [CrossRef]
- Menard, S. Applied logistic regression analysis; Vol. 106, Sage, 2002.
- Al-Ghamdi, A.S. Using logistic regression to estimate the influence of accident factors on accident severity. Accident Analysis & Prevention 2002, 34, 729–741. [Google Scholar]
- Tsay, R.S. Multivariate time series analysis: with R and financial applications; John Wiley & Sons, 2013.
- James, G.; Witten, D.; Hastie, T.; Tibshirani, R. An introduction to statistical learning; Vol. 112, Springer, 2013.
- Scornet, E.; Biau, G.; Vert, J.P. Supplementary materials for: Consistency of random forests. arXiv 2015, 1510. [Google Scholar]
- Breiman, L. Random forests. Machine learning 2001, 45, 5–32. [Google Scholar] [CrossRef]
- Louppe, G.; Wehenkel, L.; Sutera, A.; Geurts, P. Understanding variable importances in forests of randomized trees. Advances in neural information processing systems 26 2013. [Google Scholar]
- Karayılan, T.; Kılıç, Ö. Prediction of heart disease using neural network. 2017 International Conference on Computer Science and Engineering (UBMK). IEEE, 2017, pp. 719–723.
- Abdelwahab, H.T.; Abdel-Aty, M.A. Development of artificial neural network models to predict driver injury severity in traffic accidents at signalized intersections. Transportation Research Record 2001, 1746, 6–13. [Google Scholar] [CrossRef]
- Guns, R.; Lioma, C.; Larsen, B. The tipping point: F-score as a function of the number of retrieved items. Information Processing & Management 2012, 48, 1171–1180. [Google Scholar]
- Deng, X.; Liu, Q.; Deng, Y.; Mahadevan, S. An improved method to construct basic probability assignment based on the confusion matrix for classification problem. Information Sciences 2016, 340, 250–261. [Google Scholar] [CrossRef]
- Berry, K.J.; Mielke Jr, P.W. A generalization of Cohen’s kappa agreement measure to interval measurement and multiple raters. Educational and Psychological Measurement 1988, 48, 921–933. [Google Scholar] [CrossRef]
- Mandrekar, J.N. Receiver operating characteristic curve in diagnostic test assessment. Journal of Thoracic Oncology 2010, 5, 1315–1316. [Google Scholar] [CrossRef]
- Japkowicz, N.; Stephen, S. The class imbalance problem: A systematic study. Intelligent data analysis 2002, 6, 429–449. [Google Scholar] [CrossRef]
- Visa, S.; Ralescu, A. The effect of imbalanced data class distribution on fuzzy classifiers-experimental study. The 14th IEEE International Conference on Fuzzy Systems, 2005. FUZZ’05. IEEE, 2005, pp. 749–754.
- Chawla, N.V.; Bowyer, K.W.; Hall, L.O.; Kegelmeyer, W.P. SMOTE: synthetic minority over-sampling technique. Journal of artificial intelligence research 2002, 16, 321–357. [Google Scholar] [CrossRef]
- Ossiander, E.M.; Cummings, P. Freeway speed limits and traffic fatalities in Washington State. Accident Analysis & Prevention 2002, 34, 13–18. [Google Scholar]
- Hauer, E. Statistical road safety modeling. Transportation Research Record 2004, 1897, 81–87. [Google Scholar] [CrossRef]
- Anastasopoulos, P.C.; Tarko, A.P.; Mannering, F.L. Tobit analysis of vehicle accident rates on interstate highways. Accident Analysis & Prevention 2008, 40, 768–775. [Google Scholar]
- Oppong, R.A. Statistical analysis of road accidents fatality in Ghana using Poisson regression. PhD thesis, 2012.
- Anderson, M. Safety for whom? The effects of light trucks on traffic fatalities. Journal of health economics 2008, 27, 973–989. [Google Scholar] [CrossRef] [PubMed]
- Ye, F.; Lord, D. Comparing three commonly used crash severity models on sample size requirements: Multinomial logit, ordered probit and mixed logit models. Analytic methods in accident research 2014, 1, 72–85. [Google Scholar] [CrossRef]
- Caliendo, C.; Guida, M.; Parisi, A. A crash-prediction model for multilane roads. Accident Analysis & Prevention 2007, 39, 657–670. [Google Scholar]
- Milton, J.; Mannering, F. The relationship among highway geometrics, traffic-related elements and motor-vehicle accident frequencies. Transportation 1998, 25, 395–413. [Google Scholar] [CrossRef]
- Poch, M.; Mannering, F. Negative binomial analysis of intersection-accident frequencies. Journal of transportation engineering 1996, 122, 105–113. [Google Scholar] [CrossRef]
- Shankar, V.; Milton, J.; Mannering, F. Modeling accident frequencies as zero-altered probability processes: an empirical inquiry. Accident Analysis & Prevention 1997, 29, 829–837. [Google Scholar]
- Miaou, S. The relationship between truck accidents and geometric design of road sections: Poisson versus negative binomial regressions. Accident; Analysis and Prevention 1994, 26, 471–482. [Google Scholar] [CrossRef]
- Valent, F.; Schiava, F.; Savonitto, C.; Gallo, T.; Brusaferro, S.; Barbone, F. Risk factors for fatal road traffic accidents in Udine, Italy. Accident Analysis & Prevention 2002, 34, 71–84. [Google Scholar]
- Guo, L.; Ge, P.S.; Zhang, M.H.; Li, L.H.; Zhao, Y.B. Pedestrian detection for intelligent transportation systems combining AdaBoost algorithm and support vector machine. Expert Systems with Applications 2012, 39, 4274–4286. [Google Scholar] [CrossRef]
- AKIN, H.B.; Şentürk, E. Bireylerin mutluluk düzeylerinin ordinal lojistik regresyon analizi ile incelenmesi-analysing levels of happiness of individuals with ordinal logistic analysis. Öneri Dergisi 2012, 10, 183–193. [Google Scholar]
- Mussone, L.; Ferrari, A.; Oneta, M. An analysis of urban collisions using an artificial intelligence model. Accident Analysis & Prevention 1999, 31, 705–718. [Google Scholar]
- Yan, X.; Yi, P.; Wu, C.; Zhong, M. ICTIS 2011. American Society of Civil Engineers, 2011.
- Warner, P. Ordinal logistic regression. BMJ Sexual & Reproductive Health 2008, 34, 169–170. [Google Scholar]
- Karayiannis, N.; Venetsanopoulos, A. ANNs: Learning Algorithms. Performance Evaluation and Applications. Kluwer Academic Publishers, Boston 1993.
- Jadaan, K.S.; Al-Fayyad, M.; Gammoh, H.F. Prediction of road traffic accidents in jordan using artificial neural network (ANN). Journal of Traffic and Logistics Engineering 2014, 2. [Google Scholar] [CrossRef]
- Brijesh Kumar, B.; Sourabh, P. Mining educational data to analyze students’ performance, 2011.
- Kunt, M.M.; Aghayan, I.; Noii, N. Prediction for traffic accident severity: comparing the artificial neural network, genetic algorithm, combined genetic algorithm and pattern search methods. Transport 2011, 26, 353–366. [Google Scholar] [CrossRef]
- Rezaie Moghaddam, F.; Afandizadeh, S.; Ziyadi, M. Prediction of accident severity using artificial neural networks. International Journal of Civil Engineering 2011, 9, 41–48. [Google Scholar]
- Chibueze, O.T.; Nonyelum, O.F. Prediction of Solid Waste Generation Using Self-Organizing Map and Multilayer Perceptron Neural Networks. IUP Journal of Science & Technology 2010, 6. [Google Scholar]
- Krishnaveni, S.; Hemalatha, M. A perspective analysis of traffic accident using data mining techniques. International Journal of Computer Applications 2011, 23, 40–48. [Google Scholar] [CrossRef]
- Beshah, T.; Ejigu, D.; Abraham, A.; Snášel, V.; Krömer, P. Knowledge discovery from road traffic accident data in Ethiopia: Data quality, ensembling and trend analysis for improving road safety. Neural Network World 2012, 22, 215. [Google Scholar] [CrossRef]
- Tavakoli Kashani, A.; Shariat-Mohaymany, A.; Ranjbari, A. A data mining approach to identify key factors of traffic injury severity. PROMET-Traffic&Transportation 2011, 23, 11–17. [Google Scholar]
- Criminisi, A.; Shotton, J. Decision forests for computer vision and medical image analysis; Springer Science & Business Media, 2013.
- Effati, M.; Thill, J.C.; Shabani, S. Geospatial and machine learning techniques for wicked social science problems: analysis of crash severity on a regional highway corridor. Journal of Geographical Systems 2015, 17, 107–135. [Google Scholar] [CrossRef]
- Han, J.; Kamber, M.; Pei, J. Data mining concepts and techniques third edition. The Morgan Kaufmann Series in Data Management Systems 2011, 5, 83–124. [Google Scholar]
- Pakgohar, A.; Tabrizi, R.S.; Khalili, M.; Esmaeili, A. The role of human factor in incidence and severity of road crashes based on the CART and LR regression: a data mining approach. Procedia Computer Science 2011, 3, 764–769. [Google Scholar] [CrossRef]
- Al-Radaideh, Q.A.; Daoud, E.J. Data mining methods for traffic accident severity prediction. Int. J. Neural Netw. Adv. Appl 2018, 5, 1–12. [Google Scholar]
- Li, X.; Lord, D.; Zhang, Y.; Xie, Y. Predicting motor vehicle crashes using support vector machine models. Accident Analysis & Prevention 2008, 40, 1611–1618. [Google Scholar]
- Kadilar, G.O. Effect of driver, roadway, collision, and vehicle characteristics on crash severity: a conditional logistic regression approach. International journal of injury control and safety promotion 2016, 23, 135–144. [Google Scholar] [CrossRef]
- Theofilatos, A.; Graham, D.; Yannis, G. Factors affecting accident severity inside and outside urban areas in Greece. Traffic injury prevention 2012, 13, 458–467. [Google Scholar] [CrossRef] [PubMed]
- Potoglou, D.; Carlucci, F.; Cirà, A.; Restaino, M. Factors associated with urban non-fatal road-accident severity. International journal of injury control and safety promotion 2018, 25, 303–310. [Google Scholar] [CrossRef]
- Christoforou, Z.; Cohen, S.; Karlaftis, M.G. Vehicle occupant injury severity on highways: An empirical investigation. Accident Analysis & Prevention 2010, 42, 1606–1620. [Google Scholar]
- Herman, J.; Kafoa, B.; Wainiqolo, I.; Robinson, E.; McCaig, E.; Connor, J.; Jackson, R.; Ameratunga, S. Driver sleepiness and risk of motor vehicle crash injuries: a population-based case control study in Fiji (TRIP 12). Injury 2014, 45, 586–591. [Google Scholar] [CrossRef] [PubMed]
- Wang, S.Y.; Chi, G.B.; Jing, C.X.; Dong, X.M.; Wu, C.P.; Li, L.P. Trends in road traffic crashes and associated injury and fatality in the People’s Republic of China, 1951–1999. Injury control and safety promotion 2003, 10, 83–87. [Google Scholar] [CrossRef] [PubMed]
- Aarts, L.; Van Schagen, I. Driving speed and the risk of road crashes: A review. Accident Analysis & Prevention 2006, 38, 215–224. [Google Scholar]
- Tefft, B.C. The Prevalence of Motor Vehicle Crashes Involving Road Debris, United States, 2011-2014. Age (years) 2016, 20, 10–1. [Google Scholar]
- Clarke, D.; Ward, P.; Truman, W.; Bartle, C. Fatal vehicle-occupant collisions: An in-depth study. Road Safety Research Report 2007. [Google Scholar]
- Chang, L.Y.; Mannering, F. Analysis of injury severity and vehicle occupancy in truck-and non-truck-involved accidents. Accident Analysis & Prevention 1999, 31, 579–592. [Google Scholar]
- Rakha, H.; Van Aerde, M. Statistical analysis of day-to-day variations in real-time traffic flow data. Transportation research record 1995, pp. 26–34.
- Pai, C.W.; Saleh, W. Exploring motorcyclist injury severity in approach-turn collisions at T-junctions: Focusing on the effects of driver’s failure to yield and junction control measures. Accident Analysis & Prevention 2008, 40, 479–486. [Google Scholar]
- Anowar, S.; Yasmin, S.; Tay, R. Comparison of crashes during public holidays and regular weekends. Accident Analysis & Prevention 2013, 51, 93–97. [Google Scholar]
- Kuhn, M.; Johnson, K.; Kuhn, M.; Johnson, K. Over-fitting and model tuning. Applied predictive modeling 2013, pp. 61–92.
- Mokoma, L.D. Investigating pedestrian safety solutions on rural high-order roads. Case-study: R71 Polokwane. Master’s thesis, University of Cape Town, 2017.
- Hawkins, R.K. Motorway traffic behaviour in reduced visibility conditions. Vision in Vehicles II. Second International Conference on Vision in VehiclesApplied Vision AssociationErgonomics SocietyAssociation of Optometrists, 1988.
- De Pauw, E.; Daniels, S.; Thierie, M.; Brijs, T. Safety effects of reducing the speed limit from 90 km/h to 70 km/h. Accident Analysis & Prevention 2014, 62, 426–431. [Google Scholar]
Disclaimer/Publisher’s Note: The statements, opinions and data contained in all publications are solely those of the individual author(s) and contributor(s) and not of MDPI and/or the editor(s). MDPI and/or the editor(s) disclaim responsibility for any injury to people or property resulting from any ideas, methods, instructions or products referred to in the content. |
© 2024 by the authors. Licensee MDPI, Basel, Switzerland. This article is an open access article distributed under the terms and conditions of the Creative Commons Attribution (CC BY) license (http://creativecommons.org/licenses/by/4.0/).
Copyright: This open access article is published under a Creative Commons CC BY 4.0 license, which permit the free download, distribution, and reuse, provided that the author and preprint are cited in any reuse.


