Submitted:
25 July 2024
Posted:
26 July 2024
You are already at the latest version
Abstract
Lanthanum (La(III)) is one of the high-demand rare earth elements with applications in various products. However, La(III) in mining waste streams and electronic waste also poses environmental and health concerns. Therefore, recovery of La(III) in the waste is needed. In the present study, adsorption of La(III) with Dowex 50W-X8, Amberchrom50WX4, Amberlyst 15, and Amberchrom 50WX2 was evaluated, using a shaker water bath. Dowex 50W-X8 was found to be the best adsorbent and used to investigate the effect of the shaker speed (RPM=50-150), adsorbent dosage (1.0-4.0 g), pH (2.0-7.0), and temperature (20-40oC) on adsorption. La(III) adsorption was found to increase with the shaker speed, as expected. On the other hand, adsorption capacity decreased with the adsorbent amount. Also, the highest La(III) adsorption was observed at pH = 6.0. La(III) percentage removal didn’t vary significantly with temperature from 20 oC -40oC. However, the first-order kinetic rate constant decreased moderately with increases in temperature. Adsorption of La(III) by Dowex 50-X8 followed the Freundlich isotherm model better than the Langmuir model. In addition, adsorption kinetics was represented well by the first-order kinetic model. Moreover, enthalpy and Gibbs free energy changes were found to be negative, indicating an exothermic and thermodynamically favourable adsorption process.
Keywords:
Lanthanum adsorption
1. Introduction
The ever-growing need for rare earth elements (REEs) has increased drastically over the past decade. This growth is due to the various technological innovations and advancements using different electronic devices throughout the world. REEs have been coined many different terms such as “seeds of technology” or “industrial vitamins” due to their extensive use in chemical industry, electronics, metallurgy, and medicine [1,2,3,4,5]. As of 2015, the global demand of REEs was about 120,000 metric tons per year and was projected to increase by 5% annually [2]. Worldwide production has increased faster than expected to about 300,000 metric tons in 2022 [4]. These materials are an abundant resource, but they are extremely difficult to enrich as well as separate from their medium [6]. In addition, with the increasing use of electronic and electrical devices, there is an increasing demand for rare and other metals while the natural resources are limited. This leads to an interest in secondary sources from discarded devices. Waste electrical and electronic devices (e-waste), such as: old laptops, computers, smartphones and other electronic devices, are becoming the fastest growing waste stream in the world. In 2016 the worldwide total e-waste was 44.7 million tons, and it was expected to grow to 52.2 million tons in 2021 [7]. The e-waste contains a wide range of valuable metals as well as hazardous substances. For example, waste battery materials contain lithium, cobalt, nickel, and REEs. Thus, the recovery of metals from e-waste serves multiple faucets: resources re-utilization, environmental protection and reduced production costs [8]. In addition, due to the low efficiency of past mining processes and the lack of focus on recovering RREs, a significant amount of RREs was lost in the mining tailings.
Recycle of solid electronic waste usually involves leaching as a first step to dissolved metals out of the solid devices. Then, the metals of interest can be separated from other metals by ion exchange, solvent extraction, combined ion exchange/solvent extraction or liquid membrane processes etc. [9,10]. In the same token, Lanthanum, one of REEs, has become more popular over time due to continued industrial activities such as mining and ore processing. High concentrations of La(III) are often found in the mining tailings.. Therefore, researchers have devoted time and resources in investigating different methods of recovering REEs from the industrial wastes, especially from mining and mineral processing [11,12]. Various techniques investigated are reverse osmosis, evaporation, solvent extraction, chemical precipitation, membrane separation, ion-exchange, and adsorption. These techniques are utilized to remove REEs before the industrial runoff reaches the environment and recycle/reuse the trace amounts found in the runoff for other purposes. Among those techniques, many reported literatures indicated that adsorption was one of the most cost-effective, highly selective, and easily operated methods with a great potential in industry [13,14,15]. Several adsorbents have been used for La(III) recovery including raw or modified biosorbents, silica-based materials, chelating resins, polymeric, biopolymeric, and carbon-based commercial materials [16,17,18,19,20,21,22,23,24]. In this investigation, several commercially available polymeric resins were assessed for their La(III) adsorption capacity.
2. Materials and Methods
A batch adsorption process was used throughout the present study. Lanthanum sulfate (Sigma-Aldrich, St. Louis, Missouri, USA) was used to prepare La(III) solutions at varied concentrations in distilled water. Different adsorbents and other chemicals were also obtained from Sigma-Aldrich. The pH of an La(III) solution was adjusted with either a dilute sulphuric acid solution or a sodium hydroxide solution. Adsorption experiments were carried out in a temperature-controlled shaker water bath with variable speed from 50-150 RPM (Julabo SW22, Julabo USA Inc., Allentown, PA, USA). 150.0 mL of La(III) solution at a given initial concentration was added into each Erlenmeyer flask. A certain amount of adsorbent, e.g., 1.0 g, was also added to the solution in the flask. The flasks were then placed and secured in the shaker water bath. The water bath was set at a certain temperature, e.g., 20.0oC, and a predetermined shaking speed, e.g., 100 RPM. A 3.0 mL solution sample was drawn from each flask every hour over an experimental duration of 7 hours. The La(III) concentrations in the samples were measured using an ICP (Agilent 5100/5110 VDV ICP-OES, Agilent Technologies, Inc., Santa Clara, CA, USA).
At the first stage of the study, the determination of the optimal shaker speed (RPM) was carried out with experiments at varied shaker speeds from 50 RPM to 150 RPM. Once the optimal RPM was determined, it was then used for other experiments thereafter. Different adsorbents, namely Dowex 50W-X8, Amberchrom50WX4 (formerly Dowex 50W-X4), Amberlyst 15 hydrogen form, Amberchrom 50WX2 (formerly Dowex 50W-X2), were tested so to select a suitable adsorbent for further study. To study the adsorbent surface structure, X-ray images of all adsorbents were obtained with a Synchrotron at the Canadian Light Source (CLS), Saskatoon, Canada. Also, surface images of Dowex 50W-X8 were captured using a scanning electron microscope (SEM) (JSM-6380 LV, JEOL, Japan), and elemental analyses of the resin before and after adsorption were performed with an energy dispersive spectrometry (EDS) INCA X-sight (Oxford Instruments, UK). In addition, the zeta potential of Dowex 50W-X8 was measured at varied solution pH, using a zeta potential analyzer (Zetasizer-Nano Series, Malvern Instruments Ltd., UK, ±0.01mV).
Once the adsorbent of choice was determined, the effect of the adsorbent amount on the adsorption capacity was carried out with experiments using varied adsorbent amounts from 1.0 g - 4.0 g (1.0 g increment). In addition, the effect of temperature and pH on adsorption of La(III) was also investigated. Experiments at different water bath temperatures from 20.0-40.0oC with a 5oC increment and varied solution pH from 2.0-7.0 with a 1.0 pH unit increment were performed. From the variation of the amount of La(III) adsorbed with adsorption time under different experimental conditions, the kinetic models for adsorption of La(III) were also developed.
Finally, experiments with different initial La(III) concentrations from 20.0-100.0 ppm were also carried out so that the adsorption isotherm for La(III) was determined. Typical thermodynamic parameters of adsorption, such as the changes in the Gibbs free energy, the enthalpy and the entropy, were also estimated.
The evaluation of the effect of the operational conditions on La(III) adsorption, as described above, was mainly based on the percentage removal and the adsorbed amount. The percentage removal was defined as:
Where Ci and Ct (mg/L) are the initial La(III) concentration in the solution and the concentration of La(III) remaining in the solution a given time, t, during the adsorption process.
The amount of La(III) adsorbed was calculated using the following equation:
Where qt is the amount of La(III) adsorbed at a given time (mg/g), t, M is the mass of adsorbent (g), and V the volume of the La(III) solution in the flask (L).
3. Results
3.1. Adsorbent Selection
Four different commercially available resins, namely Dowex 50W-X8, Amberchrom 50WX4 (formerly Dowex 50W-X4), Amberlyst 15 hydrogen form, and Amberchrom 50WX2 (formerly Dowex 50W-X2), were tested as potential adsorbents for the removal of La(III) from an aqueous solution. After 7 hours of adsorption, the percentage removal of La(III) was about 92% and relatively the same for all four adsorbents, considering the uncertainty of the experimental data, as shown in Figure 1(a). However, Dowex 50W-X8 showed a slightly higher amount of La(III) adsorbed after 7 hours, as compared with other adsorbents. Also, adsorption was quicker with Dowex 50W-X8 at the onset of the experiment, as can be seen in Figure 1(b). In addition, Dowex 50W-X8 is relatively less expensive than other resins.
Dowex 50W-X8 is a strongly acidic cation exchanger, H+ form, which is composed of a styrene divinylbenzene ([C10H12·C10H10·C8H8]x) gel matrix with sulfonic acid functional group (Millipore Sigma, St. Louis, Missouri, USA). X-ray images of Dowex 50W-X8, Amberchrom50WX4, Amberlyst 15 hydrogen form, and Amberchrom 50WX2, obtained with a Synchrotron are shown in Figure 1(c) - (j). The majority particle sizes (> 70% of particles) of the adsorbents were also measured and presented in Figure 1(k), and the particle size distribution of Dowex 50W-X8 is plotted in Figure 1(l). As can be seen in the images of Figure 1(c) and (d), Dowex 50W-X8 resin particles have grooved surface while other resins’ surface appeared to be smoother. In addition, as can be seen in Figure 1(k), this resin’s particles are smaller than those of the others, except Amberchrom 50WX2; thereby, the total surface area per unit mass would be relatively higher, enhancing adsorption capacity and adsorption rate, as shown in Figure 1(a). Therefore, Dowex 50W-X8 was selected as the adsorbent of choice for the rest of the present study. Figure 1(m) - (p) present the SEM images of Dowex 50W-X8 before and after 7 hours of adsorption along with the EDS elemental analysis of the resin. The surface structure appears similar in Figure 1(m) and 1 (o), indicating adsorption didn’t alter the physical integrity of the resin. The elemental analysis in Figure 1(n) shows no La(III) present in the fresh Dowex 50W-X8 while clear evidence of La(III) on the resin can be seen in Figure 1(p) for the resin after 7 hours of adsorption.
3.2. Effect of the Shaker Speed on Adsorption
To ensure that mass transfer is not a limiting step of the overall adsorption process, varied shaker speeds of the water bath were tested. The results obtained are shown in Figure 2. As can be seen in Figure 2, La(III) adsorption increased with the shaker speed, as expected. A 60% increase in the percentage removal of La(III) was observed as the RPM was increased from 50 to 100 RPM. The percentage removal approached a maximum (close to 100%) at the shaker speed of 125 RPM and leveled off with a further increase to 150 RPM. Therefore, the shaker speed of 100 RPM, which achieved 80% removal of La(III), was selected to use for all other experiments in this study. This allows for better observation of the impact of other parameters such as temperature, pH, etc. on La(III) removal.
The kinetics of La(III) adsorption at different shaker speeds was also assessed to better understand the dynamics of adsorption of La(III) onto the adsorbent and obtain predictive models that allow estimations of the amount adsorbed with adsorption time. This information could be used for scale-up to a larger system.
The first-order kinetic equation for adsorption can be expressed as [25]:
Where qe (mg/g) and qt (mg/g) are the adsorbate amounts adsorbed onto the adsorbent at equilibrium and at a given time t (h), respectively. KI is the first-order rate constant (1/h).
Integration of Eq. (3) and rearrangement of the resultant equation, the first-order kinetic equation can be rewritten as:
The second-order kinetics can be represented by the following equation [26]:
From Equation(5), the second-order kinetic equation can be rewritten as:
Where KII is the second-order adsorption rate constant (g/(mg∙h)).
As indicated by Eq. (4), KI and ln(qe) can be obtained from the slope and the intercept of a plot of ln(qe-qt) versus t, respectively. Similarly, for the second-order kinetics as shown in Equation (6), qe and KII can be extracted from the slope and the intercept of the plot of t/qt vs. t. The values of the rate constants, KI and KII, and the model prediction of qe along with the experimental qe are presented in Table 1. The data seemed to fit the first-order kinetic model better, as indicated by a much better agreement between the experimental adsorption capacities and the values predicted by the kinetic model. In addition, KI increased steadily with the shaker speed (RPM), as can be seen in Table 1. Therefore, the relationship between the rate constant (KI) and the particle Reynolds number (Re) was also evaluated. This helps generalize the relationship between KI and the shaker speed. The particle Re is defined as Re = (d∙ρ∙u)/µ, where d is the adsorbent particle diameter, ρ and µ are liquid density and viscosity, respectively, and u is the equivalent linear velocity of liquid in the flasks, based on the shaker stroke length (15 mm) and the RPM. The particle Reynolds numbers at varied shaker speeds were calculated using the equivalent linear velocity of liquid passing the particles and presented along with KI in Figure 3(a). Figure 3(a) shows an increasing trend of KI with Re that is directly related to the shaker speed.
The fluid movement around the adsorbent particles would be at the onset to the turbulent regime at 50 RPM (Re = 20) since this was much higher than the cut-off Re of about 1.0 for the Stokes flow regime. From the data of KI at varied values of Re, a correlation of KI with the particle Reynolds number was also obtained, using a curve fitting, with a coefficient of determination, R2, of 0.94, and presented in Equation (7) below. For mass transfer under the condition of a turbulent flow, the mass transfer coefficient, and hence, the first-order rate constant (KI) is expected to be proportional to the Reynolds number to an exponent greater than 0.50, as can be seen in the obtained correlation below:
In addition, the mass transfer coefficient for the convective transfer of La(III) from the bulk liquid to the adsorbent particles in its dimensionless form, the Sherwood number (Sh), at varied RPM, i.e., varied values of the Reynolds number, were estimated and plotted in Figure 3(b). The mass transfer coefficient was determined from a typical mass transfer rate equation below:
Where A is the total surface area of adsorbent particles (m2) suspended in liquid, k the mass transfer coefficient (m/s), ΔC is the La(III) concentration difference between the bulk liquid and the solid-liquid interface (mg/m3), and R the rate of La(III) transfer from liquid to solid adsorbent (mg/s). R can be obtained from the reduction of the La(III) concentration in the solution with time.
A correlation of the Sherwood number for the mass transfer of La(III) from liquid to solid adsorbent, with an averaged deviation of 4.5% between the predicted and experimental Sh values, was obtained as below:
Where the dimensionless Sherwood number, Sh = (k∙d)/D, d is the particle diameter (m) and D is the diffusivity of La(III) in an aqueous solution (0.62x10⁻⁹ m2/s) [27]. Re is the particle Reynolds number and Sc the Schmidt number, Sc = µ/(ρ∙D).
As can be seen in Equation (9), the Sherwood number has a very strong dependence on the Reynolds number to the power of 2.25, which is much higher than that for the case of mass transfer from a liquid stream to a single stationary sphere under turbulent regime (the power of 0.62) [28]. This might be due to the swirling motion of liquid in the flasks, which was created by shaking of the flasks in the water shaker bath. This caused more vigorous movements of both liquid and solid particles; and hence, mass transfer was enhanced with the shaker speed at a greater degree, resulting in a higher exponent of Re. Note that Equation (9) represents the mass transfer coefficient of the La(III) transfer from the liquid to the solid adsorbent, in a dimensionless form, which is commonly used to generalize experimental data in mass transfer. Therefore, Equation (9) can be used to predict the La(III) adsorption rate in a larger system or a system with other RPM if they are operated in the same range of the Reynolds numbers as in the present study.
3.3. Effect of Adsorbent Amount on Adsorption Capacity
The effect of the adsorbent amount on the percentage removal and the amount of La(III) adsorbed on to Dowex 50W-X8 was evaluated. The results obtained are presented in Figure 4(a) and 4(b). After 3 hours of adsorption with the same initial La(III) concentration and other operational conditions, the La(III) percentage removal increased as the amount of adsorbent was increased from 1.00 to 3.00 g, as can be seen in Figure 4(a). However, no discerning increase in the percentage removal was observed with a further increase in the adsorbent amount to 4.00 g,. However, for an extended adsorption period to 7 hours, no significant difference in the percentage removal, ranging from 89%-96%, was observed at varied adsorbent amount from 1.00-4.00 g.
It is relevant to note that even though the percentage removal of La(III), based on the total amount of La(III) removed with adsorption time, didn’t change significantly with increases in the adsorbent doses from 1.00-4.00 g, the adsorption capacity/adsorbed amount, defined as the amount of La(III) adsorbed per unit mass of adsorbent (mg La(III)/g adsorbent), decreased significantly with the amount of adsorbent. The adsorbed amount dropped almost 50% from 10.8 mg/g to 5.46 mg/g as the adsorbent amount was increased from 1.00 to 2.00 g. The reduction in the adsorption capacity became more gradual with further increases from 2.00-4.00 g, as can be seen in Figure 4(b). In the presence of a finite amount of La(III) in the solution, it is expected that the amount adsorbed per unit mass of adsorbent decreases with more adsorbent present, which provides abundant active sites, but the adsorption is limited by the amount of La(III) available in the solution.
The effect of the amount of adsorbent on the kinetics of La(III) adsorption was also assessed; and the results are presented in Figure 5. For various amounts of adsorbent from 1.00-4.00 g, Figure 5(a), (b), (c) and (d) show that the data fit to the first-order kinetic model quite well with the values of the coefficient of determination, R2, from 0.95-0.99. Also, as can be seen in Figure 5(e), the rate constant for the first-order adsorption kinetics (KI) increased slightly as the adsorbent amount was increased from 1.00 g to 2.00 g. However, a significant increase of 20% in KI was observed as the adsorbent amount was further increased from 2.00 g to 3.00 g; and it leveled off with a further increase to 4.00 g.
In addition to the assessment of the effect of the sole amount of adsorbent on the adsorption kinetics, a loading factor, which is a combination of the adsorbate concentration, the volume of the adsorbate solution, and the mass of the adsorbent available in the system at the beginning of the adsorption process, was introduced and used as below:
Where LF is the loading factor (mg/g), C is the concentration of La(III) in the solution (mg/L), V is the volume of the La(III) solution (L) and M is the mass of adsorbent used (g).
The variation of the rate constant, KI, with the different values of the loading factor, LF, due to the changes in the amount of adsorbent, is presented in Figure 5(f). As can be seen in Figure 5(f), KI didn’t change significantly with the LF value lower than 4.0. However, KI dropped drastically as LF increased to 6.0, then the decrease in KI became gradual with the loading factor increase beyond 6.0. Pooled data of KI with LF from several experiments under varied initial La(III) concentrations, solution volumes and adsorbent amounts are presented in Figure 5(g). Again, a similar trend of KI with LF can be seen in Figure 5(g) where KI appeared to stay relatively similar at LF ≤ about 5.0 and decreased with increases in LF above 5.0.
3.4. Effect of pH and Temperature on Adsorption
The uptake of La(III) was examined over a pH range from 2.0-7.0 since pH may affect the adsorbent surface characteristics (active sites for adsorption), the degree of ionization and the speciation of metal ions in a solution. The La(III) percentage removal over 2.5 hours and 7 hours of adsorption was determined and presented in Figure 6(a). After 2.5 hours of adsorption, the highest percentage removal of La(III) was observed at the solution pH of 6.0, representing an increase of almost 50% as the pH was increased from 2.0 to 6.0. However, the percentage removal was quite similar over the pH range from 2.0 to 5.0. On the other hand, there was a significant drop in the percentage removal with a further increase of pH from 6.0 to 7.0. A similar trend of KI’s variation with pH was also observed. Faster adsorption at pH = 6.0 is also reflected by the higher first-order rate constant, KI, at this pH, as can be seen in Figure 6(b). Nevertheless, over an extended adsorption time of 7 hours, the variation of the La(III) percentage removal over the range of pH from 2.0-7.0 diminished and fluctuated around 85%, except a slightly higher La(III) removal of 92% at pH = 6.0 and an 80% removal at pH of 5.0.
The zeta potential of the adsorbent was also measured over the pH range from 2.0-7.0 and plotted in Figure 6(c). As shown in Figure 6(c), the zeta potential was relatively neutral over the pH range from 2.0-7.0, considering the uncertainty of ± 0.8 mV of the measurement replicates. Therefore, the zeta potential didn’t have any significant effect on La(III) adsorption at varied pH.
For the effect of temperature on adsorption of La(III), experiments were carried out over a temperature range from 20.0-40.0oC. The results obtained are presented in Figure 7. As can be seen in Figure 7 (a), adsorption of La(III) by Dowex 50W-X8 appeared to be independent of temperature. The La(III) percentage removal after 7 hours of adsorption was around 90% at all temperatures tested, with a slightly lower percentage removal of about 85% at 25oC. Nevertheless, the kinetic rate constant was higher at a lower temperature, as presented in Figure 7(b), indicating an exothermic physical adsorption of La(III) by Dowex 50W-X8, as expected for this type of adsorbent. This was indeed the case as shown later in the thermodynamic analysis.
3.5. Kinetics, Isotherm Models and Thermodynamic Parameters of La(III) Adsorption
The kinetics of La(III) adsorption with varied initial La(III) concentrations was investigated. Experimental data were fitted to both the first-order kinetic model and the second-order kinetic model. However, the data fitted better to the first-order model; and hence, only the results for the first-order kinetics are presented in this section. As can be seen in Figure 8. the data fitted to the first order kinetic model quite well, as indicated by the coefficient of determination, R2, ranging from 0.973-0.986. The first-order rate constants, KI, can be extracted from the slopes of the plots in Figure 8. It was noted that KI only increased slightly with the initial concentration of La(III).
The variation of the adsorbed amount of La(III) with adsorption time for varied initial La(III) concentrations was calculated and plotted in Figure 9. At all initial La(III) concentrations, adsorption approached equilibrium after 6 hours of adsorption, as can be seen in Figure 9. The equilibrium data, qe and Ce, were then determined and fitted into the widely used isotherm models, namely the Langmuir model and the Freundlich model, so to obtain the isotherm equation for La(III) adsorption with Dowex 50W-X8 at 25.0oC.
The Langmuir model for monolayer adsorption can be expressed as [29]:
Where Ce (mg/L) and qe (mg/g) are the La(III) concentration remaining in the solution and the La(III) adsorbed amount at equilibrium, respectively. KL (L/mg) is the Langmuir isotherm constant and qL (mg/g) is the adsorption capacity of the resin.
Where Ce (mg/L) and qe (mg/g) are the La(III) concentration remaining in the solution and the La(III) adsorbed amount at equilibrium, respectively. KF ([mg1-n. Ln]/g) represents the Freundlich adsorption capacity and n is the heterogeneity factor indicating the multilayer adsorption.
The equilibrium data were applied to Equations (11) and (13), and the plots are presented in Figure 10. As can be seen in Figure 10, adsorption of La(III) onto Dowex 50W-X8 appears to follow the Freundlich model better with the coefficient of determination, R2 = 0.98 while the data fitted the Langmuir model very poorly with R2 of about 0.45. The model constants are presented in Table 2.
In addition, from the data obtained at different temperatures, the typical thermodynamic parameters, such as: the Gibbs free energy change (ΔGo), the enthalpy change (ΔHo) and the entropy change (ΔSo), were also evaluated for adsorption of La(III) by Dowex 50W-X8. ΔGo represents the degree of spontaneity of a process. A negative ΔGo indicates that a process is spontaneous while a positive one implies a non-spontaneous process. An exothermic process has a negative change in the enthalpy. This information in turn guides the operational manipulation so to enhance the adsorption process. The Gibbs free energy change can be calculated from the Van’t Hoff equation below [31,32]:
Where R is the gas constant and T is temperature in Kelvin (K). Kd is the thermodynamic equilibrium constant (dimensionless).
The Gibbs free energy change is defined as:
Combining Equation (14) and Equation (15), the Van’t Hoff equation can be rewritten as:
The thermodynamic equilibrium constant, Kd, can be expressed as below:
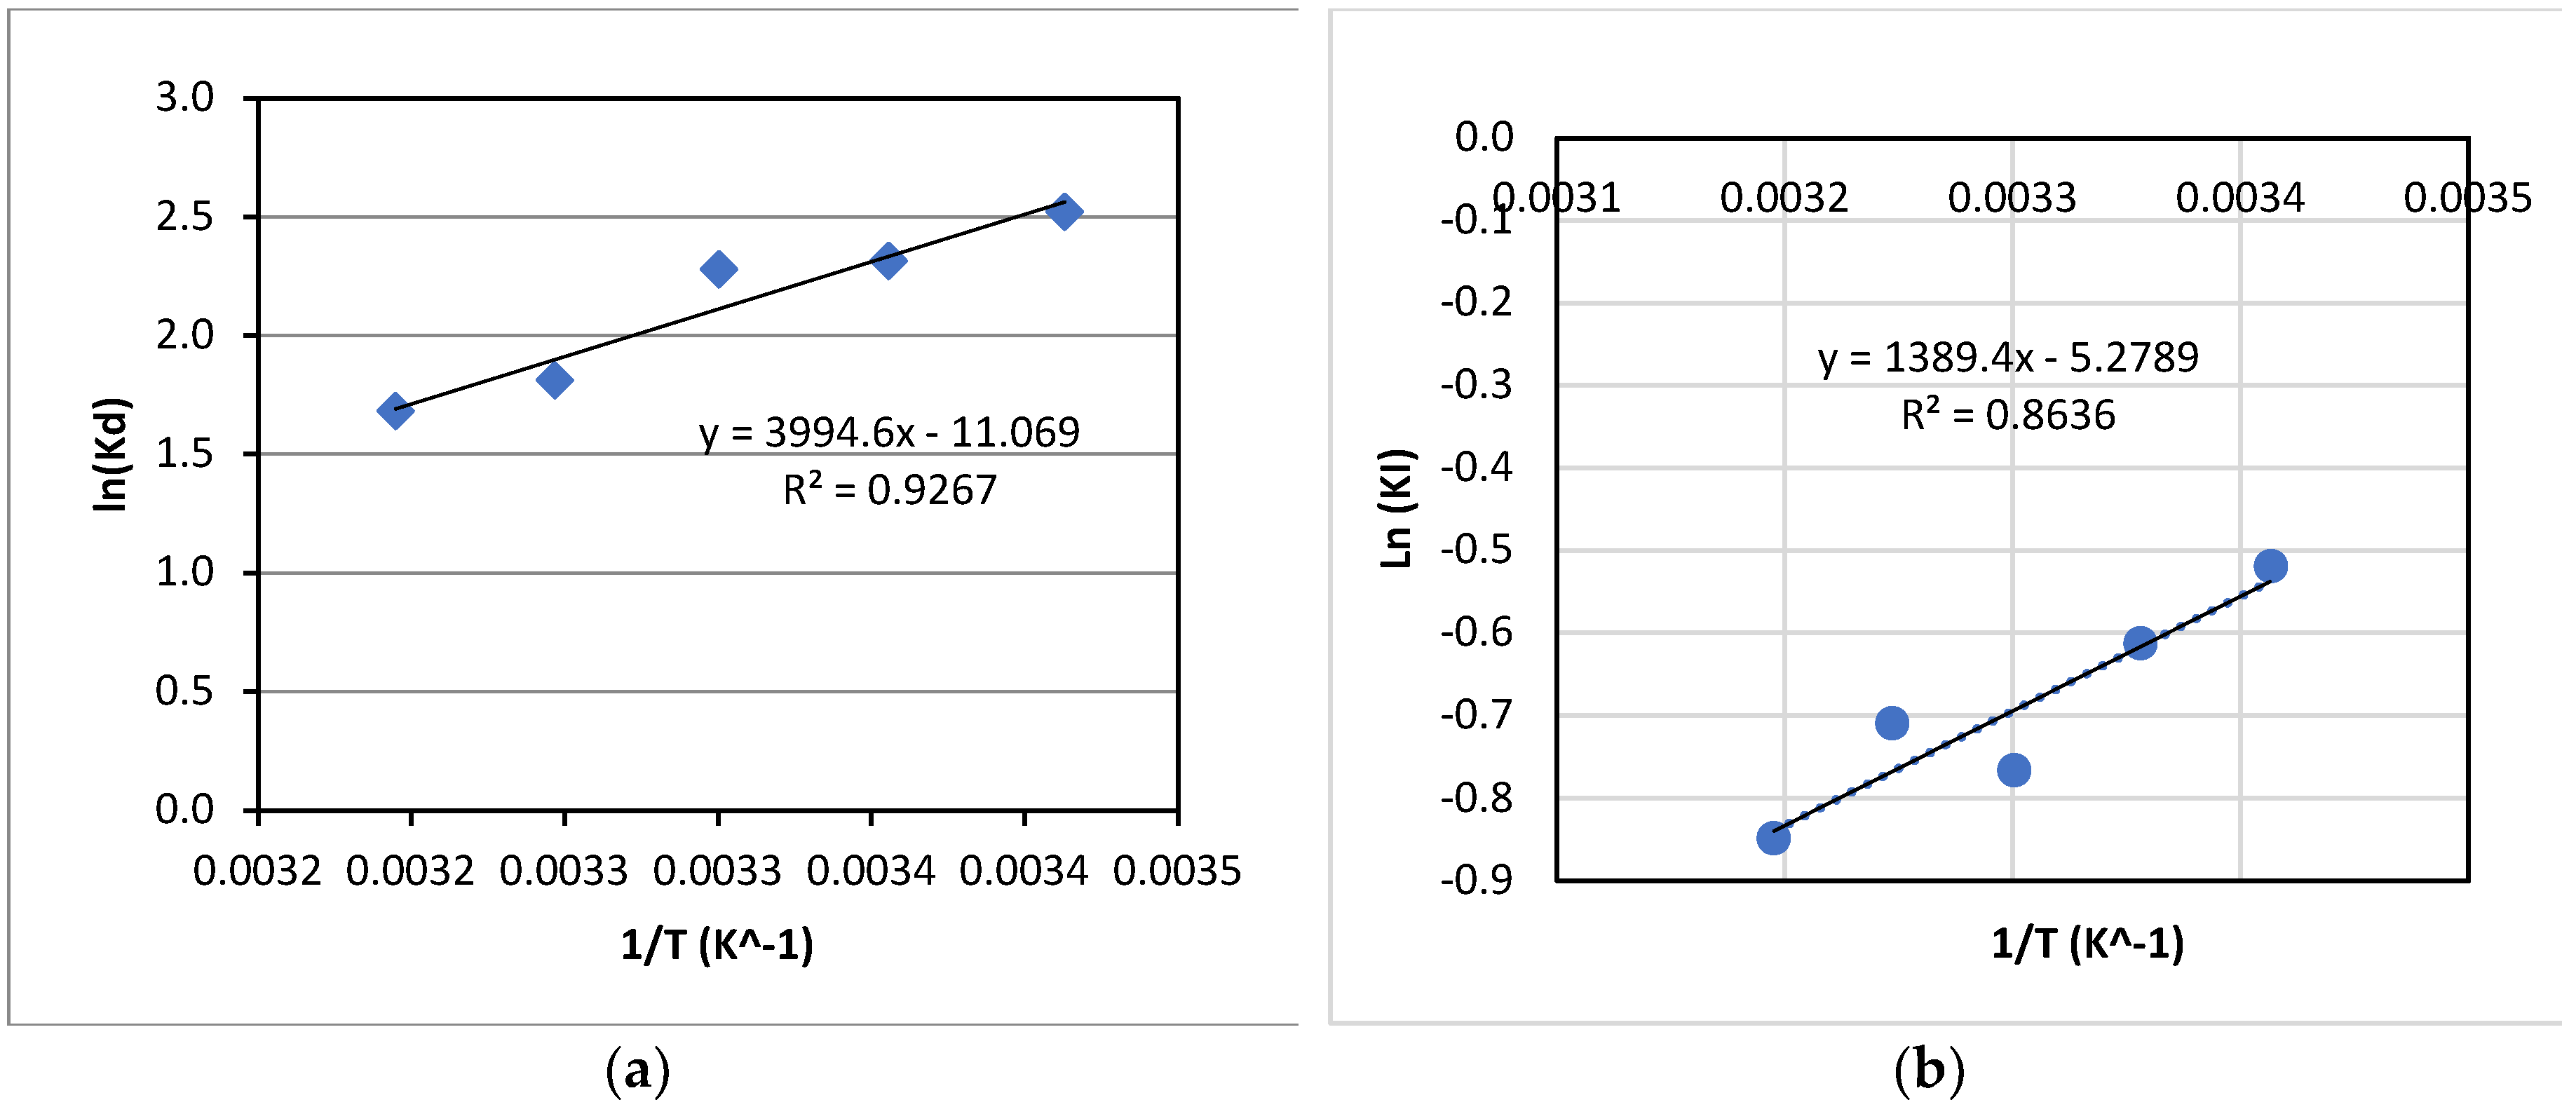
The values of Kd were calculated using experimental data at various temperatures. The variation of ln(Kd) with 1/T is presented in Figure 11(a). From Figure 11(a), ΔGo, ΔHo and ΔSo were determined and presented in Table 2 along with the isotherm parameters.
In addition, the activation energy for the kinetics of La(III) adsorption with Dowex 50W-X8 was also estimated using the Arrhenius equation as below:
Where KI is the first-order rate constant of adsorption at a given temperature; A is the pre-exponent constant; E is the activation energy for adsorption, R gas constant and T temperature (K). The values of KI were determined using adsorption data for experiments at varied temperatures from 293 K-313 K; and Ln(KI) was plotted vs. 1/T, as shown in Figure 11(b). The values of E and A of -11.6 kJ/mol and 5.10x10⁻³, respectively, were then obtained.
As can be seen in Table 2, adsorption of La(III) by Dowex 50W-X8 was an exothermic process, as reflected by the negative change of enthalpy. Also, the negative activation energy, estimated from the Arrhenius equation, further supports this finding since the adsorption rate constant decreased with increases in temperature, which is typical for an exothermic process.
In addition, the process could be considered as thermodynamically favourable, i.e., spontaneous, as indicated by the negative Gibbs free energy change over the range of temperature tested. This is in line with the low activation energy obtained from the Arrhenius equation, which was low and negative, indicating a low energy barrier for adsorption to occur.
4. Discussion
4.1. Effect of the Shaker Speed
It was expected that the shaker speed would have some effect on the adsorption rate. For non-porous solid absorbent, the adsorption process usually includes two steps: mass transfer of the adsorbate (La(III) in this case) from the bulk liquid to the surface of adsorbent particles, and adsorption of the adsorbate onto the adsorbent. The mass transfer step could be a limiting step in the overall adsorption process, i.e., limiting the adsorption rate. The shaker speed (RPM), in turn, would have a significant effect on the mass transfer step. Liquid movement in the flask was more turbulent at a higher RPM, which would enhance the mass transfer rate of La(III) from liquid to adsorbent particles, resulting in a higher adsorption rate and the percentage removal of La(III).
At a higher shaker speed, the liquid velocity at the region adjacent to the solid adsorbent surface was higher while the thickness of the concentration boundary layer was lower, resulting in a higher mass transfer coefficient of La(III) from liquid to the solid-liquid interface. In general, the mass transfer coefficient is a function of the particle Reynolds number, i.e., fluid velocity. The mass transfer rate of La(III) from liquid to adsorbent, in turn, is proportional to the mass transfer coefficient and the difference of the La(III) concentration in the bulk liquid and at the liquid-solid interface. For all tests at varied RPM in the present study, the initial La(III) concentration was kept the same for all tests; hence, the mass transfer rate was predominantly determined by the mass transfer coefficient. Consequently, at a higher RPM, a higher mass transfer coefficient would lead to a higher mass transfer rate, and hence, a higher adsorption rate constant, KI, and a higher percentage removal of La(III). This was indeed the case as can be seen in Figure 2 and Table 1.
As shown in Table 1, adsorption of La(III) to Dowex 50W-8X followed the first-order kinetics better than the second-order kinetics, as indicated a much lower % deviation between the experimental equilibrium adsorbed amount and the predicted values from the model of -2.8%, as compared with 40.2% for the second-order model. In addition, Figure 3(a) showed a linear relationship between Ln(KI) and Ln(Re). This trend implies that the rate constant (KI) for the first-order adsorption kinetics of La(III) increased exponentially with the Reynolds number, which is directly proportional to the shaker speed. Moreover, the data indicates that the mass transfer step was indeed the limiting factor on the overall adsorption process at low shaker speeds (50 and 75 RPM), resulting in much lower KI values. The mass transfer was improved significantly at higher speeds of 100-150 RPM, leading to more adsorption and higher adsorption rates, resulting in higher first-order rate constants, KI.
From a linear curve fitting of Ln(KI) vs. Ln(Re) as shown in Figure 3(a), a correlation between the rate constant (KI) and the particle Reynolds number (Re) was obtained and presented in Equation (7). The benefit of the correlation of KI with Re in Equation (7) is that it can be used to estimate the first-order rate constant for a batch La(III) adsorption system at varied RPM, which are not necessary to be the same as those in the present study, as long as it is operated at a Reynolds number within the range of the Reynolds numbers used in the experiments to generate data for this correlation. It is important to note that when comparisons are made among results from various reported literatures, they should be under a similar fluid dynamic condition, i.e., the Reynolds number, which dictates the mass transfer rate of the adsorbate from liquid to solid adsorbent, and hence, affects the adsorption rate. The same RPM may not translate to the same Reynolds number and the fluid dynamic condition if the shaking stroke and the adsorbent particle size are much different. Consequently, the comparisons may not be precise and appropriate.
4.2. Effect of the Amount of Adsorbent
The trend of the La(III) percentage removal with the amount of adsorbent, presented in Figure 4(a), was expected since at a higher amount of adsorbent, more adsorption sites were available for La(III) attachment; hence, more La(III) was adsorbed with increases in the adsorbent amount over the first stage adsorption (3 hours). For the adsorbent amount higher than 3.00 g, the La(III) in the solution became exhausted as the adsorption progressed, resulting in no further improvement in adsorption. It was more evident after 7 hours of adsorption where the amount of adsorbent over the entire range from 1.00-4.00 g didn’t show a very significant effect on the La(III) percentage removal. At the later stage of adsorption, there was much less La(III) remaining in the solution; and hence, the mass transfer rate of La(III) from the solution to the adsorbent surface was much lower. Consequently, the mass transfer became a predominant controlling factor in the adsorption process; this, in turn, rendered an underutilization of available adsorption sites on the adsorbent surface for cases with more adsorbent present. Therefore, no very discerning improvement in the percentage removal with higher amounts of adsorbent was observed after 7 hours of adsorption.
As indicated in Figure 5(e), KI increased with the amount of adsorbent from 1.00-3.00 g even though the percentage removal of La(III) stayed relatively similar at the end of the experiments (Figure 4(a), after 7 hours of adsorption). It is worthy to note that over the first stage of the adsorption process (initial 3 hours), more La(III) was still present in the solution; and hence, more La(III) was adsorbed per unit time, i.e., a higher adsorption rate, in the presence of a higher amount of adsorbent. Therefore, the overall adsorption rate over the entire duration of the experiment (7 hours) was higher, resulting in higher KI values with the increasing amount of adsorbent from 1.00-3.00 g. Nevertheless, KI remained similar for cases with 3.00 g and 4.00 g of adsorbent. This might be due to the fact that the La(III) concentration in the solution dropped quickly at the onset of the adsorption for both cases. The adsorption process thus became under the control of mass transfer from liquid to solid adsorbent, which was slow at a low La(III) concentration. Consequently, whether 3.00 g or 4.00 g of adsorbent was present, the available active sites were abundant, but the adsorption rate was low due to a low mass transfer rate of La(III) towards the adsorbent, negating the advantage of more active sites available with 4.00 g of adsorbent.
As indicated by the data obtained in the present study, the adsorption capacity and the kinetic rate constant were dependent on the amount of adsorbent present. However, non-linear trends of the adsorption capacity and the rate constant, KI, with the amount of adsorbent can be observed in Figure 4(b) and Figure 5(e), respectively. This indicates that, in addition to the amount of adsorbent, the amount La(III) present in the solution, relative to the amount of adsorbent, also affects the adsorption rate and the adsorption capacity since it affects the mass transfer rate of La(III) from the bulk liquid to the solid adsorbent; and this in turn affects the adsorption rate. Therefore, the loading factor (LF) was introduced and used for the generalization of adsorption data in the present study. The loading factor provides a more generalized absorbate loading per unit mass of adsorbent in an adsorption system. In other words, it normalizes the total amount of La(III) available in the solution to the amount of adsorbent present. Therefore, given the same fluid dynamic condition, at the same loading factor regardless of the values of M, C and V, it is expected that the adsorption process behaves in a similar way, in terms of the adsorption capacity and the adsorption rate constant.
It is relevant to note that at a low LF, there is more adsorbent available relative to the amount of adsorbate present in the solution, and vice versa. As indicated by Figure 5(f) and 5(g), at the LF values of about 5 or lower, the kinetic rate constant, KI, was high and only varied slightly with LF. Under this condition of LF, the entire adsorption process was influenced by the mass transfer step since the amount of adsorbent present was high, relative to the available adsorbate, providing abundant adsorption sites. However, at 100 RPM the turbulence in liquid was at a sufficient level to facilitate an adequate mass transfer from liquid to solid adsorbent in various experiments covering this range of LF. In addition, the mass transfer rate would be similar among the experiments at the same RPM. Consequently, the adsorption rate, and hence, the rate constant KI, clustered about the same level among those experiments. On the other hand, at the high end of LF (about 6, 7 onwards), KI decreased with increasing LF. In this case, the overall adsorption process might be controlled by the adsorption step since the number of adsorption sites available, relative to the amount of adsorbate present, was quite low, as compared to the cases with lower LF, resulting in a limited adsorption and hence lower adsorption rate and KI.
4.3. Effect of pH and Temperature on Adsorption
It is relevant to note that under acidic conditions with pH < 5.0, Lanthanum in an aqueous solution is present in the form of positively changed species, La3+ [33], which is still a dominant species in the solution at pH up to 6.0. However, Lanthanum converts to LaOH2+, which is less positive (lower valances) than La3+, at pH larger than 6.0 [1]. Moreover, the adsorbent (Dowex 50W-8X) is a cationic ion-exchange resin with negatively charged sulfonic acid functional groups that attract more strongly to the more positively charged species, La3+. In addition, La3+ is smaller than La(OH)2+; hence, it is more mobile than La(OH)2+ towards the adsorbent since it can diffuse faster in liquid. Therefore, La3+ would be adsorbed more readily than La(OH)2+. This might be the factor causing a significant drop in the percentage removal when pH was increased from 6.0 to 7.0 after 2.5 hours of adsorption, as shown in Figure 6(a). On the other hand, there would be a potential competition for the active sites on the adsorbent surface with more H+ present in a solution at a lower pH. In addition, the zeta potential of the solid absorbent stayed relatively neutral over the whole range of pH tested, as shown in Figure 6(c). This indicates that the zeta potential didn’t play a considerable role in attracting or repulsing La(III) ions, resulting in different adsorption capacity at different pH, but the decrease in La(III) adsorption at pH of 7.0 would rather be due to the speciation of La(III) towards less positive species, La(OH)2+ and La(OH)2+ at this pH [1], and lower La(III) adsorption at pH ≤ 5.0 was mainly due to H+ competition.
Several reported literatures on adsorption of metal ions and REE presented various trends of the effect of pH on adsorption capacity. For example, adsorption of La(III) by Sagassum fluitans was found to increase with pH from 2.0 to 5.0 [34] while an optimal pH at 4.0 was reported for adsorption of other Lanthanides, and lower adsorption at pH = 5.0, using a functionalized mesoporous silica monolith [33]. On the other hand, in an investigation of adsorption of La(III) and Y(III) by Gibbsite (aluminum oxides or hydroxides), the authors reported a steady increase in the adsorption capacity with increases in pH from 4.0-7.0 [22]. Some other study, using functionalized silica particles with PAA (phosphono-acetic acid) and DTPADA (diethylene-triamine-pentaacetic dianhydride) ligands, reported a maximal La(III) removal at pH=7.0 and pH=2.0 for PAA and DTPADA, respectively [35]. An investigation of co-adsorption of La(III), Ce(III) and Nd(III) showed a comparable adsorption capacity of biochar composites over a pH range from 3.0-5.0 while the adsorption capacity was less than 1/3 of that at pH = 2.0 [6]. On the other hand, a study of La(III) adsorption by dual-site polymeric ion-imprinted nanoparticles showed a steady increasing trend of adsorption capacity over a range of pH = 3.0-6.0 [11]. The wide variation in the effect of pH on adsorption, as reported, may be rooted from different adsorbents with different surface chemistry that changes differently with pH.
It is worthy to note that for pH = 2.0-7.0, a significant effect of pH on the La(III) percentage removal was only observed in the early stage of adsorption (2.5 hours) in the present study (Figure 6(a)). As adsorption was allowed to progress to 7 hours, no substantial difference in the percentage La(III) removal was observed over the range of pH used, mostly varying between 80-89% and a maximum of 92% at pH= 6.0. This indicates that pH might had some discerning effect on the adsorbent surface at the onset of the experiment (first 2.5 hours), resulting in a significantly higher La(III) percentage removal of 80% at pH of 6.0, compared with a relatively low removal of around 55% for all other pH levels. However, when the adsorption process was extended to 7 hours, La(III) remaining in the solution for the case at pH = 6.0 became more exhausted, as compared with that for other pH; and hence, the adsorption was predominantly controlled by the mass transfer rate, resulting in a low adsorption rate due to a low concentration difference between the liquid and solid, which is the driving force for mass transfer. On the other hand, for cases at pH from 2.0-5.0 and pH of 7.0, La(III) remaining in the solution was still relatively higher than that for the case with pH=6.0. This facilitated higher mass transfer rates and adsorption rates for those cases at the late stage of adsorption and compensated for lower adsorption rates over the initial stage of adsorption. Therefore, overall, the La(III) percentage removal over 7 hours of the experiment didn’t vary significantly with all pH from 2.0-7.0, except a slightly higher removal at pH = 6.0.
On another note, La(III) adsorption appeared to be insensitive to temperature changes, as indicated by the similar values of the La(III) percentage removal after 7 hours of adsorption at varied temperatures in Figure 7(a), while the first-order kinetic rate constant KI decreased moderately with temperature. Adsorption was found to be faster under a lower temperature condition at the onset of the adsorption process (about 2-3 hours), as indicated by a sharper decrease in La(III) concentration observed. Then, adsorption became much more gradual for all temperatures. Therefore, cumulatively over the duration of 7 hours, a higher rate constant, KI, was obtained at a lower temperature. Likewise, at the later stage of the adsorption process, for a case at a higher temperature, La(III) remained in the solution was relatively higher than that for a case with a lower temperature. As a result, the mass transfer of La(III) from liquid to solid adsorbent was relatively higher for the case at a higher temperature, resulting in a higher adsorption rate. That compensated for the lower adsorption rate over the initial stage. Therefore, overall, the La(III) percentage removal became similar after 7 hours of adsorption at all temperatures tested. Some studies on adsorption of La(III) and other REE reported a positive effect of temperature on adsorption capacity; and the adsorption process was thus endothermic [36,37]. On the other hand, a study of adsorption of La(III) by dual-site polymeric ion-imprinted nanoparticles reported a decreasing trend of the adsorption capacity with temperature from 25-65oC [15]. Moreover, some studies reported that temperature didn’t have any significant effect on adsorption of La(III) and Ce(III) by chitosan-functionalized magnetite-pectin [23] while an investigation of adsorption of La(III) by bamboo charcoal showed a moderate increase in adsorption capacity (15%) as the temperature was increased from 15oC to 25 oC, and no change with further increase to 35 oC [18]. Similar to the effect of pH on the adsorption capacity, temperature may affect the surface characteristics of adsorbent in different ways, depending on the type of adsorbents and their surface chemistry, resulting in a wide variation in the trends of adsorption capacity with temperature among different adsorbents.
4.4. Kinetics and Equilibrium Isotherms of La(III) Adsorption
Kinetic information is useful in the operation of a scaled-up adsorption system since it allows for the estimation of the required adsorption time to achieve a certain adsorbed amount of an absorbate. As can be seen in Figure 8, the data fitted better to the first order kinetics with the coefficient of determination, R2, ranging from 0.973-0.986, which is reasonably good. The first-order kinetic rate constant, KI remained relatively constant for all initial concentrations with a deviation from the averaged value of about 5.4%. This indicates that the adsorption kinetics of La(III) with Dowex 50W-X8 is independent of the initial concentration of La(III) in the range from 32-85 ppm. In other words, it can be deduced that the whole adsorption process, under the operational conditions used in the experiments, was predominantly controlled by the adsorption step at the adsorbent surface, which would be affected by factors that could alter the adsorbent surface characteristics such as temperature, pH and other chemical species, but not the concentration of La(III) in the bulk liquid. It is well understood that when the initial adsorbate concentration changes, the concentration remaining in the solution at equilibrium changes as well. However, the adsorption kinetics didn’t change significantly with the variation of the initial concentration. This could be because the mass transfer from the liquid to the solid adsorbent was not a dominant factor. The mass transfer rate from liquid to solid was sufficient for adsorption, regardless of the La(III) concentration while the adsorption step determined the overall adsorption rate, resulting in similar KI values for all La(III) initial concentrations over the range used in the present study.
In addition, adsorption isotherm is useful in the design of an adsorption system since it allows an estimation of the amount of adsorbent needed to remove/recover a certain amount of adsorbate/REE in the solution. Therefore, adsorption equilibrium data obtained with different initial La(III) concentrations were applied to the two typical equilibrium isotherms, the Freundlich and the Langmuir models. As presented in Figure 9, the adsorbed amount increased quickly over the initial stage of about 3 hours and became much more gradual until equilibrium was reached at about 7-8 hours. A much lower adsorption rate at the later stage of adsorption might be due to a significantly lower concentration of La(III) remaining in the solution at that time; and hence, the mass transfer of La(III) from the liquid to the solid adsorbent became much smaller, which limited the adsorption rate.
5. Conclusion
In this study, adsorption of La(III) by different cationic exchange resins, namely Dowex 50W-X8, AmberChrom 50WX4, Amberlyst 15 hydrogen form, and AmberChrom 50WX2 was evaluated. Dowex 50W-X8, was found to be more suitable for adsorption of La (III), and hence, it was used for further investigation on the effect of the shaker speed, adsorbent dosage, pH, and temperature on the adsorption capacity of La(III).
It was found that adsorption of La(III) increased with the shaker speed from 50-150 RPM, as expected. The percentage removal of La(III) approached a maximum (close to 100%) at the shaker speed of 125 RPM and leveled off with a further increase to 150 RPM. Likewise, the rate constant of the first-order kinetics of La(III) adsorption increased about 3 times as the shaker RPM was increased from 50 to 150 RPM. It is worthy to note that in an investigation on the adsorption capacity of an adsorbent, specifically a new one, it needs to be ensured that the adsorption process is not limited by the mass transfer due to a low shaking speed so that the full adsorption capacity of the adsorbent can be realized in the experiment. This is to warrant an accurate determination of the adsorbent’s adsorption capacity; and hence, a meaningful comparison with other adsorbents can be obtained. In the same token, this would help to achieve a successful scale-up to a larger adsorption system, using the data generated in a laboratory.
The La(III) percentage removal was also found to increase with the amount of adsorbent. After 3 hours of adsorption, the percentage removal increased about 30% when the amount of adsorbent was increased from 1.00 g to 3.00 g, and no further adsorption enhancement was observed with further increase in the adsorbent amount from 3.00 g to 4.00 g. However, for an extended adsorption duration to 7 hours, no significant difference in the percentage removal was observed among the runs with all adsorbent dosages used. Nevertheless, the adsorption capacity per unit mass of adsorbent decreased with increases in the amount of adsorbent. In addition, the rate constant of the first-order adsorption kinetics (KI) increased slightly as the amount of adsorbent was increased from 1.00 g to 2.00 g. However, a significant increase in KI was observed as the amount of adsorbent was further increased from 2.00 g to 3.00 g; and it leveled off with further increase to 4.00 g.
It was noted that the effect of the amount of adsorbent on the adsorption capacity was interrelated to the amount of the adsorbate available (concentration and solution volume). Therefore, in scaling up to a larger system, the loading factor (LF = C.V/M) could be of help in combining all three factors together, namely the adsorbate concentration and volume, and the adsorbent amount, such that the data from the laboratory could be used for estimation of the adsorption performance of a larger system operated under the same loading factor.
Similarly, the solution pH was observed to have some effect on La(III) adsorption over the first stage of the adsorption process (about 2.5 hours). The highest La(III) percentage removal of about 80% was obtained at pH = 6.0. As the solution pH was increased from 2.0 to 5.0, the percentage removal only varied slightly around 55%. A further increase in the pH from 6.0 to 7.0 caused a decrease in the percentage removal to about 52%. Again, for a longer adsorption time up to 7 hours, generally there was no discerning difference in the percentage removal for all solution pH, except a slightly more adsorption at pH = 6.0 (92%) and a lower adsorption of about 80% at pH = 5.0. Likewise, the adsorption capacity of La(III) by Dowex 50W-X8 after 7 hours of adsorption didn’t vary significantly with temperature from 20-40oC. However, the first-order rate constant KI decreased moderately with temperature.
Finally, adsorption of La(III) by Dowex 50-X8 followed the Freundlich isotherm model better than the Langmuir model, indicating a multilayer-adsorption of La(III) onto this type of adsorbent. In addition, for different adsorbent amounts from 1.00-4.00 g and La(III) initial concentrations from 20-100 ppm, adsorption data fitted to the first-order kinetic model better than the second-order kinetic model. Moreover, the enthalpy of adsorption was determined to be -33.2 KJ/mol, indicating that the adsorption process was exothermic. Also, the adsorption process was thermodynamically favourable, as indicated by the negative change in the Gibbs free energy in the order of -6.3 KJ/mol to -4.4 KJ/mol over a temperature range from 293K-313K.
Author Contributions
Conceptualization, H.D. (Huu Doan) and T.DV (Trong Dang-Vu); Methodology: H.D. and M.C. (Michael Chan); Formal analysis: H.D. and M.C.; Investigation: M.C. and H.D.; Data curation: M.C. and H.D.; Writing-Original draft preparation: H.D.; Writing-Review & Editing: M.C., H.D. and T.DV.
Funding
This research was funded by the Natural Science and Engineering Research Council of Canada (NSERC) grant number RGPIN-2021-03054.
Data Availability Statement
The data presented in this manuscript are available on request from the corresponding author due to the reason that this work is part of Micheal Chan’s on-going graduate work that will be used and published in his thesis.
Acknowledgments
The authors highly appreciate the financial support from the Natural Science and Engineering Research Council of Canada (NSERC) to the project. The technical and administrative support from the Department of Chemical Engineering, Toronto Metropolitan University is also greatly appreciated. In addition, the authors express their sincere gratitude to the support of Dr. A. Abdelrasoul, Department of Chemical and Biological Engineering, University of Saskatchewan, and the Canadian Light Source (CLS, Saskatoon) for assistance in X-ray imaging of the resins. Also, the technical support from SNF is highly appreciated.
Conflicts of Interest
The authors declare no conflicts of interest.
References
- Iftekhar, S.; Ramasamy, D.L.; Srivastava, V.; Asif, M.B.; Sillanpää, M. Understanding the factors affecting the adsorption of Lanthanum using different adsorbents: A critical review. Chemosphere 2018, 204, 413–430. [Google Scholar] [CrossRef] [PubMed]
- Pramanik, B.K.; Nghiem, L.D.; Hai, F.I. Extraction of strategically important elements from brines: Constraints and opportunities. Water Research 2020, 168, 115149. [Google Scholar] [CrossRef] [PubMed]
- Gschneidner Jr., K. A.; Pecharsky, V.K. Rare-Earth Element, Encyclopaedia Britannica, January 20, 2024. Available online: https://www.britannanica.comphttps://www.britannica.com/science/rare-earth-element (accessed on 29 January 2024).
- King, M.H.; (2022). REE – Rare Earth Elements and their Uses. Available online: https://geology.com/articles/rare-earth-elements/ (accessed on 29 January 2024).
- Balaram, V. Rare earth elements: A review of applications, occurrence, exploration, analysis, recycling, and environment impact. Geoscience Frontiers 2019, 10, 1285–1303. [Google Scholar] [CrossRef]
- Kołodyńska, D.; Bąk, J.; Majdańska, M.; Fila, D. Sorption of lanthanide ions on biochar composites. J. Rare Earths 2018, 36(11), 1212–1220. [Google Scholar] [CrossRef]
- Baldé, C.P.; Forti, V.; Gray, V.; Kuehr, R.; Stegmann, P. The Global E-waste Monitor – 2017, United Nations University (UNU), International Telecommunication Union (ITU) & International Solid Waste Association (ISWA), Bonn/Geneva/Vienna, 2017; pp. 2–5. ISBN Electronic Version: 978-92-808-9054-9.
- Zhang, S.; Huang, X.; Wang, D. Review on comprehensive recovery of valuable metals from spent electrode materials of nickel-hydrogen batteries. Rare Met. Mater. Eng. 2015, 44, 73–78. [Google Scholar] [CrossRef]
- Mohebbi, A.; Abolghasemi Mahani, A.; Izadi, A. Ion exchange resin technology in recovery of precious and noble metals. In Applications of Ion Exchange Materials in Chemical and Food Industries, Inamuddin; Rangreez, T.A.; Asiri, A.M., editors. Springer International Publishing, New York, NY, USA, 2019; pp. 193–258.
- Khawassek, Y.M.; Eliwa, A.A.; Haggag, E.S.A.; Omar, S.A.; Abdel-Wahab, S.M. Adsorption of rare earth elements by strong acid cation exchange resin thermodynamics, characteristics and kinetics. SN Applied Sciences 2019, 1, 51. [Google Scholar] [CrossRef]
- Royer-Lavallee, A.; Neculita, C.M.; Coudert, L. Removal and potential recovery of rare earth elements from mine water. J. Industrial and Engineering Chemistry 2020, 89, 47–57. [Google Scholar] [CrossRef]
- Mwewa, B.; Tadie, M.; Ndlovu, S.; Simate, G.S.; Matinde, E. Recovery of rare earth elements from acid mine drainage: A review of extraction methods. J. Environmental Chemical Engineering 2022, 10, 101104. [Google Scholar] [CrossRef]
- Zhao, Q.; Wang, Y.; Xu, Z.; Yu, Z. The potential use of straw-derived biochar as the adsorbent for La(iii) and Nd(iii) removal in aqueous solutions. Environmental Science and Pollution Research 2021, 28(34), 47024–47034. [Google Scholar] [CrossRef] [PubMed]
- Wang, J.; Guo, X. Adsorption kinetic models: Physical meanings, applications, and solving methods. J. Haz. Mat. 2020, 390, 122156. [Google Scholar] [CrossRef] [PubMed]
- Zhang, Y.; Liu, D.; Guo, W.; Ding, Y. Enhanced selective adsorption of Lanthanum (III) by dual-site polymeric ion-imprinted nanoparticles from aqueous media. ACS Applied Polymer Materials 2023, 5, 3315–3324. [Google Scholar] [CrossRef]
- Botelho Junior, A. B.; Pinheiro, É. F.; Espinosa, D. C.; Tenório, J. A.; Baltazar, M. D.P.G. (2022). Adsorption of lanthanum and cerium on chelating ion exchange resins: Kinetic and thermodynamic studies. Separation Science and Technology. [CrossRef]
- Haldorai, Y.; Rengaraj, A.; Ryu, T.; Shin, J.; Huh, Y. S.; Han, Y.-K. Response surface methodology for the optimization of lanthanum removal from an aqueous solution using a Fe3O4/chitosan nanocomposite. Materials Science and Engineering: B 2015, 195, 20–29. [Google Scholar] [CrossRef]
- Chen, Q. Study on the adsorption of Lanthanum (III) from aqueous solution by Bamboo Charcoal. J. Rare Earths 2010, 28, 125–131. [Google Scholar] [CrossRef]
- Iannicelli-Zubiani, E.M.; Stampino, P.G.; Cristiani, C.; Dotelli, G. Enhanced lanthanum adsorption by amine modified activated carbon. Chem. Eng. J. 2018, 314, 75–82. [Google Scholar] [CrossRef]
- Li, F.; Yang, Z.; Weng, H.; Chen, G.; Lin, M.; Zhao, C. High efficient separation of U(VI) and Th(iV) from rare earth elements in strong acidic solution by selective sorption on phenanthroline diamide functionalized graphene oxide. Chem. Eng. J. 2018, 332, 340–350. [Google Scholar] [CrossRef]
- Zhao, F.; Repo, E.; Meng, Y.; Wang, X.; Yin, D.; Sillanpää, M. An EDTA-β-cyclodextrin material for the adsorption of rare earth elements and its applications in preconcentration of rare earth elements in seawater. J. Colloid Interface Sci. 2016, 465, 215–224. [Google Scholar] [CrossRef]
- Zhou, Z.; Wan, Q.; Yu, W.; Nie, X.; Yang, S.; Yang, S.; Qin, Z. Adsorption behaviors of Lanthanum (III) and Yttrium (III) ions on Gibbsite. Minerals 2023, 13, 1530. [Google Scholar] [CrossRef]
- Yacouba, A.R.C.; Oral, A.E.; Sert, S.; Kaptanoglu, I.G. Removal of lanthanum and cerium from aqueous solution using chitosan-functionalized magnetite-pectin. Discover Water 2024, 4, 1. [Google Scholar] [CrossRef]
- Page, M.J.; Soldenhoff, K.; Ogden, M.D. Comparative study of the application of chelating resins for rare earth recovery. Hydrometallurgy 2017, 169, 275–281. [Google Scholar] [CrossRef]
- Lagergren, S. About the Theory of So-Called Adsorption of Soluble Substances. Kungliga Svenska Vetenskapsakademiens Handlingar 1898, 24, 1–39. [Google Scholar]
- Ho, Y.S.; McKay, G. Pseudo-second order model for sorption processes. Process Biochem. 1999, 34, 451–465. [Google Scholar] [CrossRef]
- Marcinkowsky, A.E.; Phillips, H.O. Diffusion Studies. PartIII. Tracer Diffusion Coefficients of Lanthanum(III) in Concentrated Solutions of HCl and HClO4 at 25oC. J. Chem. Soc. [CrossRef]
- Treybal, R.E. Mass Transfer Operations, 3rd. ed.; McGraw-Hill Book Company: New York, NY, USA, 1980; p. 75. [Google Scholar]
- Langmuir, I. The adsorption of gas on plane surfaces of glass, mica and platinum. J. Am. Chem. Soc. 1918, 40, 1361–1403. [Google Scholar] [CrossRef]
- Freundlich, H. Over the adsorption in solution. J. Phys. Chem. 1906, 57, 1100–1107. [Google Scholar]
- Lima, E.C.; Hosseini-Bandegharaei, A.; Moreno-Pirajan, J.C.; Anastopoulos, I. A critical review of the estimation of the thermodynamic parameters on adsorption equilibria. Wrong use of equilibrium constant in the Van’t Hoof equation for calculation of thermodynamic parameters of adsorption. J. Molecular Liquids 2019, 273, 424–425. [Google Scholar] [CrossRef]
- Shahzad Baig, K.; Doan, H.D.; Wu, J. (2009). Multicomponent isotherms for biosorption of Ni2+ and Zn2+. Desalination 2009, 249, 429–439. [Google Scholar] [CrossRef]
- Rabiul Awual, Md.; Kobayashi, T.; Shiwaku, H.; Miyazaki, Y.; Motokawa, R.; Suzuki, S.; Okamato, Y.; Yaita, T. Evaluation of Lanthanide sorption and their coordination mechanism by EXAFS measurement using novel hybrid adsorbent. Chem. Eng. J. 2013, 225, 558–566. [Google Scholar] [CrossRef]
- Palmieri, M.C.; Volesky, B.; Garcia Jr., O. Biosorption of Lanthanum using Sargassum fluitans in in batch system. Hydrometallurgy 2002, 67, 31–36. [Google Scholar] [CrossRef]
- Callura, J.C.; Perkins, K.M; Noack, C.W.; Washburn, N.R.; Dzombak, D.A.; Karamalidis, A.K. Selective adsorption of rare earth elements onto functionalized silica particles. Green Chem. 2018, 20, 1515–1526. [Google Scholar] [CrossRef]
- Iftekhar, S.; Srivastava, V.; Sillanpää, M. Enrichment of lanthanides in aqueous system by cellulose based silica nanocomposite. Chem. Eng. J. 2017, 320, 1151–1159. [Google Scholar] [CrossRef]
- Rahman, M.M.; Khan, S.B.; Marwani, H.M.; Asiri, A.M. SnO2-TiO2 nanocomposites as new adsorbent for efficient removal of La(III) ions from aqueous solutions. J. Taiwan Inst. Chem. Eng. 2014, 45, 1964–1974. [Google Scholar] [CrossRef]
Figure 1.
Adsorption of La(III) by various adsorbents: (a) Percentage removal after 7 hours of adsorption: 1. Dowex 50W-X8, 2. Amberchrom50WX4, 3. Amberlyst 15, 4. Amberchrom 50WX2; (b) Amount adsorbed vs. time (pH = 5.5, T = 25.0oC). X-ray images of resins: (c) Dowex 50W-X8 particle, (d) zoomed-in image of a Dowex-8X particle’ surface; (e) Amberchrom 50WX4 particles, (f) zoomed-in image of Amberchrom 50WX4; (g) Amberlyst particle, (h) zoomed-in image of Amberlyst; (i) Amberchrom 50WX2 particle, (j) zoomed-in image of Amberchrom 50WX2; (k) Majority particle sizes of the adsorbents, (l) Particle size distribution of Dowex 50W-X8; (m) SEM image of fresh Dowex 50W-X8 and (n) EDS spectrum of the resin; (o) SEM image of Dowex 50W-X8 after 7 hours of adsorption and (p) EDS spectrum of the resin.
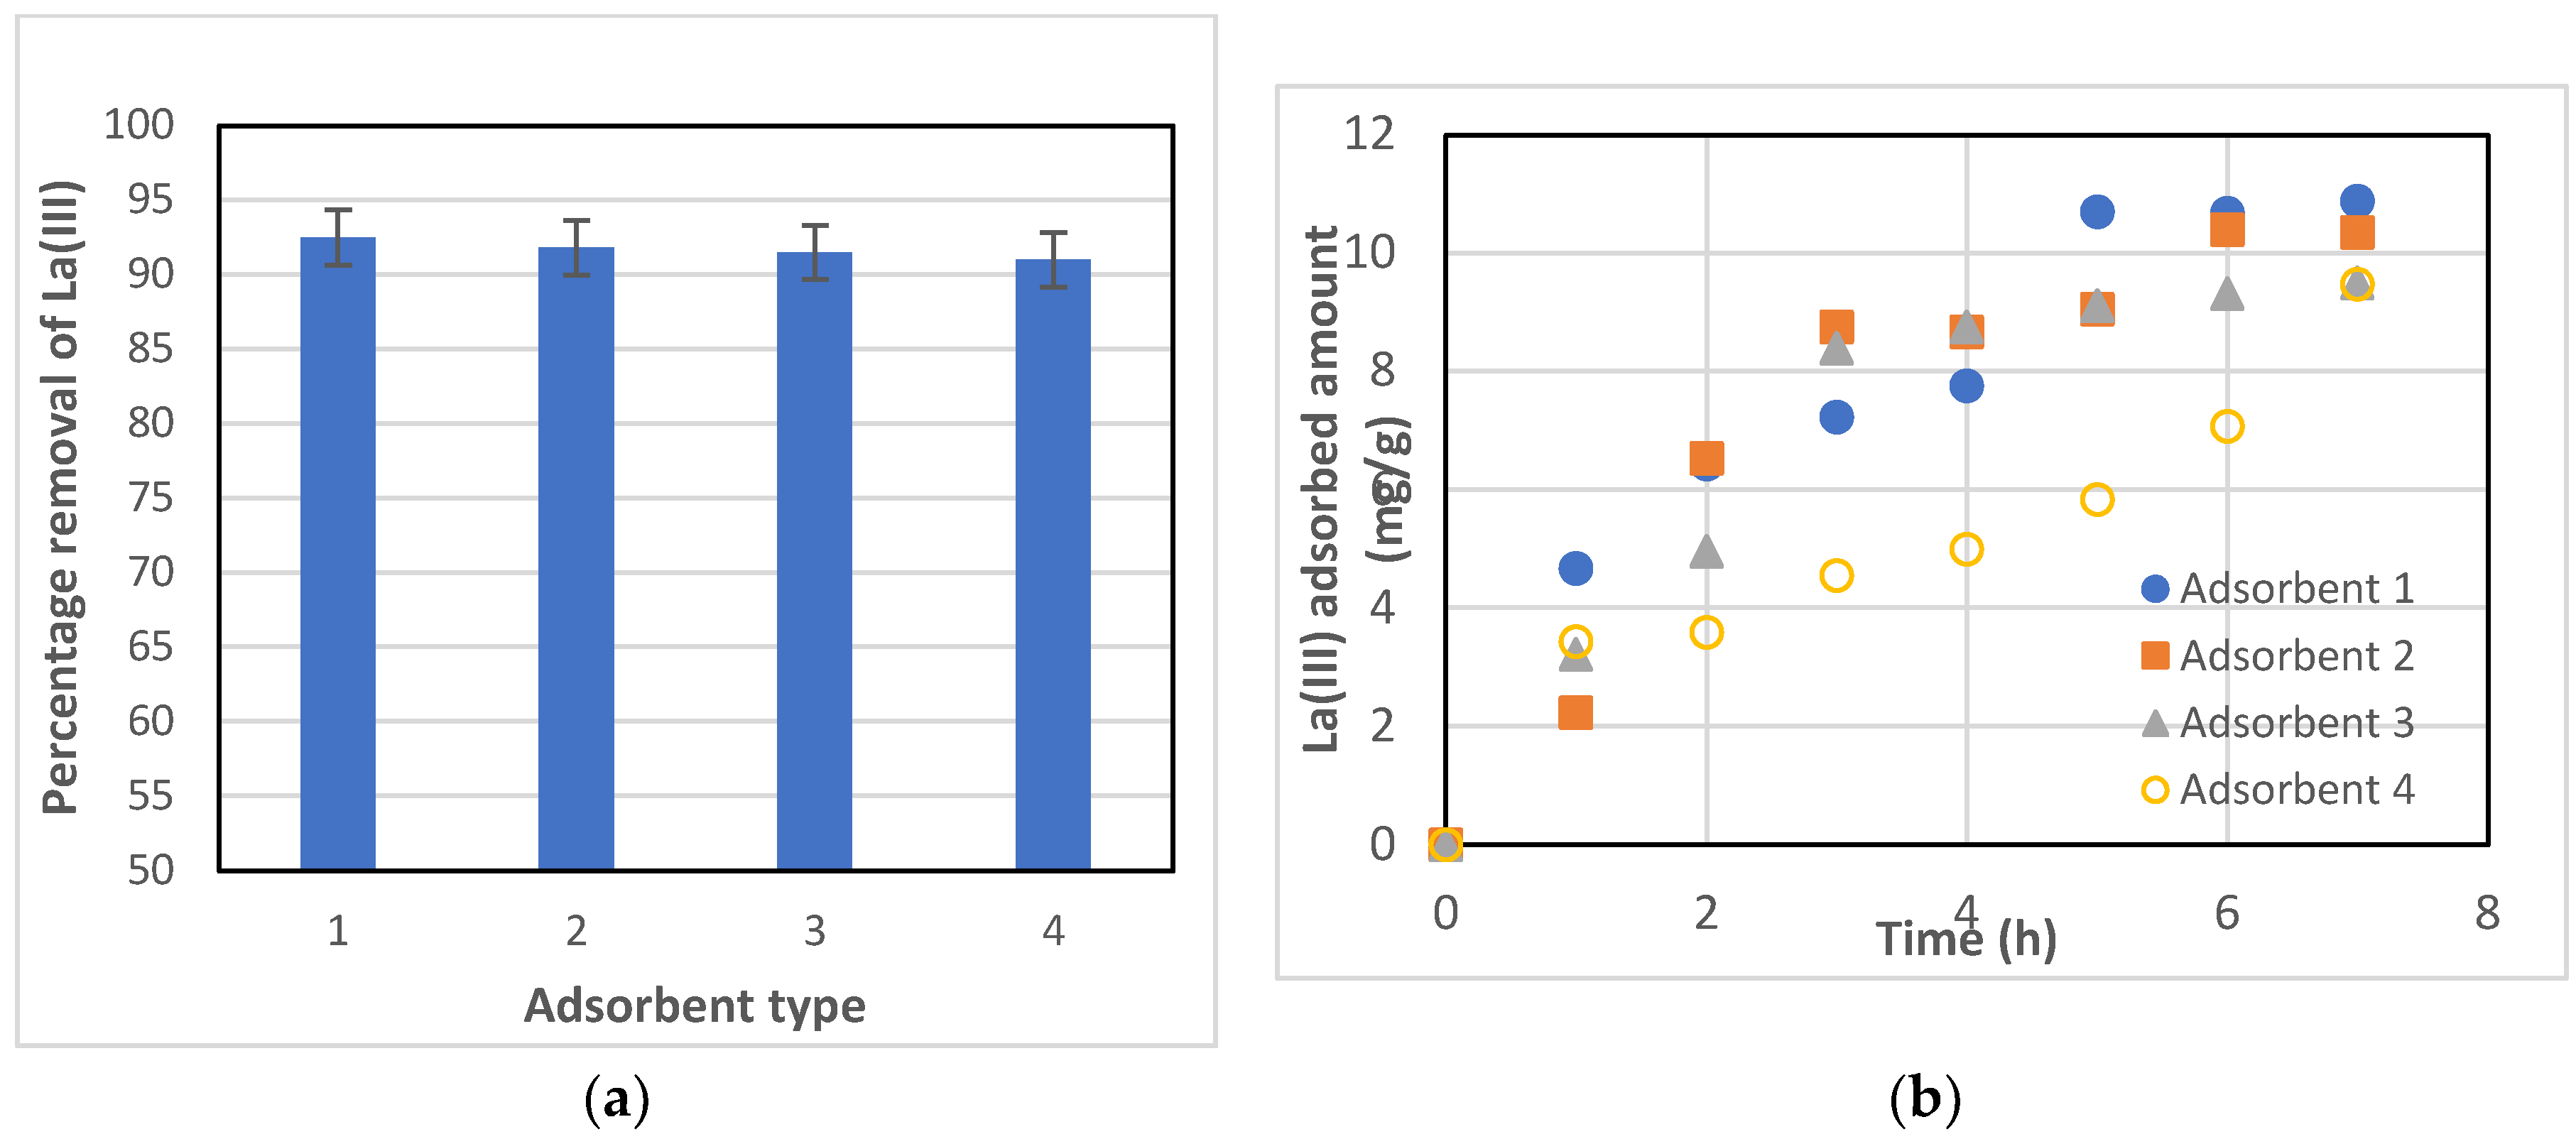
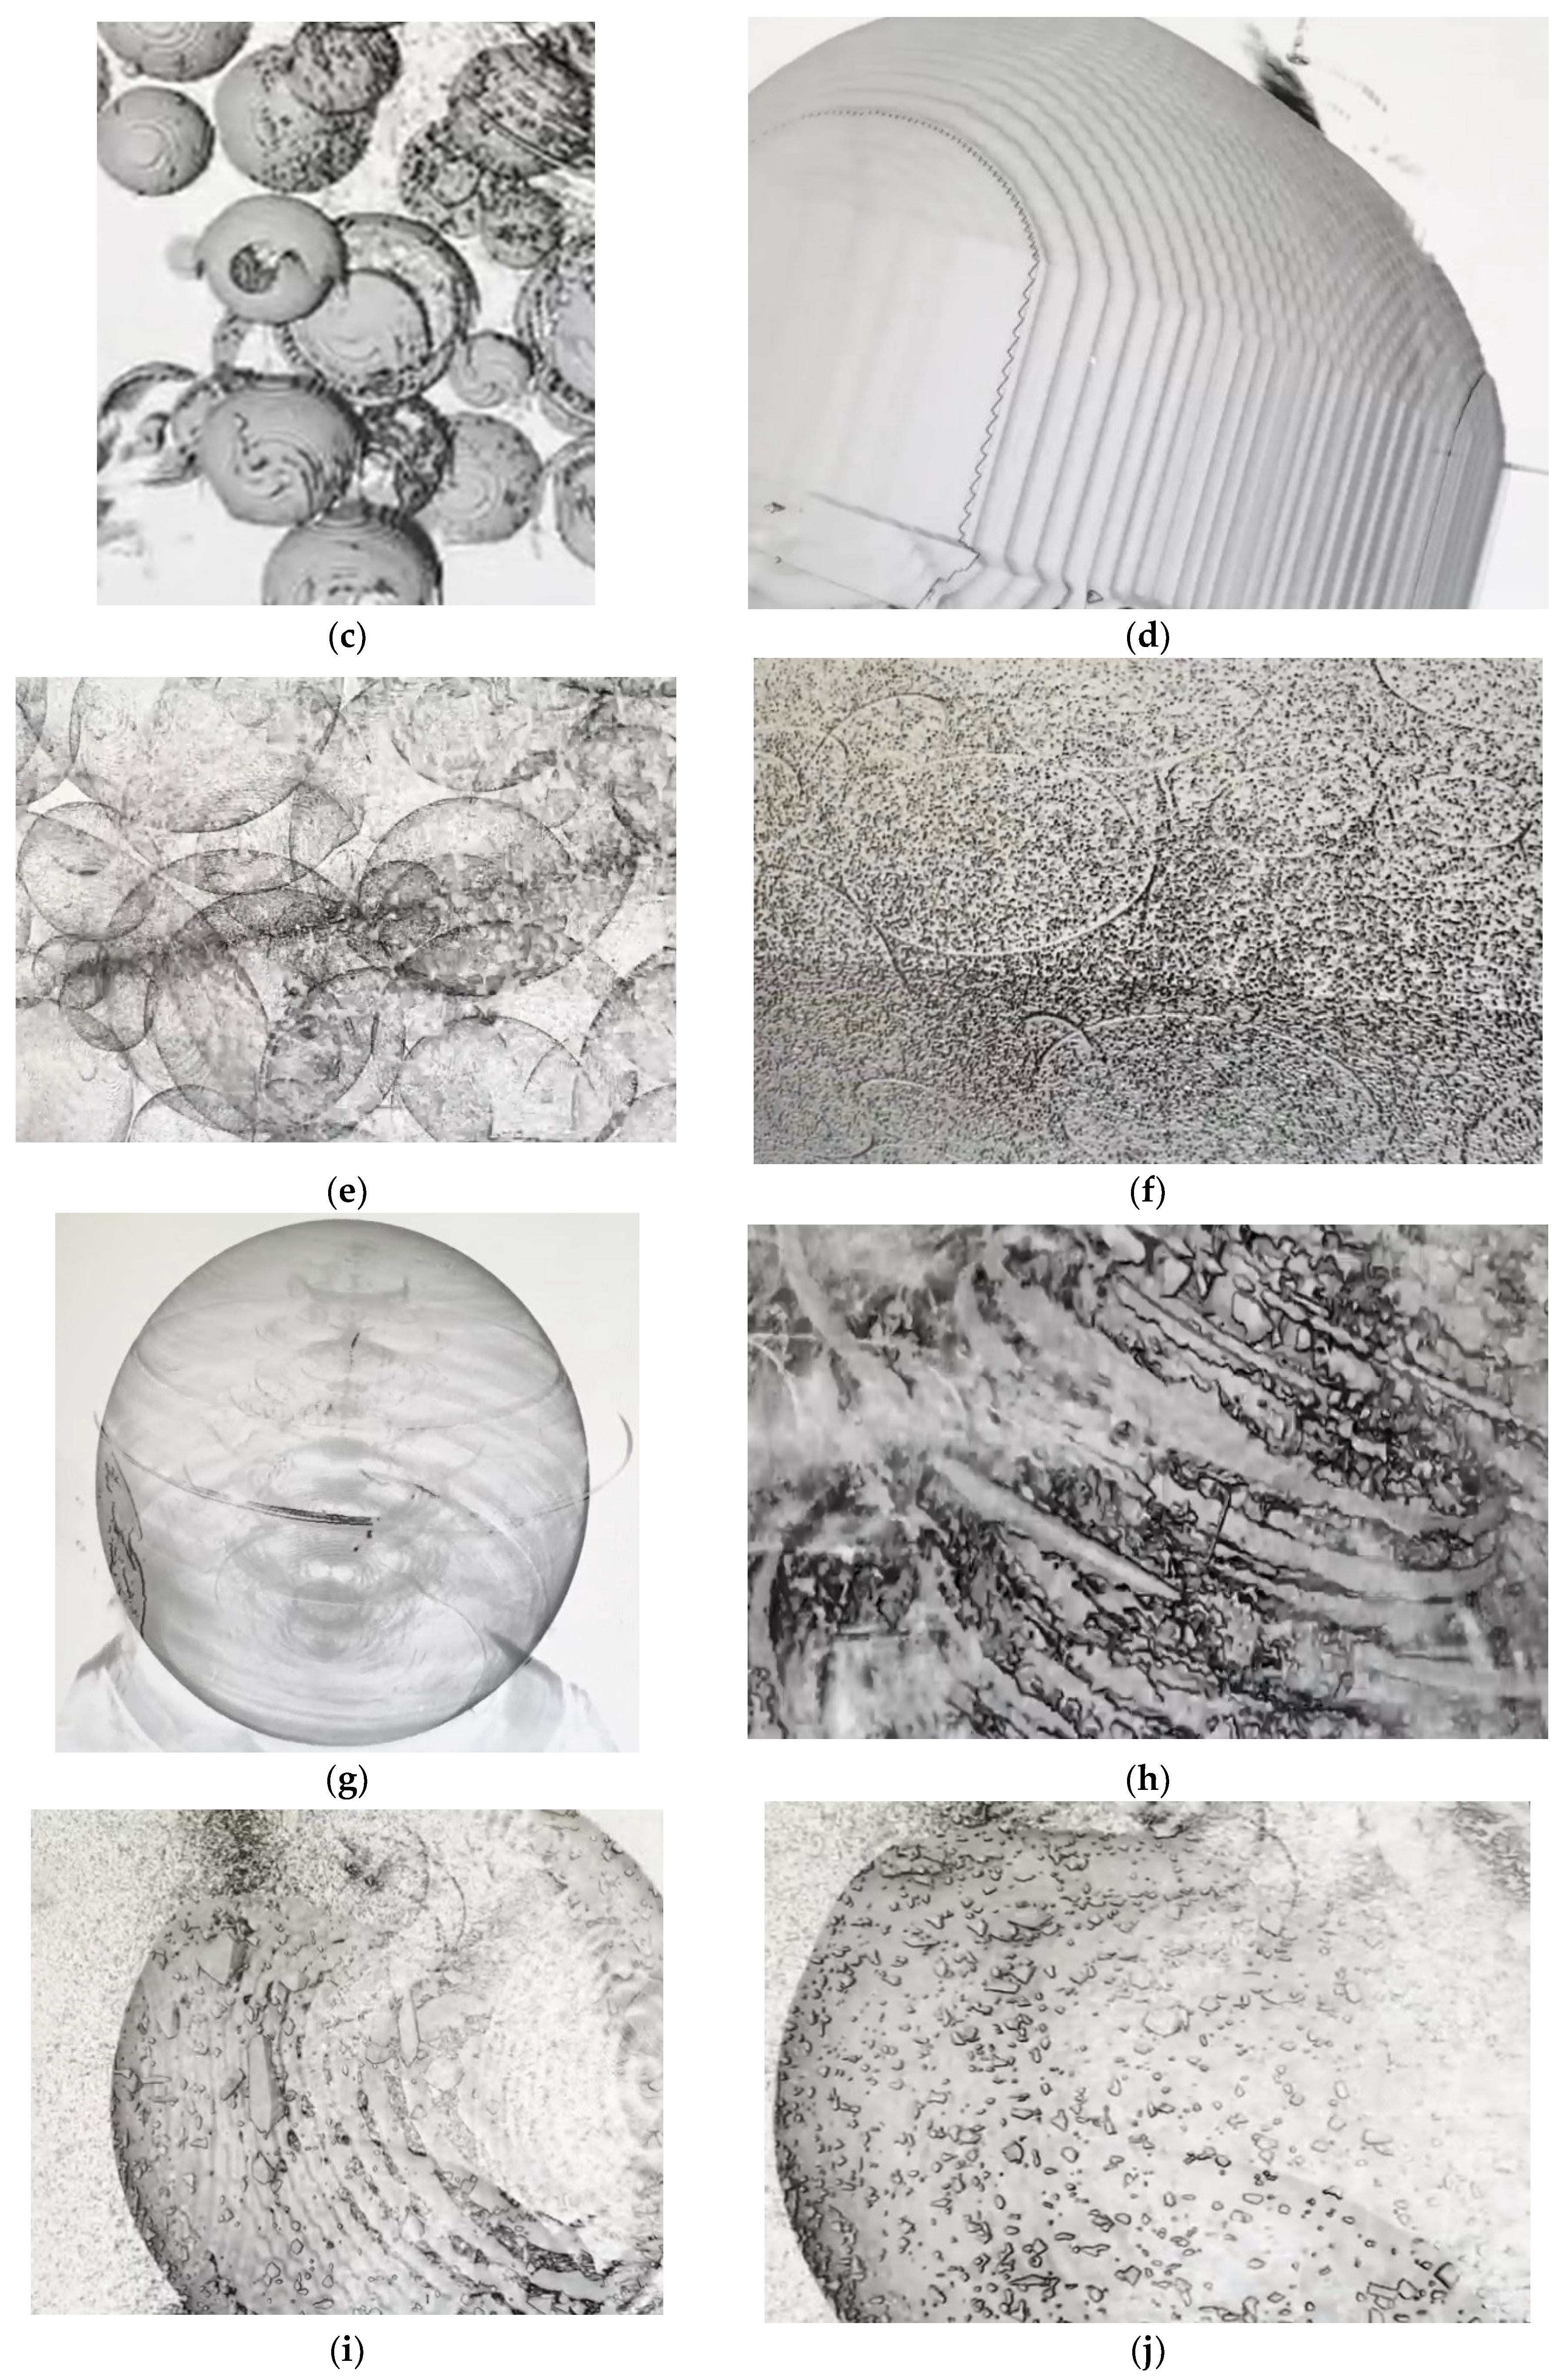
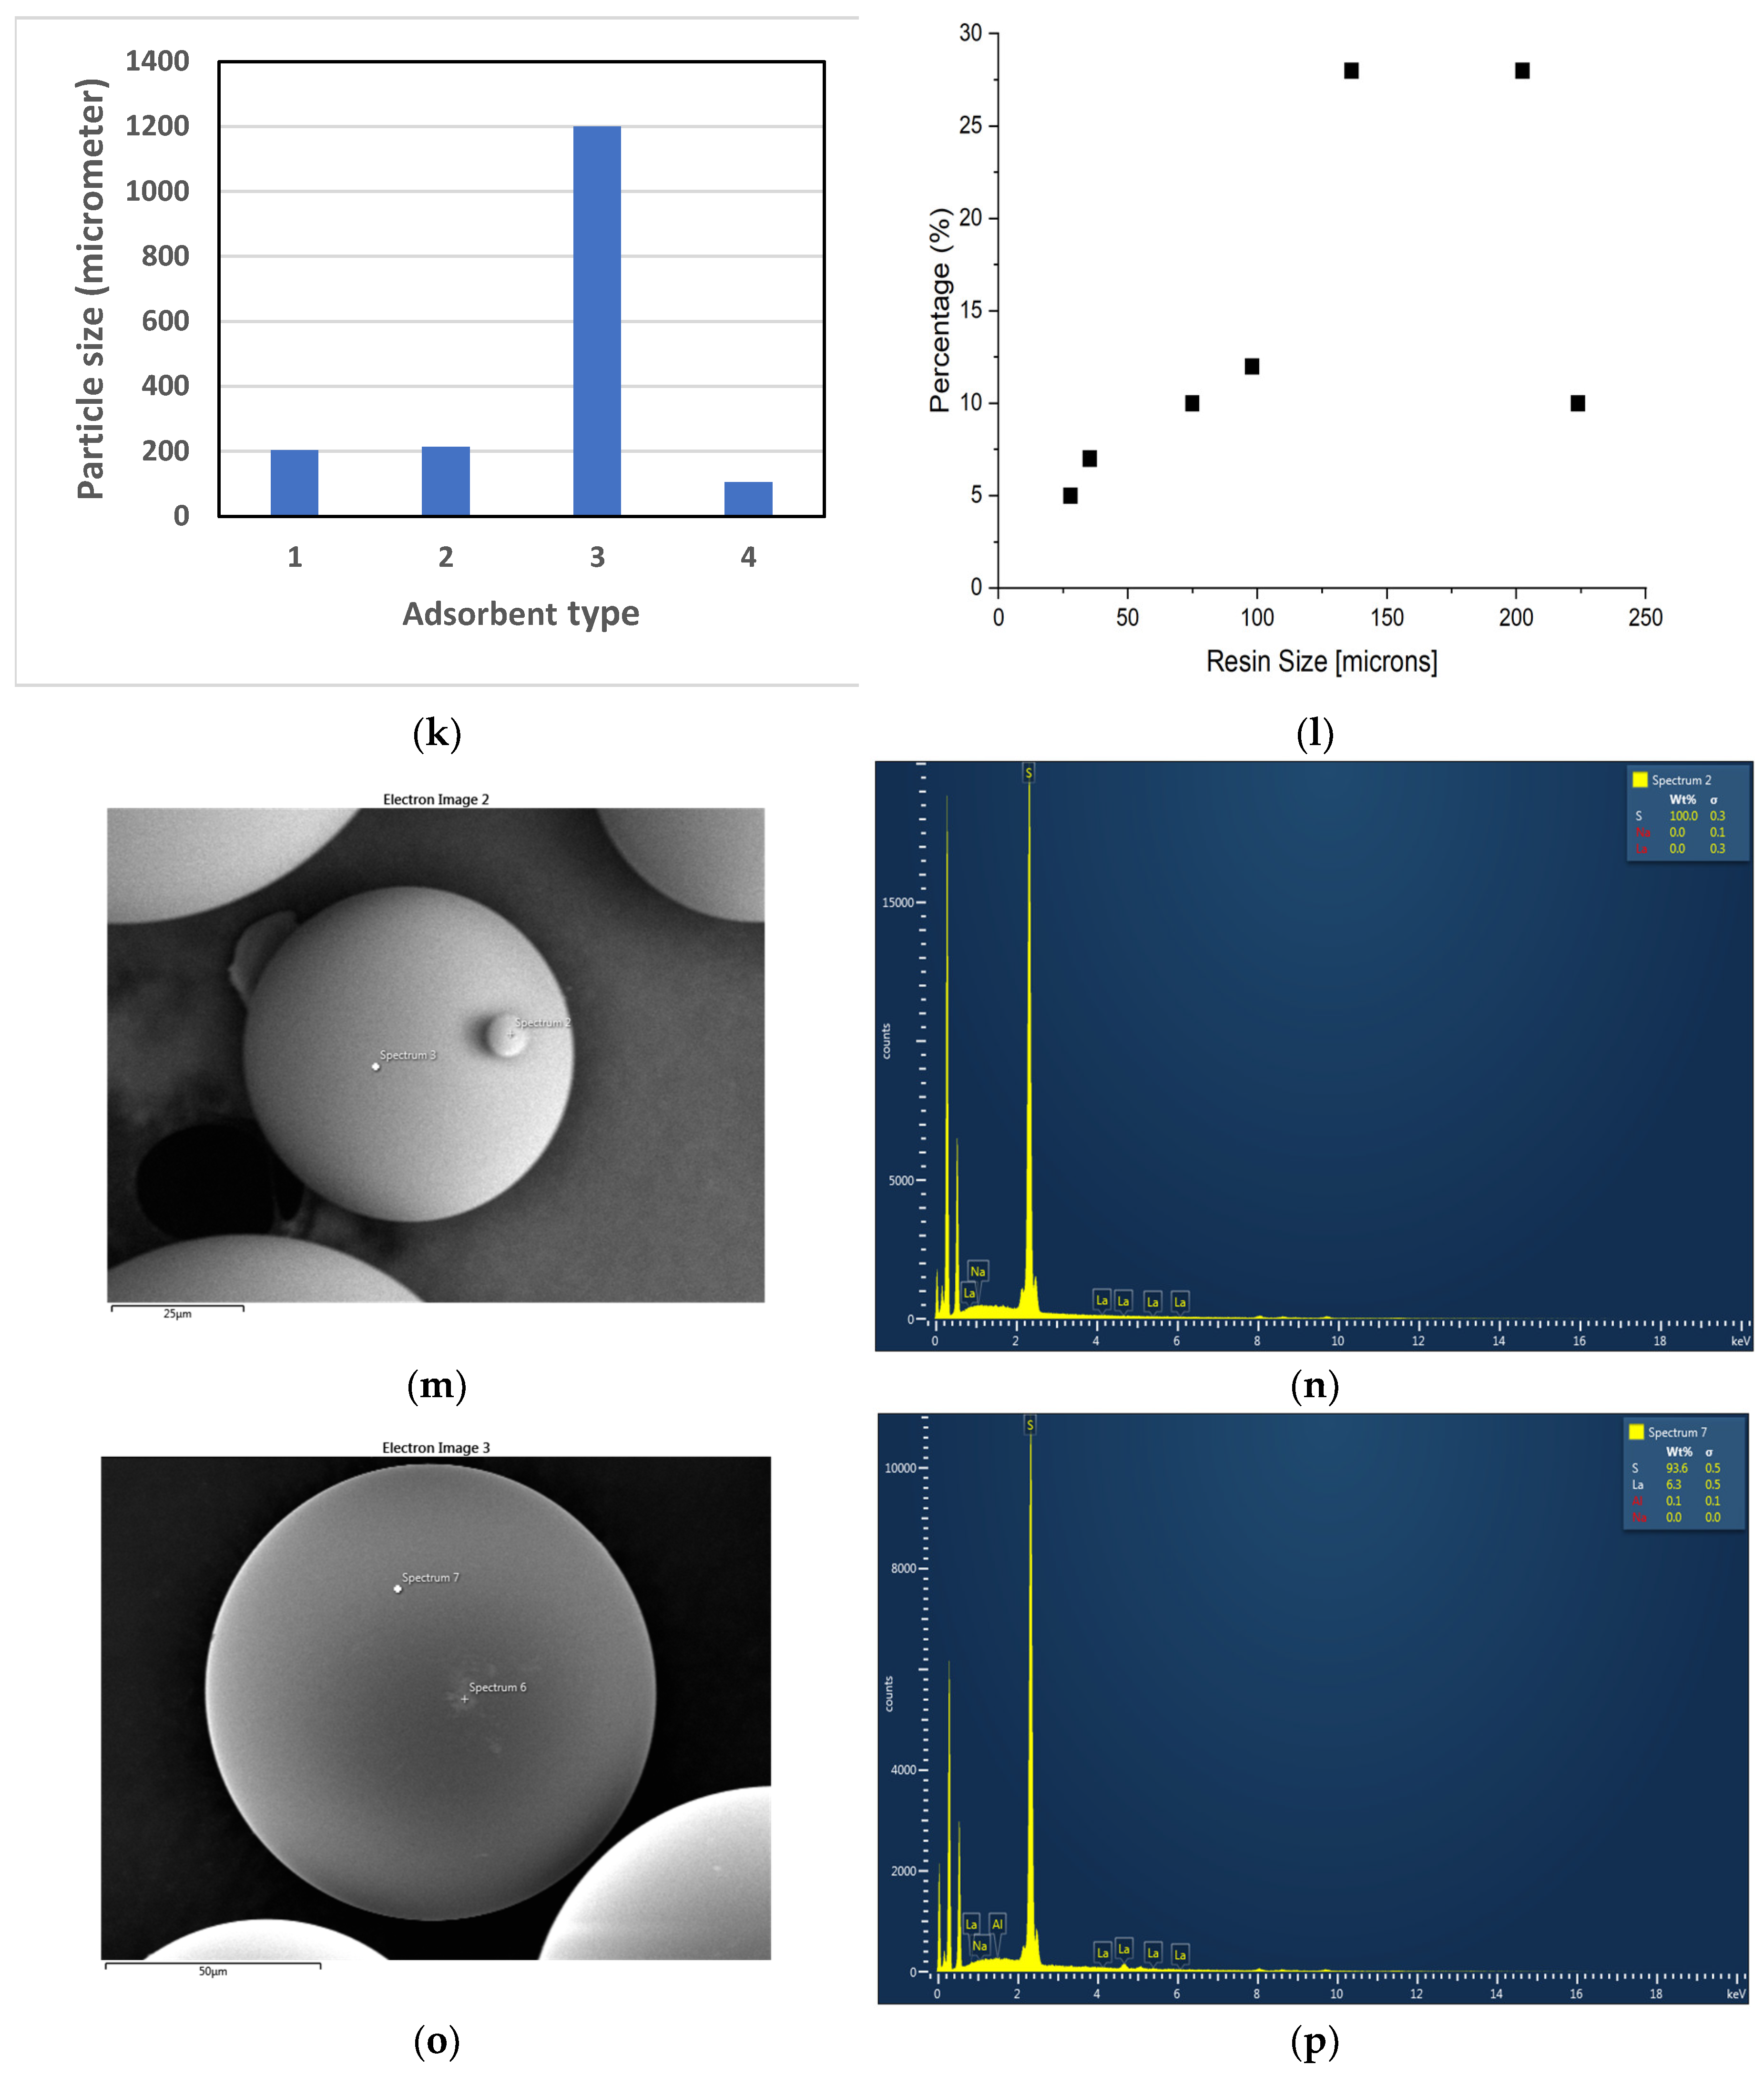
Figure 2.
Effect of the shaker speed (RPM) on the removal of La(III) after 7 hours of adsorption with Dowex 50W-X8 (pH = 5.5, T = 25.0oC).
Figure 2.
Effect of the shaker speed (RPM) on the removal of La(III) after 7 hours of adsorption with Dowex 50W-X8 (pH = 5.5, T = 25.0oC).
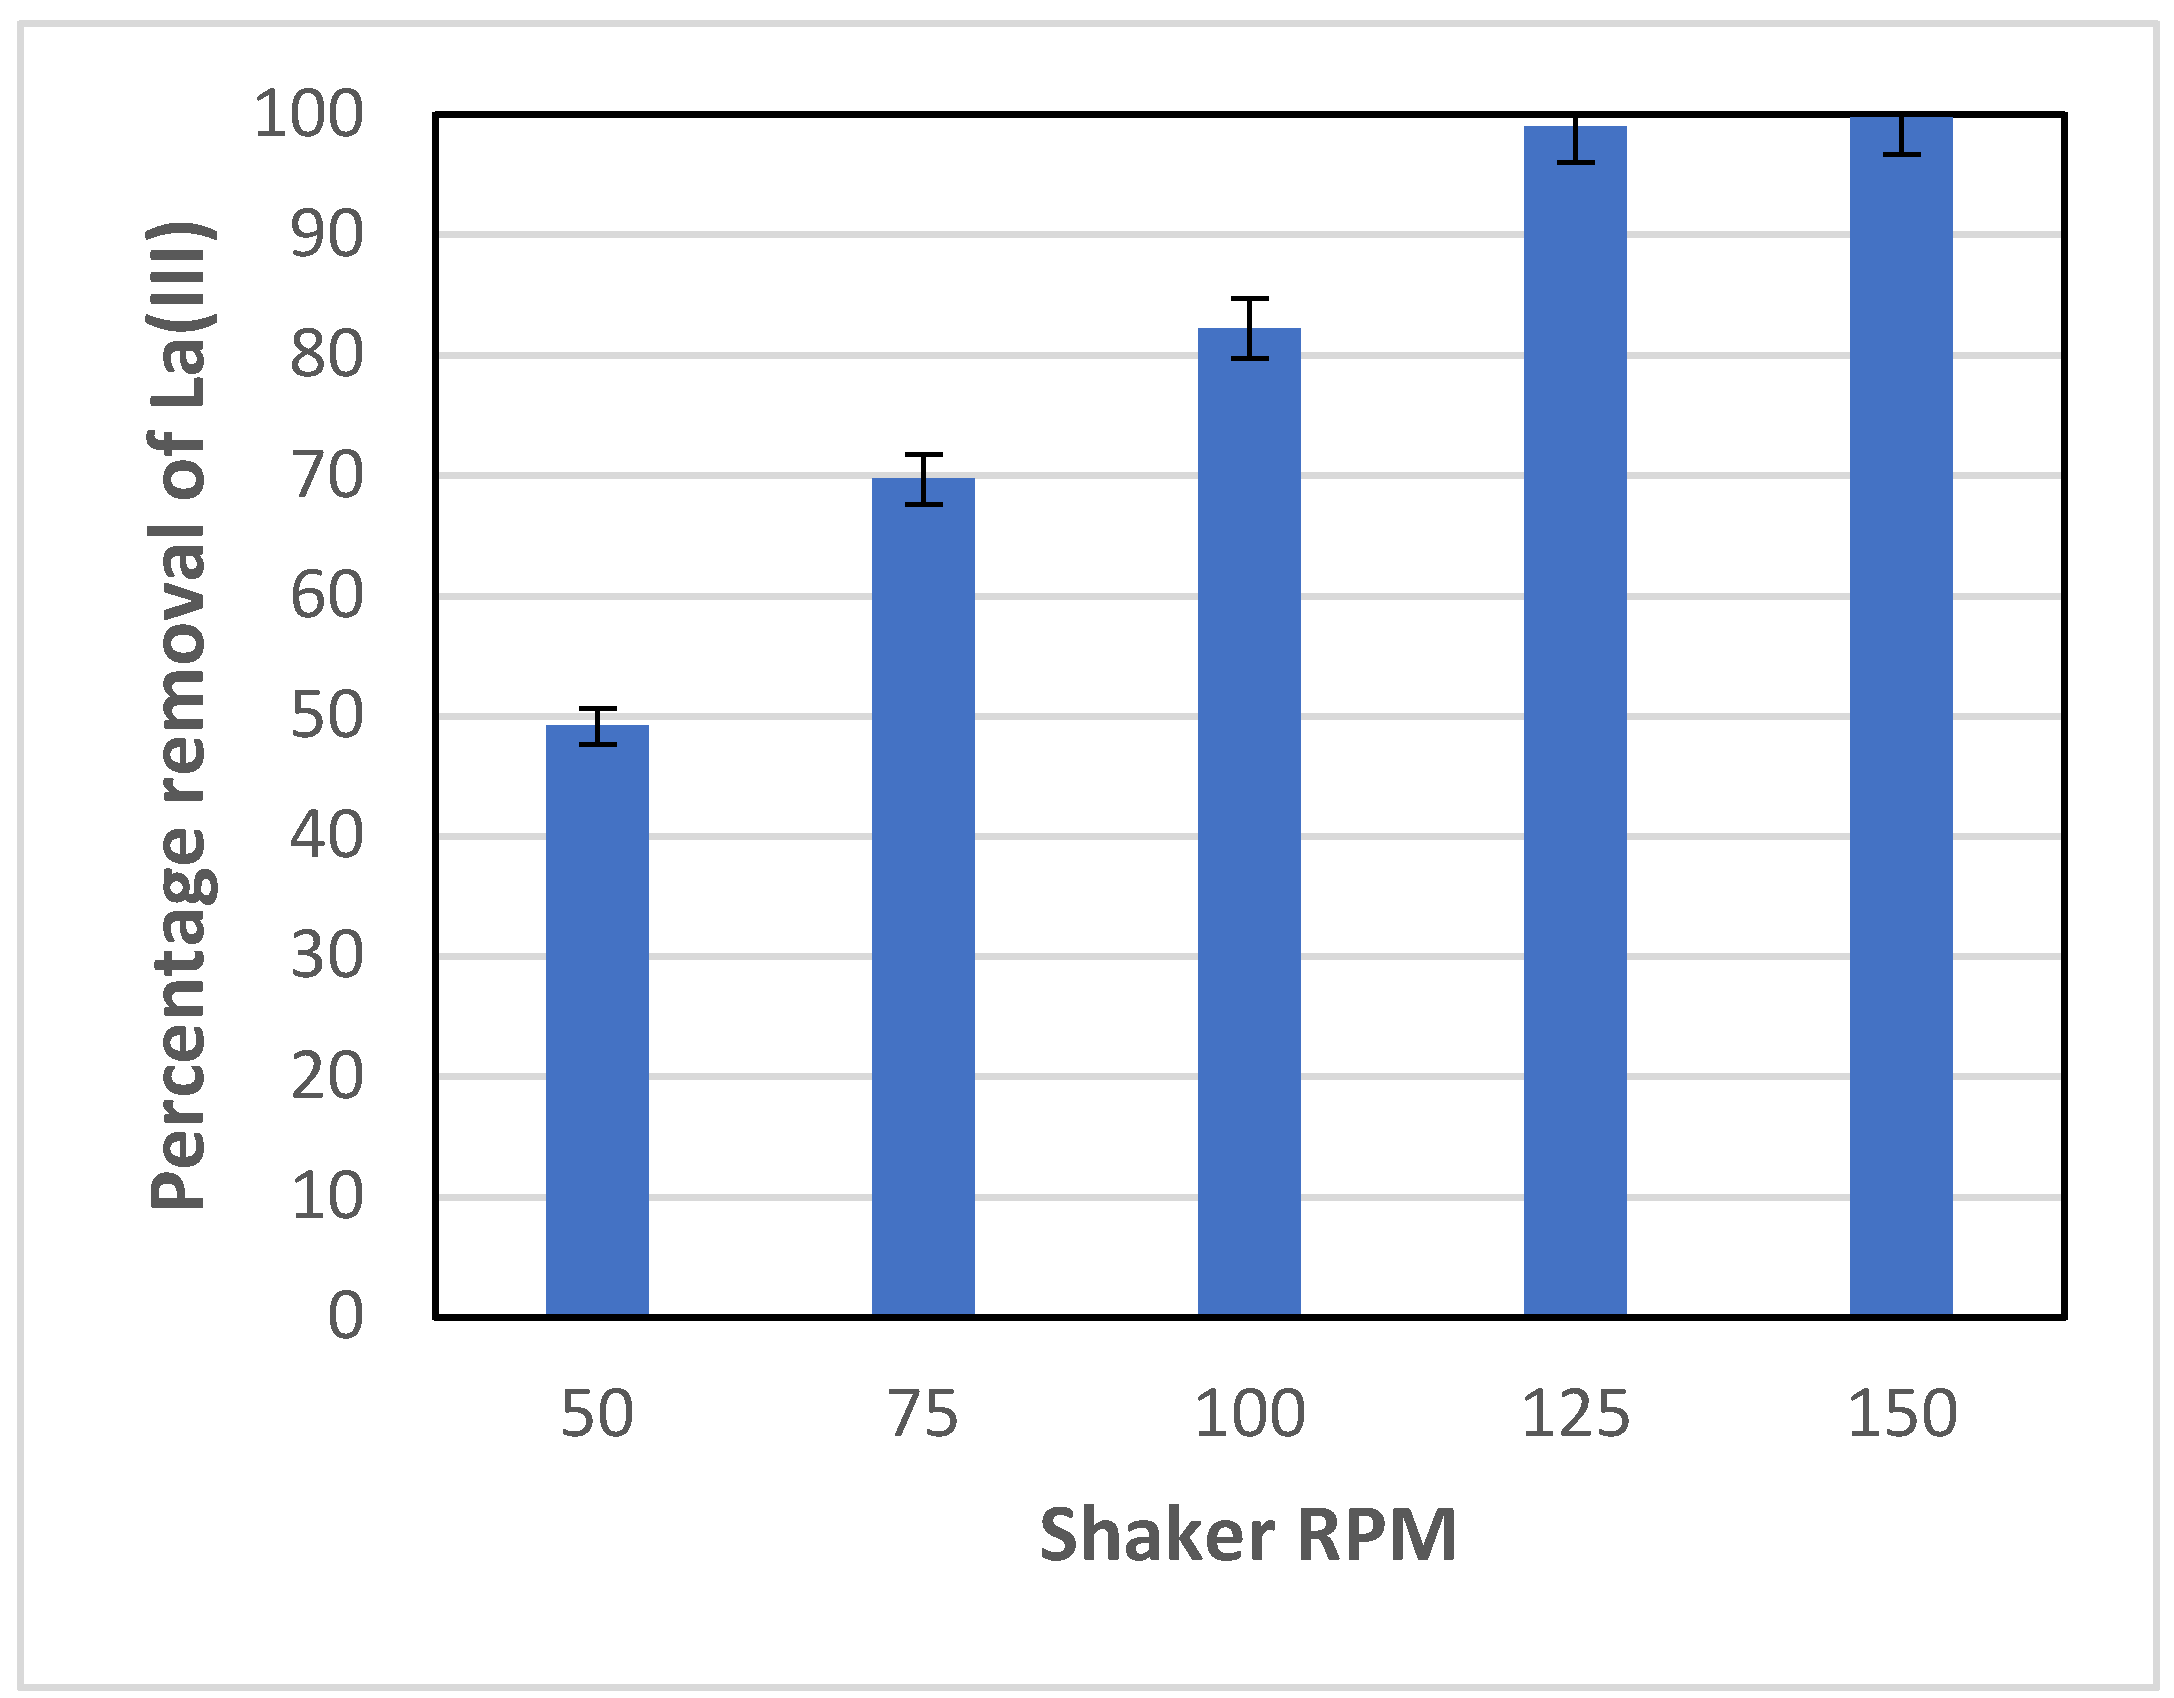
Figure 3.
Effect of the shaker speed (RPM) on La(III) adsorption: (a) Variation of the first-order kinetic rate constant, KI, with Re; (b) Relationship of the Sherwood number with Re (T = 25.0oC, pH = 5.5).
Figure 3.
Effect of the shaker speed (RPM) on La(III) adsorption: (a) Variation of the first-order kinetic rate constant, KI, with Re; (b) Relationship of the Sherwood number with Re (T = 25.0oC, pH = 5.5).
Figure 4.
(a) Effect of the adsorbent amount on the percentage removal of La(III); (b) Variation of La(III) adsorption capacity with the amount of adsorbent after 7 hours of adsorption (pH = 5.5, T = 25.0 oC, 100 RPM).
Figure 4.
(a) Effect of the adsorbent amount on the percentage removal of La(III); (b) Variation of La(III) adsorption capacity with the amount of adsorbent after 7 hours of adsorption (pH = 5.5, T = 25.0 oC, 100 RPM).
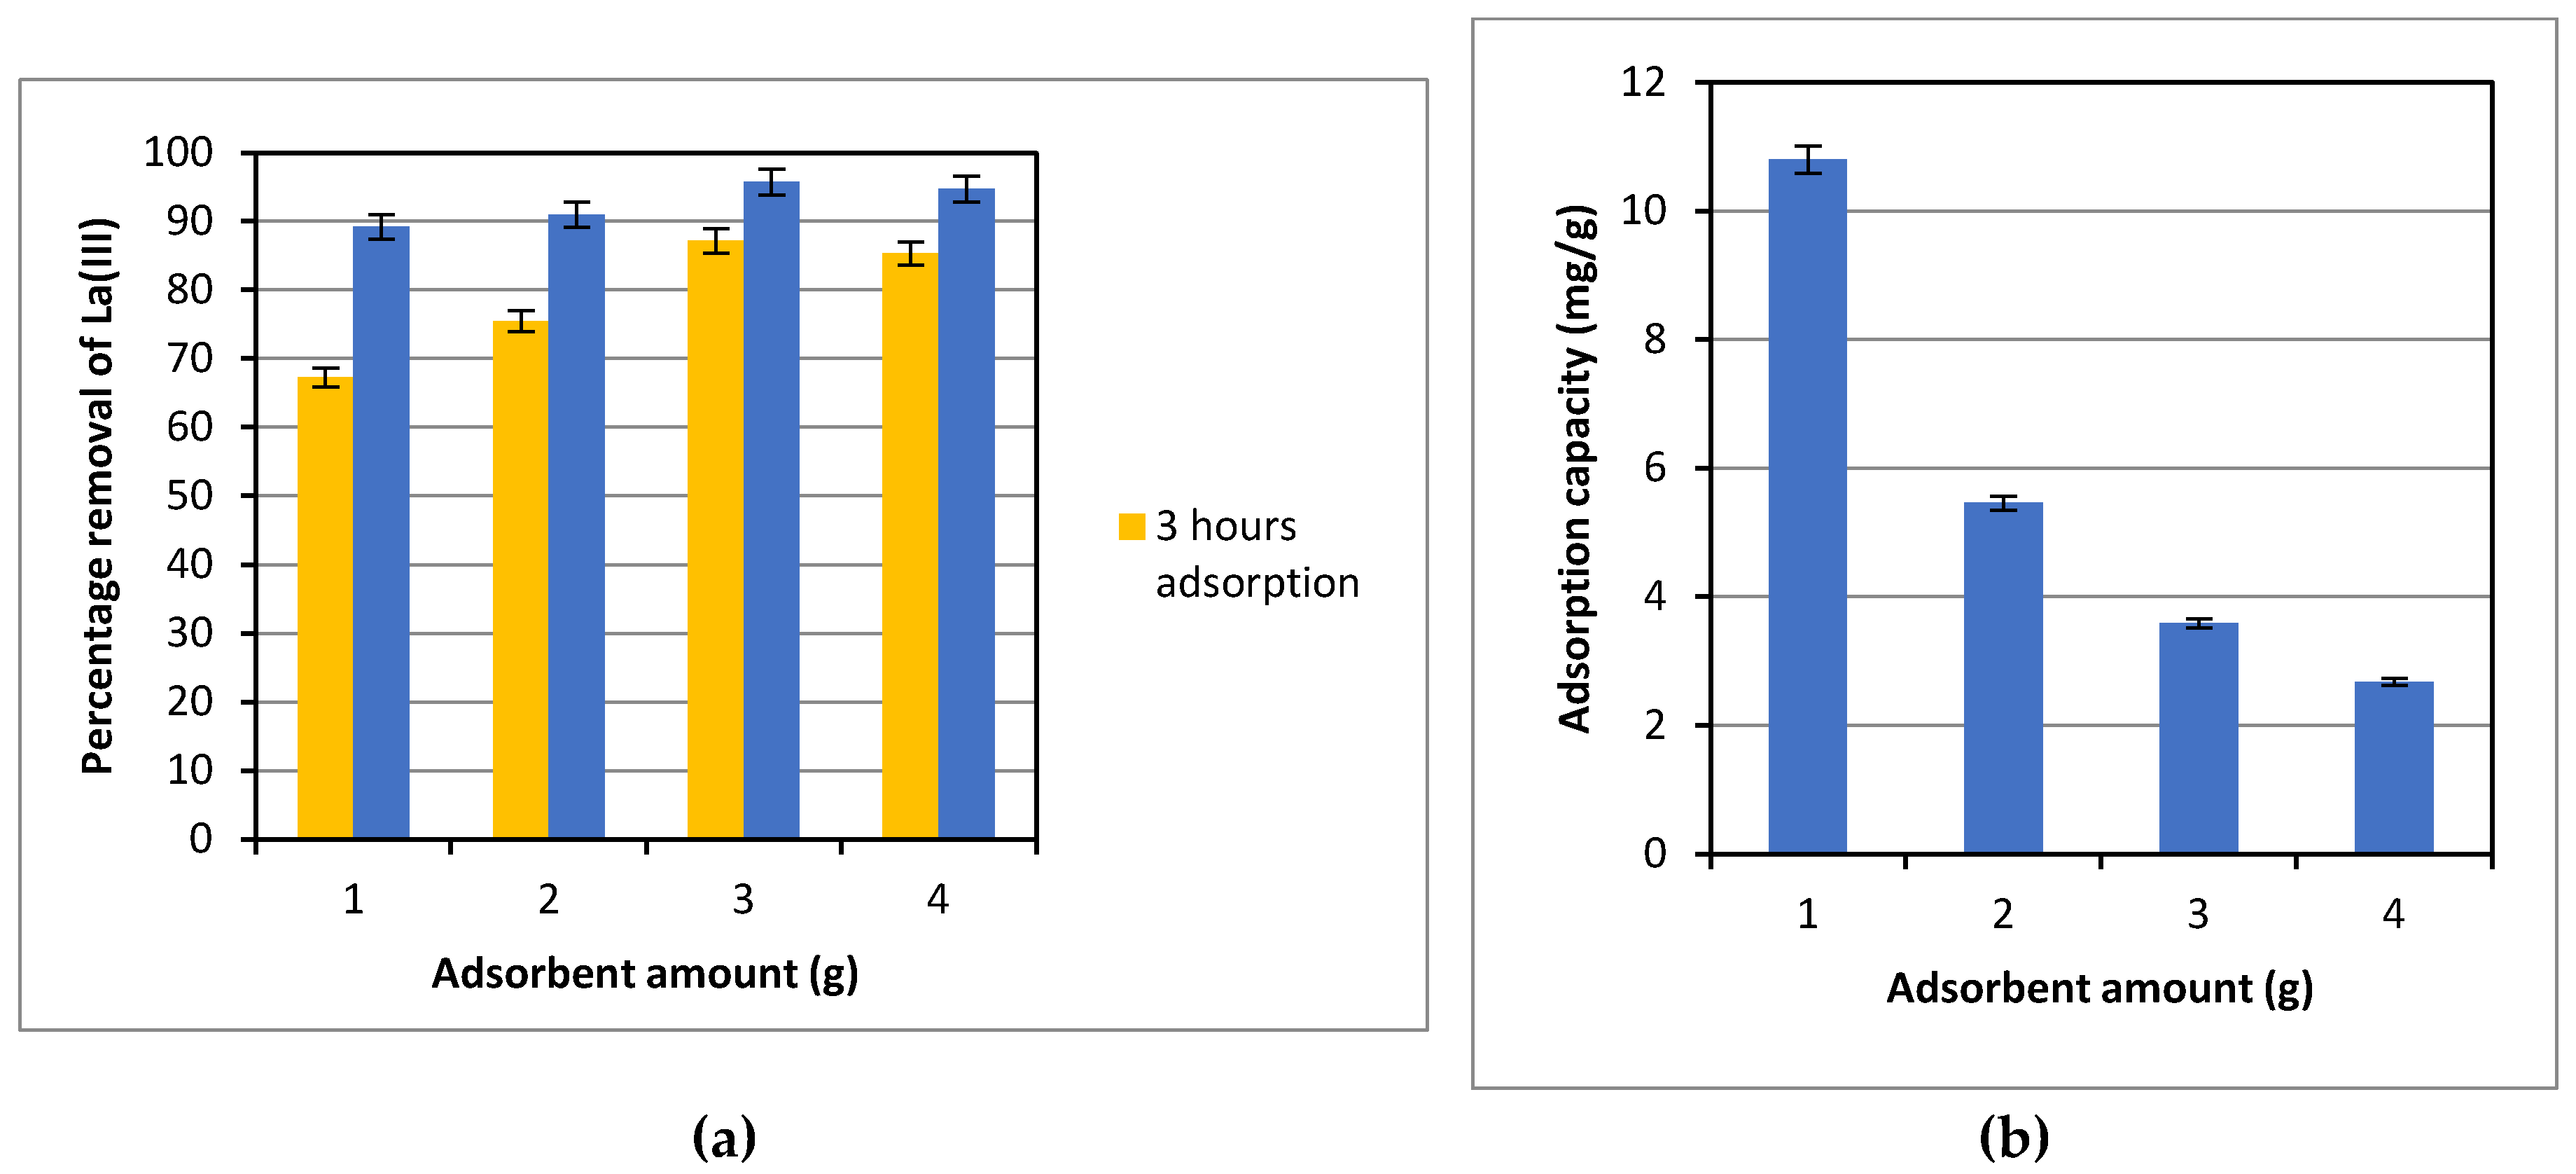
Figure 5.
First-order adsorption kinetics at varied adsorbent amounts (a, b, c, and d), variation of the rate constant, KI, with the adsorbent amount (e), and the loading factor (f, g) (pH = 5.5, T = 25.0oC, 100 RPM).
Figure 5.
First-order adsorption kinetics at varied adsorbent amounts (a, b, c, and d), variation of the rate constant, KI, with the adsorbent amount (e), and the loading factor (f, g) (pH = 5.5, T = 25.0oC, 100 RPM).

Figure 6.
Effect of the solution pH on the removal of La(III), the first-order kinetic rate constant, and the zeta potential of the adsorbent (T = 25.0oC, 100 RPM).
Figure 6.
Effect of the solution pH on the removal of La(III), the first-order kinetic rate constant, and the zeta potential of the adsorbent (T = 25.0oC, 100 RPM).
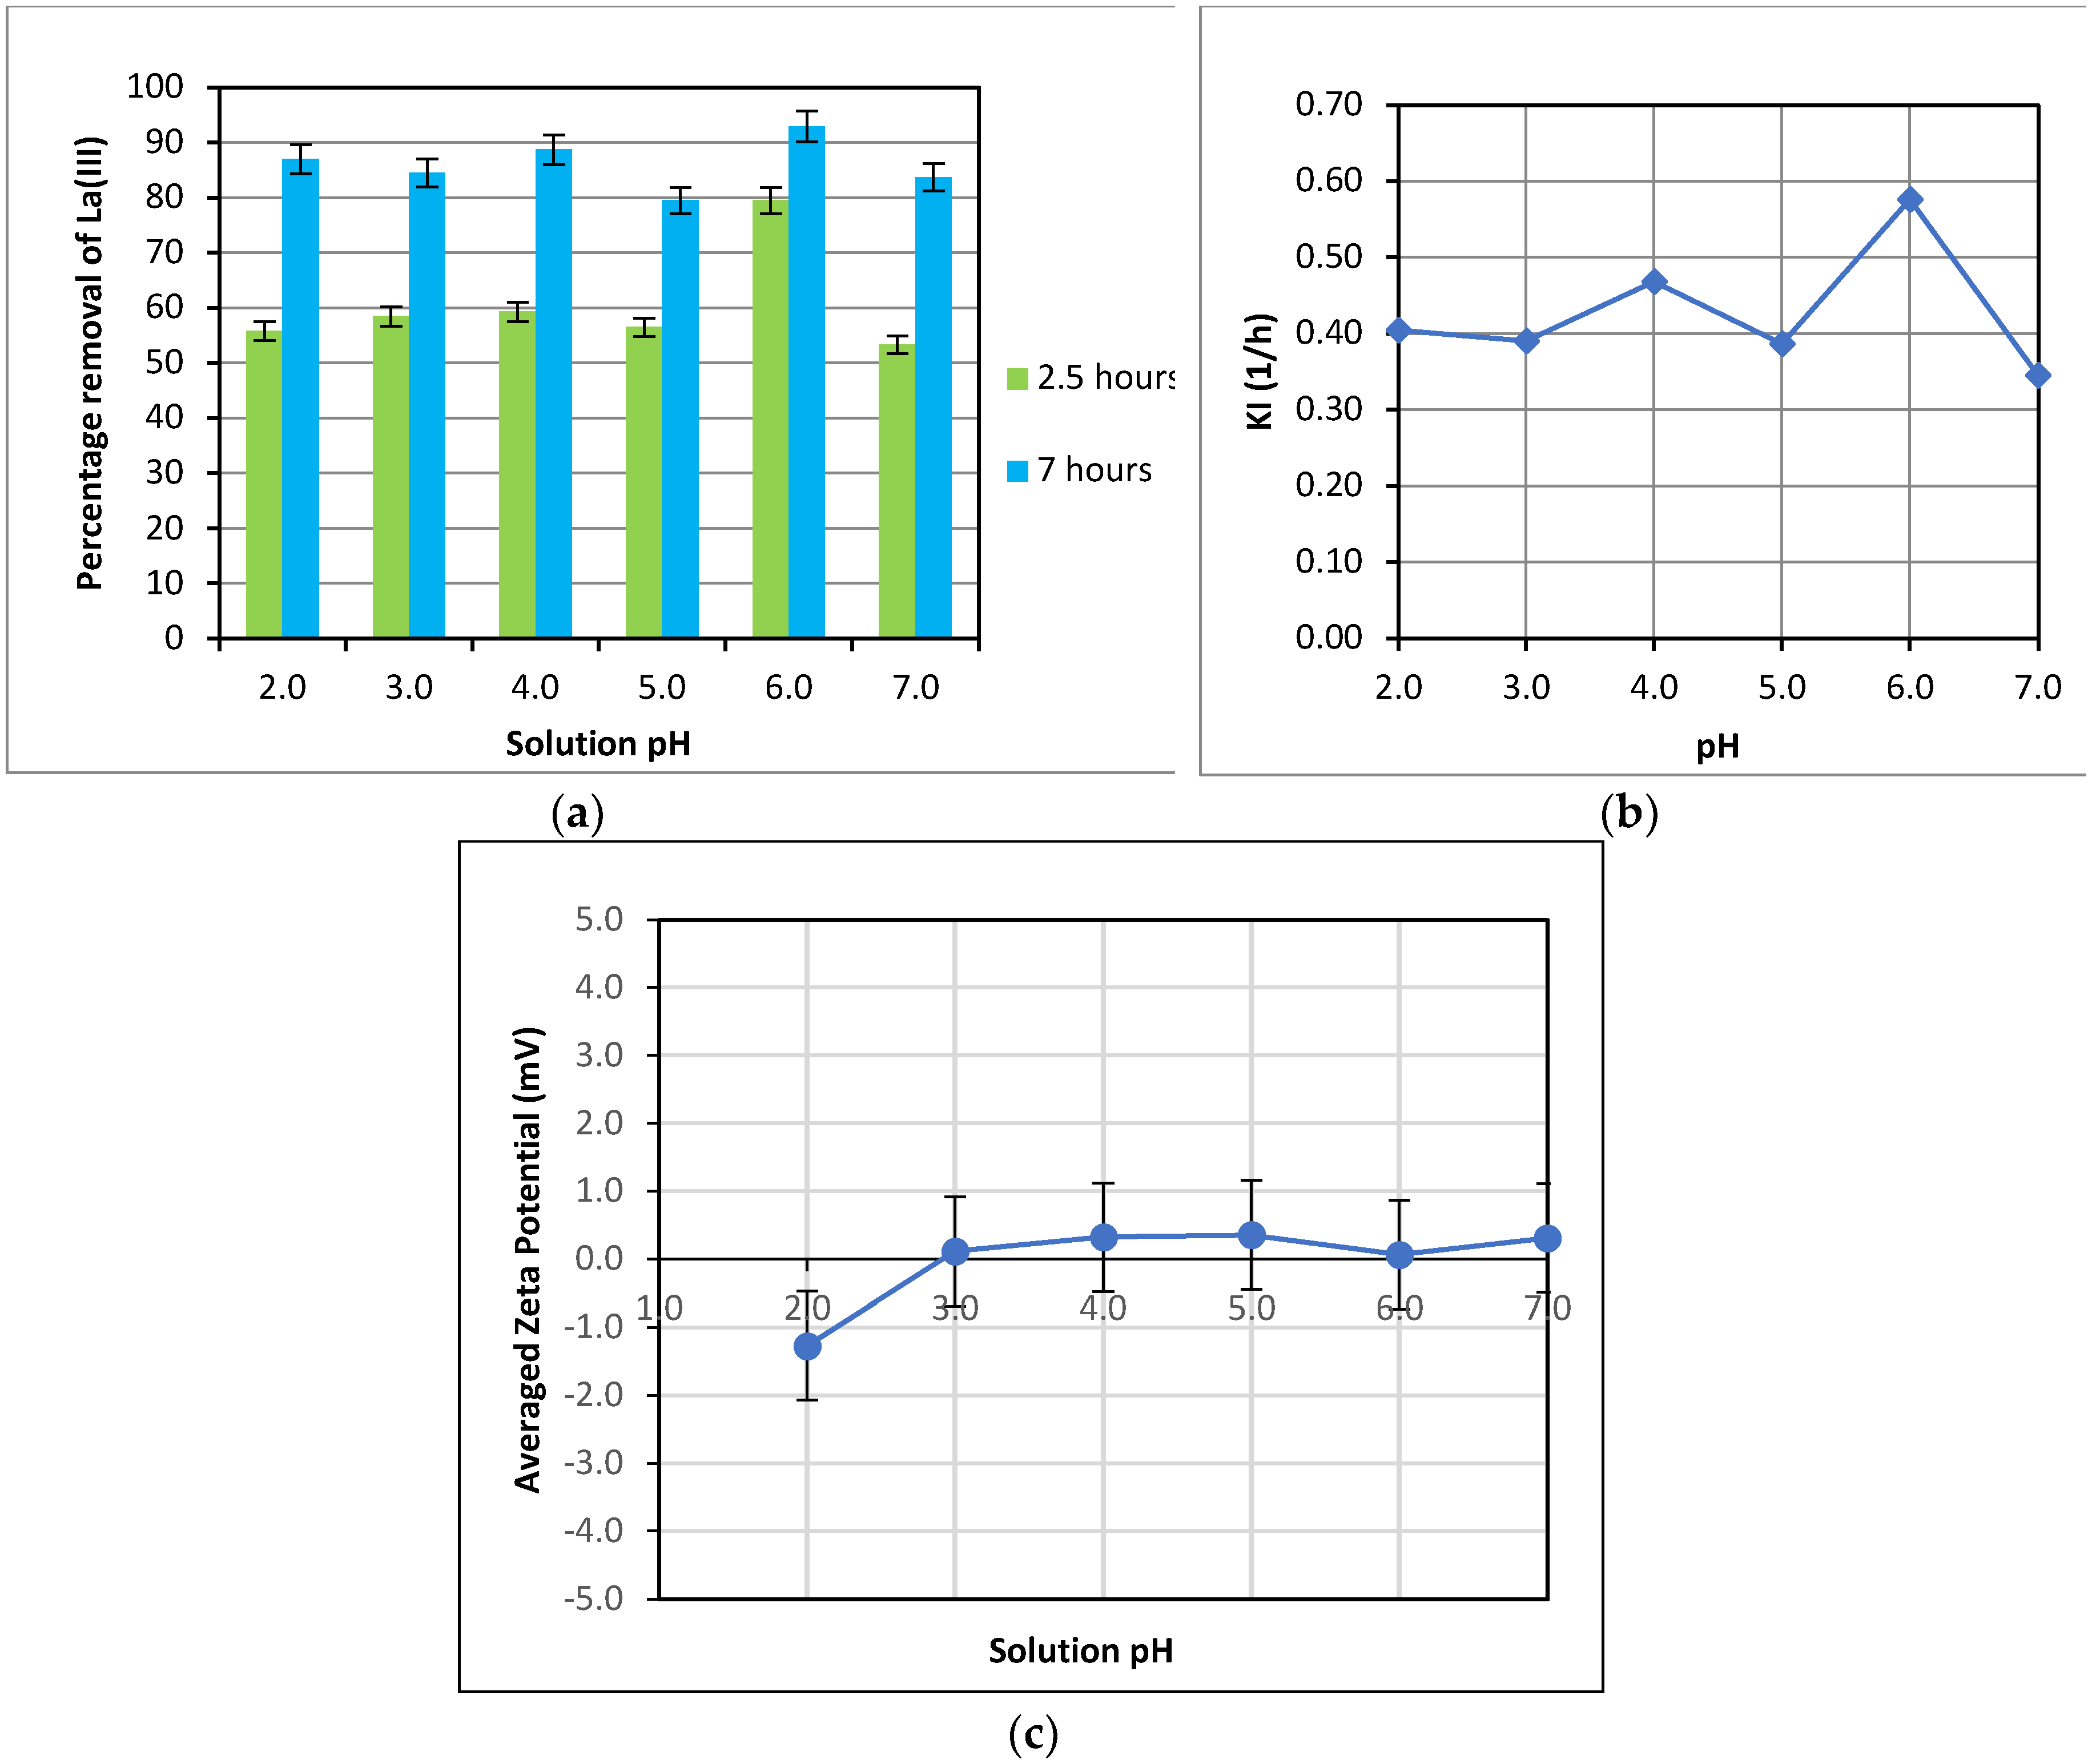
Figure 7.
Effect of temperature on adsorption of La(III): (a) Variation of the La(III) percentage removal with temperature; (b) Rate constant, KI, at different temperatures (pH = 5.5, 100 RPM).
Figure 7.
Effect of temperature on adsorption of La(III): (a) Variation of the La(III) percentage removal with temperature; (b) Rate constant, KI, at different temperatures (pH = 5.5, 100 RPM).
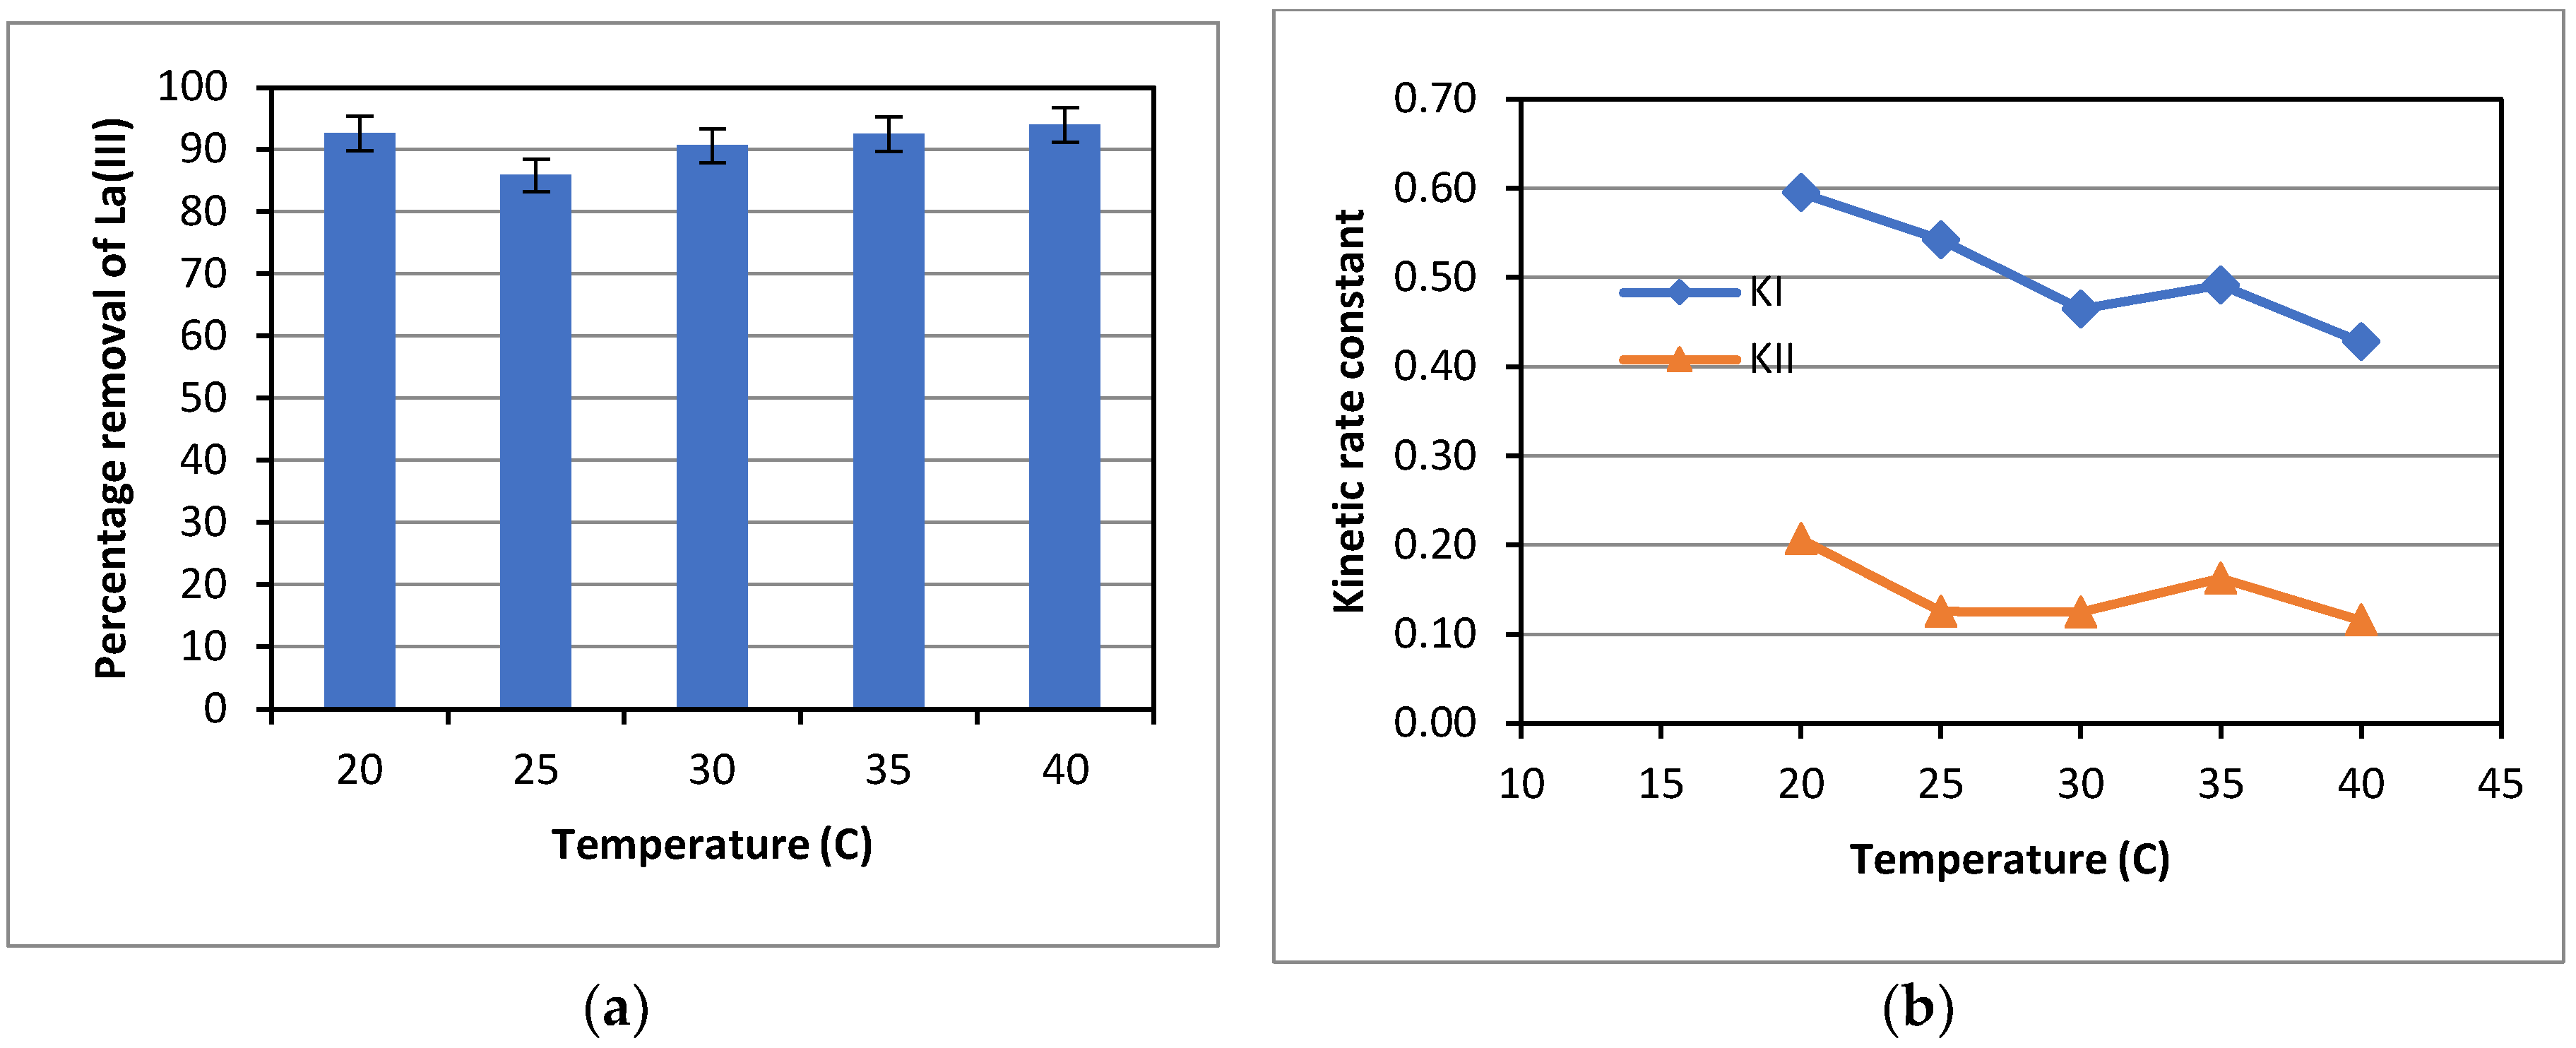
Figure 8.
First-order kinetics of La(III) adsorption: (a) Initial La(III) concentration = 32 ppm, (b) Initial La(III) concentration = 45 ppm, (c) Initial La(III) concentration = 65 ppm, (d) Initial La(III) concentration = 85 ppm, (pH = 5.5, T = 25.0oC, 100 RPM).
Figure 8.
First-order kinetics of La(III) adsorption: (a) Initial La(III) concentration = 32 ppm, (b) Initial La(III) concentration = 45 ppm, (c) Initial La(III) concentration = 65 ppm, (d) Initial La(III) concentration = 85 ppm, (pH = 5.5, T = 25.0oC, 100 RPM).
Figure 9.
Adsorption of La(III) at varied initial concentrations, 100 RPM, 2.0 g adsorbent, pH = 5.5, T = 25.0 oC.
Figure 9.
Adsorption of La(III) at varied initial concentrations, 100 RPM, 2.0 g adsorbent, pH = 5.5, T = 25.0 oC.
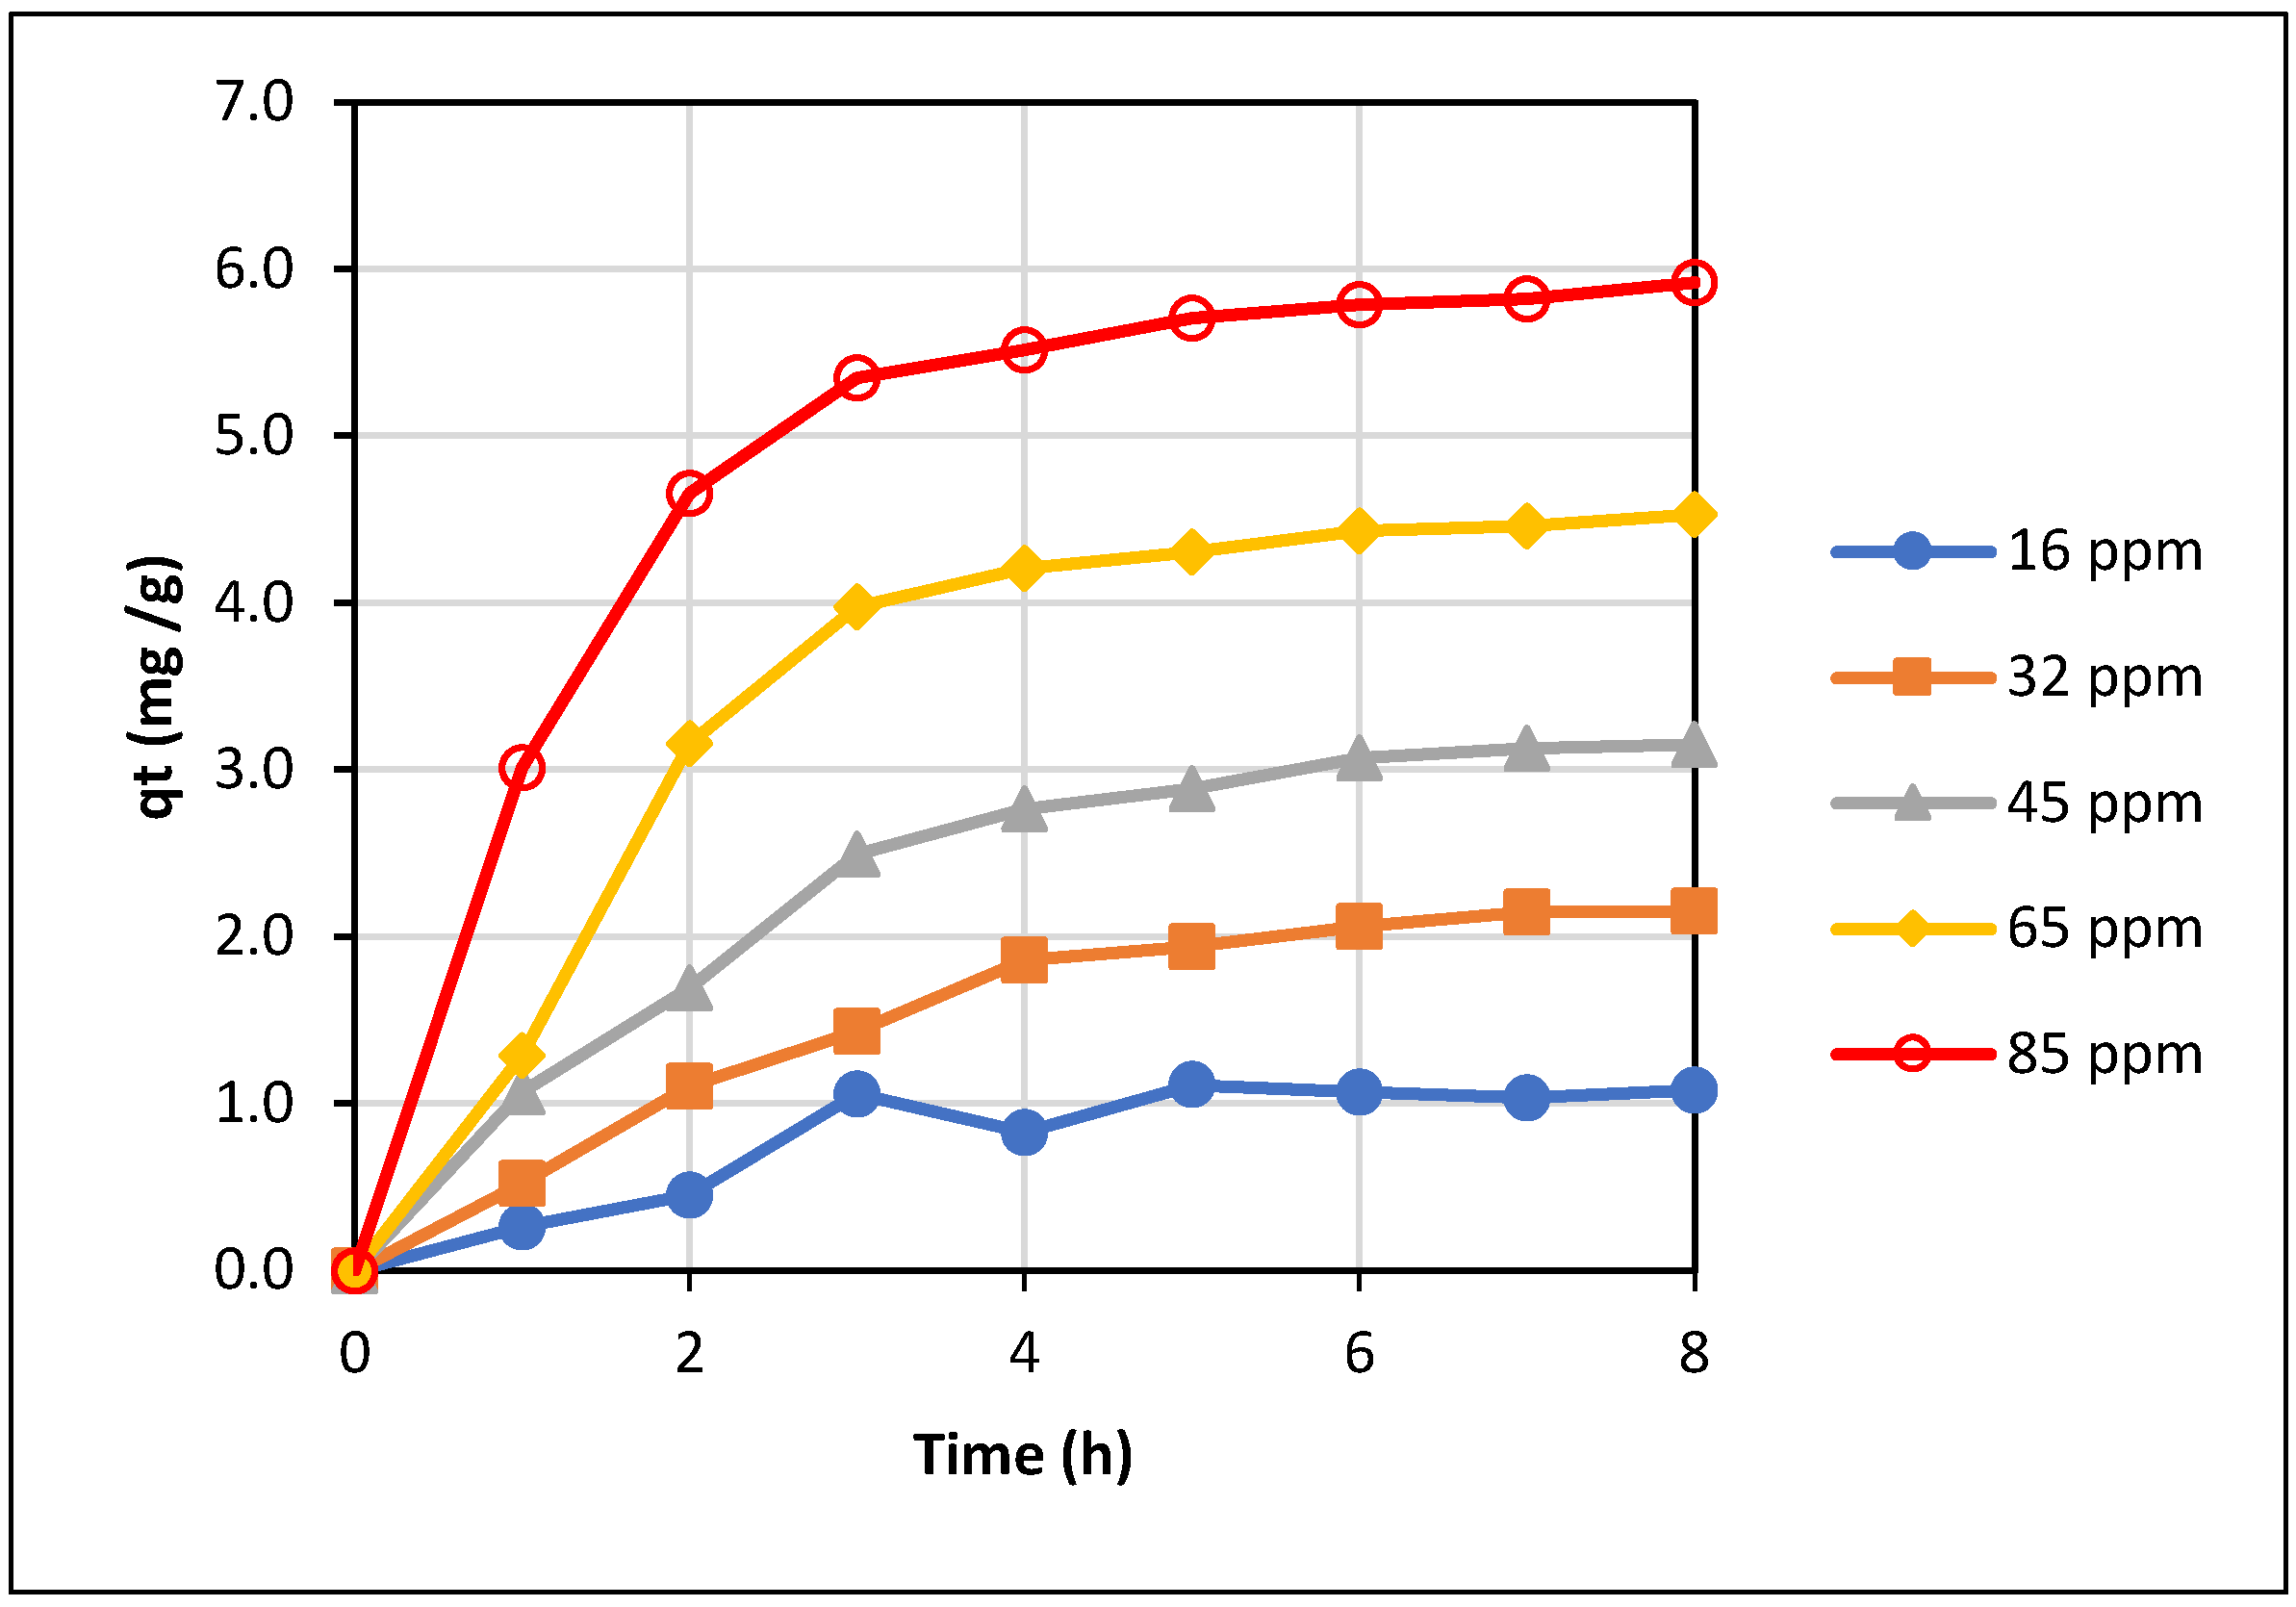
Figure 10.
Isotherm models for adsorption of La(III): a) the Freundlich model, b) the Langmuir model (100 RPM, 2.0 g adsorbent, pH = 5.5, T = 25oC).
Figure 10.
Isotherm models for adsorption of La(III): a) the Freundlich model, b) the Langmuir model (100 RPM, 2.0 g adsorbent, pH = 5.5, T = 25oC).
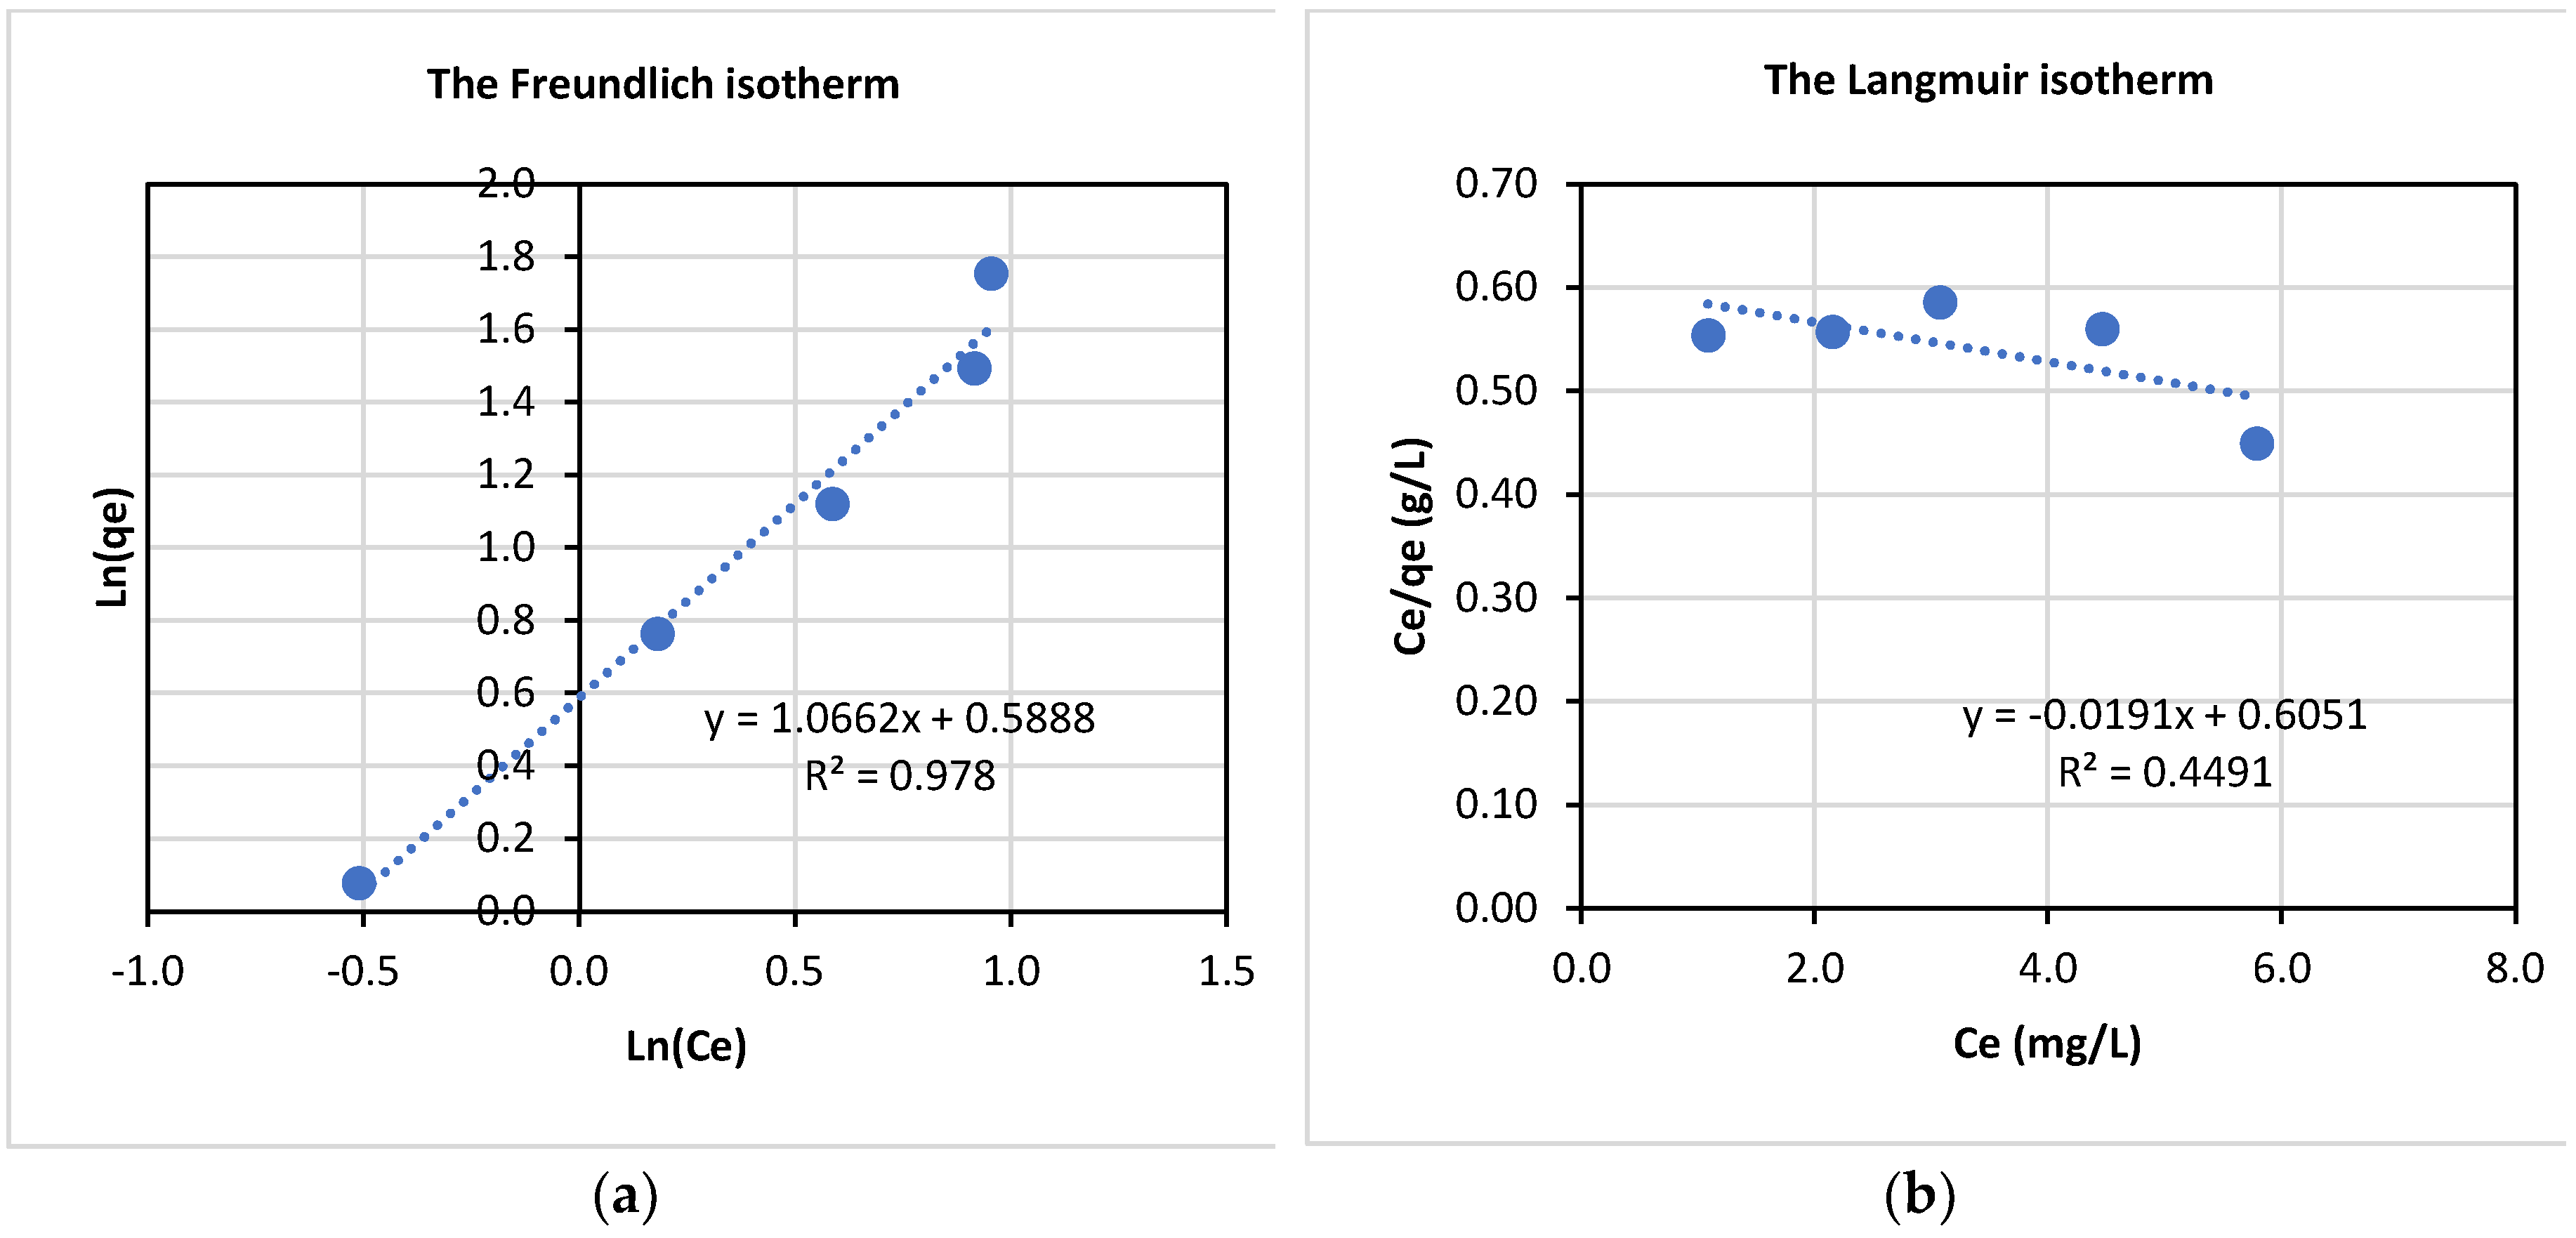
Figure 11.
Variation of the thermodynamic equilibrium constant (Kd) (a), and the kinetic constant (KI) with temperature (b).
Figure 11.
Variation of the thermodynamic equilibrium constant (Kd) (a), and the kinetic constant (KI) with temperature (b).
| ΔHo刘(KJ/mol) | ΔSo刘(KJ/mol.K) | ΔGo at varied temperatures (K)刘(KJ/mol) | Freundlich isotherm刘constants | |||||
|---|---|---|---|---|---|---|---|---|
| 293K | 298K | 303K | 308K | 313K | n | KF in mg(1-n)Ln/g | ||
| -33.2 | -0.09 | -6.3 | -5.8 | -5.3 | -4.9 | -4.4 | 1.07 | 1.80 |

Table 1.
Effect of the shaker RPM on La(III) adsorption kinetics at pH = 5.5 and T = 25.0oC.
| First-order kinetics | Second-order kinetics | |||||||
| RPM | KI (1/h) | R2 | qe model | qe expt | KII (g/[mg∙h]) | R2 | qe model | qe expt |
| 50 | 0.330 | 0.945 | 3.18 | 3.30 | 0.0525 | 0.904 | 4.85 | 3.30 |
| 75 | 0.437 | 0.927 | 3.67 | 3.10 | 0.037 | 0.885 | 5.29 | 3.10 |
| 100 | 0.542 | 0.967 | 3.71 | 3.57 | 0.126 | 0.995 | 4.46 | 3.57 |
| 125 | 0.701 | 0.937 | 3.93 | 3.40 | 0.161 | 0.994 | 4.15 | 3.40 |
| 150 | 1.032 | 0.948 | 3.02 | 4.64 | ||||
| Average | 3.50 | 3.60 | Average | 4.69 | 3.34 | |||
| Deviation (%) | -2.8 | Deviation (%) | 40.2 | |||||
Table 2.
Isotherm and thermodynamic parameters for adsorption of La(III) by Dowex 50W-X8.
| ΔHo刘(KJ/mol) | ΔSo刘(KJ/mol.K) | ΔGo at varied temperatures (K)刘(KJ/mol) | Freundlich isotherm刘constants | |||||
|---|---|---|---|---|---|---|---|---|
| 293K | 298K | 303K | 308K | 313K | n | KF in mg(1-n)Ln/g | ||
| -33.2 | -0.09 | -6.3 | -5.8 | -5.3 | -4.9 | -4.4 | 1.07 | 1.80 |
Disclaimer/Publisher’s Note: The statements, opinions and data contained in all publications are solely those of the individual author(s) and contributor(s) and not of MDPI and/or the editor(s). MDPI and/or the editor(s) disclaim responsibility for any injury to people or property resulting from any ideas, methods, instructions or products referred to in the content. |
© 2024 by the authors. Licensee MDPI, Basel, Switzerland. This article is an open access article distributed under the terms and conditions of the Creative Commons Attribution (CC BY) license (https://creativecommons.org/licenses/by/4.0/).
Copyright: This open access article is published under a Creative Commons CC BY 4.0 license, which permit the free download, distribution, and reuse, provided that the author and preprint are cited in any reuse.


