
Submitted:
23 July 2024
Posted:
24 July 2024
You are already at the latest version
Abstract
This study maps and quantifies the green infrastructure of the cities of Bujumbura, Kinshasa and Lubumbashi. A remote sensing approach, in conjunction with landscape ecology metrics, characterized this analysis, which was based upon three Landsat images acquired in 2000, 2013 and 2022 for each city. Spatial pattern indices show that green infrastructure was suppressed in the cities of Bujumbura and Kinshasa, in contrast to the city of Lubumbashi, which was characterized by a fragmentation of its green areas. Additionally, the values of the stability, aggregation and fractal dimension metrics suggest that the city of Bujumbura underwent rather intense dynamics and a reduction in the continuity of its green areas, while the city of Kinshasa shows weaker dynamics and tendances of patch aggregation in the study period. The city of Lubumbashi, in its turn, exhibits strong dynamics and an aggregation of its green infrastructure, in a context of a high level of anthropization. The evolution of the Normalized Difference Vegetation Index shows a sawtooth evolution of tall vegetation patches for the city of Bujumbura, against a gradual decrease in Kinshasa and Lubumbashi. It is advocated that the urban growth of these cities should be planned carefully in order to integrate the presence of sufficient green infrastructure.
Keywords:
spatial analysis
; remote sensing
; fragmentation
; green infrastructure
1. Introduction
With its urban population growing from 27 million to 567 million between 1950 and 2015, Africa is currently the world's most rapidly urbanizing region [1]. The urban population of sub-Saharan Africa is the fastest-growing of all developing regions, followed by South and Central Asia [2]. This growing urbanization poses several environmental challenges, especially in Africa, hence the development of urban ecology.
In this part of the world, wars, natural population growth and mass migration from the countryside to the cities continue to be a determining trend, shaping ever-larger cities that are often ill-equipped to accommodate new arrivals [3,4,5]. These new city dwellers join underprivileged and often informal neighborhoods, unhealthy and lacking basic infrastructure and services in a context of unplanned urban growth that has prevailed since the 1950s in sub-Saharan cities [4,6,7].
This lack of planning generally leads to the formation of social ghettos, the reinforcement of social inequalities, and the visual degradation of landscapes [8]. Green elements and formations in urbanized environments (urban trees, green belts and other peri-urban forests) are becoming increasingly important for sustainable development [6] through their multifunctionality [9]. For this reason, understanding the ecological functioning of urban ecosystems, particularly tropical ones, becomes an important field of research.
Despite the fact that urban green infrastructure (GI) and its ecosystem services are often conceptualized from an essentially Western perspective of cities as well as their social, economic and environmental challenges [10], studies of urban green spaces in sub-Saharan cities and their ecological functions have already been realized [10,11,12,13,14,15]. Examples include the comparison of the GI of the towns of Bahir Dar and Hawassa [16] and the cities of Bamako and Sikasso [17] and the characterization of fruit tree diversity in the cities of Lubumbashi and Kolwezi [18]. However, isolated studies of cities do not always allow pertinent comparisons enabling the development of large-scale regional or even supra-national policies due to the application of different methodological approaches and to non-standardized data sets.
Despite this methodological issues and the different ecological, social and economic contexts, comparative analyses of GI that go beyond regional and sub-regional scales are useful to formulate general conclusions not limited to a particular city [19,20]. It is in this context that a comparison of the GI of five different urban areas including Cape Town, Durban and Johannesburg in South Africa, and Birmingham and London in the UK was made [20]. It considered how GI concepts were integrated into decision-making processes of these cities. This key role for GI in urban planning was confirmed by [21] for southern and eastern Africa. Similarly, [22] highlight the need for local governments to consider GI in development and climate adaptation strategies. Hence, comparative studies are justified to understand and theorize the dynamics of tropical cities and the role of green infrastructure herein.
This study compares the green spaces of the cities of Bujumbura, Kinshasa and Lubumbashi. Although these three cities have distinct socio-economic, demographic, morphological and political contexts, they do have some elements in common. Firstly, they were all founded during the colonial era and are characterized by a rapid demographic growth, reinforced by rural exodus and migrations due to political instability [5,23]. In addition, their development is marked by increasing anthropogenic pressure on green spaces, resulting from a lack of urban planning [5,23,24], and by considerable population densities, estimated in 2023 to 11686, 1730 and 3764 habitants/km2 for Bujumbura, Kinshasa and Lubumbashi, respectively. These cities have also been chosen because of the studies available on their ecosystems, which can be illustrated by some examples. For the city of Bujumbura, data on floristic diversity [25,26] and ecosystem services [15] are available. The typology, spatial structure, plant composition, management mode, state of maintenance and ecosystem services of green spaces in the city of Kinshasa have already been analyzed [13]. For Lubumbashi, studies concerning the spatial pattern of green spaces along the urban-rural gradient [14], the perception by local experts of green spaces and their ecosystem services [27] and the diversity of street-lining trees [28] are available; in addition, peri-urban areas have been intensively described with regard to their tree and shrub vegetation [29]. Despite these individual studies, no comparative study has yet been carried out to detect commonalities between the GI of these three cities.
The present study focuses on the GI of the cities of Bujumbura, Kinshasa and Lubumbashi, using remote sensing and spatial pattern indices. It is based on the central hypothesis that the GI of these three target cities is each of them experiencing a proper dynamic however characterized by common trends such as the regression of vegetation, an increasing importance of herbaceous vegetation, an increase in the level of anthropization and a decrease in the spatial continuity of the GI. This hypothesis is subdivided into three sub-hypotheses: (i) the GI of all three cities shows strong instability and a regressive surface trend, particularly in favor of built-up areas, (ii) the GI of all cities shows an increasing level of anthropization and a decreasing level of spatial continuity over time, (iii) each city shows a dynamic in the composition of the GI in terms of low (herbaceous) and high (tree) vegetation that is specific to it, but with a common trend towards the dominance of a lower biomass in green spaces.
2. Materials and Methods
2.1. Study Area
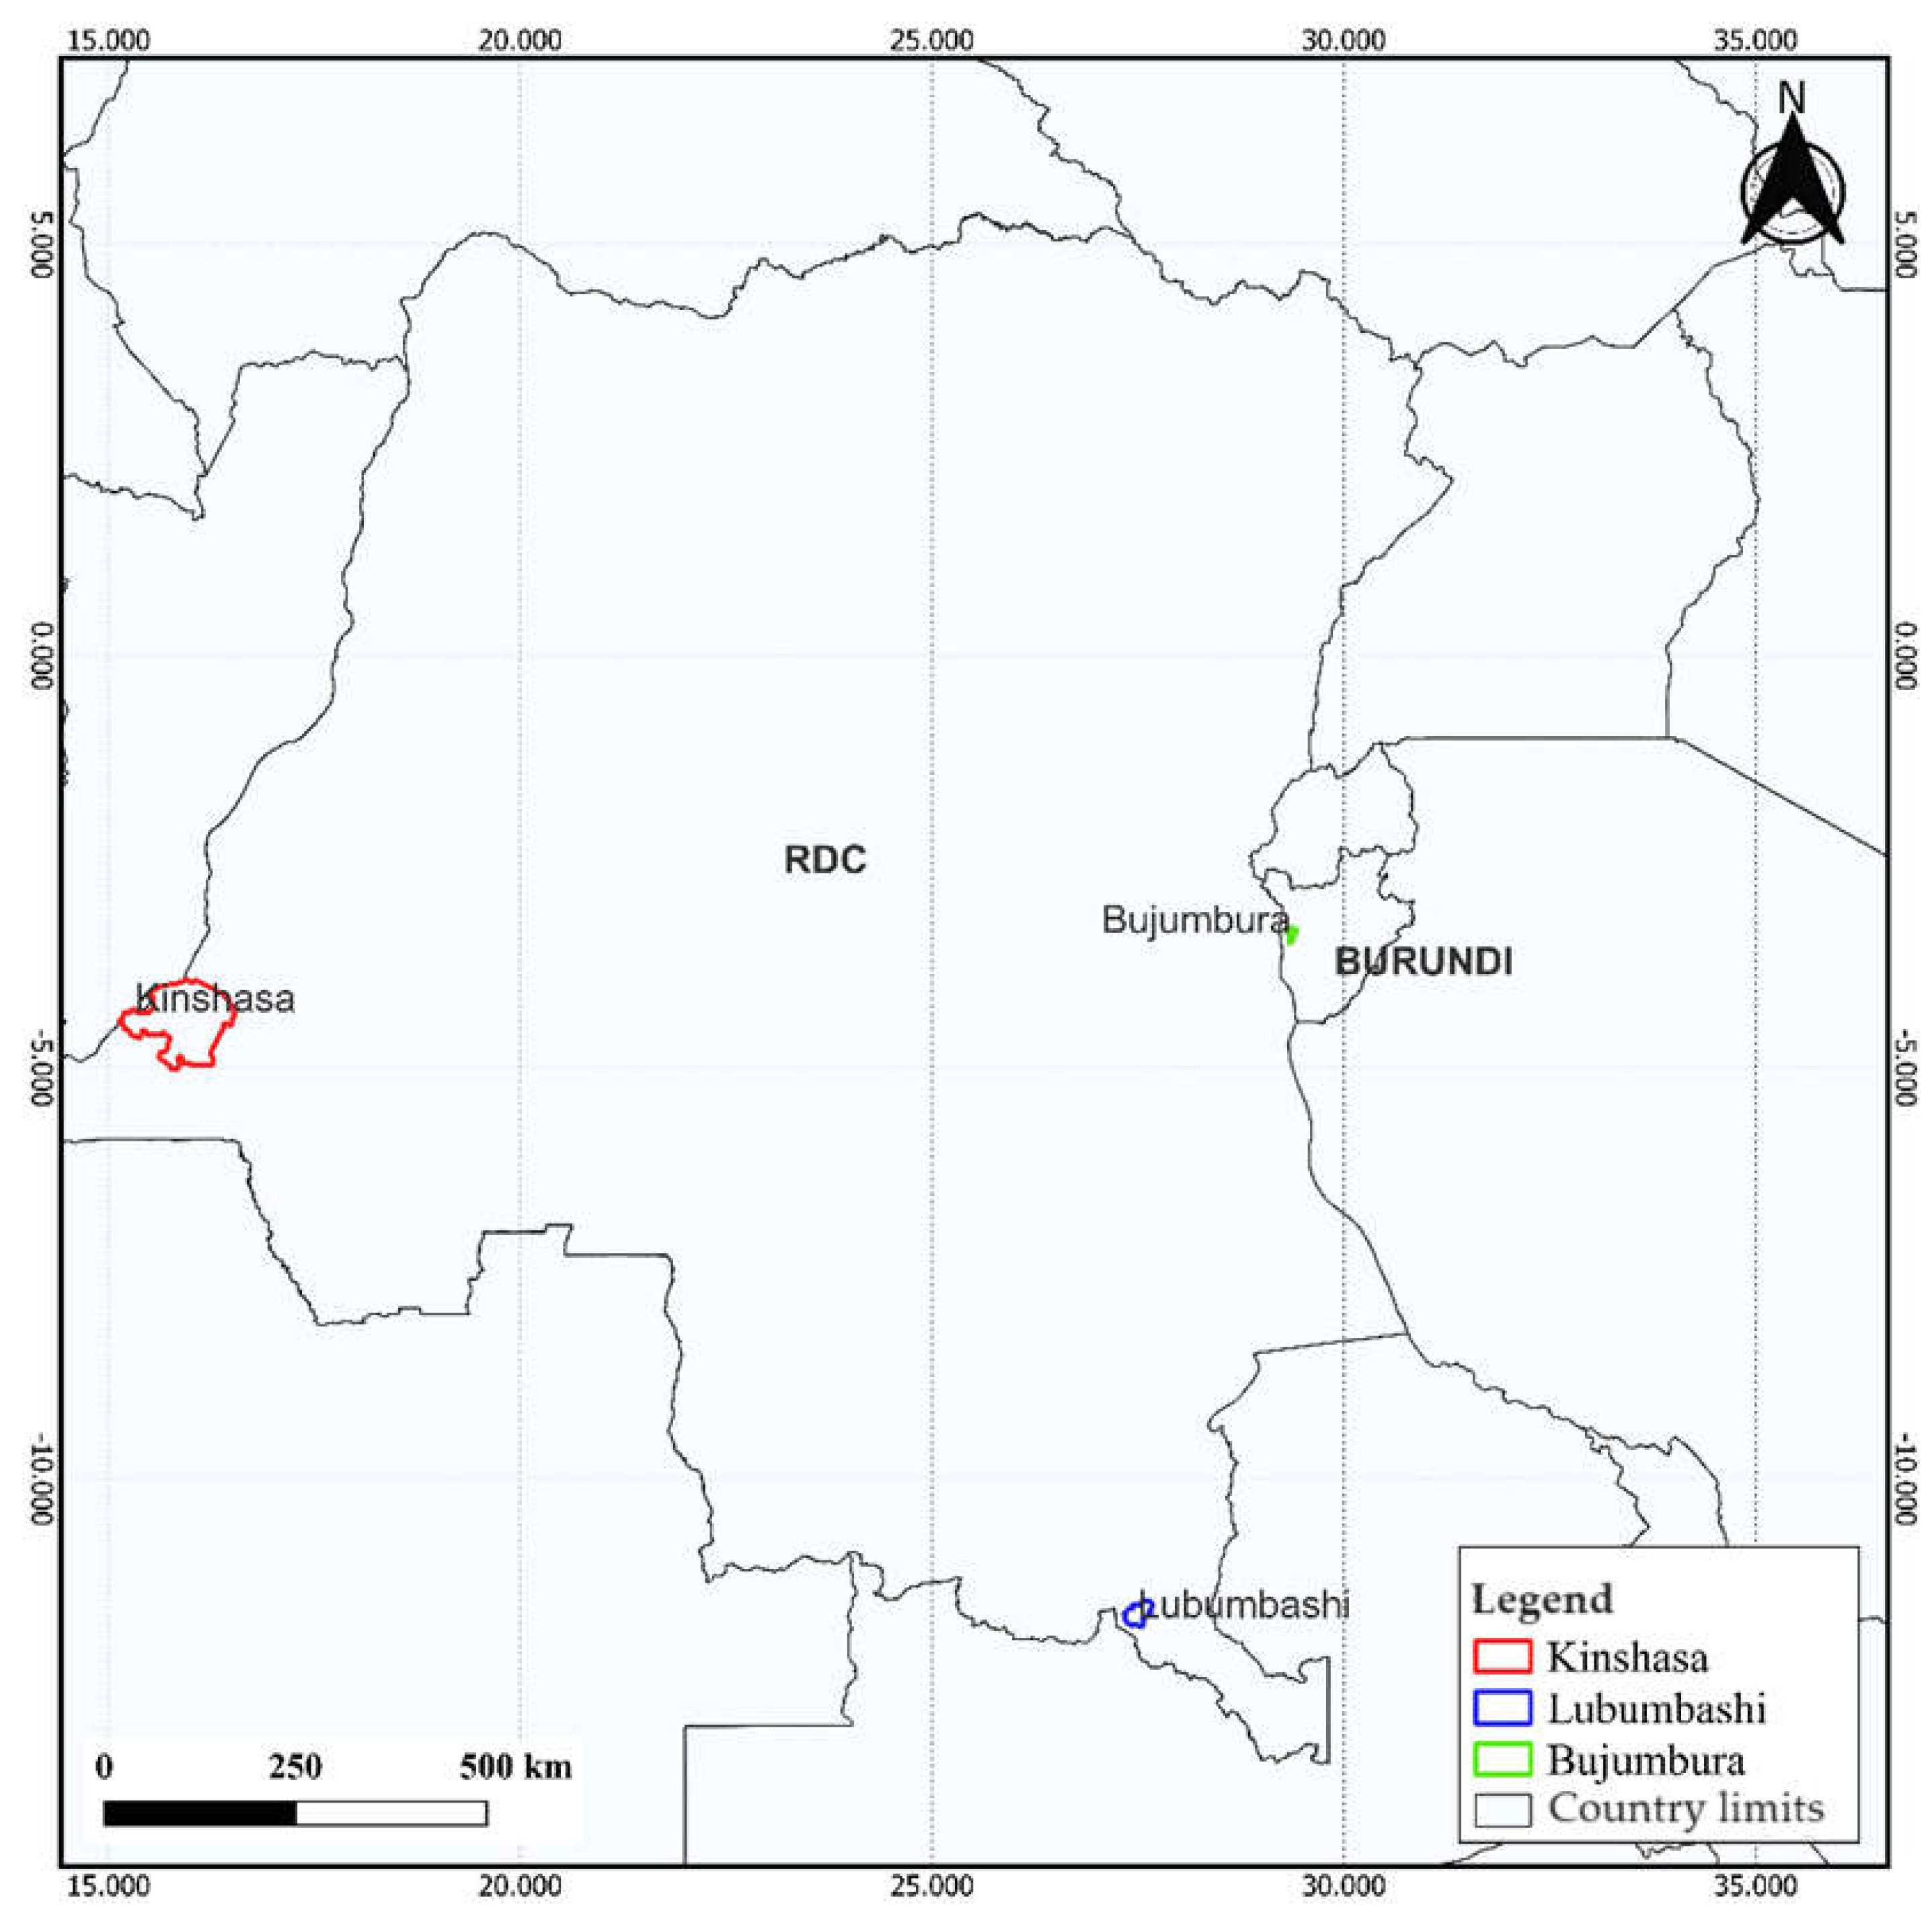
This study is based on three cities: Bujumbura, Kinshasa and Lubumbashi. The city of Bujumbura was founded in 1897 on the shores of Lake Tanganyika by the Germans on a site called Kajaga. It is situated in the western part of the Republic of Burundi, between 3°30' and 3°51' S and 29°31' and 29°42' E. Bujumbura covers 10462 hectares and comprises three communes (Table 1): Muha in the north, Mukaza in the center and Ntahangwa in the south, which are subdivided into 13 administrative entities (Butere, Buyenzi, Bwiza, Cibitoke, Gihosha, kamenge, Kanyosha, Kinama, Kinindo, Musaga, Ngagara, Nyakabiga and Rohero). These entities are set up as urban areas. The city-province of Kinshasa, founded in 1881 by explorer and journalist Henry Morton Stanley on the southern bank of the Pool Malebo, is located in the western part of the Democratic Republic of Congo, between 4°-5° S and 15°-16° E, and covers an area of 9 965 km2. Since 1968, it has been administratively subdivided into 24 communes: Bandalungwa, Barumbu, Bumbu, Gombe, Kaalamu, Kasavubu, Kimbaseke, Kinshasa, Kisenso, Kitambo, Lemba, Limeté, Lingwala, Makala, Maluku, Maiina, Matete, Mont Ngafula, Ngaba, N'djili, Ngaliema, Ngiri-Ngiri, N'sele and Selembao) [13] (Table 1). For this study, the rural commune of Maluku was excluded from the analyses, not only because of its size (it alone covers an area of 82.8% of the entire city of Kinshasa) but also because of the lack of cloud-free multi-temporal images [30]. The city of Lubumbashi and its outskirts are located in the province of Haut-Katanga in the southeastern part of the Democratic Republic of Congo. It covers an area of almost 747 km² and is located between 11°27' and 11°47' S and 27°19' and -27°40' E. It comprises 7 communes, namely: Annexe, Kamalondo, Kampemba, Katuba, Kenya, Lubumbashi and Rwashi. The town was created in 1910 following the discovery and development of large copper deposits by Haut-Katanga Mining Union (HKMU), and is the capital of Haut Katanga province [23] (Table 1).
Figure 1.
Location of Bujumbura in Burundi and Kinshasa and Lubumbashi in the Democratic Republic of the Congo.
Figure 1.
Location of Bujumbura in Burundi and Kinshasa and Lubumbashi in the Democratic Republic of the Congo.
2.2. Selection of Satellite Images.
The cities of Bujumbura, Kinshasa and Lubumbashi were each isolated by three 30 m resolution Landsat images acquired and processed on the Google Earth Engine (GEE) geospatial platform. The median images obtained by selecting the median values of each pixel during the dry season from June to August were used. Landsat 7 Enhanced Thematic Mapper plus (ETM+) and Landsat 8 Operational Land Imager (OLI) sensors were used to obtain images from 2000, 2013 and 2022 respectively. We used surface reflectance data from the Level 2 Collection 2 Tier 1 datasets, collected over a time step of 13 and 9 years, depending on availability, quality and study objectives. The image acquisition period corresponds to the dry season, when cloud cover is low [31]. ArcGis 10.8.1 software was then used to produce thematic maps.
2.3. Image pre-Processing, Processing and Classification
The pre-processing carried out consisted of a cloud mask applied to each data set to create a synthetic image with acceptable cloud cover [32]. The mask used the "QA_PIXEL" band and the Fmask (Function of mask) algorithm, to remove clouds and cloud shadows, hence generating cloud-free composites [33,34].
A false color composition was carried out by combining the near infrared, red and green bands, the first two channels being used to discriminate vegetation [35]. Three relevant land cover classes were selected according to the purpose of the study and the composition of each landscape. These are vegetation (forests, savannahs, fields, fallow lands, green spaces), built-up and bare soil (built-up and bare soil complexes, including mines) and other (sewage and decantation plants, flooded areas, ponds, swamps). For each of these land cover classes, sample polygons representing the training zones (ROIs) were collected on the same platform (GEE) using Google Earth images of finer resolution (1 m). A classification based on the “Random Forest” supervised classification algorithm was then performed using the training model obtained from the selected ROIs [36]. Classifications were validated based on the overall accuracy and the Kappa coefficient derived from six confusion matrices [37]. Kappa values below 50%, between 50-75% and above 75% indicate poor, acceptable and excellent classification, respectively [38]. For each land cover, at least 30 points were used for this assessment.
2.4. Calculation of Spatial Pattern Indices and Detection of Landscape Dynamics
Pattern metrics for each land use class were calculated using the "landscape metrics" and "Landscape tools" packages in R studio 4.2.2. The indices selected provide information on landscape fragmentation [38]. The number of patches belonging to a given class. This index provides information on the fragmentation of a class. A high number of patches in a class may be due to its fragmentation [39]. The total area () occupied by the class (in km2) was calculated according to equation (1) where is the area of patch of class:
The index of the largest patch of class or dominance was calculated using the area of the largest patch ():
With . The higher the dominance value, the less fragmented the class.
The average area of the patches of class was calculated as follows:
The aggregation index indicates the frequency with which pairs of patches of the same class are adjacent [40]. Its value is equal to 0 for maximally disaggregated classes and 100 for maximally aggregated classes [41]:
Where is the number of similar adjacencies based on the single count method and is the maximum number of similar adjacencies per class for this class.
The fractal dimension index, which assesses the relationship between the landscape transformation process and the geometry of the resulting patches, is calculated as follows according to [42]:
Where represents the perimeter, the class area and the fractal dimension. A log-log surface-perimeter plot for a set of patches therefore generates (slope) and (intercept). This technique is based on the analysis of patches of different sizes at a given scale as a "surrogate" for a change of scale [43].
To quantify the dynamics of conversion between land-use classes over the periods considered in the study, two transition matrices were created for each city. The transition matrix, obtained by juxtaposing the land use maps, provides information on the conversion between land uses (row and column proportions) on the one hand, and the stability of land use classes (diagonal) on the other[38]. The stability index was calculated to determine the conversions between the different land-use classes. This index is defined as the ratio of the sum of the diagonal values and the sum of the off-diagonal values of the transition matrix [38]. The underlying spatial transformation processes responsible for the observed changes were identified using the decision tree proposed by [44]. The distinction between fragmentation and dissection was made using the predefined area decrease value [45]. Values less than or equal to 0.75 indicate fragmentation, while values greater than 0.75 suggest dissection [45].
The aggregation index (AI), which illustrates the spatial organization of patches corresponding to land use types, was also calculated. A high IA value indicates adjacent units and therefore aggregated patches [46].
The other index calculated is the fractal dimension index (DF), which indicates that the patches have complex shapes and more tortuous contours when it is higher (approaching 2) and when it is lower (close to 1); this indicates a more regular shape of the patches and smoother contours(anthropogenic) [43].
2.5. Vegetation Index
A variety of vegetation indices have been developed for the purpose of monitoring vegetation distribution and phenology [47]. A variety of vegetation indices have been developed for the purpose of monitoring vegetation distribution and phenology [47,48]. The NDVI is defined as the normalized difference of spectral reflectance measurements acquired in the "Near Infrared (PIR)” and "Red" wavelength zones [47,48,49].
The theoretical value of NDVI varies between -1 and 1. Values below 0.1 are indicative of bodies of water and bare soil, while higher values are associated with high photosynthetic activity, which is typical of shrublands, temperate forests, rainforests, and agricultural land [50]. In practice, an open water surface (ocean, lake, etc.) will exhibit NDVI values close to 0, bare soil will have values of 0.1 to 0.2, while dense vegetation will have values of 0.5 to 0.8 [50].
3. Results
3.1. Satellite Data Analysis: Classification and Mapping (2000 to 2022)
The overall accuracy of supervised classification of Landsat images covering the areas of Bujumbura, Kinshasa and Lubumbashi is between 89% and 99%, with Kappa values between 69% and 97% (Table 2). These values indicate that discrimination between different land-use classes is statistically reliable [51].
A visual analysis of the land-use maps reveals significant spatial changes in the landscape of Bujumbura and Lubumbashi between 2000 and 2013 and 2022. These changes are evidenced by a regression of the "vegetation" class and the "other" class, which have been replaced by the "built-up" class. In contrast, the city of Kinshasa exhibited minimal change (Figure 2).
3.2. Changes in Land Use between 2000 and 2022
Table 2 illustrates the percentage changes between the various land use classes between the years 2000 and 2022 in the cities of Bujumbura, Kinshasa and Lubumbashi. In the cities of Bujumbura and Lubumbashi, the period studied (2000-2022) was characterized by a transition in which the green infrastructure, which constituted the landscape matrix in 2000, was replaced by built-up areas, which became the dominant matrix in 2022. During the period under review, the landscape of Kinshasa underwent no significant modifications, and its green infrastructure remained the dominant matrix in 2022 (Table 3).
For the city of Bujumbura, the period from 2000 to 2013 was marked by a 47.52% increase in built-up and bare soil at the expense of vegetation. The same period was characterized by the conversion of 30.42% of built-up and bare ground and 4.38% of the "other" class to vegetation. At the same time, areas in the "other" class decreased by 1.9% in favour of built-up and bare ground. Between 2013 and 2022, built-up and bare ground expanded by 26.36% at the expense of vegetation. At the same time, 1.69% of built-up and bare ground was converted to vegetation.
The period between 2000 and 2013 was characterized by a significant increase in built-up and bare soil areas in the city of Bujumbura, with a 47.52% expansion at the expense of vegetation. The same period was characterized by the conversion of 30.42% of built-up and bare ground, as well as 4.38% of the "other" category, to vegetation. Concurrently, the "other" category experienced a 1.9% reduction in area with an increase in built-up and bare ground. Between 2013 and 2022, built-up and bare ground expanded by 26.36% at the expense of vegetation. Concurrently, 1.69% of built-up and bare ground was converted to vegetation.
Regarding the city of Lubumbashi, between the years 2000 and 2013, 1.08% of buildings and bare soil, and 3.44% of other areas, were converted to accommodate vegetation. Conversely, 17.9% of built-up and bare ground and 21.65% of the "other" category expanded at the expense of vegetation. Concurrently, the "other" category exhibited an increase of 7.75% at the expense of built-up and bare ground. The period between years 2013 and 2022 is characterized by the conversion of 1.88% of built-up and bare ground and 5.48% of other to vegetation, and of 15.5% of the "other" class to built-up and bare ground. During the same period, 7.54% of the built-up area and soil, and 8.97% of the "other" class, were converted to vegetation. Concurrently, 2.36% of the "other" class was converted to bare ground and buildings.
The preceding data illustrate a notable decline in green infrastructure and an accompanying surge in the surface area of built-up and bare soil within the urban cores of Bujumbura and Lubumbashi between the years 2000 and 2022. In the case of Kinshasa, there was a slight decrease in green infrastructure, but no increase in the surface area of built-up and bare soil. However, there was an increase in the "other" class. A sequence of progression/regression of vegetated surfaces was recorded.
Table 4 illustrates the stability index values for land use classes in the cities of Bujumbura, Kinshasa and Lubumbashi between the years 2000 and 2022. This index exhibits high values in landscapes that have undergone minimal dynamic change.
Over the period 2000-2013, the vegetation stability index for Kinshasa is 25 times that of Bujumbura and 4 times that of Lubumbashi. Over the same period, the value of the stability index for buildings and bare soil in Kinshasa was 20 times that of Bujumbura and 3 times that of Lubumbashi. Furthermore, the stability index for the "other" category is identical for the cities of Kinshasa and Lubumbashi and is 1.5 times that of Bujumbura.
From 2013 to 2022, the vegetation stability index for Kinshasa was sevenfold that of Bujumbura and 5.5 times that of Lubumbashi. Over the same period, the stability index for buildings and bare soil in Kinshasa was found to be twofold that of Bujumbura and Lubumbashi. Conversely, the stability index for the "other" class in Bujumbura was three times that of Kinshasa and Lubumbashi.
From the aforementioned data, it can be observed that vegetation, buildings and bare soil in the city of Kinshasa exhibited minimal change over the period 2000-2022. In contrast, the "other" class demonstrated robust growth in all cities (Table 4).
3.3. Dynamics of the Spatial Structure of Vegetation
In the city of Bujumbura, between 2000 and 2013, the characteristic spatial transformation process of vegetation was the dissection of patches, particularly as the increase in the number of patches was accompanied by a decrease in total area, with a t-value greater than 0.75.
From 2013 to 2022, the characteristic spatial transformation process of vegetation was identified as suppression, which was observed concurrently with a reduction in the number of patches and total area. Between the years 2000 and 2022, the values assigned to dominance of vegetation increased, indicating the existence of areas of undeveloped vegetation on the periphery of the city that had not yet been developed. The Aggregation Index (AI), which illustrates the spatial organization of patches, exhibited a 6.96% decline over the study period. The fractal dimension (FD) approached a value of 1, indicating a reduction in spatial continuity and an increase in anthropization over time.
Between the years 2000 and 2013, the vegetation in the city of Kinshasa exhibited a distinctive pattern characterized by the aggregation of its patches. This was evidenced by a notable increase in the total area of vegetation, which was the result of a simultaneous decrease in the number of patches. From 2013 to 2022, the process of spatial transformation of vegetation was suppression due to a decrease in both the total area and the number of patches. Over the period 2000 to 2022, the values of vegetated area dominance exhibited a slight decline. The aggregation index demonstrated an increase of 1.72% over the period 2000 to 2022, and the fractal dimension reached 1.04. This indicates a high level of vegetation dominance, which is indicative of a slight increase in spatial continuity and a notable rise in anthropization over time.
Regarding the city of Lubumbashi, the prevailing spatial transformation process of vegetation between 2000 and 2013 was suppression. This was characterized by a simultaneous decrease in the total area and number of patches. From 2013 to 2022, the characteristic spatial transformation of vegetation was dissection, with a concomitant increase in the number of patches despite a decrease in total patch area. Between 2000 and 2022, the value of vegetation dominance exhibited a decline, which is indicative of its gradual disappearance due to anthropogenic influence. The aggregation index demonstrated an increase of 7.77% over the study period. The fractal dimension is close to 1, which suggests an increasing level of spatial continuity and anthropization over time (Table 5).
Figure 3 shows the evolution of the spatial structure indices calculated for the vegetation class of the cities of Bujumbura, Kinshasa and Lubumbashi for the years 2000, 2013 and 2022.
3.4. The Normalized Difference Vegetation Index (NDVI)
The maps obtained after calculating the Normalized Difference Vegetation Index (NDVI) for the years 2000, 2013 and 2022 demonstrate that the values vary between -0.22 and 0.85 for the city of Bujumbura, between -0.21 and 0.92 for the city of Kinshasa (DRC) and between -0.50 and 0.83 for the city of Lubumbashi (DRC) (Figure 4).
Figure 5 illustrates the proportions of IV areas over the NDVI intervals identified for each city under study, across the specified time periods of 2000, 2013 and 2022. The evolution of tall vegetation in the city of Bujumbura exhibits a sawtooth pattern, while in the cities of Kinshasa and Lubumbashi, there is a gradual decline.
4. Discussion
4.1. Methodological Approach
While Landsat images are not optimal for examining urbanized landscapes, where a single pixel may encompass disparate land uses, they have nonetheless enabled the fulfillment of the study's objective through the consolidation of land use classes[5]. It is also noteworthy that these images are frequently employed for the mapping of urban landscapes in sub-Saharan Africa [24]. Moreover, any approach to classifying satellite images must be based on knowledge of the reality of field observations, which helps to mitigate the degree of confusion between thematically similar pixels[52]. Based on in situ knowledge acquired during field missions, old maps, Google Earth images and processing on the GEE platform, Kappa values are among the classifications deemed acceptable and excellent in this study [38]. Furthermore, the indices selected in this study, including the number and area of patches, are considered optimal compromises for characterizing landscape configuration [52]. The utilization of the R language and its extensions (packages) was informed by the fact that, since its inception in 1995, it is one of the most prevalent programming languages currently, particularly within the field of ecology. Additionally, it is a language exclusively designed for statistical programming [53]. This methodology has been employed in other countries and contexts. In Rwanda, for instance, the methodology was employed to quantify the physical degradation of forests and to monitor forest cover change and fragmentation [54]. Furthermore, it has been employed for the spatial analysis of urban surface heat islands in four rapidly developing African cities (Ethiopia, Kenya, Nigeria and Zambia) [55]. It is essential for authors to discuss the results and their interpretation in the context of previous studies and the working hypotheses. Additionally, the implications of the findings should be discussed in the broadest possible context. Future research directions may also be highlighted.
4.2. Spatial Structure Indices
Several indices have been put forth with the aim of quantifying and measuring landscape structure [56,57]. The calculation of spatial structure indices serves to elucidate the spatial configuration of class patches within the landscape[58,59]. It is thus possible to calculate a wide range of indices, although this may result in redundant measurements [59]. In this study, we employed indices derived directly from fragmentation. In general ecology and landscape ecology, in particular, habitat fragmentation has emerged as a pivotal theme in conservation research[60]. Indeed, fragmentation results in a reduction in total area and an increase in the number of patches [39]. Furthermore, we considered the dominance of the largest patch in the class, as fragmentation implies fragmentation and therefore a decrease in patch size towards smaller patches of similar size [61]. The mean area value was employed as an indicator of spatial integrity [62]. The shape index was not considered in this study. Indeed, the quantification of shape is a challenging endeavour, as it can give rise to multiple interpretations [63] Furthermore, it is linked to degrees of artificialization [64]. It is also associated with landscape heterogeneity[65]. It can be observed that the value of the shape index is inversely proportional to the degree of elongation or irregularity of the shapes of the patches [66]. In contrast, the fractal dimension index was employed. A higher index value (approaching 2) indicates more complex shapes and contours that are more tortuous and natural. Conversely, a low index value (close to 1) suggests a more regular shape and contours that are smoother and anthropogenic [43]. The aggregation index (AI) was also calculated in this study. This index illustrates the spatial organization of patches corresponding to land use types. A high AI value indicates the presence of adjacent units and, consequently, aggregated patches[46]. This index has been employed in other contexts, including the monitoring of landscape anthropization in the Babagulu forest region (DRC) [67], and the assessment of links between landscape elements, their reciprocal influences and the main transformations observed over time and space for the rational and sustainable management of the Zè commune in Benin[46]. Additionally, this study utilized the stability index, which enables the evaluation of the permanence of the initial landscape [38].
4.3. Standardized Differential Vegetation Index and Green Infrastructure Composition Dynamics
Spectral vegetation indices are among the most widely used satellite data products for assessments of vegetation cover, change and processes[49]). The Normalized Difference Vegetation Index (NDVI) provides estimated values of forest "green intensity" based on the analysis of satellite data. The approach is based on the premise that NDVI is an indicator of plant health, insofar as a degradation of an ecosystem's vegetation, or a decrease in green intensity, would result in a decrease in the NDVI value [50]. Consequently, NDVI values have been employed in a multitude of contexts, including the assessment of vegetation cover variability across Algeria [48], the observation of forest degradation in Mexico [50], he monitoring of climatic variability in the Nakambé watershed in Burkina Faso [68] and the establishment of the link between vegetation NDVI, temperature and precipitation in the upper catchments of the Yellow River in China [69]. In this study, the NDVI was calculated to facilitate a comparison of the health of green infrastructure in the cities of Bujumbura, Kinshasa and Lubumbashi. The NDVI values observed for the cities under investigation exhibited a range between -1 and 1, indicating that the green infrastructure of these cities is not solely comprised of vegetation at high and low levels, but also includes other elements such as water bodies and soils devoid of water [50]. Indeed, the green infrastructure of Bujumbura comprises a variety of elements, including artificial forests [70], green spaces adjacent to roads, playgrounds, green squares, and agricultural areas. [15]. Additionally, it encompasses bare soil, a consequence of land subdivision for new residential developments, particularly in the southern periphery of the city [15]. Furthermore, since the 2020s, the rising waters of Lake Tanganyika have resulted in the formation of swamps in the western part of the coastal city situated on its shores. In addition to the green spaces that date back to the pre-independence period, the city of Kinshasa also encompasses private green spaces, residential green spaces, swampy areas[13], and erosion expansion at the edge of watercourses [71]. Bare soils resulting from urbanization and slash-and-burn agriculture [71] is also noted. In addition to green spaces accompanying roads in the urban part and buffer zones, fields, abandoned areas and informal spaces in peri-urban areas [14], the city of Lubumbashi also features bare surfaces resulting from mining, especially on the outskirts of the city. This presence can be attributed to the destruction of vegetation cover near mining sites, probably due to the developments carried out to establish mining sites [29]. The proportions of the surface areas of the various green infrastructure categories on the NDVI intervals demonstrate variability between cities over the period studied (2000-2023). This variability is evidenced by a sawtooth trend in tall vegetation for the city of Bujumbura and a gradual decrease for the cities of Kinshasa and Lubumbashi.
4.4. Urbanization and Loss of Natural Cover in the Cities of Bujumbura, Kinshasa and Lubumbashi
Urban vegetation plays an instrumental role in the provision of diverse ecosystem services, including the purification of air and water, the regulation of microclimate, and the treatment of waste [72]. Moreover, their presence offers people aesthetic pleasures, recreational opportunities and physical and psychological well-being [23]. It is regrettable that the current rate of urbanization in developing countries [73] is accompanied by the elimination of green spaces and their replacement by anthropogenic land uses [11,58,74,75]. Cities such as Bujumbura in Burundi, Kinshasa and Lubumbashi in the Democratic Republic of the Congo are illustrative of this phenomenon. Indeed, Bujumbura's urbanization is characterized by the conversion of agricultural land for the construction of new neighborhoods [5,76]. Furthermore, the expansion of the city is marked by the gradual destruction of green spaces and other natural ecosystems to make way for new housing and other physical infrastructure, including roads and monuments. Additionally, the vegetation in buffer zones along rivers and Lake Tanganyika has been cleared to accommodate residential development [5,77]. The urban growth of the city of Kinshasa is occurring through the aggregation of built-up areas, which is having a detrimental impact on green zones, including residual green spaces and market gardens [13]. This results in two distinct patterns of urban growth: extreme densification of certain central districts and low-density peripheral extensions [13]. The city of Lubumbashi has experienced a similar expansionary trajectory, with the built-up area extending towards the peri-urban zone, where plot prices are relatively affordable compared to the city center [78]. The regression of green spaces in all communes has been caused by the combination of strong demographic pressure and the absence of a program to preserve them [11,18,27,28,79]. The phenomenon of urban vegetation regression in the wake of rapid and uncontrolled urban spatial growth has also been observed in other African cities, including Abuja in Nigeria[80] Kampala in Uganda [6] and in central Togo [81]. The removal of green infrastructure from the city of Bujumbura can be attributed to the emergence of subdivisions, particularly on the outskirts of the city, which have given rise to new neighborhoods. The increasing evolution of built-up and bare soil [15] is thought to have contributed to the disappearance of green infrastructure in the city of Kinshasa. This is believed to have originated in the destruction of green infrastructure to satisfy the wood energy needs of artisanal pastry businesses and “nganda ntaba” (various corners where kebabs, chicken legs and grilled goat meat are sold) on the one hand, and their use for various constructions on the other [82]. Additionally, the high consumption of wood energy by restaurants, brickmakers, bakeries, and blacksmiths is a contributing factor [82]. With regard to the fragmentation of green infrastructure in the city of Lubumbashi, this is attributable to a combination of factors, including the city's rapid urbanization and the expansion of energy production [83]. Additionally, the fragmentation is a consequence of the patchwork nature of the city's green infrastructure, which comprises green spaces alongside roads in the urban area and buffer zones, fields, abandoned areas and informal spaces in the peri-urban zones [14]. The urban expansion of the cities of Lubumbashi and Kinshasa and the resulting quest for wood energy are threatening the protected areas around these cities. In the city of Bujumbura, it is specifically peri-urban agriculture that is under threat.
5. Conclusion
The present study employed a comparative analysis of the green infrastructure of the cities of Bujumbura, Kinshasa and Lubumbashi to ascertain whether there were any points of similarity. The results of the spatial structure indices demonstrated that the green infrastructure of the cities of Bujumbura and Kinshasa is distinguished by the suppression of patches and a fragmentation phenomenon observed in the patches of the city of Lubumbashi. These findings substantiate our hypothesis that the green infrastructure of these three cities exhibits a distinctive dynamic. Furthermore, the mean area of the green infrastructure in Bujumbura and Kinshasa increased slightly, by 12% and 14% respectively, while that of Lubumbashi decreased significantly, by 77%. Furthermore, the dominance values for Bujumbura increased by 117%. Conversely, this value decreased for Kinshasa and Lubumbashi by 2% and 66%, respectively. Additionally, the stability index values indicated that Kinshasa exhibited weak dynamics, in contrast to Bujumbura and Lubumbashi. The aggregation index indicates a declining continuity of patches in Bujumbura, while Kinshasa and Lubumbashi demonstrate an aggregation of patches. The fractal dimension index provides insight into the extent of human impact on the green infrastructure of the three cities. However, the NDVI values demonstrated a distinctive sawtooth evolution of tall vegetation for the city of Bujumbura, while exhibiting a gradual decrease for the cities of Kinshasa and Lubumbashi. The findings underscore the necessity for urban growth planning to guarantee that our cities are furnished with an adequate, multifunctional, and interconnected green infrastructure. The concern extends beyond the protection of urban biodiversity to encompass the sustainability of associated ecosystem services. Indeed, the greening of cities is the source of their social, environmental, and economic benefits, making the preservation and enhancement of our cities' natural capital a necessity.
Author Contributions
Conceptualization, H.K and J.B.; methodology, H.K., N.C.C., H.K.M., S.W., K.R.S., Y.U.S and J.B ; software, H.K, D.M., N.C.C., H.K.M and W.S.; validation, H.K., Y.U.S., K.R.S. and J.B.; formal analysis, H.K, S.W, N.C.C.,H.K.M.; investigation, H.K., H.K.M., N.C.C., and K.R.S.; resources, H.K , H.K.M, N.C.C. and K.R.S.; writing—original draft preparation, H.K.; writing—review and editing, H.K, N.C.C, DM, L.M.P.,S.W., K.R.S , Y.U.S., T.M. and J.B.; visualization, H.K and J.B..; supervision, H.K, Y.U.S, K.R.S, T.M and J.B; Project administration, H.K, T.M and J.B; funding acquisition, J.B. All authors have read and agreed to the published version of the manuscript.
Funding
This research was funded by the Académie de Recherche et d’Enseignement Supérieur-Commission de la Coopération au Développement (ARES-CCD, PSRCI-UB programme).
Data Availability Statement
Not applicable.
Acknowledgments
We would like to thank all the co-authors for providing the information that made this comparative study possible.
Conflicts of Interest
The authors declare no conflict of interest.
References
- OECD/CSAO. Cahiers de l’Afrique de l’Ouest: Dynamiques de l’urbanisation Africaine 2020: Africapolis, Une Nouvelle Géographie urbaine, Cahiers de l'Afrique de l'Ouest; Editions OCDE, Paris; 2020; ISBN 9789264349025.
- Angel, S.; Parent, J.; Civco, D.L.; Blei, A.; Potere, D. The Dimensions of Global Urban Expansion: Estimates and Projections for All Countries, 2000-2050. Prog. Plann. 2011, 75, 53–107. [Google Scholar] [CrossRef]
- Sanyal. The End of Population Growth. Deu. Ban. 2011, 1–13.
- Halleux, J.-M. Les Territoires Périurbains et Leur Développement Dans Le Monde : Un Monde En Voie d’urbanisation et de Périurbanisation. In Territoires périurbains: Développement, enjeux et Perspectives dans les pays du Sud ; Bogaert, J., Halleux, J.M., Eds.; Presses Agronomiques de Gembloux: Gemblox, Belgium, 2015, pp.43-61.
- Kabanyegeye, H.; Sikuzani, Y.U.; Sambieni, K.R.; Masharabu, T.; Bogaert, J. Trente-Trois Ans de Dynamique Spatiale de l’occupation Du Sol de La Ville de Bujumbura, République Du Burundi. Afrique Sci. Rev. Int. des Sci. Technol. 2021, 18, 203–2015. [Google Scholar]
- Vermeiren, K.; Van Rompaey, A.; Loopmans, M.; Serwajja, E.; Mukwaya, P. Urban Growth of Kampala, Uganda: Pattern Analysis and Scenario Development. Landsc. Urban Plan. 2012, 106, 199–206. [Google Scholar] [CrossRef]
- Schäffler, A.; Swilling, M. Valuing Green Infrastructure in an Urban Environment under Pressure - The Johannesburg Case. Ecol. Econ. 2013, 86, 246–257. [Google Scholar] [CrossRef]
- Bogaert, J.; Vranken, I.; Andre, M. Biocultural Landscapes. Biocultural Landscapes 2014. [Google Scholar] [CrossRef]
- Madureira, H.; Cormier, L. La Complexité de l ’ Application Du Concept d ’ Infrastructure Verte à l ’ Échelle Locale : Exemples de Paris et Porto. Urbanités biodiversité. Entre villes fertiles campagnes urbaines, quelle place pour la biodiversité ? 2017, Hal-01597292.
- Osseni, A.A.; Mouhamadou, T.; Tohoain, B.A.C.; Sinsin, B. SIG et Gestion Des Espaces Verts Dans La Ville de Porto-Novo Au Benin. Tropicultura 2015, 332, 146–156. [Google Scholar]
- Sikuzani, Y.U.; Kaleba, S.C.; Khonde, C.N.; Mwana, Y.A.; Malaisse, F.; Bogaert, J.; Kankumbi, F.M. Vingt-Cinq Ans de Monitoring de La Dynamique Spatiale Des Espaces Verts En Réponse á l'Urbanisation Dans Les Communes de La Ville de Lubumbashi (Haut-Katanga, R.D. Congo). Tropicultura 2017, 35, 300–311.
- du Toit, M.J.; Cilliers, S.S.; Dallimer, M.; Goddard, M.; Guenat, S.; Cornelius, S.F. Urban Green Infrastructure and Ecosystem Services in Sub-Saharan Africa. Landsc. Urban Plan. 2018, 180, 249–261. [Google Scholar] [CrossRef]
- Sambieni, K. R. , Sikuzani, Y. U., Kaleba, C., Moyene, A. B., Kankumbi, F. M., Nzuzi, F. L., Occhiuto, R, Bogaert, J. Les Espaces Verts En Zone Urbaine et Périurbaine de Kinshasa En République Démocratique Du Congo. Tropicultura 2018, 36, 478–491.
- Sikuzani, Y.U.; Sambiéni, K.R.; Maréchal, J.; Ilunga wa Ilunga, E.; Malaisse, F.; Bogaert, J.; Munyemba, K. F. Changes in the Spatial Pattern and Ecological Functionalities of Green Spaces in Lubumbashi (the Democratic Republic of Congo) in Relation With the Degree of Urbanization. Trop. Conserv. Sci. 2018, 11, 194008291877132. [Google Scholar] [CrossRef]
- Kabanyegeye, H.; Masharabu, T.; Sikuzani, Y.U.; Bogaert, J. Perception Sur Les Espaces Verts et Leurs Services Écosystémiques Par Les Acteurs Locaux de La Ville de Bujumbura (République Du Burundi). Tropicultura 2020, 38, 1–17. [Google Scholar]
- Gashu, K.; Egziabher, T.G. Spatiotemporal Trends of Urban Land Use / Land Cover and Green Infrastructure Change in Two Ethiopian Cities : Bahir Dar and Hawassa. Environ. Syst. Res. 2018. [Google Scholar] [CrossRef]
- Fomba, M.; Osunde, Z.D.; Sidi, S.; Okhimamhe, A.; Kleemann, J.; Fürst, C. Changes and Perceptions. L. 2024, 13, 1–20. [Google Scholar]
- Useni, Y.S.; Malaisse, F.; Yona, J.M.; Mwamba, T.M.; Bogaert, J. Diversity, Use and Management of Household-Located Fruit Trees in Two Rapidly Developing Towns in Southeastern D. R. Congo. Urb. For. Urb.Gr.. 2021, 63, 127220. [Google Scholar] [CrossRef]
- Turner, S.C.; Turner, R.N. Capital Cities: A Special Case in Urban Development. Ann. Reg. Sci. 2011, 46, 19–35. [Google Scholar] [CrossRef]
- Washbourne, C. Environmental Policy Narratives and Urban Green Infrastructure: Reflections from Five Major Cities in South Africa and the UK. Envir. Scie. & Pol. 2022,129, 96-106.
- Delgado-Capel, M.; Cariñanos, P. Towards a Standard Framework to Identify Green Infrastructure Key Elements in Dense Mediterranean Cities. Forests 2020, 11, 1–22. [Google Scholar] [CrossRef]
- Pasquini, L.; Enqvist, J. Green Infrastructure in South African Cities. Report for CSP, African Centre for Cities, National Treasury, South Africa 2019.
- Useni, Y.S. Analyse Spatio-Temporelle Des Dynamiques d’anthropisation Paysagère Le Long Du Gradient Urbain-Rural de La Ville de Lubumbashi (Haut-Katanga, République Démocratique Du Congo). Ph.D.Thesis, Université de Lubumbashi République Démocratique du Congo, 2017.
- Messina Ndzomo, J.P.; Sambieni, K.R.; Mbevo Fendoung, P.; Mate Mweru, J.P.; Bogaert, J.; Halleux, J.M. La Croissance De L’Urbanisation Morphologique À Kinshasa Entre 1979 Et 2015: Analyse Densimétrique Et De La Fragmentation Du Bâti. BSGLg 2019, 73, 85–103. [Google Scholar] [CrossRef]
- Bigirimana, J. Urban Plant Diversity Patterns, Processes and Conservation Value in Sub-Saharan Africa: Case of Bujumbura in Burundi, Ph.D. Thesis, Université libre de Bruxelles, Brussels, Belgium, 2012. [Google Scholar]
- Kabanyegeye, H.; Ndayishimiye, J.; Hakizimana, P.; Masharabu, T.; Malaisse, F.; Bogaert, J. Diversité Floristique et Statut de Conservation Des Espaces Verts de La Ville de Bujumbura (Burundi) Floristic Diversity and Conservation Status of Species in Green Spaces in the City of Bujumbura (Burundi). Geo. Eco. Trop. 2022, 46, 15–28. [Google Scholar]
- Maréchal, J. , Useni, S. Y., Bogaert, J., Munyemba, K. F., & Mahy, G. La Perception Par Des Experts Locaux Des Espaces Verts et de Leurs Services Écosystémiques Dans Une Ville Tropicale En Expansion : Le Cas de Lubumbashi. In Anthropisation des paysages Katangais; Bogaert, J., Colinet, G., Mahy, G., Ed.; Liège-Belgique, 2018; pp. 59–69.
- Sikuzani, Y.U.; Mpibwe Kalenga, A.; Yona Mleci, J.; N’Tambwe Nghonda, D.; Malaisse, F.; Bogaert, J. Assessment of Street Tree Diversity, Structure and Protection in Planned and Unplanned Neighborhoods of Lubumbashi City (DR Congo). Sustain. 2022, 14. [Google Scholar] [CrossRef]
- Sikuzani, Y.U.; Boisson, S.; Kaleba, S.C.; Khonde, C.N.; Malaisse, F.; Halleux, J.-M.; Bogaert, J.; Kankumbi, F.M. Dynamique de l’occupation Du Sol Autour Des Sites Miniers Le Long Du Gradient Urbain-Rural de La Ville de Lubumbashi, RD Congo. Base 2019, 24, 14–27. [Google Scholar] [CrossRef]
- Sambieni, K.R. Dynamique Du Paysage de La Ville Province de Kinshasa Sous La Pression de La Périurbanisation: L’infrastructure Verte Comme Moteur d’aménagement. Ph.D. Thesis, Ecole régionale post-universitaire d'Aménagement et de gestion intégrée des forêts et territoires tropicaux, Kinshasa, Republique Démocratique du Congo et Université de Liège,Brussels, Belgium, 2020.
- Salmon, M.; Ozer, A.; Pissart, A. Les Images Satellitaires Prises En Période de Sécheresse, Outil Utile Pour La Cartographie Géologique de La Belgique. Bull. la Soc. Géo. Liège 2007, 49, 67–74.
- Nicolas Soucy-Gonthier, Danielle Marceau, M.D.; Alain Cogliastro, G.D. et A.B. Détection de l’évolution Des Superficies Forestières En Montérégie Entre Juin 1999 et Août 2002 à Partir d’images Satellitaires LandSat-TM; Montréal, Canada, 2003.
- Zurqani, H. A. , Post, C. J., Mikhailova, E. A., Schlautman, M. A., & Sharp, J.L. Geospatial Analysis of Land Use Change in the Savannah River Basin Using Google Earth Engine. Int. J. Appl. earth Obs. Geoinf. 2018, 69, 175–185.
- Zhu, Z.; Woodcock, C.E. Object-Based Cloud and Cloud Shadow Detection in Landsat Imagery. Remote Sens. Environ. 2012, 118, 83–94. [Google Scholar] [CrossRef]
- Barima, Y.S.S.; Barbier, N.; Bamba, I.; Traoré, D.; Lejoly, J.; Bogaert, J. Dynamique Paysagère En Milieu de Transition Forêt-Savane Ivoirienne. Bois Forets Des Trop. 2009, 299, 15. [Google Scholar] [CrossRef]
- Floreano, I. X. , & de Moraes, L.A.F. Land Use/Land Cover (LULC) Analysis (2009–2019) with Google Earth Engine and 2030 Prediction Using Markov-CA in the Rondônia State, Brazil. Environ. Monit. Assess. 2021, 193, 239.
- Girard, M. C., & Girard, C.M. Traitement Des Données de Télédétection; Environnem.; Paris, 2010.
- Bogaert, J.; Vranken, I.; Andre, M. Anthropogenic Effects in Landscapes: Historical Context and Spatial Pattern. Bio. Landsc. 2014. [Google Scholar] [CrossRef]
- Davidson, C. Issues in Measuring Landscape Fragmentation. Wildl. Soc. Bull. 1998, 32–37. [Google Scholar]
- Bogaert, J.; Myneni, R.B.; Knyazikhin, Y. The Shape Index. Landsc. Ecol. 2002, 85443, 1–4. [Google Scholar]
- Hesselbarth, M.H.K.; Scianini, M; With, K.A.; Wiegand, K.; Nowosad, J. Landscaperemetrics: An Open-Source R Tool to Calculae Landscape Matrics. Ecogr. 2019, 1648–1657. [CrossRef]
- Diallo, H. , Bamba I., Barima Y.S.S., Visser M., B.; A., Mama A., Vranken I., M.M.&; J., B. Effets Combinés Du Climat et Des Pressions Anthropiques Sur La Dynamique Évolutive de La Dégradation d’une Aire Protégée Du Mali (La Réserve de Fina, Boucle Du Baoulé). Scie. et chang. plan./Séch. 2011, 22, 97-107.
- Bogaert, J.; Barima, Y.S.S.; Mongo, L.I.W.; Bamba, I.; Mama, A.; Toyi, M.; Lafortezza, R. Forest Fragmentation: Causes, Ecological Impacts and Implications for Landscape Management. Landsc. Ecol. For. Manag. Conserv. 2011, 273–296. [Google Scholar] [CrossRef]
- Bogaert, J.; Ceulemans, R.; Salvador-Van Eysenrode, D. Decision Tree Algorithm for Detection of Spatial Processes in Landscape Transformation. Environ. Manage. 2004, 33, 62–73. [Google Scholar] [CrossRef]
- de Haulleville, T.; Rakotondrasoa, O.L.; Rakoto Ratsimba, H.; Bastin, J.F.; Brostaux, Y.; Verheggen, F.J.; Rajoelison, G.L.; Malaisse, F.; Poncelet, M.; Haubruge, É.; beeckman, H. ; Bogaert,J. Fourteen Years of Anthropization Dynamics in the Uapaca Bojeri Baill. Forest of Madagascar. Landsc. Ecol. Eng. 2018, 14, 135–146. [Google Scholar] [CrossRef]
- Tente, O.; Oloukoi, J.; Toko, I.; Tente, O.; Oloukoi, J.; Toko, I. Dynamique Spatiale et Structure Du Paysage Dans La Commune de Zè, Bénin. In OSFACO Conference: Satellite images for sustainable land management in Africa, 2019.
- Vani, V.; Mandla, V.R. Comparative Study of NDVI and SAVI Vegetation Indices in Anantapur District Semi-Arid Areas. Int. J. Civ. Eng. Technol. 2017, 8, 559–566. [Google Scholar]
- Razagui, A. , & Bachari, N.E.I. Spatio-Temporal Analysis of NDVI Vegetation Index Calculated from NOAA and MSG Satellite Images. J. Renew. Energies, 2014, 17, 497–506.
- Huete, A.; Didan, K.; Leeuwen, W. Van; Miura, T.; Glenn, E. Land Remote Sensing and Global Environmental Change: NASA’s Earth Observing System and the Science of ASTER and MODIS. 2011, 894. [CrossRef]
- Meneses-Tovar, C.L. L’indice Différentiel Normalisé de Végétation Comme Indicateur de La Dégradation. Unasylva 2011, 62, 39–46. [Google Scholar]
- Landis, J.R.; Koch, G.G. The Measurement of Observer Agreement for Categorical Data Data for Categorical of Observer Agreement The Measurement. 2012, 33, 159–174.
- G. M. Foody Assessing the Accuracy of Land Cover Change with Imperfect Ground Rerefence Data. Remote Sens. Envirnement 2010, 144, 2271–2285.
- Hesselbarth, M.H.K.; Nowosad, J.; Signer, J.; Graham, L.J. Open-Source Tools in R for Landscape Ecology. Curr. Landsc. Ecol. Reports 2021, 6, 97–111. [Google Scholar] [CrossRef]
- Kayiranga, A.; Kurban, A.; Ndayisaba, F.; Nahayo, L.; Karamage, F.; Ablekim, A.; Li, H.; Ilniyaz, O. Monitoring Forest Cover Change and Fragmentation Using Remote Sensing and Landscape Metrics in Nyungwe-Kibira Park. J. Geosci. Environ. Prot. 2016, 04, 13–33. [Google Scholar] [CrossRef]
- Simwanda, M.; Ranagalage, M.; Estoque, R.C.; Murayama, Y. Spatial Analysis of Surface Urban Heat Islands in Four Rapidly Growing African Cities. Remote Sens. 2019, 11, 1–20. [Google Scholar] [CrossRef]
- Forman,R. T.T. Some General Principles of Landscape and Regional Ecology. Landsc. Ecol. 1995, 10, 133–142.
- Burel, F.; Baudry, J. Ecologie Du Paysage. Concepts, Méthodes et Applications; Tec & Doc.; Paris, France. 2003. [Google Scholar]
- Bogaert, J.; Bamba, I.; Koffi, K.J.; Sibomana, S.; Djibu, J.K.; Champluvier, D.; Robbrecht, E.; Visser, M.N. Fragmentation of Forest Landscapes in Central Africa : Causes , Consequences and Management. In Patterns and processes in forest landscapes: Multiple use and sustainable management; Dordrecht: Springer Netherlands, 2008; pp. 67–87. [Google Scholar]
- Bogaert, J.; Mahamane, A. Ecologie du Paysage : Cibler la Configur ation et l ’ Echelle Spatiale. Ann. des Sci. Agron. du Bénin 2005, 7, 1–18.
- Haila, Y. A Conceptual Genealogy of Fragmentation Research: From Island Biogeography to Landscape Ecology. Ecol. Appl. 2002, 12, 321–334. [Google Scholar] [CrossRef]
- Mouhamadou, I.T.; Imorou, I.T.; Sinsin, B. Perceptions locales des déterminants de la fragmentation des îlots de forêts denses dans la région des Monts Kouffé au Bénin. J. of Appl. Bio. 2022, 66, 5049–5059. [Google Scholar] [CrossRef]
- Kabulu, D.J.; Bamba, I.; Munyemba, K.F.; Defourny, P.; Vancutsem, C.; Nyembwe, N.S.; Ngongo, L.M.; Bogaert, J. Analyse de La Structure Spatiale Des Forêts Au Katanga. Ann. la Fac. des Sci. Agron. Univ. Lubumbashi 2015, 12–18. [Google Scholar]
- Ducrot, D. Méthodes d’analyses et d’interprétation d’images de Télédétection Multisource. Extraction de Caractéristiques Du Paysage, Toulouse, France, 2005.
- Mouhamadou, I.T.; Touré, F.; Imorou, I.T.; Sinsin, B. Indices de Structures Spatiales Des Îlots de Forêts Denses Dans La Région Des Monts Kouffé. VertigO 2012, 1–17. [Google Scholar] [CrossRef]
- Delcros, P. Ecologie Du Paysage et Dynamique Végétale Post-Culturale; 1994; Vol. 13; ISBN 2853623823.
- Bogaert, J.; Rousseau, R.; Van Hecke, P.; Impens, I. Alternative Area-Perimeter Ratios for Measurement of 2D Shape Compactness of Habitats. Appl. Math. Comput. 2000, 111, 71–85. [Google Scholar] [CrossRef]
- Kabuanga, J.M.; Adipalina Guguya, B.; Ngenda Okito, E.; Maestripieri, N.; Saqalli, M.; Rossi, V.; Iyongo Waya Mongo, L. Suivi de l’anthropisation Du Paysage Dans La Région Forestière de Babagulu, République Démocratique Du Congo. VertigO 2020, 20, 0–27. [Google Scholar] [CrossRef]
- Diello, P.; Mahe, G.; Paturel, J.-E.; Dezetter, A.; Delclaux, F.; Servat, E.; Ouattara, F. Relations Indices de Végétation–Pluie Au Burkina Faso: Cas Du Bassin Versant Du Nakambé/Relationship between Rainfall and Vegetation Indexes in Burkina Faso: A Case Study of the Nakambé Basin. Hydrol. Sci. J. 2005, 50. [Google Scholar] [CrossRef]
- Hao, F.; Zhang, X.; Ouyang, W.; Skidmore, A.K.; Toxopeus, A.G. Vegetation NDVI Linked to Temperature and Precipitation in the Upper Catchments of Yellow River. Environ. Model. Assess. 2012, 17, 389–398. [Google Scholar] [CrossRef]
- Bangirinama, F.; Nzitwanayo, B.; Hakizimana, P. Utilisation Du Charbon de Bois Comme Principale Source d’énergie de La Population Urbaine : Un Sérieux Problème Pour La Conservation Du Couvert Forestier Au Burundi. Bois Forets des Trop. 2016, 8, 45–53. [Google Scholar] [CrossRef]
- Mavunda, C.A.; Kanda, M.; Folega, F.; Egbelou, V.; Bosela, B.; Drazo, N.A.; Yoka, J.; Dourma, M. Dynamique Spatio-Temporelle Des Changements d ’ Occupation Du Sol Sous Incidence Anthropique Dans La Ville de Kinshasa ( RDC ) de 2001 à 2021. Geo-Eco-Trop 2022, 137–148.
- Bolund, P.; Hunhammar, S. Ecosystem Services in Urban Areas. Ecol. ec. 1999, 29, 293–301. [Google Scholar] [CrossRef]
- Attoumani, A.; Victor, R.; Randriamampandry, C. La Croissance de La Ville d ’ Antananarivo et Ses Conséquences. Madamines 2019, 1, 1–25. [Google Scholar]
- Kong, F.; Nakagoshi, N. Spatial-Temporal Gradient Analysis of Urban Green Spaces in Jinan, China. Land. and urb. Plan. 2006, 78, 147–164. [Google Scholar] [CrossRef]
- Mcdonald, R.I.; Forman, R.T.T.; Kareiva, P. Open Space Loss and Land Inequality in United States ’ Cities, 1990 – 2000. PLoS One 2010, 5(3), e9509. [Google Scholar] [CrossRef]
- Toyi, O. Politiques Publiques Urbaines De L ’ Habitat Dans La Ville De Bujumbura De 1962 a 2009. Ph.D. Thesis, Université de Pau et des Pays de l'Adour, Pau, France, 2012. [Google Scholar]
- Kabanyegeye, H.; Sikuzani, Y.U.; Sambieni, K.R.; Mbarushimana, D.; Masharabu, T.; Bogaert, J. Analysis of Anthropogenic Disturbances of Green Spaces along an Urban–Rural Gradient of the City of Bujumbura (Burundi). Land 2023, 12. [Google Scholar] [CrossRef]
- Sikuzani, Y.U.; Kaleba, S.C.; Halleux, J.M.; Bogaert, J.; Kankumbi, F.M. Caractérisation de La Croissance Spatiale Urbaine de La Ville de Lubumbashi (Haut-Katanga, R.D. Congo) Entre 1989 et 2014. Tropicultura 2018, 36, 99–108.
- Sikuzani, Y.U.; Malaisse, F.; Cabala Kaleba, S.; Kalumba Mwanke, A.; Yamba, A.M.; Nkuku Khonde, C.; Bogaert, J.; Munyemba Kankumbi, F. Tree Diversity and Structure on Green Space of Urban and Peri-Urban Zones: The Case of Lubumbashi City in the Democratic Republic of Congo. Urban For. Urban Green. 2019, 41, 67–74. [Google Scholar] [CrossRef]
- Ujoh, F.; Dlama, K.I.; Oluseyi, I.O. Urban Expansion and Vegetal Cover Loss in and around Nigeria ’ s Federal Capital City. J. Ecol. Nat. Environ. 2011, 3, 1–10. [Google Scholar]
- Koumoi, Z.; Alassane, A.; Djangbedja, M.; Boukpessi, T.; Kouya, A.-E. Dynamique Spatio-Temporelle de l’occupation Du Sol Dans Le Centre-Togo. Rev. Géographie du LARDYMES, Univ. Lomé 2013, 7, 163–172.
- Tungi, J.; Luzolo, T.; Ngembo, E.N.; Masivi, C.L.; Landu, E.L.; Kibwila, M.N. Pression Exercée Par Les Entreprises Pâtissières Artisanales et Nganda Ntaba Sur La Végétation Arborée Urbaine et Périurbaine à Kinshasa En République Démocratique Du Congo. Int. J. of Inn. and Sci. Res. 2022, 62, 25–39. [Google Scholar]
- Muteya, H.K.; Nghonda, D.D.N.; Malaisse, F.; Waselin, S.; Sambiéni, K.R.; Kaleba, S.C.; Kankumbi, F.M.; Bastin, J.F.; Bogaert, J.; Sikuzani, Y.U. Quantification and Simulation of Landscape Anthropization around the Mining Agglomerations of Southeastern Katanga (DR Congo) between 1979 and 2090. Land 2022, 11. [Google Scholar] [CrossRef]
Figure 2.
Land use maps of Bujumbura (Burundi), Kinshasa and Lubumbashi (DRC) from supervised classification of Landsat images from 2000, 2013 and 2022 based on the Random Forest algorithm.
Figure 2.
Land use maps of Bujumbura (Burundi), Kinshasa and Lubumbashi (DRC) from supervised classification of Landsat images from 2000, 2013 and 2022 based on the Random Forest algorithm.
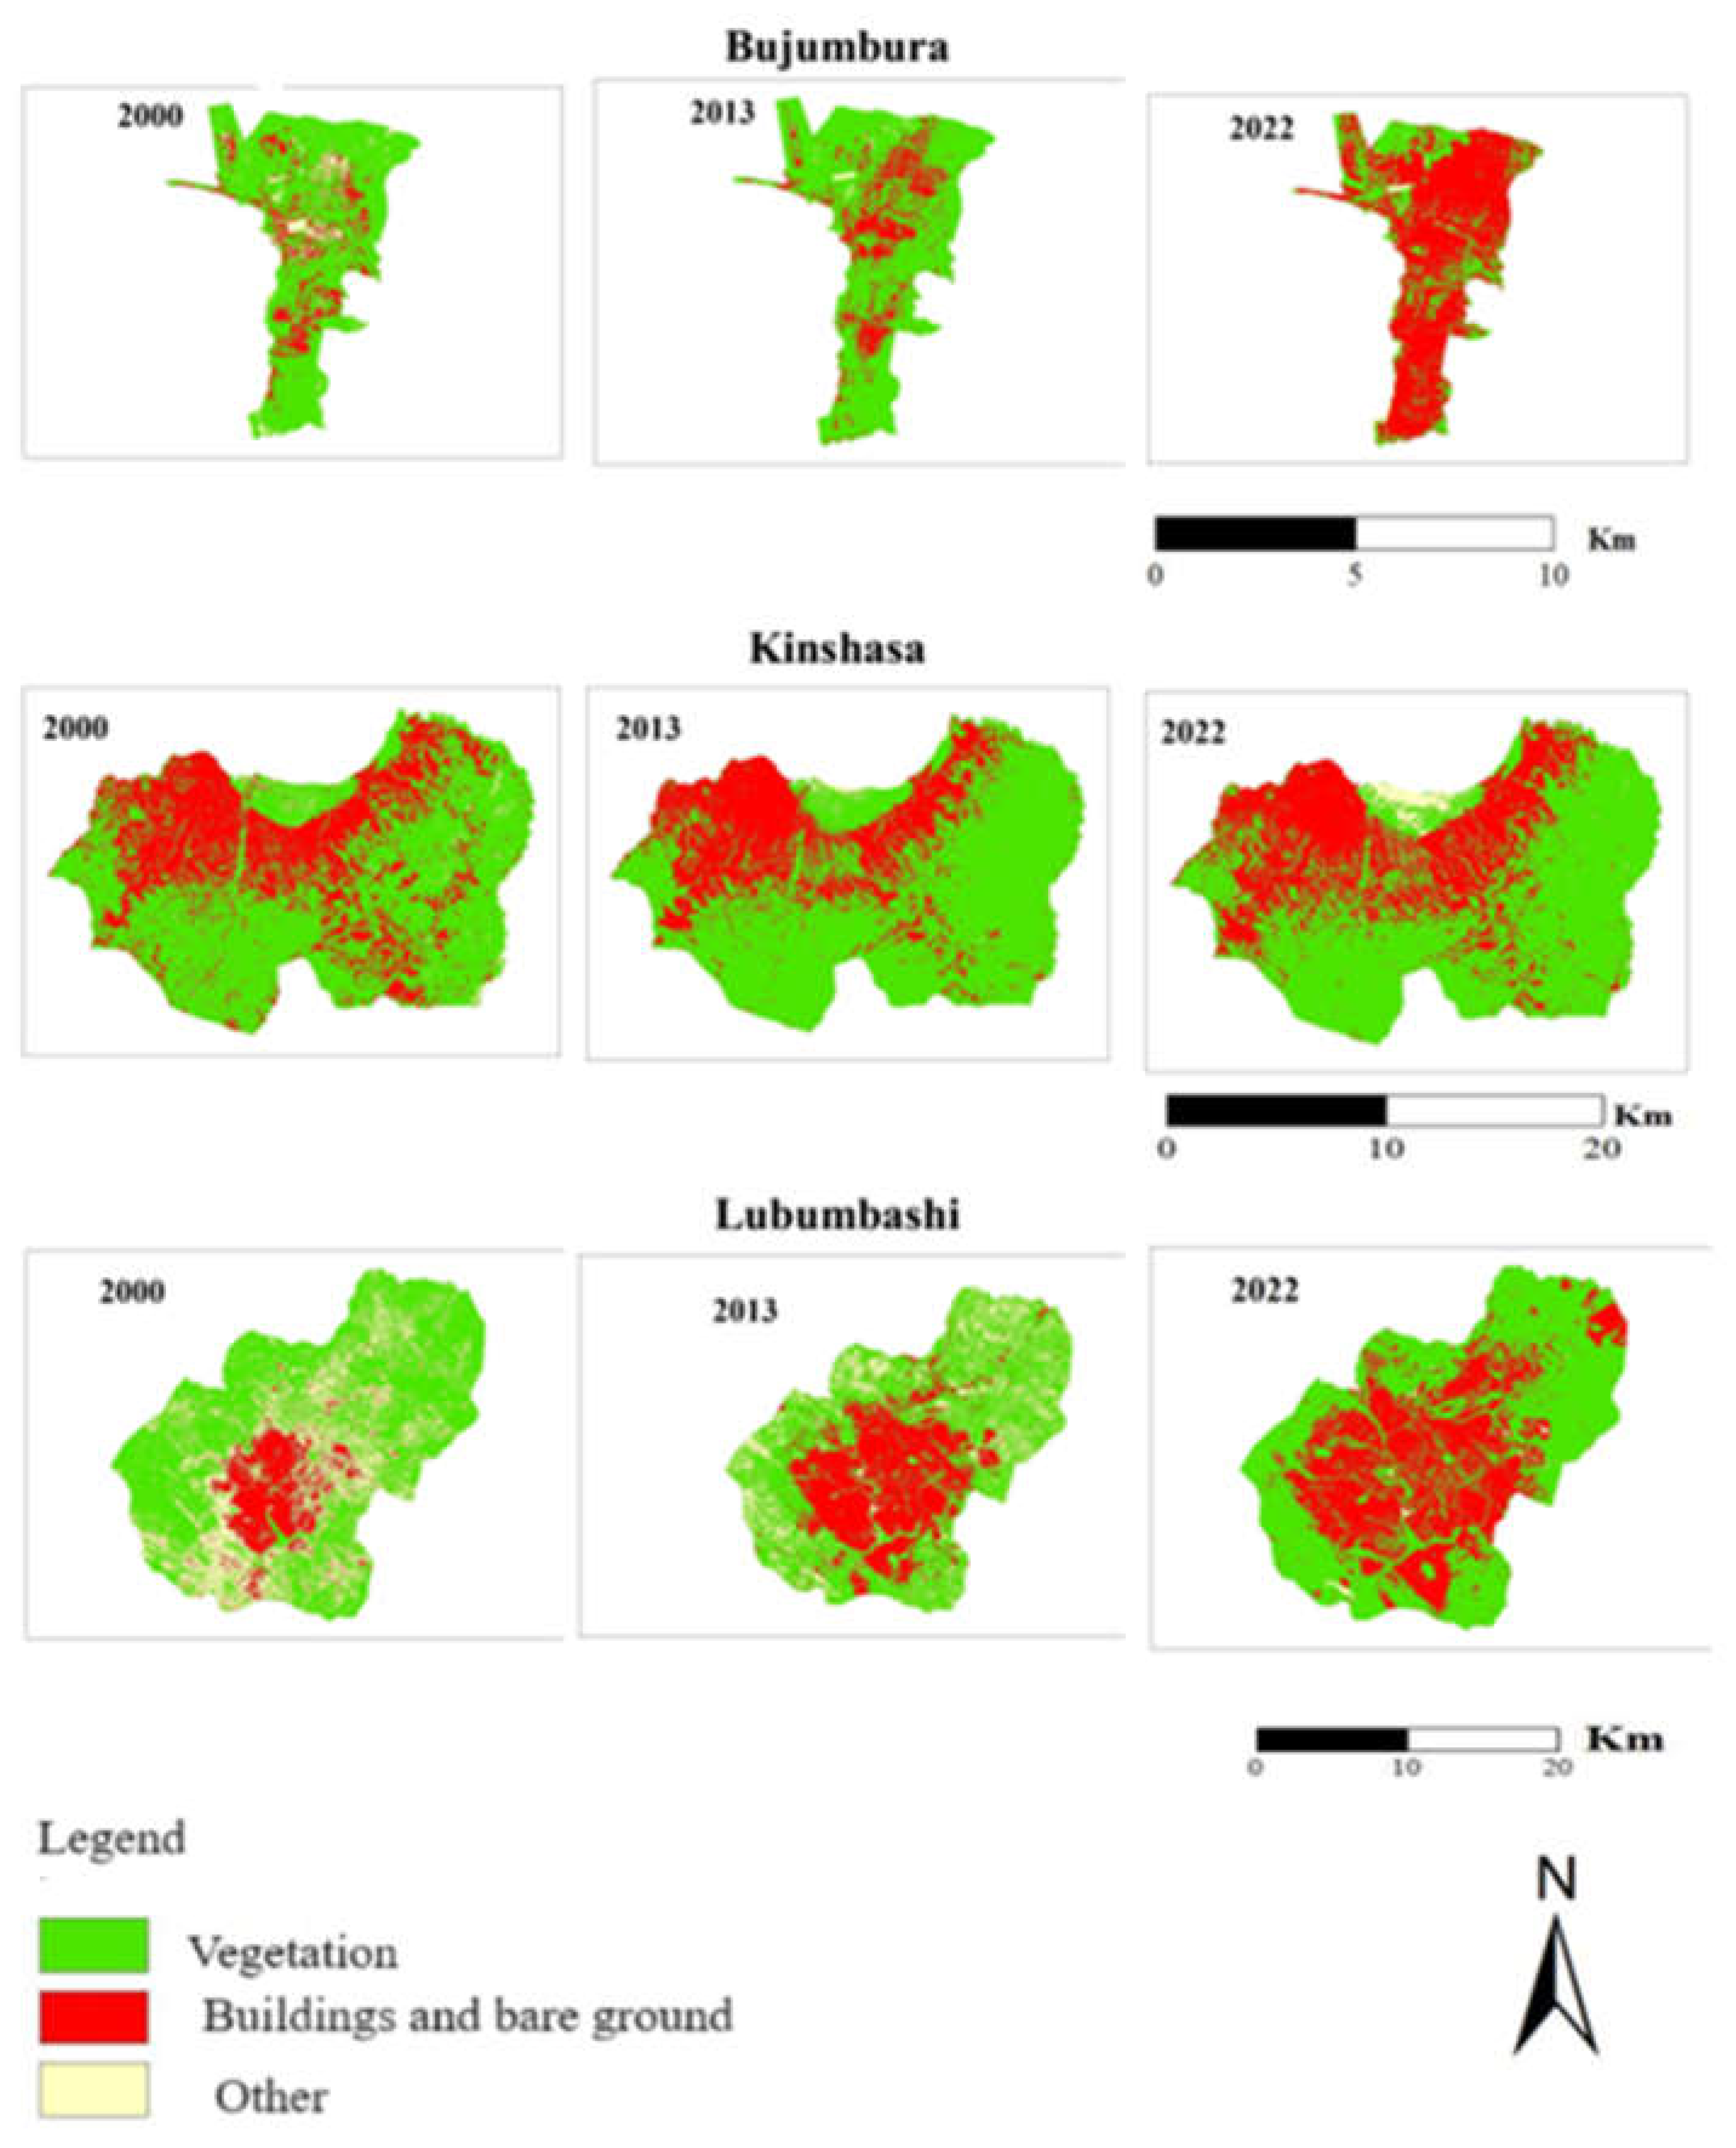
Figure 3.
Trends in number of patches, total area, average patch area and vegetation class dominance for the cities of Bujumbura (Burundi), Kinshasa and Lubumbashi (DRC) for the years 2000, 2013 and 2022.
Figure 3.
Trends in number of patches, total area, average patch area and vegetation class dominance for the cities of Bujumbura (Burundi), Kinshasa and Lubumbashi (DRC) for the years 2000, 2013 and 2022.
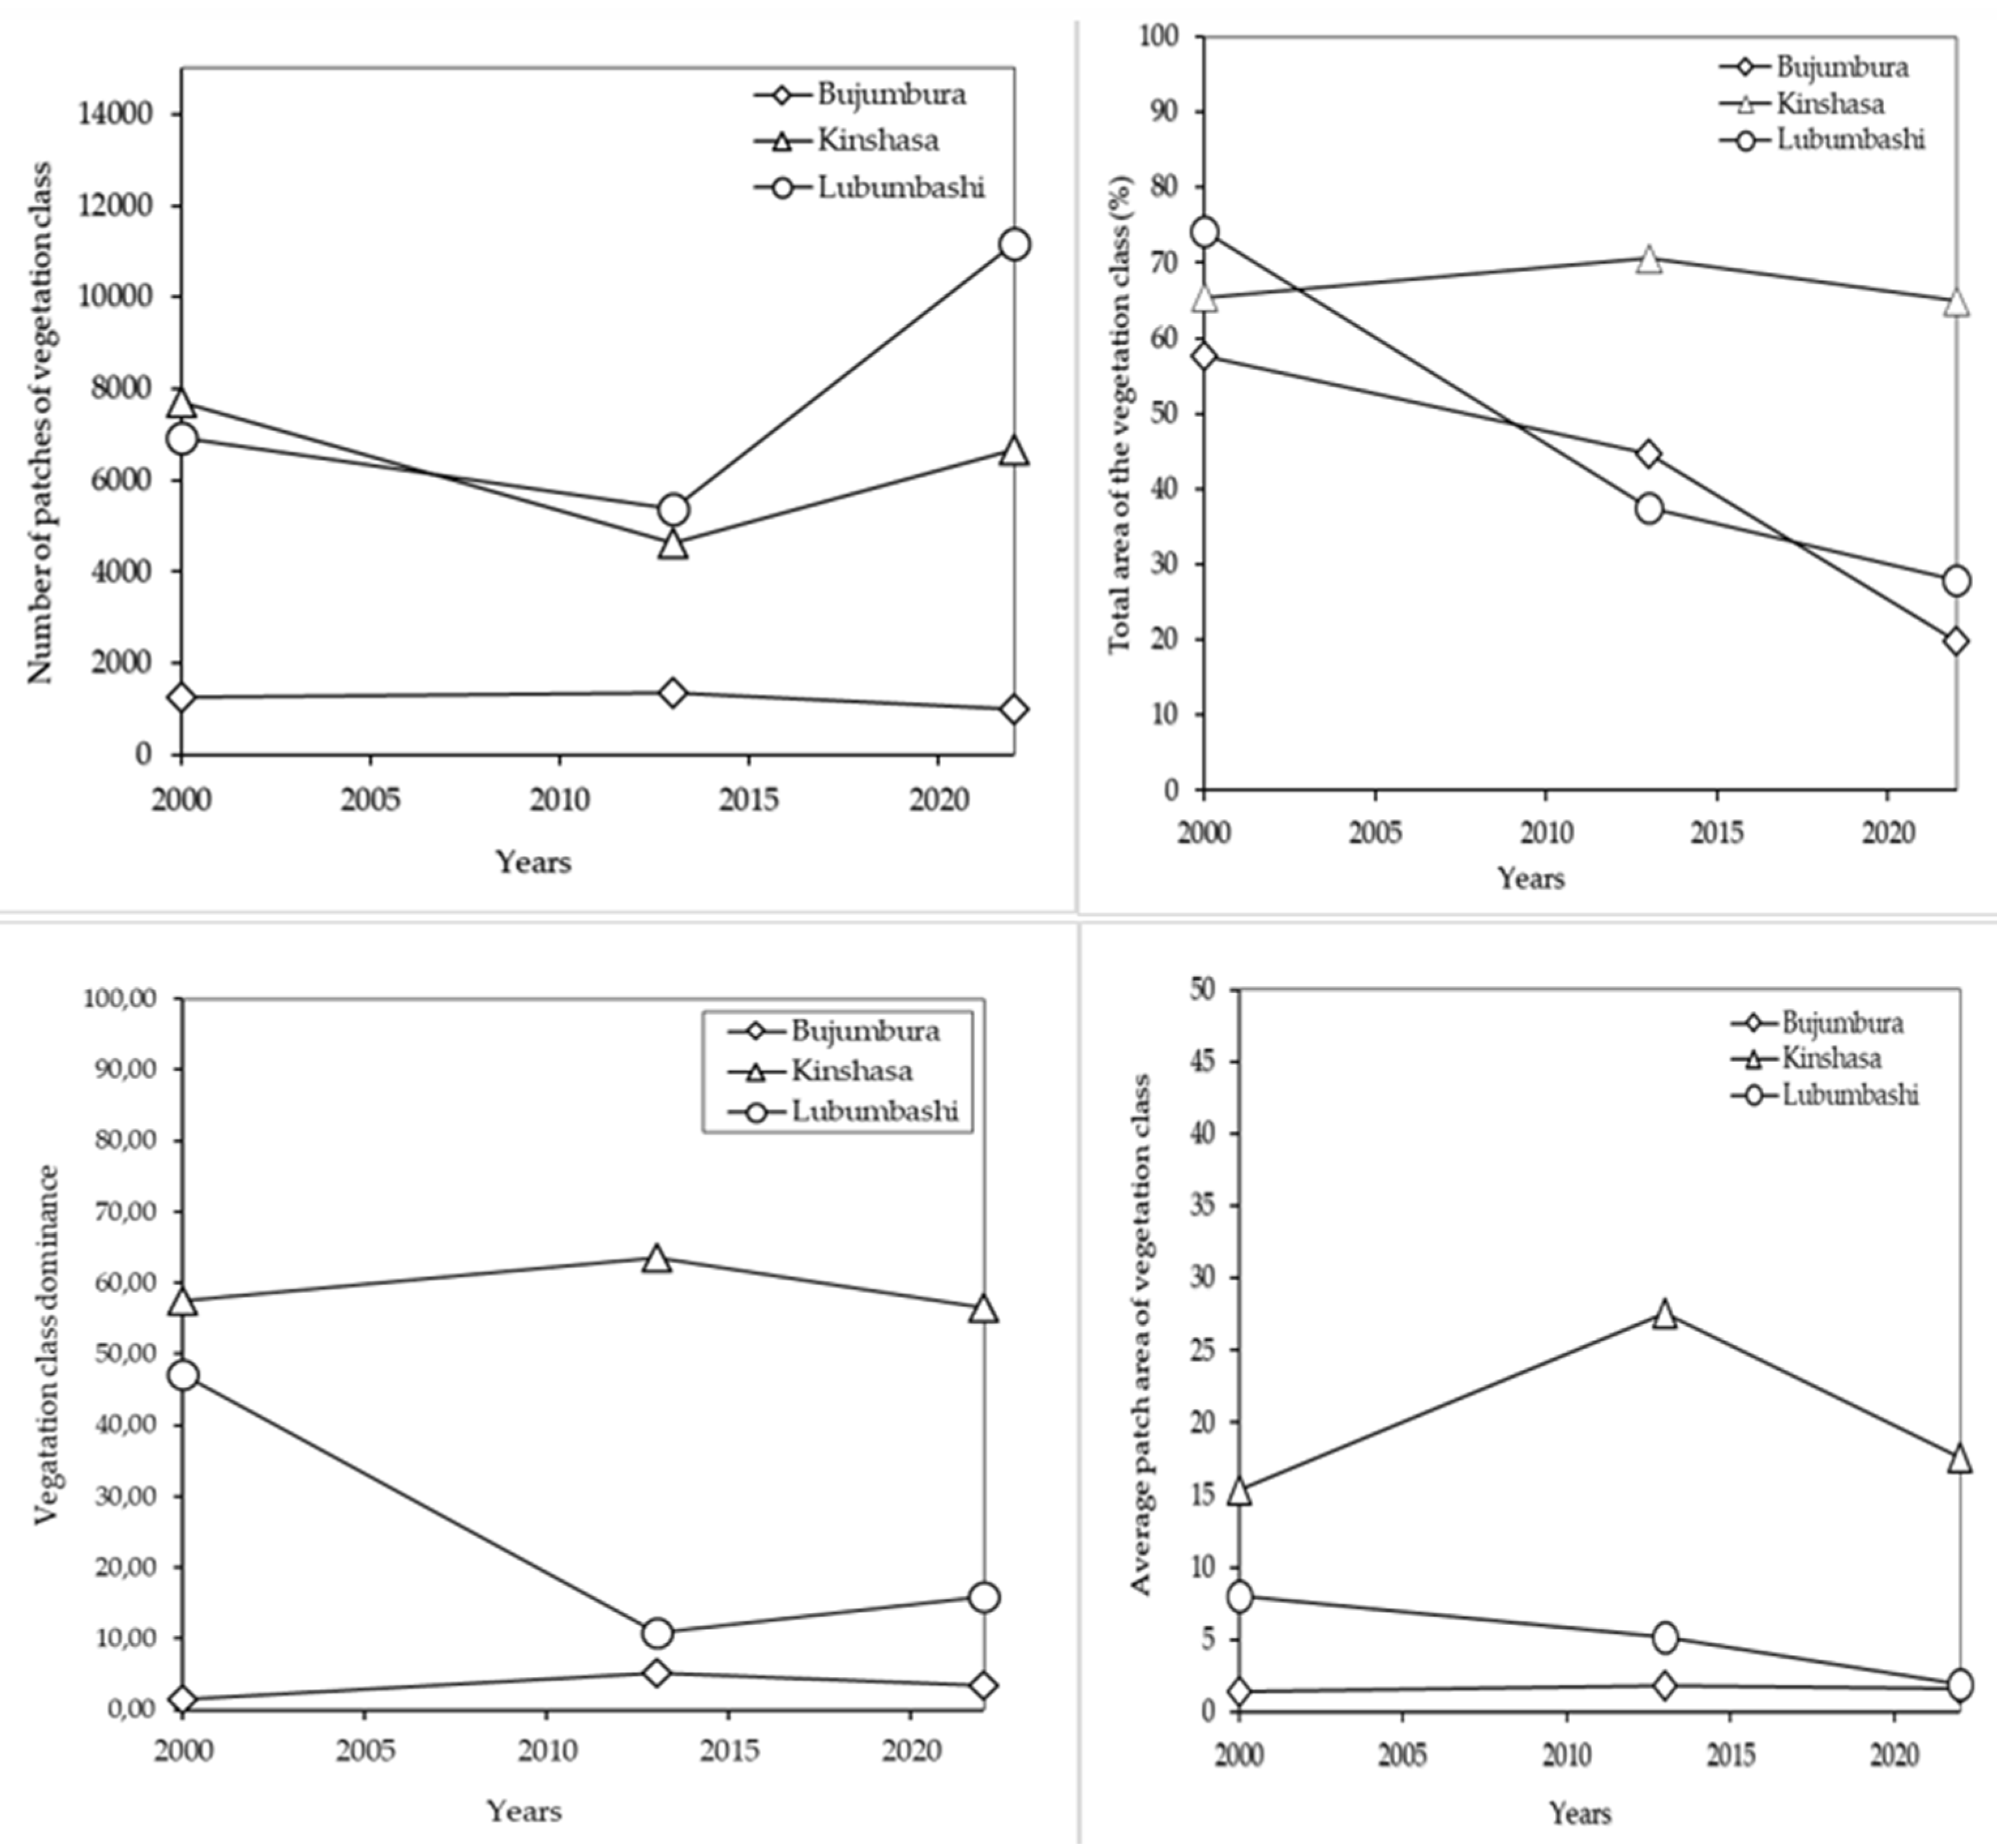
Figure 4.
Normalized difference vegetation maps of the cities of Bujumbura (Burundi), Kinshasa and Lubumbashi (DRC) for the years 2020, 2013 and 2022.
Figure 4.
Normalized difference vegetation maps of the cities of Bujumbura (Burundi), Kinshasa and Lubumbashi (DRC) for the years 2020, 2013 and 2022.
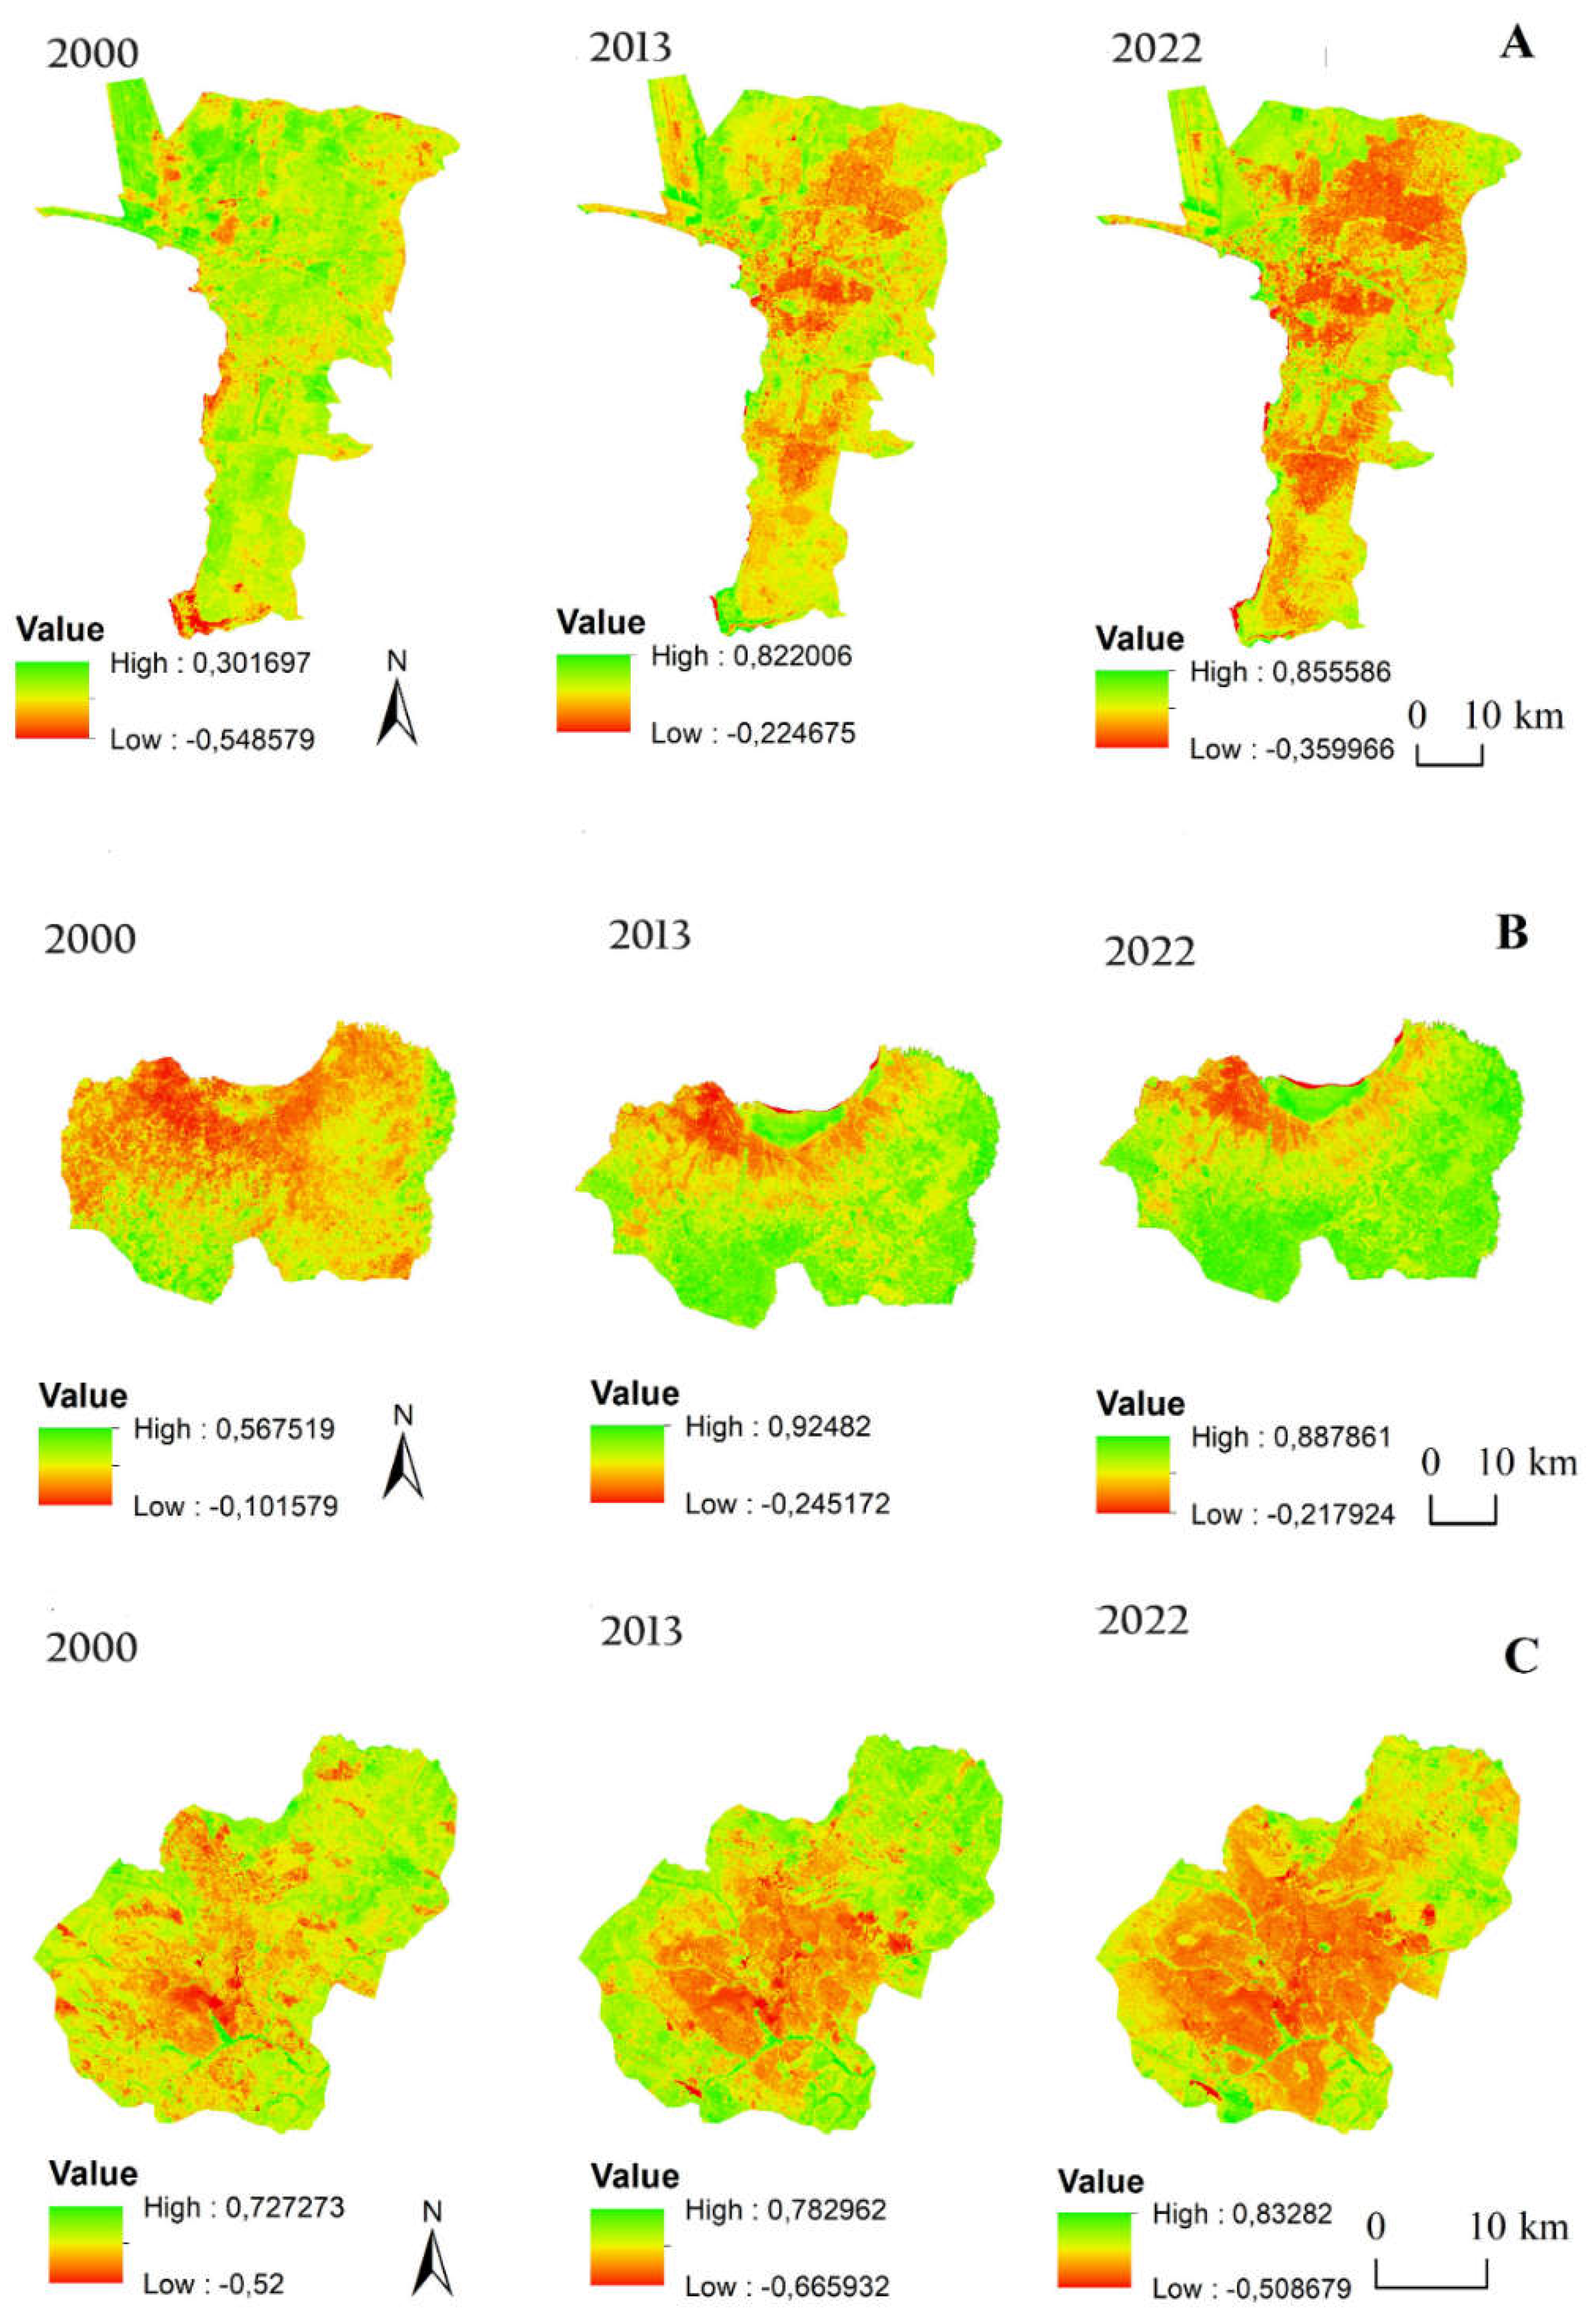
Figure 5.
Proportions of GI areas over NDVI intervals found for the cities of Bujumbura, Kinshasa and Lubumbashi for the years 2000, 2013 and 2022.
Figure 5.
Proportions of GI areas over NDVI intervals found for the cities of Bujumbura, Kinshasa and Lubumbashi for the years 2000, 2013 and 2022.
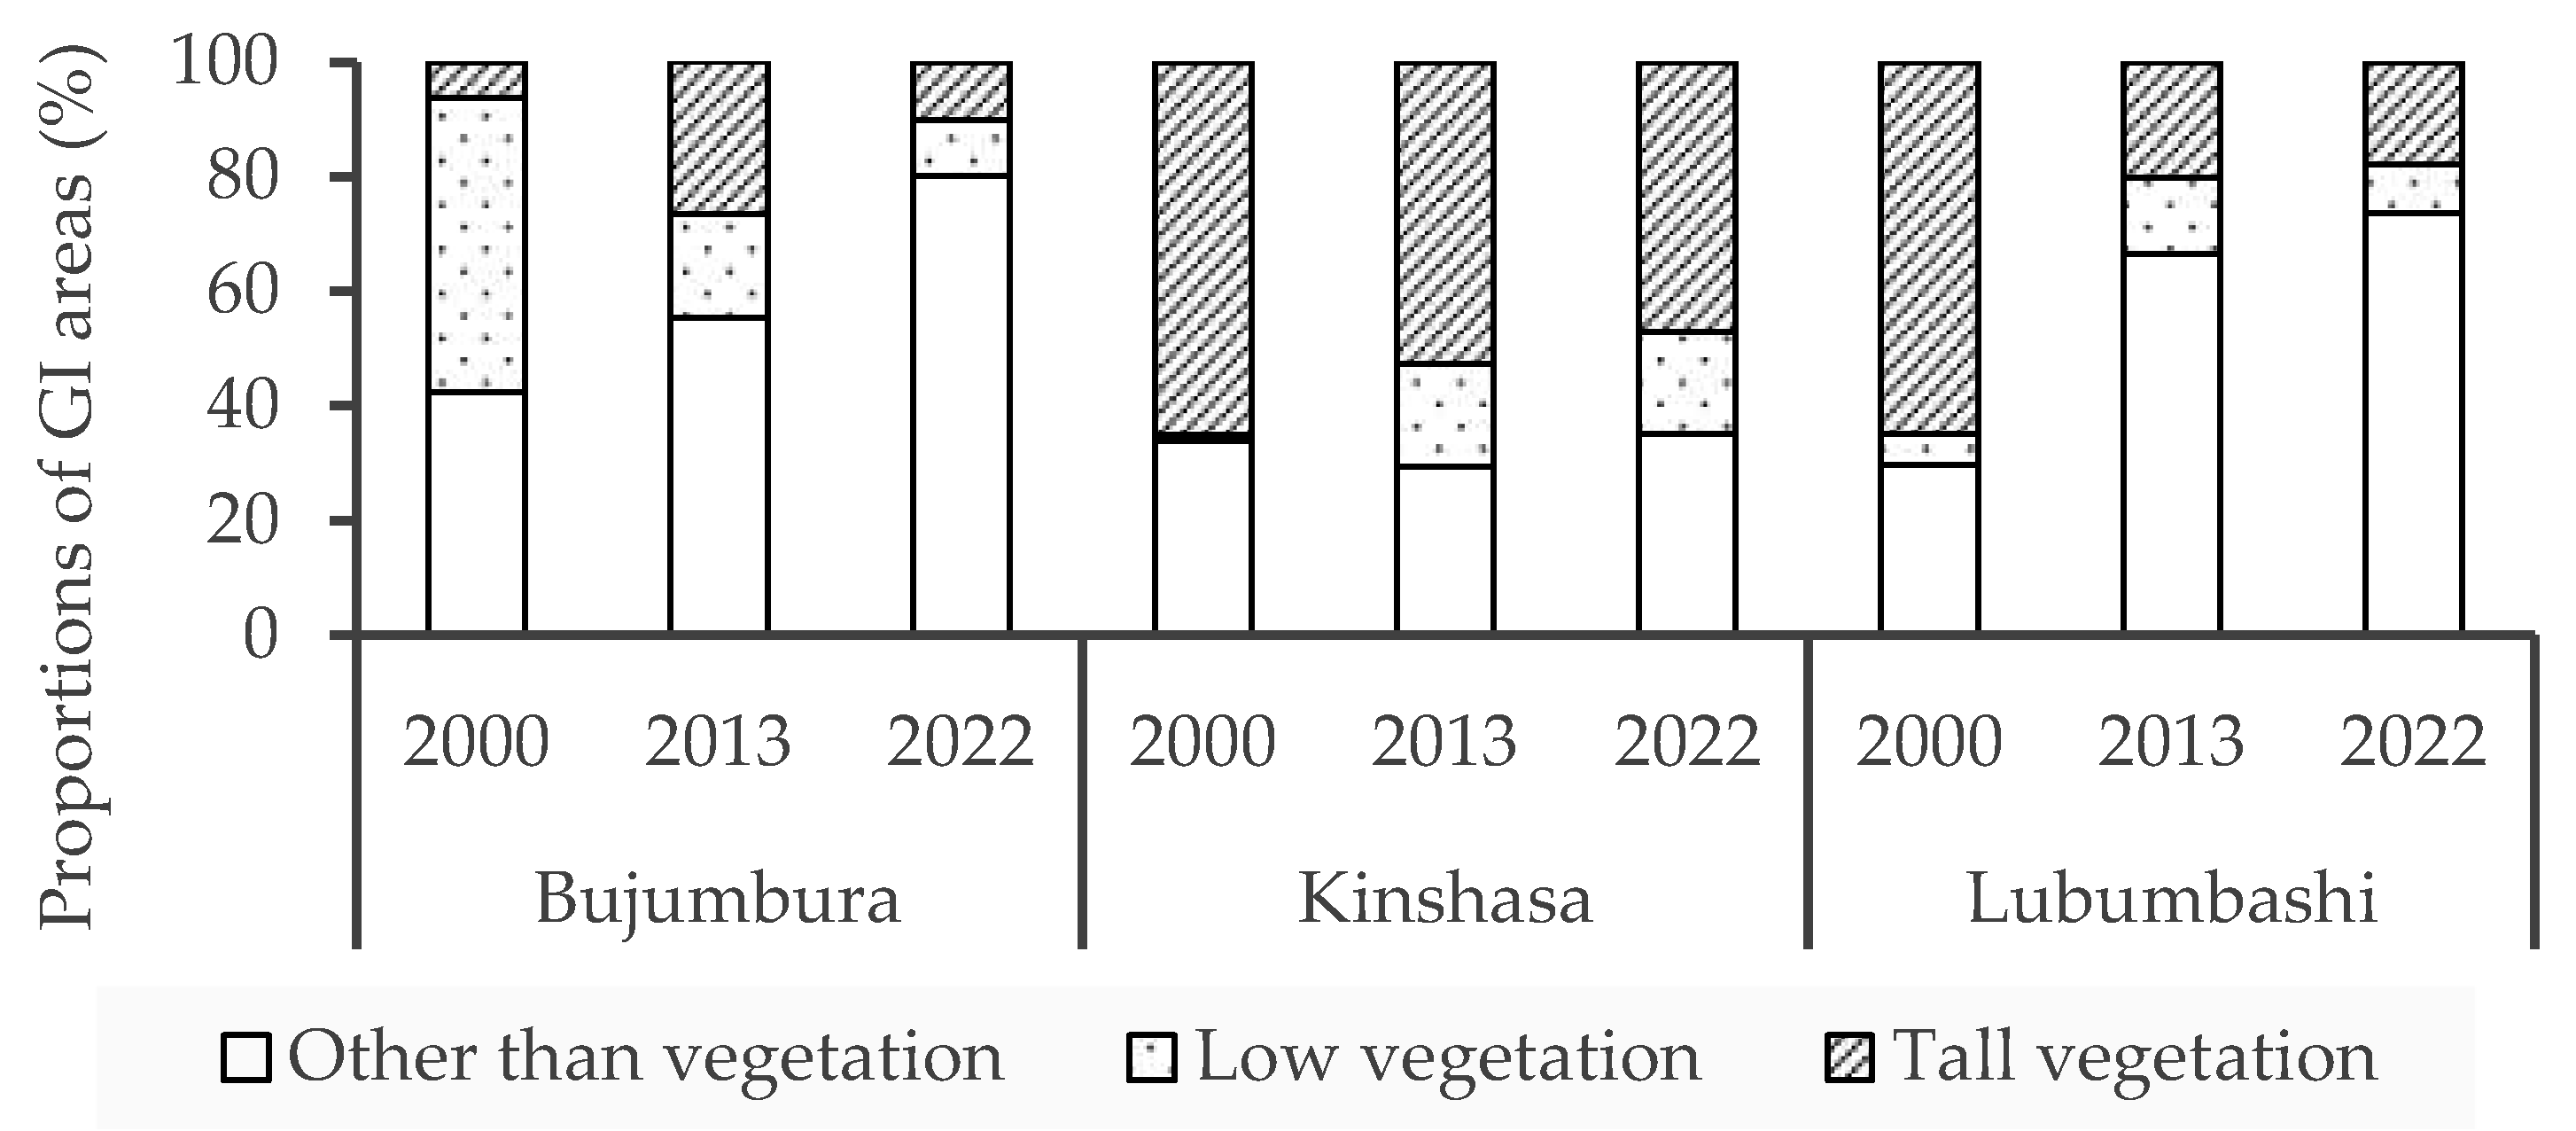

Table 1.
Characteristics of the cities of Bujumbura, Kinshasa and Lubumbashi.
| Bujumbura | Kinshasa | Lubumbashi | |
|---|---|---|---|
| Year of creation | 1897 | 1881 | 1910 |
| Location | Between 3°30' and 3°51' S and 29°31' and 29°42' E | Between 4°-5° S and 15°-16° E | Between 11°27' and 11°47' S and 27°19' and -27°40' E |
| Area | 10462 hectares | 9965 km2 | 747 km2 |
| Number of communes | 3 | 24 | 7 |
Table 2.
Accuracy of supervised classifications of Landsat images from 2000, 2013 and 2022 based on the Random Forest algorithm.
Table 2.
Accuracy of supervised classifications of Landsat images from 2000, 2013 and 2022 based on the Random Forest algorithm.
| Year | Bujumbura | Kinshasa | Lubumbashi | |||
|---|---|---|---|---|---|---|
| Overall accuracy | Kappa | Overall accuracy | Kappa | Overall accuracy | Kappa | |
| 2000 | 0,89 | 0,69 | 0,95 | 0,86 | 0,95 | 0,92 |
| 2013 | 0,93 | 0,79 | 0,97 | 0,88 | 0,96 | 0,94 |
| 2022 | 0,97 | 0,91 | 0,99 | 0,94 | 0,98 | 0,97 |
Table 3.
The following transition matrix describes the changes in land use in the cities of Bujumbura (Burundi), Kinshasa and Lubumbashi (DRC) between the periods 2000-2013 and 2013-2022. The column and row totals correspond to the land-use classes for the initial and subsequent study periods, respectively. The values in bold represent the proportion of the urban footprint that has not undergone transformation between the two specified time points. The remaining values within the matrix provide insight into the nature of the observed changes in land use.
| Bujumbura | Year 2013 | ||||
|---|---|---|---|---|---|
| Vegetation | Buildings and bare ground | Other | Total | ||
| Year 2000 | Vegetation | 9,78 | 47,51 | 0,36 | 57,65 |
| Buildings and bare ground | 30,42 | 5,01 | 0,05 | 35,48 | |
| Other | 4,38 | 1,90 | 0,59 | 6,87 | |
| Total | 44,58 | 54,42 | 1,00 | 100 | |
| Year 2022 | |||||
| Vegetation | 18,17 | 26,36 | 0,06 | 44,58 | |
| Year 2013 | Buildings and bare ground | 1,69 | 52,17 | 0,56 | 54,42 |
| Other | 0,04 | 0,37 | 0,58 | 1,00 | |
| Total | 19,90 | 78,90 | 1,20 | 100 | |
| Kinshasa | Year 2013 | ||||
| Year 2000 | Vegetation | 58,31 | 6,70 | 0,46 | 65,47 |
| Buildings and bare ground | 11,17 | 21,94 | 0,03 | 33,14 | |
| Other | 1,12 | 0,06 | 0,21 | 0,39 | |
| Total | 70,60 | 28,70 | 0,70 | 100 | |
| Year 2022 | |||||
| Year 2013 | Vegetation | 60,78 | 8,28 | 1,54 | 70,60 |
| Buildings and bare ground | 3,86 | 24,80 | 0,04 | 28,70 | |
| Other | 0,28 | 0,02 | 0,40 | 0,71 | |
| Total | 64,92 | 33,10 | 1,99 | 100 | |
| Lubumbashi | Year 2013 | ||||
| Year 2000 | Vegetation | 30,85 | 17,75 | 21,65 | 70,25 |
| Buildings and bare ground | 1,13 | 12,75 | 2,75 | 16,63 | |
| Other | 3,46 | 4,67 | 4,99 | 13,12 | |
| Total | 35,44 | 35,17 | 29,39 | 100 | |
| Year 2022 | |||||
| Year 2013 | Vegetation | 18,91 | 7,55 | 8,98 | 35,44 |
| Buildings and bare ground | 1,89 | 30,92 | 2,36 | 35,17 | |
| Other | 5,46 | 15,50 | 8,43 | 29,39 | |
| Total | 26,26 | 53,97 | 19,77 | 100 | |
Table 4.
Stability index for the vegetation, built-up and bare soil classes as well as the "other" class for the cities of Bujumbura (Burundi), Kinshasa and Lubumbashi (DRC) over the period 2000 to 2022.
Table 4.
Stability index for the vegetation, built-up and bare soil classes as well as the "other" class for the cities of Bujumbura (Burundi), Kinshasa and Lubumbashi (DRC) over the period 2000 to 2022.
| Bujumbura | Kinshasa | Lubumbashi | ||
|---|---|---|---|---|
| 2000-2013 | Vegetation | 0,12 | 3,00 | 0,70 |
| Buildings and bare ground | 0,06 | 1,22 | 0,41 | |
| Other | 0,09 | 0,13 | 0,13 | |
| 2013-2022 | Vegetation | 0,65 | 4,35 | 0,79 |
| Buildings and bare ground | 1,80 | 2,03 | 1,13 | |
| Other | 0,56 | 0,21 | 0,26 |
Table 5.
Spatial structure indices calculated in 2000, 2013 and 2022 of the vegetation class for the cities of Bujumbura (Burundi), Kinshasa and Lubumbashi (DRC). These indices enable the identification of the underlying spatial transformation processes that have resulted in the observed changes. The data were derived from the supervised classification of Landsat images using the Random Forest algorithm. : number of patches, : total area (ha), : average area, : dominance index of the largest patch (%), : fractal dimension, : aggregation index.
| City | Year | ||||||
|---|---|---|---|---|---|---|---|
| Bujumbura | 2000 | 1246 | 6032,39 | 1,55 | 1,45 | 92,47 | 1,04 |
| 2013 | 1349 | 4665,01 | 5,15 | 1,79 | 91,99 | 1,04 | |
| 2022 | 1007 | 2081,94 | 3,36 | 1,62 | 86,03 | 1,04 | |
| Kinshasa | 2000 | 7704 | 652209,25 | 57,47 | 15,36 | 92,80 | 1,04 |
| 2013 | 4623 | 703429,35 | 63,49 | 27,61 | 95,50 | 1,04 | |
| 2022 | 6685 | 646828,15 | 56,57 | 17,56 | 94,40 | 1,04 | |
| Lubumbashi | 2000 | 6925 | 55453,28 | 47,12 | 8,00 | 85,46 | 1,04 |
| 2013 | 5386 | 28034,65 | 10,77 | 5,20 | 83,30 | 1,04 | |
| 2022 | 11173 | 20904,10 | 15,96 | 1,87 | 92,10 | 1,04 |
Disclaimer/Publisher’s Note: The statements, opinions and data contained in all publications are solely those of the individual author(s) and contributor(s) and not of MDPI and/or the editor(s). MDPI and/or the editor(s) disclaim responsibility for any injury to people or property resulting from any ideas, methods, instructions or products referred to in the content. |
© 2024 by the authors. Licensee MDPI, Basel, Switzerland. This article is an open access article distributed under the terms and conditions of the Creative Commons Attribution (CC BY) license (http://creativecommons.org/licenses/by/4.0/).
Copyright: This open access article is published under a Creative Commons CC BY 4.0 license, which permit the free download, distribution, and reuse, provided that the author and preprint are cited in any reuse.


