Submitted:
22 July 2024
Posted:
24 July 2024
Read the latest preprint version here
Abstract
Background: For the past two decades, the Copenhagen Psychosocial Questionnaire (COPSOQ) has been established as a valid instrument to measure psychosocial stress at work. Nowadays, the COPSOQ international network is responsible for the monitoring and improvement of COPSOQ. 2019, a new questionnaire was published, and the Greek version is now being validated. Methods: Measurement qualities of the Greek COPSOQ III have been explored in adherence to the usual requirements of a validation study as defined by DIN EN ISO 10075-3. A sample of observations from 2.189 participants surveyed with the COPSOQ in Greece was used to validate the current version with appropriate statistical analyses. Exploratory factor analysis was used to assess statistical relations for many scales. Results: With its 108 items and 40 scales, the Greek COPSOQ III includes all psychosocial work factors that have been internationally validated and remain compatible with about 72% of the COPSOQ III German version content. Beyond primary results, congruence with widely used theoretical approaches like the Demand-Control(−Support) model (DCM) or the Job Demands-Resources model (JDR) is generally satisfactory. In summary, our validation study for the Greek COPSOQ III version showed adequate reliability and validity, which is in line with the COPSOQ III questionnaire from other European countries, and it is also compatible with the validation of the German COPSOQ III (Lincke, 2021). Our regression analysis showed that the 34 psychosocial work factors (34 “context” scales) could adequately predict the scores of the satisfactory and health scales (6 “outcome” scales). The analysis also indicated the top five (5) predictors (context variables) for each of the six (6) “effect” scales (outcome variables). Conclusions: With the launch of COPSOQ III in Greece, current and new workplace psychosocial aspects could be explored. COPSOQ III(GR) is a beneficial instrument for enterprise research and risk assessment.
Keywords:
COPSOQ
; Psychosocial Stress
; Risk Assessment
; Work Factors
; Greek Validation Study
; Organizational Diagnosis
; Psychosocial Risk Management
; Psychosocial Work Environment
; Work Environment
; Emerging Risks
; Psychosocial Risk Analytics
; Management Interventions
; Human-risk Monitoring
; Psychosocial Wellbeing
1. Introduction
According to the European organization for health and safety at work, psychosocial risks and occupational stress are among the biggest challenges in the field of occupational safety and health. They significantly affect the health of individuals, businesses, and national economies. Psychosocial stressors threaten employees and managers within organizations in the public and private sectors [1,2]. In the last 12 years of the economic crisis in Greece, an "exponential" escalation of these psychosocial hazards was experienced, which - to a greater extent – has been worsened during the COVID and post-COVID era both in the national and international level [3,4,5,6].
Psychosocial risks arise from inadequate planning, organization and management of work, as well as from an unhealthy social context of work environment, and may lead to negative physical, psychological, and social outcomes for the employees such as work stress, burnout and/or depression [7,8,9]. Some examples of working conditions that may lead to psychosocial risks include excessive workload, conflicting demands and ambiguities regarding employees’ roles, lack of participation in decision-making, lack of influence on how the work is carried out, poor management of organizational change, job insecurity, ineffective communication, lack of support from management or colleagues, psychological and sexual harassment, violence, etc [10,11,12].
A psychosocially healthy work environment increases performance and personal development, as well as reinforces the physical and mental well-being of employees [13,14]. Employees experience stress attacks when the demands of their work are excessive and exceed their ability to cope with them. In addition to mental health problems, workers suffer from prolonged stress with high risk of developing serious physical health problems, such as cardiovascular disease or musculoskeletal problems [15,16]. At the organizational level, negative consequences may include poor overall business performance, increased absenteeism, truancy (instances of employees showing up to work while ill and unable to function effectively) and increased accident rates and injuries. Stress-related absences tend to be longer than absences related to other causes, and work-related stress contributes to increased early retirement rates. The costs to businesses and society are estimated to be significant and amount to billions of euros [17,18].
Furthermore, leadership is another crucial psychosocial aspect that plays a significant role in managerial interventions and policies. The impact of leadership behavior and style on employees' health and well-being has been identified as a noteworthy psychosocial risk factor [19,20]. Effective leadership includes actively engaging health professionals by attentively listening to their problems and expectations, facilitating collaborative team planning, and appropriately allocating workloads. By carefully considering employees' psychological needs and implementing supportive leadership practices, managers and policymakers can cultivate a work climate that fosters well-being and productivity [21,22,23]. Workplace bullying is an additional psychosocial aspect that impacts management responses and legislation. Research has indicated that several psychosocial characteristics within the workplace, including but not limited to quantitative demands, job control, role expectations, leadership conduct, and social climate, are associated with workplace bullying. The primary emphasis of interventions to prevent workplace bullying should be enhancing psychosocial working conditions, decision-making processes, leadership abilities, and other organizational aspects [24,25,26]. By considering these various elements, managers and policymakers can establish a work atmosphere that fosters respect and inclusivity, enhancing employee well-being and mitigating the likelihood of bullying [27,28,29].
In Greece, employers have a legislative obligation to assess psychosocial risks, such as the risks of violence and harassment including sexual harassment and are expected to take measures to prevent and control such hazards in the workplace (amendment of paragraph 6 of article 42 of Law 3850/2010). Employers are re-quired to take specific measures to prevent and deal with violence and harassment at work, demonstrate zero tolerance for such incidents or behavior when receiving and being called upon to manage related complaints, and provide information and training on the risks, prevention, protection and obligations of those involved in accessible formats (Law 4808/2021).
The Copenhagen Psychosocial Questionnaire (COPSOQ) was originally developed in 2000 for research purposes at workplaces in Denmark, and it has since been vali-dated in 18 countries [30]. It covers all important psychosocial factors at work considering the leading concepts and theories of occupational health and well-being [31,32]. COPSOQ International Network (http://www.copsoq-network.org) was founded in 2009 to promote scientific research and risk assessment using the COPSOQ tool. COPSOQ may be used by governments, universities and research institutions, enterprises and social agents from European and other countries all over the world [33]. The network emphasizes the importance of validation studies supporting tailored national versions of the instrument.
COPSOQ is a comprehensive questionnaire that covers a wide variety of dimensions, describing psychosocial working conditions, and is considered an instrument for research and psychosocial risk prevention in the workplace [33]. Researchers [31] have documented that COPSOQ can be used as a valid and reliable tool for psychosocial risk assessment in the workplace and that is the reason why it has been used in thousands of enterprise-based risk assessment applications [34]. It can capture a broad range of psychosocial dimensions [35] being part of a systematic occupational safety and health management system [36].
The questionnaire covers a broad range of aspects of currently leading concepts and theories such as the job characteristics model, the Michigan organizational stress model, the demand-control-(support) model, the sociotechnical approach, the action-theoretical approach, the effort-reward-imbalance model, and the vitamin model [35]. The COPSOQ I and II came in short, middle, and long versions [36]. A new version of the questionnaire (COPSOQ III) has been developed by the International COPSOQ Network as an update of the previous two versions [35,36]. A set of core items of the COPSOQ III is strongly recommended to be included in national short, middle, and long versions of the questionnaire [30]. Many items and scales of COPSOQ III had been already part of the COPSOQ questionnaire since 2005. In numbers, 58 items out of 84 items (almost 70%) are identical [37].
The new version of COPSOQ III is designed to allow flexible adaptation to national and industry-specific contexts without compromising the potential for international comparisons and comparisons over time. National versions can be established by the national COPSOQ teams of each country based on all “core” items supplemented with additional items labelled as “middle” or “long” to form a reliable and relevant tool in the given context. Therefore, all future national versions include the same mandatory core items, while the total number of items in scales and number of scales are allowed relative flexibility [30,38].
COPSOQ III has been validated for the German, Spanish, French, Swedish, and Dutch languages [39,40] as well as in many countries all over the world (e.g., Canada, Chile). There is also an important validation study (available also on the COPSOQ-Network website) with content of a joint-efforts validation for the International middle version of COPSOQ III. The international validation study could be used as a linguistic “common point of reference” for both scientific research and practical implication related projects [30].
The Greek validation study project had been initiated in Greece in October 2017, at the University of Piraeus, Greece. A small part of its research findings and relevant conclusions have been presented in Employability for the 21st Century International Conference, which took place in Leuven-Belgium in September 2018 [41]. More relevant findings have been included in Dr. Kotsakis’ doctoral thesis [42]. An up-to-date part of the current study’s findings had also been presented in the Psychosocial Health Workshop for Greece and Cyprus, which took place in Nicosia-Cyprus in February 2023, under the auspices of the Open University of Cyprus.
The aim of the current study was to assess the reliability and validity of the psychometric properties of the Greek long version of the Copenhagen Psychosocial Questionnaire III [COPSOQ- III (GR)] in a comprehensive manner.
2. Materials and Methods
The study was conducted in Greece in the context of both doctoral and post-doctoral research activities in two Greek Universities (University of Piraeus-Greece and University of Patras-Greece), between the years 2017 and 2022. Due to data quantity & data quality related restrictions and our overall filtering process results, we finally decided to include only the data from University of Piraeus re-search activities. The participants were employees from different public and private organizations.
Ethics Statement
The survey was implemented in accordance with the COPSOQ International Net-work Research Guidelines and in compliance with the General Data Protection Regulation (GDPR) of Greece. The research study compliance with the COPSOQ Network Research Guidelines with regard anonymity, confidentiality & research ethics and the overall research study protocol, have been approved by the Research Ethics Committee of University of Piraeus. Respondents were given personalized credentials to access the questionnaire through a provided URL to the Aca-demic Research Radar. A written user manual was given to the respondents with instructions on how to access the survey and a notice that by clicking on the link to proceed to the survey, they were providing consent to participate. Participation was performed in an anonymous mode and the system was not able to identify an individual by his/her name or any other direct identifier. The system initiating the survey was used as a record of consent.
Sample
The aim of the study was to test the psychometric equivalence and validate the Greek translation of the long version of the Copenhagen Psychosocial Questionnaire (COPSOQ III-GR), in a sample of Greek employees (N>2000). The study sample comprised of 2,189 participants that completed all questions of the survey [43]. For the development and conduct of the COPSOQ III-GR Study the authors received approval from the International COPSOQ Network.
The Greek Version of COPSOQ III
The overall design and content of the new Greek version (III) of the questionnaire was based on a scientific collaboration outcome between the Hellenic COPSOQ Re-search Team (University of Piraeus, Greece) and the Steering Committee of the Inter-national COPSOQ-Research Network (since 2017, October). The overall development process of the Greek COPSOQ ΙΙΙ was carried out in three (3) phases. In the first phase, the construction of the Greek version III instrument took place (based on the German COPSOQ-III scales and including a few add-on scales from the COPSOQ II scales). In the second phase the forward-backward translation and the cultural adaptation of the COPSOQ-III (GR) questionnaire was performed. In the third phase, the psychometric properties of the new COPSOQ-III(GR) version were evaluated in several cross-sectoral & cross-occupational samples of Greek employees (N=2189). The permission to design and validate the Greek III version of the diagnostic tool was obtained by the Steering Committee of the International COPSOQ network, in the context of academic research activities of the School of Economics, Business and International Studies at University of Piraeus, Greece. A large number of COPSOQ-related activities are still ongoing in both the University of Piraeus and University of Patras.
The core version of the Greek COPSOQ-III (core) included a total of 108 items and twenty-one (21) core scales. Answers to all questions were given through Likert-type scales. It has been designed under a job demands-control and domain-centric approach, based on the COPSOQ German-III version. The first pilot study (N=426) used the first core scales (21 scales). The findings of the pilot study were presented in the Employability for the 21st Century International Conference Proceedings in Belgium [41]. Within 2019, the Greek version was re-engineered and finalized in order to support international comparisons & benchmarking. Today, it is available in two (2) official releases for Greece and Cyprus (Language: GR), the COPSOQ III-GR Long Version (108 items, 40 scales) and the COPSOQ-III-GR Middle Version (74 items, 24 scales) (see Domains & Items per scale table in extended data) (Appendix A).
The new “long” version of the COPSOQ III (GR) questionnaire was shared in two different ways (internet-cloud and in writing). Regarding the companion letter-paper documentation for COPSOQ-III(GR) questionnaire, the participant-consent form, the relevant cover letter explaining the purpose of the research-study, as well as researchers’ affiliation, were enclosed in the same envelope. The full paper-set was handed over to employees who belonged to many different occupational sectors. In case of a company or an organizational entity having concerns about the participation of their employees in the study, a written approval of the scientific committee or the HR department of the company was an additional prerequisite of our study. Regarding the “internet-cloud version” of the questionnaire, two types of internet-cloud based applications had been selected during the overall survey-feedback collection process. The first application was a secure cloud-interface application based on Google Forms. The second application was a Microsoft Azure application, named Academic Research Radar (A.R.R), a cloud platform which supports specific parameterizing, building, distributing and administrating online surveys under top-security and confidentiality specifications (powered MS-Azure specific services and overall data-management). As an original Azure app, ARR cloud platform took full advantage of the “Microsoft Azure Compliance Manager” solution. Azure Compliance Manager is a free, Microsoft cloud services solution designed to help organizations meet complex compliance obligations, including the GDPR, ISO 27001, ISO 27018, and NIST 800-53 aiming to help both the academic research community to assess, implement and manage Azure security policies & GDPR compliance related policies from within Microsoft Azure Cloud applications. ARR platform is used by academic staff and researchers in order to collect any type of “voice of the employee” feedback via a secure online cloud interface, powered by Azure GDPR compliance features. In our study, ARR Azure application was parameterized to support the COPSOQ-III (GR) academic surveys in terms of confidentiality, security, participants’ anonymity, organizational-entities anonymity and GDPR compliance at a national level. Thus, both two types of electronic participation -Google forms and Microsoft Azure App- were two (2) fully anonymous & confidential user interfaces (for the participants) in terms of electronic forms-fill-in, data storage, confidentiality, compliance and also for overall survey-data processing.
Statistical Analyses
Statistical analyses have been performed using the Statistical Software R (version 4.2.0). Cronbach’s α and the intraclass correlation (ICC) was computed to assess the reliability and homogeneity of the scales in the sample. We used the cronbach.alpha function from the ltm package (version 1.2) [44] to calculate the Cronbach’s α, and the icc function from the irr package (version 0.84.1) [45]. To explore the characteristics of each scale’s distribution, we calculated the mean, standard deviation, and floor and ceiling effects using base R functions (e.g., mean, sd). Floor effect is defined as the percentage of answers coded zero while ceiling effect is defined as the percentage of answers coded 100. We also assessed the internal validity and distinctiveness of the scales using Pearson’s correlations and multivariable relationships based on explorative factor analysis (EFA) and generalized linear regression models. For Pearson correlations and generalized linear regression, we used the cor and the glm functions respectively from the basic R stats package. For the EFA we used the EFA function from the EFAtools package (version 0.4.4) [46] using the rotation method (varimax with Kaiser normalization; eigenvalue of at least 1 as criterion). Statistical significance was considered at the level of < 0.05.
3. Results
The socio-demographic and occupational characteristics of the sample are presented in Table 1. From a socio-demographic perspective, 49.5% of the participants in the sample were female and 50.5% male. Concerning age, participants up to 24 years were 31.7% of the sample, 17.2% were between the ages of 25 to 34 years, while 30.7%, 17.2% and 3.2% were between the ages of 35 to 44 years, 45 to 54 years, and 55 years or older, respectively, A total of 43.6% of the participants were working in the public sector, while 56.4% were working in the private sector. The biggest percentage of employees (25.9%) was working in “admin, not leading” occupations and the smallest percentage (2.6%), was in “tech: engineers” occupations. In terms of interaction with external clients, 42.2% of the participants stated that they don’t have any interaction, 4.7% have on average, less than 1 interaction per day, 6.9% have 1 to 5 interactions per day, 10.6% have 6 to 14 times per day, and 35.6% have 15 or more interactions per day. Finally, 21.5% of the participants were supervisors, while 61% are not supervisors in jobs with supervisors and 17.5% are not supervisors in jobs with no supervisors (e.g., freelancers).
The 40 scales of the Greek COPSOQ III questionnaire, are presented in Table 2. The mean, standard deviation, and fractions with ceiling and floor effects were calculated for each scale to assess for sensitivity and variation. The mean values of the scales varied from 0.3 for “Physical Violence” to 71.55 for “Work Pace”. The standard deviations of all scales ranged from a minimum of 3.1 points to a maximum of 38.96 points. Floor effects ranged between 0.48 to 99.18%. There were 4 scales with 90% and more on this category (“Cyber Bullying”, “Physical Violence”, “Sexual Harassment”, “Threats of violence”), while 3 scales had less than 10% (“Influence”, “Variation of Work”, “Work Pace”). Ceiling effects ranged between 0 to 55.29%. In addition, there were 4 scales exceeding 20% (“Bullying from Customers (External)”, “Demands for Hiding Emotions”, “Influence”, “Mobbing”), while 22 scales showed less than 5% answers on this extreme category. Table 2 also shows the Cronbach’s “α” and the intraclass correlation (ICC) for each scale. There is a broad consensus that a value of α ≥ 0.7 is an indicator for an acceptable reliability, and a value for ICC ≥ 0.5 is an indicator for an acceptable degree of congruence. In total, 22 scales showed a good reliability in relation to Cronbach’s “α”, and 16 scales showed a good homogeneity based on ICC.
In Figure 1 we present the pairwise correlation coefficients (Pearson’s r) as indicators of the internal validity and distinctiveness of the scales. Usually if “r” is lower than |0.1| the correlation is said to be negligible. Values between |0.1| and |0.3| are considered as weak correlations, values between |0.3| and |0.5| as moderate correlations, while values greater than |0.5| are interpreted as strong correlations. In this sense, out of a total of 780 pairwise correlations, “r” was weak in 613 cases (78.6%), moderate in 133 cases (17.1%), and strong in 34 cases (4.4%) with -0.81 being the strongest correlation (between “Self-Rated Health” and “Bullying from Customers (External)”).
Exploratory factor analysis was used to assess statistical relations for a multitude of scales. In Table 3 and Table 4, we delineate the results of EFA performed by treating work factors and effects separately in accordance with the generalized model of cause and effect. In both tables, all factor loadings lower than |0.4| are hidden for better readability. In Table 3, components were extracted out of the 34 psychosocial work factors with the sum of squared loadings explaining 44.8% of the total variance. In Table 4, it can be seen that out of 6 scales on effects, 2 components were extracted, covering 48.0% of the total variance.
Finally, we applied six multiple linear regression models. The satisfaction and health scales are each defined as outcome (dependent) variables to be predicted by the 34 work factors. All regression estimates and standard errors are presented in Table 5, with star symbols indicating the statistical significance of each variable. Table 6 shows the variance explained (determination coefficient R2) by a model including all 34 workplace factors as independent variables (i.e., full model) and by a model including only the top five factors selected as those having the lowest p-values (i.e., most statistically significant variables) in the full model. Table 6 also shows the Akaike Information Criterion (AIC) and the degrees of freedom (df) for each model.
Burnout was predicted much better than all other effects (R2 = 0.905 which means 90.5% of its variance is explained by the model). The top five predictors for “Burnout” were “Work Life Conflict”, “Work Pace”, “Job Insecurity”, “Quantitative Demands” and “Role Conflicts”. Consequently, “Job Satisfaction” (R2 = 0.876), was followed by “Work Engagement” (R2 = 0.806), “Self-Rated Health” (R2 = 0.795), “Personal Well-being” (R2 = 0.718), and “Intention to leave” (R2 = 0.564). The top five predictors for “Job Satisfaction” were “Recognition”, “Quality of leadership”, “Commitment to the Workplace”, “Role Conflicts” and “Physical Work Environment”. The top five predictors for “Work Engagement” were “Commitment to the Workplace”, “Meaning of Work”, “Influence”, “Bullying”, and “Vertical Trust”. The top five predictors for “Self-Rated Health” were “Variation of Work”, “Bullying from Customers (External)”, “Work Pace”, “Influence” and “Social Support from Colleagues”. The top five predictors for “Personal Well-being” were “Bullying from Customers (External)”, “Insecurity over working conditions”, “Commitment to the Workplace”, “Role Conflicts”, and “Role Clarity”. Finally, the top five predictors for “Intention to leave” were “Bullying from Customers (External)”, “Commitment to the Workplace”, “Meaning of Work”, “Role Conflicts” and “Job Insecurity”.
4. Discussion
In summary, our validation study of the Greek COPSOQ III version showed adequate reliability and validity, which is in line with the validation of the COPSOQ III questionnaire from other European countries. For example, our findings are compatible with the validation of the German COPSOQ III [37], which found either good or very good reliability and validity for most of their 84 items and 31 scales. Based on the statistical analyses & findings of the current study, there is substantial evidence that the top work-environment predictor for the Burnout-syndrome related risks in Greece is the imbalance between Work-life and Family-life. The top predictor for “Self-rated Health”, “Personal Wellbeing” and “Intention to Leave” related risks is the “External Bullying” (Bullying from Customers). Thus, “Bullying form Customers” is a common predictor for all the above three (3) psychosocial effects on Greek employees. In addition to the above, the top predictor for “Work-Engagement” (lack of work-engagement) is the work-environment factor “Commitment to the Workplace” (lack of commitment to the workplace). Finally, the top predictor for the lack of “Job Satisfaction” risk is the lack of “Recognition”. In more detail, our regression analysis also showed that the 34 psychosocial work factors can predict, with good accuracy, the scores of the satisfactory and health scales. First “Burnout” was predicted much better than all other effects, next was “Job Satisfaction, followed by “Work Engagement”, “Self-Rated Health”, “Personal Wellbeing”, and “Intention to leave”. The analysis indicated also the top five predictors for each outcome variable. The top five predictors for “Self-Rated Health” are “Variation of Work”, “Bullying from Customers (External)”, “Work Pace”, “Influence” and “Social Support from Colleagues”.
The top five predictors for “Intention to leave” are “Bullying from Customers (Exter-nal)”, “Commitment to the Workplace”, “Meaning of Work”, “Role Conflicts” and “Job Insecurity”. As nurses account for the largest number of workforces in most healthcare systems, these factors play an important role [47]. Different studies agree with our results that occupational factors such as poor managerial support, lack of meaning for work, role conflicts, lack of opportunities for job promotion, job stress, and work–reward imbalance can be associated with employees’ intention to leave [48,49]. Another study has shown that the supportive work climate was a predictor of retaining nursing profession [50].
The top five predictors for “Job Satisfaction” were “Recognition”, “Quality of leadership”, “Commitment to the Workplace”, “Role Conflicts” and “Physical Work Environment”. Literature review has shown that nurses job satisfaction predictors include working conditions, relationships with coworkers and leaders, pay, promotion, security of employment, responsibility, and working hours [51,52]. The top five predictors for “Personal Well-being” were “Bullying from Customers (External)”, “Insecurity over working conditions”, “Commitment to the Workplace”, “Role Conflicts”, and “Role Clarity”.
The top five predictors for “Burnout” were “Work Life Conflict”, “Work Pace”, “Job Insecurity”, “Quantitative Demands” and “Role Conflicts”. For example, research consistently found that adverse job characteristics such as high workload, low staffing levels, long shifts, low control, low schedule flexibility, time pressure, high job and psychological demands, low task variety, role conflict, low autonomy, negative nurse-physician relationships, poor supervisor/leader support, poor leadership, negative team relationship, and job insecurity were associated with burnout in nursing [53].
The top five predictors for “Work Engagement” were “Commitment to the Workplace”, “Meaning of Work”, “Influence”, “Bullying”, and “Vertical Trust”. Work engagement is a positive, fulfilling state of mind about work that is characterized by vigor, dedication and absorption. Trust (organizational, managerial, and collegiality) and autonomy are the antecedents of work engagement [54]. In nursing, work engagement is the dedicated, absorbing, vigorous nursing practice that emerges from settings of autonomy and trust and results in safer, cost-effective patient outcomes. From this definition, work engagement can be developed as an explanatory middle range theory that conceptually captures the concerns that health professionals have about their work environment. The assumptions that underlie work engagement, the linkages between the antecedents of autonomy and trust and the relationship of the antecedents of trust and autonomy to the closely related concepts of transformational and authentic leadership styles are some of the remaining areas to be developed in a middle range theory.
Our study is the first to be conducted in Greece to validate the COPSOQ III Greek version of this internationally applied tool, nevertheless, several limitations of our study could be acknowledged. We believe that the study sample (N=2.189) was adequate, and the internal consistency of the subscales were satisfactory. Although our study included employees from a variety of occupational sectors and different types of workplaces in Greece, we were not able to perform sector analyses to assess possible differences in the performance of the tool. We recognize our conveniently chosen sample, which precludes the generalization of our findings. In addition, during the study, we did not perform “test-retest” reliability due to the fact that we distributed the GR-Long version of the COPSOQ -III questionnaire (108 items, 40 scales).
To sum up, COPSOQ III provides a comprehensive framework for assessing psychosocial factors at work, which is crucial for designing effective public health strategies. The Greek validation study of COPSOQ III highlights its utility in identifying key psychosocial stressors, such as work-life conflict, bullying, job insecurity, and role conflicts, which are significant predictors of mental health outcomes like burnout and job satisfaction. By incorporating COPSOQ III into public health strategies, policymakers and health professionals can better understand and address the psychosocial dimensions of occupational health. For instance, the results from the COPSOQ III study can inform targeted interventions aimed at reducing work-related stress and enhancing employee well-being. Public health initiatives can leverage this data to implement supportive policies, such as flexible work arrangements, anti-bullying programs, and leadership training, which are critical in mitigating the adverse effects of psychosocial stressors [55]. Additionally, COPSOQ III can serve as a tool for ongoing monitoring and evaluation, ensuring that interventions remain effective and responsive to emerging psychosocial risks. In the context of broader public health challenges, the COPSOQ III Greek validation study aligns with findings from other research on mental health and workplace adaptations post-pandemic. Also, researchers [56,57] emphasize the importance of addressing mental health comprehensively. These studies highlight the need for robust psychosocial assessment tools like COPSOQ III to support mental health initiatives and policy interventions. Furthermore, integrating COPSOQ III into public health strategies can enhance the effectiveness of clinical interventions for mental health disorders in the context of psychotic spectrum disorders and bipolar disorder [58]. By identifying workplace-related psychosocial risks, public health strategies can be tailored to address specific stressors that exacerbate mental health issues, thus improving overall treatment outcomes [59,60,61].
Future research could delve into cognitive-based interventions aimed at improving workplace cognitive function and reducing stress. Examining the underlying neuropsychological mechanisms by which workplace stress affects cognitive performance and overall mental health could provide deeper insights. Moreover, investigating the role of family support in mitigating workplace stress and promoting mental health among employees with high job demands would further this line of research. Comprehensive intervention strategies to address workplace bullying and harassment could be designed and evaluated, considering the psychosocial factors identified by COPSOQ III. Assessing the impact of recent legislative changes on the prevalence and management of workplace bullying and harassment in Greece could provide actionable insights.
5. Conclusions
In conclusion, the Greek version of the COPSOQ III (GR) exhibited good psychometric properties for most of the scales of the questionnaire and meets international standards. We are confident that the COPSOQ III (GR) can be recommended as a valid and highly useful instrument for research as well as for risk assessment within different public and or private enterprises. COSPQO III (GR) covers a multitude of theoretical approaches and gives comprehensive information on psychosocial working conditions supporting evidence-based organizational research and diagnosis and facilitating advanced psychosocial risk management of organizational change for both public and private sector’s entities.
Author Contributions
Conceptualization, A.K., D.A., M.M., C.H., M.G. and M.S.; methodology, A.K., D.A., M.M., C.H., M.G. and M.S.; software, A.K., D.A., M.M., C.H., M.G. and M.S.; validation, A.K., D.A., M.M., C.H., M.G. and M.S..; formal analysis, A.K., D.A., M.M., C.H., M.G. and M.S.; investigation, A.K., D.A., M.M., C.H., M.G. and M.S.; resources, A.K., D.A., M.M., C.H., M.G. and M.S.; data curation, A.K., D.A., M.M., C.H., M.G. and M.S.; writing—original draft preparation, A.K., D.A., M.M., C.H., M.G. and M.S.; writing—review and editing, A.K., D.A., M.M., C.H., M.G. and M.S.; visualization, A.K., D.A., M.M., C.H., M.G. and M.S.; supervision, A.K., D.A., M.M., C.H., M.G. and M.S.; project administration, A.K., D.A., M.M., C.H., M.G. and M.S.; funding acquisition, A.K., D.A., M.M., C.H., M.G. and M.S. All authors have read and agreed to the published version of the manuscript.
Funding
This research received no external funding.
Informed Consent Statement
Informed consent was obtained from all subjects involved in the study.
Data Availability Statement
The original data presented in the study are openly available in Zenodo Repository at https://doi.org/10.5281/zenodo.10949615. Data are available under the terms of the Creative Commons Attribution 4.0 International license (CC-BY 4.0).
Acknowledgments
The authors would like to thank the participants of this study for their contribution. Also, we would like to thank the Steering Committee of COPSOQ Network, for the overall scientific support and collaboration in the process for forward-backward translation as well as in the overall development and statistical validation process of the Greek COPSOQ-III questionnaire (COPSOQ-III-GR Long and Middle versions).
Conflicts of Interest
The authors declare no conflicts of interest.
References
- Magnavita, N.; Soave, P.M.; Ricciardi, W.; Antonelli, M. Occupational Stress and Mental Health among Anesthetists during the COVID-19 Pandemic. Int. J. Environ. Res. Public Health 2020, 17, 8245. [Google Scholar] [CrossRef] [PubMed]
- Giménez-Espert, M.d.C.; Prado-Gascó, V.; Soto-Rubio, A. Psychosocial Risks, Work Engagement, and Job Satisfaction of Nurses During COVID-19 Pandemic. Front. Public Heal. 2020, 8, 566896. [Google Scholar] [CrossRef]
- Koren, H.; Milaković, M.; Bubaš, M.; Bekavac, P.; Bekavac, B.; Bucić, L.; Čvrljak, J.; Capak, M.; Jeličić, P. Psychosocial risks emerged from COVID-19 pandemic and workers’ mental health. Front. Psychol. 2023, 14, 1148634. [Google Scholar] [CrossRef] [PubMed]
- Huei, L.C.; Ya-Wen, L.; Ming, Y.C.; Chen, H.L.; Yi, W.J.; Hung, L.M. Occupational health and safety hazards faced by healthcare professionals in Taiwan: A systematic review of risk factors and control strategies. SAGE Open Med. 2020, 8, 2050312120918999. [Google Scholar] [CrossRef]
- Rigotti, T.; Yang, L.Q.; Jiang, Z.; Newman, A.; De Cuyper, N.; Sekiguchi, T. Work-related psychosocial risk factors and coping resources during the COVID-19 crisis. Applied Psychology: Psychologie Appliquée 2021, 70, 3. [Google Scholar] [CrossRef] [PubMed]
- Oikonomou, V.; Gkintoni, E.; Halkiopoulos, C.; Karademas, E.C. Quality of Life and Incidence of Clinical Signs and Symptoms among Caregivers of Persons with Mental Disorders: A Cross-Sectional Study. Healthcare 2024, 12, 269. [Google Scholar] [CrossRef]
- Soto-Rubio, A.; Giménez-Espert, M.d.C.; Prado-Gascó, V. Effect of Emotional Intelligence and Psychosocial Risks on Burnout, Job Satisfaction, and Nurses’ Health during the COVID-19 Pandemic. Int. J. Environ. Res. Public Heal. 2020, 17, 7998. [Google Scholar] [CrossRef] [PubMed]
- van der Molen, H.F.; Nieuwenhuijsen, K.; Frings-Dresen, M.H.W.; de Groene, G. Work-related psychosocial risk factors for stress-related mental disorders: an updated systematic review and meta-analysis. BMJ Open 2020, 10, e034849. [Google Scholar] [CrossRef] [PubMed]
- Gkintoni, E.; Kourkoutas, E.; Yotsidi, V.; Stavrou, P.D.; Prinianaki, D. Clinical Efficacy of Psychotherapeutic Interventions for Post-Traumatic Stress Disorder in Children and Adolescents: A Systematic Review and Analysis. Children 2024, 11, 579. [Google Scholar] [CrossRef]
- Franklin, P.; Gkiouleka, A. A Scoping Review of Psychosocial Risks to Health Workers during the Covid-19 Pandemic. Int. J. Environ. Res. Public Health 2021, 18, 2453. [Google Scholar] [CrossRef]
- Taibi, Y.; Metzler, Y.A.; Bellingrath, S.; Müller, A. A systematic overview on the risk effects of psychosocial work characteristics on musculoskeletal disorders, absenteeism, and workplace accidents. Appl. Ergon. 2021, 95, 103434. [Google Scholar] [CrossRef] [PubMed]
- Gkintoni, E.; Skokou, M.; Gourzis, P. Integrating Clinical Neuropsychology and Psychotic Spectrum Disorders: A Systematic Analysis of Cognitive Dynamics, Interventions, and Underlying Mechanisms. Medicina 2024, 60, 645. [Google Scholar] [CrossRef]
- Obrenovic, B.; Jianguo, D.; Khudaykulov, A.; Khan, M.A.S. Work-Family Conflict Impact on Psychological Safety and Psychological Well-Being: A Job Performance Model. Front. Psychol. 2020, 11, 475. [Google Scholar] [CrossRef]
- Gkintoni, E.; Ortiz, P.S. Neuropsychology of Generalized Anxiety Disorder in Clinical Setting: A Systematic Evaluation. Healthcare 2023, 11, 2446. [Google Scholar] [CrossRef] [PubMed]
- Dar, T.; Radfar, A.; Abohashem, S.; Pitman, R.; Tawakol, A.; Osborne, M. Psychosocial stress and cardiovascular disease. Current Treatment Options in Cardiovascular Medicine 2019, 21, 23. [Google Scholar] [CrossRef] [PubMed]
- Teo, S.T.; Bentley, T.; Nguyen, D. Psychosocial work environment, work engagement, and employee commitment: A moderated, mediation model. International Journal of Hospitality Management 2020, 88, 102415. [Google Scholar] [CrossRef]
- Ibrahim, R.Z.A.R.; Zalam, W.Z.M.; Foster, B.; Afrizal, T.; Johansyah, M.D.; Saputra, J.; Abu Bakar, A.; Dagang, M.M.; Ali, S.N.M. Psychosocial Work Environment and Teachers’ Psychological Well-Being: The Moderating Role of Job Control and Social Support. Int. J. Environ. Res. Public Heal. 2021, 18, 7308. [Google Scholar] [CrossRef]
- Hu, Q.; Dollard, M.F.; Taris, T.W. Organizational context matters: Psychosocial safety climate as a precursor to team and individual motivational functioning. Saf. Sci. 2022, 145. [Google Scholar] [CrossRef]
- Östergård, K.; Kuha, S.; Kanste, O. Health-care leaders’ and professionals’ experiences and perceptions of compassionate leadership: A mixed-methods systematic review. Leadersh. Heal. Serv. 2023, 37, 49–65. [Google Scholar] [CrossRef]
- Antonopoulou, H.; Halkiopoulos, C.; Barlou, O.; Beligiannis, G.N. Associations between Traditional and Digital Leadership in Academic Environment: During the COVID-19 Pandemic. Emerg. Sci. J. 2021, 5, 405–428. [Google Scholar] [CrossRef]
- Boitshwarelo, T.; Koen, M.P.; Rakhudu, M.A. Strengths employed by resilient nurse managers in dealing with workplace stressors in public hospitals. Int. J. Afr. Nurs. Sci. 2020, 13, 100252. [Google Scholar] [CrossRef]
- Quinane, E.; Bardoel, E.A.; Pervan, S. CEOs, leaders and managing mental health: a tension-centered approach. Int. J. Hum. Resour. Manag. 2021, 32, 3157–3189. [Google Scholar] [CrossRef]
- Antonopoulou, H.; Halkiopoulos, C.; Barlou, O.; Beligiannis, G.N. Transition from Educational Leadership to e-Leadership: A Data Analysis Report from TEI of Western Greece. Int. J. Learn. Teach. Educ. Res. 2019, 18, 238–255. [Google Scholar] [CrossRef]
- Banerjee, P. The Nexus of Change Management and Sustainable Leadership: Shaping Organizational Social Impact. Diversity, Equity and Inclusion 2024, 184–197. [CrossRef]
- Antonopoulou, H.; Halkiopoulos, C.; Barlou, O.; Beligiannis, G.N. Transformational Leadership and Digital Skills in Higher Education Institutes: During the COVID-19 Pandemic. Emerg. Sci. J. 2021, 5, 1–15. [Google Scholar] [CrossRef]
- Gkintoni, E.; Halkiopoulos, C.; Antonopoulou, H. Neuroleadership as an Asset in Educational Settings: An Overview. Emerg. Sci. J. 2022, 6, 893–904. [Google Scholar] [CrossRef]
- O'Donovan, R.; Rogers, L.; Khurshid, Z.; De Brún, A.; Nicholson, E.; O'Shea, M. . & McAuliffe, E. (). A systematic review exploring the impact of focal leader behaviours on health care team performance. Journal of Nursing Management 2021, 29, 1420–1443. [Google Scholar] [CrossRef]
- Salmanizadeh, F.; Ameri, A.; Bahaadinbeigy, K. Methods of Reimbursement for Telemedicine Services: A Scoping Review. Med J. Islam. Repub. Iran 2022, 36, 481–490. [Google Scholar] [CrossRef] [PubMed]
- Koutsopoulou, I.; Grace, E.; Gkintoni, E.; Olff, M. Validation of the Global Psychotrauma Screen for adolescents in Greece. Eur. J. Trauma Dissociation 2024, 8. [Google Scholar] [CrossRef]
- Burr, H.; Berthelsen, H.; Moncada, S.; Nübling, M.; Dupret, E.; Demiral, Y.; Oudyk, J.; Kristensen, T.S.; Llorens, C.; Navarro, A.; et al. The Third Version of the Copenhagen Psychosocial Questionnaire. Saf. Health Work. 2019, 10, 482–503. [Google Scholar] [CrossRef]
- Nübling, M.; Burr, H.; Moncada, S.; Kristensen, T.S. COPSOQ International Network: Co-operation for research and assessment of psychosocial factors at work. Public Heal. Forum 2014, 22, 18–e1. [Google Scholar] [CrossRef]
- Dicke, T.; Marsh, H.W.; Riley, P.; Parker, P.D.; Guo, J.; Horwood, M. Validating the Copenhagen Psychosocial Questionnaire (COPSOQ-II) Using Set-ESEM: Identifying Psychosocial Risk Factors in a Sample of School Principals. Front. Psychol. 2018, 9, 584. [Google Scholar] [CrossRef]
- Rosário, S.; Azevedo, L.F.; Fonseca, J.A.; Nienhaus, A.; Nübling, M.; Da Costa, J.T. The Portuguese long version of the Copenhagen Psychosocial Questionnaire II (COPSOQ II) – a validation study. J. Occup. Med. Toxicol. 2017, 12, 24. [Google Scholar] [CrossRef] [PubMed]
- Vanos, J.; Vecellio, D.J.; Kjellstrom, T. Workplace heat exposure, health protection, and economic impacts: A case study in Canada. Am. J. Ind. Med. 2019, 62, 1024–1037. [Google Scholar] [CrossRef] [PubMed]
- Kristensen, T.S.; Hannerz, H.; Høgh, A.; Borg, V. The Copenhagen Psychosocial Questionnaire—A tool for the assessment and improvement of the psychosocial work environment. Scand. J. Work Environ. Health 2005, 31, 438–449. [Google Scholar] [CrossRef] [PubMed]
- Pejtersen, J.H.; Søndergå, T.; Kristensen, R.D.; Borg, V.; Bue Bjorner, J. The second version of the Copenhagen Psychosocial Questionnaire. Scand. J. Public Health 2010, 38, 8–24. [Google Scholar] [CrossRef] [PubMed]
- Lincke, H.V.; Theorell, T. COPSOQ III in Germany: Validation of a standard instrument to measure psychosocial factors at work. Journal of Occupational Medicine and Toxicology 2021, 16, 50. [Google Scholar] [CrossRef]
- Berthelsen, H.; Westerlund, H.; Bergström, G.; Burr, H. Validation of the Copenhagen Psychosocial Questionnaire Version III and Establishment of Benchmarks for Psychosocial Risk Management in Sweden. Int. J. Environ. Res. Public Heal. 2020, 17, 3179. [Google Scholar] [CrossRef] [PubMed]
- ahan, C.B.; Aydın, H. A novel version of Copenhagen Psychosocial Questionnaire-3: Turkish validation study. Archives of Environmental & Occupational Health 2018, 73, 354–362. [Google Scholar] [CrossRef]
- Nazari, G.; Lu, S.; Packham, T.; MacDermid, J.C. Rasch analysis of the firefighters’ critical incident inventory questionnaire. Work 2022, 71, 281–291. [Google Scholar] [CrossRef]
- Kotsakis, N. e. , & Nübling. (2018). Employability in the 21st Century. The Greek COPSOQ v.3 Validation Study, a post crisis assessment of the Psychosocial Risks (p. 63). Leuven,Belgium: Conference Book, 2nd International Conference on Sustainable Employability. https://zenodo.org/doi/10.5281/zenodo.12793789.
- Kotsakis, A. Conceptual framework development and systemic modelling for the assessment of strategic organizational change in public sector entities, PhD. Thesis, University of Piraeus, Greece, 2019. [Google Scholar] [CrossRef]
- Kotsakis, A.; Avraam, D. (2024). The COPSOQ III Greek validation study [Data set]. Zenodo. [CrossRef]
- Rizopoulos, D. ltm: AnRPackage for Latent Variable Modeling and Item Response Theory Analyses. J. Stat. Softw. 2006, 17, 1–25. [Google Scholar] [CrossRef]
- Gamer, M.; Lemon, J.; Fellows, I.; Singh, P. Various Coefficients of Interrater Reliability and Agreement. 2012. Available online: https://cran.r-project.org/web/packages/irr/irr.pdf.
- Plique, G. Talisman: a JavaScript archive of fuzzy matching, information retrieval and record linkage building blocks. J. Open Source Softw. 2020, 5, 2405. [Google Scholar] [CrossRef]
- Nardi, D.A.; Gyurko, C.C. The Global Nursing Faculty Shortage: Status and Solutions for Change. J. Nurs. Sch. 2013, 45, 317–326. [Google Scholar] [CrossRef]
- Hasselhorn, H.M.; Müller, B.H. Nursing in Europe: Intention to leave the nursing profession. NEXT Scientific Report 2005, 17–24. [Google Scholar]
- de Oliveira, D.R.; Griep, R.H.; Rotenberg, L. Intention to leave profession, psychosocial environment and self-rated health among registered nurses from large hospitals in Brazil: A cross-sectional study. BMC Health Services Research 2017, 17, 21. [Google Scholar] [CrossRef] [PubMed]
- Derycke, H.; Vlerick, P.; Burnay, N.; Decleire, C.; D'Hoore, W.; Hasselhorn, H.; Braeckman, L. Impact of the effort–reward imbalance model on intent to leave among Belgian health care workers: A prospective study. J. Occup. Organ. Psychol. 2010, 83, 879–893. [Google Scholar] [CrossRef]
- Lu, H.; While, A.E.; Barriball, K.L. Job satisfaction among nurses: a literature review. Int. J. Nurs. Stud. 2005, 42, 211–227. [Google Scholar] [CrossRef] [PubMed]
- Scheetz, L.J.; Zhang, J.; Kolassa, J.E.; Allen, P.; Allen, M. Evaluation of Injury Databases as a Preliminary Step to Developing a Triage Decision Rule. J. Nurs. Sch. 2008, 40, 144–150. [Google Scholar] [CrossRef] [PubMed]
- Dall’ora, C.; Ball, J.; Reinius, M.; Griffiths, P. Burnout in nursing: a theoretical review. Hum. Resour. Heal. 2020, 18, 41. [Google Scholar] [CrossRef]
- Bargagliotti, L.A. Work engagement in nursing: a concept analysis. J. Adv. Nurs. 2012, 68, 1414–1428. [Google Scholar] [CrossRef]
- Antonopoulou, H.; Halkiopoulos, C.; Barlou, O.; Beligiannis, G.N. Leadership Types and Digital Leadership in Higher Education: Behavioural Data Analysis from University of Patras in Greece. Int. J. Learn. Teach. Educ. Res. 2020, 19, 110–129. [Google Scholar] [CrossRef]
- Gkintoni, E.; Kourkoutas, E.; Vassilopoulos, S.P.; Mousi, M. Clinical Intervention Strategies and Family Dynamics in Adolescent Eating Disorders: A Scoping Review for Enhancing Early Detection and Outcomes. J. Clin. Med. 2024, 13, 4084. [Google Scholar] [CrossRef] [PubMed]
- Giménez-Espert, M.d.C.; Prado-Gascó, V.; Soto-Rubio, A. Psychosocial Risks, Work Engagement, and Job Satisfaction of Nurses During COVID-19 Pandemic. Front. Public Heal. 2020, 8, 566896. [Google Scholar] [CrossRef] [PubMed]
- Gkintoni, E. Clinical neuropsychological characteristics of bipolar disorder, with a focus on cognitive and linguistic pattern: a conceptual analysis. F1000Research 2023, 12, 1235. [Google Scholar] [CrossRef] [PubMed]
- Malliarou, M.; Kotsakis, A. Editorial: Psychosocial work environment during the COVID-19 pandemic. Front. Public Heal. 2023, 11, 1272290. [Google Scholar] [CrossRef] [PubMed]
- Berthelsen, H.; Westerlund, H.; Bergström, G.; Burr, H. Validation of the Copenhagen Psychosocial Questionnaire Version III and Establishment of Benchmarks for Psychosocial Risk Management in Sweden. Int. J. Environ. Res. Public Heal. 2020, 17, 3179. [Google Scholar] [CrossRef]
- Tzenetidis, V.; Kotsakis, A.; Gouva, M.; Tsaras, K.; Malliarou, M. The relationship between psychosocial work environment and nurses' performance, on studies that used the validated instrument Copenhagen Psychosocial Questionnaire (COPSOQ): An empty scoping review. Polski Merkur. Lek. 2023, 51, 417–422. [Google Scholar] [CrossRef]
Figure 1.
Pairwise Pearson correlations. The 40 scales are classified in 8 domains.
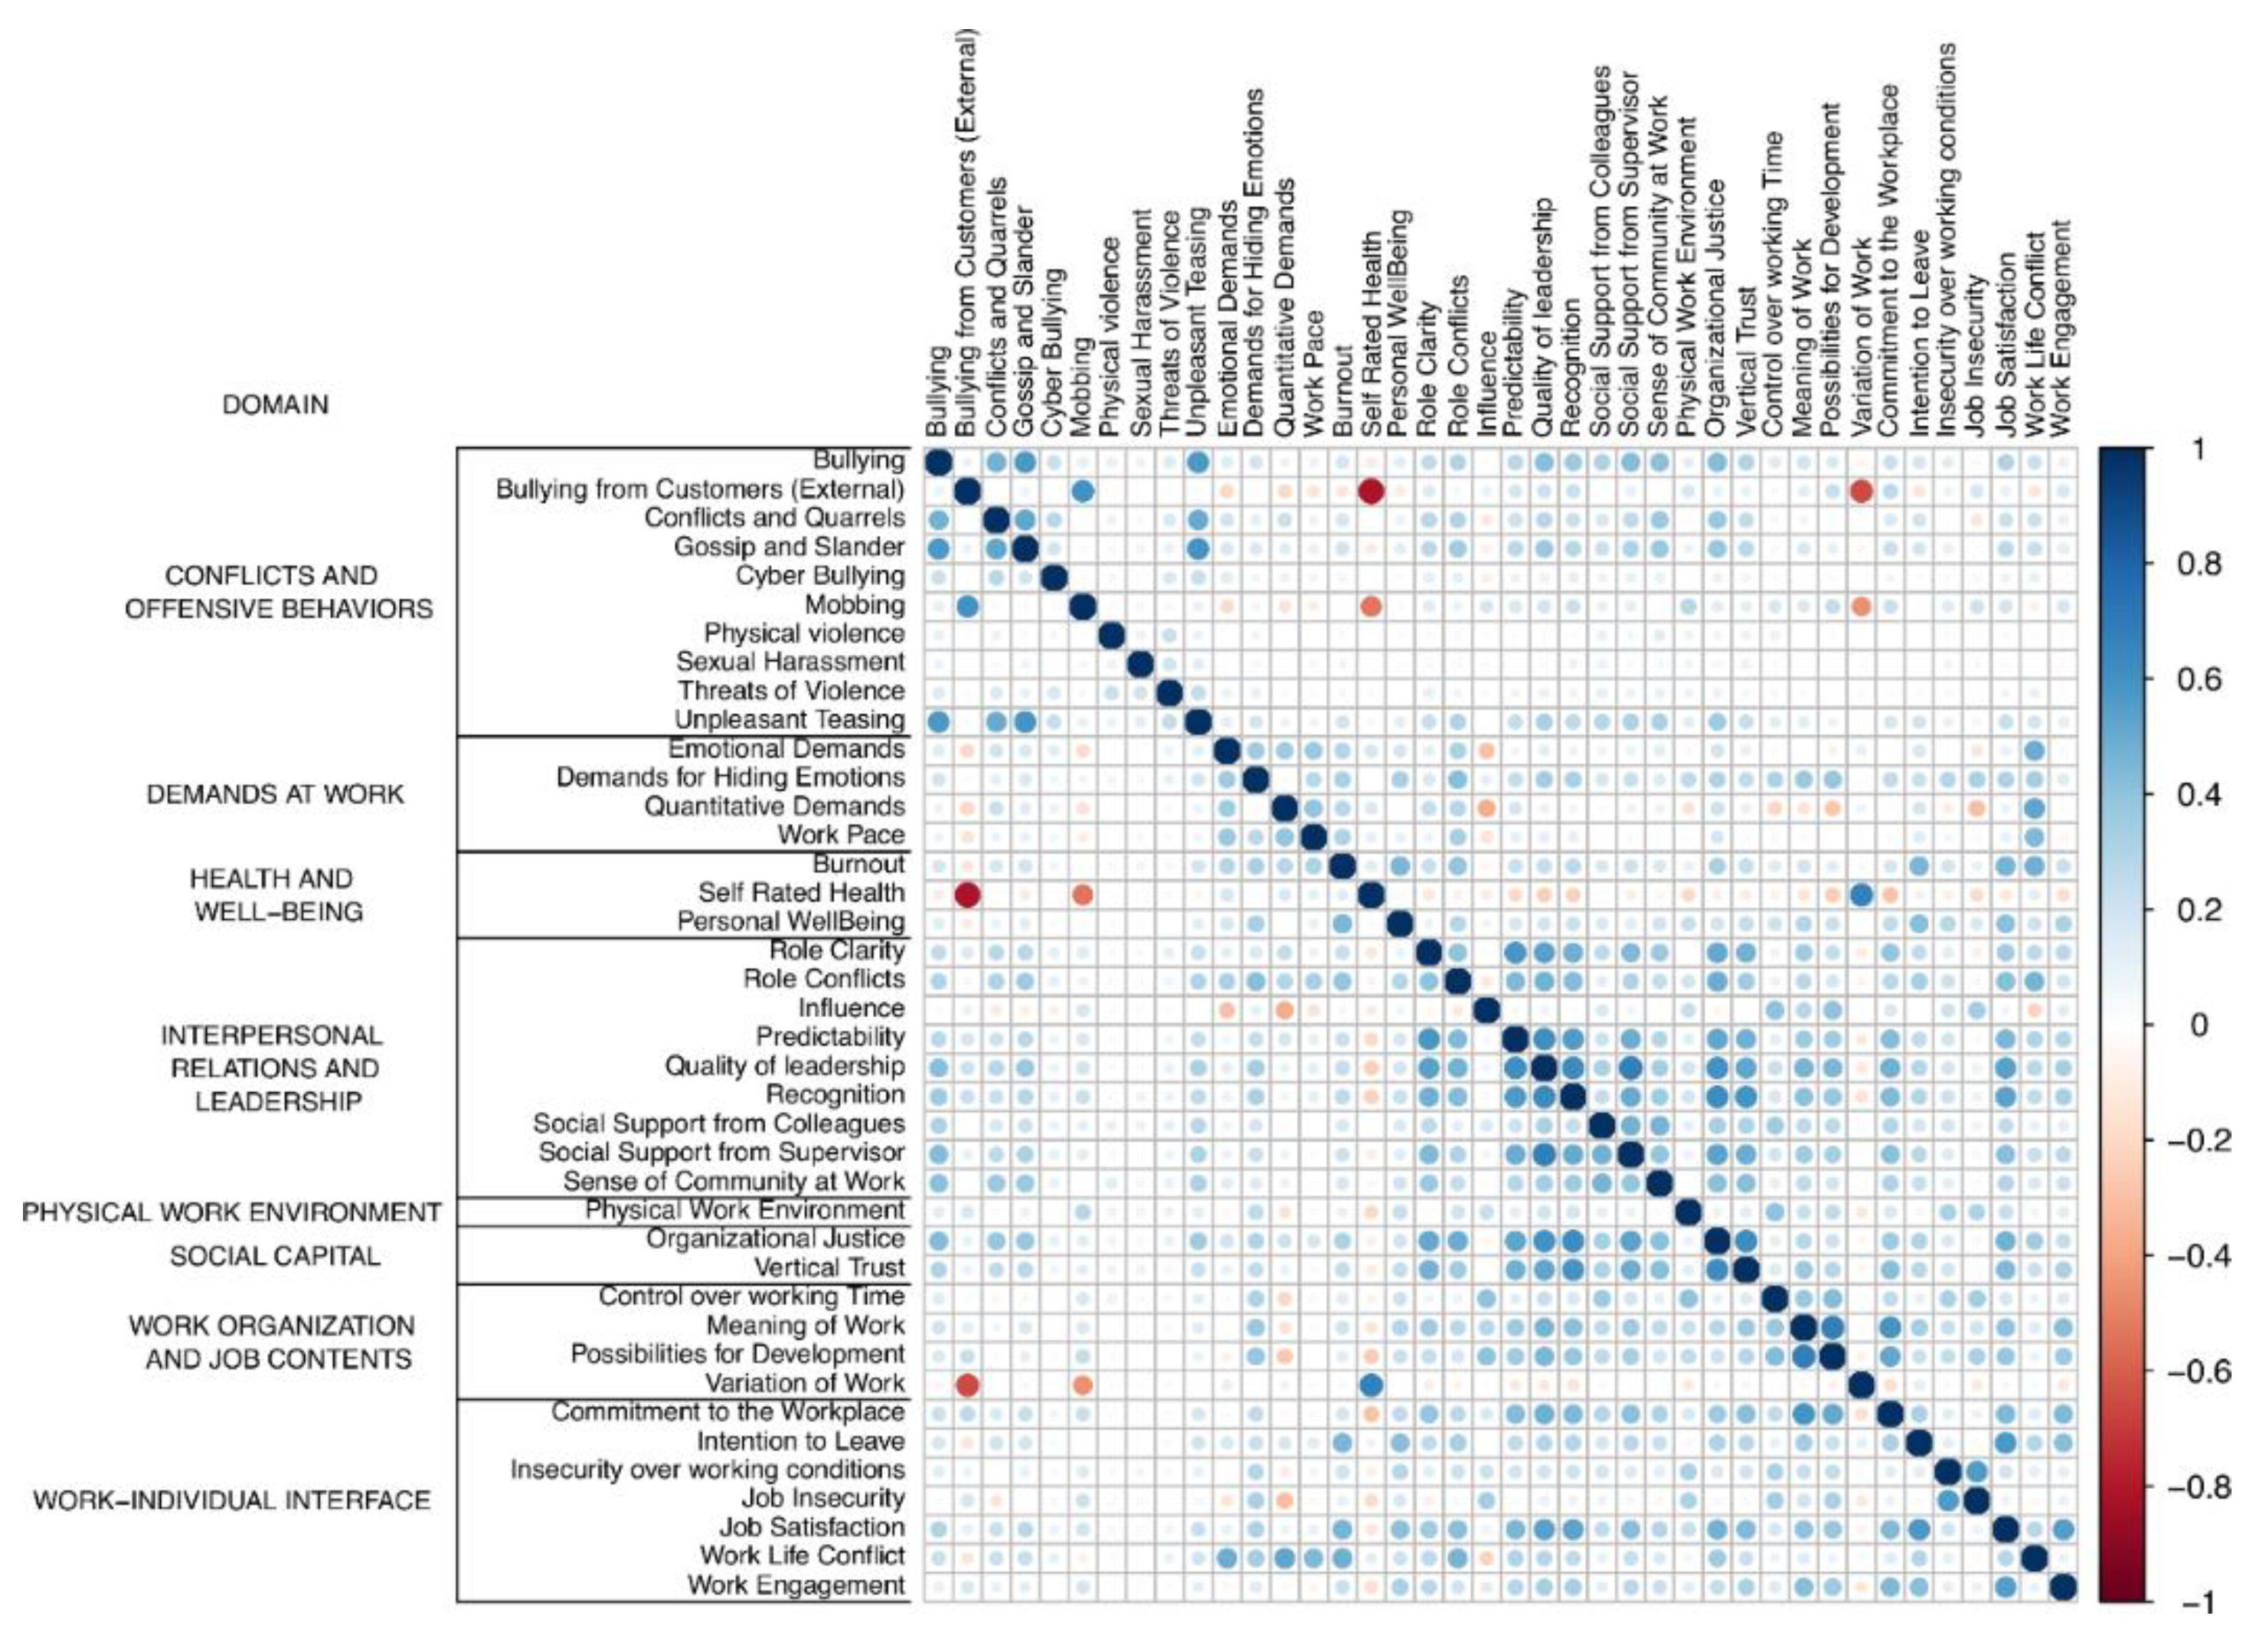

Table 1.
Study sample: socio-demographic and occupational characteristics.
| Feature | |||
|---|---|---|---|
| Category | Frequency | Percentage | |
| Gender | Male | 1105 | 50.5 |
| Female | 1084 | 49.5 | |
| Age groups | up to 24 | 693 | 31.7 |
| 25-34 | 377 | 17.2 | |
| 35-44 | 673 | 30.7 | |
| 45-54 | 376 | 17.2 | |
| 55 and more | 70 | 3.2 | |
| Supervisor | no (jobs with no supervisors) | 384 | 17.5 |
| Yes | 470 | 21.5 | |
| no (jobs with supervisors) | 1335 | 61.0 | |
| Interface with external clients | No, never | 923 | 42.2 |
| Yes, less than 1 time per day (on average) | 103 | 4.7 | |
| Yes, 1 to 5 times per day (on average) | 151 | 6.9 | |
| Yes, 6 to 14 times per day (on average) | 233 | 10.6 | |
| Yes, 15 or more times per day (average) | 779 | 35.6 | |
| Sector | Public | 954 | 43.6 |
| Private | 1235 | 56.4 | |
| Profession | Admin, leading | 336 | 15.3 |
| Tech, leading | 190 | 8.7 | |
| Workers | 202 | 9.2 | |
| Tech: engineers | 56 | 2.6 | |
| Tech: technicians | 274 | 12.5 | |
| Admin, not leading | 567 | 25.9 | |
| Tech, not leading | 97 | 4.4 | |
| Other prof. | 467 | 21.3 | |
Table 2.
Descriptive statistics and reliability of scales.
| Scale | N | a | ICC | M | SD | Floor Effect (%) | Ceiling Effect (%) |
|---|---|---|---|---|---|---|---|
| Burnout | 5 | 0.73 | 0.32 | 43.64 | 26.71 | 12.41 | 5.24 |
| Bullying | 2 | 0.94 | 0.87 | 13.47 | 20.52 | 61.06 | 1.1 |
| Bullying from Customers (External) | 9 | 0.96 | 0.68 | 64.87 | 38.96 | 16.33 | 46.34 |
| Role Clarity | 3 | 0.81 | 0.53 | 20.1 | 21.94 | 43 | 1.48 |
| Role Conflicts | 3 | 0.82 | 0.6 | 49.38 | 29.02 | 13.11 | 10.43 |
| Conflicts and Quarrels | 1 | - | - | 10.27 | 17.23 | 67.98 | 0.23 |
| Control over working Time | 2 | 0.49 | 0.3 | 38.01 | 29.55 | 18.82 | 10 |
| Commitment to the Workplace | 2 | 0.68 | 0.3 | 33.22 | 30.49 | 32.09 | 7.51 |
| Emotional Demands | 2 | 0.57 | 0.09 | 36.45 | 33.22 | 35.38 | 7.72 |
| Self-Rated Health | 1 | - | - | 29.56 | 31.75 | 23.98 | 4.93 |
| Gossip and Slander | 1 | - | - | 18.73 | 24.18 | 50.53 | 2.1 |
| Demands for Hiding Emotions | 2 | 0.73 | 0.5 | 57.47 | 32.54 | 12.79 | 22.09 |
| Cyber Bullying | 1 | - | - | 0.9 | 6.1 | 97.26 | 0.05 |
| Influence | 3 | 0.8 | 0.55 | 63.32 | 28.14 | 3.33 | 25.17 |
| Intention to Leave | 2 | 0.81 | 0.68 | 16.21 | 22.79 | 55 | 2.49 |
| Insecurity over working conditions | 3 | 0.65 | 0.28 | 32.22 | 32.45 | 37.43 | 8.82 |
| Job Insecurity | 3 | 0.8 | 0.56 | 47.99 | 34.38 | 21.08 | 17.36 |
| Job Satisfaction | 7 | 0.88 | 0.47 | 33.35 | 24.18 | 18.67 | 3 |
| Organizational Justice | 2 | 0.72 | 0.56 | 37.6 | 25.29 | 15.19 | 4.29 |
| Mobbing | 5 | 0.99 | 0.96 | 58.38 | 46.47 | 35.79 | 55.29 |
| Meaning of Work | 2 | 0.89 | 0.78 | 25.23 | 26.31 | 38.97 | 3.63 |
| Possibilities for Development | 2 | 0.84 | 0.72 | 41.83 | 31.56 | 20.05 | 12.43 |
| Predictability | 2 | 0.68 | 0.34 | 42.1 | 29.49 | 16.49 | 9.48 |
| Physical violence | 1 | - | - | 0.3 | 3.53 | 99.18 | 0 |
| Personal Well-being | 6 | 0.87 | 0.47 | 24.96 | 26.89 | 43.17 | 2.22 |
| Physical Work Environment | 6 | 0.83 | 0.4 | 36.62 | 35.85 | 37.87 | 11.69 |
| Quantitative Demands | 3 | 0.79 | 0.52 | 34 | 27.19 | 26.13 | 2.68 |
| Quality of leadership | 4 | 0.87 | 0.56 | 43.18 | 29.97 | 15.63 | 11.58 |
| Recognition | 1 | - | - | 40.81 | 28.81 | 16.26 | 8.59 |
| Social Support from Colleagues | 3 | 0.41 | 0.15 | 31.37 | 26.76 | 26.33 | 4.84 |
| Sexual Harassment | 1 | - | - | 0.32 | 3.1 | 98.81 | 0 |
| Social Support from Supervisor | 4 | 0.76 | 0.37 | 30.38 | 28.25 | 31.43 | 5.11 |
| Sense of Community at Work | 2 | 0.7 | 0.54 | 13.62 | 17.07 | 54.59 | 0.34 |
| Vertical Trust | 2 | 0.64 | 0.47 | 27.07 | 22.22 | 26.79 | 1.69 |
| Threats of Violence | 1 | - | - | 0.7 | 4.7 | 97.58 | 0 |
| Unpleasant Teasing | 1 | - | - | 9.86 | 18.58 | 71.63 | 0.73 |
| Variation of Work | 1 | - | - | 10.31 | 18.25 | 4.39 | 0.59 |
| Work Life Conflict | 7 | 0.84 | 0.34 | 34.65 | 33.35 | 37.34 | 8.61 |
| Work Engagement | 3 | 0.69 | 0.36 | 27.25 | 22.43 | 26.62 | 1.37 |
| Work Pace | 2 | 0.82 | 0.68 | 71.55 | 18.65 | 0.48 | 17.95 |
Table 3.
EFA on psychosocial work factors: rotated factor matrix.
| Psychosocial work factorsa | Factor loadingb | ||||
|---|---|---|---|---|---|
| 1 | 2 | 3 | 4 | 5 | |
| Bullying | 0.32 | 0.68 | |||
| Bullying from Customers (External) | 0.85 | ||||
| Role Clarity | 0.67 | ||||
| Role Conflicts | 0.41 | 0.53 | |||
| Conflicts and Quarrels | 0.60 | ||||
| Control over working Time | 0.63 | ||||
| Commitment to the Workplace | 0.62 | ||||
| Emotional Demands | 0.60 | ||||
| Gossip and Slander | 0.64 | ||||
| Demands for Hiding Emotions | 0.51 | 0.40 | |||
| Cyber Bullying | 0.31 | ||||
| Influence | 0.52 | 0.36 | |||
| Insecurity over working conditions | 0.53 | ||||
| Job Insecurity | 0.67 | ||||
| Organizational Justice | 0.67 | ||||
| Mobbing | 0.61 | ||||
| Meaning of Work | 0.58 | 0.45 | |||
| Possibilities for Development | 0.51 | 0.56 | |||
| Predictability | 0.68 | ||||
| Physical violence | |||||
| Physical Work Environment | 0.50 | ||||
| Quantitative Demands | -0.39 | 0.58 | |||
| Quality of leadership | 0.75 | ||||
| Recognition | 0.69 | ||||
| Social Support from Colleagues | 0.39 | 0.31 | |||
| Sexual Harassment | |||||
| Social Support from Supervisor | 0.67 | ||||
| Sense of Community at Work | 0.48 | 0.39 | |||
| Vertical Trust | 0.67 | ||||
| Threats of Violence | |||||
| Unpleasant Teasing | 0.74 | ||||
| Variation of Work | -0.71 | ||||
| WorkLife Conflict | 0.71 | ||||
| Work Pace | 0.59 | ||||
aEigenvalue ≥1, total variance explained 44.8%. bOnly loadings ≥ |0.30| are shown.
Table 4.
EFA on effects: rotated factor matrix.
| Effectsa | Factor loadingb | |
|---|---|---|
| 1 | 2 | |
| Self Rated Health | -0.55 | |
| Intention to Leave | 0.70 | |
| Job Satisfaction | 0.73 | 0.47 |
| Personal Well-being | 0.62 | |
| Burnout | 0.69 | |
| Work Engagement | 0.51 | 0.44 |
a Eigenvalue ≥1, total variance explained 48.0%. b Only loadings ≥ |0.40| are shown.
Table 5.
Estimates and standard errors of the models where each outcome variable is regressed in all 34 psychosocial work factors.
Table 5.
Estimates and standard errors of the models where each outcome variable is regressed in all 34 psychosocial work factors.
| Outcome Exposure |
Self-Rated Health | Intention to leave | Job Satisfaction | Personal Well-being | Burnout | Work Engagement |
|---|---|---|---|---|---|---|
| Bullying | -0.022 (0.031) | -0.028 (0.027) | 0.012 (0.021) | -0.023 (0.027) | -0.034 (0.023) | -0.086 (0.023) *** |
| Bullying from Customers (External) | -0.341 (0.018) *** | -0.120 (0.016) *** | -0.028 (0.012) * | -0.116 (0.016) *** | -0.039 (0.014) ** | 0.048 (0.013) *** |
| Role Clarity | 0.068 (0.033) * | -0.044 (0.030) | -0.060 (0.023) ** | -0.143 (0.029) *** | 0.025 (0.025) | 0.001 (0.025) |
| Role Conflicts | 0.019 (0.024) | 0.117 (0.021) *** | 0.079 (0.016) *** | 0.109 (0.021) *** | 0.082 (0.018) *** | 0.039 (0.018) * |
| Conflicts and Quarrels | 0.021 (0.033) | 0.052 (0.029) | 0.025 (0.022) | 0.025 (0.029) | 0.039 (0.025) | 0.039 (0.024) |
| Control over working Time | -0.032 (0.024) | -0.018 (0.021) | -0.047 (0.016) ** | 0.011 (0.021) | 0.012 (0.018) | -0.013 (0.018) |
| Commitment to the Workplace | -0.067 (0.024) ** | 0.141 (0.022) *** | 0.086 (0.016) *** | 0.114 (0.021) *** | 0.031 (0.018) | 0.135 (0.018) *** |
| Emotional Demands | 0.072 (0.022) ** | 0.017 (0.020) | -0.005 (0.015) | 0.086 (0.020) *** | 0.039 (0.017) * | -0.004 (0.017) |
| Gossip and Slander | -0.059 (0.025) * | -0.010 (0.022) | 0.011 (0.017) | 0.001 (0.022) | 0.021 (0.019) | -0.017 (0.018) |
| Demands for Hiding Emotions | 0.041 (0.021) | 0.005 (0.019) | 0.007 (0.014) | 0.063 (0.018) *** | 0.027 (0.016) | -0.020 (0.015) |
| Cyber Bullying | -0.078 (0.075) | -0.126 (0.067) | 0.048 (0.051) | 0.027 (0.066) | -0.030 (0.057) | 0.001 (0.055) |
| Influence | 0.191 (0.021) *** | 0.021 (0.019) | 0.041 (0.014) ** | 0.033 (0.018) | 0.059 (0.016) *** | 0.073 (0.016) *** |
| Insecurity over working conditions | -0.038 (0.024) | 0.077 (0.021) *** | 0.015 (0.016) | 0.125 (0.021) *** | 0.029 (0.018) | -0.024 (0.018) |
| Job Insecurity | 0.040 (0.021) | -0.070 (0.018) *** | -0.009 (0.014) | 0.018 (0.018) | 0.082 (0.016) *** | 0.038 (0.015) * |
| Organizational Justice | 0.057 (0.031) | 0.006 (0.028) | 0.057 (0.021) ** | -0.001 (0.027) | 0.056 (0.023) * | -0.011 (0.023) |
| Mobbing | -0.021 (0.012) | 0.026 (0.011) * | 0.037 (0.008) *** | 0.026 (0.011) * | 0.019 (0.009) * | 0.018 (0.009) * |
| Meaning of Work | -0.002 (0.027) | 0.148 (0.024) *** | 0.028 (0.018) | 0.082 (0.023) *** | 0.023 (0.020) | 0.121 (0.020) *** |
| Possibilities for Development | -0.093 (0.023) *** | 0.020 (0.021) | 0.046 (0.016) ** | -0.017 (0.020) | -0.012 (0.018) | 0.028 (0.017) |
| Predictability | 0.000 (0.026) | -0.021 (0.023) | 0.042 (0.018) * | 0.038 (0.023) | -0.033 (0.020) | 0.009 (0.019) |
| Physical violence | -0.168 (0.126) | -0.304 (0.113) ** | 0.008 (0.086) | -0.040 (0.111) | 0.042 (0.095) | 0.116 (0.094) |
| Physical Work Environment | 0.006 (0.020) | -0.026 (0.018) | 0.065 (0.014) *** | 0.077 (0.018) *** | 0.007 (0.015) | 0.015 (0.015) |
| Quantitative Demands | 0.069 (0.027) ** | 0.081 (0.024) *** | 0.019 (0.018) | -0.025 (0.023) | 0.095 (0.020) *** | 0.053 (0.020) ** |
| Quality of leadership | -0.115 (0.031) *** | -0.023 (0.027) | 0.115 (0.021) *** | -0.030 (0.027) | -0.036 (0.023) | 0.014 (0.023) |
| Recognition | -0.038 (0.023) | 0.064 (0.020) ** | 0.095 (0.016) *** | 0.013 (0.020) | 0.032 (0.017) | 0.029 (0.017) |
| Social Support from Colleagues | 0.162 (0.032) *** | 0.016 (0.028) | 0.031 (0.021) | 0.026 (0.028) | 0.067 (0.024) ** | -0.051 (0.023) * |
| Sexual Harassment | -0.074 (0.143) | -0.087 (0.128) | -0.027 (0.097) | -0.013 (0.125) | 0.197 (0.108) | -0.141 (0.106) |
| Social Support from Supervisor | 0.056 (0.032) | 0.043 (0.029) | 0.004 (0.022) | -0.063 (0.028) * | 0.004 (0.024) | 0.041 (0.024) |
| Sense of Community at Work | -0.054 (0.037) | 0.013 (0.033) | 0.028 (0.025) | 0.119 (0.033) *** | -0.003 (0.028) | 0.098 (0.028) *** |
| Vertical Trust | 0.050 (0.032) | 0.030 (0.029) | 0.054 (0.022) * | 0.105 (0.028) *** | 0.033 (0.024) | 0.087 (0.024) *** |
| Threats of Violence | -0.059 (0.099) | 0.063 (0.089) | 0.018 (0.068) | -0.121 (0.087) | -0.084 (0.075) | -0.127 (0.074) |
| Unpleasant Teasing | -0.019 (0.032) | 0.081 (0.029) ** | -0.035 (0.022) | -0.019 (0.028) | 0.002 (0.025) | 0.025 (0.024) |
| Variation of Work | 0.706 (0.030) *** | 0.056 (0.026) * | 0.037 (0.020) | -0.045 (0.026) | 0.026 (0.022) | 0.020 (0.022) |
| WorkLife Conflict | 0.018 (0.028) | 0.063 (0.025) * | 0.048 (0.019) * | 0.031 (0.024) | 0.207 (0.021) *** | 0.015 (0.021) |
| Work Pace | 0.376 (0.025) *** | -0.019 (0.023) | 0.035 (0.017) * | 0.034 (0.022) | 0.171 (0.019) *** | 0.012 (0.019) |
| R2 | 0.795 | 0.558 | 0.874 | 0.711 | 0.901 | 0.794 |
| R2 adjusted | 0.791 | 0.551 | 0.872 | 0.706 | 0.899 | 0.790 |
*** denotes a p-value <0.001, ** denotes a p-value <0.01, * denotes a p-value <0.05.
Table 6.
Model fit parameters and top five predictors for each dependent variable.
| Dependent Scale | Total model fit | Model fit with top fivea predictors | Top fivea predictors | Estimated Coefficient (Std error)b | ||
|---|---|---|---|---|---|---|
| R2 | AIC (df) | R2 | AIC (df) | |||
| Self-Rated Health | 0.795 | 13107.96 (34) | 0.777 | 13229.95 (5) | Variation of Work Bullying from Customers (External) Work Pace Influence Social Support from Colleagues |
0.744 (0.030) -0.385 (0.015) 0.487 (0.017) 0.120 (0.018) 0.089 (0.025) |
| Intention to leave | 0.564 | 12599.47 (40) | 0.524 | 12723.22 (5) | Bullying from Customers (External) Commitment to the Workplace Meaning of Work Role Conflicts Job Insecurity |
-0.106 (0.011) 0.195 (0.021) 0.157 (0.020) 0.256 (0.014) -0.016 (0.013) |
| Job Satisfaction | 0.876 | 11411.47 (40) | 0.861 | 11598.03 (5) | Recognition Quality of leadership Commitment to the Workplace Role Conflicts Physical Work Environment |
0.140 (0.014) 0.200 (0.017) 0.150 (0.014) 0.177 (0.013) 0.109 (0.012) |
| Personal Well-being | 0.718 | 12491.16 (40) | 0.673 | 12745.61 (5) | Bullying from Customers (External) Insecurity over working conditions Commitment to the Workplace Role Conflicts Role Clarity |
-0.046 (0.010) 0.249 (0.017) 0.226 (0.018) 0.270 (0.015) -0.112 (0.025) |
| Burnout | 0.905 | 11798.87 (40) | 0.892 | 12013.86 (5) | Work Life Conflict Work Pace Job Insecurity Quantitative Demands Role Conflicts |
0.244 (0.020) 0.255 (0.015) 0.130 (0.011) 0.074 (0.019) 0.153 (0.015) |
| Work Engagement | 0.806 | 11681.94 (40) | 0.774 | 11943.91 (5) | Commitment to the Workplace Meaning of Work Influence Bullying Vertical Trust |
0.213 (0.017) 0.116 (0.017) 0.165 (0.009) -0.005 (0.017) 0.206 (0.019) |
a Top predictors are the first five workplace factors with the lowest p-values in the full model. b In the model with top five predictors.
Disclaimer/Publisher’s Note: The statements, opinions and data contained in all publications are solely those of the individual author(s) and contributor(s) and not of MDPI and/or the editor(s). MDPI and/or the editor(s) disclaim responsibility for any injury to people or property resulting from any ideas, methods, instructions or products referred to in the content. |
© 2024 by the authors. Licensee MDPI, Basel, Switzerland. This article is an open access article distributed under the terms and conditions of the Creative Commons Attribution (CC BY) license (http://creativecommons.org/licenses/by/4.0/).
Copyright: This open access article is published under a Creative Commons CC BY 4.0 license, which permit the free download, distribution, and reuse, provided that the author and preprint are cited in any reuse.


