Submitted:
23 July 2024
Posted:
23 July 2024
You are already at the latest version
Abstract
Background: Cardiometabolic risk factors (CRFs) are significant health concerns among adults with overweight and obesity. Resistance training (RT) is known to manage CRFs, but the impact of moderate-frequency RT (two to three times weekly) remains unclear.
Methods: We conducted a systematic review and meta-analysis of randomized controlled trials (RCTs) comparing moderate-frequency RT with non-exercise control or usual care in overweight and obese adults. Searches were performed in PubMed, Web of Science, EMBASE, and Cochrane Library up to February 2024, following the PRISMA 2020 guidelines. Eligible studies included non-athletic adults (BMI ≥ 25) aged 18 years or older, with RT interventions lasting 7 weeks or longer.
Results: Fifteen RCTs were included. Moderate-frequency RT significantly reduced systolic blood pressure by -4.66 mmHg (95% CI -9.34 to 0.02, p=0.01) and mean arterial pressure by -6.48 mmHg (95% CI -10.63 to -2.33, p=0.002) compared to controls. Additionally, RT significantly lowered fasting insulin levels by -12.52 mmol/L (95% CI -24.17 to -0.88, p=0.04) and HOMA-IR by -1.49 (95% CI -1.63 to -1.35, p<0.00001). Improvements were more pronounced in participants with dietary control.
Conclusion: Moderate-frequency RT effectively improves CRFs in overweight and obese adults, suggesting its potential as a beneficial intervention for this population.
PROSPERO registration number: CRD42022343167.
Keywords:
resistance training
; overweight
; obesity
; cardiometabolic risk factors
1. Introduction
Over recent decades, significant environmental and lifestyle changes have contributed to the increasing prevalence of overweight and obesity [1,2]. Research strongly links these conditions to cardiometabolic health issues including, including hypertension, hyperglycemia, insulin resistance, high cholesterol, and elevated triglyceride levels [3]. These factors collectively heighten the risk of cardiovascular disease (CVD) and mortality, potentially shortening lifespan [4].
The term “cardiometabolic risk factors (CRFs)” encompasses all risk factors associated with diabetes and CVD, including being overweight and obese, elevated blood glucose and blood pressure, insulin resistance, and abnormal lipid metabolism [5]. Addressing all CRFs is essential due to their interplay, which exacerbates CVD vulnerability and contributes to its pathogenesis [5]. The American Heart Association has issued a statement advocating physical activity as a strategy to ameliorate CRFs [6].
Resistance training (RT) involves utilizing equipment such as resistance machines, weights, elastic bands, or one’s own body weight to improve muscle strength and endurance. This form of exercise primarily enhances skeletal muscle strength, muscle cross-sectional area, muscle fiber number, and cardiac pumping capacity, while also facilitating adaptive vasodilation [7,8]. Conversely, a reduction in skeletal muscle mass coupled with an increase in body fat (e.g., sarcopenic obesity) is detrimental to the well-being of adults with obesity. This scenario can lead to decreased physical performance, increased cardiometabolic risk, and increased likelihood of adverse clinical outcomes [9,10]. Notably, RT is the only non-pharmacological intervention that consistently counteracts age-related declines in skeletal muscle mass, strength, and power [11,12].
Aerobic exercise is known to enhance CRFs in populations with obesity. However, it usually requires prolonged exercise duration and a conductive environment, which may reduce exercise compliance among individuals with overweight and obesity [13]. Additionally, previous meta-analyses have shown that the effect of aerobic exercise on blood glucose depends on the appropriateness of the training load, which may be compromised if individuals are unable or unwilling to complete the prescribed training [14]. Conversely, RT does not encounter the constraints of space, equipment, or time commitments, redenring it a convenient option for individuals with overweight and obesity, whether at home or another location [15]. Indeed, RT aligns with global physical activity guidelines that advocate for 2-3 RT sessions per week for adults [16,17].
It is worth noting that in recent years, concurrent training (a combination of both aerobic training and RT) has exhibited efficacy in improving CRFs in adults [18,19]. However, concurrent training is time-demanding, and the interference effects between aerobic training and RT warrant careful consideration due to the possible compromise of skeletal muscle mass and function [20]. Recent studies have reported the positive effects of high-intensity interval training(HIIT) on CRFs in the general population [21], but these effects have not been validated in populations with overweight and obesity. Considering that overweight and obesity are often associated with various metabolic and other diseases, performing HIIT without professional supervision may increase the risk of injury or impair the function of certain organs in this population [22,23]. On the contrary, RT can be adjusted to individual perceptions and, when performed with an optimal dose interval, can mitigate barriers to participation and positively influence the intervention outcome [24]. Based on the advantages of RT, it becomes imperative to elucidate the effects of moderate-frequency RT (two or three times weekly) on cardiometabolic health outcomes, to support further research endeavors and the practical application of RT.
Currently, although some studies have reported CRFs as a secondary outcome, there is limited research employing it as the primary outcome for RT, especially in populations with overweight and obesity. Moreover, interpreting the impact of RT on CRFs is limited by methodological diversity, such as RT frequency and dietary regulation. Previous meta-analyses have explored the effects of short-, medium- and long-term RT on CRFs in adults, while ignoring the assessment of improved cardiometabolic health at the prevailing and recommended frequency of RT endorsed by the global physical activity guidelines [25]. A high-quality systematic review and meta-analysis can help overcome these challenges by providing more precise effect sizes while accounting for bias and heterogeneity. Therefore, the objective of this systematic review is to comprehensively assess the effects of moderate-frequency RT on CRF outcomes in adults with overweight and obesity, with a subgroup analysis examining the role of dietary control.
2. Methods
2.1. Protocol
This systematic review and meta-analysis followed the Preferred Reporting Items for Systematic Reviews and Meta-Analyses (PRISMA) checklist [26] and was registered with PROSPERO(ID: CRD42022343167).
2.2. Eligibility Criteria
To determine the inclusion criteria for the literature, we followed the PICOS model (see Table 1).
2.3. Information Sources and Search Strategy
A systematic search was conducted on PubMed, Cochrane Library, and Web of Science databases from inception until April 2023. Medical subject heading (MeSH) terms and text words related to overweight, obesity, resistance training, glucose metabolism, lipid metabolism, and randomized controlled trials were used to identify studies that could be potentially relevant. We also checked the reference lists of all trials that met the screening criteria, although no additional eligible trials were found.
The search strategy employed a combination of subject headings and free text words, adjusted for each database's characteristics. The search was conducted using four main categories of terms: (ⅰ) population; (ⅱ) intervention; (ⅲ) study type; and (ⅳ) outcome. For example, the specific search strategy used in PubMed is shown in Table 2. The reference lists of the included studies were also searched to supplement the obtained information.
2.4. Study Selection and Data Extraction
To identify relevant studies, we applied the following inclusion criteria: (i) reports that included clear participant information for body mass index (BMI) and age, adhering to the WHO definitions of overweight and obesity used (BMI ≥ 25 for overweight and BMI ≥ 30 for obesity); (ii) studies that included a control group, i.e., no additional physical exercise; and (iii) studies that employed a randomized controlled trial design. Exclusions were applied to studies that met the following criteria: (i) studies involving pregnant participants; (ii) studies involving exercise forms other than resistance training, such as a combination of aerobic exercise and resistance training; (iii) studies that used an acute resistance training intervention [25]; and (iv) studies that were published in a language other than English. After identifying studies that met the inclusion criteria, we first eliminated duplicate content. Subsequently, articles were subjected to title and abstract screening to eliminate those that did not meet the eligibility criteria. Finally, we carefully reviewed the full texts of these articles, excluding those that did not meet the inclusion criteria.
The data extraction process from the selected reference articles was performed using Microsoft Excel spreadsheets (Microsoft Corporation, Redmond, WA, USA). To ensure accuracy, another author scrutinized the data extraction, and any discrepancies were resolved through discussion. In situations where a consensus could not be reached between the two authors, a third person was consulted for resolution. The extracted data included information on study source (authors, publication year, country, and region), participant demographics (age, gender, and BMI), resistance training intervention details (total time, frequency, and intensity), and outcome measurements. If a study had multiple intervention arms (such as different resistance training doses, regimens, or participant populations), and at least one of these arms met the inclusion criteria, those individual arms were treated as distinct studies, termed trials. In addition, one author independently reviewed the titles and abstracts of all referenced articles, screening them against the inclusion criteria. Following the removal of duplicate articles, the other author further reviewed the full texts of the remaining articles. Any discrepancies between the two authors were resolved through discussion to reach a consensus.
2.5. Risk of Bias
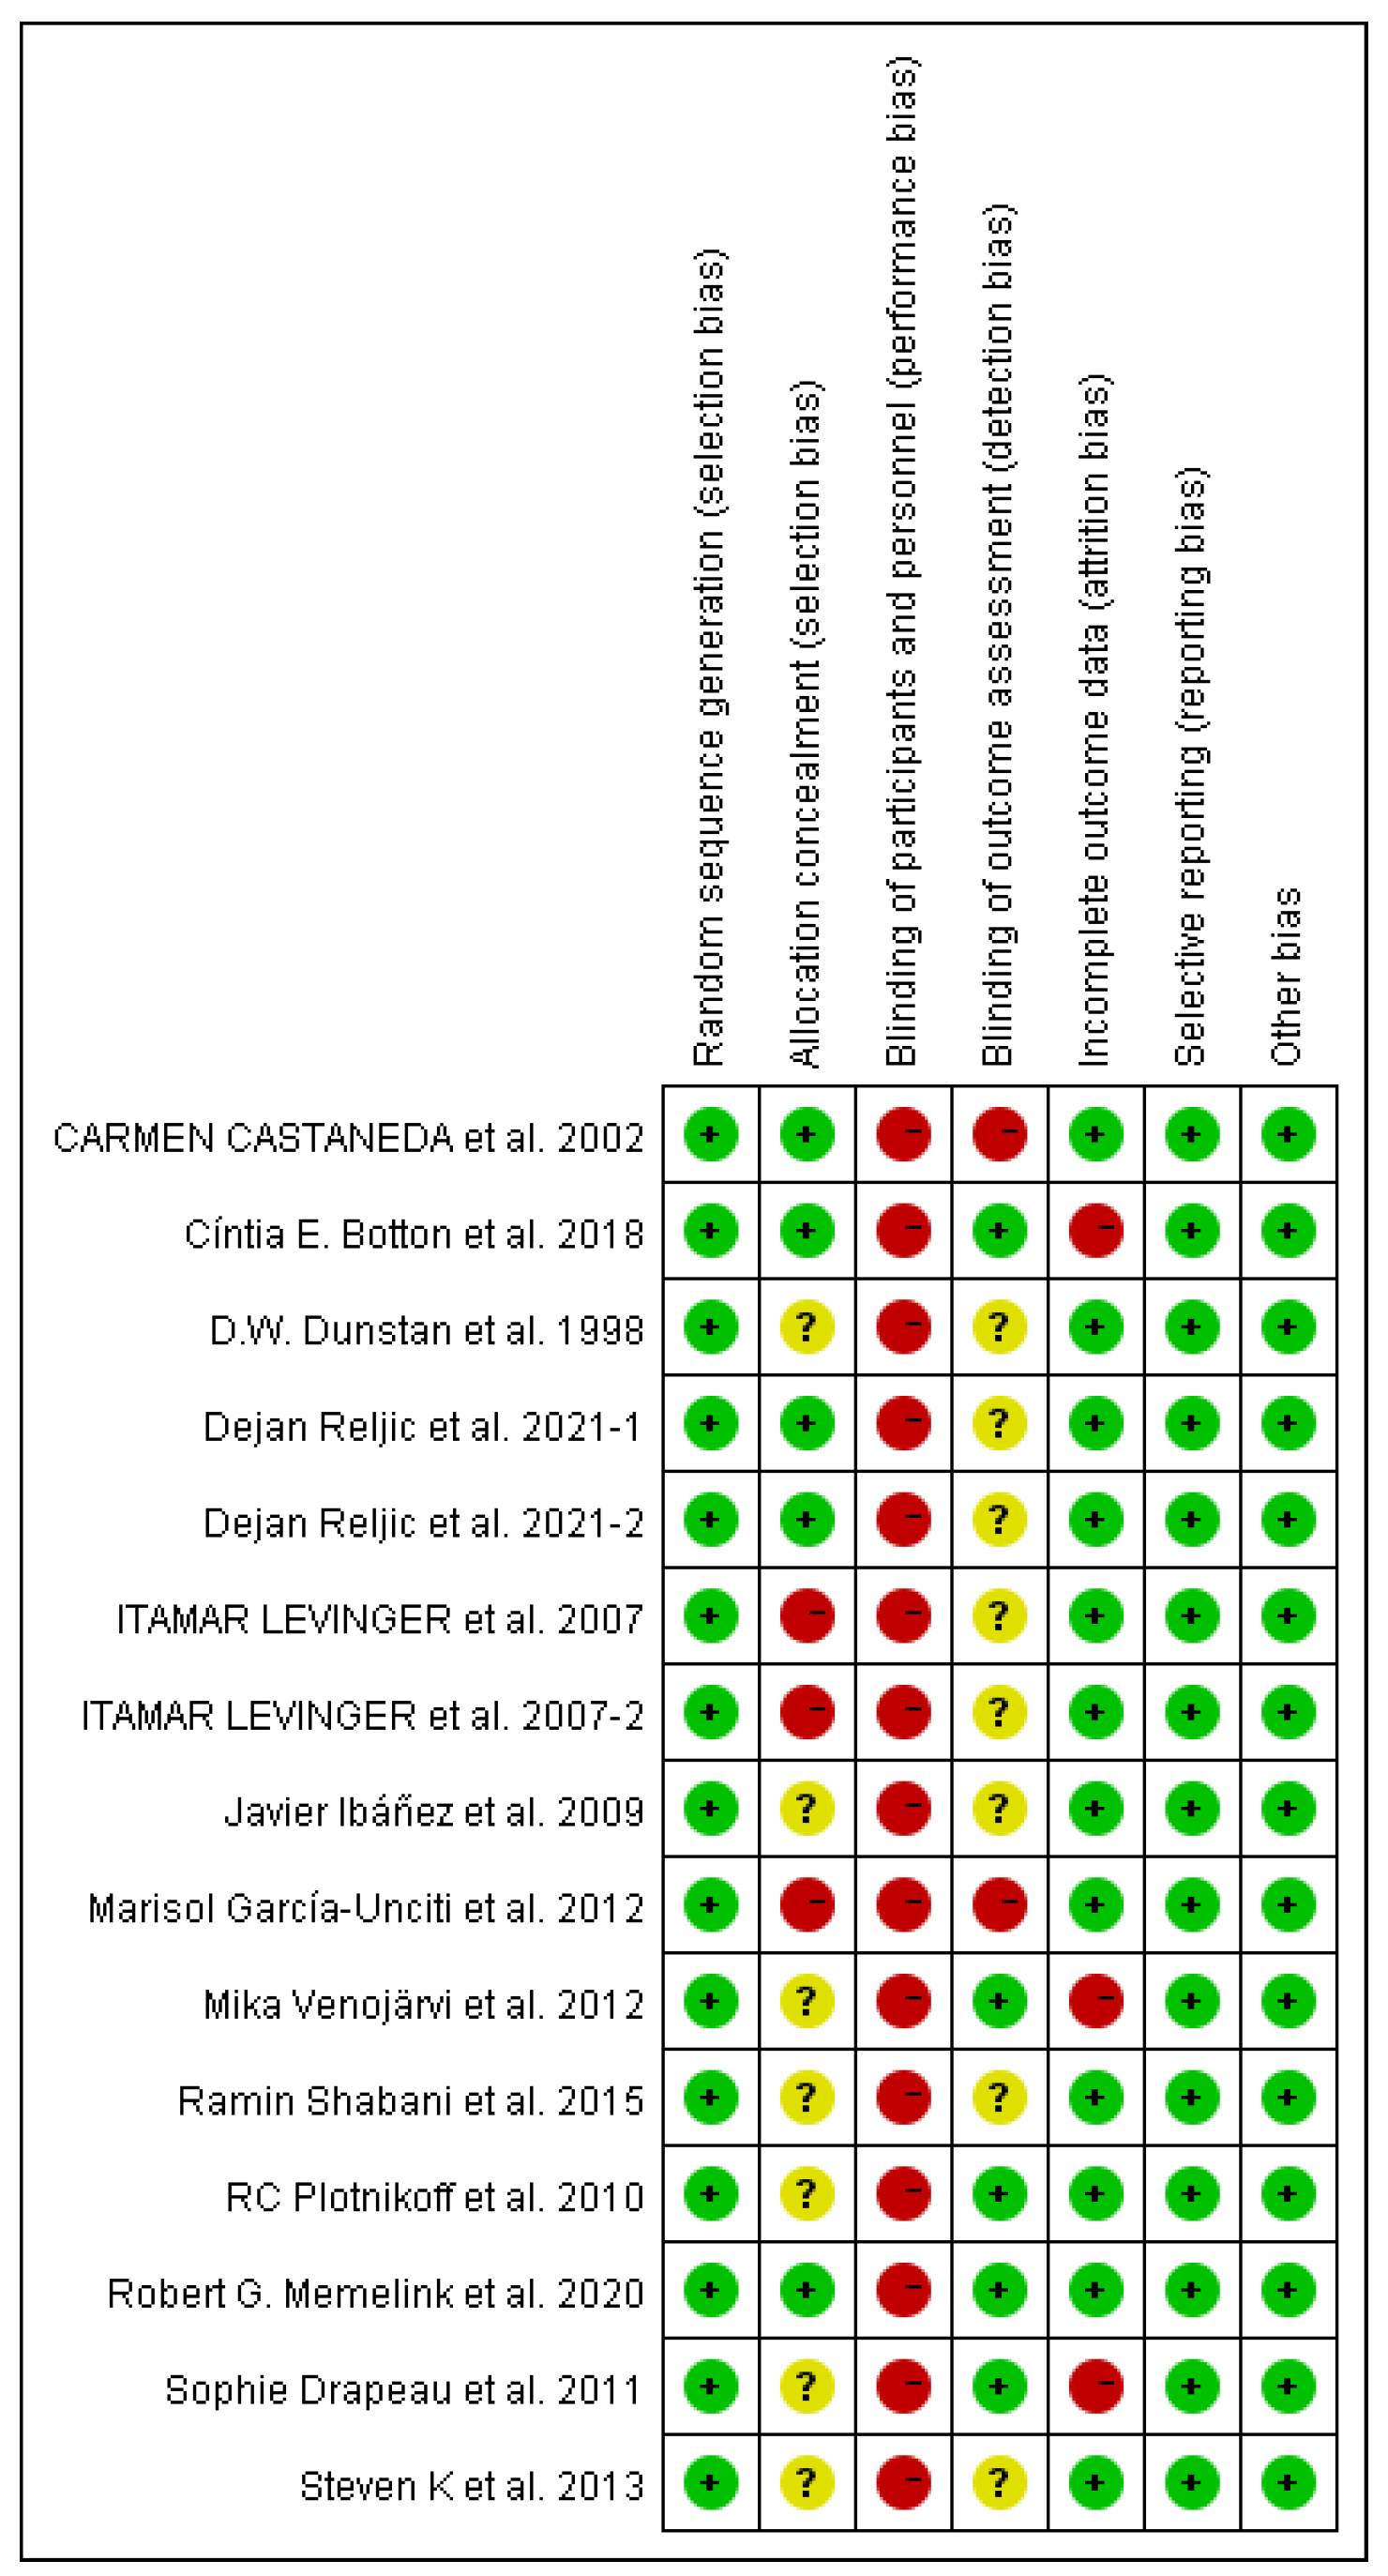
We used the Cochrane Risk of Bias tool to assess the following aspects of bias risk: (1) random sequence generation (selection bias); (2) allocation concealment (selection bias); (3) blinding of participants and personnel (performance bias); (4) blinding of outcome assessment (detection bias); (5) incomplete outcome data (attrition bias); (6) selective reporting (reporting bias); and (7) other biases [27]. In parallel, we used funnel plots to assess potential publication bias [28].
2.6. Data Synthesis and Analysis
Meta-analysis was conducted using Review Manager (RevMan V.5.4) when more than two studies reported on the same outcome. Effect sizes were expressed as mean differences with 95% confidence intervals. To assess heterogeneity, both the I² statistic and p-value were used, with I²>50% and P<0.10 indicating significant heterogeneity. In instances of significant heterogeneity, a random-effects model was employed for analysis. Conversely, if heterogeneity was not significant, a fixed-effects model was applied.
Sensitivity analysis was conducted to examine the impact of individual studies on the overall effect size by systematically excluding each study from the analysis. If significant heterogeneity was detected, but no clinical heterogeneity was absent, a random-effects model was used for analysis. If significant heterogeneity was observed but its source could not be identified, descriptive analysis was performed. Furthermore, funnel plots were utilized to assess publication bias, with a significance level of α=0.05. The Z-test was used to determine statistical significance, with p<0.05 indicating a significant result.
3. Results
3.1. Search results
Initially, an extensive search across multiple databases yielded a total of 7011 references. After removing 573 duplicates and 2478 references using the Endnote automatic screening tool, 3925 references were excluded for other reasons such as animal experiments, systematic reviews, studies irrelevant to the research topics, and lack of full text availability. This left 35 references for a detailed screening of titles and abstracts. Subseqently, 12 articles were excluded due to the absence of resistance training or had non-pure resistance training interventions. One reference involved pregnant subjects, seven were written in languages other than English, and two lacked sufficient data for meaningful analysis. Ultimately, 13 articles, involving 651 adults with overweight and obesity, were included in the final analysis, with two trials featuring two resistance training groups (Refer to Figure 1 for a visual representation).
3.2. Characteristics of the included studies
Table 2 presents the basic characteristics of the included studies. These 15 randomized controlled trials encompassed 691 participants, with 343 in the control group and 348 in the resistance training group. The trials were conducted in 9 countries at various settings, such as hospitals, specialized research centers, universities, and fitness centers. The number of participants in the resistance training group varied from 7 to 62 individuals per study, with 5 studies only including female participants and 1 study only including male participants. All participants in the studies were adults with overweight and obesity, ranging from 21 to 71 years old.
The duration of resistance training interventions exhibited a range from 7 weeks to 24 weeks, with resistance training sessions performed two to three times per week. All resistance training involved multiple muscle groups in different body regions. The majority of resistance training entailed a progressive intensity approach ranging from 40% 1RM to 85% 1RM. The regimen encompassed 1 to 8 sets per session, each comprising 8 to 20 repetitions per set, with a rest period between each set.

Table 3.
Summary of descriptive characteristics of included articles.
| Author | Year | Samples(F/M) | Age(years) | Duration | Intervention | Primary outcomes |
|---|---|---|---|---|---|---|
| Dejan Reljic[29] | May-21 | 23/7 | 51.7 ± 11.7 | 12 weeks, twice a week | Weeks 1-4:50-60%1RM; Weeks 5-8:60-75%1RM; Weeks 9-12:70-80%1RM, one exercise per set | A, B, C, D, E, F, I, J, K |
| Dejan Reljic [29] | May-21 | 23/7 | 51.7 ± 11.7 | 12 weeks, three times a week | Weeks 1-4:50-60%1RM; Weeks 5-8:60-75%1RM; Weeks 9-12:70-80%1RM, three exercises per set | A, B, C, D, E, F, I, J, K |
| Javier Ibáñez [30] | Aug-09 | 12/0 | 51.4 ± 5.5 | 16 weeks, twice a week | During the first 8 weeks of the training period, subjects were loaded at 50 to 70% of the individual 1-RM, and during the last 8 weeks of the training period, the load was 70 to 80% of the maximum load. In addition, from week 8 to week 16, subjects performed a partial (20%) calf extension and bench press set-up with loads ranging from 30% to 50% of the maximum load. | A, F, G, H, I, J, K, L |
| Itamar Levinger [31] | Oct-07 | 5/9 | 51.9 ± 5.8 | 10 weeks, three times a week | With a 48-h recovery between sessions, the initial training intensity was two sets of 15-20 reps at 40-50% 1RM each. Starting in weeks 2-10, subjects performed three sets of each exercise at 50-85% 1RM for 8-20 repetitions. | A, B, C, F, I, J |
| Itamar Levinger [31] | Oct-07 | 6/4 | 48.9±7.4 | 10 weeks, three times a week | The total intervention duration was 10 weeks, with 48-h of recovery between sessions, and the initial training intensity was two sets of 15-20 reps at 40-50% 1RM. Starting in weeks 2-10, subjects performed three sets of each exercise at 50-85% 1RM for 8-20 repetitions. | A, B, C, F, I, J |
| Steven K [32] | Sep-13 | 7/0 | 20.9 ± 1.59 | 7 weeks, three times a week | At 60% 1-RM for 3 days/week and approximately 60 minutes/repetition, subjects performed three sets of 8-12 repetitions with 90-120 seconds of rest between sets. | A, F, L |
| Robert G. Memelink [33] | Dec-20 | 24/38 | 65.8 ± 6.4 | 13 weeks, three times a week | Total intervention length 13 weeks, three times a week, one hour each time | A, E, F, G, L |
| Ramin Shabani [34] | Apr-15 | 10/0 | 51.3 ± 6.63 | 12 weeks, three times a week | In the initial 1-3 weeks, the intensity is 40-50% 1-RM, 4-8 weeks, 50-65% 1-RM, with a total of 8 sets of movements, each set repeated 8-12 times, with 3 minutes rest between sets | F |
| D.W. Dunstan [35] | Feb-98 | 5/5 | 51.1 ± 2.2 | 8 weeks, three times a week | The total duration of the intervention was 8 weeks, three times a week, with a weight of 50-55% 1RM for each exercise. | B, C. F. L |
| Cíntia E. Botton [36] | Oct-18 | 8/14 | 68.6 ± 7.06 | 12 weeks, three times a week | The initial training load is determined during the familiarization training and increases with the load until a maximum of 15 repetitions is reached. | E, F, H, I, J, K |
| Sophie Drapeau [37] | Apr-11 | 22/0 | 58.5±4.6 | 24 weeks, three times a week | Phase 1: Start training (3 weeks, 15 repetitions, 2-3 sets each, 90-120 seconds between sets); Phase 2 (5 weeks, 12 repetitions, 2-3 sets each, 90 seconds between sets); Phase 3 (9 weeks, 8-10 repetitions, 2-4 sets each, 120-180 seconds between sets); Phase 4 (8 weeks, 10-12 repetitions, 3-4 sets each, 60-90 seconds between sets)) | F, G, H, I, J, K, L |
| RC Plotnikoff [38] | Jun-10 | 13/8 | 54±12 | 16 weeks, three times a week | Total intervention duration of 16 weeks, 3 training sessions per week | A, B, C, E, F, I, J, K, L |
| Mika Venojärvi [39] | Aug-12 | 0/40 | 54 ±7.2 | 12 weeks, three times a week | Increase exercise intensity and load every 4 weeks | A, B, C, E, F, G, H, I, J, K, L |
| Carmen Castaneda [40] | Sep-02 | 19/12 | 66 ± 5.57 | 16 weeks, three times a week | For 45 minutes each time, subjects performed three sets of eight repetitions on each machine at a time. | A, B, C, F, H, J, K |
| Marisol García-Unciti [41] | Dec-12 | 12/0 | 51.4±5.5 | 16 weeks, twice a week | During the first 8 weeks of the training period, subjects were loaded at 50-70% of the individual 1-RM, and during the last 8 weeks of the training period, the load was 70-80% of the maximum load. | A, F, H, I, J, K, L |
Note: Values are presented as means ± SD. F: female; M: male; A: Waist circumference (cm); B: Systolic blood pressure(mmHg); C: Diastolic blood pressure(mmHg); D: Mean arterial pressure(mmHg); E: Glycated hemoglobin (%); F: Fasting glucose (mmol·L-1); G: HOMA-IR(Homeostasis model assessment for insulin resistance); H: Serum total cholesterol (mmol·L-1); I: Triglyceride (mmol·L-1); J: High-density lipoprotein (mmol·L-1); K: Low-density lipoprotein (mmol·L-1); L: Fasting insulin (pmol·L-1).
3.3. Risk of bias
3.3.1. Selection bias
All studies employed random allocation for group assignment, with 7 randomized controlled trials using a describable method for sequence generation, and the remaining 6 studies having unclear risk due to insufficient information on randomization methods. The majority of studies did not report allocation concealment and were considered to have unclear risk.
3.3.2. Performance and detection bias
All studies exhibited a notable susceptibility to performance bias (i.e., lack of blinding among intervention and outcome assessors). This absence of blinding among researchers could have introduced potential biases into the measurement of blood pressure and the extent of improvement in some indicators such as glucose and lipid metabolism among participants. Most studies were judged as unclear for detection bias (i.e., blinding of outcome assessors) due to insufficient information provided in the studies. Two studies stood out with a pronounced risk of detection bias.
3.3.3. Attrition bias
The majority of studies were categorized as having a low risk of attrition bias. However, three trials received a high-risk rating due to either high dropout rates or the exclusion of specific participants from the analysis.
3.3.4. Reporting bias
All studies were rated as low risk for selective reporting bias.
3.3.5. Publication bias
All measurements were plotted in funnel plots, which were asymmetrical, indicating potential publication bias.
Figure 2.
Results of the risk of bias assessment of the 15 studies included in this systematic review. Green: low risk of bias. Yellow: unclear risk of bias. Red: high risk of bias.
Figure 2.
Results of the risk of bias assessment of the 15 studies included in this systematic review. Green: low risk of bias. Yellow: unclear risk of bias. Red: high risk of bias.
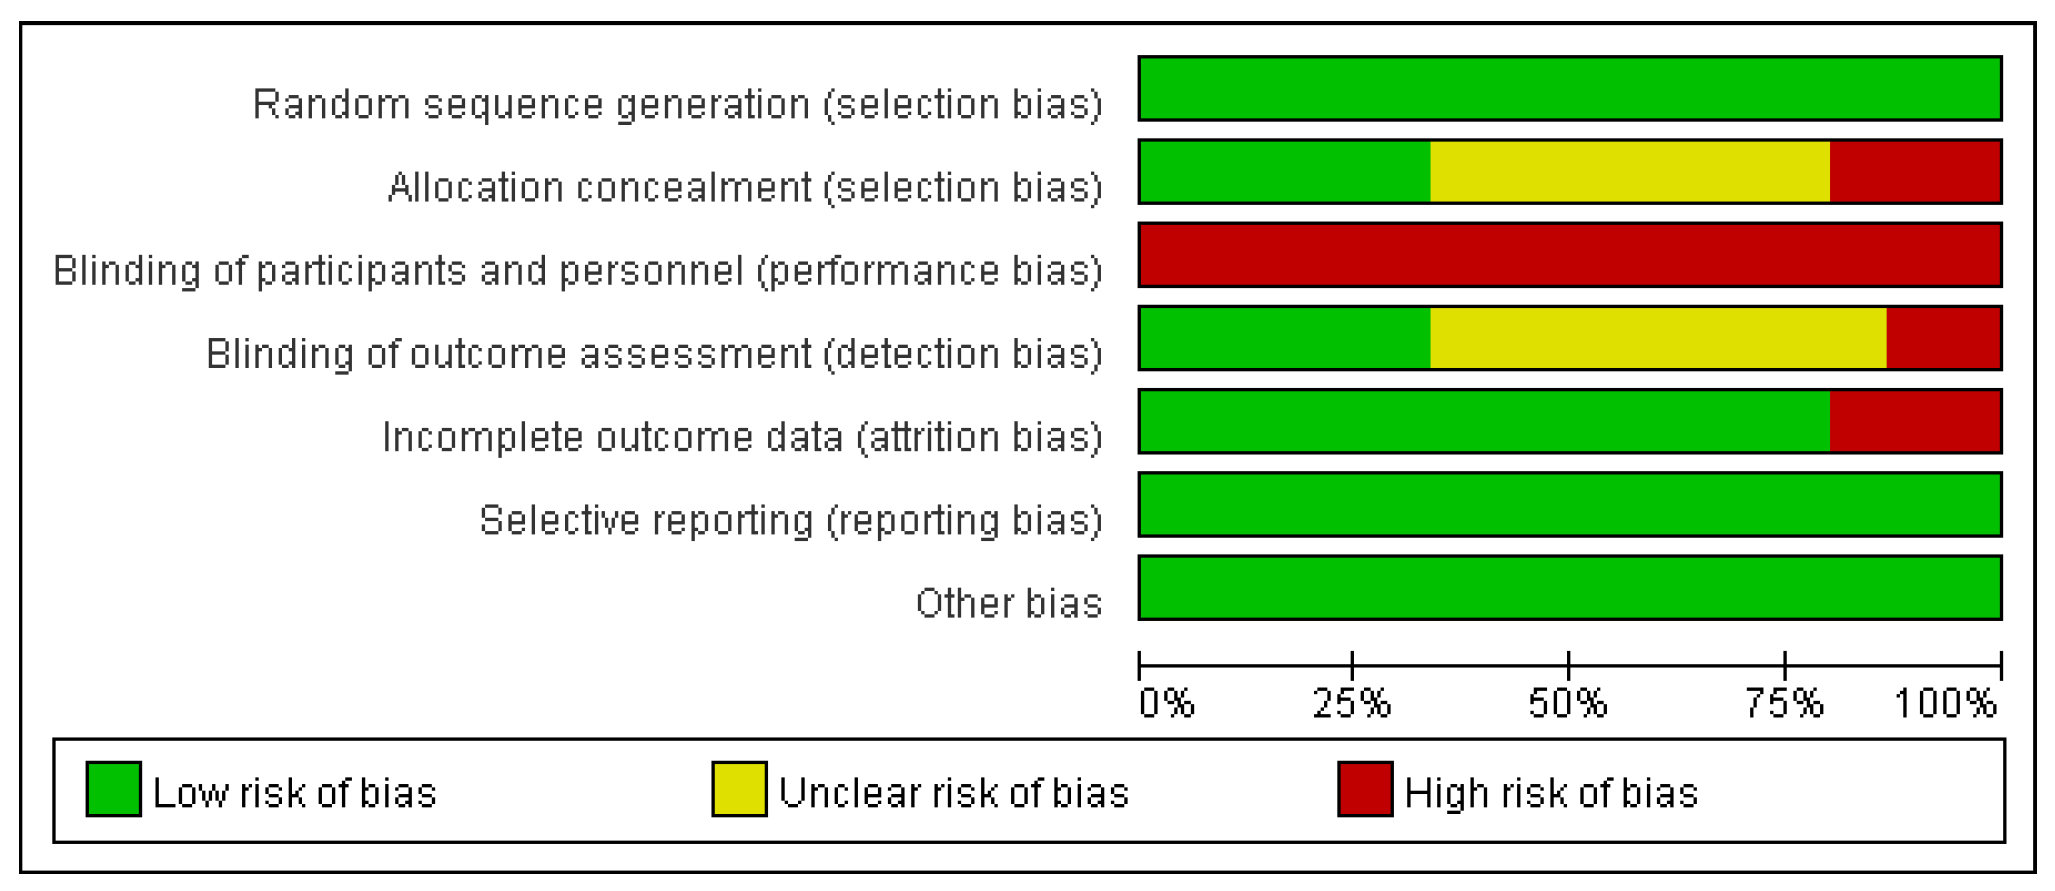
Figure 3.
Results of the risk of bias assessment of the 15 studies included in this systematic review. Green: low risk of bias. Yellow: unclear risk of bias. Red: high risk of bias.
Figure 3.
Results of the risk of bias assessment of the 15 studies included in this systematic review. Green: low risk of bias. Yellow: unclear risk of bias. Red: high risk of bias.
3.4. Study outcomes
Waist
Figure 4 illustrates the waist circumference data encompassing 550 participants from 11 trials. Evaluating the effect of resistance training on waist circumference in adults with overweight and obesity, no heterogeneity was observed among the studies (I2 =0%, p=0.5). Employing a fixed-effects model for analysis yielded a combined effect size of MD = 0.27, with 95% CI spanning from = 0.10 to 0.44 (p=0.002). Subgroup analyses showed no between-study heterogeneity in the dietary control group, with a total effect size of MD = 0.30, and 95%CI of = 0.13 to 0.47 (p<0.001); there was no heterogeneity in the no-dietary-control group, with a total effect size of MD = of -1.33, and 95%CI from = -2.62 to -0.03 (p=0.04). These findings suggest that resistance training does not manifest a favorable impact on the enhancement of waist circumference in adults with overweight and obesity.
Systolic blood pressure
Figure 5 presents the systolic blood pressure data encompassing 372 participants from 8 trials. Exploring the effect of resistance training on systolic blood pressure in adults with overweight and obesity, heterogeneity was observed among the studies (I2=60%, p=0.01). Employing a random-effects model for the analysis, a combined effect size of MD = -4.66 is derived, accompanied by a 95% CI of = -9.34 to 0.02 (p=0.05). These findings suggest that resistance training has a positive effect on improving systolic blood pressure in adults with overweight and obesity.
Diastolic blood pressure
Figure 6 presents the diastolic blood pressure data encompassing 372 participants from 8 trials. Delving into the effect of resistance training on diastolic blood pressure in adults with overweight and obesity, no heterogeneity was observed among the studies (I2=0%, p=0.8). The analysis adopted a fixed-effects model, yielding a combined effect size of MD = -1.32, with 95% CI of = -3.03 to 0.38 (p=0.13). These findings indicate that resistance training could potentially yield a favorable influence on improving diastolic blood pressure in adults with overweight and obesity.
Mean arterial pressure
Figure 7 illustrates the mean arterial pressure data involving 116 participants from 2 trials. Exploring the potential effect of resistance training on mean arterial pressure in adults with overweight and obesity, no heterogeneity was observed among the studies (I2=0%, p=0.81). Employing a fixed-effects model for analysis, a combined effect size of MD = -6.48 is derived, with 95% CI of = -10.63 to -2.33 (p=0.002). These findings indicate that resistance training exerts a significant positive effect on the enhancement of mean arterial pressure in adults with overweight and obesity.
Glycated hemoglobin (HbA1c (%))
Figure 8 illustrates the glycated hemoglobin (HbA1c) data derived from 418 participants across 6 trials. In examining the effect of resistance training on HbA1c levels in adults with overweight and obesity, a substantial degree of heterogeneity was observed among the studies (I2=89%, p<0.001). Employing a random-effects model, the resulting combined effect size is MD = 0.2, with a 95% CI spanning from = -0.33 to 0.73 (p=0.46). Subgroup analyses revealed a total effect size of MD = 1.30, with 95%CI from = -2.40 to 5.00 (p=0.49) in the dietary control group; notable heterogeneity (I2=91%, p<0.001) is observed in the no-dietary-control group, with a total effect size of MD = 0.18,and 95%CI spanning from = -0.36 to 0.71 (p=0.52). These findings indicate that resistance training does not yield a favorable impact on the enhancement of HbA1c levels in adults with overweight and obesity.
Fasting glucose
Figure 9 illustrates the fasting glucose data from 681 participants across 15 trials. In examining the effect of resistance training on fasting glucose levels in adults with overweight and obesity, no heterogeneity was observed among the studies (I2=0%, p=0.6). Utilizing a fixed-effects model for analysis, the resultant combined effect size stands at MD=-0.01, with a 95% CI spanning from = -0.08 to 0.05 (p=0.75). Subgroup analyses revealed a notable level of between-study heterogeneity (I2=67%, p=0.05) in the dietary control group, with a total effect size of MD = -0.50, along with a 95%CI spanning from = -0.24 to 0.14 (p=0.6); there was no heterogeneity within the no-dietary-control group, with a total effect size of MD = -0.01, and a 95%CI ranging from = -0.07 to 0.06 (p=0.88). These findings indicate that resistance training does not yield a positive influence on the enhancement of fasting glucose levels in adults with overweight and obesity.
Homeostasis model assessment for insulin resistance
Figure 10 illustrates the homeostasis model assessment for insulin resistance (HOMA-IR) data encompassing 277 participants from 4 trials. In examining the effect of resistance training on HOMA-IR in adults with overweight and obesity, a moderate level of heterogeneity was observed among the studies (I2=48%, p=0.12). Employing a fixed-effects model for analysis, the resulting combined effect size is MD = -1.49, with a 95% CI spanning from = -1.63 to -1.35 (p<0.001). Subgroup analyses revealed no between-study heterogeneity in the dietary control group, with a total effect size of MD = -1.52, accompanied by a 95%CI ranging from = -1.66 to -1.38 (p<0.001); within the no-dietary group a total effect size of MD = -0.6 is observed, with a 95%CI spanning from = -1.41 to 0.21 (p=0.15). These findings indicate that resistance training exerts a significant and positive effect on the enhancement of HOMA-IR in adults with overweight and obesity.
Total cholesterol
Figure 11 illustrates the total cholesterol data derived from 278 participants spanning 6 trials. In examining the effect of resistance training on total cholesterol in adults with overweight and obesity, a substantial degree of heterogeneity was observed among the studies (I2=63%, p=0.02). Utilizing a random-effects model for analysis, the resulting combined effect size is MD=-0.53, with a 95% CI ranging from = -1.14 to 0.08 (p=0.09). Subgroup analyses revealed no between-study heterogeneity in the dietary control group, with a total effect size of MD = -1.94, alongside a 95%CI ranging from = -3.07 to -0.82 (p<0.001); within the no-dietary-control group low level of heterogeneity (I2=10%, p=0.33) is observed, with a total effect size of MD = 0.00, alongside a 95%CI ranging from = -0.26 to 0.27 (p=0.98). These findings indicate that resistance training could potentially yield a favorable impact on the enhancement of total cholesterol in adults with overweight and obesity.
Total triglycerides
Figure 12 illustrates total triglyceride data from 419 participants across 10 trials. In examining the effect of resistance training on total triglyceride levels in adults with overweight and obesity, no heterogeneity was observed among the studies (I2=0%, p=0.83). Utilizing a fixed-effects model for analysis, a combined effect size of MD = -0.03 is observed, with a 95% CI ranging from = -0.20 to 0.14 (p=0.72). Subgroup analyses revealed no between-study heterogeneity in the dietary control group, with a total effect size of MD = 0.30, alongside a 95%CI ranging from = -0.96 to 1.56 (p=0.64); no heterogeneity is observed within the no-dietary-control group, with a total effect size of MD = -0.04, alongside a 95%CI ranging from = -0.21 to 0.13 (p=0.67). These findings indicate that resistance training does not yield a favorable impact on the enhancement of total triglyceride levels in adults with overweight and obesity.
High-density lipoprotein
Figure 13 illustrates high-density lipoprotein data from 491 participants across 11 trials. In examining the effect of resistance training on high-density lipoprotein levels in adults with overweight and obesity, a low degree of heterogeneity was observed among the studies (I2=27%, p=0.19). Subgroup analyses yielded no between-study heterogeneity in the dietary control group, with a total effect size of MD = -0.49, alongside a 95%CI ranging from = -0.82 to -0.17 (p=0.002); no heterogeneity was observed within the no-dietary-control group, with a total effect size of MD = 0.05, alongside a 95%CI ranging from = -0.04 to 0.15 (p=0.25). Utilizing a fixed-effects model for analysis, a combined effect size of MD = 0.01 was observed, with a 95% CI ranging from = -0.08 to 0.10 (p=0.79). These findings indicate that resistance training does not yield a favorable impact on the enhancement of high-density lipoprotein levels in adults with overweight and obesity.
Low-density lipoprotein
Figure 14 illustrates low-density lipoprotein data from 442 participants across 9 trials. In examining the effect of resistance training on low-density lipoprotein levels in adults with overweight and obesity, a substantial degree of heterogeneity was observed among the studies (I2=69%, p=0.001). Utilizing a random-effects model for analysis, a combined effect size of MD = -0.06 was observed, with a 95% CI ranging from = -0.49 to 0.37 (p=0.79). Subgroup analyses yielded high between-study heterogeneity (I2=88%, p<0.001) in the dietary control group, with a total effect size of MD = -0.29, alongside a 95%CI ranging from = -3.07 to 2.48 (p=0.84); low degree of heterogeneity (I2=42%, p=0.12) was observed within the no-dietary-control group, with a total effect size of MD = -0.09, alongside a 95%CI ranging from = -0.39 to 0.21 (p=0.57). These findings indicate that resistance training does not yield a favorable impact on the enhancement of low-density lipoprotein in adults with overweight and obesity.
Fasting insulin
Figure 15 illustrates the fasting insulin data from 390 participants across 8 trials. In examining the effect of resistance training on fasting insulin levels in adults with overweight and obesity, a substantial degree heterogeneity was observed among the studies (I2=98%, p<0.001). Utilizing a random-effects model for analysis, a combined effect size of MD = -12.52 was observed, with a 95% CI ranging from = -24.17 to -0.88 (p=0.04). Subgroup analyses yielded high between-study heterogeneity (I2=99%, p<0.001) in the dietary control group, with a total effect size of MD = -8.56, alongside a 95%CI ranging from = -26.37 to 9.25 (p=0.35); a moderate degree of heterogeneity (I2=51%, p=0.11) was observed within the no-dietary-control group, with a total effect size of MD = -20.51, alongside a 95%CI ranging from = -40.86 to -0.17 (p=0.05). These findings indicate that resistance training has a significant and positive effect on the enhancement of fasting insulin levels in adults with overweight and obesity.
Discussion
This Meta-Analysis demonstrates that moderate-frequency resistance training exerts a beneficial influence on cardiometabolic risk factors (CRFs) in adults with overweight and obesity. The positive effects are evidenct in the enhancement of blood biomarkers, blood pressure, and HOMA-IR levels. Notably, individuals in the dietary control combined with resistance training cohort exhibited greater improvements in fasting glucose, HOMA-IR, total cholesterol, and LDL cholesterol levels compared to those without dietary control. These finding have significant clinical implications for populations dealing with overweight and obesity.
Waist circumference is a critical indicator of CRFs, with higher measurement signifying increased visceral adipose tissue [42,43]. Studies exploring the effects of weight loss strategies, including diet, physical activity/exercise, pharmacologically induced weight loss, consistently show that the greater initial amounts of visceral adipose tissue result in greater loss of visceral relative to subcutaneous adipose tissue following weight reduction [44,45]. There is ongoing debate on whether a similar caloric deficit, induced by diet or exercise, will generate the same loss of visceral adipose tissue. Unfortunately, the results of this analysis suggest that resistance training does not significantly impact waist circumference in adults with overweight and obesity. This observation aligns with the findings of Kordi et al. and is consistent with studies conducted on individuals with normal weight [46,47]. Interestingly, the improvement in waist circumference was greater in the group without diet control than in the group combing diet control and resistance training [30,33,41,48]. The underlying reasons for this phenomenon remain unclear. Given that diet control primarily revolves around creating an energy deficit, Marisol García-Unciti et al. propose that incorporating resistance training might influence the interaction between subcutaneous fat and glucose metabolism [41]. Further investigation into this aspect is warranted.
Resistance training positively impacts systolic blood pressure, diastolic blood pressure, and mean arterial pressure, with reductions comparable to those observed following aerobic exercise interventions [49,50]. Given the global prominence of hypertension as a significant cause of mortality [25], it is evident that moderate-frequency resistance training holds potential as an effective non-pharmacological strategy for preventing and managing blood pressure concerns. The blood pressure-lowering effects of moderate-frequency resistance training arise through mechanisms, such as enhanced vascular function, increased muscle mass and metabolic rate, and reduced sympathetic nervous activity. This multifaceted impact fosters improvements in cardiovascular metabolic health, thereby mitigating the risk of cardiovascular disease [51,52]. Mean arterial pressure is particularly important for specific patient groups, such as those with diabetes or the elderly, who often exhibit pronounced blood pressure fluctuations [53,54,55]. In this context, mean arterial pressure serves as a valuable metric for assessing the severity of blood pressure changes. The results of this meta-analysis indicate that the imprevements in mean arterial pressure are more pronounced than those observed in systolic and diastolic blood pressure.
Glycated hemoglobin, produced by the binding of blood glucose to hemoglobin in red blood cells, is a clinically significant marker for adjusting blood glucose levels and evaluating glycaemic control [56,57].Unfortunately, although some studies suggest that resistance training may improve glucose metabolism by enhancing glucose utilization and storage and increasing insulin sensitivity [58,59], the result of this meta-analysis do not support a significant modulatory effect of moderate-frenqency resistance training on glycaemic control. Glycated hemoglobin levels are influenced by many factors, with elevated blood glucose concentrations having the greatest impact [60,61]. Elevated blood glucose levels lead to an increase in glycation end products, promoting the production of glycated hemoglobin. Notably, this meta-analysis was conducted in adults with overweight and obesity, who may exhibit elevated fasting blood glucose levels, providing additional context for the outcomes presented. Furthermore, the role of erythrocytes in influencing glycated hemoglobin concentration should not be overlooked [62]. Several studies have shown that the stability of erythrocyte membranes improves during the recovery period after exercise, potentially prolonging erythrocyte lifespan and influencing glycated hemoglobin levels [63,64,65].
The effects of resistance training on various lipid markers, including total cholesterol, triglycerides, HDL cholesterol, and LDL cholesterol, have exhibited positive trends. Our finding indicate that total cholesterol and LDL cholesterol showed more favorable improvements among patients with overweight and obesity in the diet-controlled group compared to those in the diet-uncontrolled group. This observation suggests that lifestyle interventions tailored for this population can yield substantial benefits through a combination of dietary restriction and resistance training. This holistic approach holds clinical significance, potentially contributing to the prevention and management of conditions such as cardiovascular disease, diabetes mellitus, and metabolic syndrome [66,67,68]. However, a decrease in HDL cholesterol was noted in the dietary control group. Although studies have shown that HDL cholesterol can decrease in specific disease states, such as acute infections, chronic inflammation, and autoimmune diseases [69], the decrease in HDL observed in the dietary control group compared to the no-dietary control group remains unexplained. Interestingly, a decline in HDL cholesterol has also been observed in patients receiving statin therapy [70].
Beyond influencing glucose levels, HDL, LDL, and triglycerides, resistance training demonstrated varying degrees of improvement across other biomarkers. The most pronounced improvements were observed in fasting insulin and HOMA-IR. The decrease in fasting insulin and HOMA-IR levels may be attributed to the multifaceted influence of resistance training on body composition, including increased skeletal muscle mass and a decreased fat mass. These shifts further affect adipokine secretion, insulin sensitivity, and glucose transport mechanisms [71,72,73,74].
Future studies on resistance training should monitor and control for potential confounding factors beyond the scope of the intervention, such as the influence of aerobic exercise. The rationale behind the observed greater improvement in waist circumference within the no-diet-control group compared to the diet-control group remains unclear and may be associate with the limited sample size. The relative importance and potential of maximizing central, systemic, and peripheral adaptations by varying the training factors of resistance training (e.g., number of sets, intensity, repetitions) warrant further investigation. Additionally, more high-quality studies are required to develop optimal exercise intervention designs for resistance training, considering gender differences and catering to diverse populations. This evolution is crucial for promoting precise cardiovascular health management within various demographic groups.
Conclusions
This systematic review and meta-analysis highlights that moderate-frequency resistance training (RT) is a safe and effective intervention for improving cardiometabolic risk factors (CRFs) in adults with overweight and obesity. Specifically, RT significantly enhances resting blood pressure, insulin resistance, and key blood biomarkers linked to cardiometabolic health. The subgroup analysis reveals that the presence or absence of dietary control does not substantially alter the effects of moderate-frequency RT on most CRFs, except for total cholesterol. This indicates that RT alone can be a robust non-pharmacological strategy for managing cardiometabolic health in this population. These findings emphasize the potential of moderate-frequency RT as a practical and accessible intervention for adults with overweight and obesity, aligning with global physical activity guidelines. Future research should further explore the interaction between dietary control and RT to optimize intervention strategies, considering factors such as gender differences and specific population needs. This will enhance the precision and effectiveness of cardiovascular health management across diverse demographic groups.
Funding
The authors acknowledge the support of the National Key Research and Development Program of China, 2018YFC2000602 and Central Special Funds of the University for Basic Scientific Research 2015SYS009.
Data Availability Statement
All data in this study are available from the corresponding author on request.
Conflict of Interest
All authors disclosed no relevant relationships.
References
- Heymsfield SB, Wadden TA. Mechanisms, Pathophysiology, and Management of Obesity. The New England Journal of Medicine. 2017;376(3):254-266.
- Trends in adult body-mass index in 200 countries from 1975 to 2014: a pooled analysis of 1698 population-based measurement studies with 19·2 million participants. Lancet (London, England). 2016;387(10026):1377-1396.
- Ortega FB, Lavie CJ, Blair SN. Obesity and Cardiovascular Disease. Circulation Research. 2016;118(11):1752-1770.
- Powell-Wiley TM, Poirier P, Burke LE, et al. Obesity and Cardiovascular Disease: A Scientific Statement From the American Heart Association. Circulation. 2021;143(21). [CrossRef]
- Eckel RH, Kahn R, Robertson RM, Rizza RA. Preventing cardiovascular disease and diabetes: a call to action from the American Diabetes Association and the American Heart Association. Circulation. 2006;113(25):2943-2946.
- Lobelo F, Rohm Young D, Sallis R, et al. Routine Assessment and Promotion of Physical Activity in Healthcare Settings: A Scientific Statement From the American Heart Association. Circulation. 2018;137(18):e495-e522. [CrossRef]
- Lim C, Nunes EA, Currier BS, McLeod JC, Thomas ACQ, Phillips SM. An Evidence-Based Narrative Review of Mechanisms of Resistance Exercise-Induced Human Skeletal Muscle Hypertrophy. Medicine and Science In Sports and Exercise. 2022;54(9):1546-1559. [CrossRef]
- Duncker DJ, Bache RJ. Regulation of coronary blood flow during exercise. Physiological Reviews. 2008;88(3):1009-1086. [CrossRef]
- Yu P-C, Hsu C-C, Lee W-J, et al. Muscle-to-fat ratio identifies functional impairments and cardiometabolic risk and predicts outcomes: biomarkers of sarcopenic obesity. Journal of Cachexia, Sarcopenia and Muscle. 2022;13(1):368-376. [CrossRef]
- Hong S-H, Choi KM. Sarcopenic Obesity, Insulin Resistance, and Their Implications in Cardiovascular and Metabolic Consequences. International Journal of Molecular Sciences. 2020;21(2). [CrossRef]
- Murach KA, Dimet-Wiley AL, Wen Y, et al. Late-life exercise mitigates skeletal muscle epigenetic aging. Aging Cell. 2022;21(1):e13527. [CrossRef]
- Hurst C, Robinson SM, Witham MD, et al. Resistance exercise as a treatment for sarcopenia: prescription and delivery. Age Ageing. 2022;51(2). [CrossRef]
- Armstrong A, Jungbluth Rodriguez K, Sabag A, et al. Effect of aerobic exercise on waist circumference in adults with overweight or obesity: A systematic review and meta-analysis. Obesity Reviews : an Official Journal of the International Association For the Study of Obesity. 2022;23(8):e13446. [CrossRef]
- Umpierre D, Ribeiro PAB, Schaan BD, Ribeiro JP. Volume of supervised exercise training impacts glycaemic control in patients with type 2 diabetes: a systematic review with meta-regression analysis. Diabetologia. 2013;56(2):242-251. [CrossRef]
- Mañas A, Gómez-Redondo P, Valenzuela PL, Morales JS, Lucía A, Ara I. Unsupervised home-based resistance training for community-dwelling older adults: A systematic review and meta-analysis of randomized controlled trials. Ageing Research Reviews. 2021;69:101368. [CrossRef]
- American College of Sports Medicine position stand. Progression models in resistance training for healthy adults. Medicine and Science In Sports and Exercise. 2009;41(3):687-708.
- Donnelly JE, Blair SN, Jakicic JM, Manore MM, Rankin JW, Smith BK. American College of Sports Medicine Position Stand. Appropriate physical activity intervention strategies for weight loss and prevention of weight regain for adults. Medicine and Science In Sports and Exercise. 2009;41(2):459-471. [CrossRef]
- Amaro-Gahete FJ, Ponce-González JG, Corral-Pérez J, Velázquez-Díaz D, Lavie CJ, Jiménez-Pavón D. Effect of a 12-Week Concurrent Training Intervention on Cardiometabolic Health in Obese Men: A Pilot Study. Frontiers In Physiology. 2021;12:630831. [CrossRef]
- Da Silva MAR, Baptista LC, Neves RS, et al. The Effects of Concurrent Training Combining Both Resistance Exercise and High-Intensity Interval Training or Moderate-Intensity Continuous Training on Metabolic Syndrome. Frontiers In Physiology. 2020;11:572. [CrossRef]
- Wilson JM, Marin PJ, Rhea MR, Wilson SMC, Loenneke JP, Anderson JC. Concurrent training: a meta-analysis examining interference of aerobic and resistance exercises. Journal of Strength and Conditioning Research. 2012;26(8):2293-2307.
- Edwards JJ, Griffiths M, Deenmamode AHP, O'Driscoll JM. High-Intensity Interval Training and Cardiometabolic Health in the General Population: A Systematic Review and Meta-Analysis of Randomised Controlled Trials. Sports Medicine (Auckland, NZ). 2023. [CrossRef]
- Zheng L, Qin R, Rao Z, Xiao W. High-intensity interval training induces renal injury and fibrosis in type 2 diabetic mice. Life Sciences. 2023;324:121740. [CrossRef]
- Quindry JC, Franklin BA, Chapman M, Humphrey R, Mathis S. Benefits and Risks of High-Intensity Interval Training in Patients With Coronary Artery Disease. The American Journal of Cardiology. 2019;123(8):1370-1377. [CrossRef]
- Fyfe JJ, Hamilton DL, Daly RM. Minimal-Dose Resistance Training for Improving Muscle Mass, Strength, and Function: A Narrative Review of Current Evidence and Practical Considerations. Sports Medicine (Auckland, NZ). 2022;52(3):463-479. [CrossRef]
- Ashton RE, Tew GA, Aning JJ, Gilbert SE, Lewis L, Saxton JM. Effects of short-term, medium-term and long-term resistance exercise training on cardiometabolic health outcomes in adults: systematic review with meta-analysis. British Journal of Sports Medicine. 2020;54(6):341-348. [CrossRef]
- Page MJ, McKenzie JE, Bossuyt PM, et al. The PRISMA 2020 statement: an updated guideline for reporting systematic reviews. BMJ. 2021;372:n71.
- Higgins JPT, Altman DG, Gøtzsche PC, et al. The Cochrane Collaboration's tool for assessing risk of bias in randomised trials. BMJ. 2011;343:d5928.
- Sutton AJ, Song F, Gilbody SM, Abrams KR. Modelling publication bias in meta-analysis: a review. Stat Methods Med Res. 2000;9(5):421-445.
- Reljic D, Herrmann HJ, Neurath MF, Zopf Y. Iron Beats Electricity: Resistance Training but Not Whole-Body Electromyostimulation Improves Cardiometabolic Health in Obese Metabolic Syndrome Patients during Caloric Restriction-A Randomized-Controlled Study. Nutrients. 2021;13(5). [CrossRef]
- Ibáñez J, Izquierdo M, Martínez-Labari C, et al. Resistance training improves cardiovascular risk factors in obese women despite a significative decrease in serum adiponectin levels. Obesity (Silver Spring, Md). 2010;18(3):535-541. [CrossRef]
- Levinger I, Goodman C, Matthews V, et al. BDNF, metabolic risk factors, and resistance training in middle-aged individuals. Medicine and science in sports and exercise. 2008;40(3):535-541. [CrossRef]
- Malin SK, Hinnerichs KR, Echtenkamp BG, Evetovich TK, Engebretsen BJ. Effect of adiposity on insulin action after acute and chronic resistance exercise in non-diabetic women. European Journal of Applied Physiology. 2013;113(12):2933-2941. [CrossRef]
- Memelink RG, Pasman WJ, Bongers A, et al. Effect of an Enriched Protein Drink on Muscle Mass and Glycemic Control during Combined Lifestyle Intervention in Older Adults with Obesity and Type 2 Diabetes: A Double-Blind RCT. Nutrients. 2020;13(1). [CrossRef]
- Shabani R, Nazari M, Dalili S, Rad AH. Effect of Circuit Resistance Training on Glycemic Control of Females with Diabetes Type II. Int J Prev Med. 2015;6:34. [CrossRef]
- Dunstan DW, Puddey IB, Beilin LJ, Burke V, Morton AR, Stanton KG. Effects of a short-term circuit weight training program on glycaemic control in NIDDM. Diabetes research and clinical practice. 1998;40(1):53-61. [CrossRef]
- Botton CE, Umpierre D, Rech A, et al. Effects of resistance training on neuromuscular parameters in elderly with type 2 diabetes mellitus: A randomized clinical trial. Exp Gerontol. 2018;113:141-149. [CrossRef]
- Drapeau S, Doucet E, Rabasa-Lhoret R, Brochu M, Prud'homme D, Imbeault P. Improvement in insulin sensitivity by weight loss does not affect hyperinsulinemia-mediated reduction in total and high molecular weight adiponectin: a MONET study. Appl Physiol Nutr Metab. 2011;36(2):191-200. [CrossRef]
- Plotnikoff RC, Eves N, Jung M, Sigal RJ, Padwal R, Karunamuni N. Multicomponent, home-based resistance training for obese adults with type 2 diabetes: a randomized controlled trial. International Journal of Obesity. 2010;34(12):1733-1741. [CrossRef]
- Venojärvi M, Wasenius N, Manderoos S, et al. Nordic walking decreased circulating chemerin and leptin concentrations in middle-aged men with impaired glucose regulation. Ann Med. 2013;45(2):162-170. [CrossRef]
- Castaneda C, Layne JE, Munoz-Orians L, et al. A randomized controlled trial of resistance exercise training to improve glycemic control in older adults with type 2 diabetes. Diabetes Care. 2002;25(12):2335-2341. [CrossRef]
- García-Unciti M, Izquierdo M, Idoate F, et al. Weight-loss diet alone or combined with progressive resistance training induces changes in association between the cardiometabolic risk profile and abdominal fat depots. Ann Nutr Metab. 2012;61(4):296-304. [CrossRef]
- Klein S, Allison DB, Heymsfield SB, et al. Waist circumference and cardiometabolic risk: a consensus statement from shaping America's health: Association for Weight Management and Obesity Prevention; NAASO, the Obesity Society; the American Society for Nutrition; and the American Diabetes Association. Diabetes Care. 2007;30(6):1647-1652.
- Tchernof A, Després J-P. Pathophysiology of human visceral obesity: an update. Physiological Reviews. 2013;93(1):359-404. [CrossRef]
- Leenen R, van der Kooy K, Deurenberg P, et al. Visceral fat accumulation in obese subjects: relation to energy expenditure and response to weight loss. The American Journal of Physiology. 1992;263(5 Pt 1):E913-E919. [CrossRef]
- van der Kooy K, Leenen R, Seidell JC, Deurenberg P, Droop A, Bakker CJ. Waist-hip ratio is a poor predictor of changes in visceral fat. The American Journal of Clinical Nutrition. 1993;57(3):327-333. [CrossRef]
- Kordi R, Dehghani S, Noormohammadpour P, Rostami M, Mansournia MA. Effect of abdominal resistance exercise on abdominal subcutaneous fat of obese women: a randomized controlled trial using ultrasound imaging assessments. J Manipulative Physiol Ther. 2015;38(3):203-209. [CrossRef]
- Vispute SS, Smith JD, LeCheminant JD, Hurley KS. The effect of abdominal exercise on abdominal fat. Journal of Strength and Conditioning Research. 2011;25(9):2559-2564. [CrossRef]
- Drapeau S, Doucet E, Rabasa-Lhoret R, Brochu M, Prud'homme D, Imbeault P. Improvement in insulin sensitivity by weight loss does not affect hyperinsulinemia-mediated reduction in total and high molecular weight adiponectin: a MONET study. Applied Physiology, Nutrition, and Metabolism = Physiologie Appliquee, Nutrition Et Metabolisme. 2011;36(2):191-200. [CrossRef]
- Chudyk A, Petrella RJ. Effects of exercise on cardiovascular risk factors in type 2 diabetes: a meta-analysis. Diabetes Care. 2011;34(5):1228-1237.
- Yang Z, Scott CA, Mao C, Tang J, Farmer AJ. Resistance exercise versus aerobic exercise for type 2 diabetes: a systematic review and meta-analysis. Sports Medicine (Auckland, NZ). 2014;44(4):487-499. [CrossRef]
- Cornelissen VA, Fagard RH. Effects of endurance training on blood pressure, blood pressure-regulating mechanisms, and cardiovascular risk factors. Hypertension (Dallas, Tex : 1979). 2005;46(4):667-675. [CrossRef]
- Cornelissen VA, Fagard RH, Coeckelberghs E, Vanhees L. Impact of resistance training on blood pressure and other cardiovascular risk factors: a meta-analysis of randomized, controlled trials. Hypertension (Dallas, Tex : 1979). 2011;58(5):950-958.
- Gao Y, Wang Q, Li J, et al. Impact of Mean Arterial Pressure Fluctuation on Mortality in Critically Ill Patients. Critical Care Medicine. 2018;46(12):e1167-e1174. [CrossRef]
- Sun S, Lo K, Liu L, et al. Association of mean arterial pressure with all-cause and cardiovascular mortality in young adults. Postgrad Med J. 2020;96(1138):455-460. [CrossRef]
- Miyai N, Shiozaki M, Yabu M, et al. Increased mean arterial pressure response to dynamic exercise in normotensive subjects with multiple metabolic risk factors. Hypertens Res. 2013;36(6):534-539. [CrossRef]
- Brownlee M. The pathobiology of diabetic complications: a unifying mechanism. Diabetes. 2005;54(6):1615-1625.
- Yang W. Diagnosing diabetes using glycated haemoglobin A1c. BMJ. 2010;340:c2262. [CrossRef]
- Sylow L, Kleinert M, Richter EA, Jensen TE. Exercise-stimulated glucose uptake - regulation and implications for glycaemic control. Nature Reviews Endocrinology. 2017;13(3):133-148. [CrossRef]
- Evans PL, McMillin SL, Weyrauch LA, Witczak CA. Regulation of Skeletal Muscle Glucose Transport and Glucose Metabolism by Exercise Training. Nutrients. 2019;11(10). [CrossRef]
- Rossello X, Raposeiras-Roubin S, Oliva B, et al. Glycated Hemoglobin and Subclinical Atherosclerosis in People Without Diabetes. Journal of the American College of Cardiology. 2021;77(22):2777-2791. [CrossRef]
- Khaw K-T, Wareham N. Glycated hemoglobin as a marker of cardiovascular risk. Current Opinion In Lipidology. 2006;17(6):637-643. [CrossRef]
- Malka R, Nathan DM, Higgins JM. Mechanistic modeling of hemoglobin glycation and red blood cell kinetics enables personalized diabetes monitoring. Science Translational Medicine. 2016;8(359):359ra130. [CrossRef]
- Hu M, Lin W. Effects of exercise training on red blood cell production: implications for anemia. Acta Haematol. 2012;127(3):156-164. [CrossRef]
- Montero D, Lundby C. Regulation of Red Blood Cell Volume with Exercise Training. Comprehensive Physiology. 2018;9(1):149-164.
- Montero D, Breenfeldt-Andersen A, Oberholzer L, et al. Erythropoiesis with endurance training: dynamics and mechanisms. American Journal of Physiology Regulatory, Integrative and Comparative Physiology. 2017;312(6):R894-R902. [CrossRef]
- Gomez-Delgado F, Katsiki N, Lopez-Miranda J, Perez-Martinez P. Dietary habits, lipoprotein metabolism and cardiovascular disease: From individual foods to dietary patterns. Crit Rev Food Sci Nutr. 2021;61(10):1651-1669. [CrossRef]
- Huang G, Xu J, Zhang Z, Cai L, Liu H, Yu X. Total cholesterol and high density lipoprotein cholesterol ratio is associated with metabolic syndrome in a very elderly Chinese population. Scientific Reports. 2022;12(1):15212. [CrossRef]
- Chait A, Ginsberg HN, Vaisar T, Heinecke JW, Goldberg IJ, Bornfeldt KE. Remnants of the Triglyceride-Rich Lipoproteins, Diabetes, and Cardiovascular Disease. Diabetes. 2020;69(4):508-516. [CrossRef]
- Cho K-H. The Current Status of Research on High-Density Lipoproteins (HDL): A Paradigm Shift from HDL Quantity to HDL Quality and HDL Functionality. International Journal of Molecular Sciences. 2022;23(7). [CrossRef]
- Hasvold P, Thuresson M, Sundström J, et al. Association Between Paradoxical HDL Cholesterol Decrease and Risk of Major Adverse Cardiovascular Events in Patients Initiated on Statin Treatment in a Primary Care Setting. Clin Drug Investig. 2016;36(3):225-233. [CrossRef]
- de Salles BF, Simão R, Fleck SJ, Dias I, Kraemer-Aguiar LG, Bouskela E. Effects of resistance training on cytokines. International Journal of Sports Medicine. 2010;31(7):441-450. [CrossRef]
- Libardi CA, De Souza GV, Cavaglieri CR, Madruga VA, Chacon-Mikahil MPT. Effect of resistance, endurance, and concurrent training on TNF-α, IL-6, and CRP. Medicine and Science In Sports and Exercise. 2012;44(1):50-56.
- Sañudo B, Alfonso-Rosa R, Del Pozo-Cruz B, Del Pozo-Cruz J, Galiano D, Figueroa A. Whole body vibration training improves leg blood flow and adiposity in patients with type 2 diabetes mellitus. European Journal of Applied Physiology. 2013;113(9):2245-2252. [CrossRef]
- Williams MA, Haskell WL, Ades PA, et al. Resistance exercise in individuals with and without cardiovascular disease: 2007 update: a scientific statement from the American Heart Association Council on Clinical Cardiology and Council on Nutrition, Physical Activity, and Metabolism. Circulation. 2007;116(5):572-584.
Figure 1.
PRISMA Flow diagram of literature search.
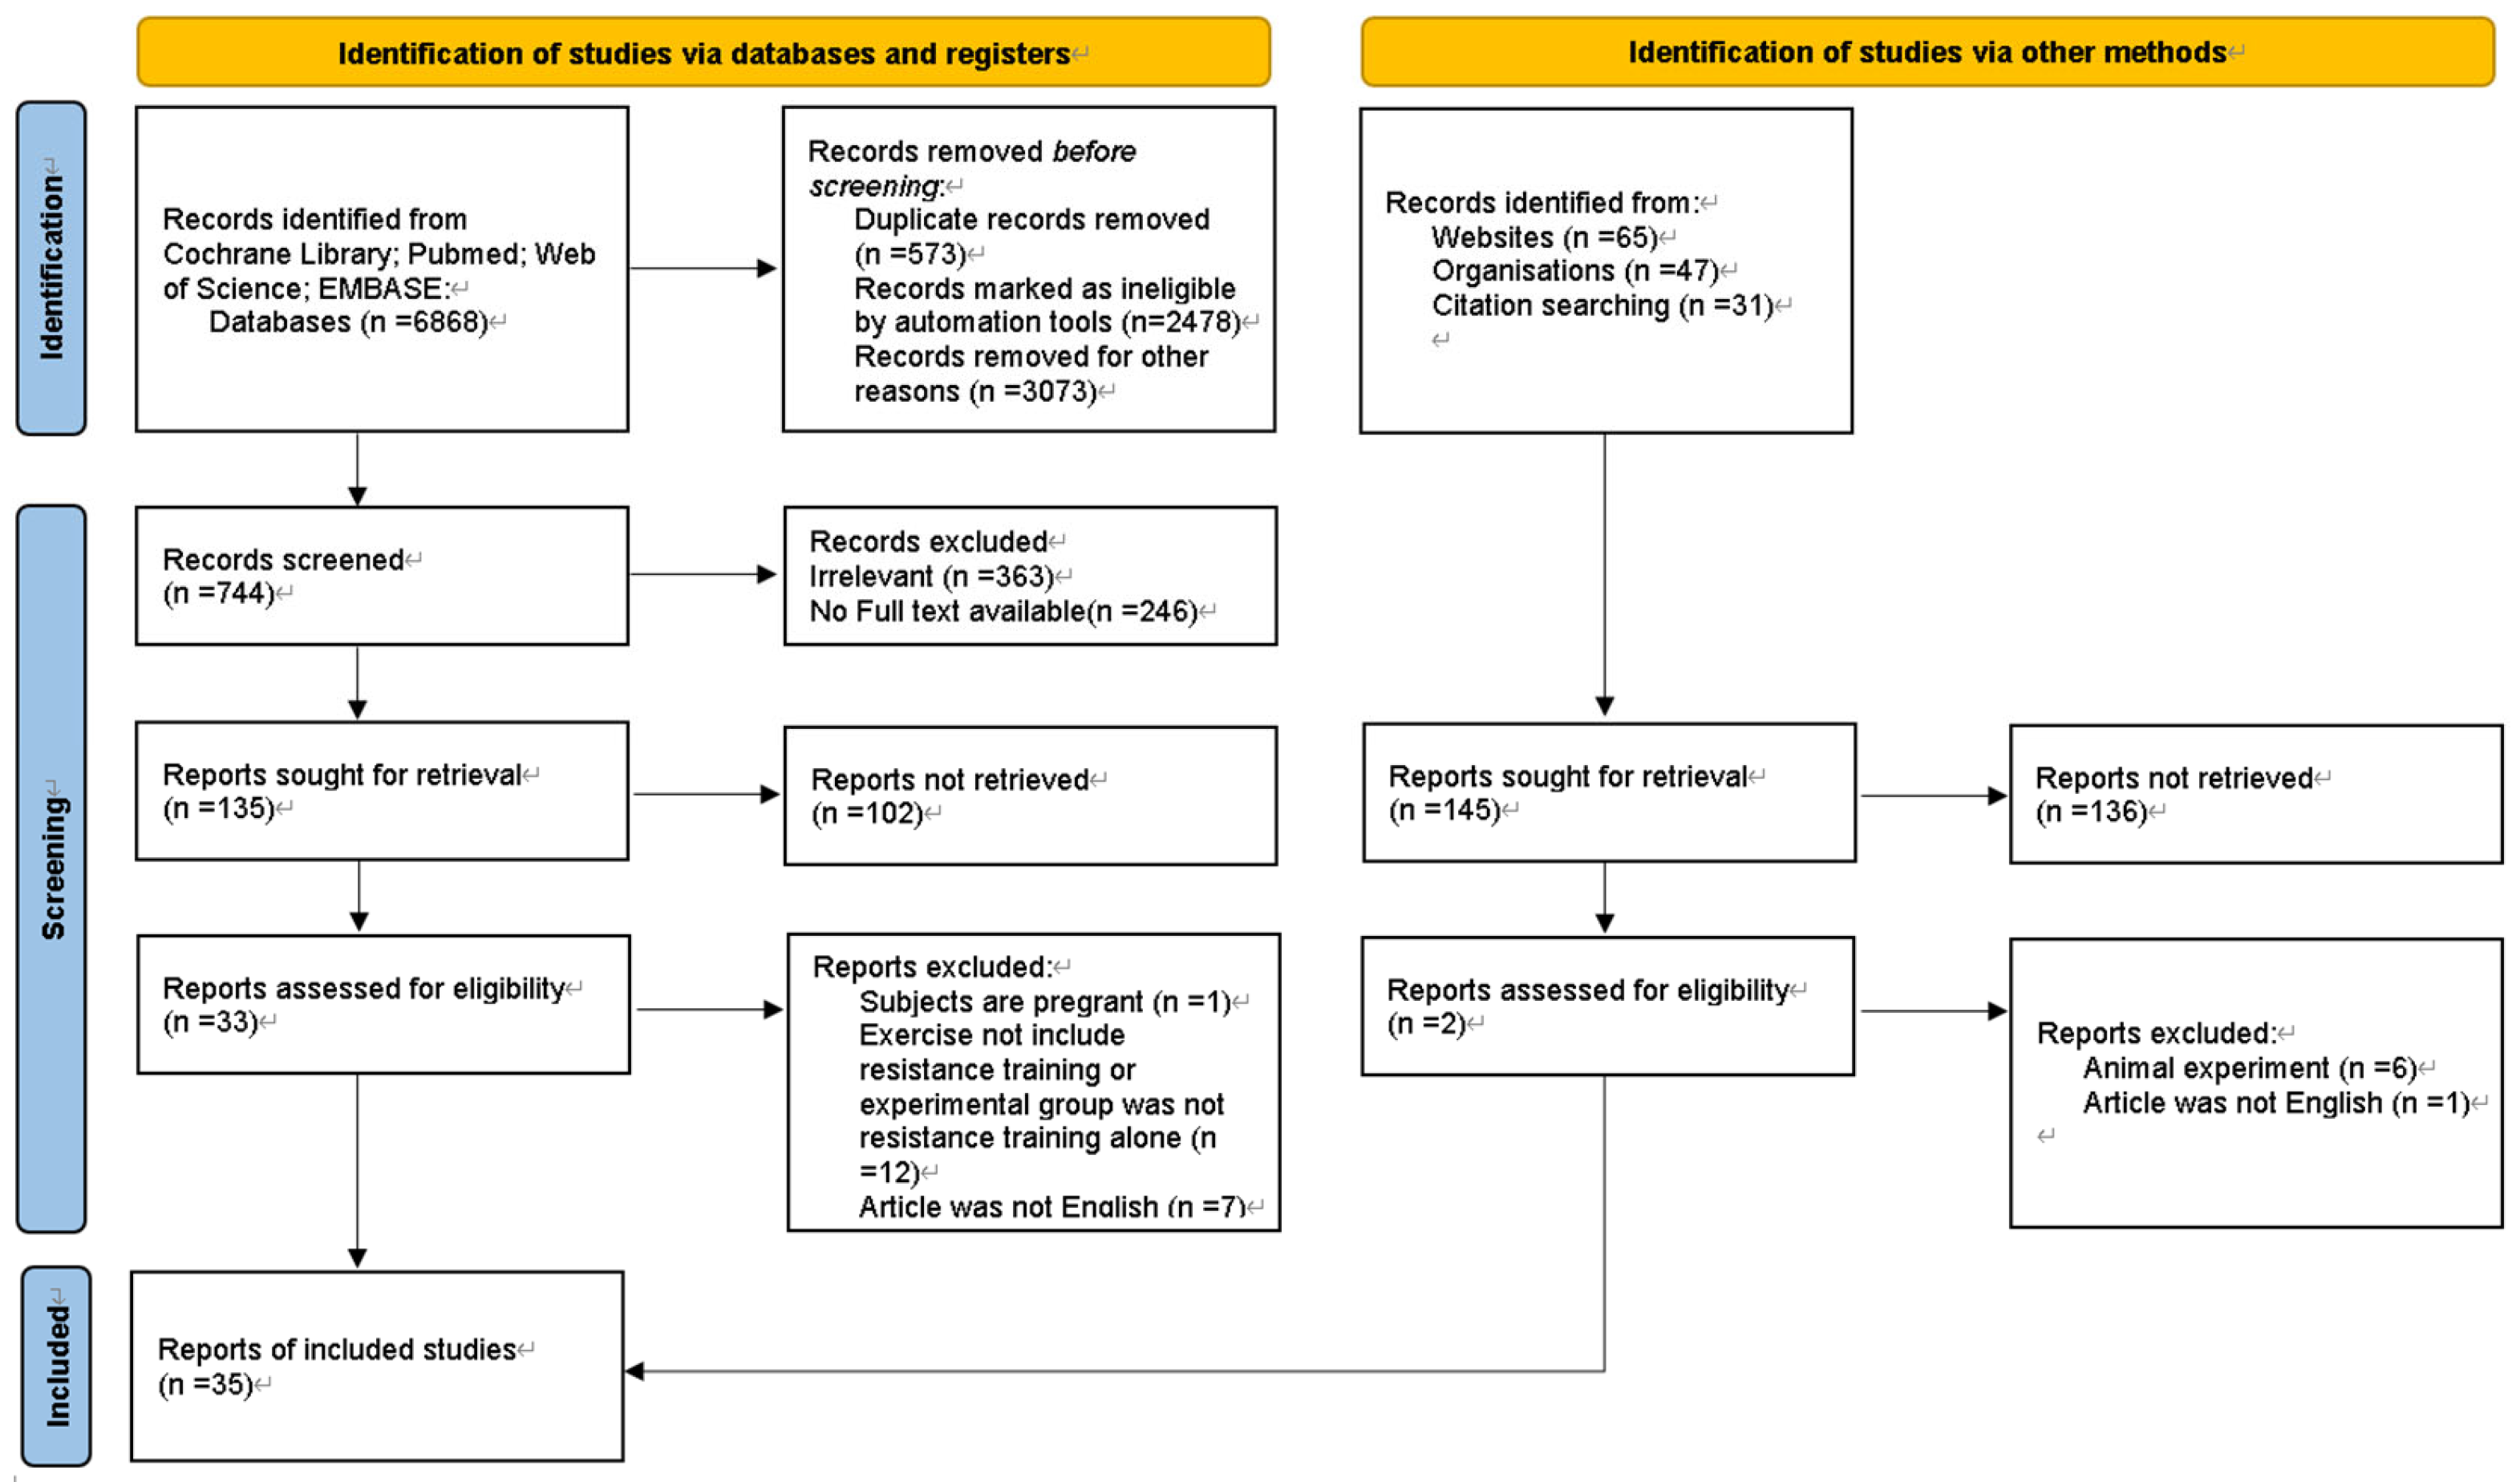
Figure 4.
Forest plot: difference in waist circumference between resistance training group and control group. CI confidence interval, IV inverse variance method, SD standard deviation.
Figure 4.
Forest plot: difference in waist circumference between resistance training group and control group. CI confidence interval, IV inverse variance method, SD standard deviation.
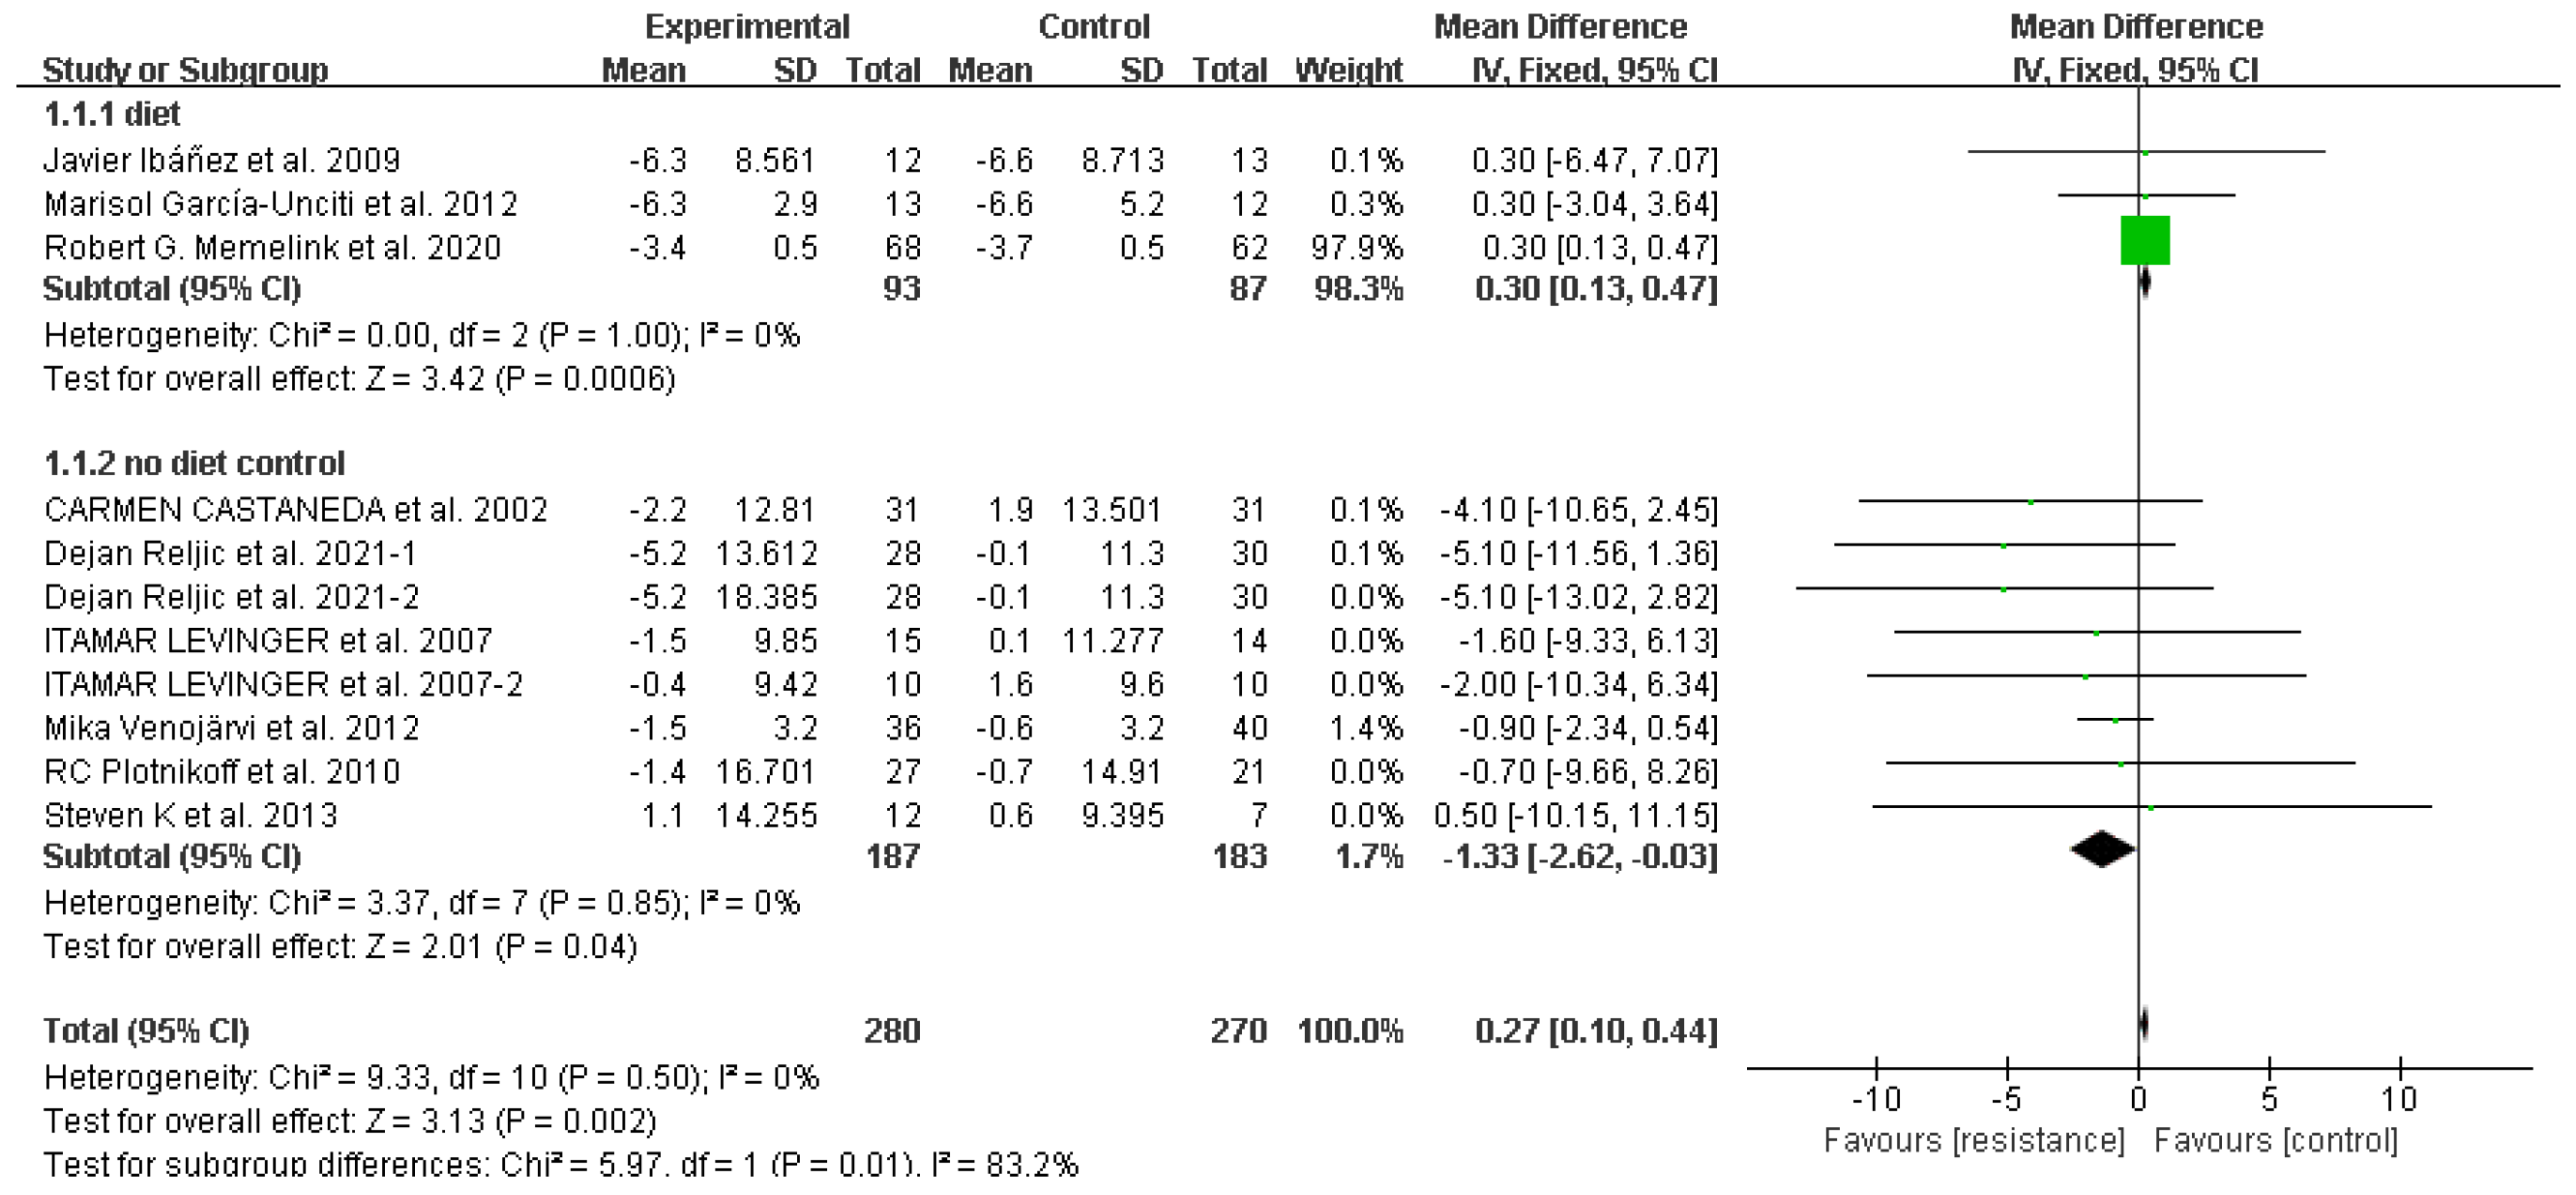
Figure 5.
Forest plot: difference in systolic blood pressure between the resistance training group and the control group. CI confidence interval, IV inverse variance method, SD standard deviation.
Figure 5.
Forest plot: difference in systolic blood pressure between the resistance training group and the control group. CI confidence interval, IV inverse variance method, SD standard deviation.
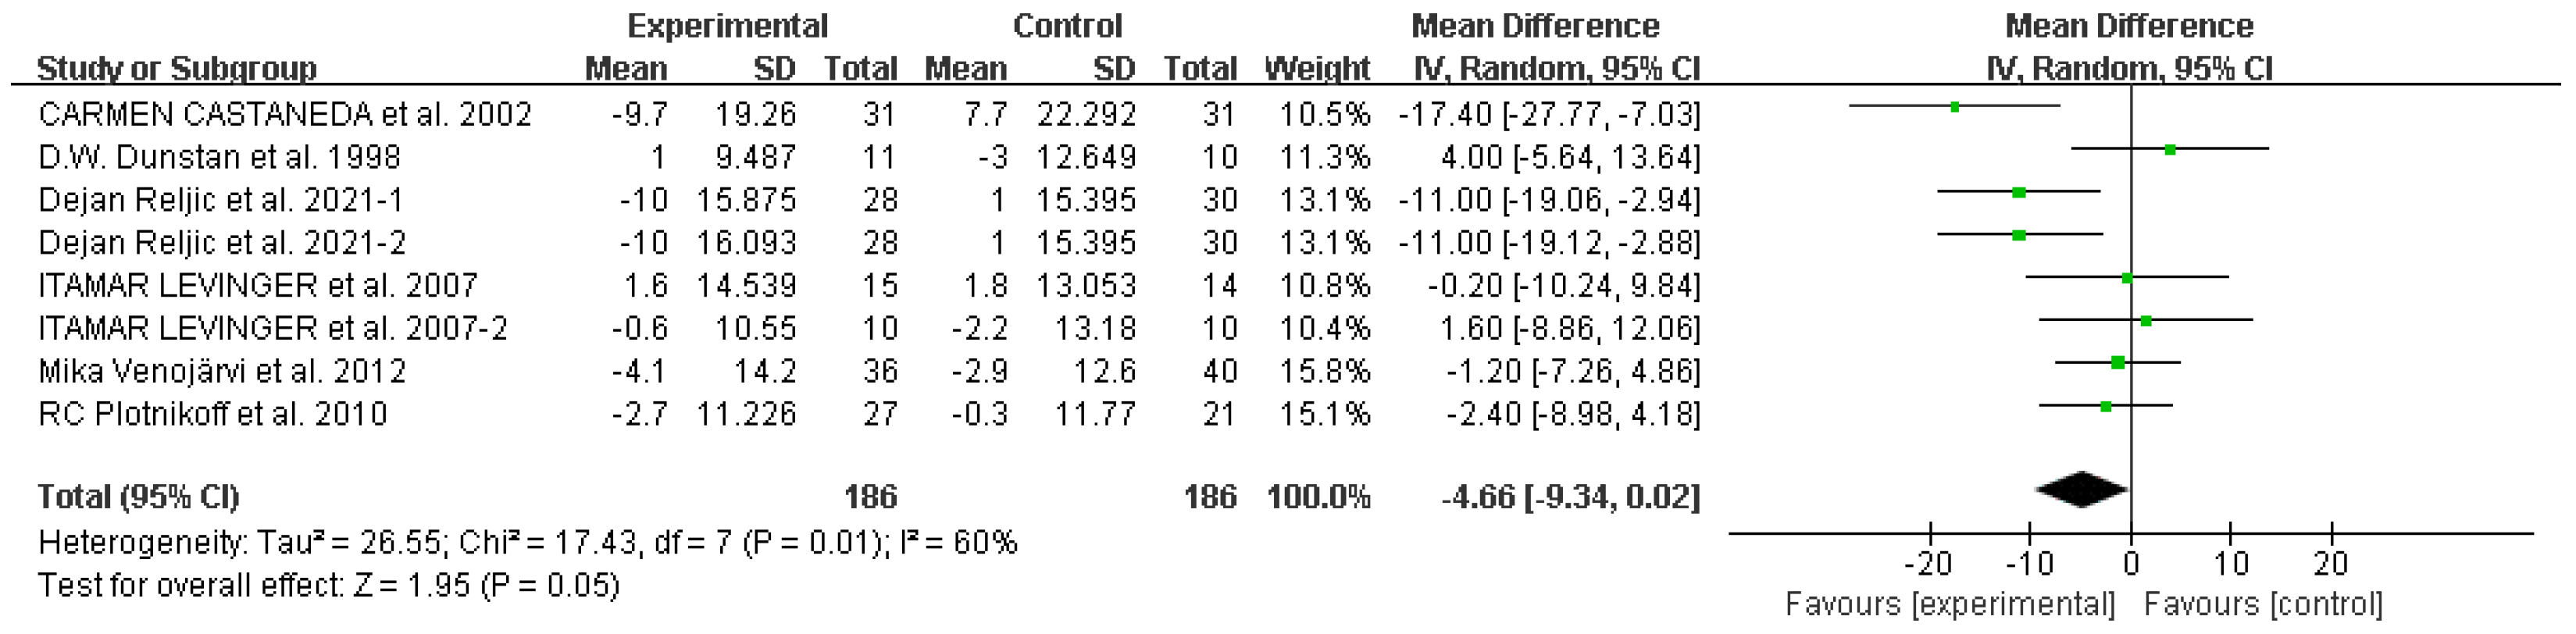
Figure 6.
Forest plot: difference in diastolic blood pressure between the resistance training group and the control group. CI confidence interval, IV inverse variance method, SD standard deviation.
Figure 6.
Forest plot: difference in diastolic blood pressure between the resistance training group and the control group. CI confidence interval, IV inverse variance method, SD standard deviation.
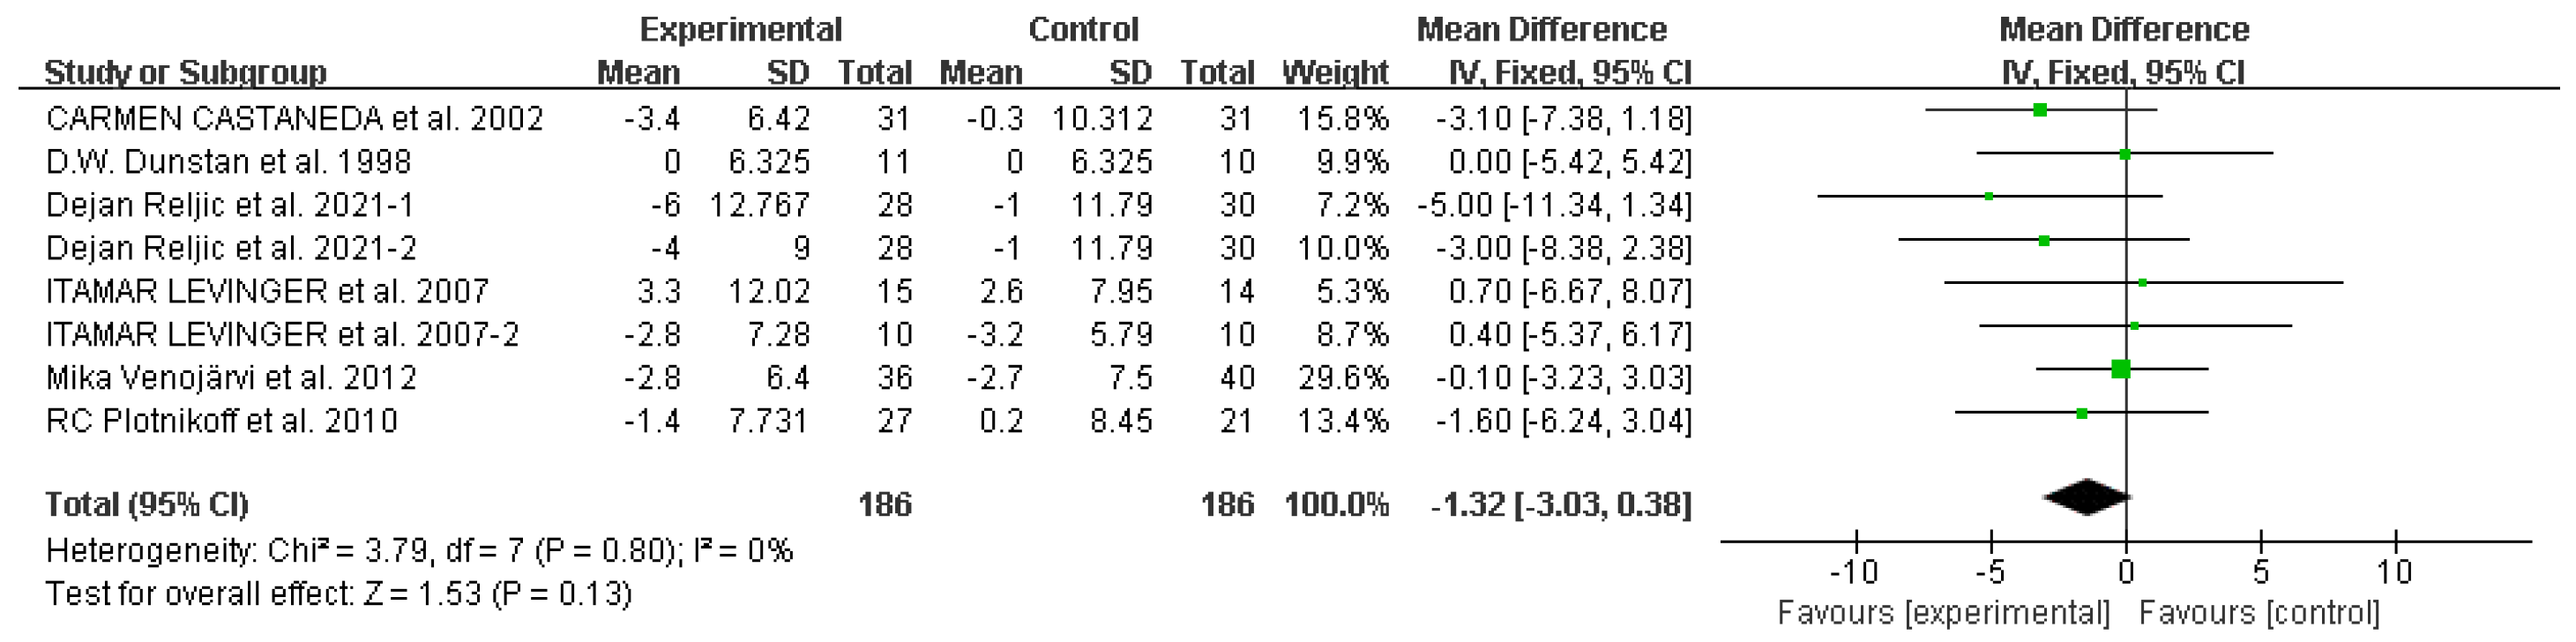
Figure 7.
Forest plot: difference in mean arterial pressure between the resistance training group and the control group. CI confidence interval, IV inverse variance method, SD standard deviation.
Figure 7.
Forest plot: difference in mean arterial pressure between the resistance training group and the control group. CI confidence interval, IV inverse variance method, SD standard deviation.
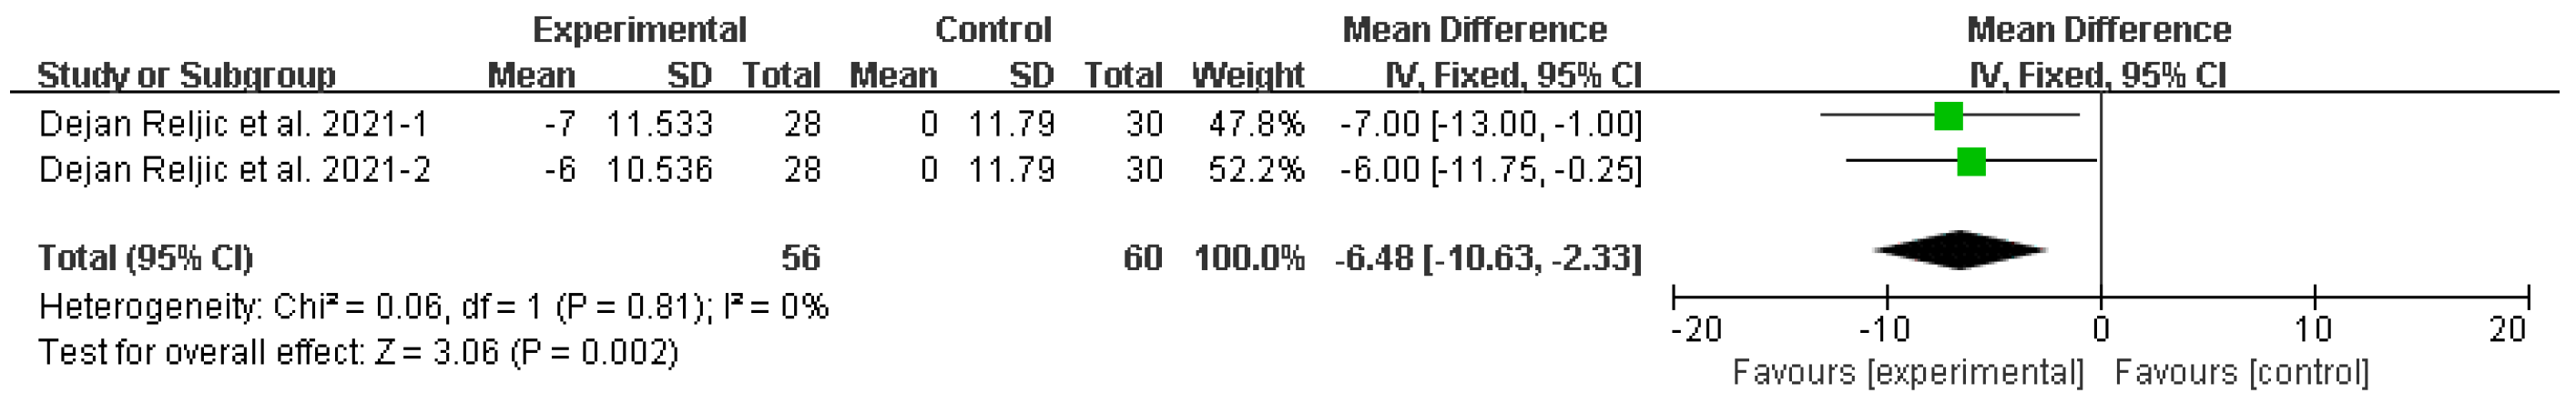
Figure 8.
Forest plot: difference in glycated hemoglobin between the resistance training group and the control group. CI confidence interval, IV inverse variance method, SD standard deviation.
Figure 8.
Forest plot: difference in glycated hemoglobin between the resistance training group and the control group. CI confidence interval, IV inverse variance method, SD standard deviation.
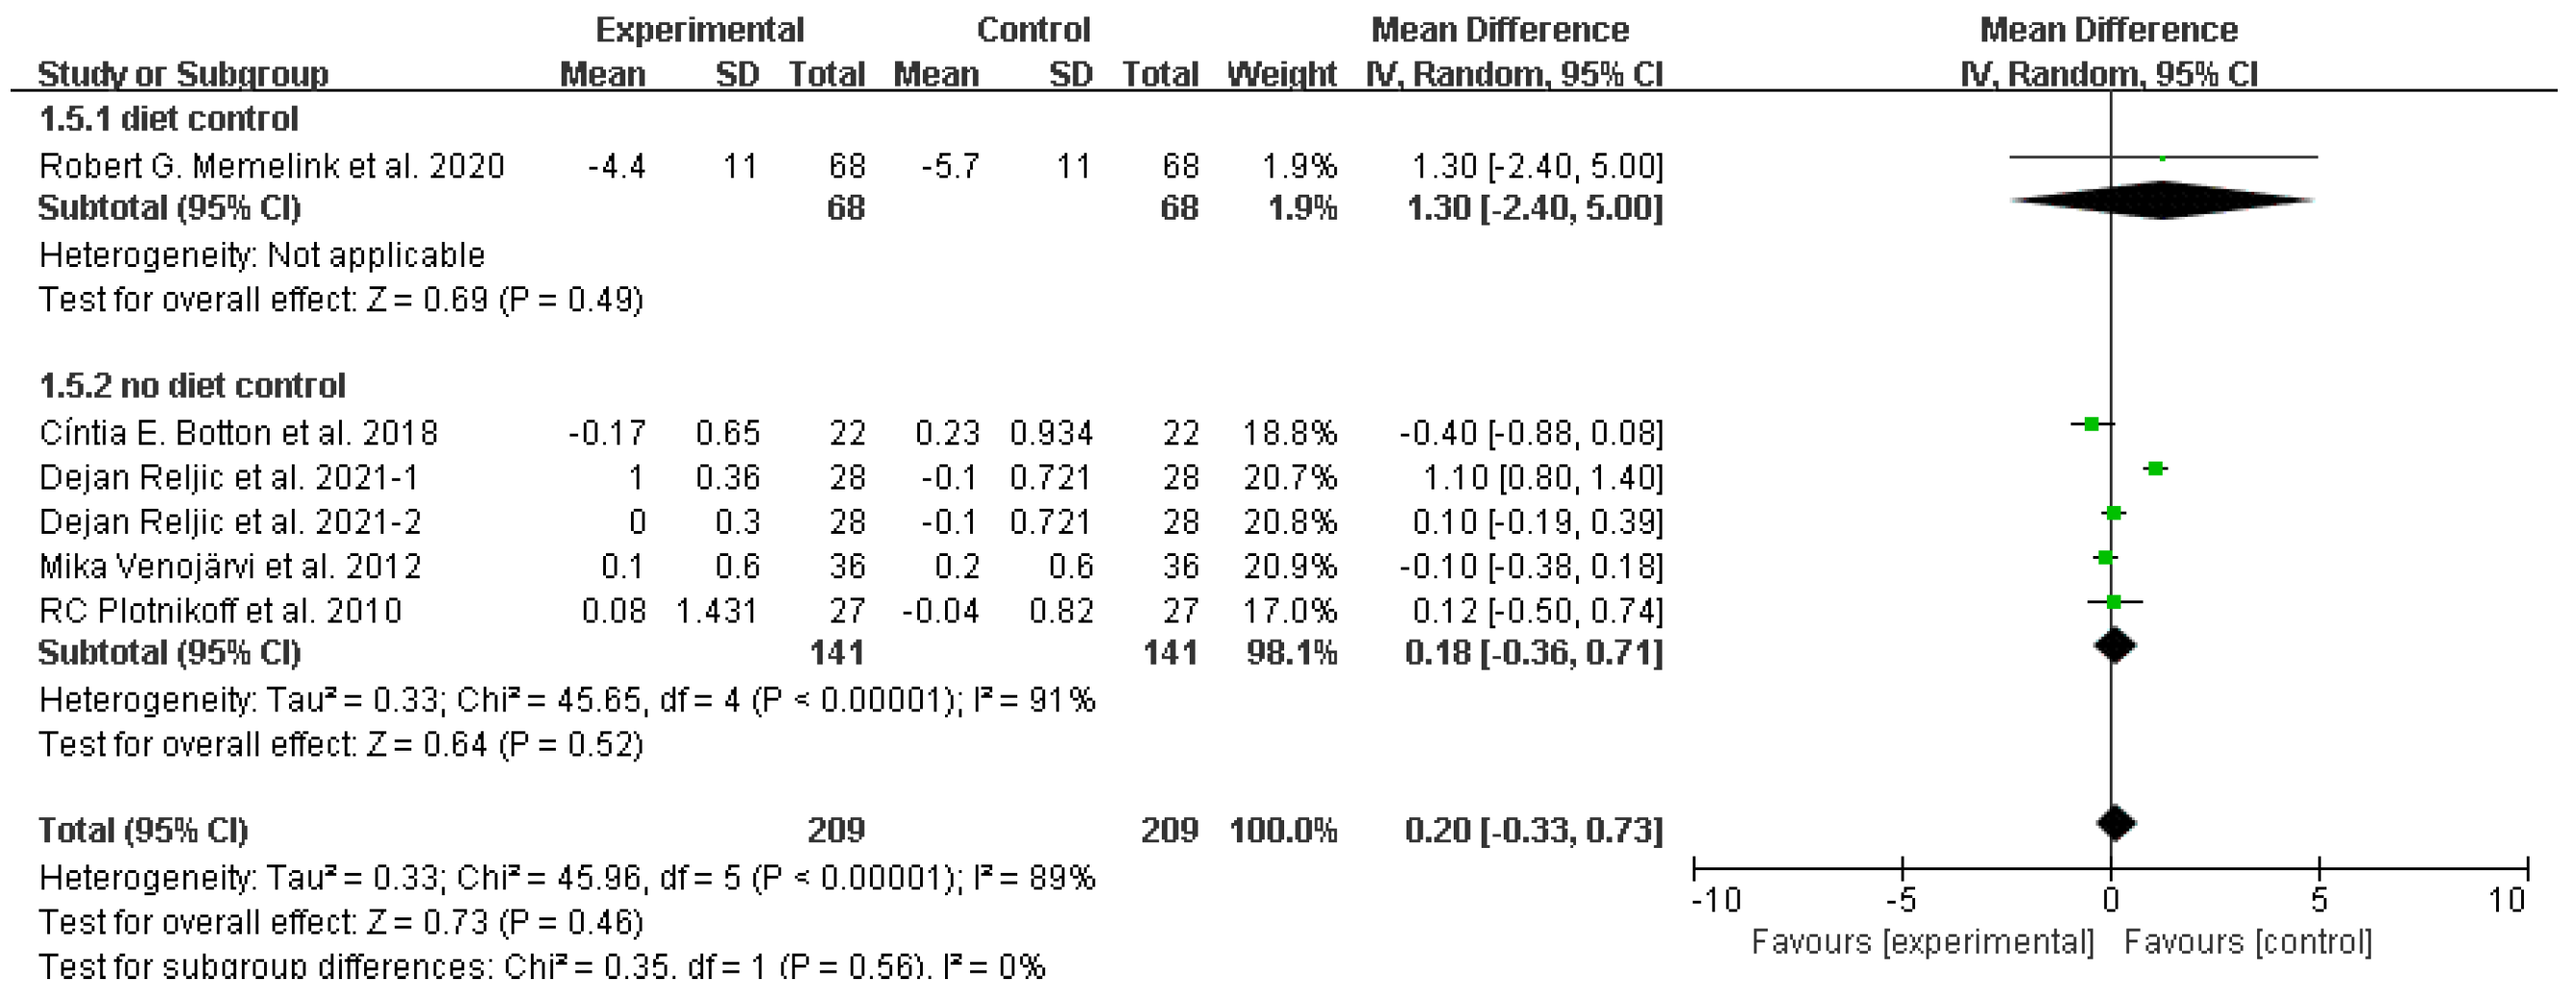
Figure 9.
Forest plot: difference in fasting glucose between the resistance training group and the control group. CI confidence interval, IV inverse variance method, SD standard deviation.
Figure 9.
Forest plot: difference in fasting glucose between the resistance training group and the control group. CI confidence interval, IV inverse variance method, SD standard deviation.
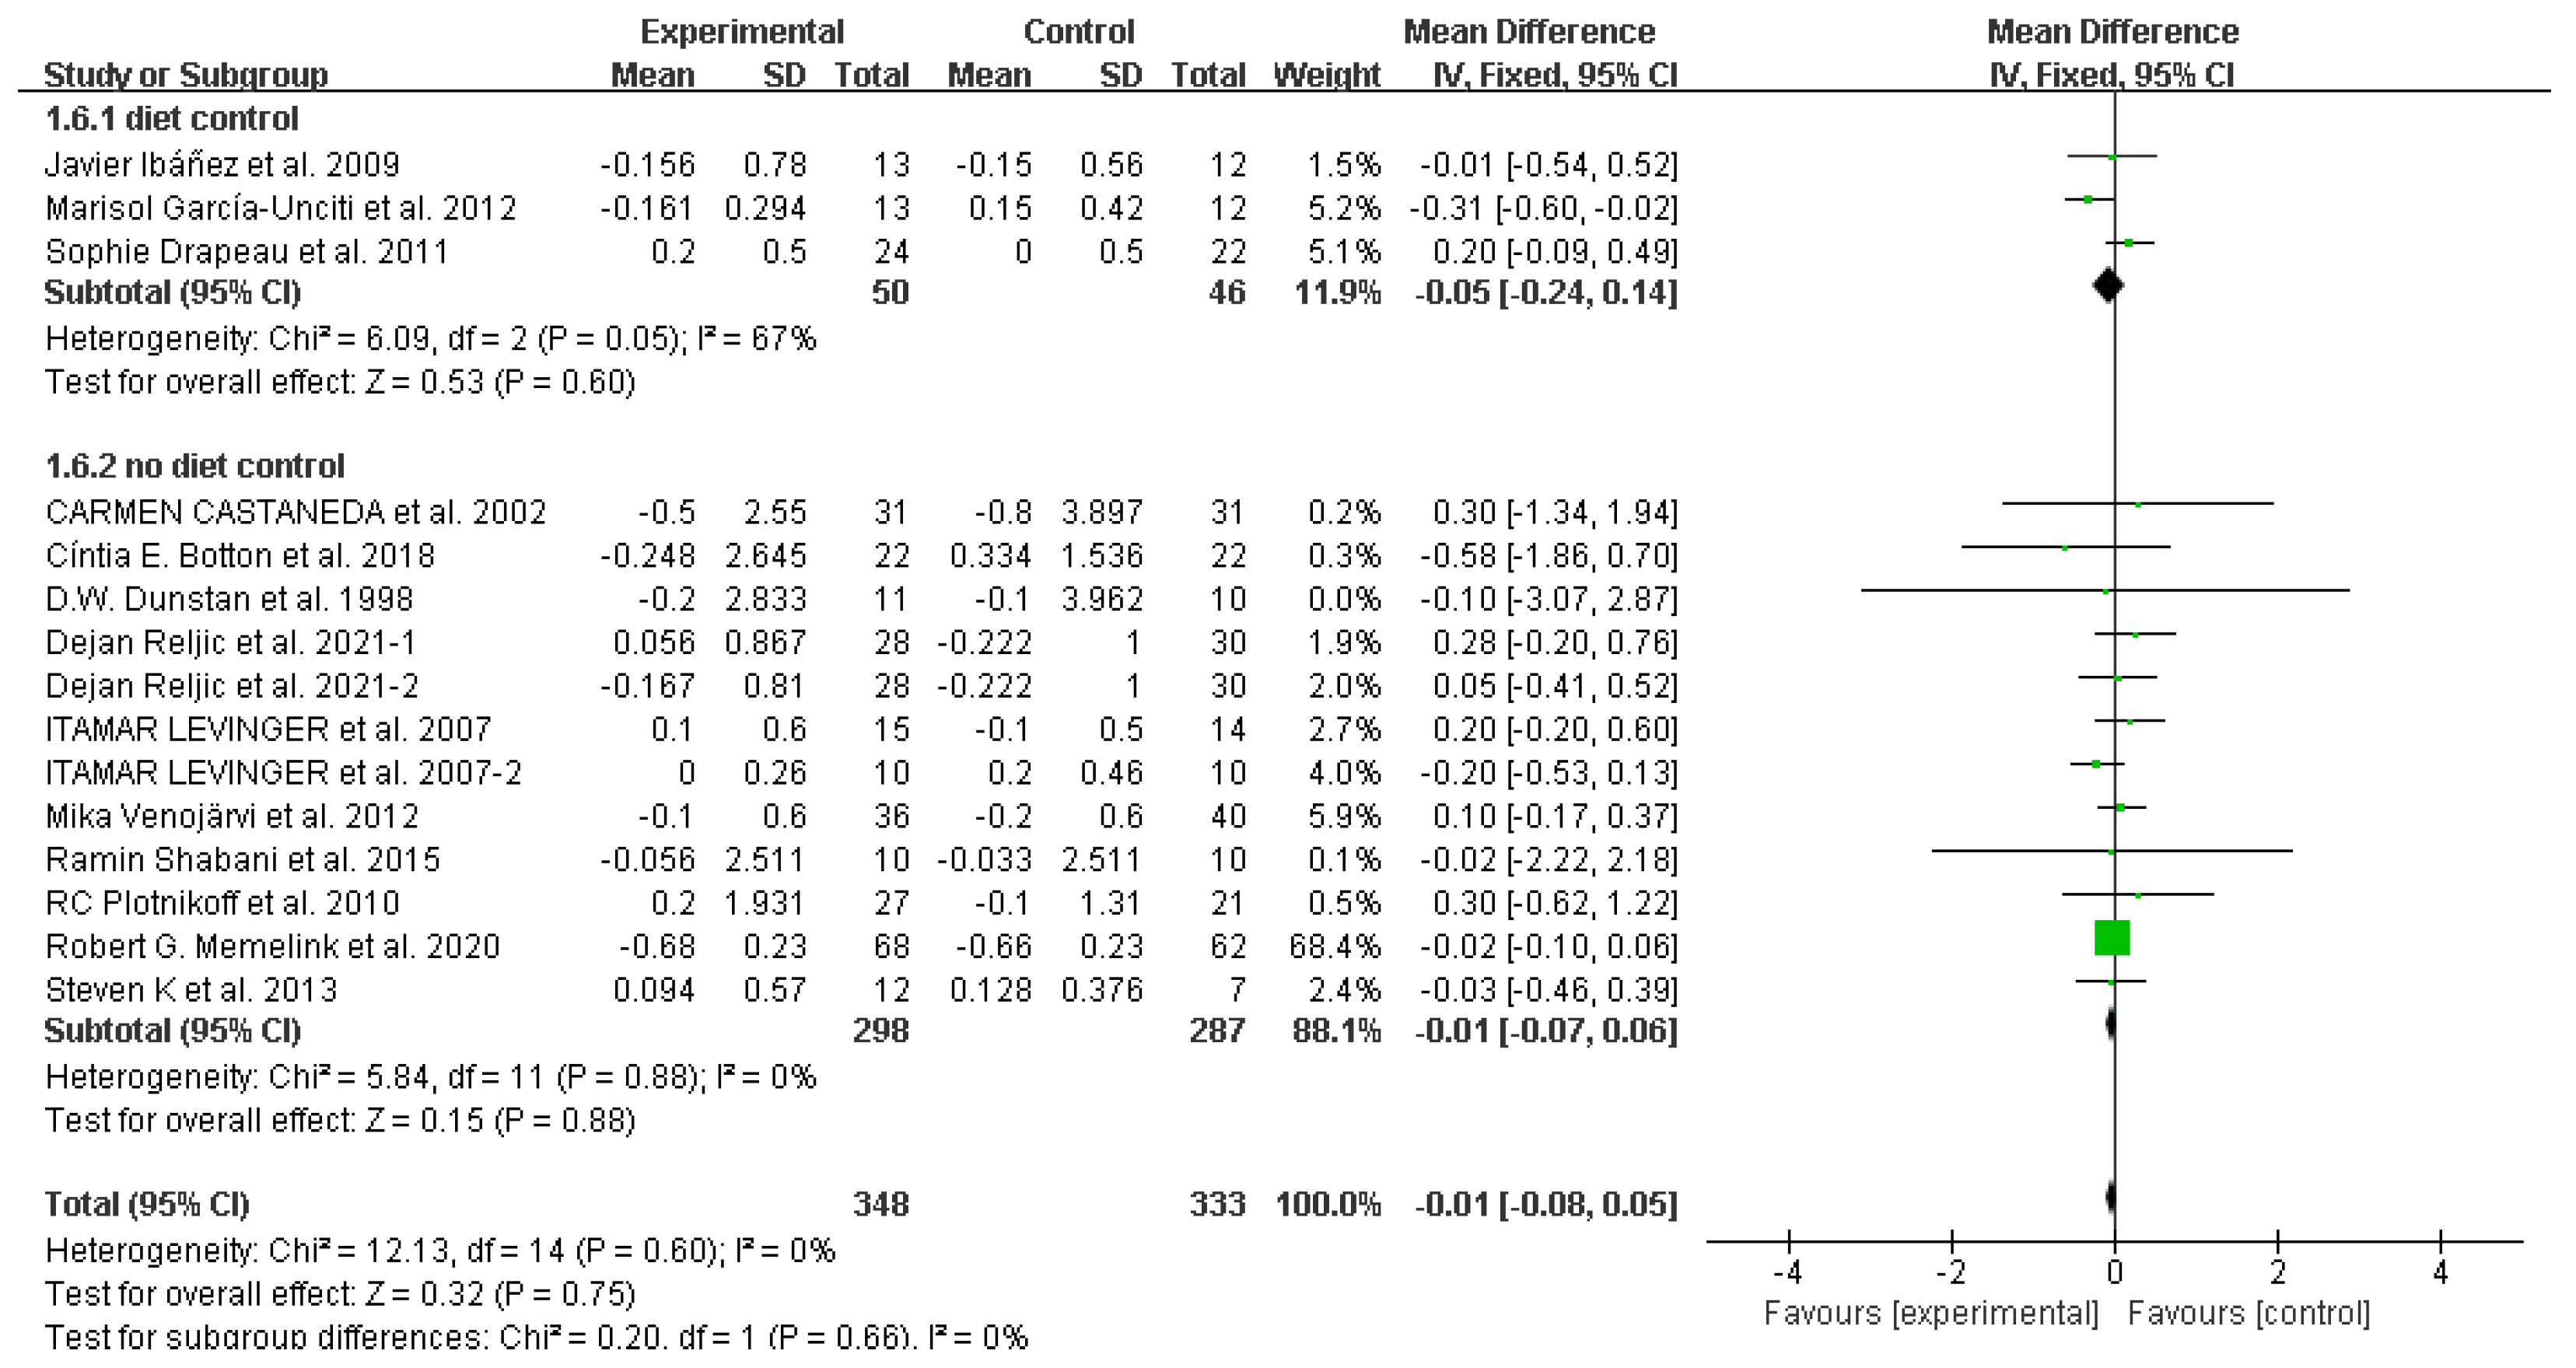
Figure 10.
Forest plot: difference in homeostasis model assessment for insulin resistance between the resistance training group and the control group. CI confidence interval, IV inverse variance method, SD standard deviation.
Figure 10.
Forest plot: difference in homeostasis model assessment for insulin resistance between the resistance training group and the control group. CI confidence interval, IV inverse variance method, SD standard deviation.
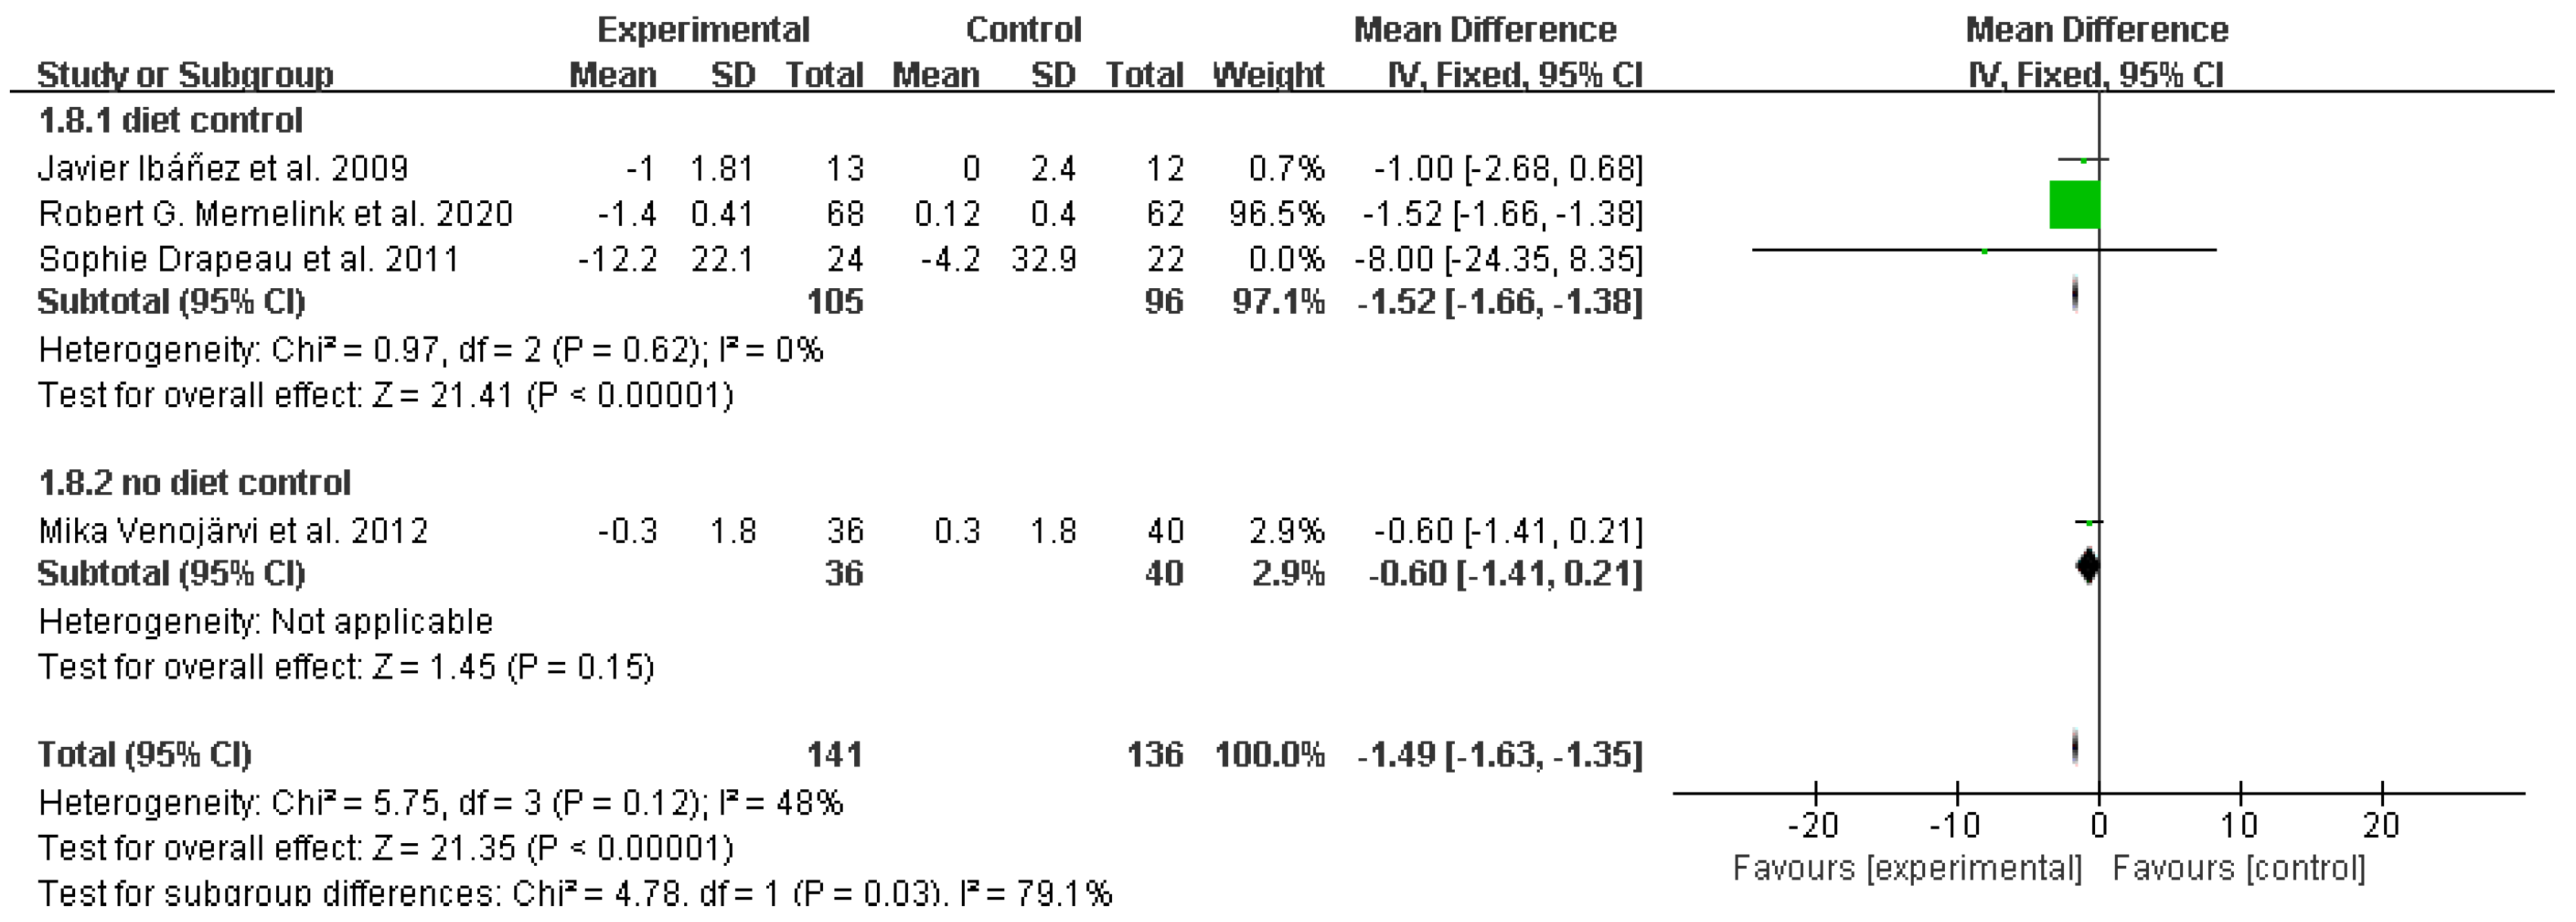
Figure 11.
Forest plot: difference in total cholesterol between the resistance training group and the control group. CI confidence interval, IV inverse variance method, SD standard deviation.
Figure 11.
Forest plot: difference in total cholesterol between the resistance training group and the control group. CI confidence interval, IV inverse variance method, SD standard deviation.
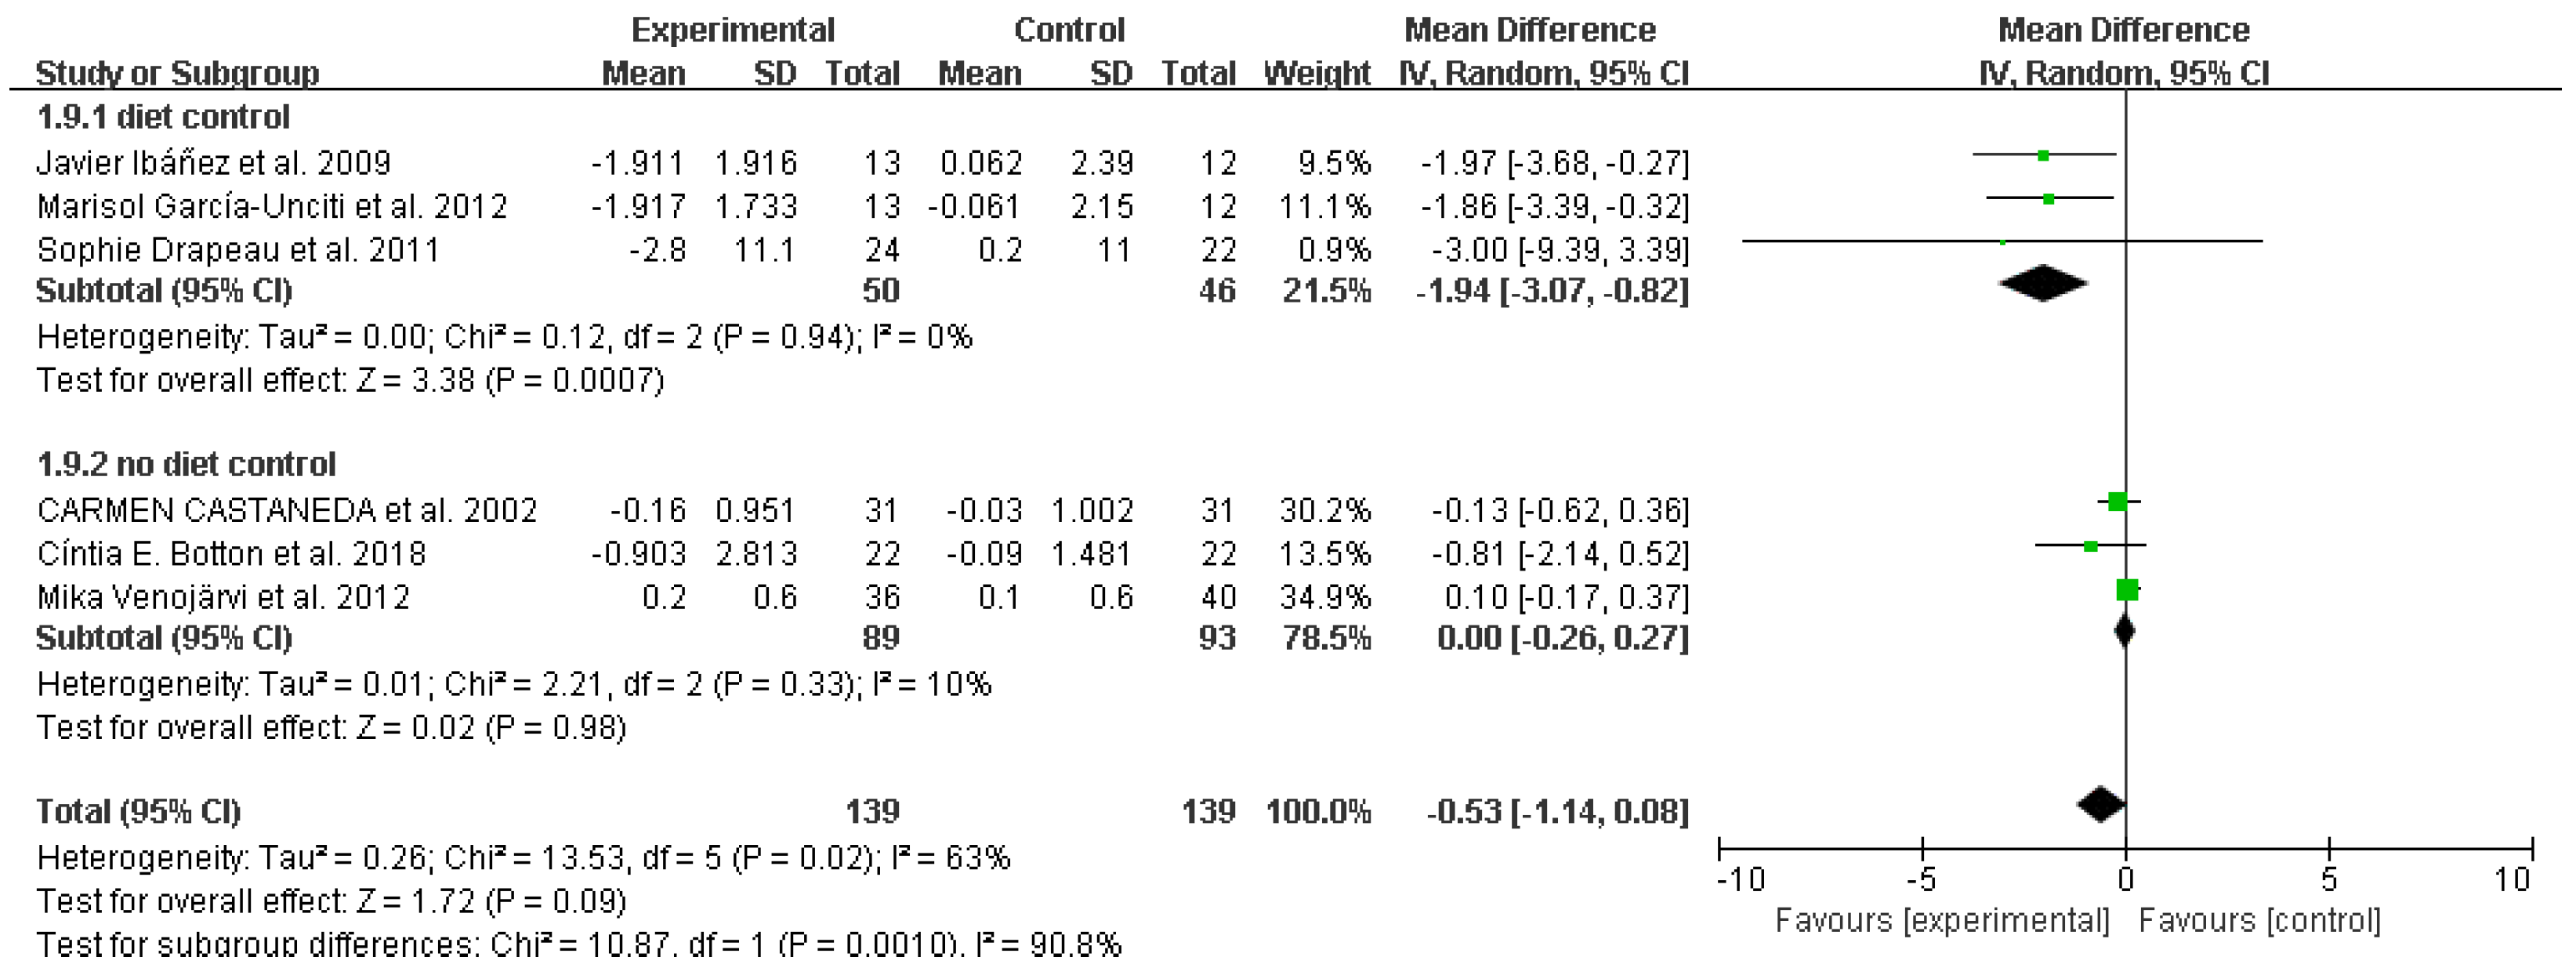
Figure 12.
Forest plot: difference in total triglycerides between the resistance training group and the control group. CI confidence interval, IV inverse variance method, SD standard deviation.
Figure 12.
Forest plot: difference in total triglycerides between the resistance training group and the control group. CI confidence interval, IV inverse variance method, SD standard deviation.
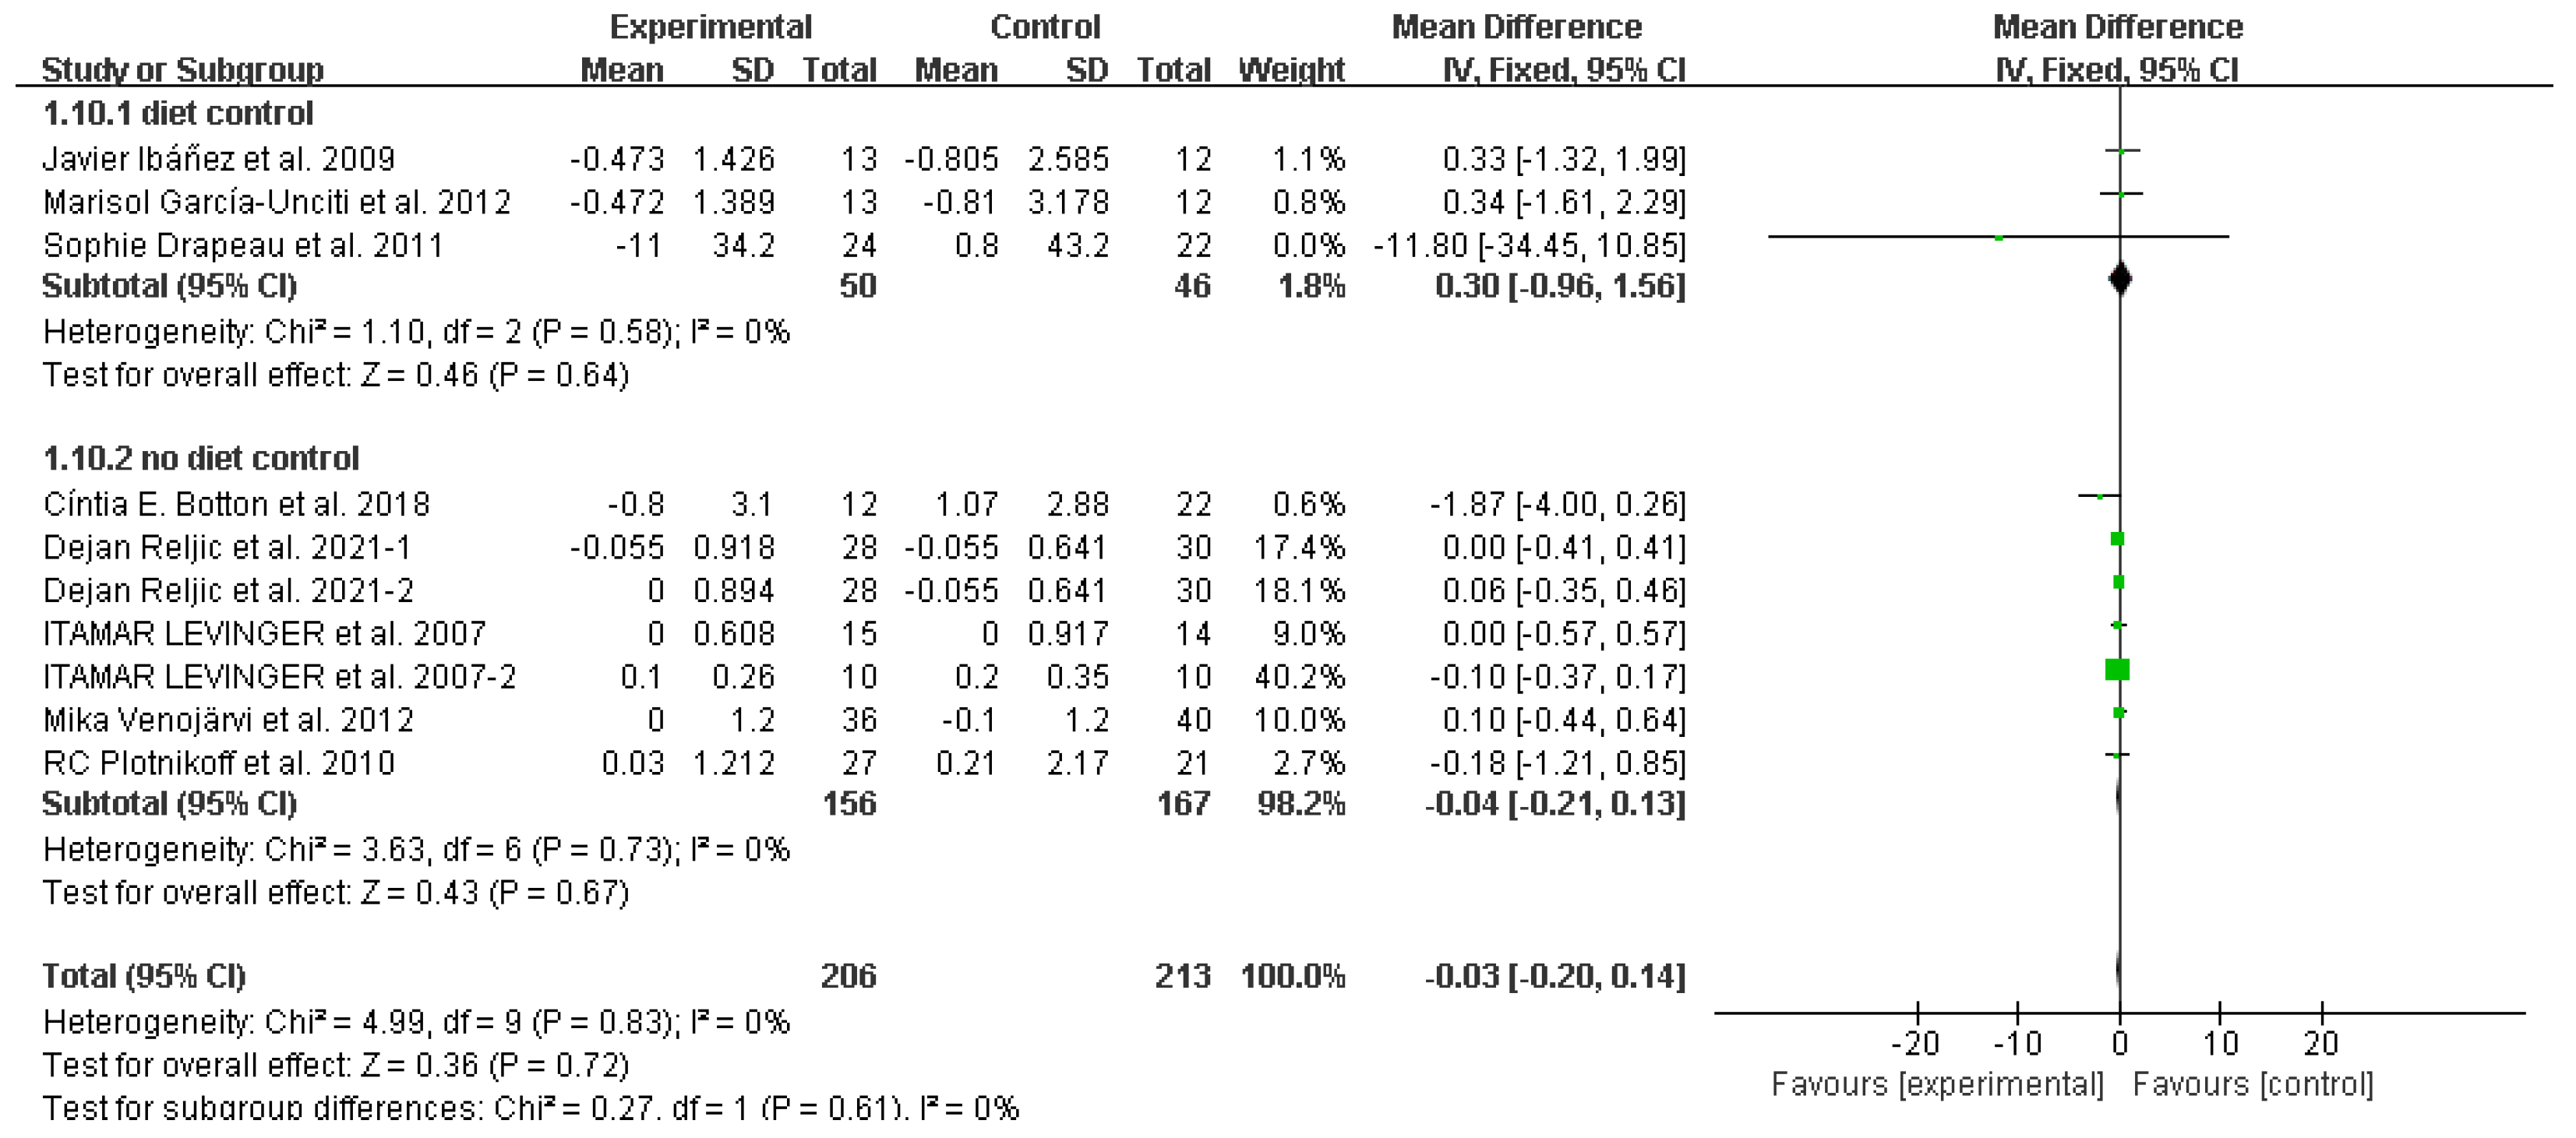
Figure 13.
Forest plot: difference in high-density lipoprotein between the resistance training group and the control group. CI confidence interval, IV inverse variance method, SD standard deviation.
Figure 13.
Forest plot: difference in high-density lipoprotein between the resistance training group and the control group. CI confidence interval, IV inverse variance method, SD standard deviation.
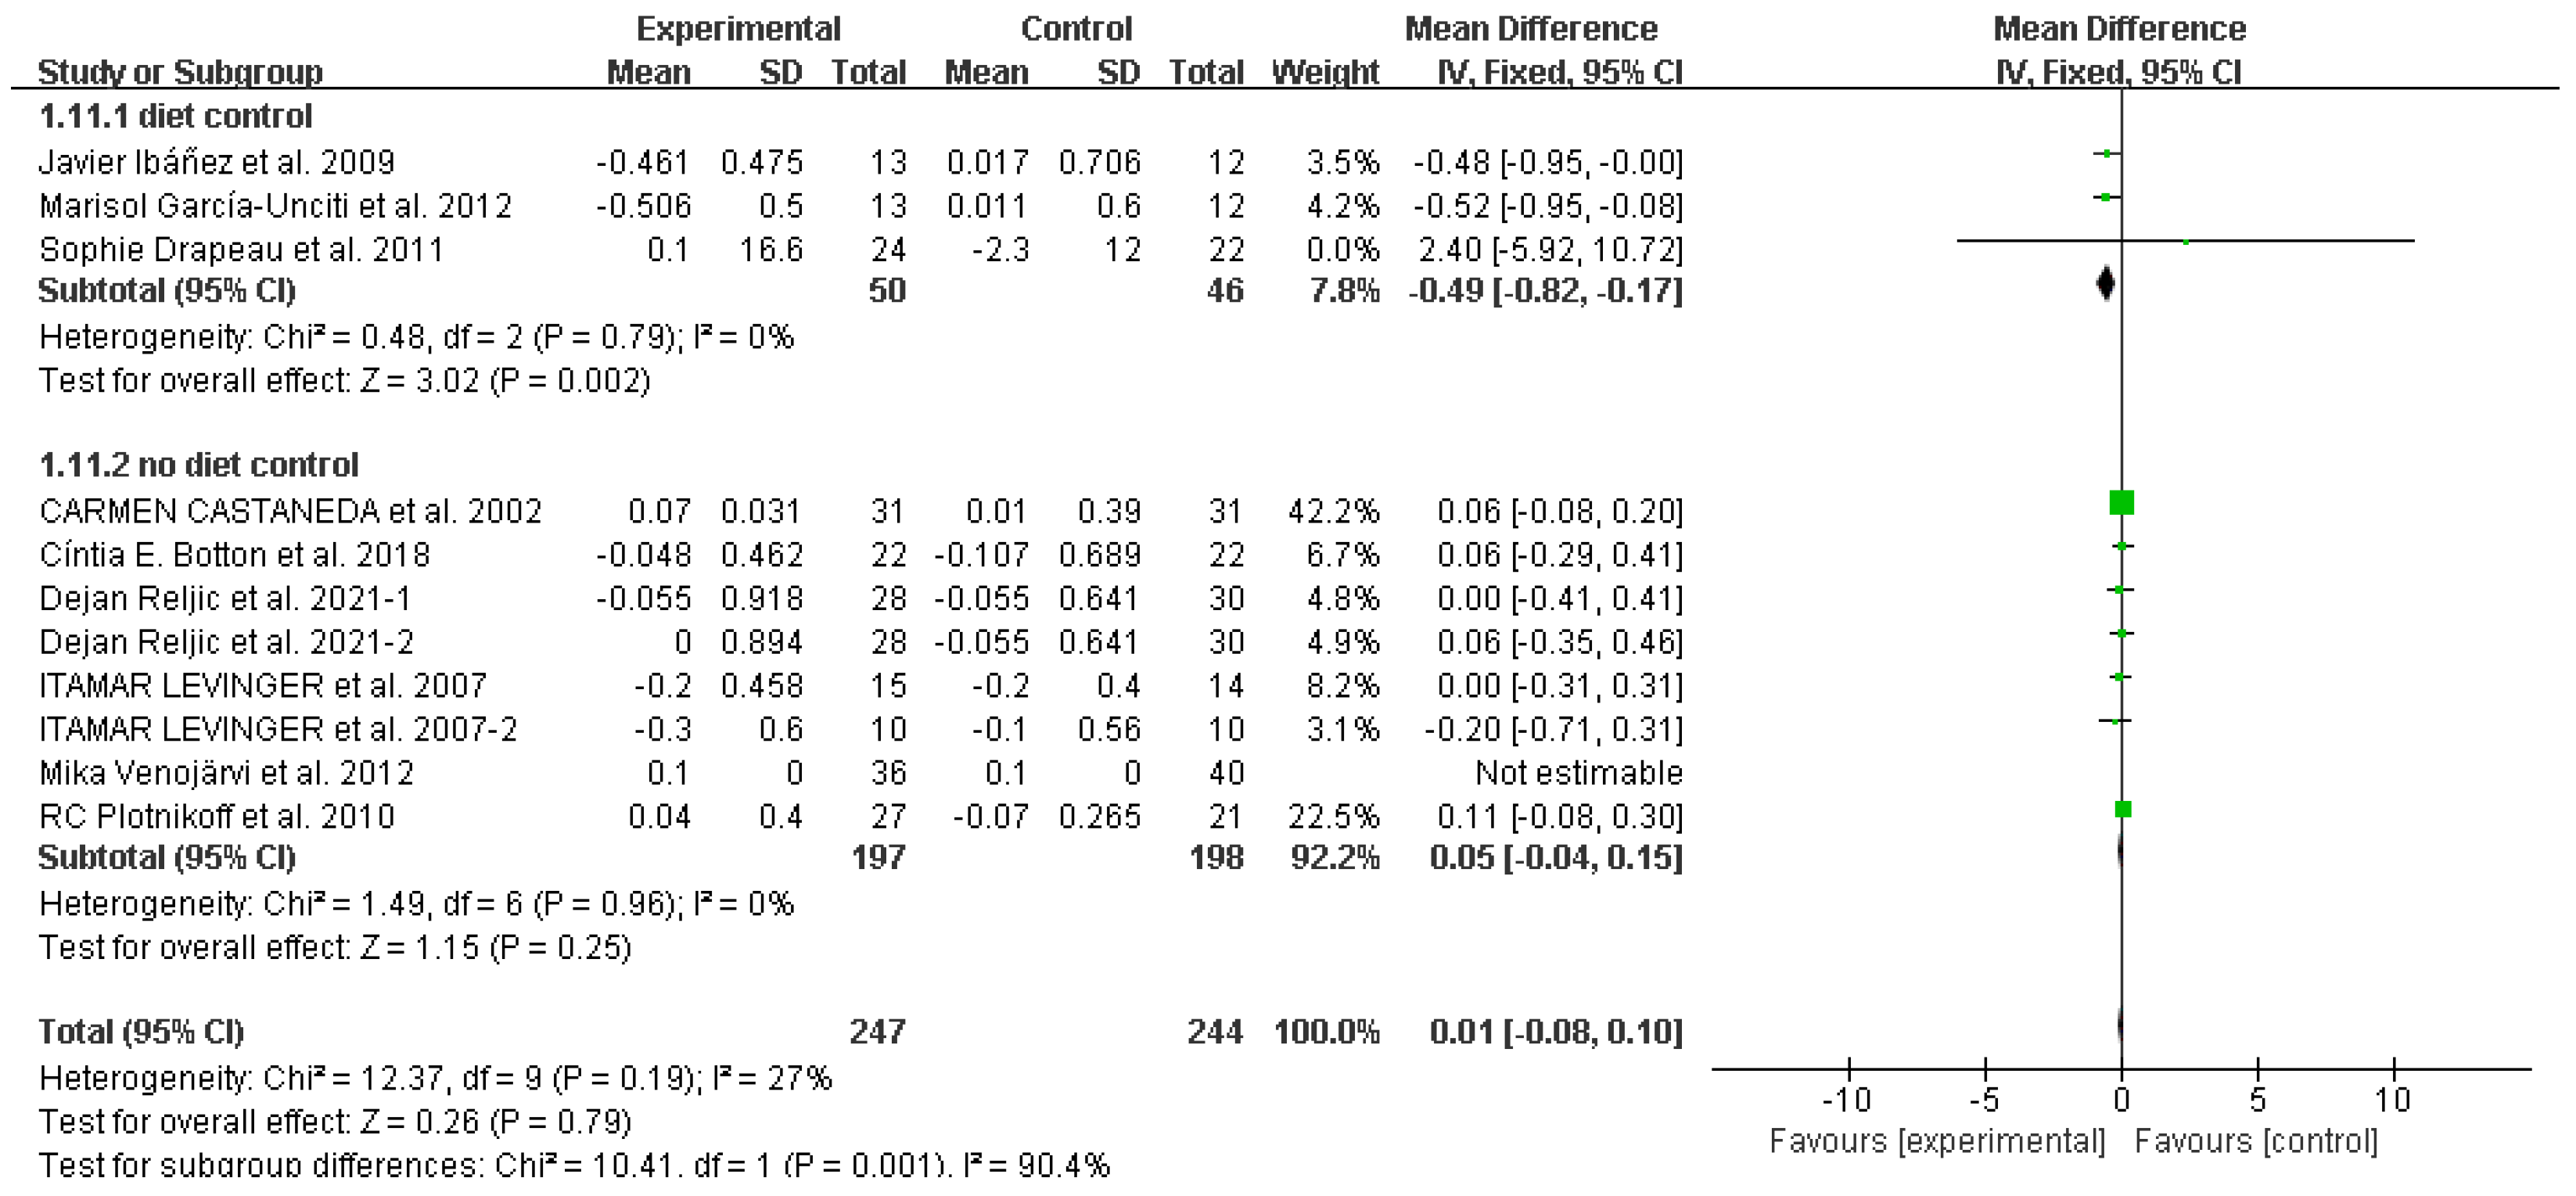
Figure 14.
Forest plot: difference in low-density lipoprotein between the resistance training group and the control group. CI confidence interval, IV inverse variance method, SD standard deviation.
Figure 14.
Forest plot: difference in low-density lipoprotein between the resistance training group and the control group. CI confidence interval, IV inverse variance method, SD standard deviation.
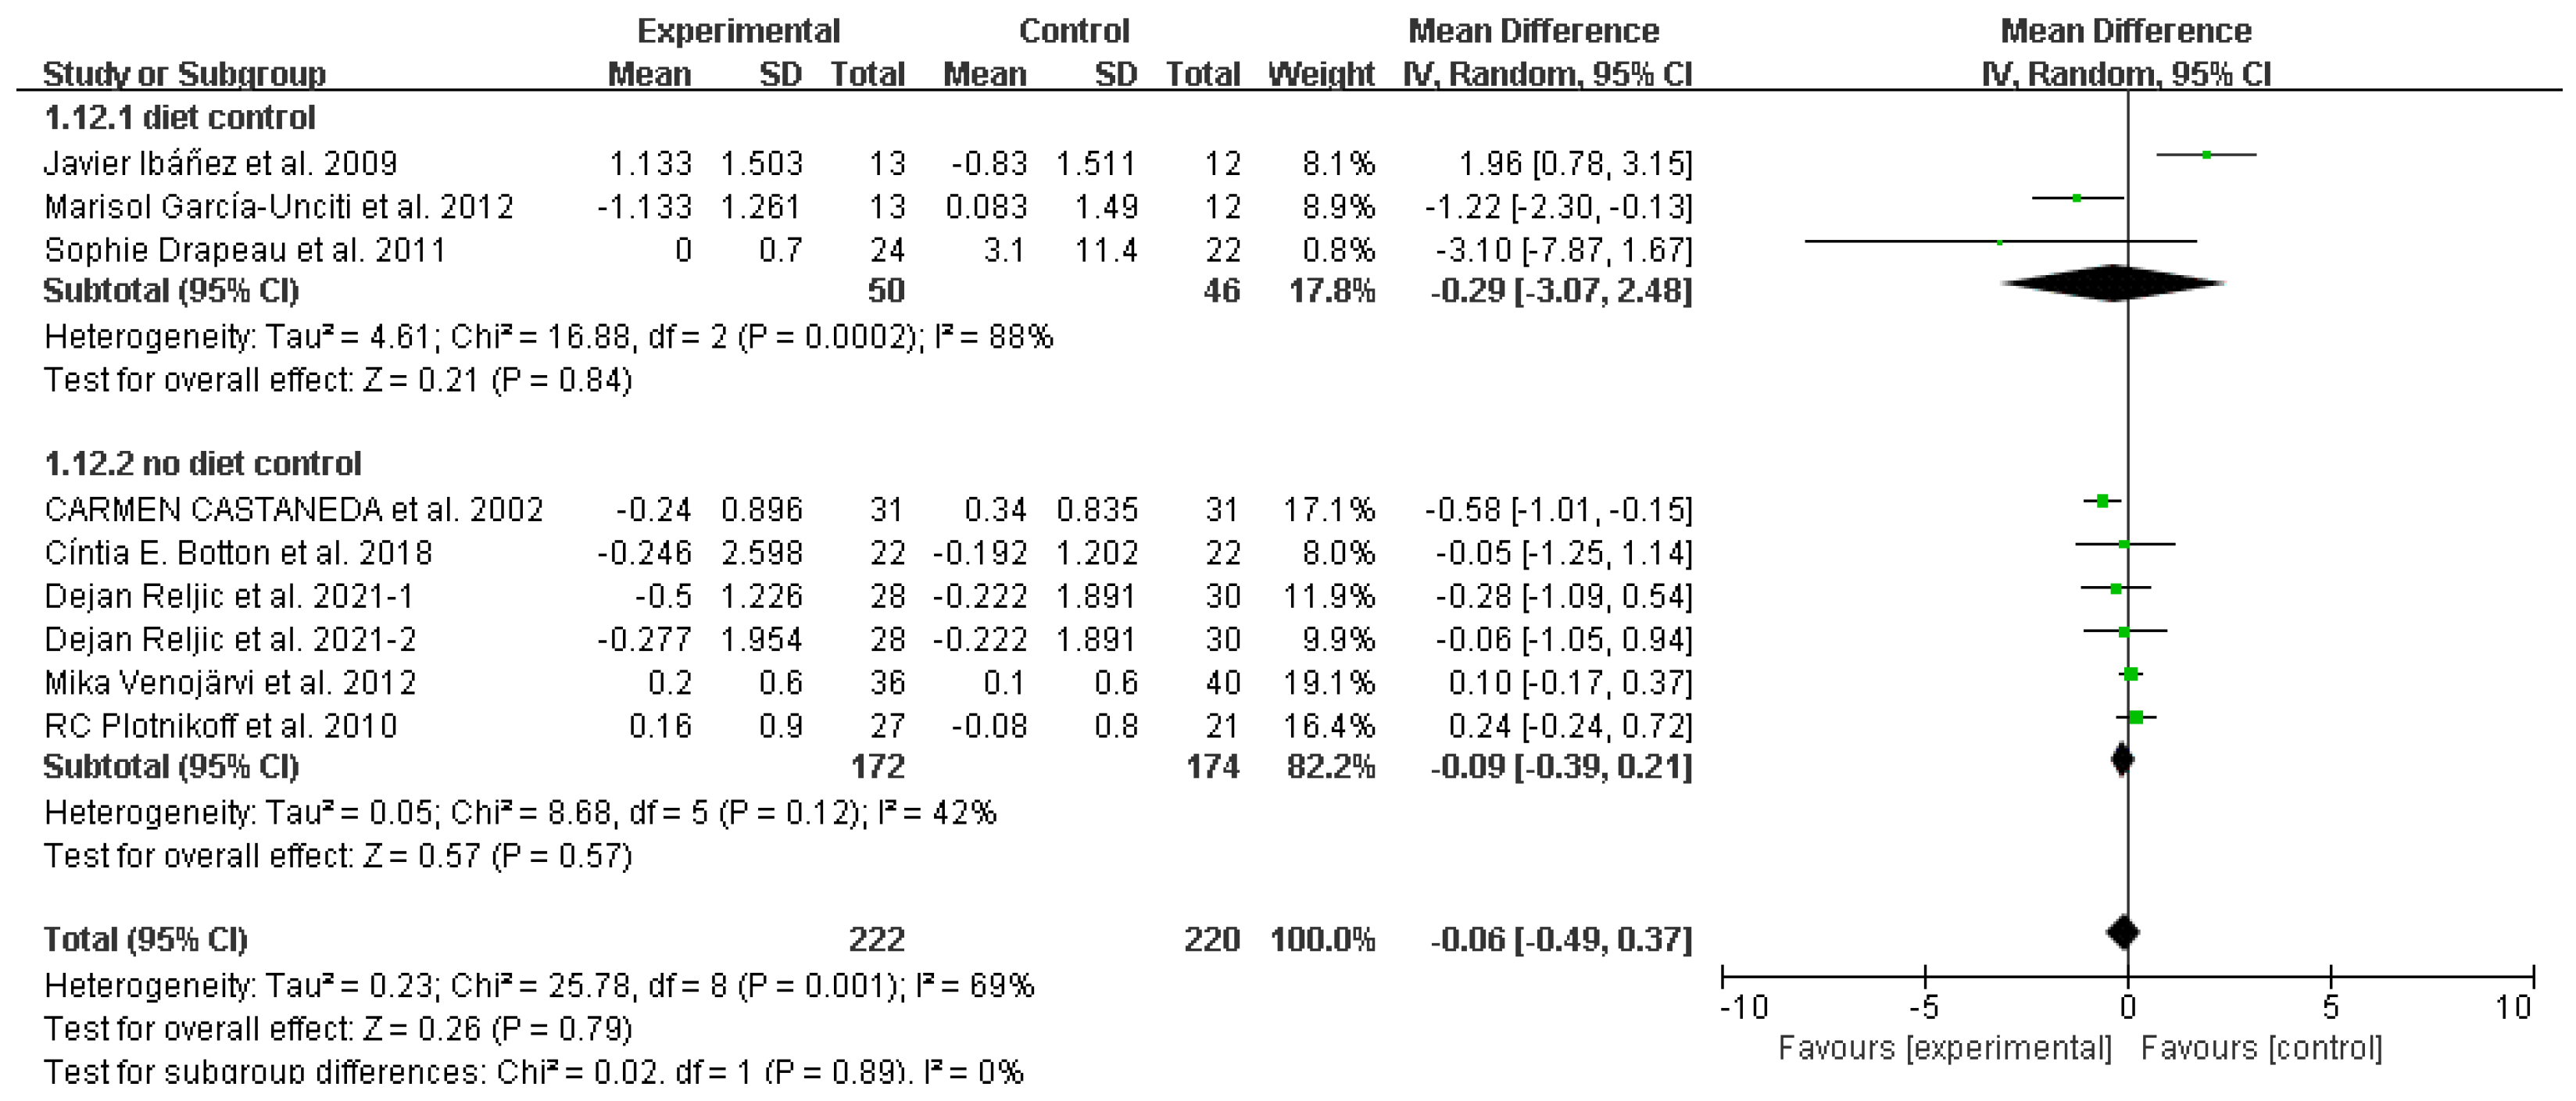
Figure 15.
Forest plot: difference in fasting insulin between the resistance training group and the control group. CI confidence interval, IV inverse variance method, SD standard deviation.
Figure 15.
Forest plot: difference in fasting insulin between the resistance training group and the control group. CI confidence interval, IV inverse variance method, SD standard deviation.
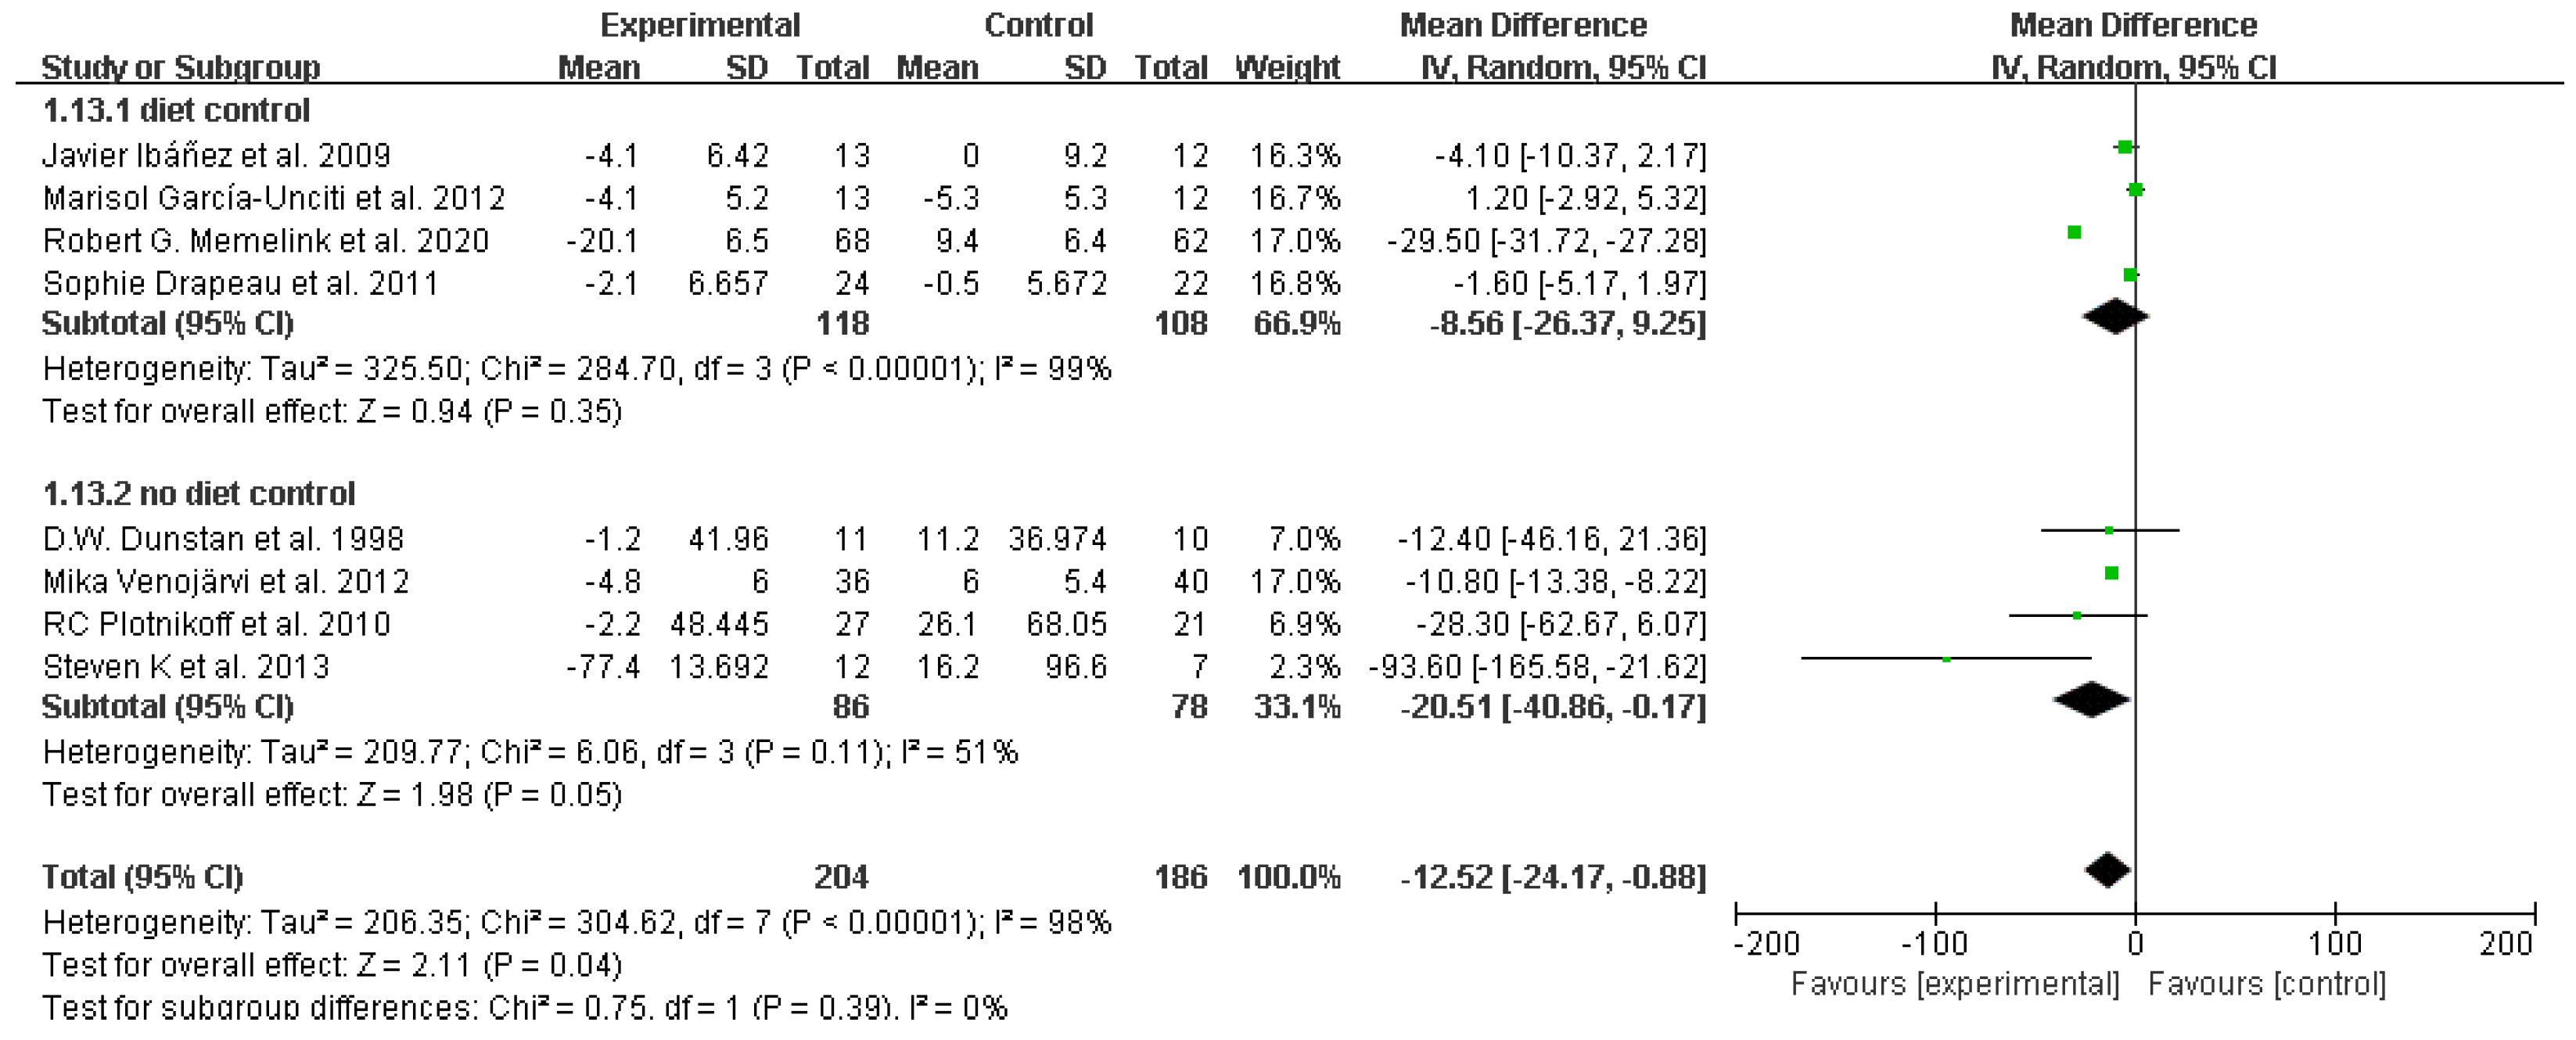
Table 1.
PICOS criteria for the inclusion of studies in the systematic review.
| Parameter | Inclusion Criteria |
|---|---|
| Population | Adults with overweight and obesity |
| Intervention | Resistance training |
| Comparators | No additional physical exercise |
| Outcomes | Waist circumference, systolic blood pressure, diastolic blood pressure, mean arterial pressure, variables related to glucose metabolism and lipids, including glycated hemoglobin, fasting glucose, balance model assessment of insulin resistance (HOMA-IR), total cholesterol (TC), triglycerides (TG), HDL cholesterol, LDL cholesterol, fasting insulin |
| Study design | All randomized controlled trials |
Table 2.
Search strategies for PubMed.
| #1 resistance training [Mesh] |
| #2 training, resistance OR strength training OR training, strength OR weight-lifting OR strengthening program OR strengthening program OR weight-lifting OR strengthening programs OR weight-lifting OR weight lifting strengthening program OR weight-lifting strengthening programs OR weight-lifting exercise program OR exercise program OR exercise programs OR weight lifting exercise program OR weight-lifting exercise programs OR weight-bearing strengthening program OR strengthening program OR weight-bearing OR strengthening programs OR weight-bearing OR weight bearing strengthening program OR weight-bearing strengthening programs OR weight-bearing exercise program OR exercise program OR weight-bearing OR exercise programs OR weight-bearing OR weight-bearing exercise program OR weight-bearing exercise programs |
| #3 #1 OR #2 |
| #4 obesity [Mesh] |
| #5 appetite depressants OR body weight OR diet, reducing OR skinfold thickness OR lipectomy OR anti-obesity agents OR bariatrics |
| #6 #4 OR #5 |
| #7 overweight [Mesh] |
| #8 glucose metabolism disorders [Mesh] |
| #9 disorder, glucose metabolism OR disorders, glucose metabolism OR metabolism disorder, glucose OR metabolism disorders, glucose OR glucose metabolic disorders OR glucose metabolic disorders OR disorder, glucose metabolic OR disorders, glucose metabolic OR metabolic disorder, glucose OR metabolic disorders, glucose OR glucose metabolism disorder OR glucose metabolic disorder |
| #10 #8 OR #9 |
| #11 Lipid metabolism [Mesh] |
| #12 Metabolism, lipid OR lipid metabolism disorder OR metabolism disorder, lipid OR metabolism disorders, lipid |
| #13 #11 OR #12 |
| #14 Glycated hemoglobin OR Fasting plasma glucose OR Homeostatic model assessment-B cell function OR Homeostatic model assessment of insulin resistance OR Triglycerides OR Total-cholesterol OR HDL-cholesterol OR LDL-cholesterol OR insulin |
| #15 randomized controlled trial [Publication Type] |
| #16 randomized OR RCT |
| #17 #15 OR #16 |
| #18 #3 AND #6 AND #10 AND #13 AND #17 |
Disclaimer/Publisher’s Note: The statements, opinions and data contained in all publications are solely those of the individual author(s) and contributor(s) and not of MDPI and/or the editor(s). MDPI and/or the editor(s) disclaim responsibility for any injury to people or property resulting from any ideas, methods, instructions or products referred to in the content. |
© 2024 by the authors. Licensee MDPI, Basel, Switzerland. This article is an open access article distributed under the terms and conditions of the Creative Commons Attribution (CC BY) license (http://creativecommons.org/licenses/by/4.0/).
Copyright: This open access article is published under a Creative Commons CC BY 4.0 license, which permit the free download, distribution, and reuse, provided that the author and preprint are cited in any reuse.


