
Submitted:
22 July 2024
Posted:
24 July 2024
You are already at the latest version
Abstract
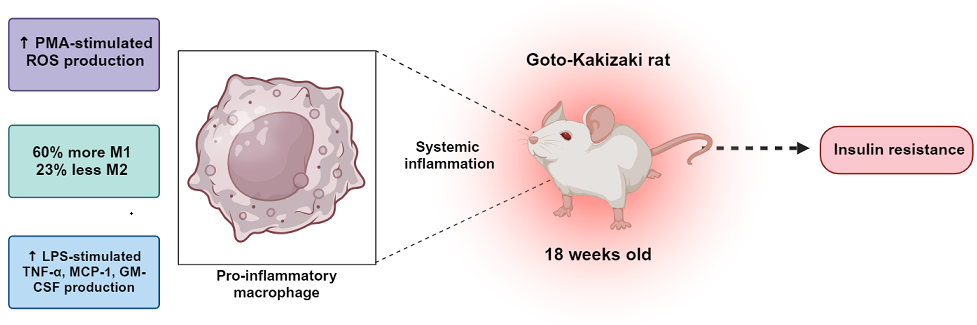
Obesity causes insulin resistance (IR) through systemic low-grade inflammation and can lead to type 2 diabetes mellitus (T2DM). However, the mechanisms that cause IR and T2DM in non-obese individuals are unclear. The Goto-Kakizaki (GK) rat develops IR spontaneously and is a model of non-obese T2DM. These rats exhibit hyperglycemia beginning at weaning and exhibit lower body mass than control Wistar rats. Herein, we tested the hypothesis that macrophages of GK rats are permanently in a pro-inflammatory state, which may be associated with a systemic inflammation condition that mimics the pathogenesis of obesity-induced T2DM. Using eighteen-week-old GK and control Wistar rats, we investigated the proportions of M1 (pro-inflammatory) and M2 (anti-inflammatory) macrophages isolated from the peritoneal cavity. Additionally, the production of inflammatory cytokine and reactive oxygen species (ROS) in cultured macrophages under basal and stimulated conditions was assessed. It was found that phorbol myristate acetate (PMA) stimulation increased GK rat macrophage ROS production by 90-fold compared to basal levels. This response was also three times more pronounced than in control cells (36-fold). The production of pro-inflammatory cytokines, such as tumor necrosis factor-alpha (TNF-α), tended to be upregulated in cultured macrophages from GK rats under basal conditions. Macrophages from GK rats produced 1.6 times more granulocyte-macrophage colony-stimulating factor (GM-CSF), 1.5 times more monocyte chemoattractant protein-1 (MCP-1) and 3.3 times more TNF-α than control cells when stimulated with lipopolysaccharide (LPS) (p = 0.0033; p = 0.049; p = 0.002, respectively). Moreover, compared to control cells, GK rats had 60% more M1 (p = 0.0008) and 23% less M2 (p = 0.038) macrophages. This study is the first to report macrophage inflammatory reprogramming towards a pro-inflammatory state in GK rats.
Keywords:
type 2 diabetes mellitus
; insulin resistance
; inflammation
; GK
; GM-CSF
; M1
; M2
; TNF-α
1. Introduction
In 2021, diabetes mellitus (DM) was diagnosed in 537 million people, corresponding to 10.5% of the world's adult population [1]. Type 2 DM (T2DM) accounts for over 90% of these cases and results from insulin resistance (IR) in peripheral tissues or decreased insulin secretion due to dysfunction in pancreatic β-cells [1]. Additionally, T2DM has been associated with increased plasma free fatty acid (FFA) concentrations, a common characteristic of obesity. The FFAs promote IR by activating protein kinases such as IκB-β (IKKβ), which subsequently phosphorylate insulin receptor substrates (IRS, especially IRS1 and IRS2) in serine residues, instead of tyrosines [2,3,4,5,6]. The activation of IKKβ also promotes the expression of pro-inflammatory genes, such as tumor necrosis factor-alpha (TNF-α) and interleukins (ILs) IL-6 and IL-1β, that activate protein kinases (IKKβ, JNK1 or MAPK8, and p38 MAPK) and cytokine signaling suppressors (SOCS), consequently inhibiting the insulin signaling cascade [2,3,4,7]. Furthermore, the large number of macrophages that infiltrate the white adipose tissue (WAT) of obese individuals contributes to increased plasma levels of pro-inflammatory cytokines [8,9].
However, besides obesity, other factors, including mitochondrial dysfunction, endoplasmic reticulum stress, oxidative and nitrative stress, aging, and systemic inflammation conditions, can lead to IR and, ultimately, the development of TD2M [2,3,10,11]. In Japan, 60% of the individuals with T2DM have a body mass index (BMI) lower than 25 kg/m [2,12,13]. Moreover, Chan et al. (2009) [14] associated the predisposition of non-obese Japanese to T2DM with high abdominal and visceral adiposity and lower muscle mass compared to the Western population.
To study the onset and development of T2DM without the complicating factors associated with obesity the Goto-Kakizaki (GK) rat model has been utilized. This spontaneous model of non-obese T2DM was obtained by breeding glucose-intolerant Wistar rats [15]. Previous studies have shown that GK rats have about 50% fewer pancreatic β cells and exhibit glucose intolerance and hyperglycemia associated with low body mass since weaning [16,17,18,19,20]. Notably, these animals do not have elevated plasma FFA, total cholesterol, or LDL concentrations, indicating that the IR observed in GK rats is not due to augmented circulating FFAs. Indeed, Tranæs et al. (2021) [21] reported that IR in the Asian population is independent of the plasma lipid and lipoprotein levels, confirming previous findings [22].
Systemic inflammation has been reported in GK rats from the neonatal stage to 5 months of age [17,19]. The increased expression of genes induced by interferons (Ifit1 and Iigp1) is associated with chronic inflammation in the WAT and liver of these animals [19]. Additionally, Mongkolpathumrat et al. (2019) measured the gene expression (mRNA) of IL-6, TNF-α, and IL-1β in several organs and cytokine levels in the serum of four-month-old GK rats [23]. The authors reported increased IL-6 and IL-1β expression and production in the liver, IL-6 production in the kidney, IL-6 and TNF-α production and IL-1β expression in the brain, and elevated serum TNF-α levels. In addition, previous studies from our group demonstrated upregulated IL-1β concentrations in the duodenum and jejunum and NF-κB p65 concentrations in the duodenum, jejunum and ileum [24]. As part of the systemic inflammatory feature, macrophage infiltration has been reported in various tissues such as pancreatic islets, kidneys, intestine, and retina by several research groups [10,25,26,27,28,29,30,31].
Macrophages are tissue-resident innate immune cells capable of reprogramming their metabolism to promote inflammation. The M2 (anti-inflammatory) type is the default programming macrophage. M2 macrophages exhibit high activities of oxidative phosphorylation, fatty acid oxidation pathways, and glutaminolysis. These cells play a key role in inflammation resolution and tissue repair by producing cell growth factors such as transforming growth factor beta (TGF-β) and anti-inflammatory cytokines such as IL-10 [32]. Polarization to the M1 type (pro-inflammatory) can occur by molecular patterns associated with pathogens (PAMPs) stimulus, such as lipopolysaccharides (LPS); molecular patterns associated with tissue damage (DAMPs); interferon gamma (IFN-γ), secreted mainly by T helper 1 lymphocytes (Th-1) and TNF-α. M1 cells produce reactive oxygen (ROS) and nitrogen (RNS) species and pro-inflammatory cytokines, such as TNF-α, IL-1β, IL-6, IL-12 and IL-23. These macrophages display augmented glycolytic and pentose pathway activities [32,33,34,35].
In the present study, we hypothesized that macrophages from GK rats are in a permanently pro-inflammatory state and play a vital role in the systemic low-grade inflammation state that induces IR without obesity. Towards this goal, we measured the proportions of M1 and M2 macrophages from the peritoneal cavity of GK and control rats, the production of pro- and anti-inflammatory cytokines (such as IL-1α, TNF-α and IL-6) and stimulating and chemoattractant factors (CXCL-1, MCP-1 and GM-CSF) in the presence or absence of LPS, and ROS production in the presence and absence of PMA. The obtained results provide novel insights into the contribution of macrophages to the pro-inflammatory state of GK rats and their role in the onset and development of IR under non-obese conditions.
2. Results
2.1. Characterization of Non-Obese Diabetic Feature
The animals' body mass and food intake were recorded weekly to confirm the non-obese diabetic state of GK rats in our colony. The nasal–anal length was measured at eighteen weeks of age on the day of euthanasia after the animals were anesthetized. The GK rats had a smaller body mass (Figure 1A) and were 14% shorter in length (Figure 1B). The GK rats also exhibited lower daily food intake (Figure 1C). However, when normalizing their food intake for the animal's body mass, the values were similar (Figure 1D).
The animals' blood glucose levels were measured at 21, 60, and 120 days of age (Table S3). The animals were fasted for 12 hours, and the blood glucose levels were measured. We observed that fasting glycemia in GK rats is greater than in the WT group, indicating diabetes since weaning (Table 1).
2.2. Proportions of M1 and M2 Macrophage Phenotypes in the Peritoneal Cavity
Peritoneal macrophages were obtained from eighteen-week-old rats, as described in the Materials and Methods. The representative dot plots from flow cytometry are presented in the supplementary material (Table S4). We considered CD68+ CD86+ cells M1 macrophages, and CD68+ CD163+ cells as M2 (Figure S1). Macrophages corresponded to 26% of the total peritoneal cavity isolated cells in Wistar and 23% in GK rats. The predominant type in the peritoneum of both groups of animals is M2 (Figure 2A,B). However, GK rats have 60% more M1 and 23% less M2 macrophages compared to the Wistar control group (Figure 2C,D).
2.3. Production of Reactive Oxygen Species by Isolated Macrophages
The obtained macrophages from eighteen-week-old rats were submitted to chemiluminescence analyses, as described in the Materials and Methods. This approach allowed us to evaluate each group's response to the stimulus by the ratio between the means of the PMA/basal results that were significant. It was found that ROS production increased by 90 times in macrophages from GK rats and 36 times in those from Wistar control rats (Table 2), highlighting the effectiveness of the methodology and the differences in ROS production between the two rat strains.
2.4. Cytokine Concentration in Cultured Peritoneal Macrophage Supernatant
The assays were performed with the supernatant of macrophages isolated from the peritoneum cavity and cultured in the presence and absence of LPS (Table 3). GM-CSF, IFN-γ, IL-12p70, IL-17A and IL-1β were detected only in LPS-stimulated macrophages. The GK LPS-stimulated macrophages produced 1.6 times more GM-CSF, 1.5 times more MCP-1 and 3.3 times more TNF-α compared to WT LPS-stimulated macrophages (Table 3). Additionally, there was a clear trend towards greater production of MCP-1, IL-1α and TNF-α, under basal conditions, in macrophages from GK animals compared with controls (Table 3).
3. Discussion
Our initial characterization of this model demonstrated that GK animals exhibit a lower body mass compared to the Wistar control group from weaning until eighteen weeks of age. This distinct feature has been previously linked to smaller growth in length [20]. Our research group has confirmed this by observing a smaller nasal–anal length in GK rats, a finding also reported by others [18,24,36,37].
The normalized food intake by the animal's body mass was similar between groups. Hyperphagia was reported in GK rats [38] and was attributed to lower appetite suppressing the activity of pro-opiomelanocortin (POMC) neurons impaired by hyperglycemia during the weaning period [39,40]. Herein, we reported high food intake by GK rats at weaning and around two months of age (seven weeks). Xue et al. (2011) and Kuwabara et al. (2017) reported higher food intake relative to body mass in GK rats from two months to eighteen weeks.
Throughout the entire experimental period (21 days to 18 weeks old), GK rats presented low body mass, which could be due to impaired differentiation of pre-adipocytes into mature adipocytes, making it difficult to store fat in the WAT [19]. Although we did not evaluate the fat deposits, Pereira et al. (2021) reported that GK rats have reduced epididymal, retroperitoneal, and mesenteric adipose tissue mass weight. Regarding glycemia, GK rats exhibited fasting hyperglycemia and glucose intolerance since weaning, which is in agreement with Portha et al. (2012) and Ando et al. (2018). This glucose intolerance is observed in 3- and 18-week-old GK rats, as reported by our group [18,24,36,37,41] and others [42,43,44].
The predominant macrophage phenotype in the peritoneum of Wistar and GK rats is M2. This result was expected since this is the standard programming of resident macrophages 32. However, GK rats have more M1 and less M2 compared to Wistar controls, thus demonstrating macrophage signalization reprogramming. The increased production of GM-CSF, MPC-1 and TNF-α under stimuli further indicates this reprogramming towards a pro-inflammatory macrophage phenotype.
GK rats have a high infiltration of macrophages in tissues that modulate the microenvironment to an inflammatory state, such as pancreatic islets and retina. Hachana et al. (2020) observed a subretinal infiltration of activated macrophages accompanied by gliosis reactivity, leading to the inflammatory process in the retinas of seven-month-old GK rats. This macrophage-related inflammatory condition has also been reported by Zhang et al. (2014) in the bone marrow-derived macrophages of GK rats, which presented higher levels of IRAK4, IkBa, p-p38 and HuR and higher production of IL-6 under LPS stimulation [45].
GK rats also present higher production and expression of MCP-1, as reported by Homo-Delarche et al. (2006) and Matafome et al. (2012) in 1- and 18-week-old rats, respectively [25,46]. Homo-Delarche reported a high expression of MCP-1 and TNF-α in pancreatic islets, alongside a macrophage infiltration, and Matafome et al. observed high levels of MCP-1 in the fibrotic and glycated regions of epididymal adipose tissue of GK rats, the same areas where macrophage infiltration was detected.
In addition, the greater production of GM-CSF, MCP-1 and TNF-α following LPS stimulation may be responsible for the higher M1 phenotype in GK rats since these factors are known for their immunomodulatory capacities [47]. For example, the production of GM-CSF upregulates the expression of interferon regulatory factor 4 (IRF4), which supports macrophage polarization into a pro-inflammatory profile, and cytokines such as TNF-α, MCP-1 and IL-6 activate and assist in the proliferation of lymphoid cells during inflammatory responses [48,49,50].
Hyperglycemia also plays a direct role in macrophage polarization towards the M1 phenotype through the formation of advanced glycation end products that contribute to a greater expression and production of pro-inflammatory cytokines (e.g., TNF-α) [51,52].
Our results reveal that GK rat macrophages exhibit a pro-inflammatory profile, evidenced by the higher percentage of M1 and lower M2 macrophages, higher production of GM-CSF, MCP-1 and TNF-α upon stimulation, and a trend towards greater production of TNF-α, MCP-1 and IL-α under basal conditions compared to the control. Thus, these data suggest that macrophages play a central role in establishing the systemic inflammation that leads to IR and diabetes in GK rats.
It is important to highlight that the literature has not provided information about the physiology of GK peritoneal macrophages until now, which reinforces the relevance of the results found in this study. In this sense, the present work contributes to a better understanding of the physiology of peritoneal macrophages from GK rats and the role of these cells in IR, providing valuable insights into measures for treating individuals with T2DM.
4. Materials and Methods
4.1. Animals
Male Wistar and Goto-Kakizaki (GK) rats obtained from the Charles River Laboratories (California, United States) were housed in the Interdisciplinary Post-graduate Program in Health Sciences animal facility at Cruzeiro do Sul University, São Paulo, Brazil. The temperature of the room was 23 ± 2 ºC, 50 ± 10% humidity, with a light/dark cycle of 12 hours. Age-matched animals had ad libitum access to water and standard rodent chow (Nuvilab®-Quimtia, Colombo, PR, Brazil). Weight and food intake were monitored from weaning (21 days) to 18 weeks of age. Nasal–anal length and macrophage assessments were recorded at 18 weeks of age. The Animal Ethical Committee at the Cruzeiro do Sul University (024-2017) approved the experimental procedures.
4.2. Body Mass and Food Intake Measurement
Three animals from the same group were kept per cage, totaling nine Wistar and nine GK rats. The body mass of each animal, the weight of the food offered, and the amount of food remaining were measured twice a week on an electronic scale, from weaning to euthanasia (21 days to 18 weeks of age). At the end of each week, the mean body mass and the standard error of the mean (SEM) for each group were calculated (in grams) to determine the weekly body mass.
The daily food intake per animal (g/day) was estimated by measuring the difference between the food weight offered and the remaining food in the cage. This value was then divided by 7 (seven days a week) and by 3 (three animals per cage) to provide a comprehensive average for each group. The daily food intake relative to body mass (mg/day/g) was calculated by the ratio between the weekly daily food intake and the body mass measured of each animal, with the results presented as mean and SEM (Table S1).
4.3. Nasal–Anal Length Measurement and Euthanasia
At 18 weeks of age, we anesthetized the rats with an intramuscular injection of ketamine (75 mg/kg) and xylazine (10 mg/kg) [53]. Nasal–anal length was measured in the anesthetized rats using a tape measure (Table S2), and euthanasia was performed by decapitation using a guillotine.
4.4. Macrophage Isolation from Peritoneal Washing
Macrophages were obtained by washing the peritoneal cavity without any prior stimulus, which would affect the cells' metabolism, function, and phenotype [54].
We injected into the peritoneum 40 mL sterile, ice-cold Roswell Park Memorial Institute (RPMI)-1640 culture medium supplemented with L-glutamine (2 mM), sodium bicarbonate (24 mM), HEPES (22 mM), fetal bovine serum (FBS; 10%), penicillin (100 IU/mL), and streptomycin (100 μg/mL) (Sigma-Aldrich, St. Louis, MI, USA). The peritoneum was massaged to displace cells attached to the serosa and peritoneal membranes into the culture medium, with the same number of massages (20 times) applied to all animals. We collected the peritoneal medium containing cells using a sterile Pasteur pipette. The cell suspension was centrifuged at 400× g for 10 min at 4 °C.
Following the centrifugation and discarding of the supernatant, the red blood cells were then lysed with 5 mL of a lysis solution [150 mM ammonium chloride, 10 mM sodium bicarbonate and 0.1 mM ethylenediaminetetraacetic acid (EDTA)]. After another centrifugation and discarding of the supernatant, the cells were resuspended in 1 mL of RPMI-1640 culture medium, and an aliquot was removed for cell counting and cell viability determinations [55,56].
4.5. Cell Viability Assay
An aliquot of cells from a 1 mL suspension of peritoneal lavage was diluted 50 times in an aqueous solution of 0.1% trypan blue (Sigma-Aldrich) and counted in a hemocytometer (Neubauer chamber) on a Nikon Eclipse TS100 inverted microscope (Minato, Tokyo, Japan). Blue-stained cells were considered dead [57]. We calculated the cellular yield in 1 mL and the percentage of viable cells.
4.6. Macrophage Culture
Macrophages were cultured (1 × 10⁶ peritoneal lavage cells/well) in 24-well plates, which were maintained in an incubator (Sanyo MCO-17AC, Osaka, Japan) at 37 ºC and 5% of CO2 for 2 hours. After this period, the culture medium was discarded. The adhered macrophages were washed with 500 μL sterile and heated phosphate-buffered saline (PBS, 137 mM sodium chloride, 2.7 mM potassium chloride, 8.1 mM anhydrous dibasic sodium phosphate, and 1.5 mM anhydrous monobasic potassium phosphate) to remove other cell types, such as B and T lymphocytes [56]. We added 1 mL RPMI-1640 medium with or without 500 ng/mL LPS (Escherichia coli O111:B4, Sigma-Aldrich) in each well, six wells per animal, three with and three without LPS stimuli. Cells were kept in culture for 6 hours, and then the supernatant was collected [58].
4.7. Cytokine Concentration in Cultured Macrophage Medium
The supernatant samples, collected as described above, were stored at −80 ºC until measuring the cytokine concentration by flow cytometry using the LEGENDplex™ Rat Inflammation Panel (BioLegend®, San Diego, CA, USA). This assay allows the determination of 13 cytokines simultaneously, namely: IL-1β, IL-6, IL-10, IL-18, IL-1α, IL-12p70, IL-17A, IL-33, TNF-α, IFN-γ, ligand C-X-C family chemokine 1 or keratinocyte-derived chemokine (CXCL1/KC), C-C family chemokine 2 ligand or monocyte chemoattractant protein 1 (CCL2/MCP-1), and granulocyte-macrophage colony-stimulating factor (GM-CSF). A 1:4 serial curve was prepared with eight points using the kit's standard reagent. Samples were diluted 4× in assay buffer. In a 96-well plate (V-shaped bottom), 12.5 μL LEGENDplex™ Matrix C were added to the wells previously defined for the curve preparation, and 12.5 μL assay buffer was added to the wells corresponding to the samples. The standards and samples were added to the corresponding wells, and 12.5 μL premixed beads reagent, previously vortexed, were added to all wells. The plate was sealed, wrapped in aluminum foil and stirred at approximately 800 rpm for 2 hours at room temperature.
After a well-timed incubation, the plates were centrifuged at 250× g at room temperature, and the supernatant was removed using a multichannel pipette. For the washing, 100 μL washing buffer were added, and after 1 minute under shaking, the plate was centrifuged and the supernatant removed as described above. The detection antibody (in 12.5 μL) was added, and the plate was sealed and shaken for 1 hour at room temperature. After agitation, 12.5 μL LEGENDplex™ SA-PE were added, and the plate was sealed again and agitated for 30 minutes at room temperature. After this period, the plate was centrifuged and washed, and the beads were resuspended in 120 μL washing buffer. Data were acquired on a BD Accuri™ C6 Plus Flow Cytometer (BD Biosciences, San Jose, California, United States) at slow flow; 4000 events were recorded per sample. The analysis of the data was performed using LEGENDplex™ online software.
4.8. Proportion of M1 and M2 Macrophages
Cells from the peritoneal cavity washing were processed, and 2 × 10⁶ cells were centrifuged at 250× g for 10 minutes at room temperature and thoroughly resuspended with 1 mL of cold BD Cytofix™ Fixation Buffer (BD Biosciences, San Jose, CA, USA). Afterward, cells were washed twice at room temperature in stain buffer (FBS) and centrifuged at 250× g for 10 minutes at room temperature. Cells were stored in 90% FBS / 10% DMSO at -80 °C
The proportion of M1 and M2 macrophages was determined by flow cytometry using the following monoclonal antibodies conjugated to fluorophores: for total macrophages Alexa Fluor® 647 anti-CD68 (1:20, Bio-Rad, Hercules, CA, USA); for M1 Phycoerythrin anti-CD86 (1:50, BD Biosciences); for M2 Fluorescein isothiocyanate anti-CD163 (1:20, Bio-Rad) 59. After defrosting, the cells were stained with anti-CD86 and anti-CD163 surface antibodies, permeabilized with Perm/Wash™ buffer (BD Biosciences) and incubated with the anti-CD68 intracellular antibody for 30 minutes at room temperature. Isotype controls for each fluorochrome were used. Twenty thousand events were acquired. Dot plots were analyzed using the BD-Accuri software (BD Biosciences).
4.9. Production of Reactive Oxygen Species (ROS) by Cultured Peritoneal Macrophages
In a 96-well plate, 1 × 10⁶ cells were placed per well in PBS and treated with 1 mM luminol (Sigma-Aldrich) in the presence or absence of phorbol myristate acetate (PMA, 50 ng/mL, Sigma-Aldrich) and 30 μL final volume. The reading was performed on a FLUOstar® Omega luminometer (BMG Labtech, Ortenberg, Baden-Württemberg, Germany) immediately after the PMA addition and monitored for 30 minutes 60.
4.10. Statistical Analysis
All statistical analyses were performed using GraphPad Prism 8.0.1 software. Before the analyses, the raw data were subjected to outlier identification (ROUT) and normality (Shapiro-Wilk) tests.
Student's t-test was employed for comparing two groups, with Welch's correction applied in cases where sample standard deviations were unequal. When data missed normality assumptions, the Mann-Whitney test was applied.
The Bonferroni post-hoc test was used following two-way ANOVA analysis, and post-hoc Tukey's test was applied after performing repeated measures one-way ANOVA test. A significance level was defined as p < 0.05.
Author Contributions
Conceptualization, Amanda Silveira and Rui Curi; Data curation, Amanda Silveira, Patrícia Quessada, Tiago Lobato, Beatriz Dias, Ana Pereira, Patrícia Iser-Bem and Joice Pereira; Formal analysis, Amanda Silveira, Amara Alves, Gabriela Gimenes, Patrícia Quessada, Tiago Lobato, Beatriz Dias, Elaine Hatanaka, Laureane Masi, Tânia Pithon-Curi, Sandro Hirabara, Amanda Crisma, Renata Gorjão and Rui Curi; Funding acquisition, Tânia Pithon-Curi, Sandro Hirabara, Renata Gorjão and Rui Curi; Investigation, Amanda Silveira and Amanda Crisma; Methodology, Amanda Silveira, Elaine Hatanaka, Laureane Masi, Sandro Hirabara, Amanda Crisma, Renata Gorjão and Rui Curi; Project administration, Rui Curi; Resources, Joice Pereira, Elaine Hatanaka, Laureane Masi, Tânia Pithon-Curi, Vânia Mattaraia, Sandro Hirabara, Renata Gorjão and Rui Curi; Supervision, Laureane Masi, Tânia Pithon-Curi, Sandro Hirabara, Renata Gorjão and Rui Curi; Validation, Laureane Masi, Sandro Hirabara, Renata Gorjão and Rui Curi; Writing – original draft, Amanda Silveira, Amara Alves, Gabriela Gimenes and Rui Curi; Writing – review & editing, Laureane Masi, Tânia Pithon-Curi, Sandro Hirabara, Renata Gorjão and Rui Curi.
Funding
Funding for this project was obtained from the São Paulo State Research Support Foundation (FAPESP: 2018/09868–7), Brazil; the National Research and Development Council (CNPq), Brazil; and the Coordination for the Improvement of Higher Education Personnel (CAPES), Brazil.
Institutional Review Board Statement
The Animal Ethical Committee at the Cruzeiro do Sul University (024-2017) approved the experimental procedures.
Data Availability Statement
The data presented in this study are openly available in Zenodo at 10.5281/zenodo.12786331.
Acknowledgments
We thank Maria Elisabeth Pereira Passos and Renaide Rodrigues Ferreira Gacek for their technical assistance.
Conflicts of Interest
The authors declare that the research was conducted without any commercial or financial relationship that could be interpreted as a potential conflict of interest.
References
- Home, *!!! REPLACE !!!*; Resources, *!!! REPLACE !!!*; diabetes, L. Home; Resources; diabetes, L. with; Acknowledgement; FAQs; Contact; Policy, P. IDF Diabetes Atlas 2021 | IDF Diabetes Atlas, 2024. [Google Scholar]
- DeFronzo, R. A.; Ferrannini, E.; Groop, L.; Henry, R. R.; Herman, W. H.; Holst, J. J.; Hu, F. B.; Kahn, C. R.; Raz, I.; Shulman, G. I.; Simonson, D. C.; Testa, M. A.; Weiss, R. Type 2 Diabetes Mellitus. Nat. Rev. Dis. Primer 2015, 1, 1–22. [Google Scholar] [CrossRef] [PubMed]
- Hirabara, S. M.; Gorjão, R.; Vinolo, M. A.; Rodrigues, A. C.; Nachbar, R. T.; Curi, R. Molecular Targets Related to Inflammation and Insulin Resistance and Potential Interventions. J. Biomed. Biotechnol. 2012, 2012, 379024. [Google Scholar] [CrossRef] [PubMed]
- Kim, J. K. Endothelial Nuclear Factor κB in Obesity and Aging: Is Endothelial Nuclear Factor κB a Master Regulator of Inflammation and Insulin Resistance? Circulation 2012, 125, 1081–1083. [Google Scholar] [CrossRef] [PubMed]
- Rogero, M. M.; Calder, P. C. Obesity, Inflammation, Toll-Like Receptor 4 and Fatty Acids. Nutrients 2018, 10, 432. [Google Scholar] [CrossRef] [PubMed]
- Kuryłowicz, A.; Koźniewski, K. Anti-Inflammatory Strategies Targeting Metaflammation in Type 2 Diabetes. Mol. Basel Switz. 2020, 25, 2224. [Google Scholar] [CrossRef] [PubMed]
- Kwon, H.; Pessin, J. E. Adipokines, Inflammation, and Insulin Resistance in Obesity. In Textbook of Energy Balance, Neuropeptide Hormones, and Neuroendocrine Function; Nillni, E. A., Ed.; Springer International Publishing: Cham, 2018. [Google Scholar] [CrossRef]
- Olefsky, J. M.; Glass, C. K. Macrophages, Inflammation, and Insulin Resistance. Annu. Rev. Physiol. 2010, 72, 219–246. [Google Scholar] [CrossRef] [PubMed]
- Lauterbach, M. A. R.; Wunderlich, F. T. Macrophage Function in Obesity-Induced Inflammation and Insulin Resistance. Pflugers Arch. 2017, 469, 385–396. [Google Scholar] [CrossRef]
- Akash, M. S. H.; Rehman, K.; Chen, S. Role of Inflammatory Mechanisms in Pathogenesis of Type 2 Diabetes Mellitus. J. Cell. Biochem. 2013, 114, 525–531. [Google Scholar] [CrossRef] [PubMed]
- Chen, J.; Hendriks, M.; Chatzis, A.; Ramasamy, S. K.; Kusumbe, A. P. Bone Vasculature and Bone Marrow Vascular Niches in Health and Disease. J. Bone Miner. Res. Off. J. Am. Soc. Bone Miner. Res. 2020, 35, 2103–2120. [Google Scholar] [CrossRef]
- P., B. P., B. The Lean Patient with Type 2 Diabetes: Characteristics and Therapy Challenge. Int. J. Clin. Pract. [CrossRef]
- Kashima, S.; Inoue, K.; Matsumoto, M.; Akimoto, K. Prevalence and Characteristics of Non-Obese Diabetes in Japanese Men and Women: The Yuport Medical Checkup Center Study. J. Diabetes 2015, 7, 523–530. [Google Scholar] [CrossRef]
- Chan, J. C. N.; Malik, V.; Jia, W.; Kadowaki, T.; Yajnik, C. S.; Yoon, K.-H.; Hu, F. B. Diabetes in Asia: Epidemiology, Risk Factors, and Pathophysiology. JAMA 2009, 301, 2129–2140. [Google Scholar] [CrossRef] [PubMed]
- Goto, Y.; Kakizaki, M.; Masaki, N. Spontaneous Diabetes Produced by Selective Breeding of Normal Wistar Rats. Proc. Jpn. Acad. 1975, 51, 80–85. [Google Scholar] [CrossRef]
- Movassat, J.; Saulnier, C.; Serradas, P.; Portha, B. Impaired Development of Pancreatic Beta-Cell Mass Is a Primary Event during the Progression to Diabetes in the GK Rat. Diabetologia 1997, 40, 916–925. [Google Scholar] [CrossRef] [PubMed]
- Portha, B.; Giroix, M.-H.; Tourrel-Cuzin, C.; Le-Stunff, H.; Movassat, J. The GK Rat: A Prototype for the Study of Non-Overweight Type 2 Diabetes. Methods Mol. Biol. Clifton NJ 2012, 933, 125–159. [Google Scholar] [CrossRef]
- Kuwabara, W. M. T.; Panveloski-Costa, A. C.; Yokota, C. N. F.; Pereira, J. N. B.; Filho, J. M.; Torres, R. P.; Hirabara, S. M.; Curi, R.; Alba-Loureiro, T. C. Comparison of Goto-Kakizaki Rats and High Fat Diet-Induced Obese Rats: Are They Reliable Models to Study Type 2 Diabetes Mellitus? PLoS ONE 2017, 12, e0189622. [Google Scholar] [CrossRef] [PubMed]
- Xue, B.; Sukumaran, S.; Nie, J.; Jusko, W. J.; DuBois, D. C.; Almon, R. R. Adipose Tissue Deficiency and Chronic Inflammation in Diabetic Goto-Kakizaki Rats. PLoS ONE 2011, 6, e17386. [Google Scholar] [CrossRef] [PubMed]
- Movassat, J.; Bailbé, D.; Lubrano-Berthelier, C.; Picarel-Blanchot, F.; Bertin, E.; Mourot, J.; Portha, B. Follow-up of GK Rats during Prediabetes Highlights Increased Insulin Action and Fat Deposition despite Low Insulin Secretion. Am. J. Physiol. Endocrinol. Metab. 2008, 294, E168–E175. [Google Scholar] [CrossRef] [PubMed]
- Tranæs, K.; Ding, C.; Chooi, Y. C.; Chan, Z.; Choo, J.; Leow, M. K.-S.; Magkos, F. Dissociation Between Insulin Resistance and Abnormalities in Lipoprotein Particle Concentrations and Sizes in Normal-Weight Chinese Adults. Front. Nutr. 2021, 8, 651199. [Google Scholar] [CrossRef]
- Ding, C.; Chan, Z.; Chooi, Y. C.; Choo, J.; Sadananthan, S. A.; Chang, A.; Sasikala, S.; Michael, N.; Velan, S. S.; Magkos, F. Regulation of Glucose Metabolism in Nondiabetic, Metabolically Obese Normal-Weight Asians. Am. J. Physiol. Endocrinol. Metab. 2018, 314, E494–E502. [Google Scholar] [CrossRef]
- Mongkolpathumrat, P.; Nokkaew, N.; Adulyaritthikul, P.; Kongpol, K.; Sanit, J.; Pankhong, P.; Kumphune, S. Diabetes Induced Internal Organs Inflammation in Non-Obese Type 2 Diabetic Rats. J. Appl. Pharm. Sci. 2019, (3), 041–049. [Google Scholar] [CrossRef]
- Pereira, J. N. B.; Murata, G. M.; Sato, F. T.; Marosti, A. R.; Carvalho, C. R. de O.; Curi, R. Small Intestine Remodeling in Male Goto–Kakizaki Rats. Physiol. Rep. 2021, 9, e14755. [Google Scholar] [CrossRef] [PubMed]
- Homo-Delarche, F.; Calderari, S.; Irminger, J.-C.; Gangnerau, M.-N.; Coulaud, J.; Rickenbach, K.; Dolz, M.; Halban, P.; Portha, B.; Serradas, P. Islet Inflammation and Fibrosis in a Spontaneous Model of Type 2 Diabetes, the GK Rat. Diabetes 2006, 55, 1625–1633. [Google Scholar] [CrossRef] [PubMed]
- Luo, X.; Pan, L.; Nie, A.; Wang, Q.; Gu, Y.; Li, F.; Zhang, H.; Li, W.; Li, X. Liraglutide Protects Pancreatic Beta Cells during an Early Intervention in Gato-Kakizaki Rats. J. Diabetes 2013, 5, 421–428. [Google Scholar] [CrossRef] [PubMed]
- Calderari, S.; Irminger, J.-C.; Giroix, M.-H.; Ehses, J. A.; Gangnerau, M.-N.; Coulaud, J.; Rickenbach, K.; Gauguier, D.; Halban, P.; Serradas, P.; Homo-Delarche, F. Regenerating 1 and 3b Gene Expression in the Pancreas of Type 2 Diabetic Goto-Kakizaki (GK) Rats. PLoS ONE 2014, 9, e90045. [Google Scholar] [CrossRef] [PubMed]
- Cheng, Z. J.; Vaskonen, T.; Tikkanen, I.; Nurminen, K.; Ruskoaho, H.; Vapaatalo, H.; Muller, D.; Park, J. K.; Luft, F. C.; Mervaala, E. M. Endothelial Dysfunction and Salt-Sensitive Hypertension in Spontaneously Diabetic Goto-Kakizaki Rats. Hypertens. Dallas Tex 1979 2001, 37 (2 Pt 2) Pt 2, 433–439. [Google Scholar] [CrossRef]
- Qiao, Z.; Wang, X.; Zhang, H.; Han, J.; Feng, H.; Wu, Z. Single-Cell Transcriptomics Reveals That Metabolites Produced by Paenibacillus Bovis Sp. Nov. BD3526 Ameliorate Type 2 Diabetes in GK Rats by Downregulating the Inflammatory Response. Front. Microbiol. 2020, 11, 568805. [Google Scholar] [CrossRef] [PubMed]
- Omri, S.; Behar-Cohen, F.; Kozak, Y. de; Sennlaub, F.; Verissimo, L. M.; Jonet, L.; Savoldelli, M.; Omri, B.; Crisanti, P. Microglia/Macrophages Migrate through Retinal Epithelium Barrier by a Transcellular Route in Diabetic Retinopathy: Role of PKCζ in the Goto Kakizaki Rat Model. Am. J. Pathol. 2011, 179, 942. [Google Scholar] [CrossRef] [PubMed]
- Hachana, S.; Pouliot, M.; Couture, R.; Vaucher, E. Diabetes-Induced Inflammation and Vascular Alterations in the Goto–Kakizaki Rat Retina. Curr. Eye Res. 2020, 45, 965–974. [Google Scholar] [CrossRef] [PubMed]
- Viola, A.; Munari, F.; Sánchez-Rodríguez, R.; Scolaro, T.; Castegna, A. The Metabolic Signature of Macrophage Responses. Front. Immunol. 2019, 10, 1462. [Google Scholar] [CrossRef]
- Italiani, P.; Töpfer, E.; Boraschi, D. Chapter 7 - Modulation of Macrophage Activation. In Immune Rebalancing; Boraschi, D., Penton-Rol, G., Eds.; Academic Press, 2016; pp 123–149. [CrossRef]
- Murray, P. J. Macrophage Polarization. Annu. Rev. Physiol. 2017, 79, 541–566. [Google Scholar] [CrossRef]
- Curi, R.; de Siqueira Mendes, R.; de Campos Crispin, L. A.; Norata, G. D.; Sampaio, S. C.; Newsholme, P. A Past and Present Overview of Macrophage Metabolism and Functional Outcomes. Clin. Sci. 2017, 131, 1329–1342. [Google Scholar] [CrossRef] [PubMed]
- Serdan, T. D. A.; Masi, L. N.; Pereira, J. N. B.; Rodrigues, L. E.; Alecrim, A. L.; Scervino, M. V. M.; Diniz, V. L. S.; Dos Santos, A. A. C.; Filho, C. P. B. S.; Alba-Loureiro, T. C.; Marzuca-Nassr, G. N.; Bazotte, R. B.; Gorjão, R.; Pithon-Curi, T. C.; Curi, R.; Hirabara, S. M. Impaired Brown Adipose Tissue Is Differentially Modulated in Insulin-Resistant Obese Wistar and Type 2 Diabetic Goto-Kakizaki Rats. Biomed. Pharmacother. Biomedecine Pharmacother. 2021, 142, 112019. [Google Scholar] [CrossRef] [PubMed]
- Borges, J. C. O.; Oliveira, V. a. B.; Serdan, T. D. A.; Silva, F. L. R.; Santos, C. S.; Pauferro, J. R. B.; Ribas, A. S. F.; Manoel, R.; Pereira, A. C. G.; Correa, I. S.; Pereira, J. N. B.; Bazotte, R. B.; Levada-Pires, A. C.; Pithon-Curi, T. C.; Gorjão, R.; Curi, R.; Hirabara, S. M.; Masi, L. N. Brain Glucose Hypometabolism and Hippocampal Inflammation in Goto-Kakizaki Rats. Braz. J. Med. Biol. Res. 2023, 56, e12742. [Google Scholar] [CrossRef] [PubMed]
- Maekawa, F.; Fujiwara, K.; Kohno, D.; Kuramochi, M.; Kurita, H.; Yada, T. Young Adult-Specific Hyperphagia in Diabetic Goto-Kakizaki Rats Is Associated with Leptin Resistance and Elevation of Neuropeptide Y mRNA in the Arcuate Nucleus. J. Neuroendocrinol. 2006, 18, 748–756. [Google Scholar] [CrossRef] [PubMed]
- Ando, A.; Gantulga, D.; Nakata, M.; Maekawa, F.; Dezaki, K.; Ishibashi, S.; Yada, T. Weaning Stage Hyperglycemia Induces Glucose-Insensitivity in Arcuate POMC Neurons and Hyperphagia in Type 2 Diabetic GK Rats. Neuropeptides 2018, 68, 49–56. [Google Scholar] [CrossRef] [PubMed]
- Toda, C.; Santoro, A.; Kim, J. D.; Diano, S. POMC Neurons: From Birth to Death. Annu. Rev. Physiol. 2017, 79, 209–236. [Google Scholar] [CrossRef] [PubMed]
- Panveloski-Costa, A. C.; Kuwabara, W. M. T.; Munhoz, A. C.; Lucena, C. F.; Curi, R.; Carpinelli, A. R.; Nunes, M. T. The Insulin Resistance Is Reversed by Exogenous 3,5,3’triiodothyronine in Type 2 Diabetic Goto-Kakizaki Rats by an Inflammatory-Independent Pathway. Endocrine 2020, 68, 287–295. [Google Scholar] [CrossRef] [PubMed]
- Imai, E.; Shibata, K. Oral Glucose Tolerance and Tryptophan Metabolism in Non-Obese and Non-Insulin-Dependent Diabetic Goto-Kakizaki Rats Fed High-Tryptophan Diets. J. Nutr. Sci. Vitaminol. (Tokyo) 2018, 64, 48–55. [Google Scholar] [CrossRef] [PubMed]
- Szkudelska, K.; Deniziak, M.; Hertig, I.; Wojciechowicz, T.; Tyczewska, M.; Jaroszewska, M.; Szkudelski, T. Effects of Resveratrol in Goto-Kakizaki Rat, a Model of Type 2 Diabetes. Nutrients 2019, 11, 2488. [Google Scholar] [CrossRef]
- Azul, L.; Leandro, A.; Boroumand, P.; Klip, A.; Seiça, R.; Sena, C. M. Increased Inflammation, Oxidative Stress and a Reduction in Antioxidant Defense Enzymes in Perivascular Adipose Tissue Contribute to Vascular Dysfunction in Type 2 Diabetes. Free Radic. Biol. Med. 2020, 146, 264–274. [Google Scholar] [CrossRef]
- Zhang, X.; Wang, Y.; Hu, W.; Li, D.; Zhou, Z.; Pan, D.; Wu, W.; Xu, T. Interleukin-1/Toll-Like Receptor-Induced Nuclear Factor Kappa B Signaling Participates in Intima Hyperplasia after Carotid Artery Balloon Injury in Goto-Kakizaki Rats: A Potential Target Therapy Pathway. PLoS ONE 2014, 9, e103794. [Google Scholar] [CrossRef] [PubMed]
- Matafome, P.; Santos-Silva, D.; Crisóstomo, J.; Rodrigues, T.; Rodrigues, L.; Sena, C. M.; Pereira, P.; Seiça, R. Methylglyoxal Causes Structural and Functional Alterations in Adipose Tissue Independently of Obesity. Arch. Physiol. Biochem. 2012, 118, 58–68. [Google Scholar] [CrossRef] [PubMed]
- Edgar, L.; Akbar, N.; Braithwaite, A. T.; Krausgruber, T.; Gallart-Ayala, H.; Bailey, J.; Corbin, A. L.; Khoyratty, T. E.; Chai, J. T.; Alkhalil, M.; Rendeiro, A. F.; Ziberna, K.; Arya, R.; Cahill, T. J.; Bock, C.; Laurencikiene, J.; Crabtree, M. J.; Lemieux, M. E.; Riksen, N. P.; Netea, M. G.; Wheelock, C. E.; Channon, K. M.; Rydén, M.; Udalova, I. A.; Carnicer, R.; Choudhury, R. P. Hyperglycemia Induces Trained Immunity in Macrophages and Their Precursors and Promotes Atherosclerosis. Circulation 2021, 144, 961–982. [Google Scholar] [CrossRef] [PubMed]
- Lee, K. M. C.; Achuthan, A. A.; Hamilton, J. A. GM-CSF: A Promising Target in Inflammation and Autoimmunity. ImmunoTargets Ther. 2020, 9, 225–240. [Google Scholar] [CrossRef] [PubMed]
- Koncz, G.; Jenei, V.; Tóth, M.; Váradi, E.; Kardos, B.; Bácsi, A.; Mázló, A. Damage-Mediated Macrophage Polarization in Sterile Inflammation. Front. Immunol. 2023, 14, 1169560. [Google Scholar] [CrossRef] [PubMed]
- Li, H.; Meng, Y.; He, S.; Tan, X.; Zhang, Y.; Zhang, X.; Wang, L.; Zheng, W. Macrophages, Chronic Inflammation, and Insulin Resistance. Cells 2022, 11. [Google Scholar] [CrossRef]
- Luo, M.; Zhao, F.; Cheng, H.; Su, M.; Wang, Y. Macrophage Polarization: An Important Role in Inflammatory Diseases. Front. Immunol. 2024, 15, 1352946. [Google Scholar] [CrossRef] [PubMed]
- Wong, A.; Sun, Q.; Latif, I. I.; Karwi, Q. G. Metabolic Flux in Macrophages in Obesity and Type-2 Diabetes. J. Pharm. Pharm. Sci. 2024, 27, 13210. [Google Scholar] [CrossRef]
- Neves, S. M. P.; Filho, J. M.; Menezes, E. W. de. Manual de cuidados e procedimentos com animais de laboratório do biotério de produção e experimentação da FCF-IQ/USP; Portal de Livros Abertos da USP, 2016. [CrossRef]
- Pavlou, S.; Wang, L.; Xu, H.; Chen, M. Higher Phagocytic Activity of Thioglycollate-Elicited Peritoneal Macrophages Is Related to Metabolic Status of the Cells. J. Inflamm. Lond. Engl. 2017, 14, 4. [Google Scholar] [CrossRef]
- Zhang, X.; Goncalves, R.; Mosser, D. M. The Isolation and Characterization of Murine Macrophages. Curr. Protoc. Immunol. Ed. John E Coligan Al. [CrossRef]
- Magdalon, J.; Vinolo, M. A. R.; Rodrigues, H. G.; Paschoal, V. A.; Torres, R. P.; Mancini-Filho, J.; Calder, P. C.; Hatanaka, E.; Curi, R. Oral Administration of Oleic or Linoleic Acids Modulates the Production of Inflammatory Mediators by Rat Macrophages. Lipids 2012, 47, 803–812. [Google Scholar] [CrossRef]
- Johnson, S.; Nguyen, V.; Coder, D. Assessment of Cell Viability. Curr. Protoc. Cytom. 9. [CrossRef]
- Mosser, D. M.; Zhang, X. Activation of Murine Macrophages. Curr. Protoc. Immunol. 14. [CrossRef]
- Liu, R.-H.; Wen, Y.; Sun, H.-Y.; Liu, C.-Y.; Zhang, Y.-F.; Yang, Y.; Huang, Q.-L.; Tang, J.-J.; Huang, C.-C.; Tang, L.-J. Abdominal Paracentesis Drainage Ameliorates Severe Acute Pancreatitis in Rats by Regulating the Polarization of Peritoneal Macrophages. World J. Gastroenterol. 2018, 24, 5131–5143. [Google Scholar] [CrossRef] [PubMed]
- Hatanaka, E.; Levada-Pires, A. C.; Pithon-Curi, T. C.; Curi, R. Systematic Study on ROS Production Induced by Oleic, Linoleic, and γ-Linolenic Acids in Human and Rat Neutrophils. Free Radic. Biol. Med. 2006, 41, 1124–1132. [Google Scholar] [CrossRef] [PubMed]
Figure 1.
Body mass, food intake, and nasal–anal length of Goto-Kakizaki (GK) and Wistar (WT) rats. (A) Weekly evaluation of body mass, (B) nasal–anal length, (C) daily food intake, and (D) daily food intake relative to body mass. Results are presented as the mean ± SEM. The two groups were compared using one-way ANOVA (A, C and D) and Mann–Whitney's test (B) for *p < 0.05. Number of animals used: WT = 7–9 and GK = 9. The individual numbers are in the supplemental data (Table S1).
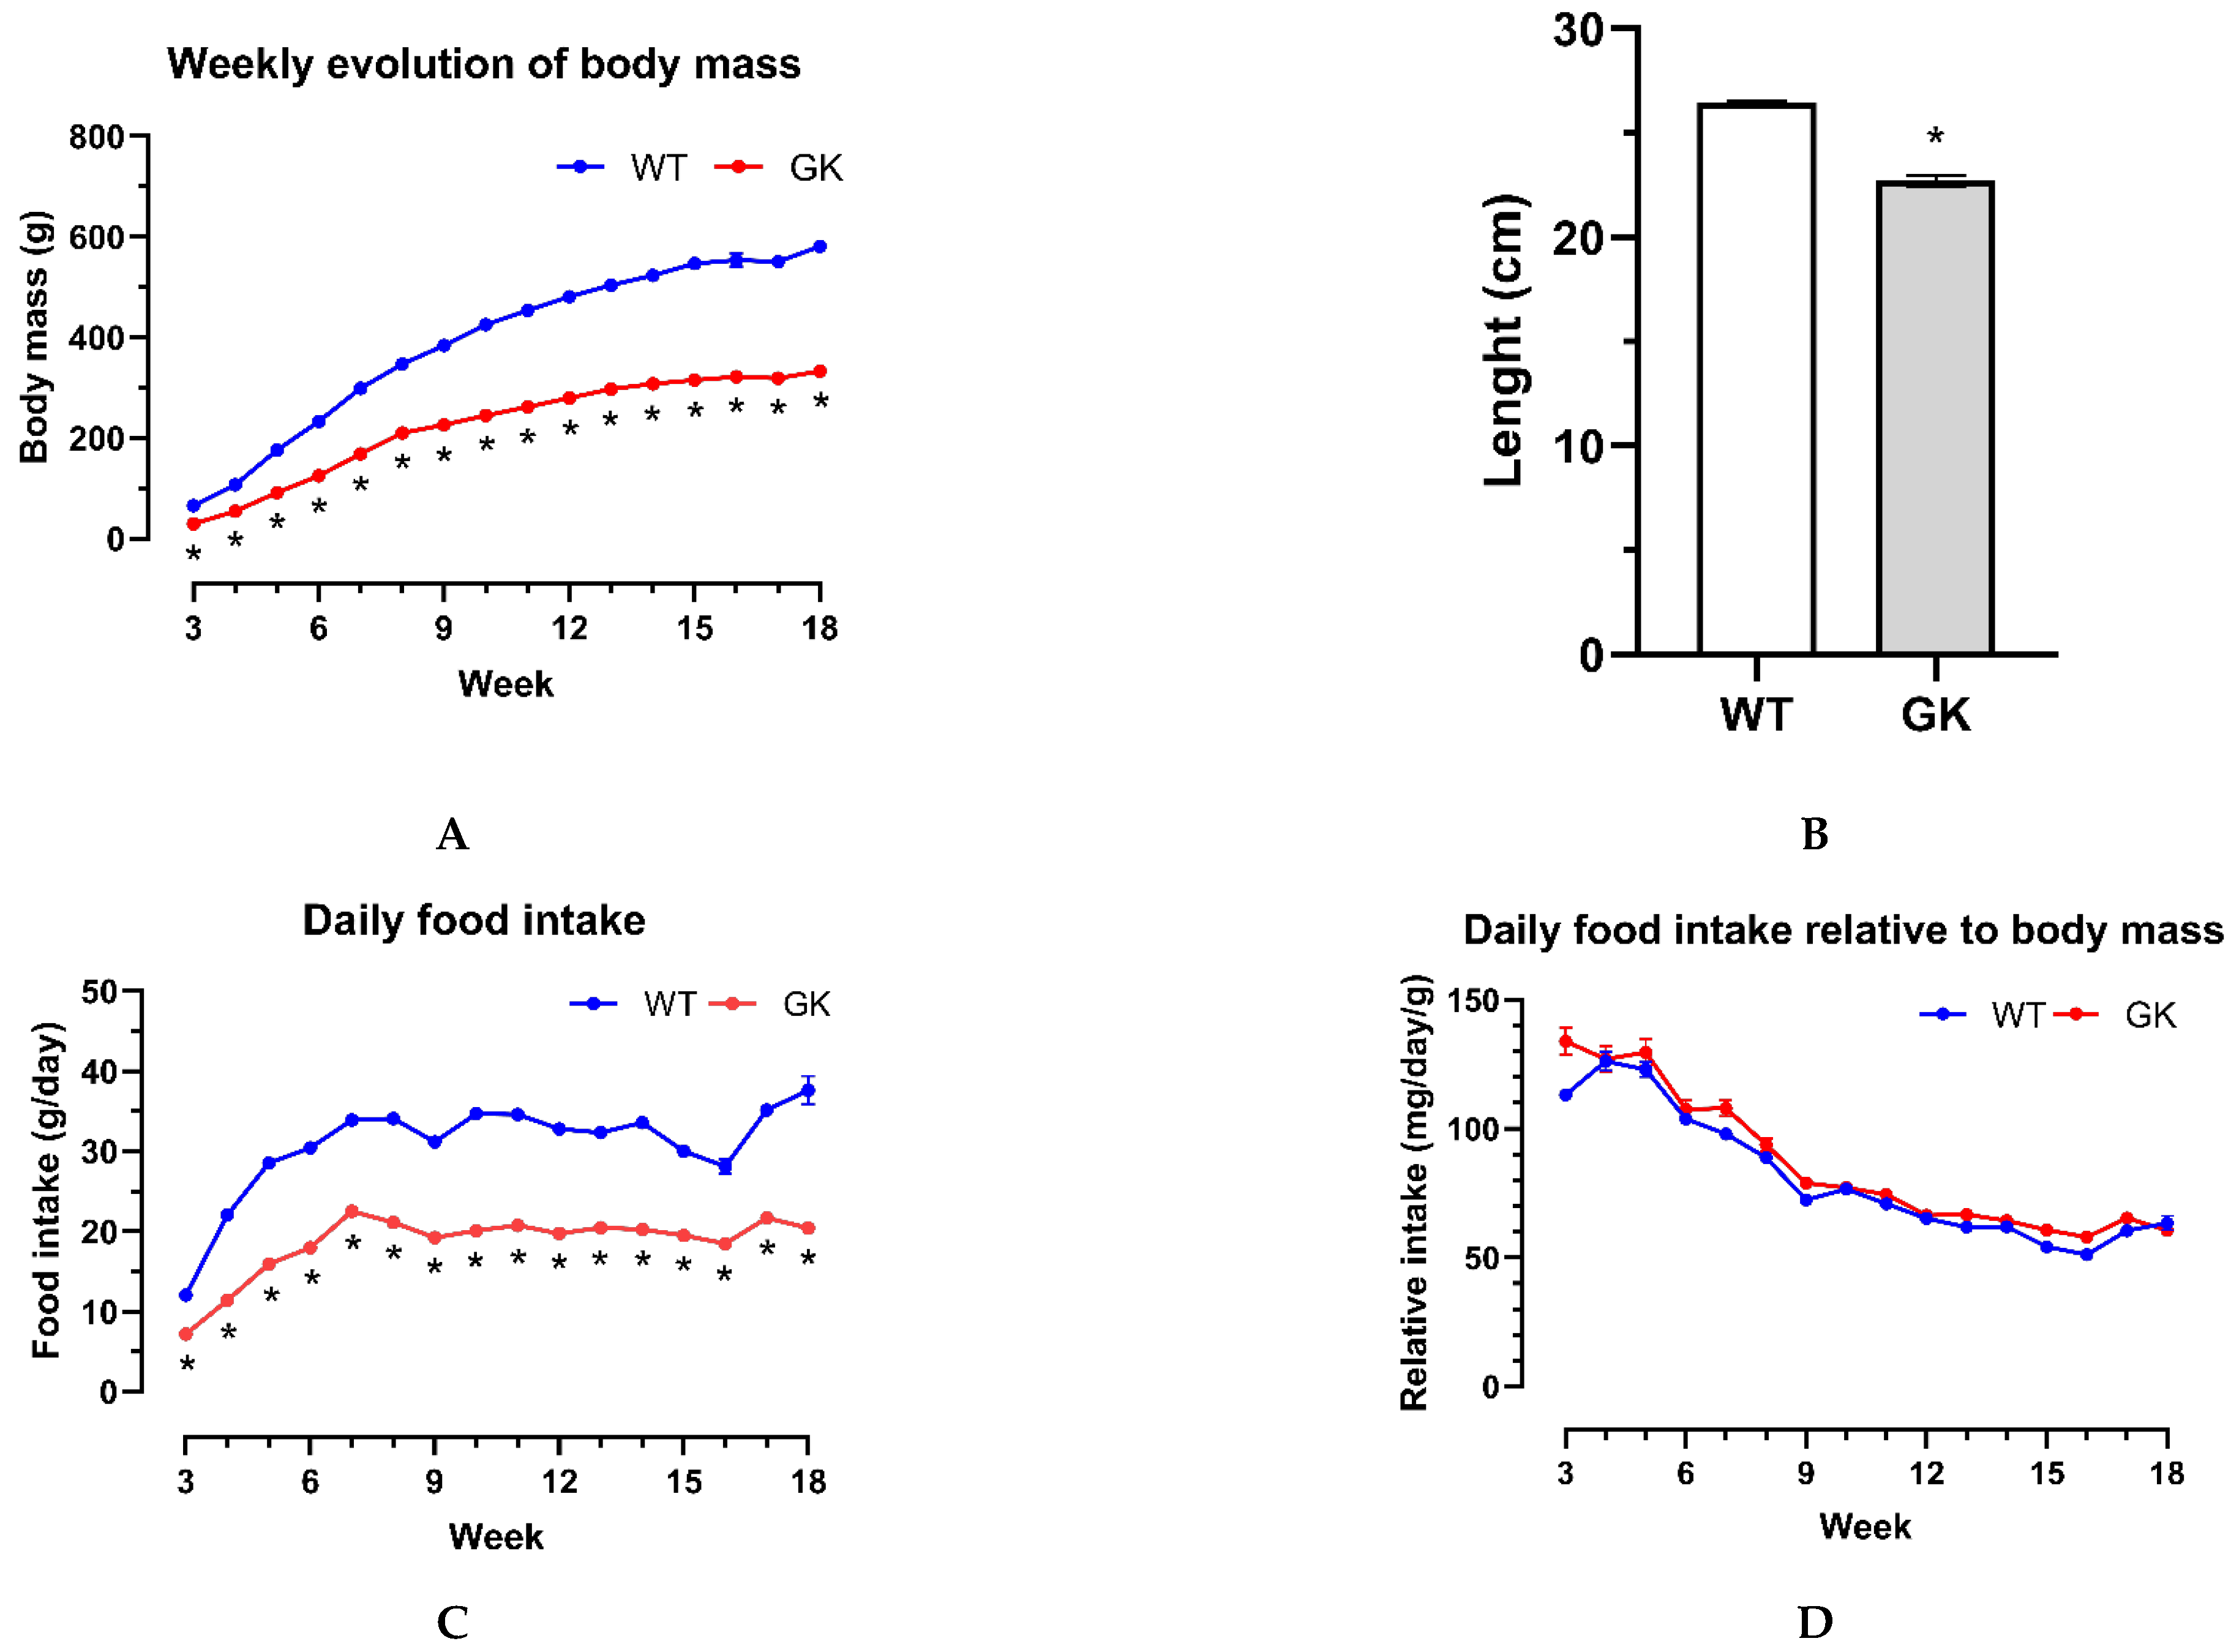
Figure 2.
Percentage of M1 and M2 macrophages in the peritoneal cavity of Wistar (WT) and Goto-Kakizaki (GK) rats. CD68+ = total macrophages; CD68+ CD86+ = M1 macrophages; CD68+ CD163+ = M2 macrophages. Student's t-test was used to compare WT and GK rats (*p < 0.05). Number of animals: WT = 9 and GK = 8. Results are presented as the mean ± SEM. The individual numbers are described in the supplemental data (Table S4).
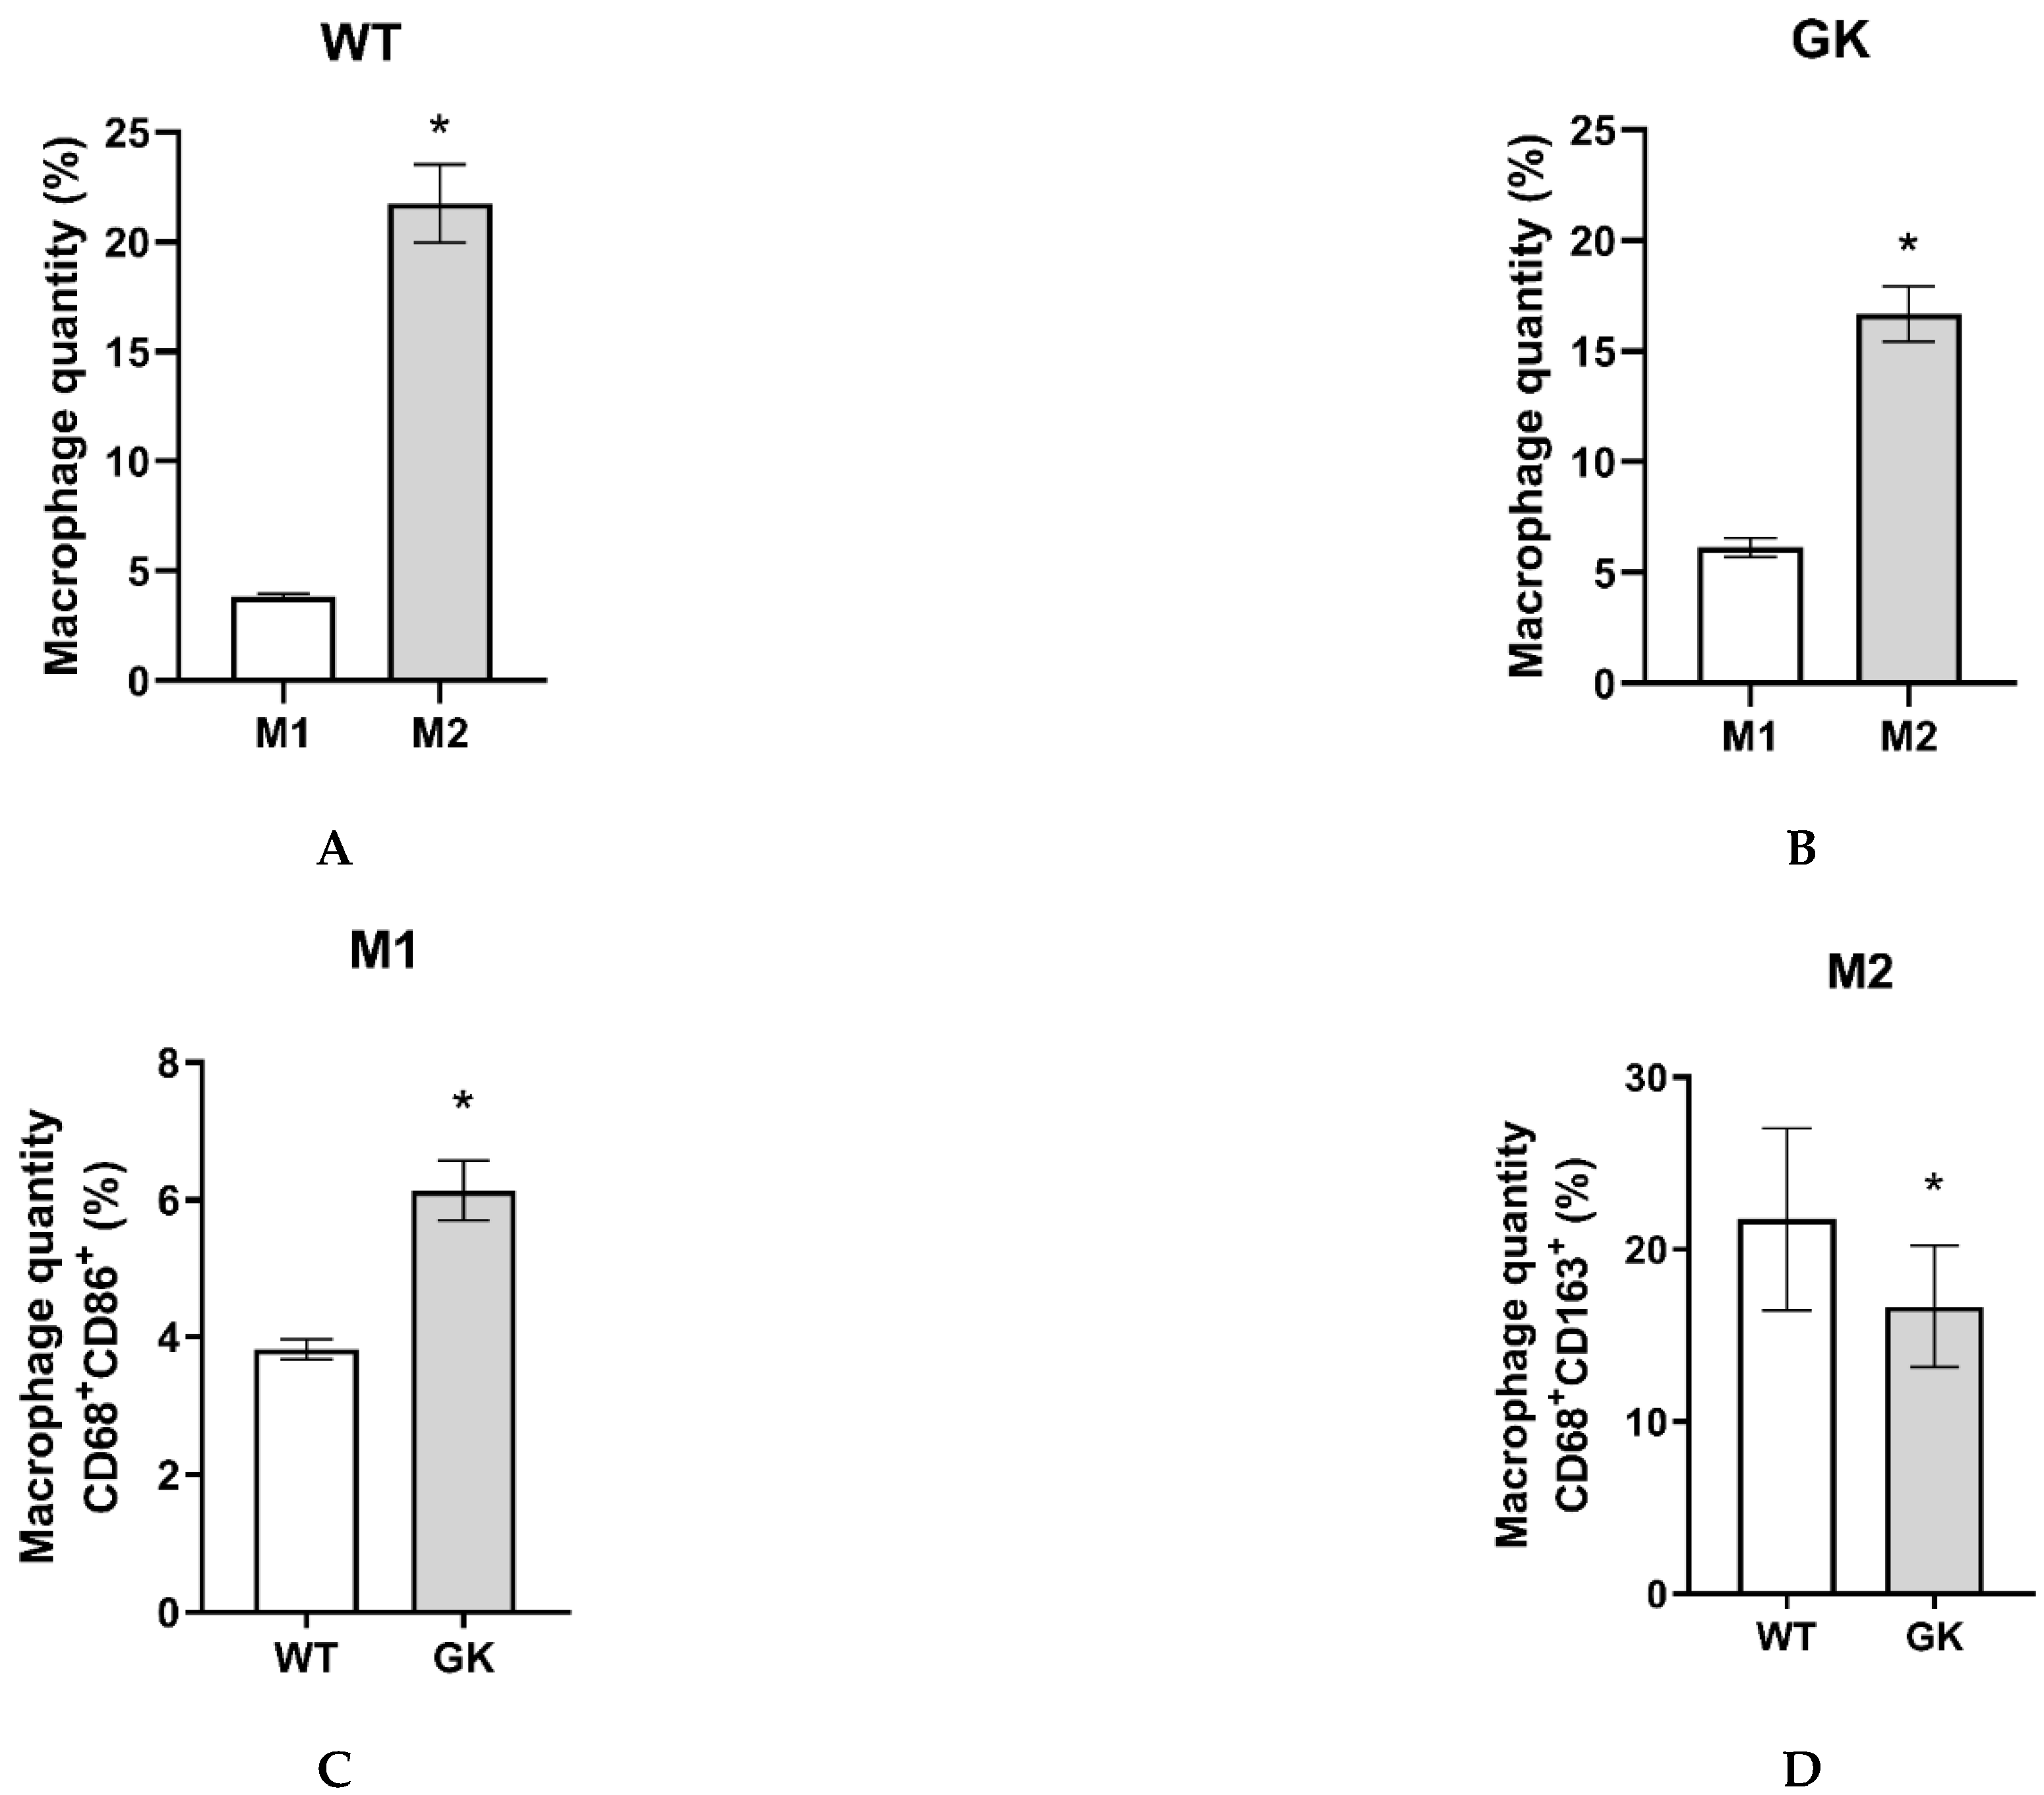
Figure 3.
Indicators for the pro-inflammatory state of macrophage from Goto-Kakizaki rats, as described in this study and by others. Subscripted numbers refer to the cited references.
Figure 3.
Indicators for the pro-inflammatory state of macrophage from Goto-Kakizaki rats, as described in this study and by others. Subscripted numbers refer to the cited references.
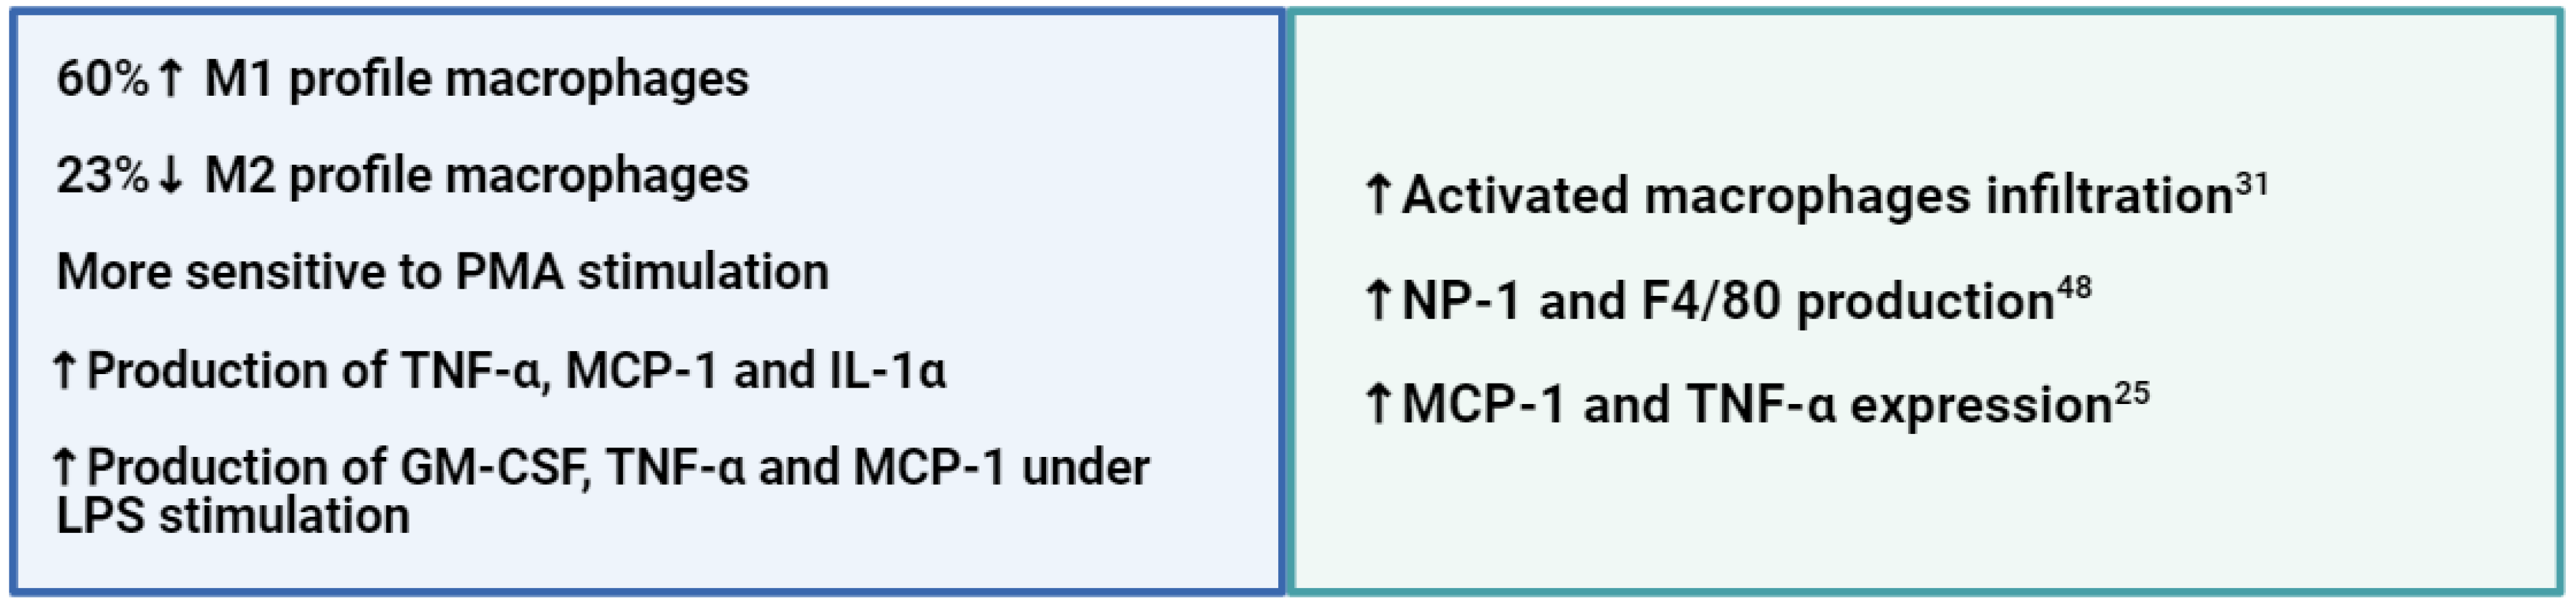

Table 1.
Blood glucose levels of Goto-Kakizaki (GK) and Wistar (WT) rats at weaning, eight and eighteen weeks of age.
Table 1.
Blood glucose levels of Goto-Kakizaki (GK) and Wistar (WT) rats at weaning, eight and eighteen weeks of age.
| Group | Age | Fasting Glucose |
|---|---|---|
| WT | Weaning | 114.4 ± 4.2 |
| Eight weeks old | 89.8 ± 1.6 | |
| Eighteen weeks old | 90.0 ± 3.4 | |
| GK | Weaning | 137.1 ± 4.0* |
| Eight weeks old | 157.6 ± 6.9** | |
| Eighteen weeks old | 130.6 ± 5.1** |
Comparisons between groups were performed using the Student's t-test; *p < 0.05 and **p < 0.0001. Number of animals: WT = 8 and GK = 9 (weaning and eighteen weeks); WT = 4 and GK = 5 (eight weeks). Results are presented as the mean ± SEM. The individual numbers are in the supplemental data (Table S3).
Table 2.
Production of reactive oxygen species by macrophages from Wistar (WT) and Goto-Kakizaki (GK) rats over the course of 30 minutes with and without phorbol myristate acetate (PMA) stimulation.
Table 2.
Production of reactive oxygen species by macrophages from Wistar (WT) and Goto-Kakizaki (GK) rats over the course of 30 minutes with and without phorbol myristate acetate (PMA) stimulation.
| Group | Basal (RU)* | PMA (RU)* | PMA/Basal ratio |
|---|---|---|---|
| WT | 3.6 ± 1.2 | 132.6 ± 32.7 | 36 |
| GK | 0.98 ± 0.18 | 88.3 ± 13.7 | 90 |
*Results are presented as the mean ± SEM. The PMA/Basal ratio indicates the response to PMA compared to the basal condition. Groups were compared using two-way ANOVA. RU= Relative Unit. Number of animals used: WT = 7 and GK = 8. The individual numbers are in the supplemental data (Table S5).
Table 3.
Concentration of cytokines in the supernatant from peritoneal macrophages from Wistar (WT) and Goto-Kakizaki (GK) rats cultured for 6 hours in basal or LPS-stimulated condition.
Table 3.
Concentration of cytokines in the supernatant from peritoneal macrophages from Wistar (WT) and Goto-Kakizaki (GK) rats cultured for 6 hours in basal or LPS-stimulated condition.
| WT | GK | |||
|---|---|---|---|---|
| Cytokine | Mean concentration ± SEM (pg/mL) | Number of animals | Mean concentration ± SEM (pg/mL) | Number of animals |
| Basal conditions | ||||
| MCP-1 | 10,872 ± 2,155 | 8 | 24,136 ± 13,772 | 5 |
| IL-1α | 9.92 ± 1.01 | 5 | 85.0 ± 39.2 | 6 |
| TNF-α | 115 ± 33.9 | 8 | 531 ± 208 | 7 |
| IL-6 | 53.3 ± 6.12 | 8 | 48.1 ± 11.5 | 6 |
| CXCL-1 | 2,516 ± 504 | 8 | 4,834 ± 1,684 | 7 |
| IL-18 | 67.6 ± 7.89 | 7 | 121 ± 38.9 | 7 |
| LPS-stimulated | ||||
| GM-CSF* | 176 ± 12.3 | 8 | 289 ± 33.8 | 5 |
| TNF-α** | 4,610 ± 626 | 9 | 15,219 ± 2,495 | 5 |
| MCP-1* | 21,317 ± 2,724 | 9 | 31,800 ± 4,281 | 7 |
| CXCL-1 | 10,916 ± 3,811 | 9 | 7,437 ± 4,171 | 5 |
| IFN-γ | 102 ± 34.9 | 7 | 330 ± 125 | 6 |
| IL-18 | 233 ± 69.6 | 7 | 244 ± 88.2 | 5 |
| IL-6 | 52,125 ± 15,280 | 5 | 35,950 ± 12,211 | 6 |
| IL-1α | 704 ± 70.3 | 8 | 610 ± 139 | 6 |
| IL-17A | 8.01 ± 2.41 | 4 | 10.8 ± 1.94 | 5 |
| IL-1β | 20.3 ± 3.74 | 9 | 23.0 ± 4.9 | 6 |
| IL-12p70 | 167 ± 59.3 | 4 | 143 ± 24.9 | 6 |
Monocyte chemoattractant protein 1 (MCP-1), interleukin-1 alpha (IL-1α), tumor necrosis factor-alpha (TNF-α), interleukin-6 (IL-6), C-X-C family chemokine 1 ligand (CXCL-1) and interleukin-18 (IL-18) detected in basal condition. Granulocyte-macrophage colony-stimulation factor (GM-CSF), tumor necrosis factor-alpha (TNF-α), monocyte chemoattractant protein 1 (MCP-1), C-X-C family chemokine 1 ligand (CXCL-1), interferon-gamma (IFN-γ), interleukin-18 (IL-18), interleukin-6 (IL-6), interleukin-1 alpha (IL-1α), interleukin-17A (IL-17A), interleukin-1 beta (IL-1β) and interleukin-12, p70 (IL-12p70) detected under lipopolysaccharide (LPS) stimuli (500ng/mL). Student's t-test or Mann–Whitney test was used for comparisons between the WT and GK rats (*p < 0.05 and **p < 0.01). The individual numbers are in the supplemental data (Table S6).
Disclaimer/Publisher’s Note: The statements, opinions and data contained in all publications are solely those of the individual author(s) and contributor(s) and not of MDPI and/or the editor(s). MDPI and/or the editor(s) disclaim responsibility for any injury to people or property resulting from any ideas, methods, instructions or products referred to in the content. |
© 2024 by the authors. Licensee MDPI, Basel, Switzerland. This article is an open access article distributed under the terms and conditions of the Creative Commons Attribution (CC BY) license (https://creativecommons.org/licenses/by/4.0/).
Copyright: This open access article is published under a Creative Commons CC BY 4.0 license, which permit the free download, distribution, and reuse, provided that the author and preprint are cited in any reuse.


