Submitted:
19 July 2024
Posted:
22 July 2024
You are already at the latest version
Abstract
Chalcones constitute an important group of natural compounds abundant in fruits and comestible plants. They are a subject of increasing interest because of their biological activities including antidiabetic and anti-obesity effects. The simple chalcone structural scaffold can be modified at multiple sites with different chemical moieties. Here we generated an artificial chalcone, i.e., 3,5-dimethyl-2,4,6-trimethoxychalcone (TriMetChalc), derived from 2′,4′-Dihydroxy-6′-methoxy-3′,5′-dimethylchalcone (DMC). DMC is the major compound of Cleistocalyx operculatus, a plant widely used in Asia for its anti-hyperglycemic activity. Using ob/ob mice as an obesity model, we ported that, after 3 weeks of per os administration, TriMetChalc modified food intake through the specific activation of brain structures dedicated to the regulation of energy balance. TriMetChalc also decreased weight gain, glucose intolerance and hepatic steatosis. Moreover, through extensive liver lipidomic analysis, we identified TriMetChalc-induced modifications that could contribute to improving the liver status of the animals. Hence, TriMetChalc is a chalcone derivative capable of reducing food intake and addition of glucose intolerance, and hepatic steatosis in a mouse model of obesity. In light of these results, we believe that TriMetChalc action deserves to be more deeply evaluated over longer treatment periods and/or in combination with other chalcones with protective effects on the liver.
Keywords:
chalcone
; food intake
; brainstem
; hypothalamus
; leptin
; steatosis
; liver
1. Introduction
Keeping a healthy weight has become both a personal challenge and a major public health issue. The majority of people on the planet actually reside in countries where being overweight or obese is associated with a higher death rate than being underweight. The rate of obesity worldwide has almost tripled since 1975. In 2016, there were approximately 1.9 billion obese adults (those above the age of 18). Of these, more than 650 million were overweight. The World Health Organization has estimated that 39 million children under the age of five and over 340 million children and adolescents will be overweight or obese after 2020 [1]. Fat accumulation in the liver, a defining feature of fatty liver disease, is frequently linked to metabolic syndromes, including obesity. Non-alcoholic fatty liver disease (NAFLD) is a term used to cover a continuum of liver disorders that are characterized by evidence of excessive fat in the liver (hepatic steatosis) and the absence of secondary origins (alcohol consumption, medications, and hereditary disorders). NAFLD is the most common cause of chronic liver disease worldwide and represents a major, expanding public health problem [2]. Over one billion people worldwide suffer from NAFLD, which has become the most common form of chronic liver disease. While the majority of people with fatty liver have no or few symptoms, a small subset can develop liver cancer, or end-stage liver disease [3]. To better reflect the metabolic related etiology of this pathology, a new nomenclature was proposed [4,5]. The term metabolic dysfunction-associated fatty liver disease (MAFLD) is now largely accepted and used. The global epidemic of fatty liver disease grows alongside the obesity pandemic. The prevalence rate of MAFLD rises with increasing body mass index (BMI). Based on data from 1989 to 2015, the global prevalence of MAFLD in the general population has been estimated to be 25% [6]. The prevalence of MAFLD was 17% in lean individuals and between 50% and 90% in the obese population [7]. For instance, based on histologic analysis of liver originating from donor automobile crash victims, autopsy findings, and clinical liver biopsies, the observed prevalence rates of steatosis are approximately 15% in non-obese persons, 65% in persons with class I and II obesity (BMI 30.0–39.9 kg/m2), and 85% in extremely obese patients (BMI ≥ 40 kg/m2) [8].
The need for new compounds and possible treatments to prevent the development of obesity and MAFLD persists, despite the wealth of information on the etiology and mechanisms underlying these pathologies. A class of natural flavonoids derivatives of aromatic ketones known as 1,3-diphenyl-2-propen-1-ones, or chalcones, has attracted attention among natural promising chemicals. This interest is based on their numerous biological actions, including anti-obesity and antidiabetic qualities in both in vitro and in vivo systems. Many plant-derived forms of chalcone with multiple substitution patterns on both aromatic rings, such as hydroxy, methyl, and methoxy substituents, have been identified [9].
2′,4′-Dihydroxy-6′-methoxy-3′,5′-dimethylchalcone (DMC) is the major compound of Cleistocalyx operculatus, a plant that is widely distributed in southern Asia. Locally, the water extract of Cleistocalyx operculatus is commonly used for its anti-hyperglycemic activity [10]. It was reported that DMC promoted glucose uptake and lipid storage in differentiated 3T3-L1 adipocytes [11] and increased glucose uptake and fatty acid oxidation in myotubes [12]. In addition, DMC improved glucose tolerance and significantly increased fatty acid activation (FAO) of the muscles of high-fat diet (HFD)-fed mice [12]. Chalcones can not only be biosynthesized by plants but can also be manufactured synthetically. The simple chalcone structural scaffold can be modified at multiple sites with different chemical moieties. The resulting molecules could respond to different molecular targets or interfere with different signaling pathways [13,14,15]. Using a simple synthetic method, we have generated a new artificial chalcone i.e., 3,5-dimethyl-2,4,6-trimethoxychalcone (TriMetChalc) which derived from the 2′,4′-Dihydroxy-6′-methoxy-3′,5′-dimethylchalcone (DMC). Therefore, the aim of this study was to test the effect of TriMetChalc on food intake and weight gain in lean C57Bl/6J mice and leptin-deficient ob/ob mice and to evaluate the impact of this molecule on hepatic steatosis that occurs naturally in ob/ob mice.
2. Results
2.1. Effect of Acute Per Os Administration of TriMetChal on Food Intake in C57Bl/6 Mice
A single oral administration of TriMetChal resulted in a dose-dependent decrease in daily food intake in C57Bl/6 mice (Figure 2A). Note that 6.5 and 65 mg/kg BW failed to modify food intake measured during the first 24 hours (h) following administration while 130 and 650 mg/kg BW of TriMetChal diminished it respectively by 11.8 and 18.4%. Food consumption measured 3, 12 and 24 h after treatment revealed that 130 and 650 mg/kg BW TriMetChal mainly affected the night-time food intake (Figure 2B). To decipher feeding behavior analysis after TriMetChalc administration, we quantified the consumption of a non-nutritive substance i.e., kaolin. This behavior, known as pica, serves as a model for the study of nausea/emesis in rodents [20]. Lithium chloride (150 mg/kg BW) well known to induce discomfort in rodents served as positive control. Mice treated with vehicle consumed 0.14 +/- 0.03 mg/24 h of kaolin and those treated with lithium ingested 0.33 +/- 0.08 mg/24 h (Figure 2C). While the higher dose of TriMetChalc 650 mg/kg BW caused a significant increase in kaolin intake (0.27 +/- 0.03 mg/24 h; p < 0.01), at the dose of 130 mg/kg BW TriMetChalc did not induce significant kaolin intake (0.19 +/- 0.02 mg/24 h).
2.2. Brain Pattern of Central Pathways Activated in Response t Acute Trimetchalc Per Os Administration
Central structures activated in response to per os administration of 130 mg/kg BW TriMetChalc were next identified using the immune detection of the early gene c-Fos. A very low basal level of c-Fos positive nuclei was observed in the brainstem, pons and forebrain of vehicle-treated mice. TriMetChalc-treated mice showed a strong increase in the number of c-Fos positive nuclei within the nucleus tractus solitarius (NTS) regardless the rostro-caudal level considered and a moderate increase within the area postrema (AP, Figure 3A,B). Animals challenged with TriMetChalc also displayed a strong rise in c-Fos immunoreactivity in the within forebrain structures such as the arcuate nucleus (ARC), paraventricular hypothalamus nucleus (PVN) and ventromedial hypothalamus (VMH; Figure 3C,D).
2.3. Effect of Acute Per Os Administration of TriMetChalc on Food Intake and c-Fos Expression in ob/ob Mice
The ob mutation is a spontaneous recessive mutation in the gene encoding leptin. Mice homozygous for this mutation are leptin deficient and develop obesity which appears around 4-5 weeks of age. In this model, obesity is associated with hyperphagia, hyperglycemia and type II diabetes. To shed light on the mechanisms by which TriMetChalc reduces food intake, we tested the potential interaction between TriMetChalc and endogenous leptin. Thus, we next tested the acute administration of TriMetChalc in ob/ob mice. As previously observed in C57Bl/6 mice, TriMetChalc 130 and 650 mg/kg BW reduced night-time food intake (Figure 4A,B). The extend of TriMetChalc-induced food reduction in C57Bl/6 and ob/ob mice were similar (Figure 2 and Figure 4). As previously observed with C57Bl/6 mice, TriMetChalc increased kaolin intake at the dose of 650 mg/kg BW but not when administered at 130 mg/kg BW (Figure 4C). c-Fos immunochemistry performed in ob/ob mice confirmed this observation. The brain pattern and number of c-Fos positive cells in response to TriMetChalc in ob/ob mice resembled those observed in C57Bl/6. Indeed, an increase in c-Fos positive cells was observed in the NTS, the AP and several nuclei of the hypothalamus i.e., PVN, ARC and VMH (Figure 5A–D). Other regions appeared virtually devoid of c-Fos positive nuclei (Figure 5A,B).
2.4. Effect of Chronic TriMetChalc Treatment on Food Intake and Body Weight of Leptin Deficient Mice
We next sought to determine whether the anorexigenic effect of TriMetChalc could reverse leptin deficiency induced-obesity. To this aim, ob/ob mice were chronically administered with TriMetChalc once a day during three weeks. We chose to use TriMetChalc at a dose of 65 mg/kg BW, which appeared as a subthreshold dose in experiments measuring 24 h food intake over its acute administration. Chronic TriMetChalc administration limited the weight gain of ob/ob mice over the period studied (Figure 6A,B). Weight gain was 7.1 +/- 1.4 g for mice that received vehicle and 4.0 +/- 1.6 g for those treated with TriMetChalc (Figure 6A,B). At the same time, cumulative food intake over 3 weeks was reduced by 20.9 +/- 5.6% by TriMetChalc administration (Figure 6C,D). Interestingly, daily food intake was not significantly reduced in the first week but was decreased from day 7 until the end of treatment (Figure 6D) suggesting a cumulative effect of TriMetChalc. We next evaluated the potential impact of chronic TriMetChalc treatment on glucose intolerance since ob/ob mice develop hyperglycemia and a type II diabetes syndrome. OGTT was performed before and after three weeks treatment with 65 mg/kg BW TriMetChalc. The results confirmed the development of glucose intolerance over time in this model (Figure 6E,F). TriMetChalc significantly reduced glycemic response to oral glucose overload in ob/ob mice with a more rapid return to basal glycaemia in treated group than control animals (Figure 6E). Quantification of the area under the curve confirmed this observation (Figure 6F).
2.5. Effect of Chronic TriMetChalc Treatment on Hepatic Lipid Content of ob/ob Mice
After the animal sacrifice, observation of livers from TriMetChalc-treated mice (65 mg/kg BW) revealed a slightly less yellow coloration suggesting reduced lipids storage in the test group (data not shown). Weighing the livers after three weeks of treatment showed that TriMetChalc significantly reduced the weight of this organ (Figure 7A). ORO staining is a commonly used experimental technique to detect lipid content in cells or tissues. As shown in Figure 7B, ORO staining confirmed lipid liver storage in ob/ob mice and a reduced accumulation in TriMetChalc-treated animals. Quantification of ORO staining objectified this observation, and a significant reduction in lipid droplets number and total droplet surface was observed in the TriMetChalc-treated group compared to the control (Figure 7C,D). The size of the lipid droplet remained unchanged (Figure 7E).
To enable a thorough understanding of the effect of TriMetChalc on MAFLD known to develop in the ob/ob model, a lipidomic analysis of liver was performed [16,17]. The results are expressed in relative abundance of each compound as an area ratio between the area of the detected species and the area of the internal standard normalized per mg of proteins in the sample. We firstly quantify liver content of cholesterol and triacyglycerols (TAG). Despite a clear downward trend towards lower concentrations in both cholesterol and TAG, no significant difference could be demonstrated with the sampling and the administration protocol used (Figure 8A–C and Table 1).
Fatty acids (FA) constitute the fundamental structural components of complex lipids and can enter the system through dietary intake, are released from visceral adipose tissue during lipolysis, or are synthesized within the liver through de novo lipogenesis (DNL). Considering the consistent association between hepatic steatosis and saturated (SFA), monounsaturated (MUFA), and polyunsaturated (PUFA) fatty acids, an investigation of their levels across the studied groups was performed. Analysis of FA contents within the liver of control and TriMetChalc (65 mg/kg BW)-treated mice revealed a significant reduction of total FA (Figure 9A and Table 2). Regarding SFA, a clear reduction of total SFA was observed in ob/ob mice that received TriMetChalc (Figure 9B and Table 2). Palmitic acid (FA C16:0) and stearic acid (FA C18:0) were the most prevalent SFA in liver samples from ob/ob mice and their abundance was reduced by TriMetChalc treatment (Figure 9C,D and Table 2). MUFAs including palmitoleic acid (FA C16:1), oleic acid (FA C18:1) and eicosenoic acid (FA C20:1) were found to be significantly reduced by TriMetChalc administration (Figure 9E–H and Table 2). Concerning PUFAs, linoleic acid (FA C18:2n6) and alpha-linolenic acid (FA C18:3n3) were found increased after TriMetChalc treatment (Table 2). Accordingly, total conjugated linoleic acid (CLA-FA) and total PUFAs contents exhibited an increase in the TriMetChalc group (Figure 9I,J and Table 2). Altogether these results contributed to an increase of PUFA/SFA and USFA/SFA ratio and a reduction of MUFA/PUFA ratio (Figure 9K and Table 2). The lipogenic index derived from the ratio of palmitic acid (FA C16:0) to the essential ω-6 linoleic acid (FA C18:2n6) reflects rates of DNL. Here we reported a strong reduction in the lipogenic index: 8.20 +/- 0.66 versus 3.24 +/- 0.73 in control and TriMetChalc-treated mice respectively (Figure 9L and Table 2). We next evaluated liver phospholipids, ceramides and sphingomyelins contents in control and treated groups. Interestingly, phosphatidylcholines (PCs) and phosphatidyl inositols (PI) were weakened by the treatment while phosphatidyl ethanolamines (PE) and phosphatidyl serines (PS) levels was not significantly reduced despite to trend toward lower concentrations (Figure 10A–D and Table 3). As a result, the PC/PE ratio was significantly reduced (32.5 +/- 0.9 versus 29.2 +/- 0.7, P 0.01) in control and TriMetChalc-treated groups respectively, Figure 10E). Ceramides and sphingomyelins contents remained unchanged by TriMetChalc treatment (Table S1).
3. Discussion
The present study was designed to evaluate the potential therapeutic effects of TriMetChalc on food intake, obesity and liver steatosis using the hyperphagic, obese and diabetic ob/ob mice model. We observed that TriMetChalc which derived from DMC retained the anti-obesity and anti-diabetic effects of the native molecule but we also showed that this molecule has an anorexigenic property and protective action on the liver, two actions which have not been described for DMC.
3.1. TriMetChalc Acts as Anorexigenic Molecule Independently of Leptin
Per os administration of TriMetChalc induced a dose-dependent reduction in daily food intake by decreasing night-time food consumption. This result proves that TriMetChalc was stable and effective in vivo after daily administration. An interesting finding of the present work is that the anorexigenic effect of TriMetChalc was similar in C56Bl/6 and leptin-deficient ob/ob mice. Leptin is a hormone secreted by adipose cells that inhibits hunger. Leptin-deficient ob/ob mice are hyperphagic and develop severe obesity, insulin resistance, and steatosis. Therefore, TriMetChalc acts on leptin-independent signaling pathways or molecular targets operating downstream of leptin. Thus, the anorexigenic action of TriMetChalc in ob/ob mice is of interest in the perspective of the future development of TriMetChalc as an anti-obesity drug since human obesity is characterized by leptin resistance [18]. The reduction in food intake may be the result of intoxication and the appearance of nausea and vomiting [19]. To verify whether this was the case with TriMetChalc, we measured the consumption of the clay (kaolin) intake, used here as an indicator of nausea and emesis [20]. The dose of 130 mg/kg BW, which induces a reduction in food intake, did not lead to any kaolin consumption, excluding the presence of nausea at this dosage. On the other hand, at a high dose, i.e., 650 mg/kg BW, TriMetChalc significantly increases the ingestion of kaolin, showing that a high dosage of this molecule is likely to induce discomfort in animals. In terms of toxicity, we did not observe any remarkable histological liver damage after administration of TriMetChalc for 3 weeks. In addition, the results of the single-dose acute-toxicity study showed no toxicity or abnormal clinical signs in the mice. The estimated LD 50 is higher than 1300 mg/kg, which is much higher than the effective dosage (6.25 and 650 mg/kg) administered to the mice in this study. Taken together, the TriMetChalc compound demonstrated no significant toxicity at the doses used in the present work.
By controlling hunger, the brain plays an essential role in regulating food intake and energy expenditure. Two central regions, i.e., the hypothalamus and dorsal vagal complex (DVC), a brainstem structure, strongly contribute to the homeostatic control of the energy balance by integrating information linked to nutritional status and arising from peripheral organs (gut, liver, pancreas, adipose tissue; see [21] for review). To decipher the mechanisms underlying the modulation of food intake by TriMetChalc and identify central structures activated by this compound, we performed a c-Fos expression mapping. The detection of the early gene c-Fos is classically used to identify brain-activated cells [22,23]. We observed that TriMetChalc strongly and specifically activated hypothalamic nuclei such as ARC, PVN, VMH, and the brainstem nuclei of the DVC. It should be noted that TriMetChalc did not cause c-Fos activation outside these areas, excluding a nonspecific toxic effect. On the contrary, the specific activation of these areas reinforces the idea that the TriMetChalc interacts with pathways dedicated to the regulation of food intake. As mentioned previously, TriMetChalc is a derivative of DMC, the major compound in Cleistocalyx operculatus extract. Choi and colleagues [12] reported that DMC activated AMP-activated protein kinase (AMPK) by direct binding and proposed that DMC is an AMPK agonist. AMPK was highly expressed in the different hypothalamic nuclei, such as ARC, PVN, and VMH [24]. Hypothalamic AMPK is involved in the modulation of energy balance and plays an important role in the regulation of feeding. The modulation of hypothalamic AMPK level and activity by key hormones such as leptin and ghrelin is implicated in the control of food intake and appetite [25]. For example, during fasting, AMPK activity is raised in hypothalamus nuclei, and it is inhibited after refeeding. Furthermore, elevated hypothalamic AMPK activity caused increased food intake leading to weight gain. Conversely, hypophagia and weight loss were caused by its suppression [26]. Thus, given the anorexigenic effect observed here with TriMetChalc, it seems unlikely that it acts as a hypothalamic AMPK agonist. We showed here that TriMetChalc limited the weight gain of ob/ob mice over a period of three weeks, a duration similar to that used in the two previously cited studies [12,27]. Three weeks of DMC treatment improved glucose tolerance in HFD-induced obese mice but the body weight of DMC-treated mice remains unchanged compared with that of the control group [12]. Recently, Lee and collaborators [27] synthesized 12 chalcone derivatives from DMC possessing AMPK agonist activity. These derivatives increased the fatty acid oxidation (FAO) rate of C2C12 myotubes. After three weeks of administration, the more potent effective AMPK agonist derivate was reported to improve glucose tolerance in HFD-mice without modification in weight gain [27]. In addition, we revealed that TriMetChalc reduces food intake from the 7th day until the end of treatment. As a result, cumulative food intake over the 3-week period was reduced. This is a notable difference from the works of Choi et al. [12] and Lee et al. [27], which suggests that modifying DMC as we practiced it allows the molecule to have an anorexigenic effect. Other synthetic chalcones derivatives, i.e., halogen-containing chalcone derivatives 2-bromo-4′-methoxychalcone and 2-iodo-4’-methoxychalcone, have been reported to prevent body weight gain and impaired glucose tolerance in HFD mice after 10 weeks of treatment [28]. But in the absence of measurement of food intake in this latest study, it is difficult to compare the effects of these different molecules. To date, our work is the first to show that a chalcone derivative has a hunger-killing effect by directly or indirectly targeting neural networks dedicated to the central energy balance. Understanding the precise mechanism remains to be clarified.
3.2. TriMetChalc Attenuates Metabolic Dysfunction-Associated Fatty Liver Disease
Excess fat deposition within the liver has been reported for centuries. In 1980, Ludwig and colleagues describe the liver histology associated with excess liver fat in the absence of significant alcohol consumption and use the term “non-alcoholic steatohepatitis (NASH)” [29]. Non-alcoholic fatty liver disease (NAFLD) is rapidly becoming a worldwide public health problem. NAFLD represents a spectrum of diseases ranging from “simple steatosis,” which is considered relatively benign, to non-alcoholic steatohepatitis (NASH) and NAFLD-associated cirrhosis and end-stage liver disease. Even if NAFLD can be induced by a variety of drugs and toxins, a high prevalence of NAFLD in patients with obesity, metabolic syndrome, and type-2 diabetes was clearly observed [30]. In 2020, to better reflect the metabolism-related etiology, an international panel of experts reached a consensus to replace the term NAFLD with “metabolic dysfunction-associated fatty liver disease” (MAFLD) [4,5]. In addition to obesity and type 2 diabetes, ob/ob mice develop steatosis and associated lipotoxicity and lipo-apoptosis. Liver histology shows a rare progression to cirrhosis since ob/ob mice are resistant to hepatic fibrosis. Although ob/ob mice do not display the full spectrum of human NASH, these obese animals could represent a suitable model to study MAFLD [16].
Numerous chalcones, i.e., trans-chalcone, naringenin chalcone, xanthohumol, 4-hydroxyderricin, xanthoangelol, cardamonin, flavokawain B, and safflower yellow, have been shown to have protective effects on the liver and in MAFLD. To do this, they can improve adipocyte functions, increase adiponectin secretion, inhibit lipogenesis, or enhance fatty acid oxidation (see [9] for review). However, no such effects have been reported for DMC. Only one study shows that DMC has a hepatoprotective effect on carbon tetrachloride-induced acute liver injury in Kunming mice through the attenuation of oxidative stress and inhibition of lipid peroxidation [31]. Here, we observed that treatment for three weeks with a dose of 65 mg/kg BW of TriMetChalc significantly reduced hepatic steatosis in ob/ob mice, as quantified by histological staining. This is the first observation that a DMC derivative compound can have a positive impact on this pathology. An important aspect of MAFLD progression is lipotoxicity, caused by hepatic accumulation of lipids that can trigger cellular stress responses. We performed a lipidomic study to identify which lipids were modified by the treatment. Despite a trend towards a reduction in TAG and cholesterol, the quantification carried out here was unable to highlight a significant difference. The three weeks exposure time may explain this result, and we will proceed with longer treatment periods in the future. We might also consider increasing the dose of TriMetChalc and/or combining TriMetChalc with other chalcones or compounds with liver-protective action. However, our protocol induced many modifications in long-chain FFAs (containing 16 carbons or more) divided into SFAs, MUFAs, and PUFAs based on the presence of double bonds. First, we observed a significant reduction in total SFAs content largely due to the decrease in palmitic and stearic acids. Increased levels of hepatic SFAs have been reported in MAFLD patients and animal models, largely due to significant increases in palmitic and stearic acids (see [32] for review). The excessive accumulation of these two SFAs in hepatocytes has been shown to induce endoplasmic reticulum stress, leading to apoptosis and hepatocyte damage. Hence, palmitic and stearic acids induce concentration- and time-dependent lipo-apoptosis in hepatocytes [33,34]. Palmitic acid through interaction with receptor toll-like type 2 has been shown to activate the inflammasome in Kupffer cells and macrophages in vitro and in vivo and then contribute to NASH development [35]. Conversely, the excessive SFA consumption may be a risk factor for MAFLD pathogenesis [36].
Animals and humans with MAFLD also have high levels of hepatic total MUFAs, suggesting a potential link between increased levels of these lipids and hepatic inflammation and lipotoxicity [37,38,39]. The most abundant and well-studied MUFAs in MAFLD are palmitoleic acid (C16:1) and oleic acid (C18:1), which are generated from the SFAs palmitic and stearic acids, respectively [40]. Oleic acid-induced steatosis has been reported in hepatocytes of many mammalian species [41,42]. Although they contribute to steatosis, these MUFAs are less lipotoxic than SFAs. Indeed, individually studied, these MUFAs induce apoptosis, but this effect is minimal compared with SFAs [40]. Furthermore, they greatly attenuated palmitate-induced apoptosis in cultured hepatocytes [43]. Consistently, in cultured hepatocytes, MUFAs reduced palmitate-induced apoptosis but increased triglyceride (TAGs) accumulation [44]. Moreover, in a context of impaired TAGs synthesis, oleic acid accumulation exerts significant lipotoxicity [44]. Finally, the inhibition of stearoyl-CoA desaturase 1 (SCD1), a rate-limiting enzyme that allows the biosynthesis of monounsaturated fatty acids from their saturated fatty acid precursors, has been proposed as a treatment for MAFLD [45,46]. In this context, the concomitant decrease in SFAs and MUFAs, i.e., FA C16:0, FA C16:1, FA C18:0, FA C18:1, and FA C20:1, observed in TriMetChalc-treated ob/ob mice could help reduce lipotoxicity and TAGs accumulation.
Our lipidomic analyses revealed a significant increase in PUFAs contents, particularly linoleic acid (FA C18:2w6) and alpha-linolenic acid (FA C18:3w3). Accordingly, the PUFAs/SFAs ration was found to be increased by TriMetChalc administration. In recent years, it has become clear that PUFAs are important for many biological processes within cells. For instance, PUFAs increase membrane fluidity, which raises the number of membrane insulin receptors and improves insulin sensitivity. Additionally, through their interactions with other genes, PUFAs directly regulate the activity of genes linked to lipid metabolism, redox balance, inflammation, and fibrogenesis in NASH (see [40,47] for reviews). The PUFAs content is altered in MAFLD, and the severity of this pathology is correlated with a constant decline in hepatic PUFAs levels. [38,48]. Thus, the molar percentages of both n-3 and n-6 PUFAs were decreased in human liver biopsies from MAFLD patients [38]. A low liver PUFAs/SFAs ratio has been associated with an increased risk of developing atherosclerosis, cardiovascular diseases, diabetes, and MAFLD [49]. In a meta-analysis, Yu and colleagues [50] found that total PUFAs improve liver function and promote benefits for obesity-related comorbidities, such as a reduction in insulin resistance, dyslipidemias, inflammation, and non-alcoholic fatty liver disease markers. PUFAs are effective at limiting the hepatic steatosis process by increasing the gene expression of lipid oxidation, reducing liver lipogenic enzymes activity, and releasing adiponectin [51]. The increase in PUFAs and the concomitant reduction in SFA and MUFA induced by TriMetChalc should be highlighted and could contribute to improve the liver status of the animals.
Liver steatosis in MAFLD is triggered by excessive hepatic triglyceride synthesis using white adipose tissue (WAT)-derived fatty acids, de novo lipogenesis (DNL), and endocytosis of triglyceride-rich lipoproteins. DNL, the metabolic pathway synthesizing SFAs and MUFAs from acetyl-CoA, accounts for only a small fraction of FAs in the liver of lean humans (5%) [3]. However, in MAFLD, hepatic DNL is strongly increased, and approximately 25% of triglycerides originate from DNL. This increase in MAFLD compared to healthy subjects can be largely explained by the induction of DNL enzymes [52]. The lipogenic index was introduced by Hudgins et al. in 1996 [53] to reflect the DNL rate and is calculated as the ratio of palmitic acid (16:0) to the essential omega-6 linoleic acid (18:2n6). The amounts of FA chains (i.e., FA C16:0, FA C18:0, and FA C18:1) representing DNL were substantially elevated in ob/ob mice [54]. Here, we reported a clear and strong reduction in the DNL index in response to TriMetChalc treatment, confirming the potential benefit of this molecule in the MAFLD context.
An interesting observation we made is the reduction of hepatic PC contents and PC/PE ratio with TriMetChalc treatment. PC and PE are the two most abundant phospholipids in the plasma membranes of all mammalian cells. PC and PE predominantly reside on the outer and inner leaflets of the plasma membrane bilayer, respectively. In the context of MAFLD, PC and PE have been associated to liver damage. In several mouse models and in human studies, a change not only in the absolute concentrations of these phospholipids but, more critically, in the molar ratio between PC and PE is a key determinant of liver health [55]. Mostly, the severity of MAFLD is generaly negatively correlated with the hepatic PC/PE ratio [56]. But in some models, the PC/PE ratio can be increased above the normal range, and this disturbance in the ratio is also associated with MAFLD. The leptin-deficient ob/ob mice belong to models where the hepatic PC/PE ratio is increased [57]. To manage excess lipids storage in these mice, the expression of genes involved in hepatic PC synthesis (i.e., Pcyt1a and Pemt) is up-regulated, increasing the hepatic PC/PE ratio [58]. When ob/ob mice were treated with Pemt-targeted shRNA, the hepatic PC/PE molar ratio was restored to the wild-type level, thereby significantly decreasing hepatic steatosis [55]. In this context, the reduction in PC/PE ratio observed in response to TriMetChalc could contribute to the reduction of liver steatosis in this model and be an indicator of the improvement in the metabolic status of the ob/ob mice.
4. Materials and Methods
4.1. Animal Housing
Experiments were performed on 7-8 weeks male C57Bl/6J mice and homozygous male C57BL/6J-lepob (ob/ob) mice (Charles River Laboratories, l’Abresle, France). All animals were individually housed in a pathogen-free facility at controlled temperature on a 12/12 h light/dark cycle (lights on at 7 AM) with standard diet (AO4 P2.5, SAFE UAR) and water available ad libitum. All experiments were performed at 21°C. Each experimental group comprised 8 animals.
4.2. 3,5-Dimethyl-2,4,6-trimethoxychalcone (TriMetChalc) Synthesis Pathway (Figure 1)
Figure 1.
Synthesis path to obtain 3,5-dimethyl-2,4,6-trimethoxychalcone (TriMetChalc). A: dimethylformamide, phosphorous oxychloride, 0 °C, 1 h. B: hydrazine hydrate, KOH, ethylene glycol 90-145 °C, 4 h. C: dimethylformamide, phosphorous oxychloride, 0 °C, 1 h. D: hydrazine hydrate, KOH, ethylene glycol 90-145 °C, 4 h. E: boron trifluoride ethyl etherate, acetic anhydride, 90 °C, 1.5 h. F: LiOH, ethanol, 25 °C, 16 h. G: K2CO3, dimethyl sulfate, acetone, 50 °C, 12 h.
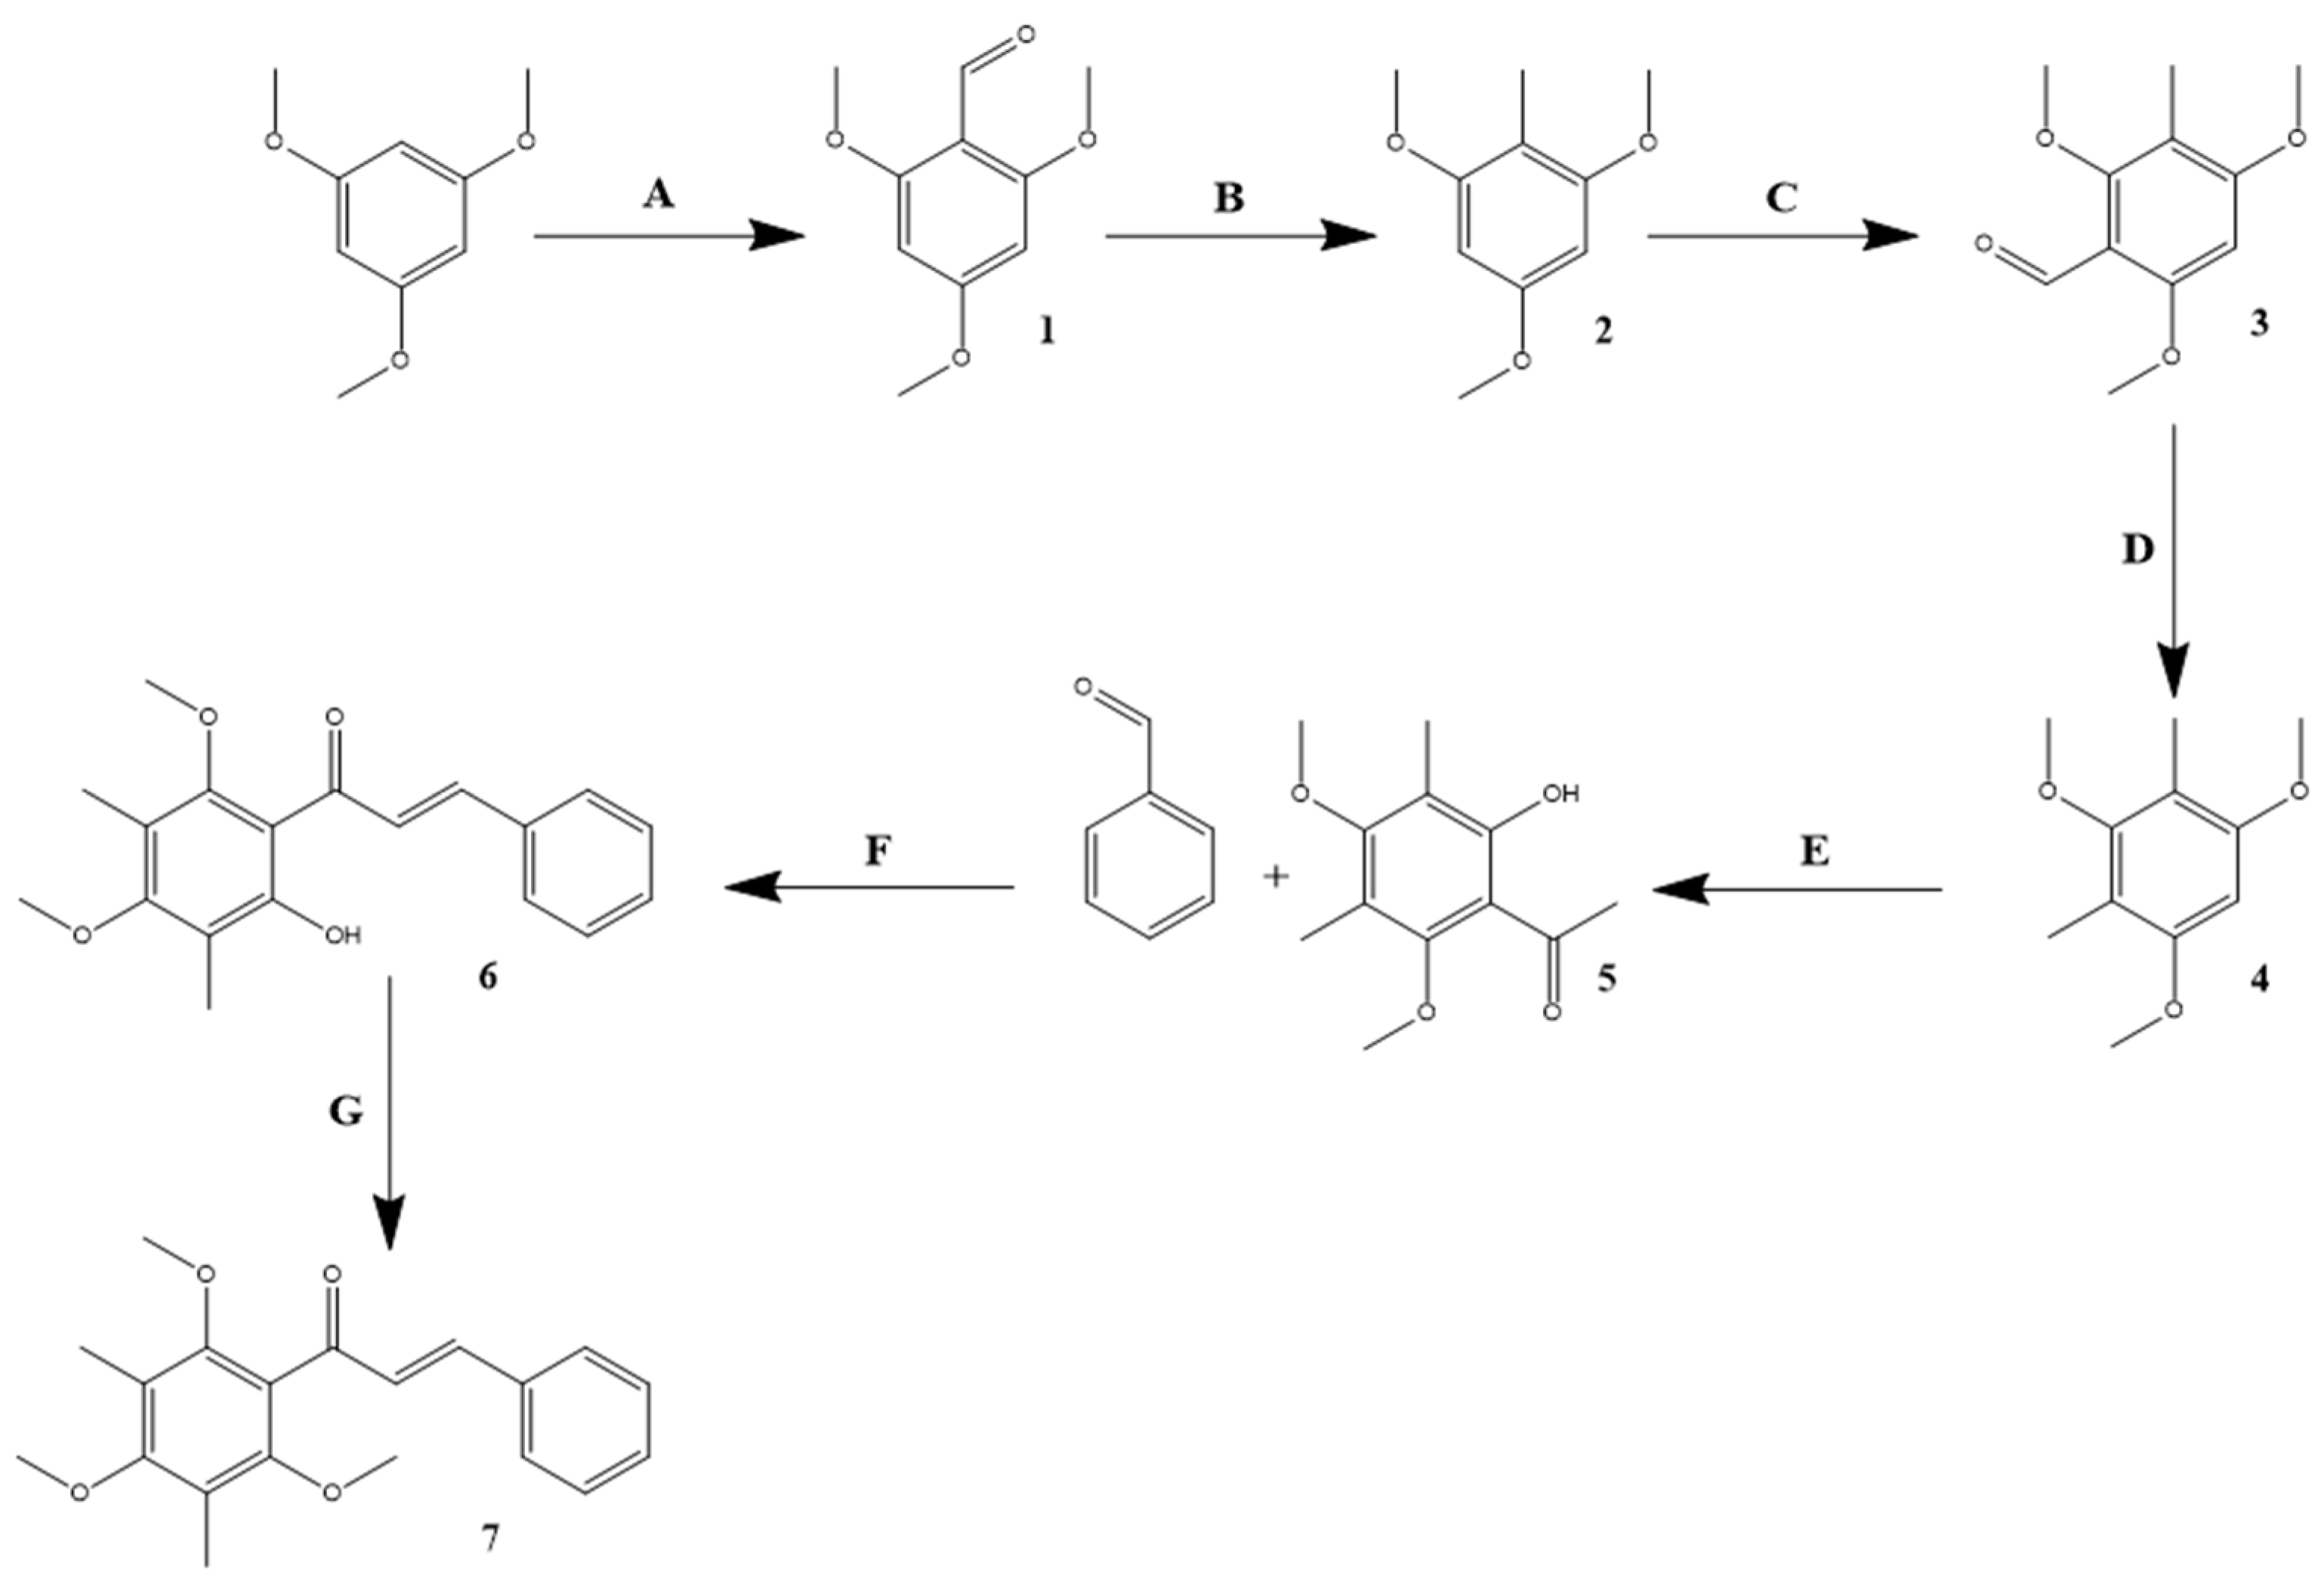
4.2.1. Synthesis of 2,4,6-Trimethoxybenzaldehyde
According to a previously described synthesis [59,60], 15 g of 1,3,5-trimethoxybenzene were dissolved in 9 mL of dimethylformamide (1.3 equimolar (eq.)) and cooled at 0 °C. A volume of 9.1 ml of phosphorous oxychloride (1.1 eq) was slowly added dropwise and the mixture was allowed to react at room temperature for 1h. After completion, the mixture was cooled with ice cold water and neutralized with 8 M KOH. The precipitate was filtered, and a pink solid was obtained (93% yield). 1H NMR (300MHz, DMSO-d6): δ 10.19 (s, 1H, CHO), 6.23 (s, 2H, CH), 3.86 (s, 3H, O-CH3), 3.81 (s, 6H, O-CH3).
4.2.2. Synthesis of 2,4,6-Trimethoxytoluene
As described in a previous synthesis [59,60], 10 g of 2,4,6-trimethoxybenzaldehyde were dissolved in 30 mL of ethylene glycol. Then, 11.1 ml of hydrazine hydrate (0.5 eq.) and 14 g of KOH (5 eq.) were added. The solution was then heated to 90 °C for 2 h, and once foam has formed, the mixture was heated to 145 °C for 2 h. When completed, the reaction was poured on ice-cold water and acidified with 1 M HCl. The precipitate was filtered and washed several times with brine to obtain a white powder (81% yield). 1H NMR (300 MHz, DMSO-d6): δ 6.19 (s, 2H, CH), 3.74, (s, 9H, O-CH3), 1.9 (s, 3H, CH3)
4.2.3. Synthesis of 3-Methyl-2,4,6-trimethoxybenzaldehyde
As for the previous formylation, 10 g of 2,4,6-trimethoxytoluene were dissolved in 5.5 mLof dimethylformamide (1.3 eq.) and then cooled at 0 °C. Then, 5.6 mL of phosphorous oxychloride (1.1 eq.) were slowly added dropwise, and the mixture was allowed to react at room temperature for 1 h. After completion, the mixture was cooled with ice cold water and neutralized with 8 M KOH. The precipitate was filtered to obtain a bright yellow precipitate (89% yield). 1H NMR (300 MHz, DMSO-d6): δ 10.18 (s, 1H, CHO), 6.53 (s, 1H, CH), 3.91 (s, 3H, O-CH3), 3.88 (s, 3H, O-CH3), 3.68 (s, 3H, O-CH3), 1.96 (s, 3H, CH3)
4.2.4. Synthesis of 2,4-Dimethyl-1,3,5-trimethoxybenzene
As for the previous reduction, 10 g of 3-methyl-2,4,6-trimethoxybenzaldehyde (0.05 mol) and 10.5 mL of hydrazine hydrate (0.6 equimolar) were dissolved in 30 mL of ethylene glycol. When the reactants were perfectly dissolved, 14 g of KOH (5 eq.) were added portion wise, then the reaction was heated up to 90 °C for 2 h. When foam has formed the mixture was heated up again, up to 145 °C for 2 h. When the reaction was complete, the mixture was poured onto ice cold water and acidified with 1M HCl. The precipitate was filtered and washed several times with brine to obtain a yellowish powder (56% yield). 1H NMR (300 MHz, DMSO-d6): δ 6.41 (s, 1H, CH), 3.77 (s, 6H, O-CH3), 3.57 (s, 3H, O-CH3), 1.98 (s, 6H, CH3)
4.2.5. Synthesis of 2-Hydroxy-3,5-dimethyl-4,6-dimethoxyacetophenone
According to a previously described synthesis [61], 10 g of 2,4-dimethyl-1,3,5-trimethoxybenzene were dissolved in 26 mL of acetic anhydride (5.5 eq.). Then 6.4 mL of boron trifluoride ethyl etherate (2 equimolar) were added dropwise to the mixture. When the addition was completed, the mixture was heated up to 90 °C and stirred for 1.5 h, then the reaction was allowed to stand without stirring overnight. Then, 30 mL of water were added and the mixture was stirred again for 10 min. Twenty-five milliliters of ethyl acetate were added, and the mixture was extracted three times. The organic layers were combined and washed several times with brine, then dried under pressure to obtain a dark brown thick oil (74% yield).
1H NMR (300 MHz, DMSO-d6): δ 12.81 (s, 1H, OH), 3.71 (s, 3H, O-CH3), 3.69 (s, 3H, O-CH3), 2.65 (s, 3H, COCH3), 2.09 (s, 3H, CH3), 2.03 (s, 3H, CH3)
4.2.6. Synthesis of 2-Hydroxy-3,5-dimethyl-4,6-dimethoxychalcone
To 10 mL of ethanol were added 0.224 g of 2-hydroxy-3,5-dimethyl-4,6-dimethoxyacetophenone, 0.106 g of benzaldehyde (1 eq.) and 0.168 g of lithium hydroxide (5 eq.). The mixture was then stirred at room temperature for 16 h. Then, ethanol was evaporated under pressure and the residual oil was washed with water and 1 M HCl. The precipitate is filtered then dissolved in ethyl acetate. The mixture was extracted several times with brine and ethyl acetate evaporated to obtain a bright orange oil (89% yield). 1H NMR (300 MHz, CDCl3): δ 7.42-7.51 (m, 6H), 5.42 (d, 3 Hz, 1H), 3.83 (s, 3H, O-CH3), 3.75 (s, 3H, O-CH3), 2.17 (s, 6H, 2xCH3). 13C NMR (75 MHz, CDCl3): δ 190.2, 163.4, 159.6, 139.1, 128.7, 125.7, 118.6, 115.6, 111.7, 61.1, 60.0, 8.5, 9.0
4.2.7. Synthesis of 3,5-Dimethyl-2,4,6-dimethoxychalcone (TriMetChalc)
Two hundred milligrams of 2-hydroxy-3,5-dimethyl-4,6-dimethoxychalcone and 265 mg of potassium carbonate (3 eq.) were dissolved in 10 mL of acetone. A volume of 0.121 mL of dimethyl sulfate (2 eq.) were added dropwise, and the mixture was stirred and refluxed for 12 h. When the reaction was complete, the precipitate was filtered, and the solvent evaporated. The residual oil was dissolved in dichloromethane and extracted several times with brine. The organic layer was evaporated to obtain a bright yellow oil. (76% yield). 1H NMR (300 MHz; CDCl3): δ 7.50 (m, 2H), 7.29 (m, 4H), 6.95 (d, J = 15 Hz), 3.65 (s, 3H, O-CH3), 3.59 (s, 6H, 2xO-CH3), 2.13 (s, 6H, 2xCH3). 13C NMR (75 MHz; CDCl3): δ 193.3, 162.0, 159.1, 158.9, 142.8, 135.4, 130.1, 128.9, 128.4, 126.7, 109.1, 108.8, 106.5, 62.3, 8.2, 7.5.
4.3. Per Os Administration of TriMetChalc
Once a day (i.e., 10 h AM), mice were administered 6.25 to 25 mg/kg body weight (BW) TriMetChalc dissolved in vegetal oil via gavage using a 22 gauge intubation needle (Popper and Sons). Prior to TriMetChalc treatment, mice received the same volume of distilled water using the similar oral administration procedure for a habituation period of seven consecutive days.
4.4. Food Intake Measurements and Pica Behavior (Kaolin Intake)
Food consumption: Immediately after treatment, a new supply of pre-weighed food was given. Food intake was calculated as the difference between the pre-weighed food and the remaining chow measured with a precision balance (0.01 g; Denver Instrument from Bioblock).
Measurement of pica behavior (kaolin intake): Pica behavior was assayed as previously described [20]. Briefly, kaolin pellets were prepared from pharmacological grade kaolin and gum Arabic (Sigma Chemical Co) mixed at a 99:1 ratio in distilled water. The kaolin paste was rolled and cut into pieces similar in shape to mice chow pellets. The pellets were dried in an oven at 37 °C for 72 h and then placed in individual cages. Mice were allowed access to regular food and kaolin pellets for a 5 days adaptation period before the beginning of the study. On the day of the experiment the last 24 h, the kaolin consumption was recorded. Mice were then per os administered TriMetChal (65 mg/kg BW) or vehicle as described above and kaolin intake was measured 24 h later by subtracting pre-weighed and remaining kaolin pellets with a precision balance (Denver Instrument from Bioblock).
4.5. Tissue Histology and Oil Red O Staining
Oil Red O (ORO) staining of hepatic sections was performed as previously described [62]. Briefly, 10 µm thick sections were prepared from fixed liver samples with a cryostat (Leica CM3050, France). ORO stock solution 0.625% was first prepared in isopropanol. Sections were then incubated 6 min in ORO working solution (1.5 parts of ORO stock solution to one part of distilled water) and then washed three times in distilled water. For microscopic observations, sections were mounted in Mowiol solution. Four microphotographs (x 20) per animal were acquired using a Nikon Eclipse E600 light microscope coupled to a DXM 1200 Camera and ACT-1 software. The number of lipid droplets per surface unity (mm2), total droplet surface per surface unity (mm2) and lipid droplet size were counted for each condition using the NIH Image J software.
4.6. Immunohistochemistry Procedures
Per os treated-animals used for immunostaining procedure were sacrificed 3 h after treatment without free access to food. Mice were anaesthetized using intraperitoneal injection (ip) of ketamine (120 mg/kg BW, Imalgène 1000, Boehringer Ingelheim) and xylazine (16 mg/kg BW, Rompun 2%, Bayer Santé). Intracardiac perfusion was achieved in 4% paraformaldehyde (PFA). Brains were post-fixed for 1 h in 4% PFA at room temperature, rinsed in PBS and then cryoprotected for 24-48 h in 30% sucrose at 4 °C. After freezing of the brains in isopentane (-40 °C), coronal sections (40 µm thick) were cut on a cryostat (Leica CM3050, France) and collected serially in PBS (0.1 M; pH 7.4). Brains were cut from caudal brainstem (Bregma -8.24 mm) to forebrain (Bregma + 0.75 mm).
c-Fos immunohistochemistry was performed on free-floating sections using an anti-c-Fos rabbit antiserum synthesized against the N-terminus of human protein (1:3000, Millipore) as previously described [22]. Briefly, the free-floating sections were incubated 10 min in a solution containing 0.3% H2O2 in PBS 0.1 M for quenching of endogenous peroxidase activity. The sections were first incubated 1 h in PBS containing 3% normal goat serum (NGS) and 0.3% Triton X-100, then for overnight at room temperature in PBS containing 3% NGS, 0.3% Triton X-100 and anti-c-Fos antibody. A biotinylated goat anti-rabbit IgG (1:400, Vector Labs) was used as secondary antibody. After incubation with the avidin-biotin complex (1:200, Vector Labs), horseradish peroxidase activity was visualized using a nickel-enhanced diaminobenzidine (DAB) as the chromogen. The reaction was closely monitored and terminated when optimal intensity was reached (3-5 min) by washing the sections in distilled water. Non-specific labeling was assessed on alternate slices that were processed identically to those above but in which the primary antibody was omitted. Finally, all sections were mounted on gelatin-coated slides, air dried, and coverslipped with mounting medium.
4.7. Microscopy, Image Analysis and Cell Count
c-Fos immunostaining was further analyzed by counting positive nuclei on four sections. c-Fos positive nuclei counting was performed on photomicrographs acquired using a 10x objective equipped with a DXM 1200 Camera (Nikon) coupled to ACT-1 software. The microscope was set to a specific illumination level, as was the camera exposure time. c-Fos positive nuclei were then counted on these pictures by computer-assisted morphometry using the NIH image J software. Images were normalized by subtracting the background determined for each nucleus studied. The c-Fos stained elements were identified by setting a threshold value (140 grey levels above the background on a 0-255 intensity scale). Counts were manually corrected for overlapping cell nuclei that were counted by the software as unique. Software-generated counts of c-Fos stained profiles were also manually corrected by excluding positive objects whose area did not exceed 10 pixels (image resolution 150 pixels/inch) corresponding to objects with an area equal or less than to 3 square µm.
4.8. Extraction and Analysis of Neutral Lipids and Phospholipids
We performed quantitative analysis of neutral lipids (Free Cholesterol, Cholesterol ester C16, C18 and C20:4, Triacylglycerols C49, C51, C53, C55, C57, C59) and of the following classes of phospholipids (PL), ceramides (Cer18:1), phosphatidylethanolamines (PE), phosphatidylcholines (PC), sphingomyelins (SM d18:1), phosphatidylserines (PS), phosphatidylinositols (PI) on liver samples. Internal calibrations were achieved with Stigmasterol, Cholesterol ester C17, TAG 19 for neutral lipids and Cerd18:1/12:0 20 ng, PE 12:0/12:0 180 ng, PC 13:0/13:0 20 ng, SM d18:1/12:0 20 ng, PI 16:0/17:0 30 ng, PS 12:0/12:0 1600 ng for Phospholipids and ceramides. This method allows a relative quantification of the molecules.
For extraction, each frozen liver sample was crushed with a FastPrep ®-24 Instrument (MP Biomedical) in 1 mL of Water/EGTA 5 mM: Metanol (1:2, v/v). After 2 crush cycles (10 m/s, 2 × 30 s), lipids were extracted according to Bligh and Dyer in dichloromethane/water/methanol 2% acetic acid (2.5:2:2.5, v/v/v) [63], in the presence 100 µL internal standards of neutral Lipids and 40 µL internal standards of phospholipids. Samples were centrifuged at 2500 revolutions per minute (RPM/min) for 6 min, evaporated to dryness and then dissolved in 20 µL of ethyl acetate of neutral lipids or 50 µL methanol of phospholipids.
For neutral lipids, 1 µL of the lipid extract was analyzed by gas chromatography flam ionization detector on a GC TRACE 1300 Thermo Electron system using an Zebron ZB-5MS Phenomenex columns (5% polysilarylene, 95% polydimethylsiloxane, 5 m × 0.25 mm i.d, 0.25 µm film thickness [64]. Oven temperature was programmed from 190 °C to 350 °C at a rate of 5 °C/min and the carrier gas was hydrogen (5 mL/min). The injector and the detector were at 315 °C and 345 °C respectively.
For phospholipids, lipid extracts were analyzed by liquid chromatography mass spectrometry using an Agilent 1290 UPLC system coupled to a G6460 triple quadripole mass spectrometer (Agilent Technologies) and using MassHunter software for data acquisition and analysis. A Kinetex HILIC column (Phenomenex, 50 × 4.6 mm, 2.6 µm) was used for liquid chromatography separations. The column temperature was controlled at 40 °C. The mobile phase A was acetonitrile and phase B was 10 mM ammonium formate in water at pH 3.2. For Cer, PE, PC, SM: the gradient was as follows: from 10% to 30% B in 10 min; 10-12 min, 100% B; and then back to 10% B at 13 min for 2 min prior to the next injection. The flow rate of mobile phase was 0.3 mL/min and the injection volume was 2 µL. For PI, PS: the gradient was as follows: from 5% to 50% B in 10 min and then back to 5% B at 10.2 min for 9 min prior to the next injection. The flow rate of mobile phase was 0.8 mL/min and the injection volume was 5 µL. Electrospray ionization was performed in positive mode for Cer, PE, PC and SM analysis and in negative mode for PI and PS analysis. Needle voltage was set respectively at 4 kV and -3.5 kV. Analyses were performed in Selected Reaction Monitoring detection mode (SRM) using nitrogen as collision gas. Ion optics and collision energy were optimized for each lipid class. Finally, peak detection, integration and quantitative analysis were done using MassHunter Quantitative analysis software (Agilent Technologies).
4.9. Extraction and Analysis of Fatty Acids
Quantitative analysis of total conventional fatty acids (FAs, c10:0, c12:0, c14:0, c15:0, c16:0, c17:0, c18:0, c20:0, c22:0, c23:0, c24:0, c14:1w5, c15:1, c16:1w7, c18:1w9, c18:1w7, c20:1w9, c22:1w9, c24:1w9, c18:2w6, c18:3w6, c18:3w3, c20:2w6, c20:3w3, c20:3w6, c20:4w6, c20:5w3, c22:2w6, c22:6w3, c22:4w6) was achieved using TAG17 or TAG19 or TAG15 as internal standard. This method allows a relative quantification of esterified and free fatty acids. Lipids were extracted according to Bligh and Dyer [63] in dichloromethane/methanol/water (2.5:2.5:2, v/v/v), in the presence of the internal standards glyceryl trinonadecanoate (4 µg). The lipid extract was hydrolyzed in KOH (0.5 M in methanol) at 55 °C for 30 min, and transmethylated in boron trifluoride methanol solution 14% (SIGMA, 1 mL) and heptane (1 mL) at 80 °C for 1 h. After addition of water (1 mL) to the crude, FAs were extracted with heptane (3 mL), evaporated to dryness and dissolved in ethyl acetate (20 µL). FAs were analyzed by gas chromatography equipped with a FID on a Clarus 600 Perkin Elmer system using a Famewax RESTEK fused silica capillary columns (30 m × 0.32 mm i.d, 0.25 µm film thickness) [65]. Oven temperature was programmed from 100 °C to 250 °C at a rate of 6 °C/min and the carrier gas was hydrogen (1.5 mL/min). The injector and the detector were at 220 °C and 230 °C respectively.
4.10. Statistical Analysis
All results are presented as mean ± SEM. Statistical analyses were performed using Graphpad Prism 6.05. Comparison between two groups was performed using unpaired 2-tailed Student’s t test. Pearson correlation analysis was used to quantify relationships between variables of interest. Significant difference was assessed by a one-way ANOVA followed by a post hoc Fisher’s test for comparison between four or five groups (Figure 2, Figure 4 and Figure 6F). Two ways ANOVAs followed by Bonferroni’s multiple comparisons were used to assess effects at different time post treatment (Figure 6A and C). P-values less than 0.05 were considered significant.
5. Conclusions
In summary, the present work provides the first demonstration of a chalcone derivative capable of reducing both food intake and hepatic steatosis in a mouse model of obesity and MAFLD. Given that in obese subjects, insulin-resistant hypertrophic white adipocytes exhibit high elevated lipolysis, which explains the link between obesity and MAFLD, we cannot exclude that the reduction in food intake and overweight induced by TriMetChalc partly explain the amelioration of MAFLD. Although promising, these results need to be supplemented with additional studies which will clarify its mode of action and evaluate its action over longer treatment periods and/or in combination with other chalcones with protective effects on the liver.
Supplementary Materials
The following supporting information can be downloaded at the website of this paper posted on Preprints.org, Table S1: Detailed ceramides and sphingomyelins composition and quantification of liver extracts from vehicle or TriMetChalc (65 mg/kg BW) treated ob/ob mice.
Author Contributions
SG, AA, RB, ADM, MR, AL and JDT performed experiments. ADM, MR and AL contributed to trimetchal synthesis. AL and JDT designed the study. SG, AA, RB, MR, AL and JDT analyzed the data. JDT wrote the manuscript. All authors revised and approved the MS.
Funding
This work was supported by funding provided by CAYLAB CRO and Dominique NGUYEN.
Institutional Review Board Statement
Experiments carried out in this study were performed in strict accordance with European Economic Community guidelines (86/609/EEC) and the local committees’ recommendations (C-13-055-6, Aix-Marseille University) for the care and use of laboratory animals. Project authorizations are referenced under the numbers: #23133-2019110610027079 and #37509-2022050912435969.
Acknowledgments
The authors thank the MetaToul-Lipidomique (I2MC, Inserm, Toulouse, France), MetaboHUB-ANR-11-INBS-0010 for lipidomic analysis. The authors are also grateful to the staff of the CRPN research animal support facility.
Conflicts of Interest
Maxime Robin and Anh-Tuan Lormier are founders and directors of the CayLab compagny. The remaining authors declare no conflict of interest specific for this research.
References
- WHO. World Health Organization. Obesity and Overweight. 2016. Available online: https://www.who.int/news-room/fact-sheets/de- 854tail/obesity-and-overweight.
- Mitra, S.; De, A.; Chowdhury, A. Epidemiology of non-alcoholic and alcoholic fatty liver diseases. Transl. Gastroenterol. Hepatol. 2020, 5, 16. [Google Scholar] [CrossRef] [PubMed]
- Heeren, J.; Scheja, L. Metabolic-associated fatty liver disease and lipoprotein metabolism. Mol. Metab. 2021, 50, 101238. [Google Scholar] [CrossRef] [PubMed]
- Eslam, M.; Newsome, P.N.; Sarin, S.K.; Anstee, Q.M.; Targher, G.; Romero-Gomez, M.; Zelber-Sagi, S.; Wong, V.W.S.; Dufour, J.F.; Schattenberg, J.M.; et al. A new definition for metabolic dysfunction-associated fatty liver disease: An international expert consensus statement. J. Hepatol. 2020, 73, 202–209. [Google Scholar] [CrossRef] [PubMed]
- Gofton, C.; Upendran, Y.; Zheng, M.H.; George, J. MAFLD: How is it different from NAFLD? Clin. Mol. Hepatol. 2023, 29, S17–S31. [Google Scholar] [CrossRef] [PubMed]
- Younossi, Z.M.; Koenig, A.B.; Abdelatif, D.; Fazel, Y.; Henry, L.; Wymer, M. Global epidemiology of nonalcoholic fatty liver disease: Meta-analytic assessment of prevalence, incidence, and outcomes. Hepatology 2016, 64, 73–84. [Google Scholar] [CrossRef] [PubMed]
- Liu, J.; Ayada, I.; Zhang, X.; Wang, L.; Li, Y.; Wen, T.; Ma, Z.; Bruno, M.J.; de Knegt, R.J.; Cao, W.; et al. Estimating Global Prevalence of Metabolic Dysfunction-Associated Fatty Liver Disease in Overweight or Obese Adults. Clin. Gastroenterol. Hepatol. 2022, 20, e573–e582. [Google Scholar] [CrossRef] [PubMed]
- Fabbrini, E.; Sullivan, S.; Klein, S. Obesity and nonalcoholic fatty liver disease: Biochemical, metabolic, and clinical implications. Hepatology 2010, 51, 679–689. [Google Scholar] [CrossRef] [PubMed]
- Karimi-Sales, E.; Mohaddes, G.; Alipour, M.R. Chalcones as putative hepatoprotective agents: Preclinical evidence and molecular mechanisms. Pharmacol. Res. 2018, 129, 177–187. [Google Scholar] [CrossRef] [PubMed]
- Mai, T.T.; Chuyen, N.V. Anti-hyperglycemic activity of an aqueous extract from flower buds of Cleistocalyx operculatus (Roxb.) Merr and Perry. Biosci. Biotechnol. Biochem. 2007, 71, 69–76. [Google Scholar] [CrossRef]
- Hu, Y.C.; Zhang, Z.; Shi, W.G.; Mi, T.Y.; Zhou, L.X.; Huang, N.; Hoptroff, M.; Lu, Y.H. 2′,4′-dihydroxy-6′-methoxy-3′,5′-dimethylchalcone promoted glucose uptake and imposed a paradoxical effect on adipocyte differentiation in 3T3-L1 cells. J. Agric. Food. Chem. 2014, 62, 1898–1904. [Google Scholar] [CrossRef]
- Choi, J.W.; Kim, M.; Song, H.; Lee, C.S.; Oh, W.K.; Mook-Jung, I.; Chung, S.S.; Park, K.S. DMC (2’,4’-dihydroxy-6’-methoxy-3’,5’-dimethylchalcone) improves glucose tolerance as a potent AMPK activator. Metabolism. 2016, 65, 533–542. [Google Scholar] [CrossRef] [PubMed]
- Benny, F.; Kumar, S.; Binu, A.; Parambi, D.G.T.; Alsahli, T.G.; Al-Sehemi, A.G.; Chandran, N.; Manisha, D.S.; Sreekumar, S.; Bhatt, A.; et al. Targeting GABA receptors with chalcone derivative compounds, what is the evidence? Expert Opin. Ther. Targets 2023, 27, 1257–1269. [Google Scholar] [CrossRef] [PubMed]
- Dadi, V.; Malla, R.R.; Siragam, S. Natural and Synthetic Chalcones: Potential Impact on Breast Cancer. Crit. Rev. Oncog. 2023, 28, 27–40. [Google Scholar] [CrossRef] [PubMed]
- Nematollahi, M.H.; Mehrabani, M.; Hozhabri, Y.; Mirtajaddini, M.; Iravani, S. Antiviraland antimicrobial applications of chalcones and their derivatives: From nature to greener synthesis. Heliyon 2023, 9, e20428. [Google Scholar] [CrossRef] [PubMed]
- Trak-Smayra, V.; Paradis, V.; Massart, J.; Nasser, S.; Jebara, V.; Fromenty, B. Pathology of the liver in obese and diabetic ob/ob and db/db mice fed a standard or high-calorie diet. Int. J. Exp. Pathol. 2011, 92, 413–421. [Google Scholar] [CrossRef] [PubMed]
- Parlati, L.; Régnier, M.; Guillou, H.; Postic, C. New targets for NAFLD. JHEP Rep. 2021, 3, 100346. [Google Scholar] [CrossRef] [PubMed]
- Roth, C.L.; McCormack, S.E. Acquired hypothalamic obesity: A clinical overview and update. Diabetes Obes. Metab. 2024, 26, 34–45. [Google Scholar] [CrossRef] [PubMed]
- Porter, M.H.; Arnold, M.; Langhans, W. Lipopolysaccharide-induced anorexia following hepatic portal vein and vena cava administration. Physiol. Behav. 1998, 64, 581–584. [Google Scholar] [CrossRef]
- Girardet, C.; Bonnet, M.S.; Jdir, R.; Sadoud, M.; Thirion, S.; Tardivel, C.; Roux, J.; Lebrun, B.; Wanaverbecq, N.; Mounien, L.; et al. The food-contaminant deoxynivalenol modifies eating by targeting anorexigenic neurocircuitry. PLoS ONE 2011, 6, e26134. [Google Scholar] [CrossRef]
- Brüning, J.C.; Fenselau, H. Integrative neurocircuits that control metabolism and food intake. Science 2023, 381, eabl7398. [Google Scholar] [CrossRef]
- Guillebaud, F.; Duquenne, M.; Djelloul, M.; Pierre, C.; Poirot, K.; Roussel, G.; Riad, S.; Lanfray, D.; Morin, F.; Jean, A.; et al. Glial Endozepines Reverse High-Fat Diet-Induced Obesity by Enhancing Hypothalamic Response to Peripheral Leptin. Mol. Neurobiol. 2020, 57, 3307–3333. [Google Scholar] [CrossRef] [PubMed]
- Gaige, S.; Barbouche, R.; Barbot, M.; Boularand, S.; Dallaporta, M.; Abysique, A.; Troadec, J.D. Constitutively active microglial populations limit anorexia induced by the food contaminant deoxynivalenol. J. Neuroinflammation 2022, 19, 280. [Google Scholar] [CrossRef] [PubMed]
- Xue, B.; Kahn, B.B. AMPK integrates nutrient and hormonal signals to regulate food intake and energy balance through effects in the hypothalamus and peripheral tissues. J. Physiol. 2006, 574, 73–83. [Google Scholar] [CrossRef] [PubMed]
- Minokoshi, Y.; Alquier, T.; Furukawa, N.; Kim, Y.B.; Lee, A.; Xue, B.; Mu, J.; Foufelle, F.; Ferré, P.; Birnbaum, M.J.; et al. AMP-kinase regulates food intake by responding to hormonal and nutrient signals in the hypothalamus. Nature 2004, 428, 569–574. [Google Scholar] [CrossRef] [PubMed]
- López, M. Hypothalamic AMPK and energy balance. Eur. J. Clin. Invest. 2018, 48, e12996. [Google Scholar] [CrossRef] [PubMed]
- Lee, J.S.; Chun, H.C.; Choi, J.Y.; Park, K.S.; Chung, S.S.; Park, K. Synthesis of 2′,4′,6′-trimethoxy-3′,5′-dimethylchalcone derivatives and their anti-diabetic and anti-atherosclerosis effect. Journal of Industrial and Engineering Chemistry 2023, 128, 268–274. [Google Scholar] [CrossRef]
- Hsieh, C.T.; Chang, F.R.; Tsai, Y.H.; Wu, Y.C.; Hsieh, T.J. 2-Bromo-4’-methoxychalcone and 2-Iodo-4’-methoxychalcone Prevent Progression of Hyperglycemia and Obesity via 5’-Adenosine-Monophosphate-Activated Protein Kinase in Diet-Induced Obese Mice. Int. J. Mol. Sci. 2018, 19, 2763. [Google Scholar] [CrossRef]
- Ludwig, J.; Viggiano, T.R.; McGill, D.B.; Oh, B.J. Nonalcoholic steatohepatitis: Mayo Clinic experiences with a hitherto unnamed disease. Mayo Clin. Proc. 1980, 55, 434–438. [Google Scholar] [PubMed]
- Samy, A.M.; Kandeil, M.A.; Sabry, D.; Abdel-Ghany, A.A.; Mahmoud, M.O. From NAFLD to NASH: Understanding the spectrum of non-alcoholic liver diseases and their consequences. Heliyon 2024, 10, e30387. [Google Scholar] [CrossRef]
- Yu, W.G.; Qian, J.; Lu, Y.H. Hepatoprotective effects of 2’,4’-dihydroxy-6’-methoxy-3’,5’-dimethylchalcone on CCl4-induced acute liver injury in mice. J. Agric. Food Chem. 2011, 59, 12821–12829. [Google Scholar] [CrossRef]
- Hliwa, A.; Ramos-Molina, B.; Laski, D.; Mika, A.; Sledzinski, T. The role of fatty acids in non-alcoholic fatty liver disease progression: An Update. Int. J. Mol. Sci. 2021, 22, 6900. [Google Scholar] [CrossRef] [PubMed]
- Malhi, H.; Bronk, S.F.; Werneburg, N.W.; Gores, G.J. Free fatty acids induce JNK-dependent hepatocyte lipoapoptosis. J. Biol. Chem. 2006, 281, 12093–12101. [Google Scholar] [CrossRef] [PubMed]
- Malhi, H.; Gores, G.J. Molecular mechanisms of lipotoxicity in nonalcoholic fatty liver disease. Semin. Liver Dis. 2008, 28, 360–369. [Google Scholar] [CrossRef] [PubMed]
- Miura, K.; Yang, L.; van Rooijen, N.; Brenner, D.A.; Ohnishi, H.; Seki, E. Toll-likereceptor 2 and palmitic acid cooperatively contribute to the development of nonalcoholic steatohepatitis through inflammasome activation in mice. Hepatology 2013, 57, 577–589. [Google Scholar] [CrossRef] [PubMed]
- Lottenberg, A.M.; Afonso Mda, S.; Lavrador, M.S.; Machado, R.M.; Nakandakare, E.R. The role of dietary fatty acids in the pathology of metabolic syndrome. J. Nutr. Biochem. 2012, 23, 1027–1040. [Google Scholar] [CrossRef] [PubMed]
- Wang, X.; Cao, Y.; Fu, Y.; Guo, G.; Zhang, X. Liver fatty acid composition in mice with or without nonalcoholic fatty liver disease. Lipids Health Dis. 2011, 10, 234. [Google Scholar] [CrossRef] [PubMed]
- Puri, P.; Baillie, R.A.; Wiest, M.M.; Mirshahi, F.; Choudhury, J.; Cheung, O.; Sargeant, C.; Contos, M.J.; Sanyal, A.J. A lipidomic analysis of nonalcoholic fatty liver disease. Hepatology 2007, 46, 1081–1090. [Google Scholar] [CrossRef] [PubMed]
- Spooner, M.H.; Jump, D.B. Omega-3 fatty acids and nonalcoholic fatty liver disease in adults and children: Where do we stand? Curr. Opin. Clin. Nutr. Metab. Care 2019, 22, 103–110. [Google Scholar] [CrossRef] [PubMed]
- Musso, G.; Cassader, M.; Paschetta, E.; Gambino, R. Bioactive lipid species and metabolic pathways in progression and resolution of nonalcoholic steatohepatitis. Gastroenterology 2018, 155, 282–302.e8. [Google Scholar] [CrossRef]
- Yan, D.; Dou, Q.L.; Wang, Z.; Wei, Y.Y. Establishment of a hepatocyte steatosis model using Chang liver cells. Genet. Mol. Res. 2015, 14, 15224–15232. [Google Scholar] [CrossRef]
- Hu, J.; Hong, W.; Yao, K.N.; Zhu, X.H.; Chen, Z.Y.; Ye, L. Ursodeoxycholic acid ameliorates hepatic lipid metabolism in LO2 cells by regulating the AKT/mTOR/SREBP-1 signaling pathway. World J. Gastroenterol. 2019, 25, 1492–1501. [Google Scholar] [CrossRef] [PubMed]
- Akazawa, Y.; Cazanave, S.; Mott, J.L.; Elmi, N.; Bronk, S.F.; Kohno, S.; Charlton, M.R.; Gores, G.J. Palmitoleate attenuates palmitate-induced Bim and PUMA upregulation and hepatocyte lipoapoptosis. J. Hepatol. 2010, 52, 586–593. [Google Scholar] [CrossRef] [PubMed]
- Listenberger, L.L.; Han, X.; Lewis, S.E.; Cases, S.; Farese Jr, R.V.; Ory, D.S.; Schaffer, J.E. Triglyceride accumulation protects against fatty acid-induced lipotoxicity. Proc. Natl. Acad. Sci. USA 2003, 100, 3077–3082. [Google Scholar] [CrossRef] [PubMed]
- Kurikawa, N.; Takagi, T.; Wakimoto, S.; Uto, Y.; Terashima, H.; Kono, K.; Ogata, T.; Ohsumi, J. A novel inhibitor of stearoyl-CoA desaturase-1 attenuates hepatic lipid accumulation, liver injury and inflammation in model of nonalcoholic steatohepatitis. Biol. Pharm. Bull. 2013, 36, 259–267. [Google Scholar] [CrossRef] [PubMed]
- Uto, Y. Recent progress in the discovery and development of stearoyl CoA desaturase inhibitors. Chem. Phys. Lipids 2016, 197, 3–12. [Google Scholar] [CrossRef] [PubMed]
- Nobili, V.; Alisi, A.; Musso, G.; Scorletti, E.; Calder, P.C.; Byrne, C.D. Omega-3 fatty acids: Mechanisms of benefit and therapeutic effects in pediatric and adult NAFLD. Crit. Rev. Clin. Lab. Sci. 2016, 53, 106–120. [Google Scholar] [CrossRef] [PubMed]
- Chiappini, F.; Coilly, A.; Kadar, H.; Gual, P.; Tran, A.; Desterke, C.; Samuel, D.; Duclos-Vallée, J.C.; Touboul, D.; Bertrand-Michel, J.; et al. Metabolism dysregulation induces a specific lipid signature of nonalcoholic steatohepatitis in patients. Sci. Rep. 2017, 7, 1–17. [Google Scholar] [CrossRef]
- Schaefer, E.J. Lipoproteins, nutrition, and heart disease. Am. J. Clin. Nutr. 2002, 75, 191–212. [Google Scholar] [CrossRef] [PubMed]
- Yu, L.; Yuan, M.; Wang, L. The effect of Omega-3 unsaturated fatty acids on non-alcoholic fatty liver disease: A systematic review and meta-analysis of RCTs. Pak. J. Med. Sci. 2017, 33, 1022–1028. [Google Scholar] [CrossRef]
- Figueiredo, P.S.; Carla Inada, A.; Marcelino, G.; Maiara Lopes Cardozo, C.; de Cássia Freitas, K.; de Cássia Avellaneda Guimarães, R.; Pereira de Castro, A.; Aragão do Nascimento, V.; Aiko Hiane, P. Fatty acids consumption: The role metabolic aspects involved in obesity and its associated disorders. Nutrients 2017, 22, 1158. [Google Scholar] [CrossRef]
- Diraison, F.; Moulin, P.; Beylot, M. Contribution of hepatic de novo lipogenesis and reesterification of plasma non esterified fatty acids to plasma triglyceride synthesis during non-alcoholic fatty liver disease. Diabetes Metab. 2003, 29, 478–485. [Google Scholar] [CrossRef] [PubMed]
- Hudgins, L.C.; Hellerstein, M.; Seidman, C.; Neese, R.; Diakun, J.; Hirsch, J. Human fatty acid synthesis is stimulated by a eucaloric low fat, high carbohydrate diet. J. Clin. Invest. 1996, 97, 2081–2091. [Google Scholar] [CrossRef] [PubMed]
- Hayakawa, J.; Wang, M.; Wang, C.; Han, R.H.; Jiang, Z.Y.; Han, X. Lipidomic analysis reveals significant lipogenesis and accumulation of lipotoxic components in ob/ob mouse organs. Prostaglandins Leukot. Essent. Fatty Acids 2018, 136, 161–169. [Google Scholar] [CrossRef] [PubMed]
- Fu, S.; Yang, L.; Li, P.; Hofmann, O.; Dicker, L.; Hide, W.; Lin, X.; Watkins, S.M.; Ivanov, A.R.; Hotamisligil, G.S. Aberrant lipid metabolism disrupts calcium homeostasis causing liver endoplasmic reticulum stress in obesity. Nature 2011, 473, 528–531. [Google Scholar] [CrossRef] [PubMed]
- Ling, J.; Chaba, T.; Zhu, L.F.; Jacobs, R.L.; Vance, D.E. Hepatic ratio of phosphatidylcholine to phosphatidylethanolamine predicts survival after partial hepatectomy in mice. Hepatology 2012, 55, 1094–1102. [Google Scholar] [CrossRef] [PubMed]
- van der Veen, J.N.; Kennelly, J.P.; Wan, S.; Vance, J.E.; Vance, D.E.; Jacobs, R.L. The critical role of phosphatidylcholine and phosphatidylethanolamine metabolism in health and disease. Biochim. Biophys. Acta BBA Biomembr. 2017, 1859, 1558–1572. [Google Scholar] [CrossRef] [PubMed]
- Perfield 2nd, J.W.; Ortinau, L.C.; Pickering, R.T.; Ruebel, M.L.; Meers, G.M.; Rector, R.S. Altered hepatic lipid metabolism contributes to nonalcoholic fatty liver disease in leptin-deficient Ob/Ob mice. J. Obes. 2013, 296537. [Google Scholar] [CrossRef] [PubMed]
- Babu, A.V.; Rambabu, A.; Giriprasad, P.V.; Rao, R.S.C.; Babu, B.H. Synthesis of (±)-Pisonivanone and Other Analogs as Potent Antituberculosis Agents. J. Chem. 2012, 2013, 961201. [Google Scholar] [CrossRef]
- Anandam, R.; Jadav, S.S.; Ala, V.B.; Ahsan, M.J.; Bollikolla, H.B. Synthesis of new C-dimethylated chalcones as potent antitubercular agents. Med. Chem. Res. 2018, 27, 1690–1704. [Google Scholar] [CrossRef]
- Jung, J.W.; Damodar, K.; Kim, J.K.; Jun, J.G. First synthesis and in vitro biological assessment of isosideroxylin, 6,8-dimethylgenistein and their analogues as nitric oxide production inhibition agents. Chin. Chem. Lett. 2017, 28, 1114–1118. [Google Scholar] [CrossRef]
- Barbouche, R.; Gaigé, S.; Airault, C.; Poirot, K.; Dallaporta, M.; Troadec, J.D.; Abysique, A. The food contaminant deoxynivalenol provokes metabolic impairments resulting in non-alcoholic fatty liver (NAFL) in mice. Sci. Rep. 2020, 10, 12072. [Google Scholar] [CrossRef] [PubMed]
- Bligh, E.G.; Dyer, W.J. A rapid method of total lipid extraction and purification. Can. J. Biochem. Physiol. 1959, 37, 911–917. [Google Scholar] [CrossRef] [PubMed]
- Barrans, A.; Collet, X.; Barbaras, R.; Jaspard, B.; Manent, J.; Vieu, C.; Chap, H.; Perret, B. Hepatic lipase induces the formation of pre-beta 1 high density lipoprotein (HDL) from triacylglycerol-rich HDL2. A study comparing liver perfusion to in vitro incubation with lipases. J. Biol. Chem. 1994, 269, 11572–11577. [Google Scholar] [CrossRef] [PubMed]
- Lillington, J.M.; Trafford, D.J.; Makin, H.L. A rapid and simple method for the esterification of fatty acids and steroid carboxylic acids prior to gas-liquid chromatography. Clin. Chim. Acta. 1981, 111, 91–98. [Google Scholar] [CrossRef] [PubMed]
Figure 2.
TriMetChalc reduced Food Intake. (A,B) Cumulative food intake measured over a 24 h period in C57Bl/6J mice per os administered with vehicle or TriMetChalc (6.5 to 650 mg/kg BW). In B, the dark period is represented by a shaded box. * p < 0.05, ** p < 0.01, *** p < 0.001, significantly different from vehicle-treated mice. (C) Kaolin intake measured in C57Bl/6 mice 24 h after vehicle, TriMetChalc (65 to 650 mg/kg BW) or LiCl (150 mg/kg BW) administration. * p < 0.05 and significant difference from vehicle-treated mice.
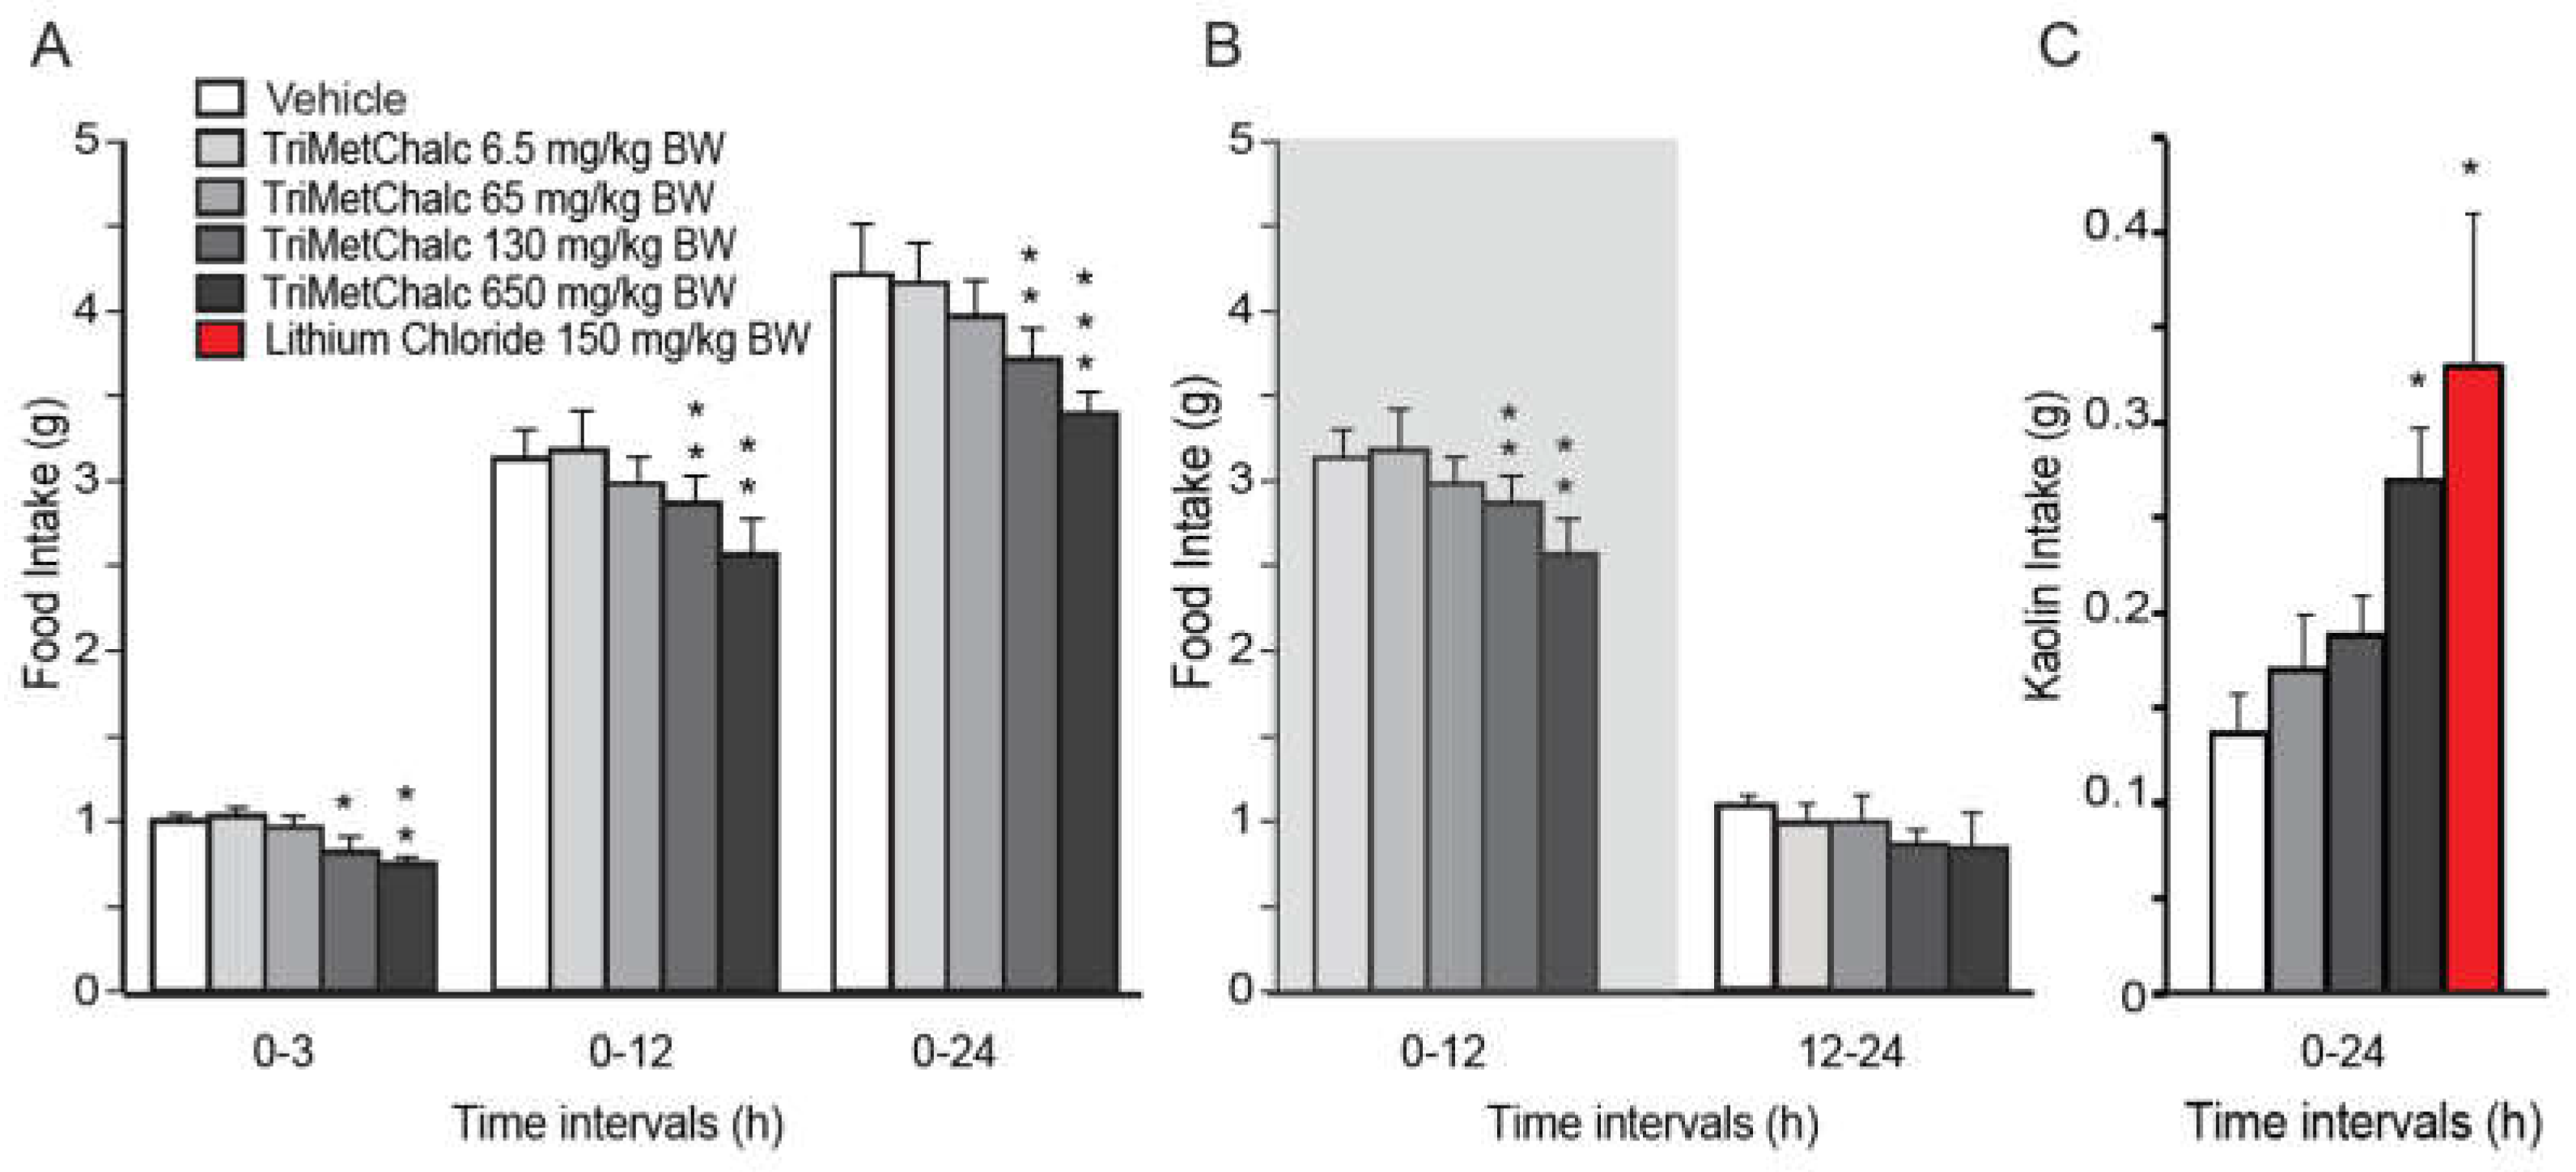
Figure 3.
Identification of TriMetChalc-sensitive brain structures in C57Bl/6J mice. (A,C) Representative coronal sections illustrating the c-Fos labeling observed within brainstem (A) and hypothalamic (C) regions of C57Bl/6J mice treated with vehicle (left panel) or animals sacrificed 3 h (right panel) after per os treatment with TriMetChalc (130 mg/kg BW). Scale bar: 200 µm. (B,D) Quantification of the number of c-Fos-immunoreactive nuclei observed within the brainstem (B) and hypothalamic (D) structures 3 h after treatment with either vehicle or TriMetChalc (130 mg/kg BW). ** p < 0.01, *** p < 0.001 significantly different from vehicle-treated mice. AP, area postrema; ARC, arcuate nucleus; cc, central canal; ME, median eminence; NTS, nucleus tractus solitarii; PVN, paraventricular nucleus; VMH: ventromedial hypothalamus; X, dorsal motor nucleus of the vagus nerve; 3V, third ventricle; 4, fourth ventricle.
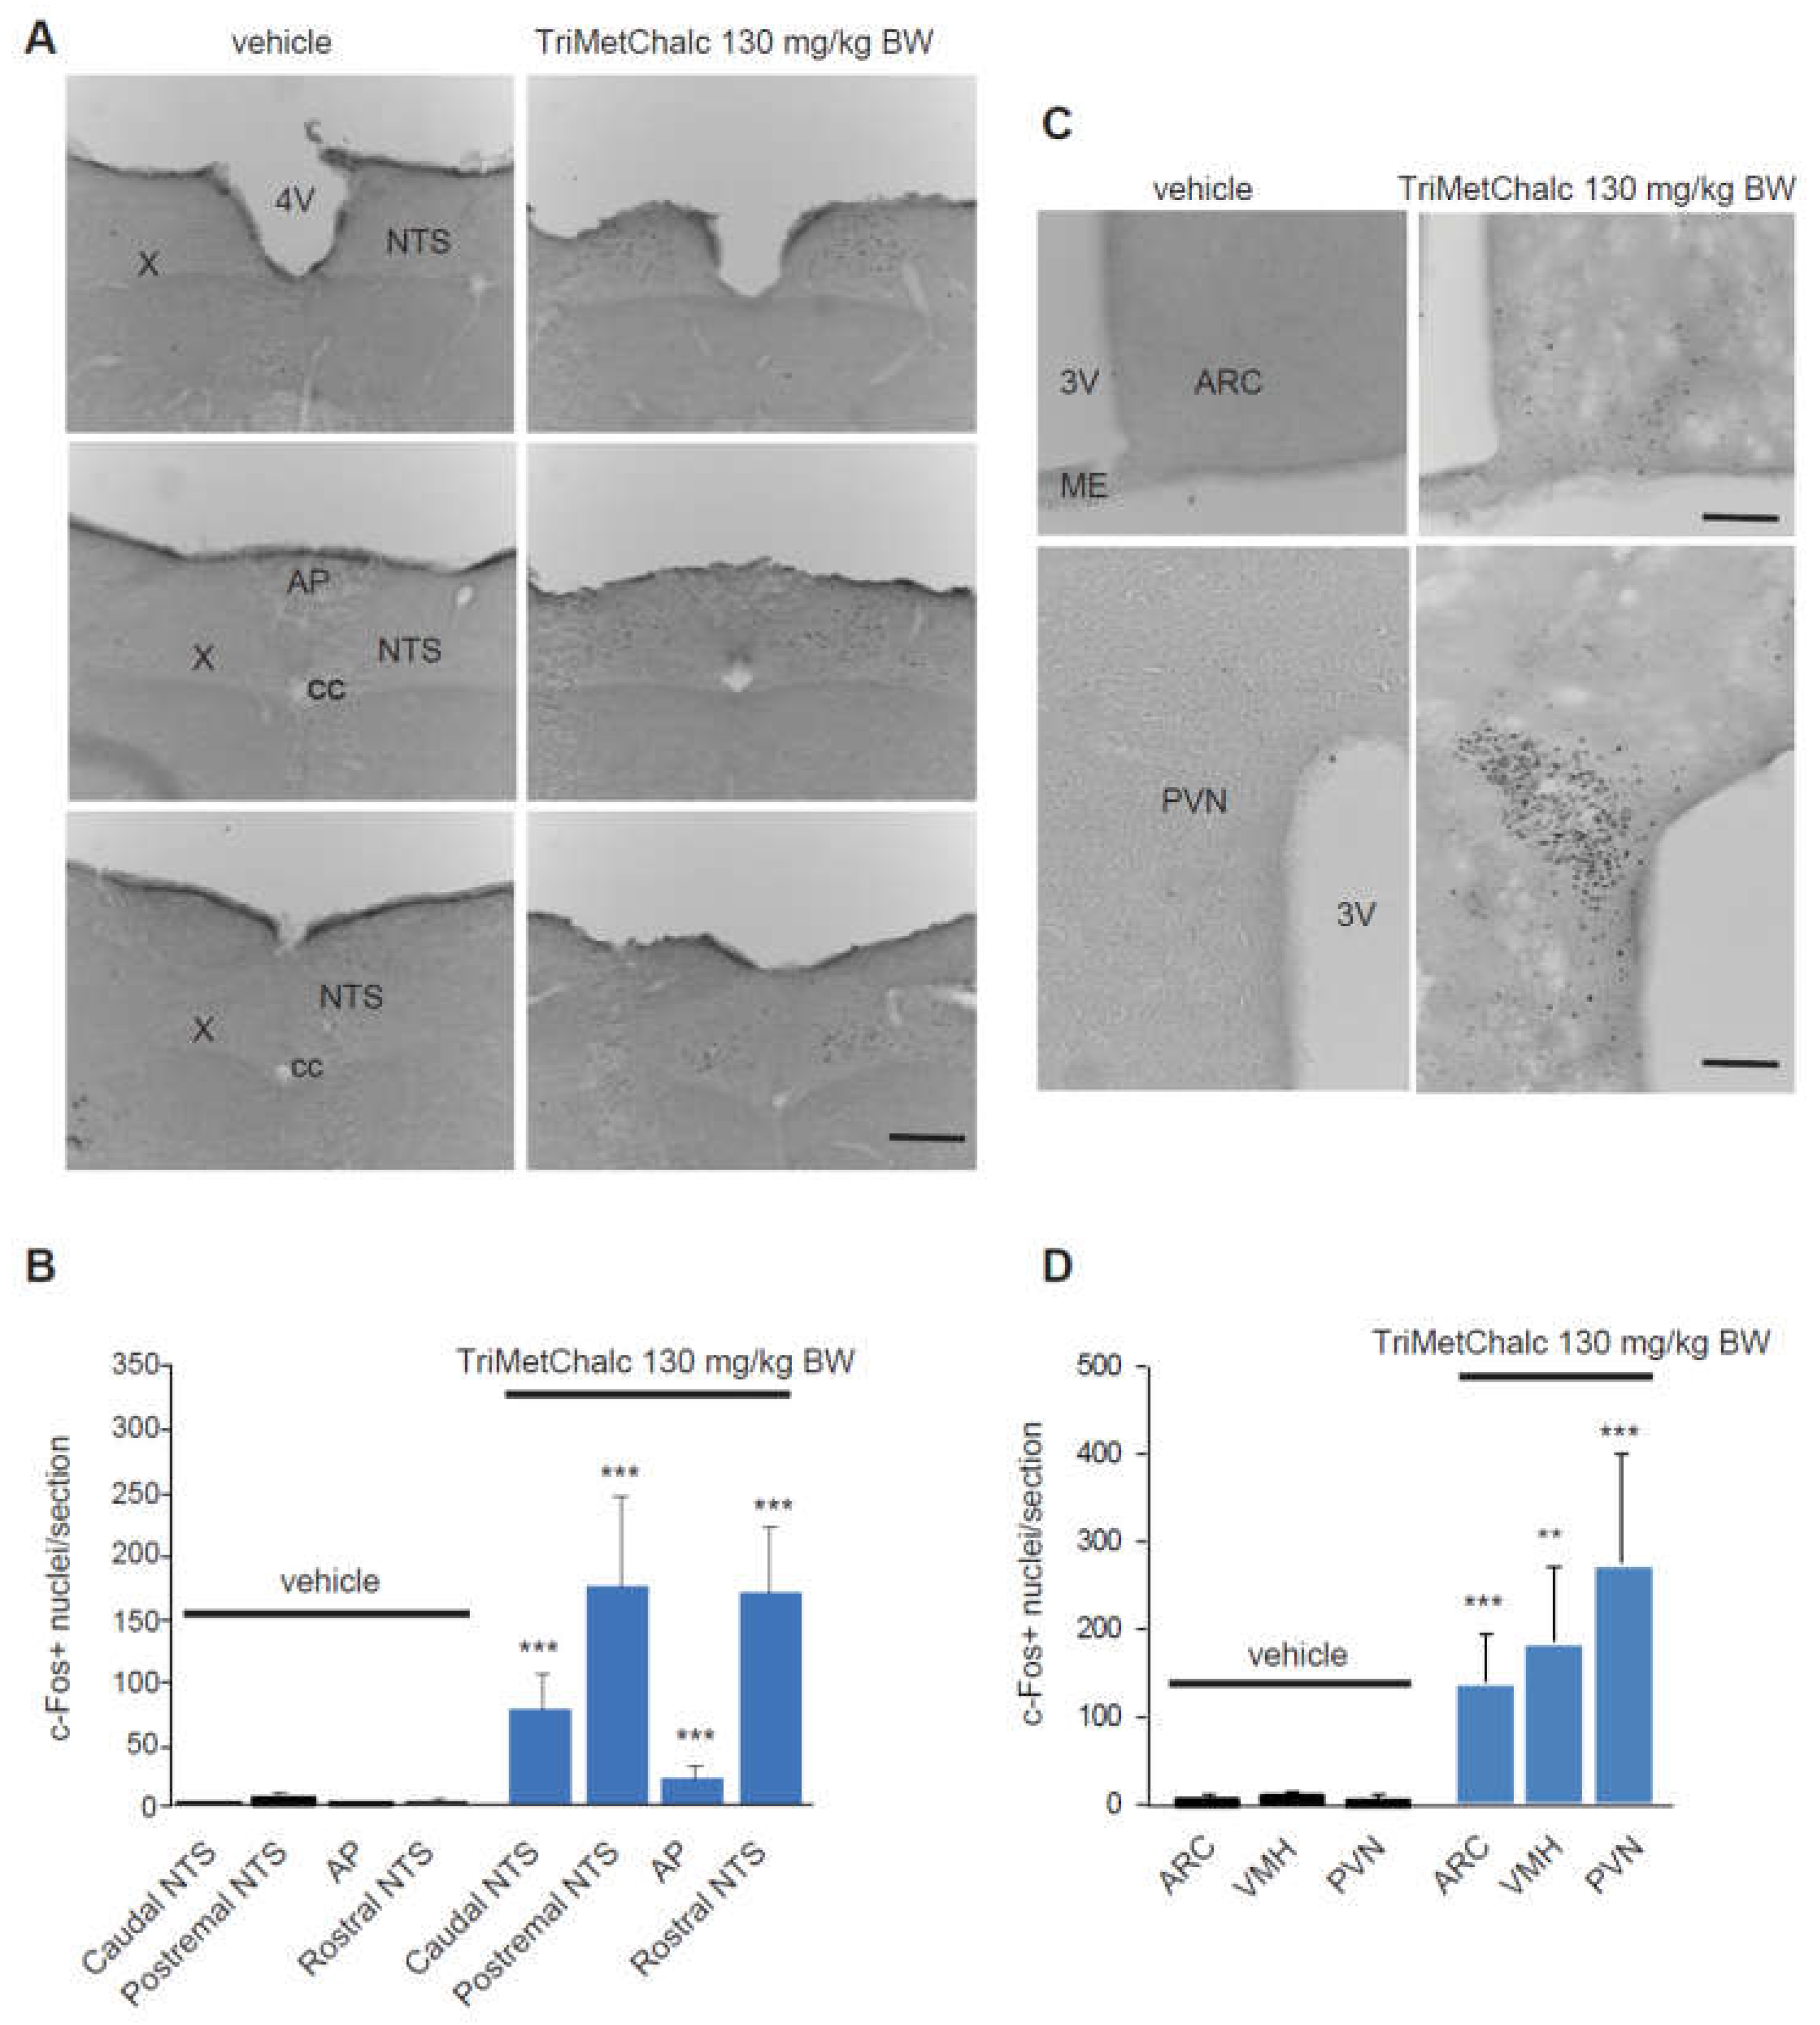
Figure 4.
TriMetChalc reduced Food Intake in ob/ob mice. (A,B) Cumulative food intake measured over a 24 h period in ob/ob mice per os administered with vehicle or TriMetChalc (6.5 to 650 mg/kg BW). In B, the dark period is represented by a shaded box. * p < 0.05, ** p < 0.01, *** p < 0.001, significantly different from vehicle-treated mice. (C) Kaolin intake measured in ob/ob mice 24 h after vehicle, TriMetChalc (65 to 650 mg/kg BW) or LiCl (150 mg/kg BW) administration. * p < 0.05 significant difference from vehicle-treated mice.
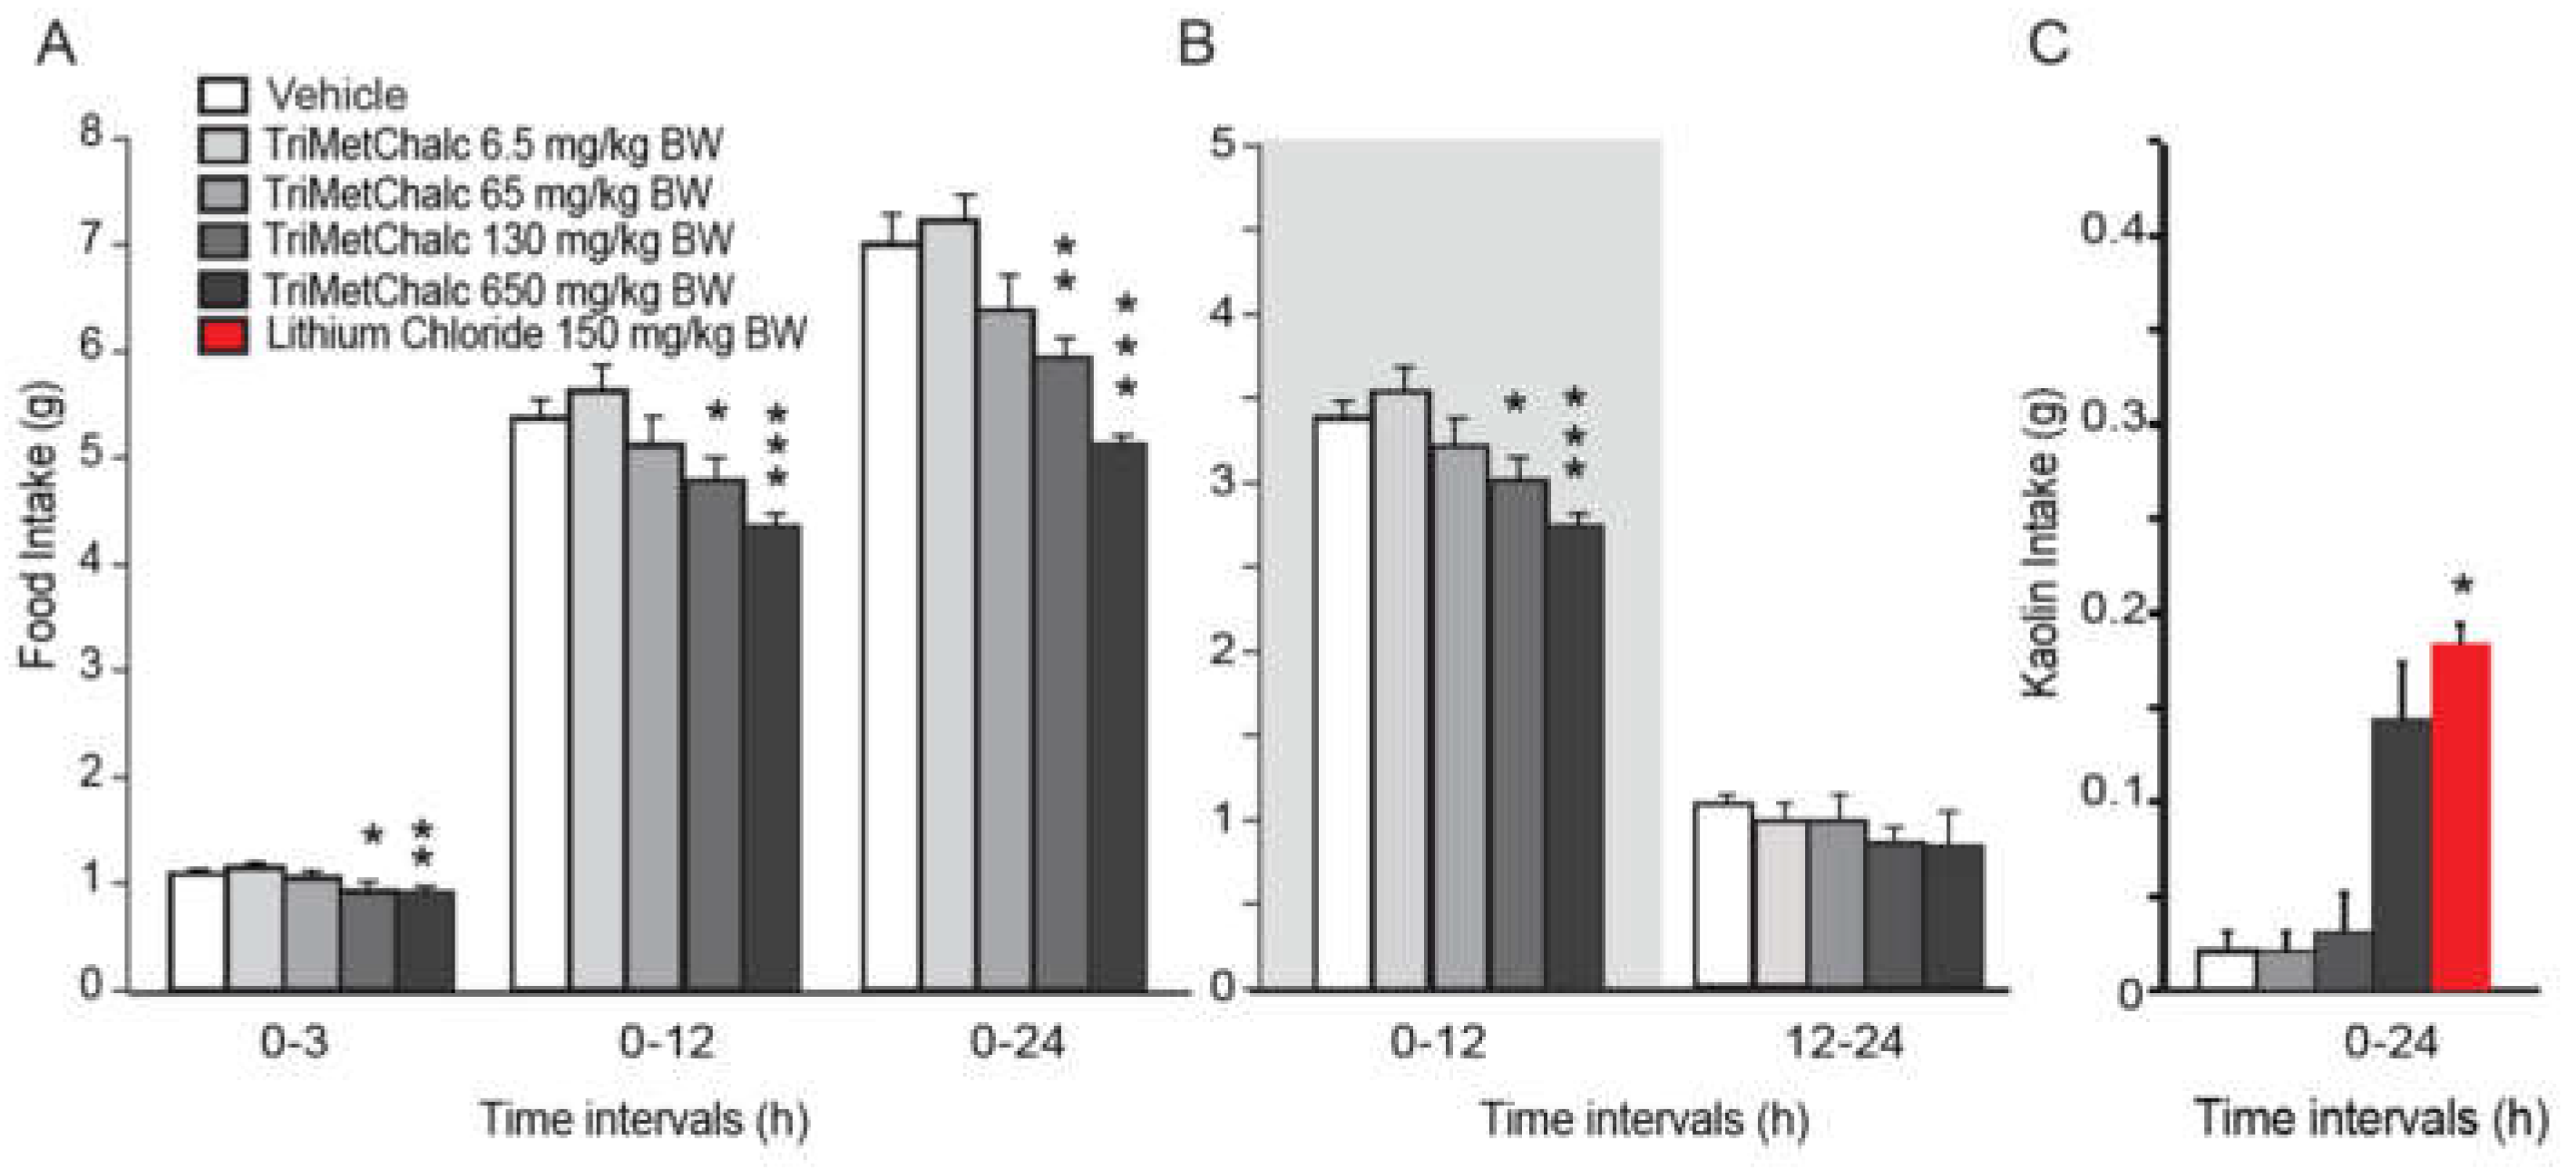
Figure 5.
Identification of TriMetChalc-sensitive brain structures in ob/ob mice. (A,B) Representative coronal sections illustrating the c-Fos labeling observed within brainstem (A) and hypothalamic (B) regions of ob/ob mice treated with vehicle or animals sacrificed 3 h after treatment with TriMetChalc (130 mg/kg BW). Scale bar: 200 µm. (C,D) Quantification of the number of c-Fos-immunoreactive nuclei observed within the brainstem (C) and hypothalamic (D) structures 3 h after treatment with either vehicle or TriMetChalc (130 mg/kg BW). *** p < 0.001, significantly different from vehicle-treated mice. AP, area postrema; ARC, arcuate nucleus; cc, central canal; ME, median eminence; NTS, nucleus tractus solitarii; PVN, paraventricular nucleus; VMH: ventromedial hypothalamus; X, dorsal motor nucleus of the vagus nerve; 3V, third ventricle.
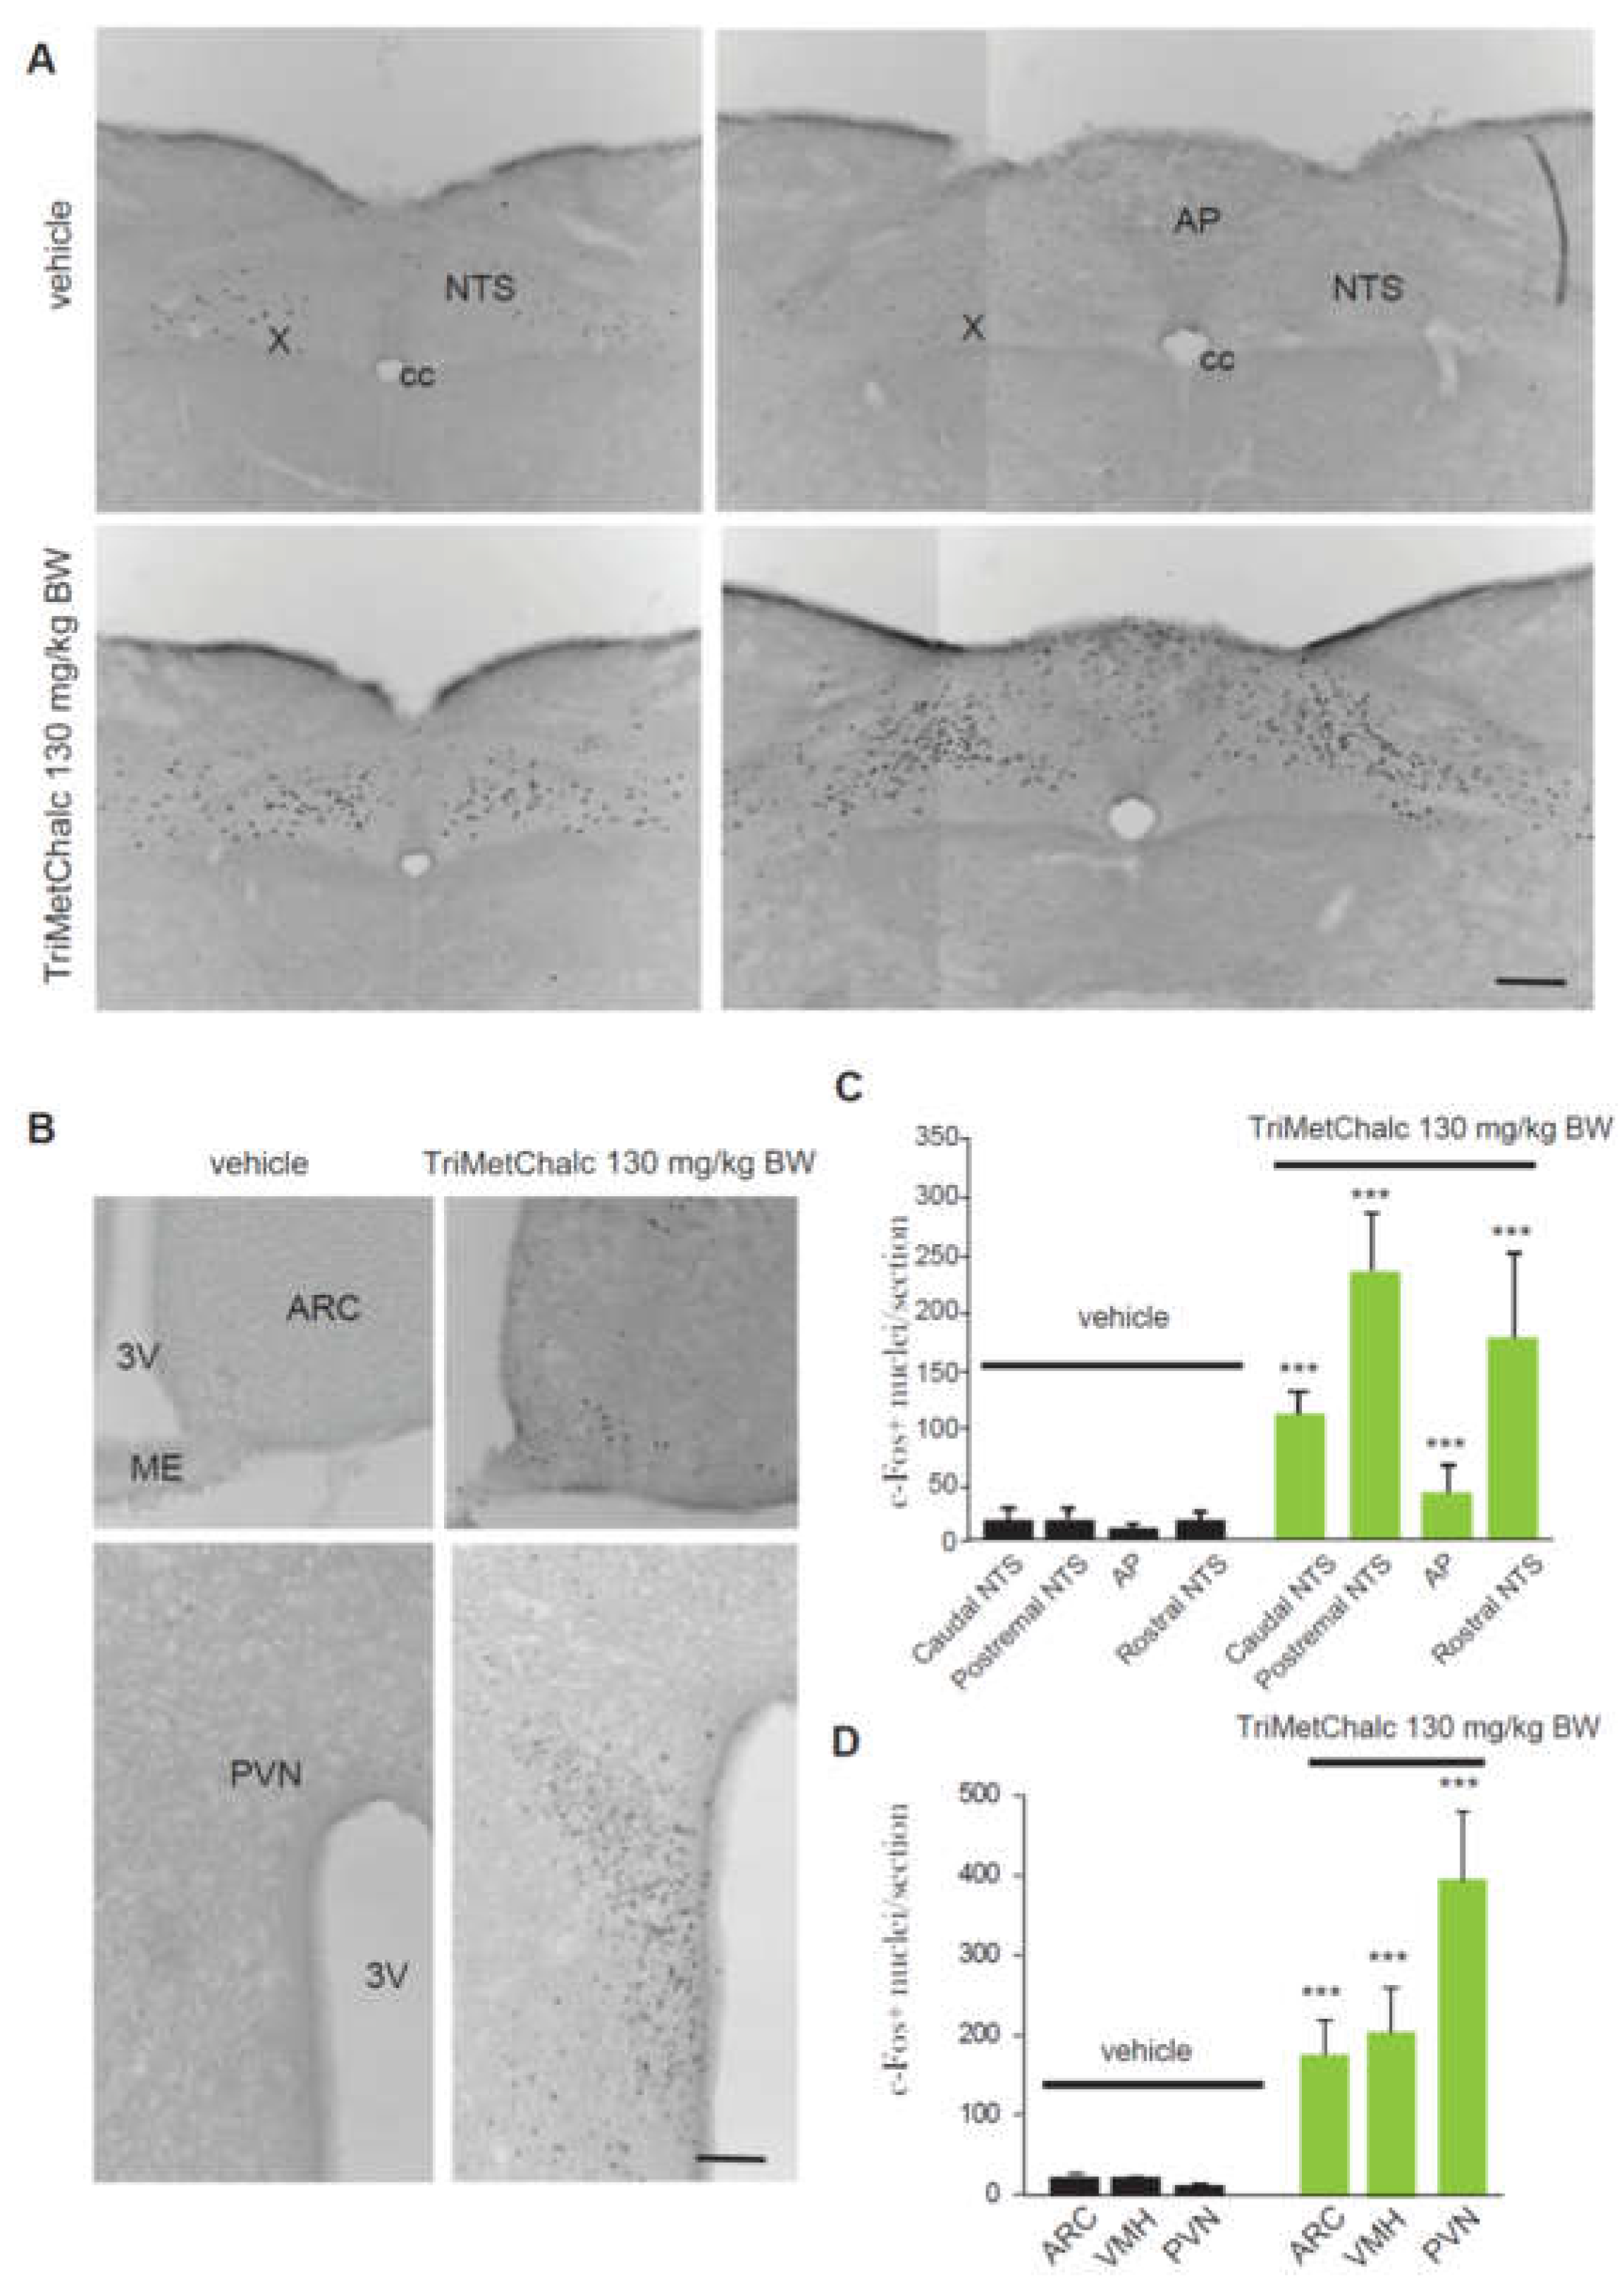
Figure 6.
Chronic TriMetChalc administration reduces leptin dependent obesity. (A) Body weight measured from day 0 to 21 after per os administration of either saline or TriMetChalc (65 mg/kg BW) in ob/ob mice. The dashed line indicates the first day of treatment. (B) Final body weight measured on day 21 after per os administration of vehicle or TriMetChalc (65 mg/kg BW) in ob/ob mice. * p < 0.05, ** p < 0.01, significantly different from vehicle-treated mice. (C,D) Daily food intake (C) and cumulative food intake (D) measured from day 0 to 21 following administration of either vehicle or TriMetChalc (65 mg/kg BW) in ob/ob mice ** p < 0.01, *** p < 0.001 significantly different from vehicle-treated mice. (E) Oral glucose tolerance test using per os glucose administration (1.5 g/kg) performed before and after a 21-day period of vehicle or TriMetChalc (65 mg/kg BW) administration in ob/ob mice. (F) Quantification of area under the curves (AUC) measured at 120 min after per os glucose administration., significantly different from vehicle-treated mice.
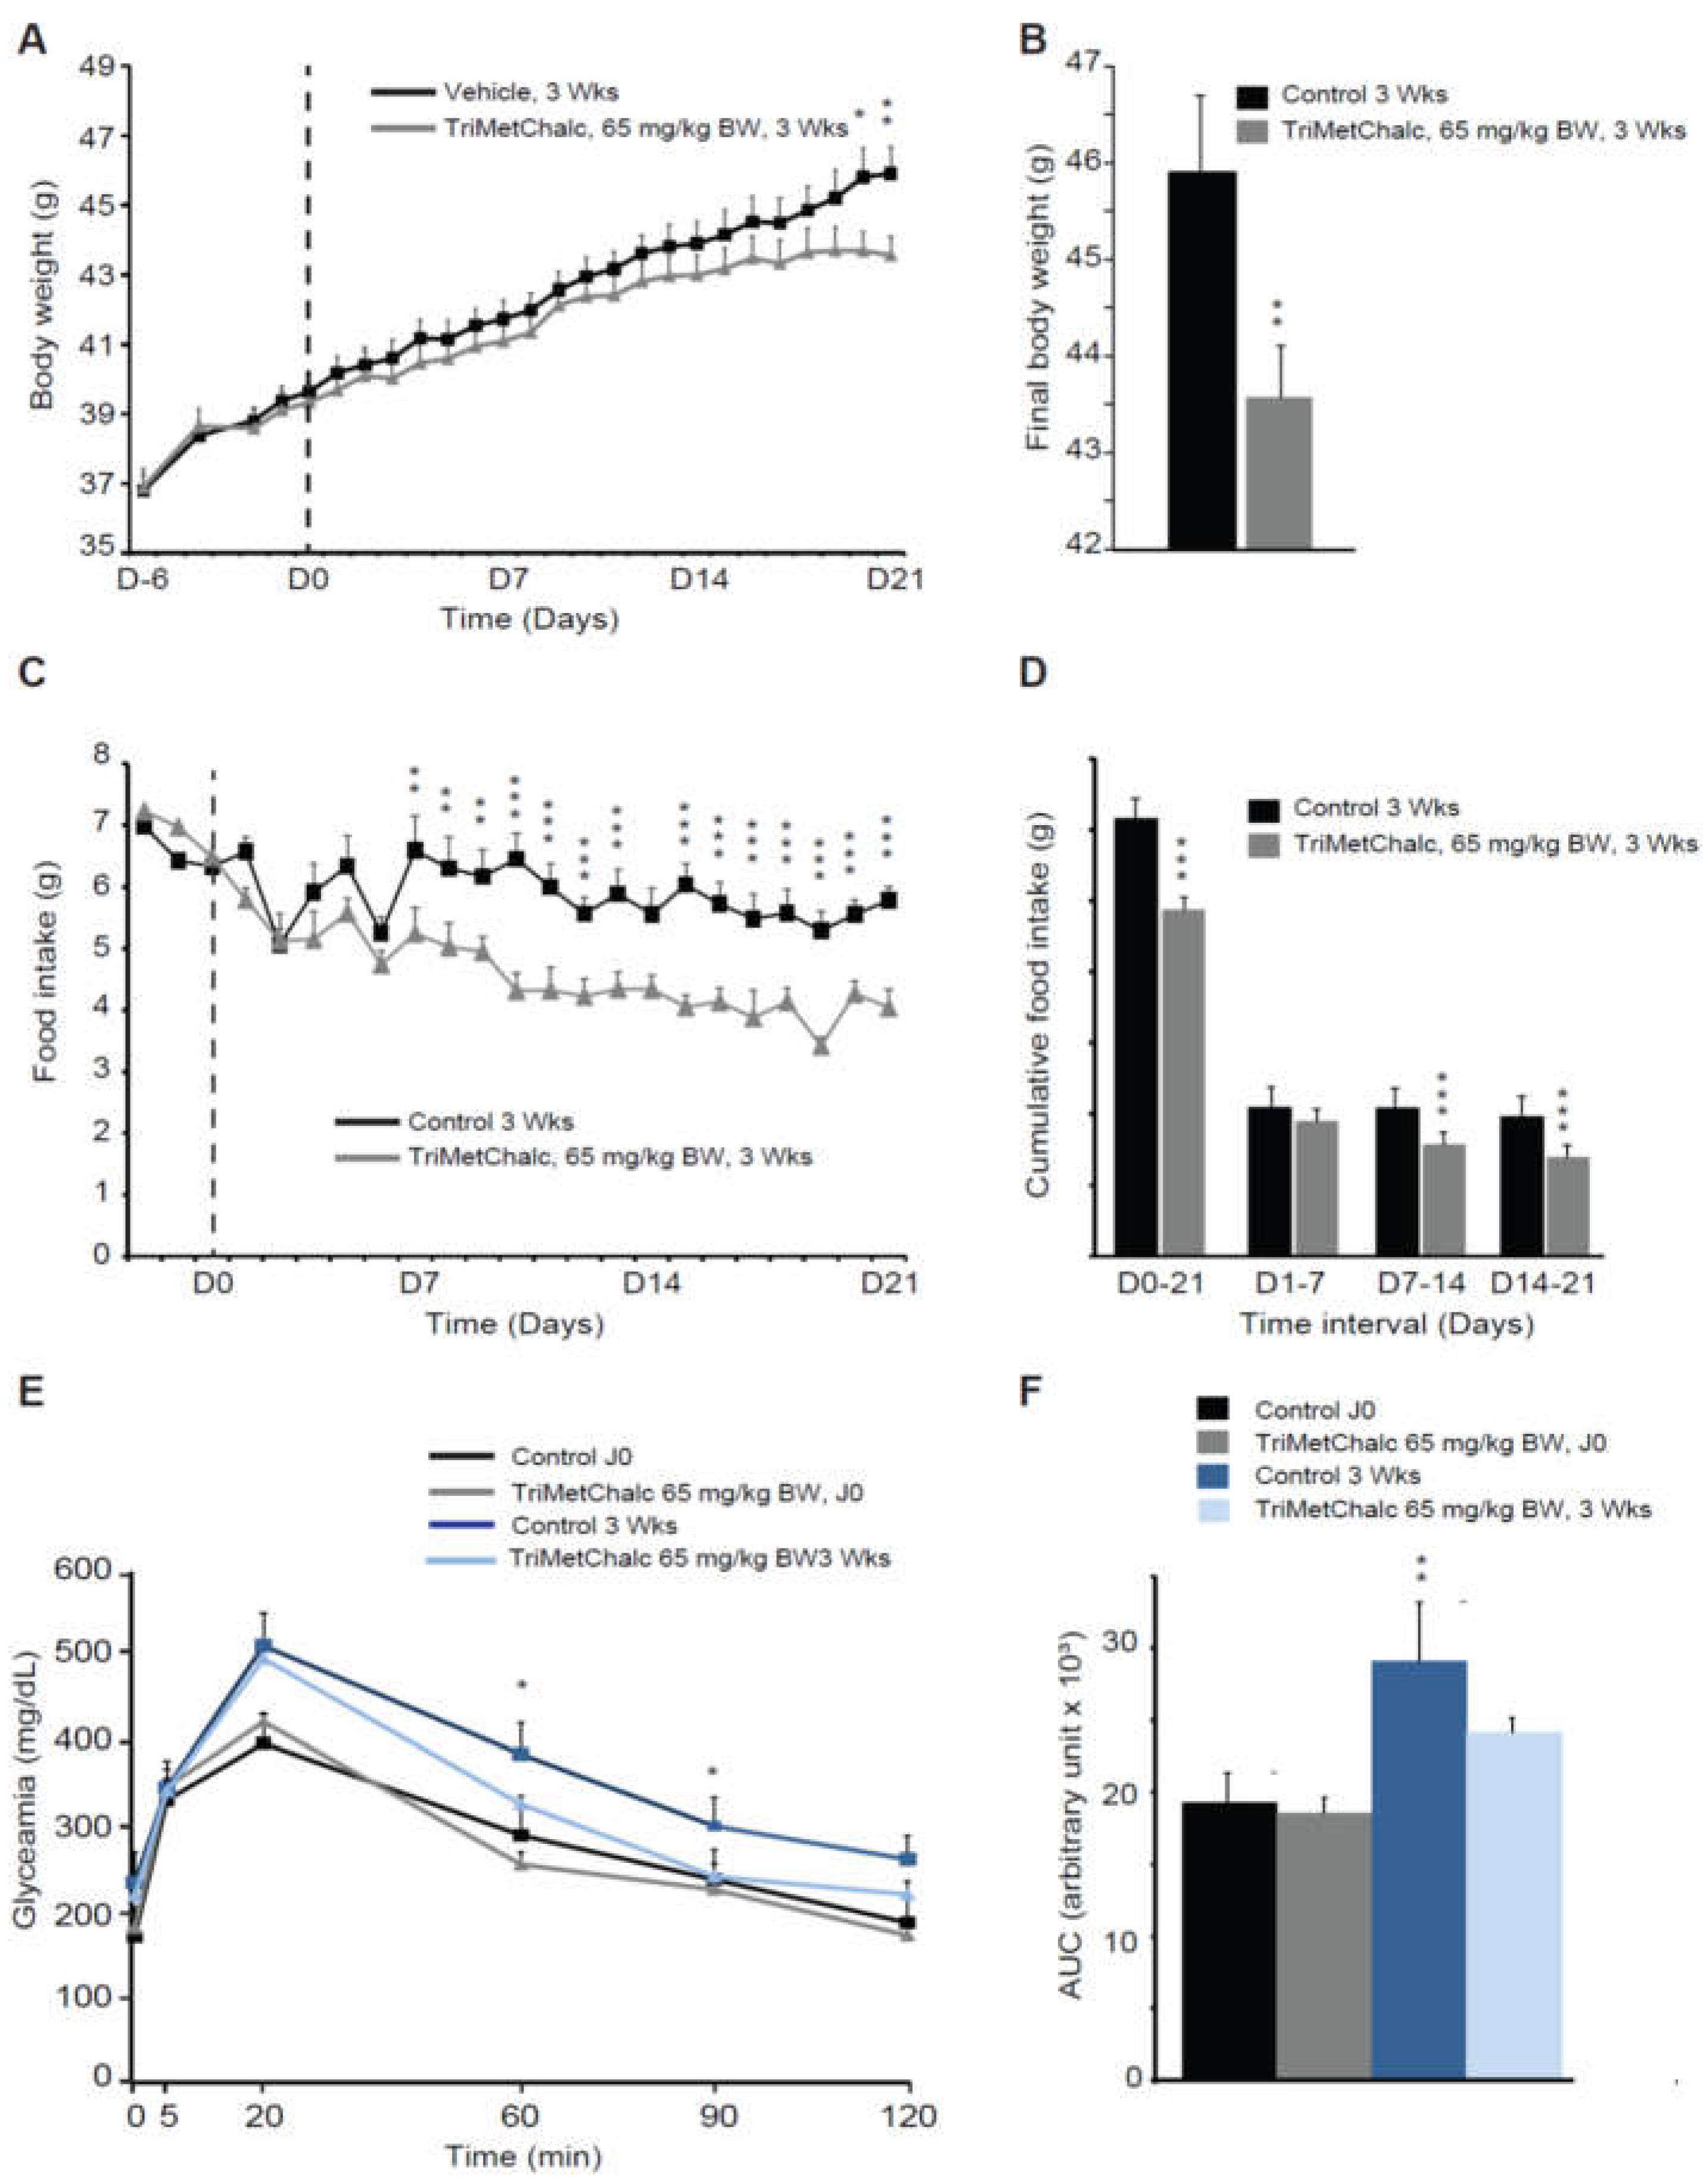
Figure 7.
Chronic TriMetChalc administration ameliorates liver steatosis in ob/ob mice. (A) Liver weight measured in control and TriMetChalc (65 mg/kg BW) groups at the end of the treatment period. (B) Representative photomicrographs of ORO staining observed in vehicle- and TriMetChalc (65 mg/kg BW)-treated ob/ob mice. Black boxes (upper panels) indicate where high magnification images (lower panels) originated. (C–E) Quantification of ORO+ inclusion number per surface unit (C), total surface covered by ORO+ inclusions (D) and mean surface of ORO+ inclusion (E) in liver of vehicle- and TriMetChalc (65 mg/kg BW)-treated mice. * p < 0.05, *** p < 0.001, significantly different from vehicle-treated mice. Scale bar: 10 µm.
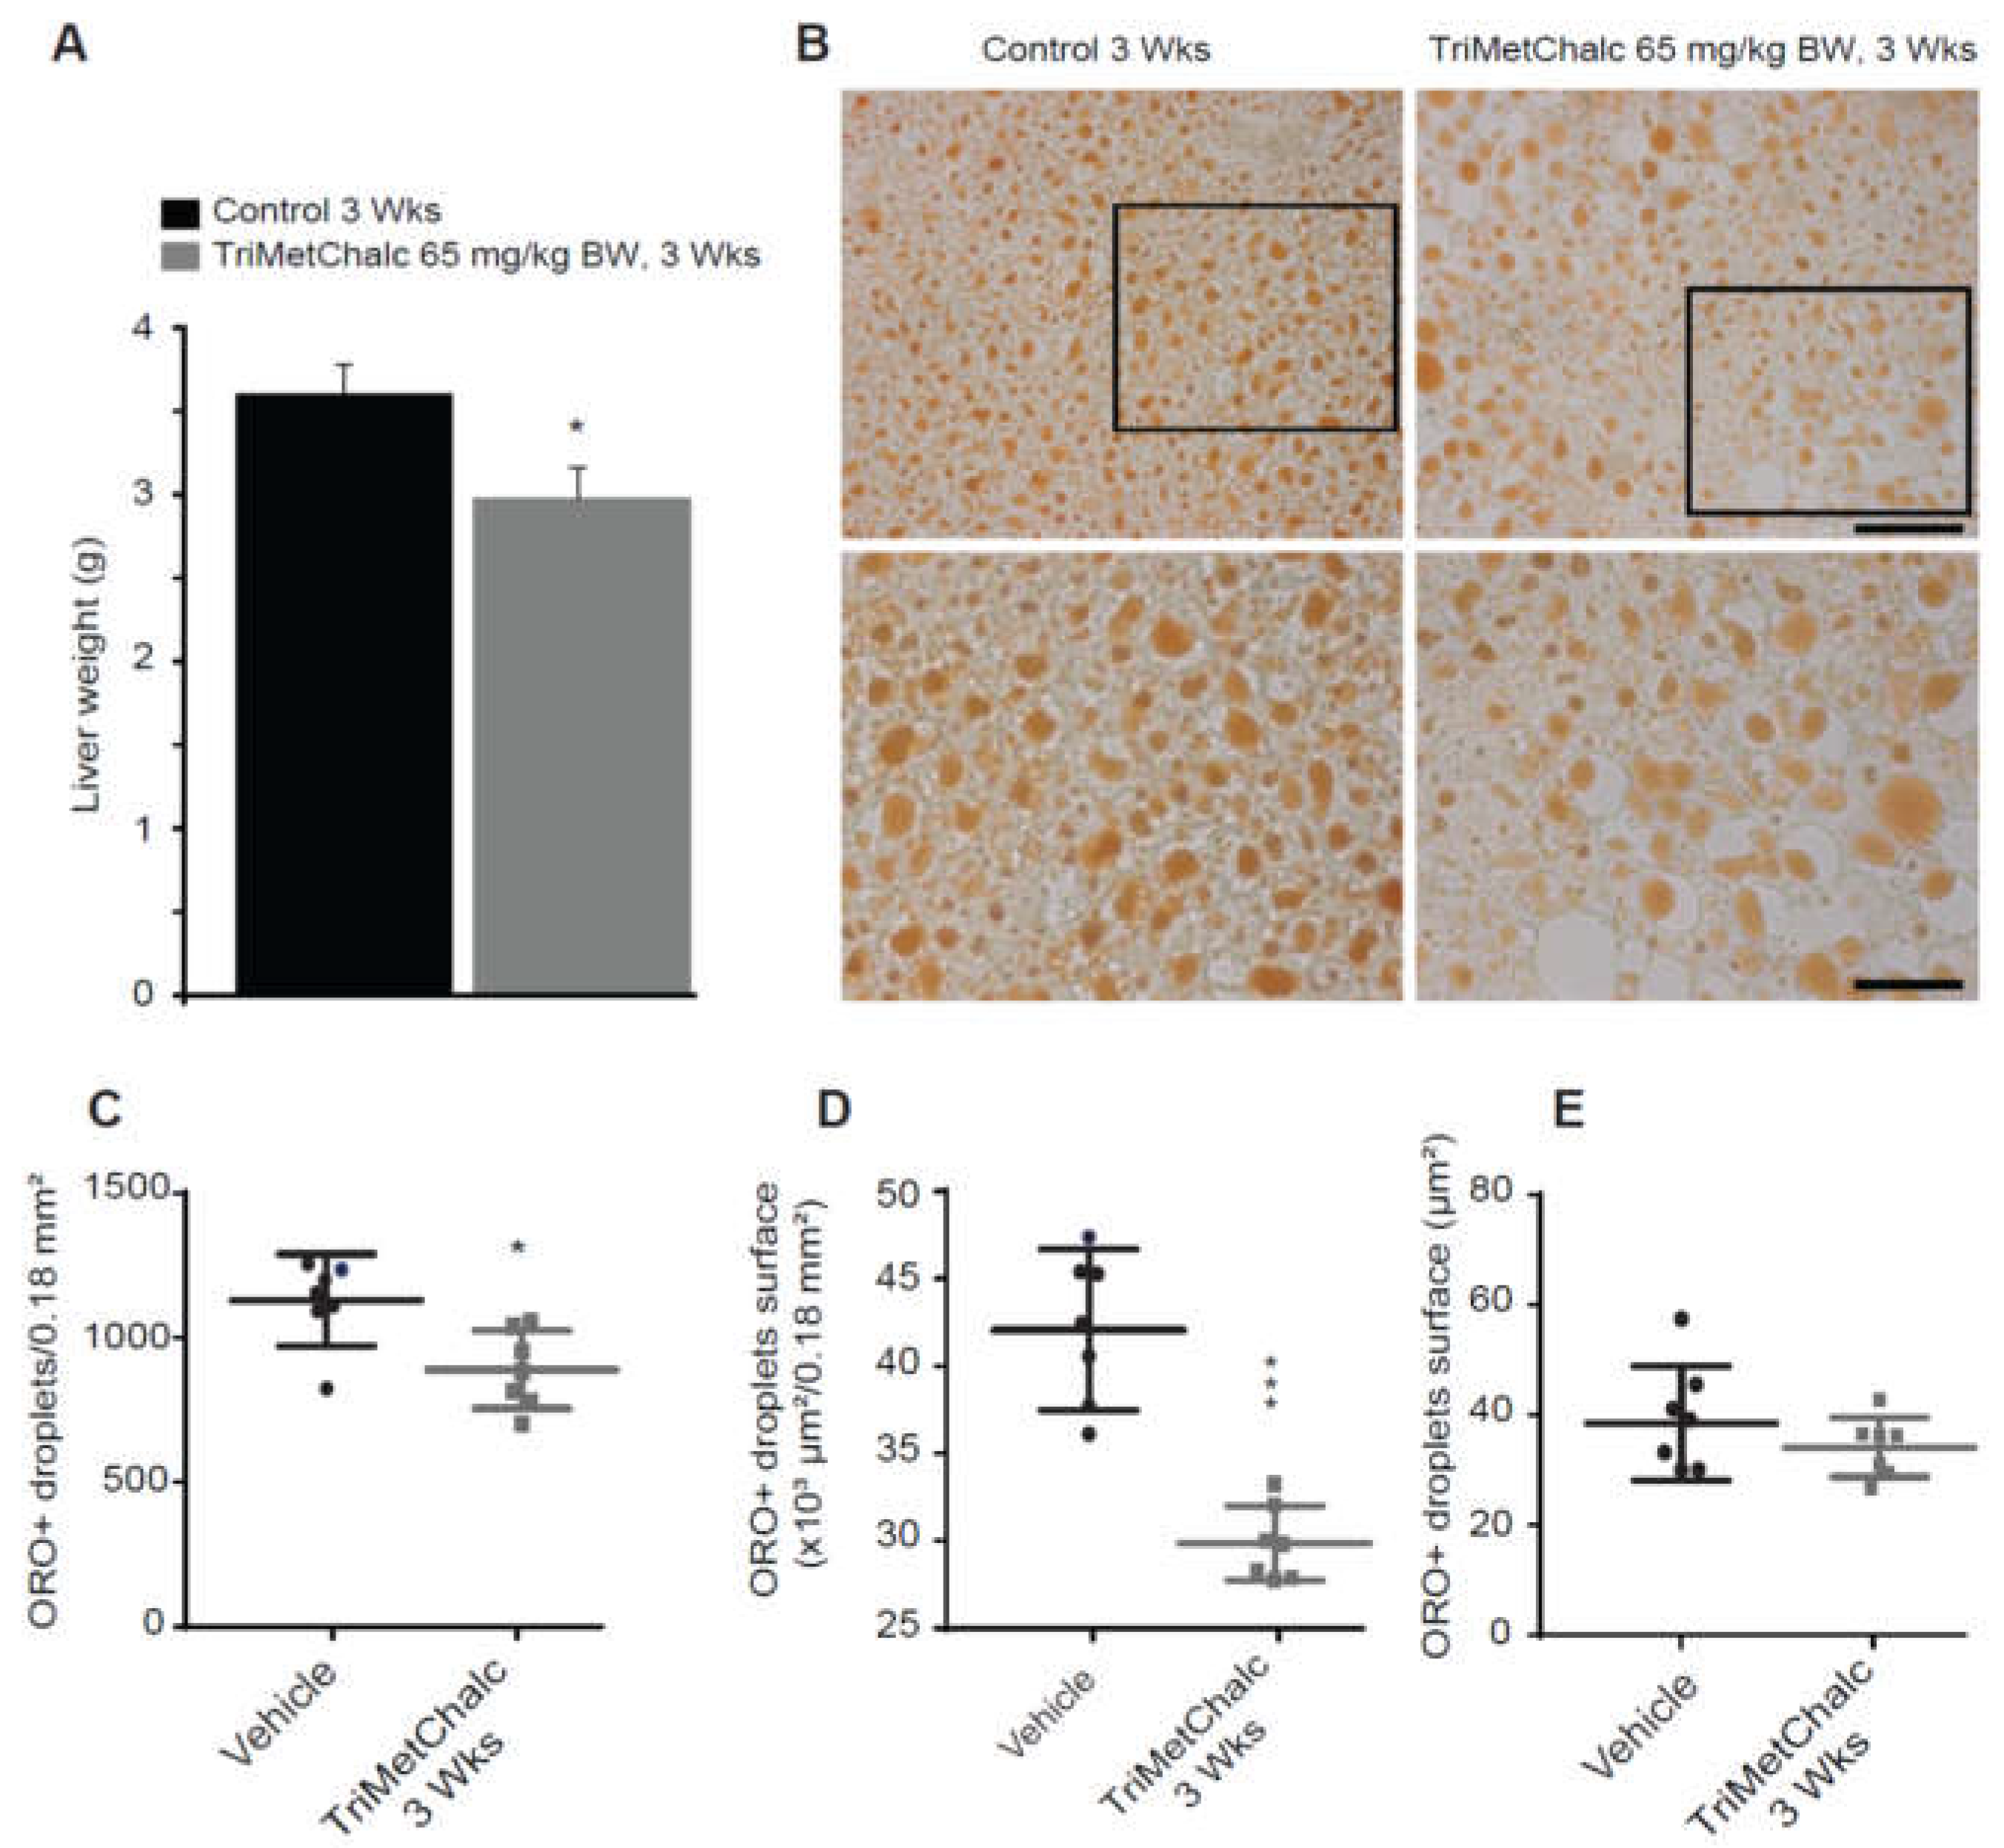
Figure 8.
Quantification of free cholesterol (A), cholesterol ester (B) and triacylglycerols (C) on liver extracts from vehicle or TriMetChalc (65 mg/kg BW) treated ob/ob mice. ns: non-significant difference.
Figure 8.
Quantification of free cholesterol (A), cholesterol ester (B) and triacylglycerols (C) on liver extracts from vehicle or TriMetChalc (65 mg/kg BW) treated ob/ob mice. ns: non-significant difference.
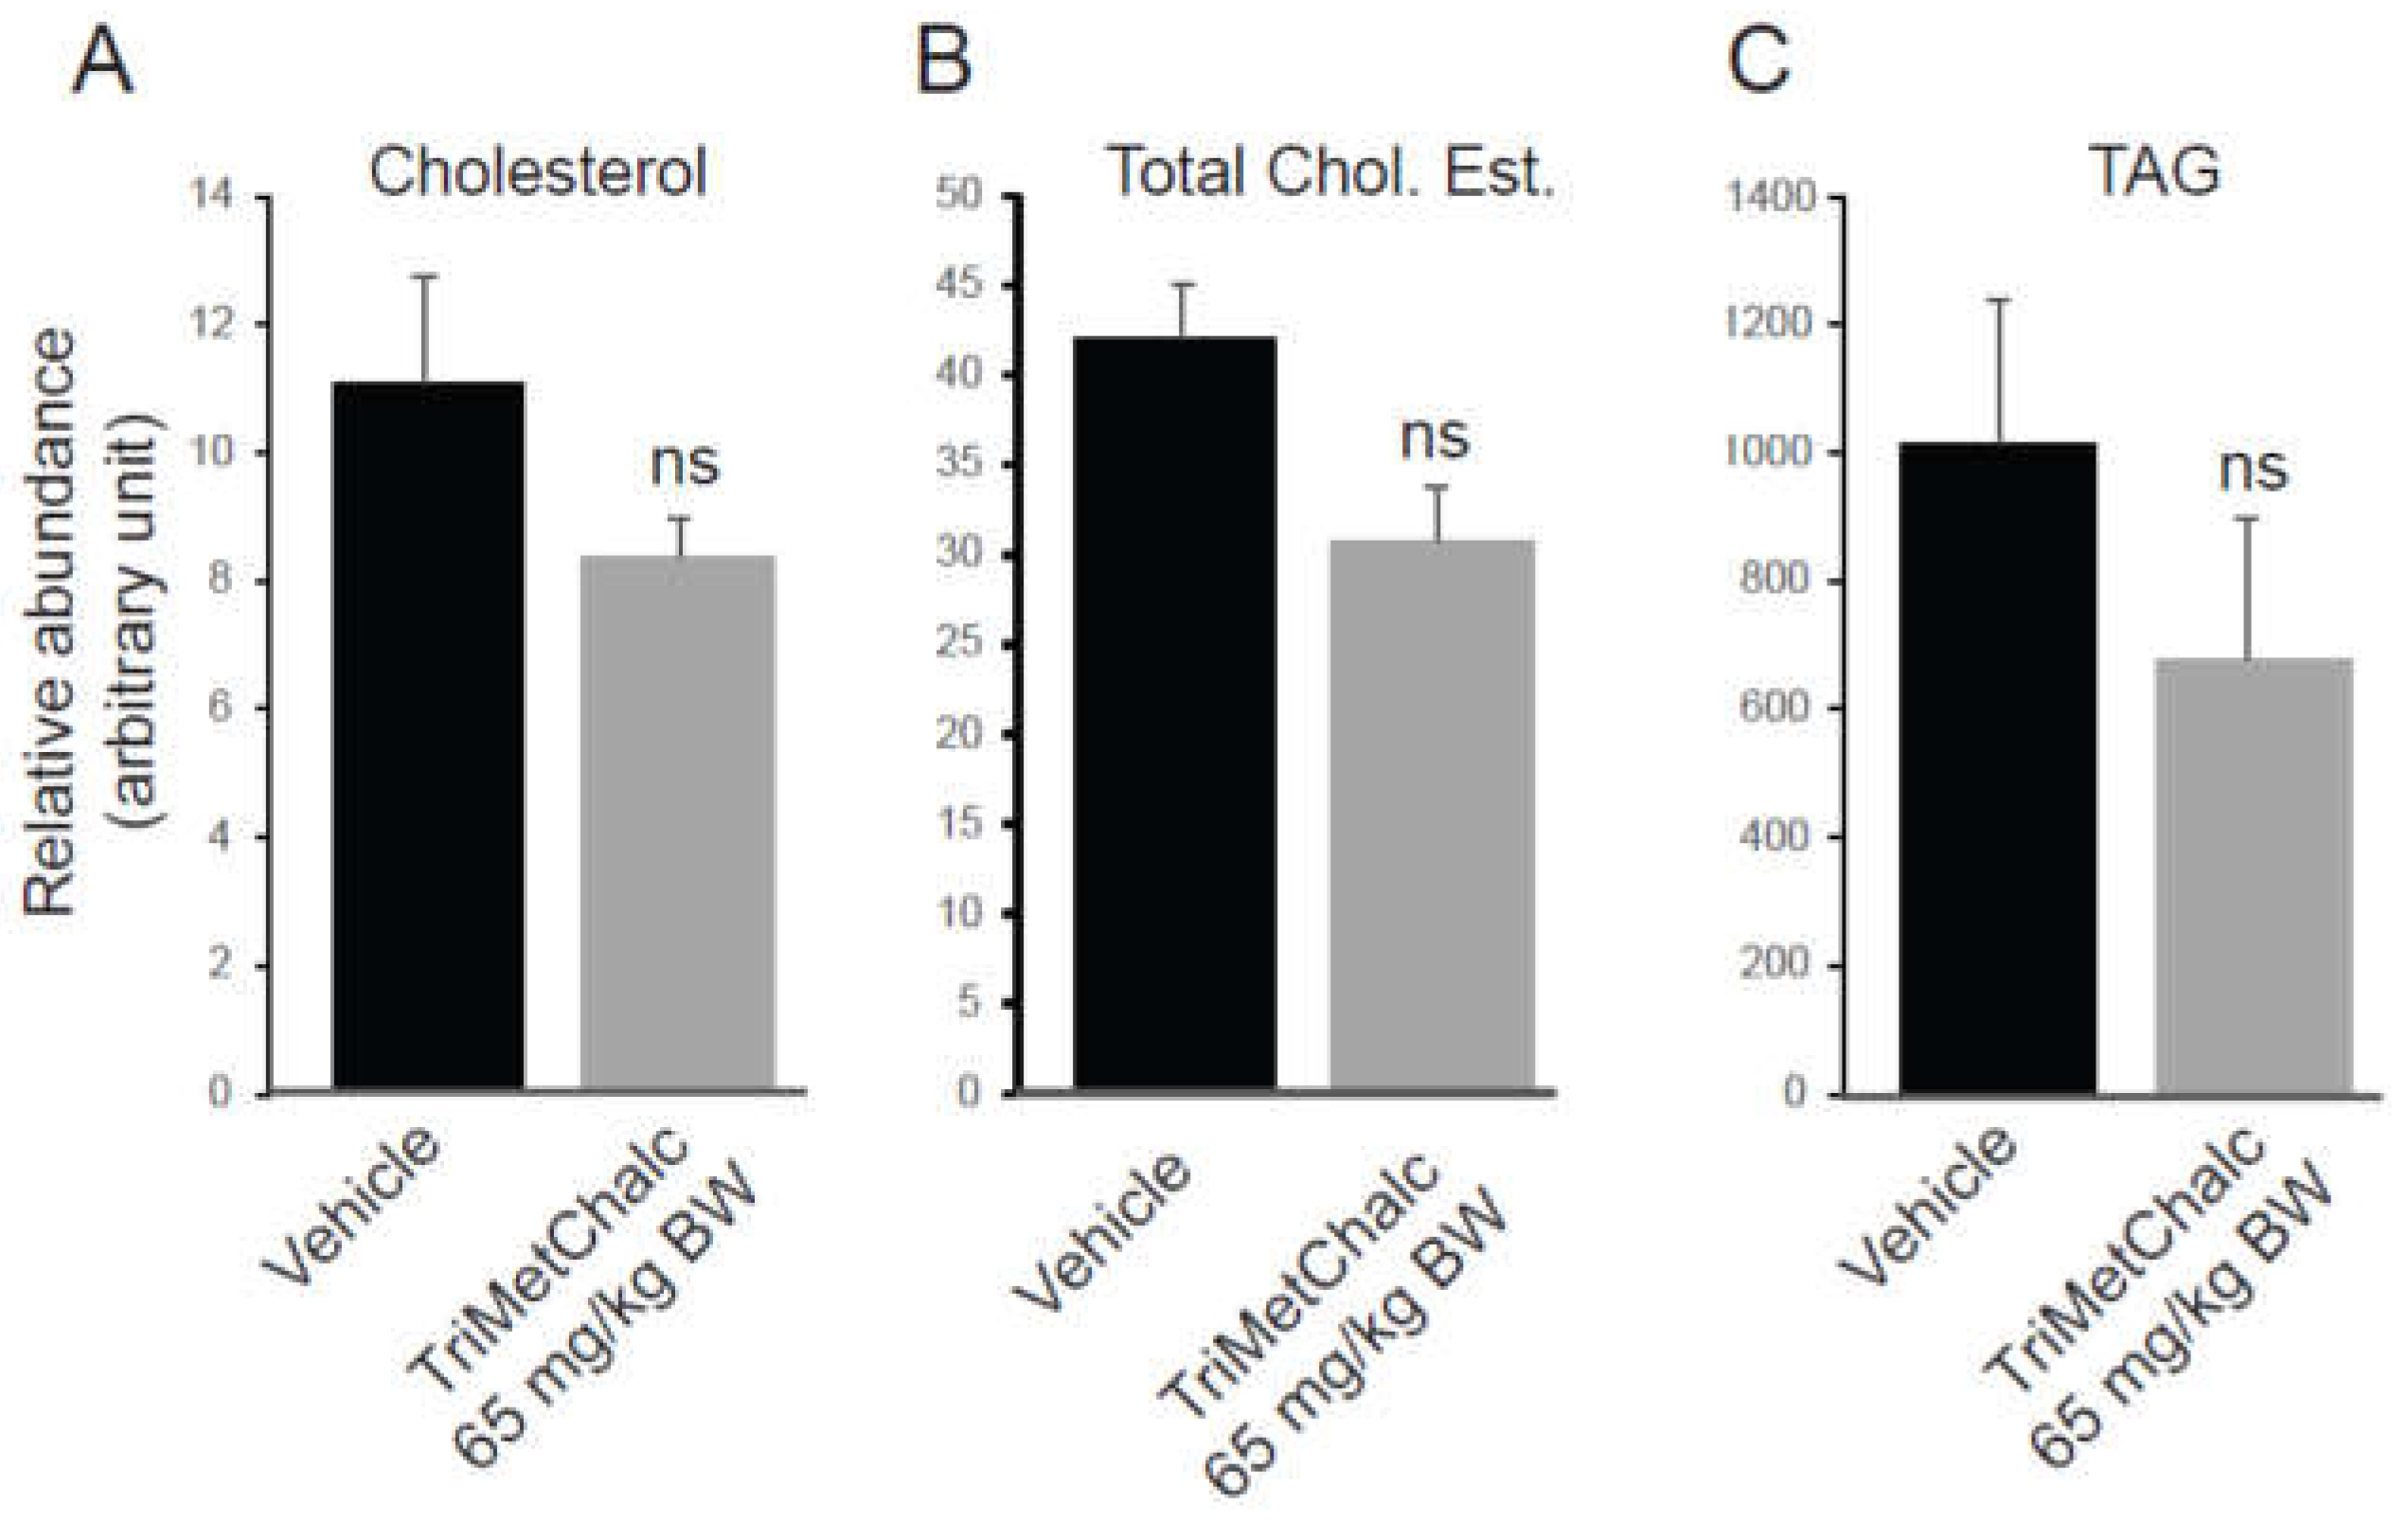
Figure 9.
Quantification of FA (A), SFA (B–D), MUFA (E–H) and PUFA (I,J) on liver extracts from vehicle or TriMetChalc (65 mg/kg BW) treated ob/ob mice. PUFA/SFA ratio (K) and de novo lipogenesis (L) were calculated from data detailed within Table 2. * p < 0.05, ** p < 0.01, *** p < 0.001 significantly different from vehicle-treated mice, ns: non-significant difference.
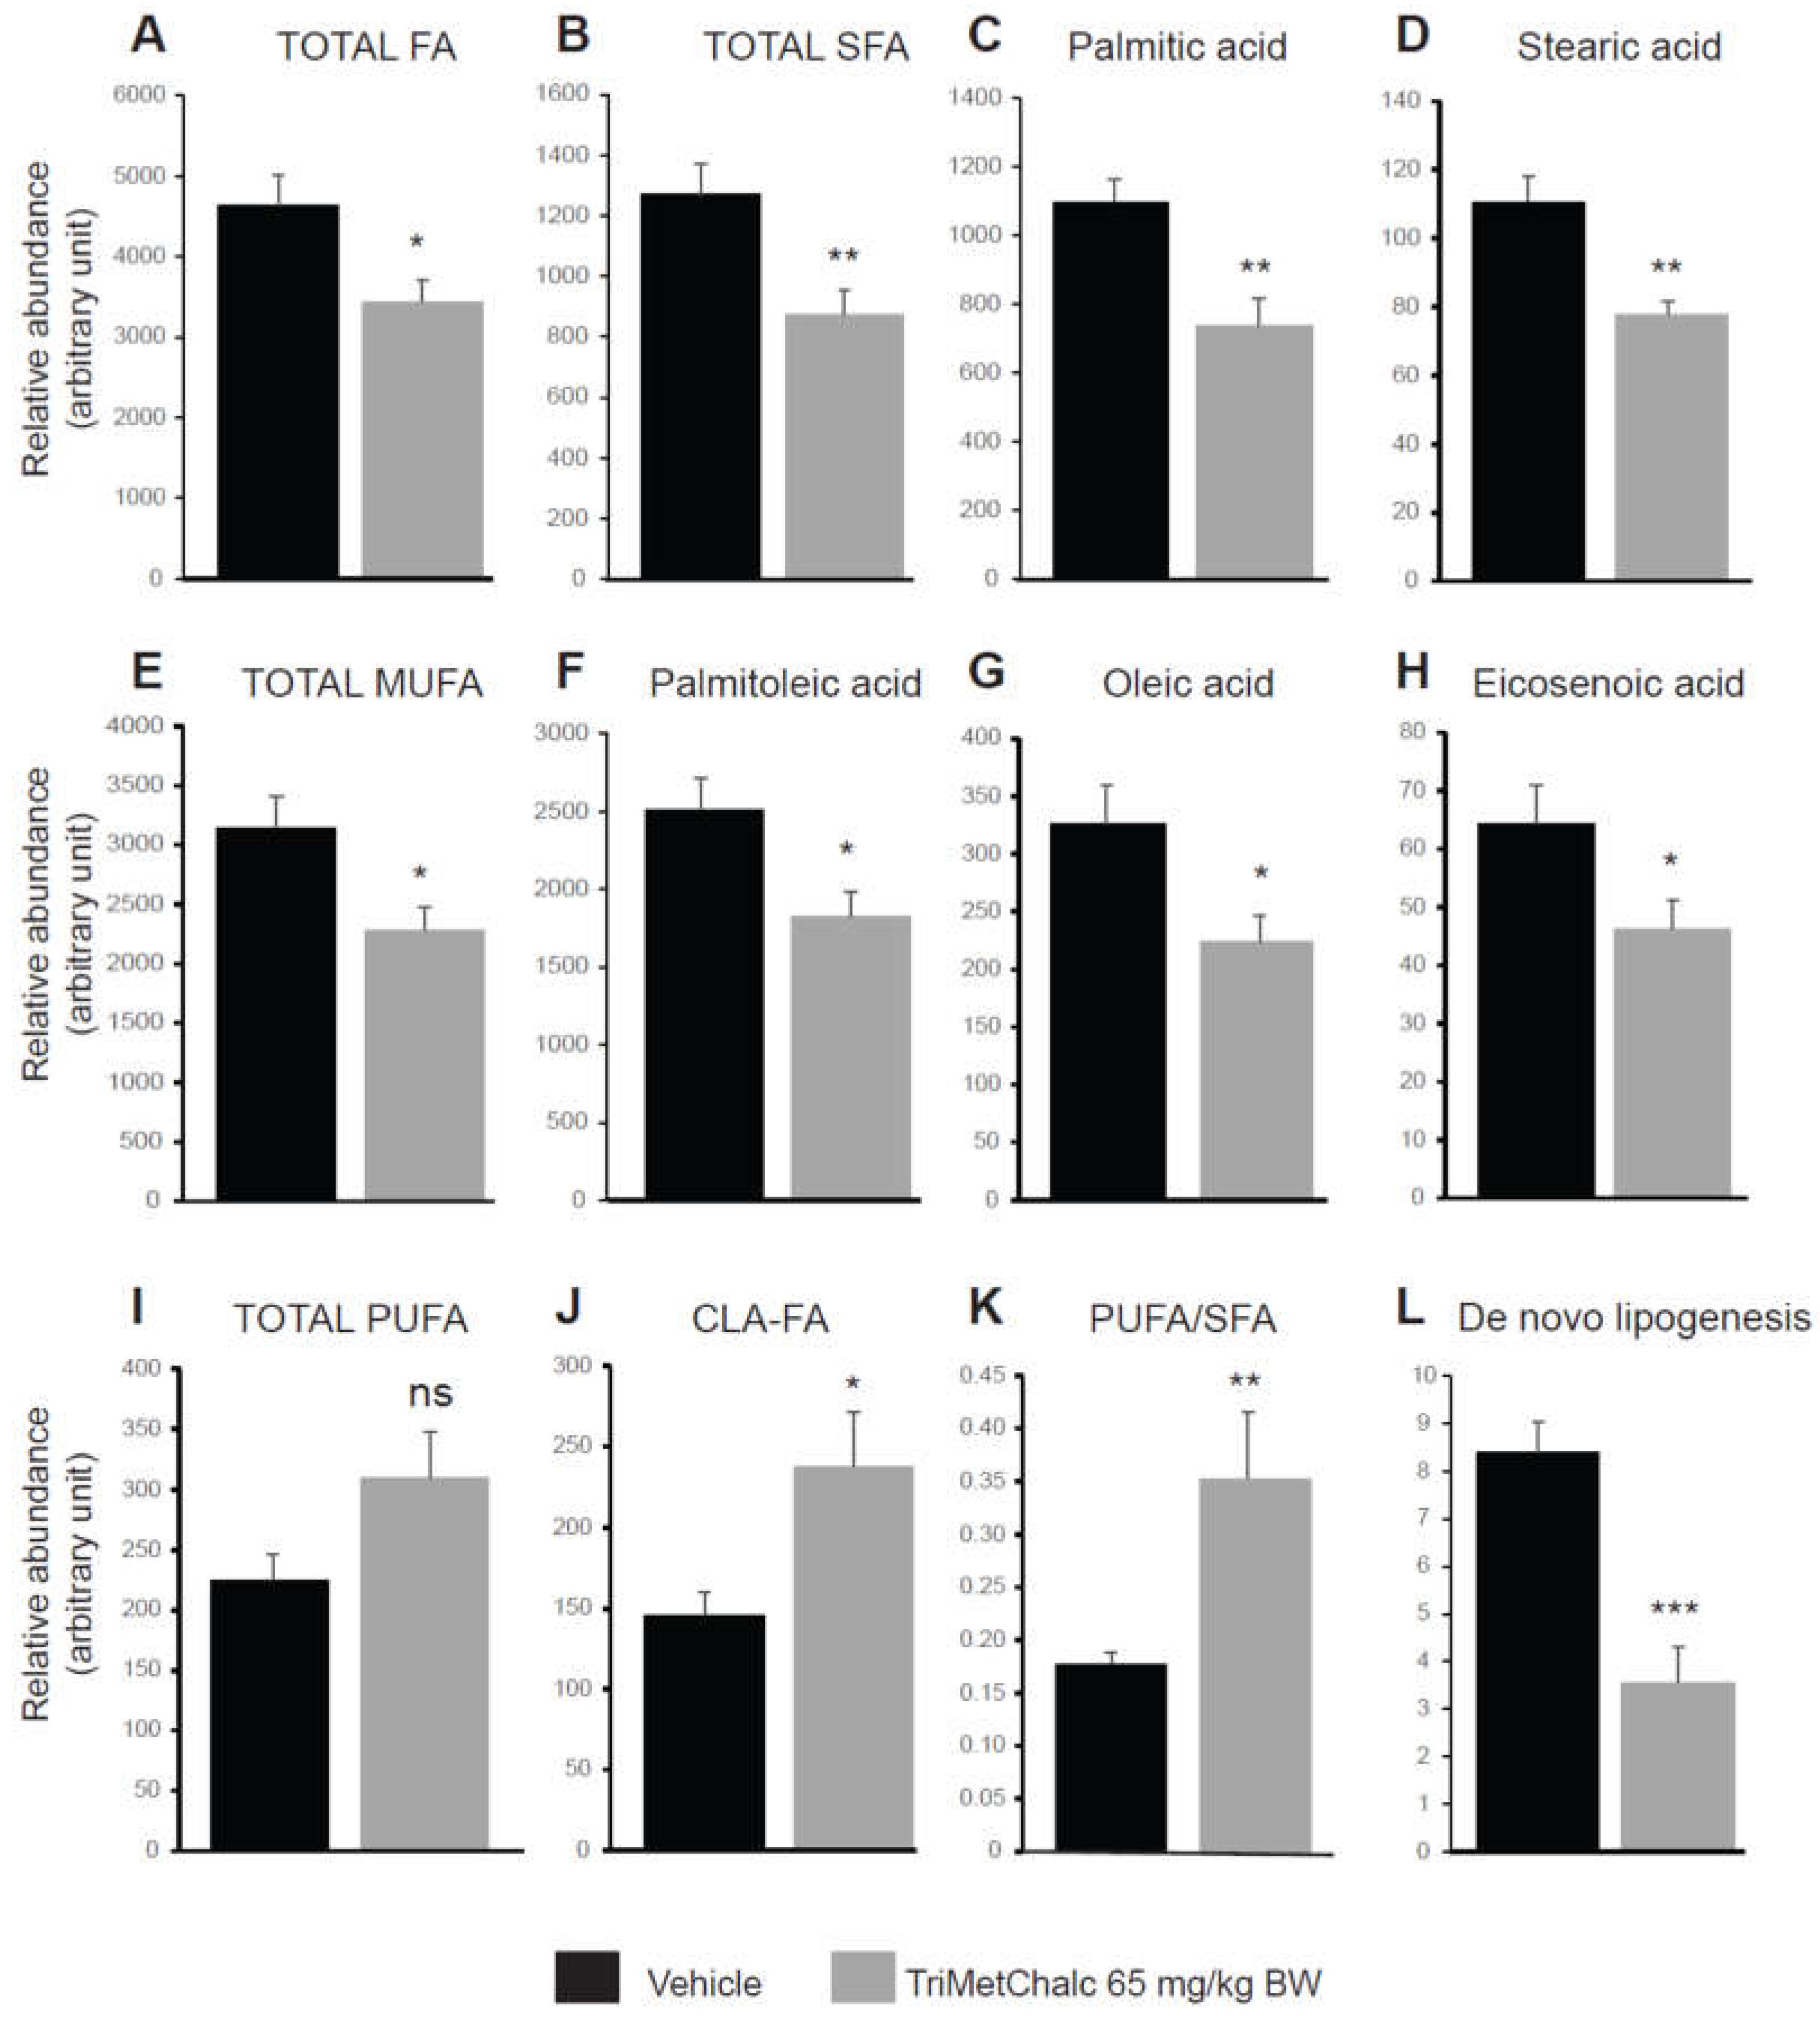
Figure 10.
Quantification of phosphatidylcholines (PC, A), phosphatidylethanolamines (PE, B), PC/PE ratio (C), phosphatidylinositols (PI, D) and phosphatidylserines (PS, E) on liver extracts from vehicle or TriMetChalc (65 mg/kg BW) treated ob/ob mice. * p < 0.05, ** p < 0.01 significantly different from vehicle-treated mice, ns: non-significant difference.
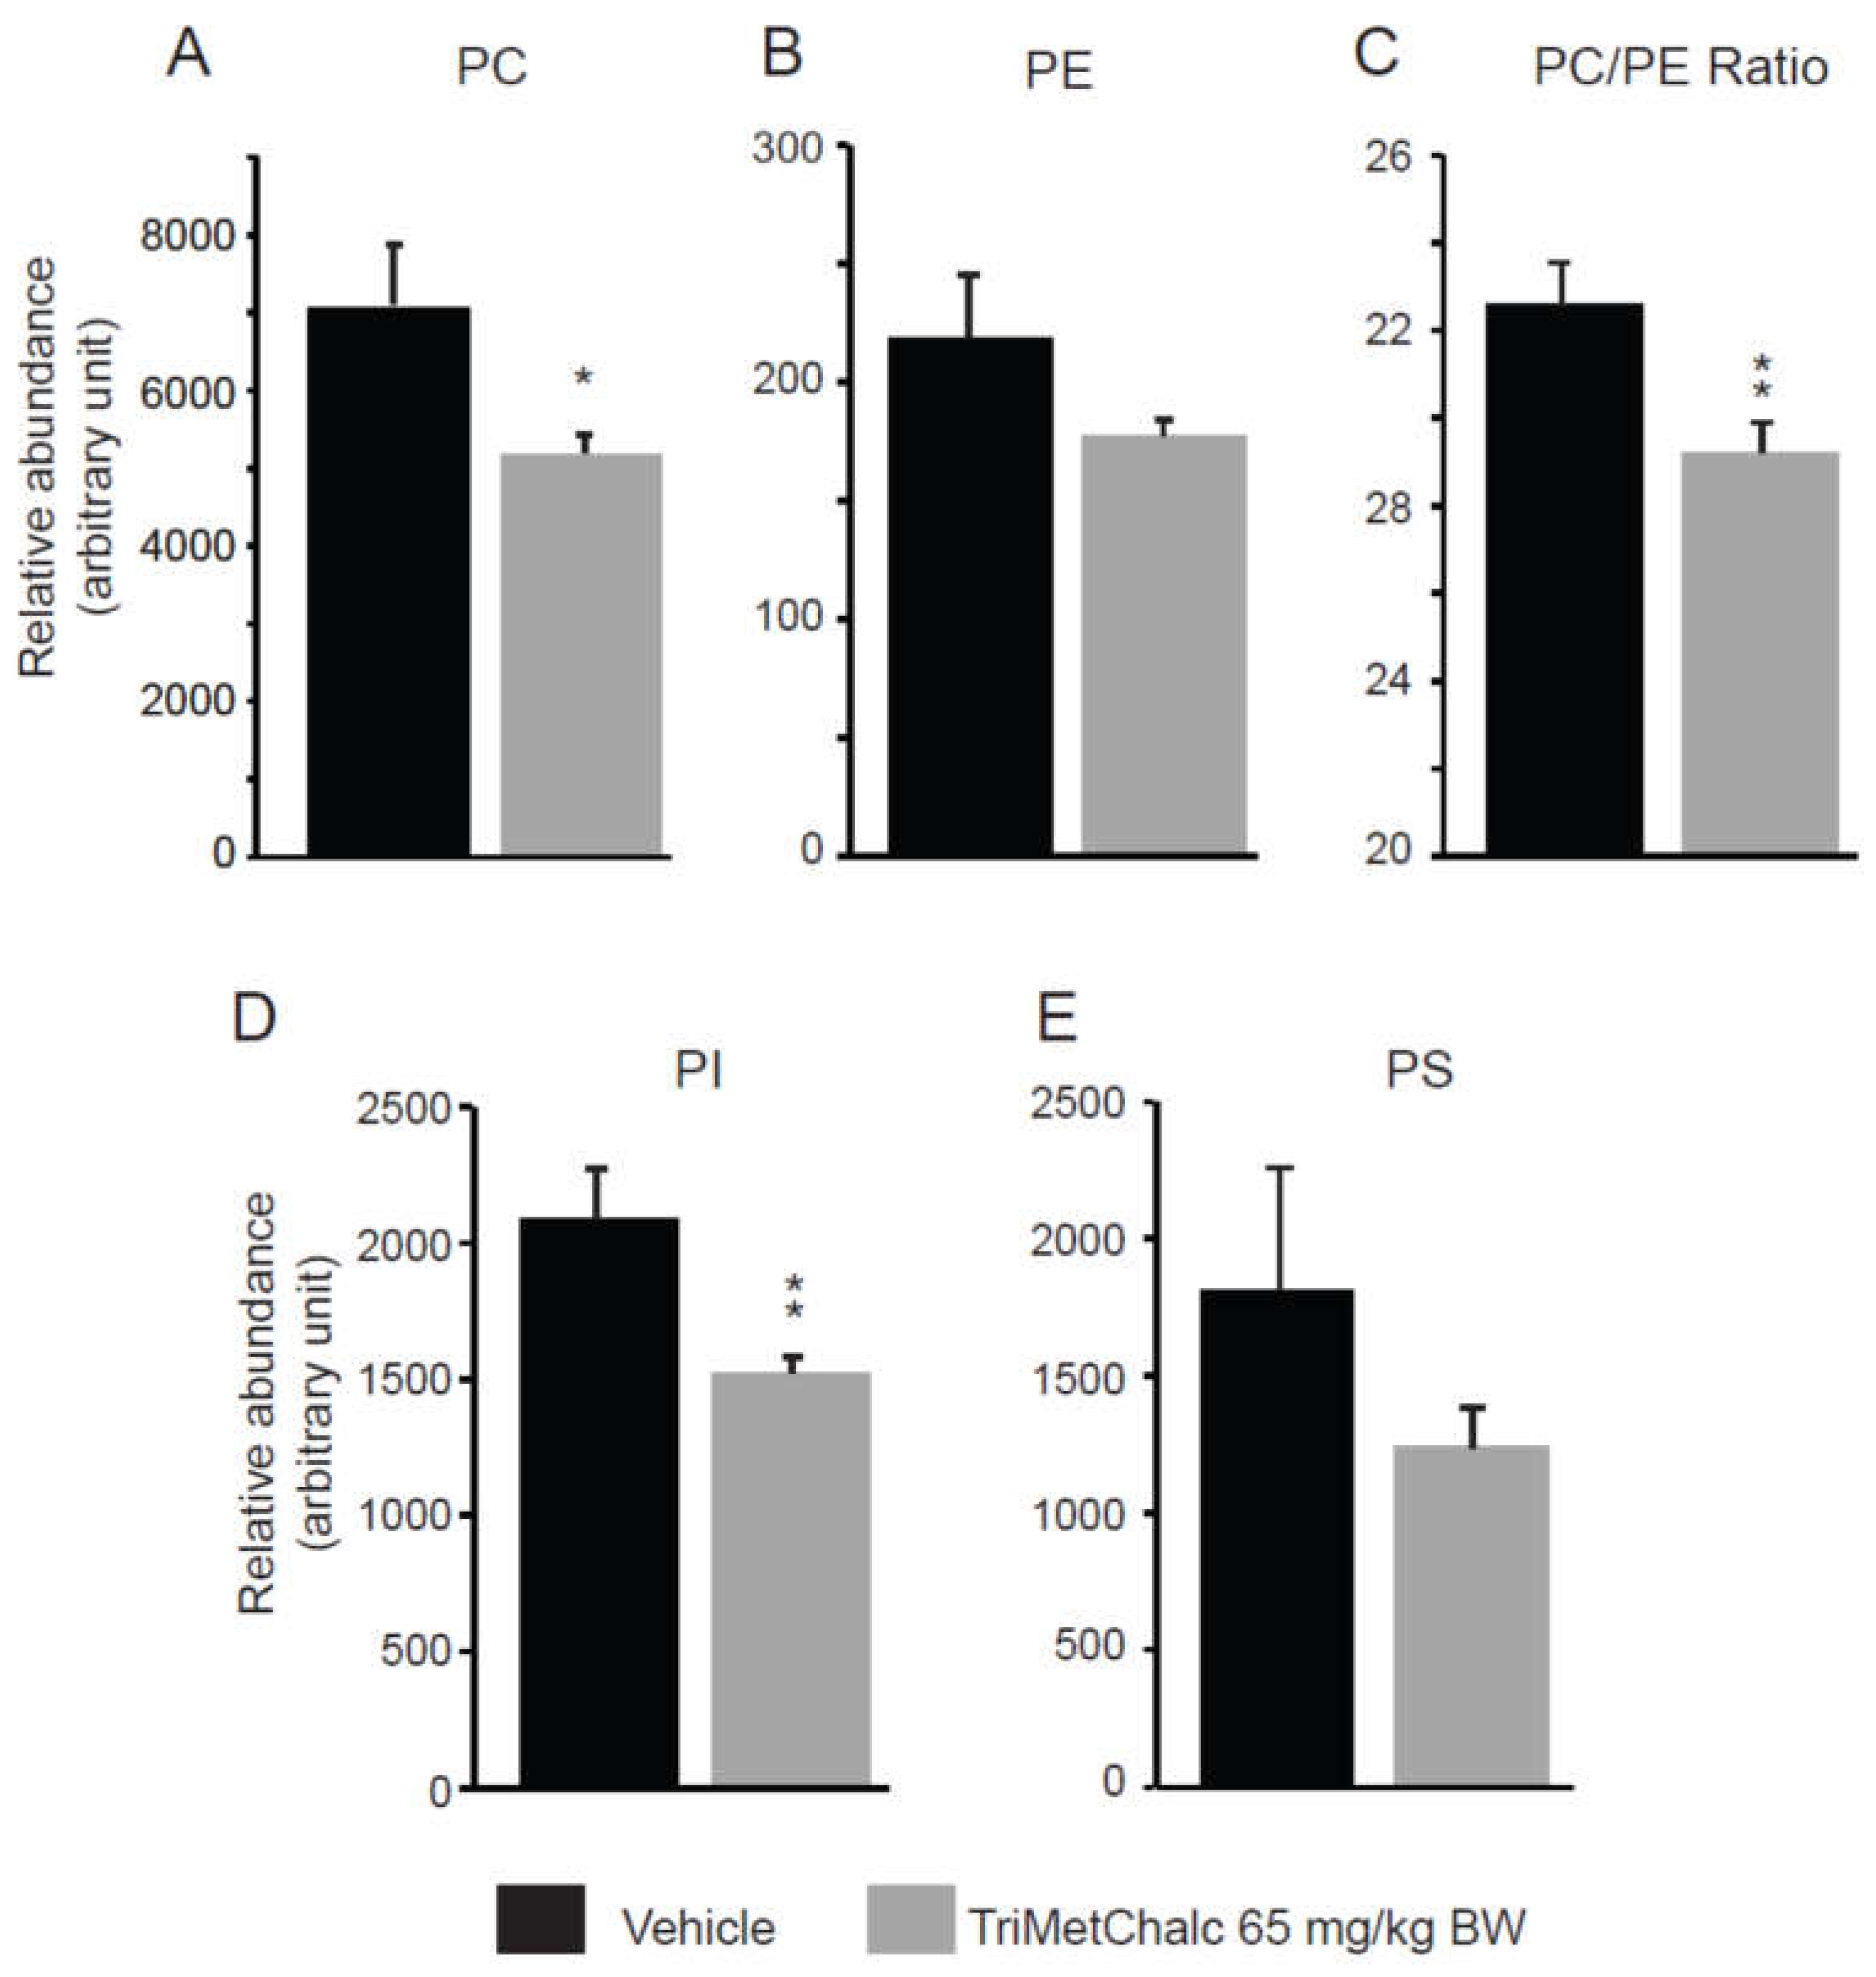

Table 1.
Detailed cholesterol and triacylglycerols composition and quantification of liver extracts from vehicle or TriMetChalc (65 mg/kg BW) treated ob/ob mice.
Table 1.
Detailed cholesterol and triacylglycerols composition and quantification of liver extracts from vehicle or TriMetChalc (65 mg/kg BW) treated ob/ob mice.
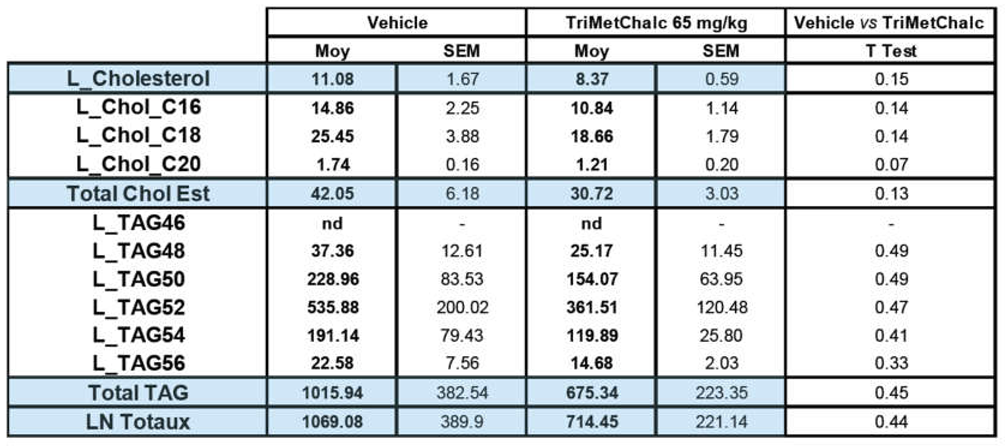 |
Table 2.
Detailed fatty acid (FA) composition and quantification of liver extracts from vehicle or TriMetChalc (65 mg/kg BW) treated ob/ob mice.
Table 2.
Detailed fatty acid (FA) composition and quantification of liver extracts from vehicle or TriMetChalc (65 mg/kg BW) treated ob/ob mice.
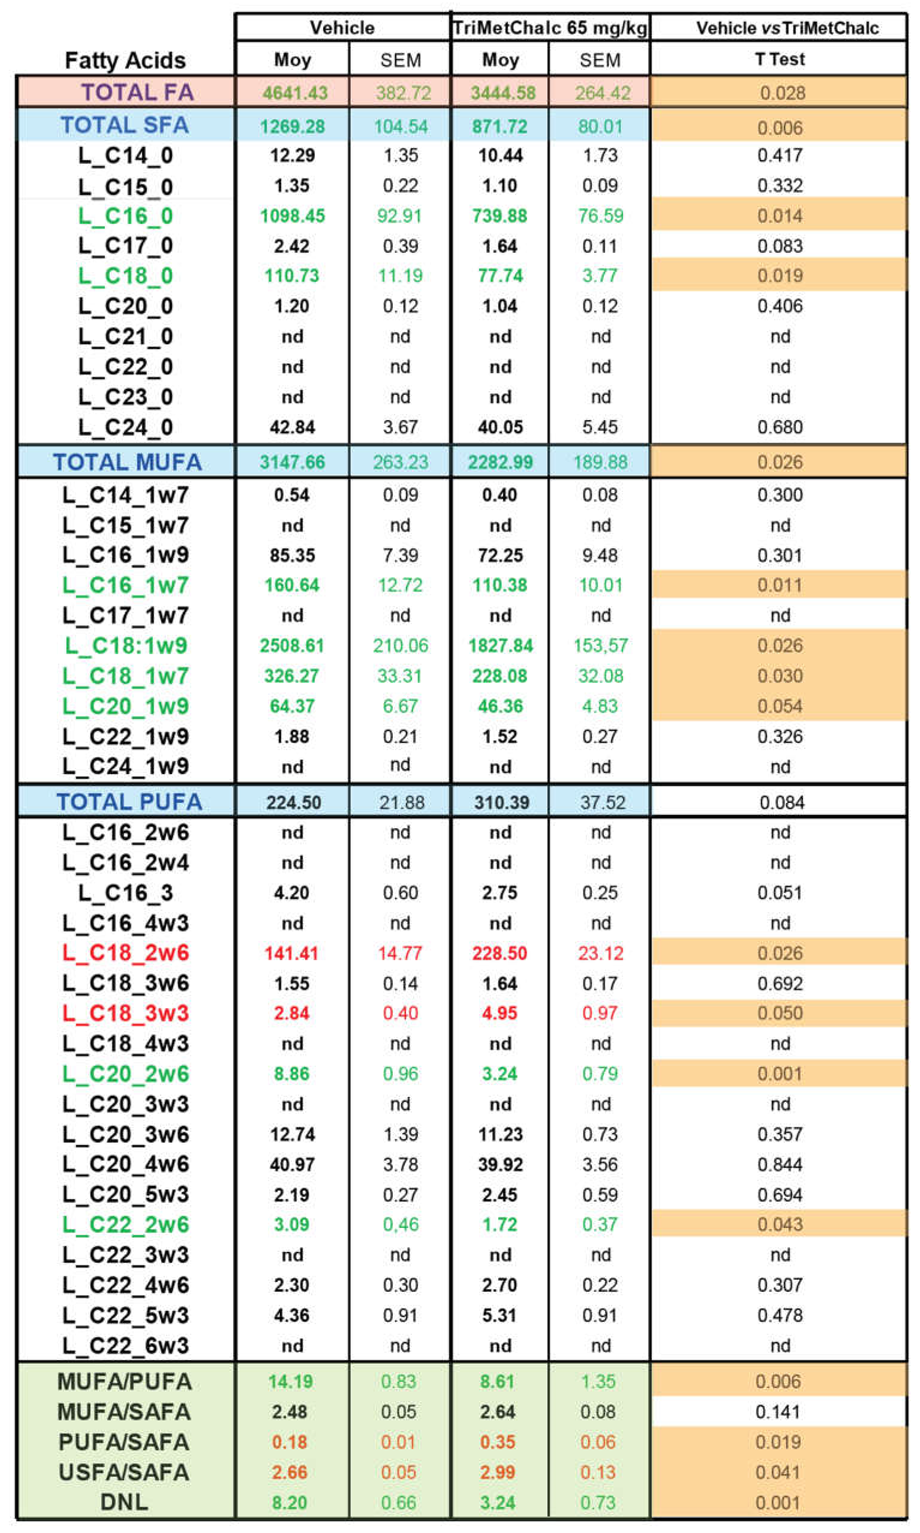 |
Table 3.
Detailed phospholipids composition and quantification of liver extracts from vehicle or TriMetChalc (65 mg/kg BW) treated ob/ob mice.
Table 3.
Detailed phospholipids composition and quantification of liver extracts from vehicle or TriMetChalc (65 mg/kg BW) treated ob/ob mice.
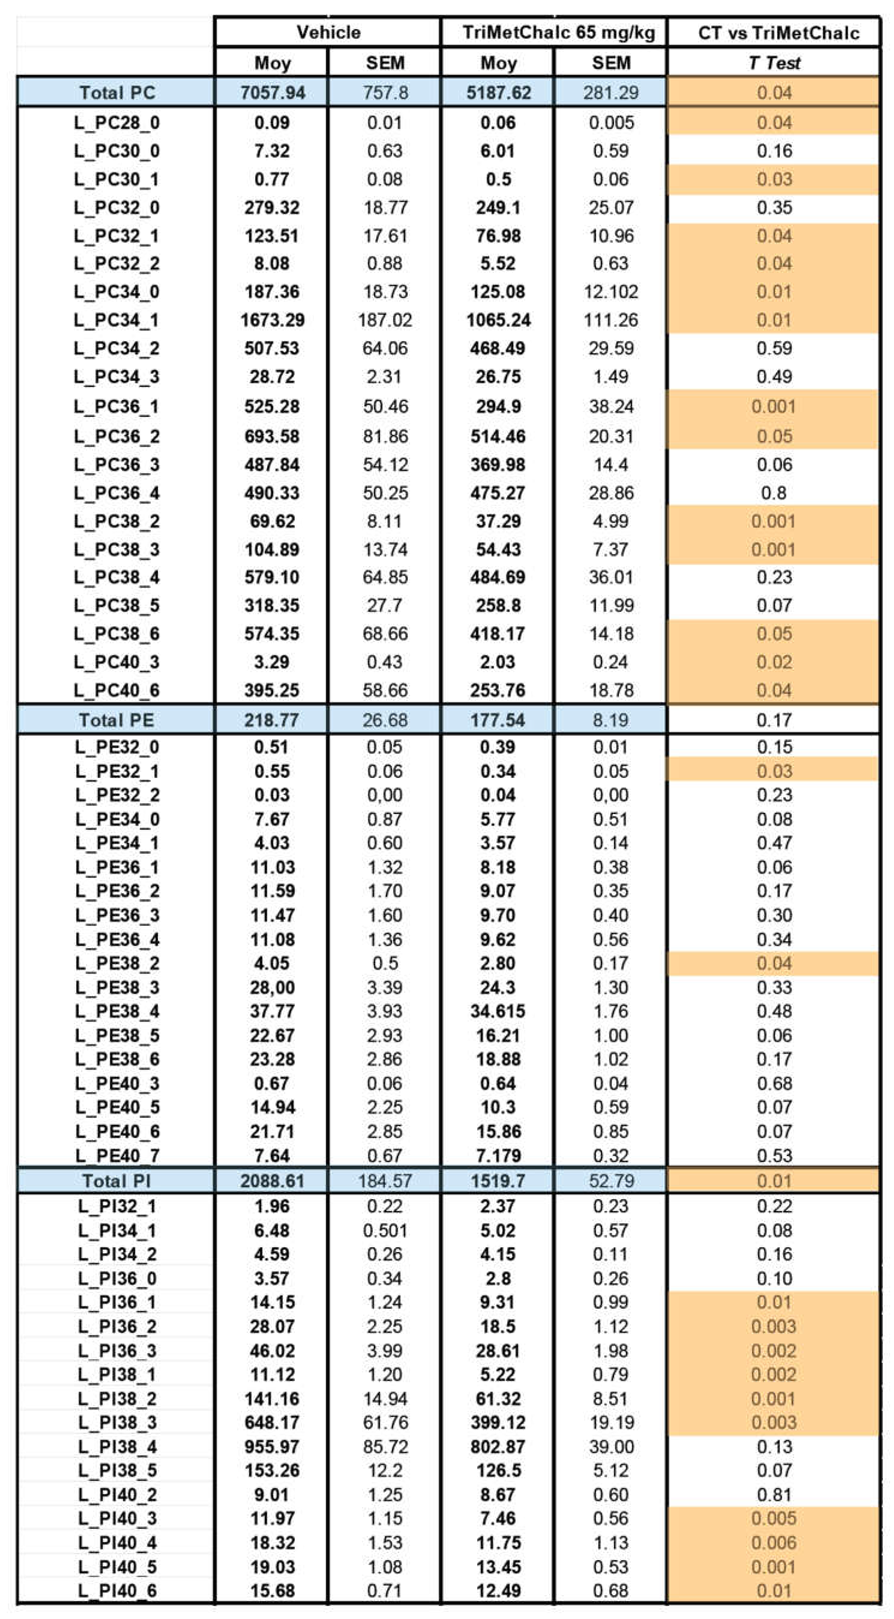 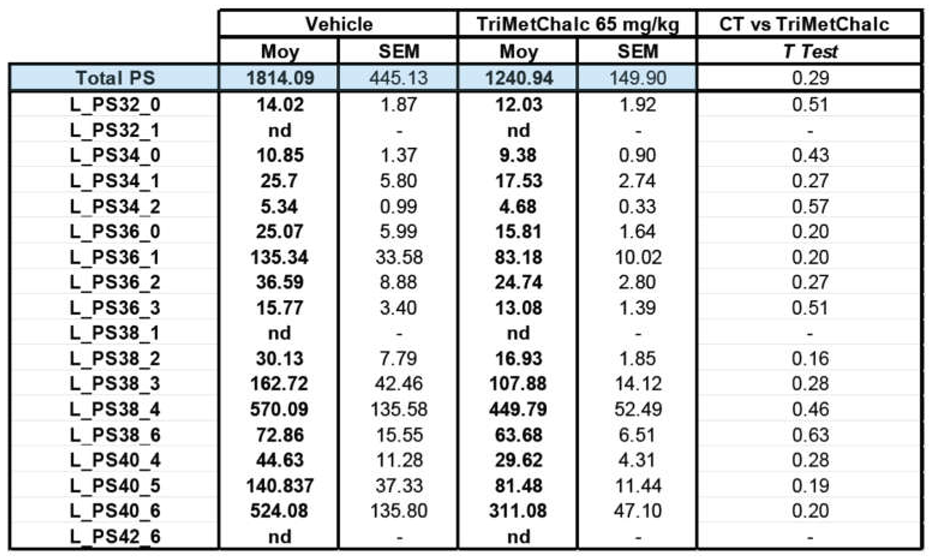
|
Disclaimer/Publisher’s Note: The statements, opinions and data contained in all publications are solely those of the individual author(s) and contributor(s) and not of MDPI and/or the editor(s). MDPI and/or the editor(s) disclaim responsibility for any injury to people or property resulting from any ideas, methods, instructions or products referred to in the content. |
© 2024 by the authors. Licensee MDPI, Basel, Switzerland. This article is an open access article distributed under the terms and conditions of the Creative Commons Attribution (CC BY) license (http://creativecommons.org/licenses/by/4.0/).
Copyright: This open access article is published under a Creative Commons CC BY 4.0 license, which permit the free download, distribution, and reuse, provided that the author and preprint are cited in any reuse.


